Article

Farm Production Diversity: Is It Important for Dietary Diversity? Panel Data Evidence from Uganda

1
Department of Natural Resource Management (NRM), International Institute of Tropical Agriculture (IITA), Kigali KG 563 #3, P. O. Box 1269, Rwanda
2
Department of Research, LADS Consult, P. O. Box 909 Mukono, Uganda
*
Author to whom correspondence should be addressed.
Sustainability 2020, 12(3), 1028; https://doi.org/10.3390/su12031028
Submission received: 2 December 2019 / Revised: 16 January 2020 / Accepted: 21 January 2020 / Published: 31 January 2020
(This article belongs to the Special Issue Rethinking Agriculture to Meet Food, Fiber and Energy Demands)

Abstract

:
The substantial existence of malnutrition globally, especially in developing countries, has usually driven policy initiatives to focus on improving household food security and nutrition primarily through prioritizing farm production diversity. Although indeed some empirical evidence has pointed to farm production diversity remedying malnutrition, other evidence has pointed to markets. Therefore, evidence is mixed and may be country or region variant. To contribute to closing such a gap in the literature, we used three waves of national panel survey data from Uganda and panel regression models to investigate associations between farm production diversity and dietary diversity, as well as impact pathways. We found that farm production diversity was positively and significantly associated with household dietary diversity. Farm production diversity influenced dietary diversity through own farm production, and market consumption food security pathways. The own farm production pathway showed a stronger associated impact. Increasing food expenditure by 1000 UGX via own farm production yielded an eight percentage point increment in household dietary diversity, while an equal expenditure via markets yielded a 5.3 percentage point increment. We also found existence of gender effects. Male headed households were associated with relatively poorer household dietary diversity. These findings could have broader implications for countries practicing smallholder agriculture.

1. Introduction

Attaining food security (quantities of food available for household consumption) and nutrition security (quality of food) has remained a persistent problem globally [1]. Yet attaining food and nutrition security is among the top priority of the United Nation’s sustainable development goals [2]. Globally, nearly 800 million people are still chronically hungry [1]. Chronic hunger has been attributed to food access being dependent on income access [1,3,4]. Since large income inequality exists, this has hampered fair universal income access [1,5]. Therefore, income inequality has alienated poor households from food markets [5,6,7]. Unfortunately, income inequality is and has been generally rising in most countries of Sub Sahara Africa (SSA) [4,5,6]. The increasing income inequality is blamed on market-oriented policies that prioritize consumption from markets [3,5,6,7]. Moreover, income inequality has also been found to enhance poverty, hunger, and malnutrition in SSA [3,6,8,9,10]. Hence, the existence of income inequality implies that market access may not be a reliable pathway against food insecurity and malnutrition. Therefore, farm production diversity remains a strategic option to enhance household food security, dietary diversity, and nutrition [11,12,13,14,15,16,17]. In recent decades, various national policies in SSA have guided farmers on what crops and livestock to prioritize, thus indicating strongly that farm production diversity is still an important pathway to secure household food consumption. Therefore, policies have somehow dictated household farm production diversity, and hence dietary diversity and consequently household nutrition. This has led to a complex nexus of agriculture (farm production diversity), food security (consumption quantities), and nutrition (dietary diversity) that requires proper understanding to ensure sustainable household nutrition security.
For instance, using Uganda as a case study country in SSA, on realizing that malnutrition was seriously challenging human welfare and economic growth, the government re-oriented its policies towards attaining household nutrition security. In the agricultural sector strategy and investment plan, the government of Uganda prioritized agricultural technologies that provided strategic food security, income, and nutritional advantages [18]. In this plan, Uganda prioritized coffee, tea, cotton, maize, rice, fish, beans, cassava, Irish potatoes, cattle, goats, poultry, citrus, pineapples, apples, vegetables, palm oil, and bananas [18,19]. In its 2040 vision, Uganda also prioritized agricultural system diversity [20].
Unfortunately, there are knowledge gaps in understanding these agricultural systems, specifically the linkages between household farm production diversity and dietary diversity. These knowledge gaps have been more evident in the smallholder farm household sector that makes up the largest proportion of the chronically hungry population. Some evidence, for instance by Sibhatu et al. [16], has pointed to market access being more important than farm production diversity towards better dietary diversity. However, in the context of smallholder farmers in some parts of SSA, where market infrastructure is poor and income unequally distributed, such evidence may not be universally valid. Moreover, other evidence has pointed to farm production diversity being more important [9,12,21,22], including recent conclusions by Islam et al. [13]. Therefore, evidence is mixed. In general, empirical evidence linking farm production diversity and nutrition (dietary diversity in quality and quantity) is infrequent, insufficient, and disjointed [23,24,25]. Yet agriculture and nutrition security are strategically important towards eliminating severe hunger and malnutrition [1,25]. Therefore, understanding these linkages in a jointed framework is of strategic importance.
Disjointed efforts studying the agriculture, food security, and nutrition nexus have been evident in literature. For instance, food insecurity (food poverty) has been singly analyzed in SSA without showing relationships between farm production diversity and nutrition security indicators (dietary diversity) [26,27]. Sibhatu et al. [16], showed evidence of association between market access and dietary diversity only. While food insecurity has been studied singly in Uganda without covering farm production diversity [10,28], Sekabira and Qaim [10] have also studied dietary diversity singly in Uganda, moreover using data from only two districts in Central Uganda. A more jointed effort has been done by Jones et al. [12], who associated farm production diversity to household dietary diversity, although they used cross-sectional data and made no causal inferences. Yet, studying diets jointly and comprehensively is important in understanding farm production diversity and dietary diversity linkages [12,22]. Whitney et al. [17] also studied associations between production diversity and dietary diversity but used cross sectional data of a small sample from western Uganda. A relatively more comprehensive effort was done by Islam et al. [13], who used a large sample panel dataset to study associations between farm production diversity and dietary diversity in Bangladesh. However, they used only two data waves, which could not describe trends. Unfortunately, they also did not investigate these associations in other globally dominant smallholder farming regions like the SSA.
Therefore, there has been no empirical guidance on associations of farm production diversity and dietary diversity in SSA that used panel data, and even less so those that used nationally representative panel data. We addressed this gap in literature by focusing on the following research questions:
  • How does farm production diversity (FPD) influence the following household livelihood indicators?
    • Food security,
    • Nutrition security, and
  • Between the farm generated food security pathway and the income generated pathway via market access, which is the more important pathway through which FPD contributed to household dietary diversity?
The farm generated food security pathway (FFS) is the daily food consumption (food security) achieved by households from consuming their own farm produce, and the income generated pathway via market access (MFS) is the food security achieved by households from consuming foods purchased or given from markets.

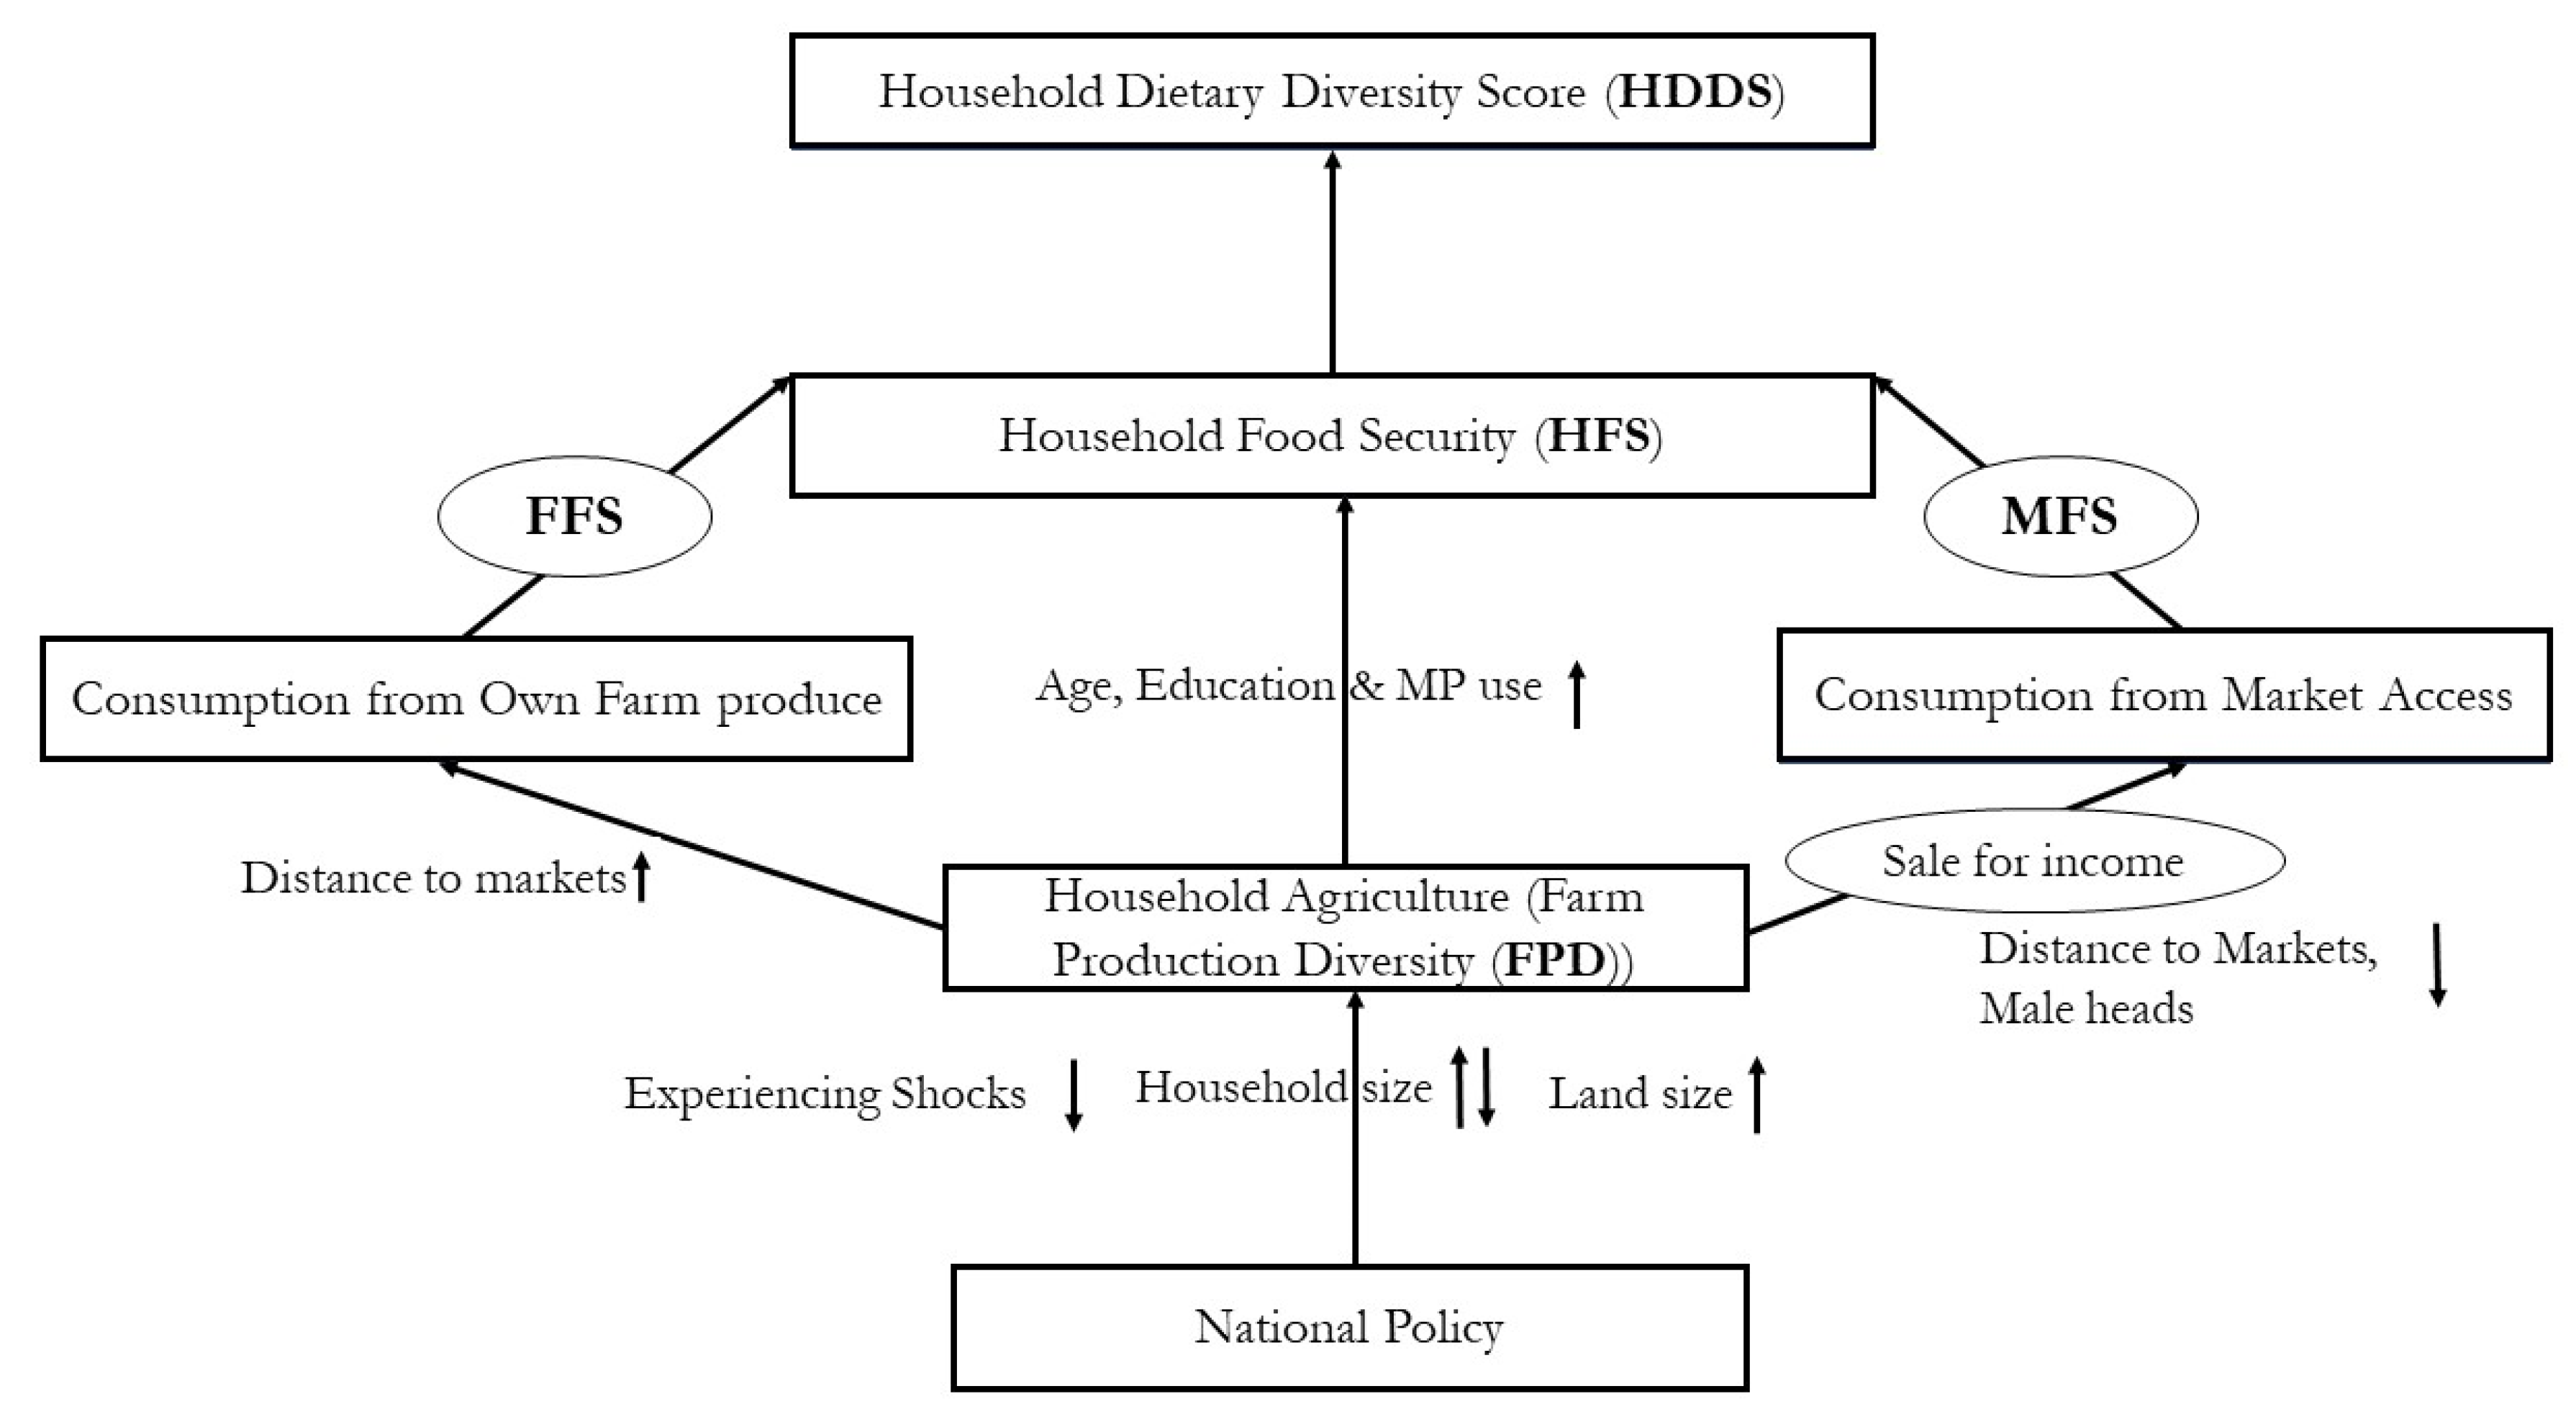
2. Conceptual Framework

Households can satisfy their consumption needs mainly from their own farm production or by buying consumables from markets. By diversifying what households grow on their farms, households can consume from these plants or livestock species or sell these products to access income and then buy consumables from markets. This therefore creates two major consumption pathways: (1) own farm produce consumption, and (2) market access based consumption. In the context of this study, the own farm produce consumption pathway is where households get their consumables (plant or livestock species) directly from the farm, while the market access based consumption pathway is where households get consumables via market channels, for instance, raw foods bought from markets and cooked at home, cooked foods from restaurants, kiosks, etc., and food accessed in kind.
Since farm production diversity (FPD) can enable households to access foods either directly from farms (farm food security pathway (FFS)) or indirectly by using farm incomes to buy from markets (markets food security pathway (MFS)), we hypothesized that FPD had a positive influence on household food security (HFS) and subsequently household dietary diversity score (HDDS). We illustrate these linkages in Figure 1.
Specifically, we hypothesized that households with higher FPD would have better food security and thus a better household dietary diversity score (HDDS). We also hypothesized that households with more diverse farm production would have more market opportunities through marketing more farm items, thus diversifying risks and hence improving their incomes and subsequently their food consumption from markets, which thus leads to a better HDDS. To compare pathways, we hypothesized that the own farm generated food security (FFS) pathway was more important towards improving dietary diversity than the market generated food security (MFS) pathway.
However, we understand that this nexus works around contextual and household characteristics. Therefore, as we built our hypotheses, we factored in these characteristics whose hypothesized direction of influence is reflected by the arrows in the conceptual framework. We also placed these characteristics in the regions of the framework where they were hypothesized to more importantly influence these linkages. Specifically, a longer distance to markets was assumed to impede market access and was thus expected to influence market consumption negatively. However, a longer distance to markets was also assumed to reflect remoteness that would be associated with more land available for farming, hence favoring own farm production consumption. Male heads usually control household incomes and yet are less involved in household feeding schedules and thus were expected to influence HDDS negatively. Direct or indirect knowledge enhancing variables like the use of mobile phone (MP) use, education, and age of the household head were assumed to enhance nutrition awareness and knowledge, hence impacting HDDS positively. Wealth indicators like size of land owned would avail more space for own farm production, thus impacting HDDS positively. Household size was assumed to be two-fold: if the membership was of working age or adult children, these would enhance labor availability for farm production or even income from employment. However, with a more dependent membership, composed of very young children or elderly persons, a larger household size would be a burden. Shocks like droughts, floods, death of household heads, persistent illness, etc. would deprive households of means to access food, thus impacting HDDS negatively. Since this was panel data, we also expected temporal effects on HDDS, which could either be negative or positive given yearly specific effects.

3. Materials and Methods

3.1. Measurement of Farm Production Diversity, Food, and Nutrition Security

Following Sibhatu et al. [16], we measured farm production diversity (FPD) as the household biodiversity index (HBI). The HBI is a simple count of all crops and livestock species produced on the farm. Previously, the HBI was used to study FPD [12,13,16,29]. While computing the HBI, we included crop species farmed for purposes of either food consumption or income generation. Each crop and livestock species was given a quantitative value of 1. The sum of all these crop species farmed generated the household crops biodiversity index (CBI), and otherwise the livestock biodiversity index (LBI). The sum of these two indices (CBI and LBI) gave the household biodiversity index (HBI) that we used to measure FPD. These formulae are illustrated in Equations (1) to (3):
1 k C r o p S p e c i e s i = C B I i
1 J L i v e s t o c k S p e c i e s i = L B I i
C B I i + L B I i = H B I i
where crop species were numbering from 1 to K , and livestock species from 1 to J for household i . Crops grown included avocado, bananas, beans, cabbage, cassava, chick peas, coco yam, cocoa, coffee, cotton, cow peas, dodo, eggplants, field peas, ginger, groundnuts, Irish potatoes, jackfruit, maize, mango, millet, oil palm, onions, oranges, passion fruit, papaya, pigeon peas, pineapples, pumpkins, rice, sesame, sorghum, soya beans, sugarcane, sunflower, sweet potatoes, tea, tobacco, tomatoes, vanilla, wheat, and aerial yam. Livestock species included cattle, donkeys, horses, goats, sheep, pigs, rabbits, chicken, turkeys, ducks, and bees.
Using panel data supported by the World Bank [30], we measured Household Food Security (HFS) following the empirical work of Van Campenhout et al. [28], which established utility consistent food poverty lines for specific regions in Uganda (Kampala (2336), Central (2099), Northern (1653), Eastern (1668), and Western (1990)). Moreover, empirical evidence asserts that food and dietary assessment that reflects region specific societal diets are more appropriate than aggregated assessment [10,12,16,22,31]. The novelty of region specific food poverty lines is that they portray the cost of basic needs (minimum energy requirements in kilocalories for an average adult to live), hence giving a clearer assessment of the consumer’s food security status [10,31]. A household whose cost of daily consumption requirements was above its region’s utility consistent food poverty line was food secure, and otherwise food insecure. We measured consumption and utility lines in Ugandan shillings (UGX) (1 USD = 3500 UGX). We deflated values for earlier years using the official consumer price index (CPI) from the Uganda Bureau of Statistics [4] to enable comparison across households over time.
We measured household dietary diversity score (HDDS) using the aggregate food consumption index, measuring the sum of groups of foods consumed within a household [32]. HDDS reflected the dietary quality of foods available to households, and was used here as the household nutrition security indicator. HDDS was comprised of twelve food groups, namely cereals; white roots and tubers; vegetables; fruits; meat and its products; eggs; fish; legumes, nuts and seeds; dairy and its products; oils and fats; sweets and sugars; and spices, condiments, and beverages. Various approaches can be used to measure dietary diversity, but these should reflect comparative available qualities of foods, diets, and societal food behavior [12,16,32]. Therefore, using HDDS was appropriate. Previously HDDS was used to study dietary diversity [13,14,16,17,33,34,35,36].

3.2. Data Used

We used nationally representative panel data to study farm production diversity and nutrition linkages. We used the Uganda National Panel Survey (UNPS) data, a yearly survey conducted by the Uganda Bureau of Statistics (UBOS) with support from the World Bank’s Living Standards Measurement Study—Integrated Surveys on Agriculture (LSMS-ISA). We used three waves, namely 2009/2010, 2010/2011, and 2011/2012, which covered about 3300 households consecutively. The UNPS is a subset of the nationally representative 2005/2006 Uganda National Household Survey (UNHS) of 6775 households. The data is available freely from the World Bank [30]. We used the agricultural data to derive farm production diversity and the household data to derive household characteristics. Agricultural data covered, among others, land holdings, crops grown, and livestock ownership. Household data covered education, income sources, consumption expenditure, and shocks, among others. There were sufficient data available on Uganda for the opportunity to study these linkages, including literature on food security assessment that account for region specific differences in food prices, as well as culture [10,28].

3.3. Empirical Model for the Impact of Farm Production Diversity on Food and Nutrition Security

We implemented the following specification of panel regression models to address this objective.
F N S I i t = χ 0 + χ 1 F P D i t + χ 2 T t + ε i t
where F N S I i t is a food/nutrition security indicator (food security dummy or HDDS) of household i in year t . χ 0 is a constant. χ 1 is the effect of farm production diversity ( F P D i t ). χ 2 is a time fixed effects parameter, T is the year identifier, and ε i t is the normally distributed error term. Essentially, FPD was HBI.
We followed Equation (4) to assess the influence of FPD on food security and dietary diversity. However, since households chose to farm or not farm particular crop or livestock species, there might have been endogeneity concerns (for instance correlation and reverse causality) stemming from both observed and unobserved heterogeneity over time, thus biasing estimates. We therefore estimated Equation (4) with both random effects (RE) to cater for heterogeneity within observed time variant and time invariant farm household characteristics, and fixed effects (FE) to account for unobserved heterogeneity [37]. FE and RE specifications were recently used to study associations between FPD and dietary diversity [13,38]. A significant Hausman test statistic signaled that the FE specification better suited the data; thus it was used to interpret associated impact. Otherwise we interpreted the RE specification. To the best of our knowledge, no such study with such panel data has yet been done, especially in SSA where a large proportion of smallholder farms are located.

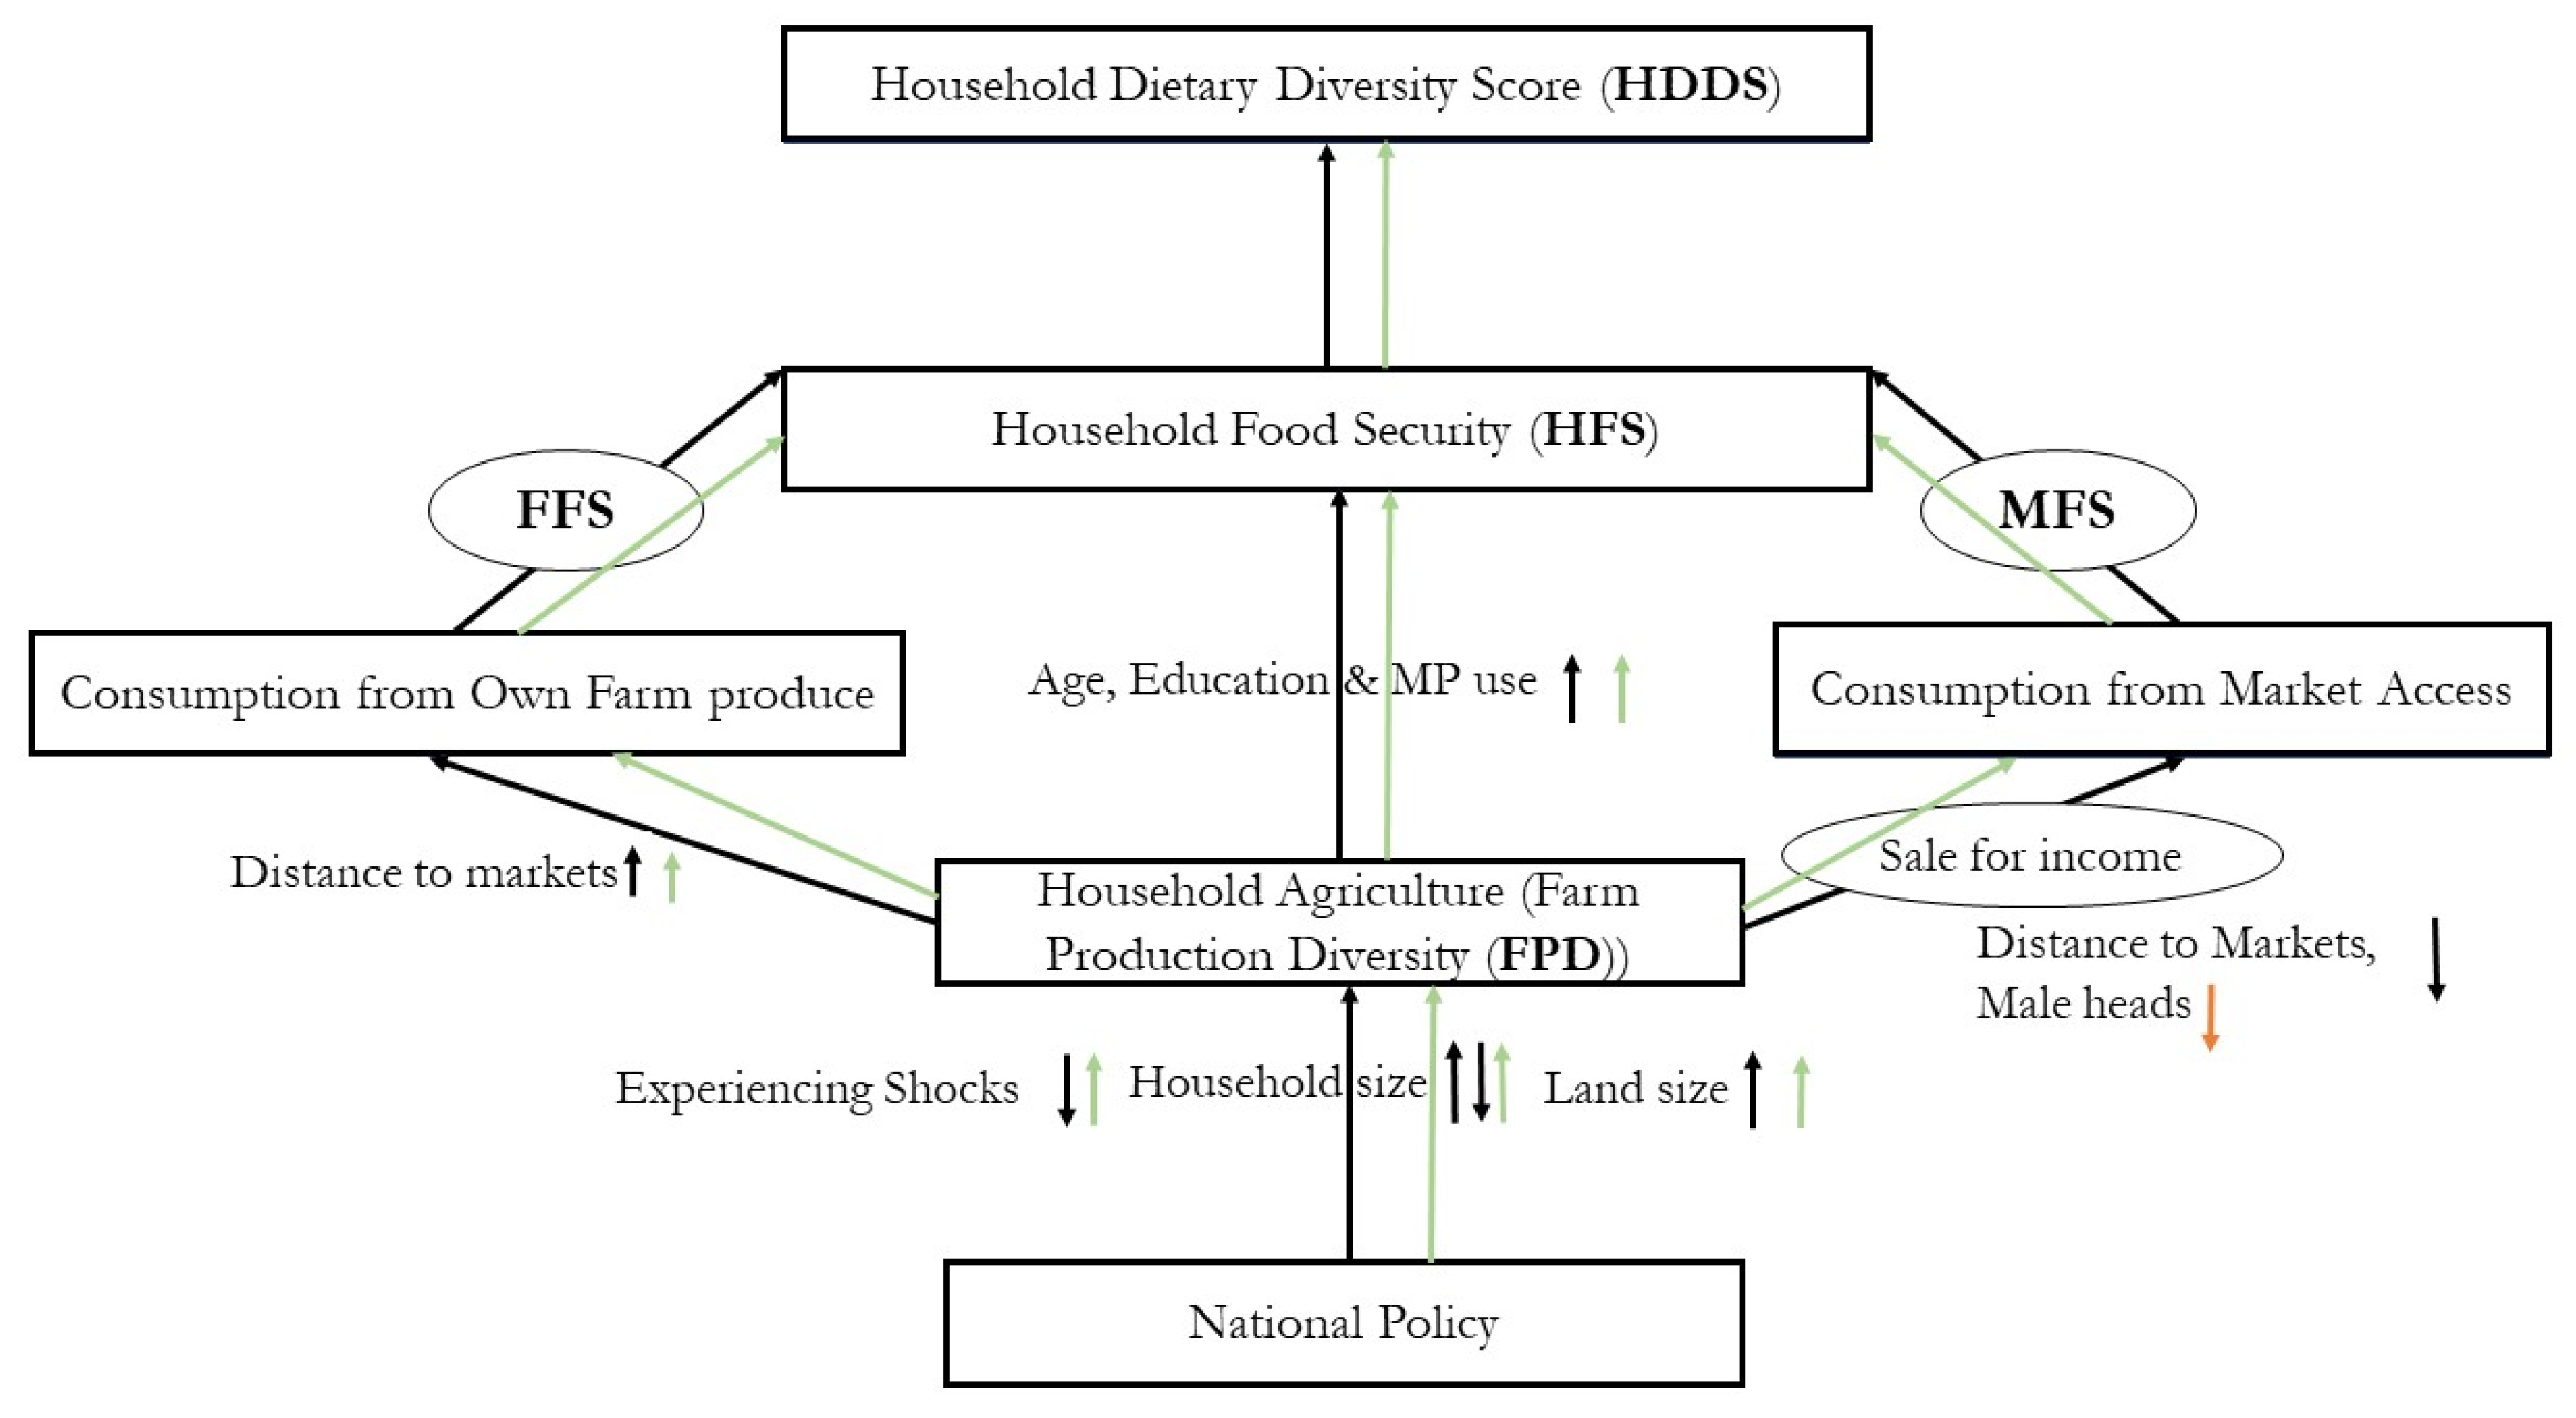
3.4. Modelling Impact Pathways of Farm Production Diversity (FPD) on Nutrition

Following Islam et al. [13], Koppmair et al. [14], and Sibhatu et al. [16], we modeled impact pathways of farm production diversity (FPD) on household dietary diversity ( H D D S i t ) by implementing Equation (5). Essentially, we modified Equation (4) by first controlling for the two food security pathways (market generated food security pathway ( M F S i t ) and own farm generated food security pathway ( F F S i t ) separately. Secondly, we controlled for other household, farm, and contextual characteristics ( X i t ).
H D D S i t = α 0 + α 1 F P D i t + α 2 F F S i t + α 3 M F S i t + α 4 X i t + α 5 T t + ε i t 2
where α 0 is the constant, α 1 is the effect of FPD on HDDS after controlling for other factors, α 2 is the effect of own farm generated food security on HDDS, α 3 is the effect of market generated food security on HDDS, and α 4 is a vector of coefficients for the vector of household characteristics X i t that affected HDDS. α 5 is a time fixed effects parameter, T is a year identifier, while ε i t 2 is the random error term. We estimated Equation (5) with both random and fixed effects, as did Islam et al. [13]. We presented both RE and FE models for comparison of results.
Our data was a pooled unbalanced panel dataset. An unbalanced panel yields estimations that are more efficient than balanced subsets of the same pooled sample [39].

4. Results and Discussion

We present descriptive and empirical results in this section, discuss results, and check for result robustness. In the following section we conclude the paper.

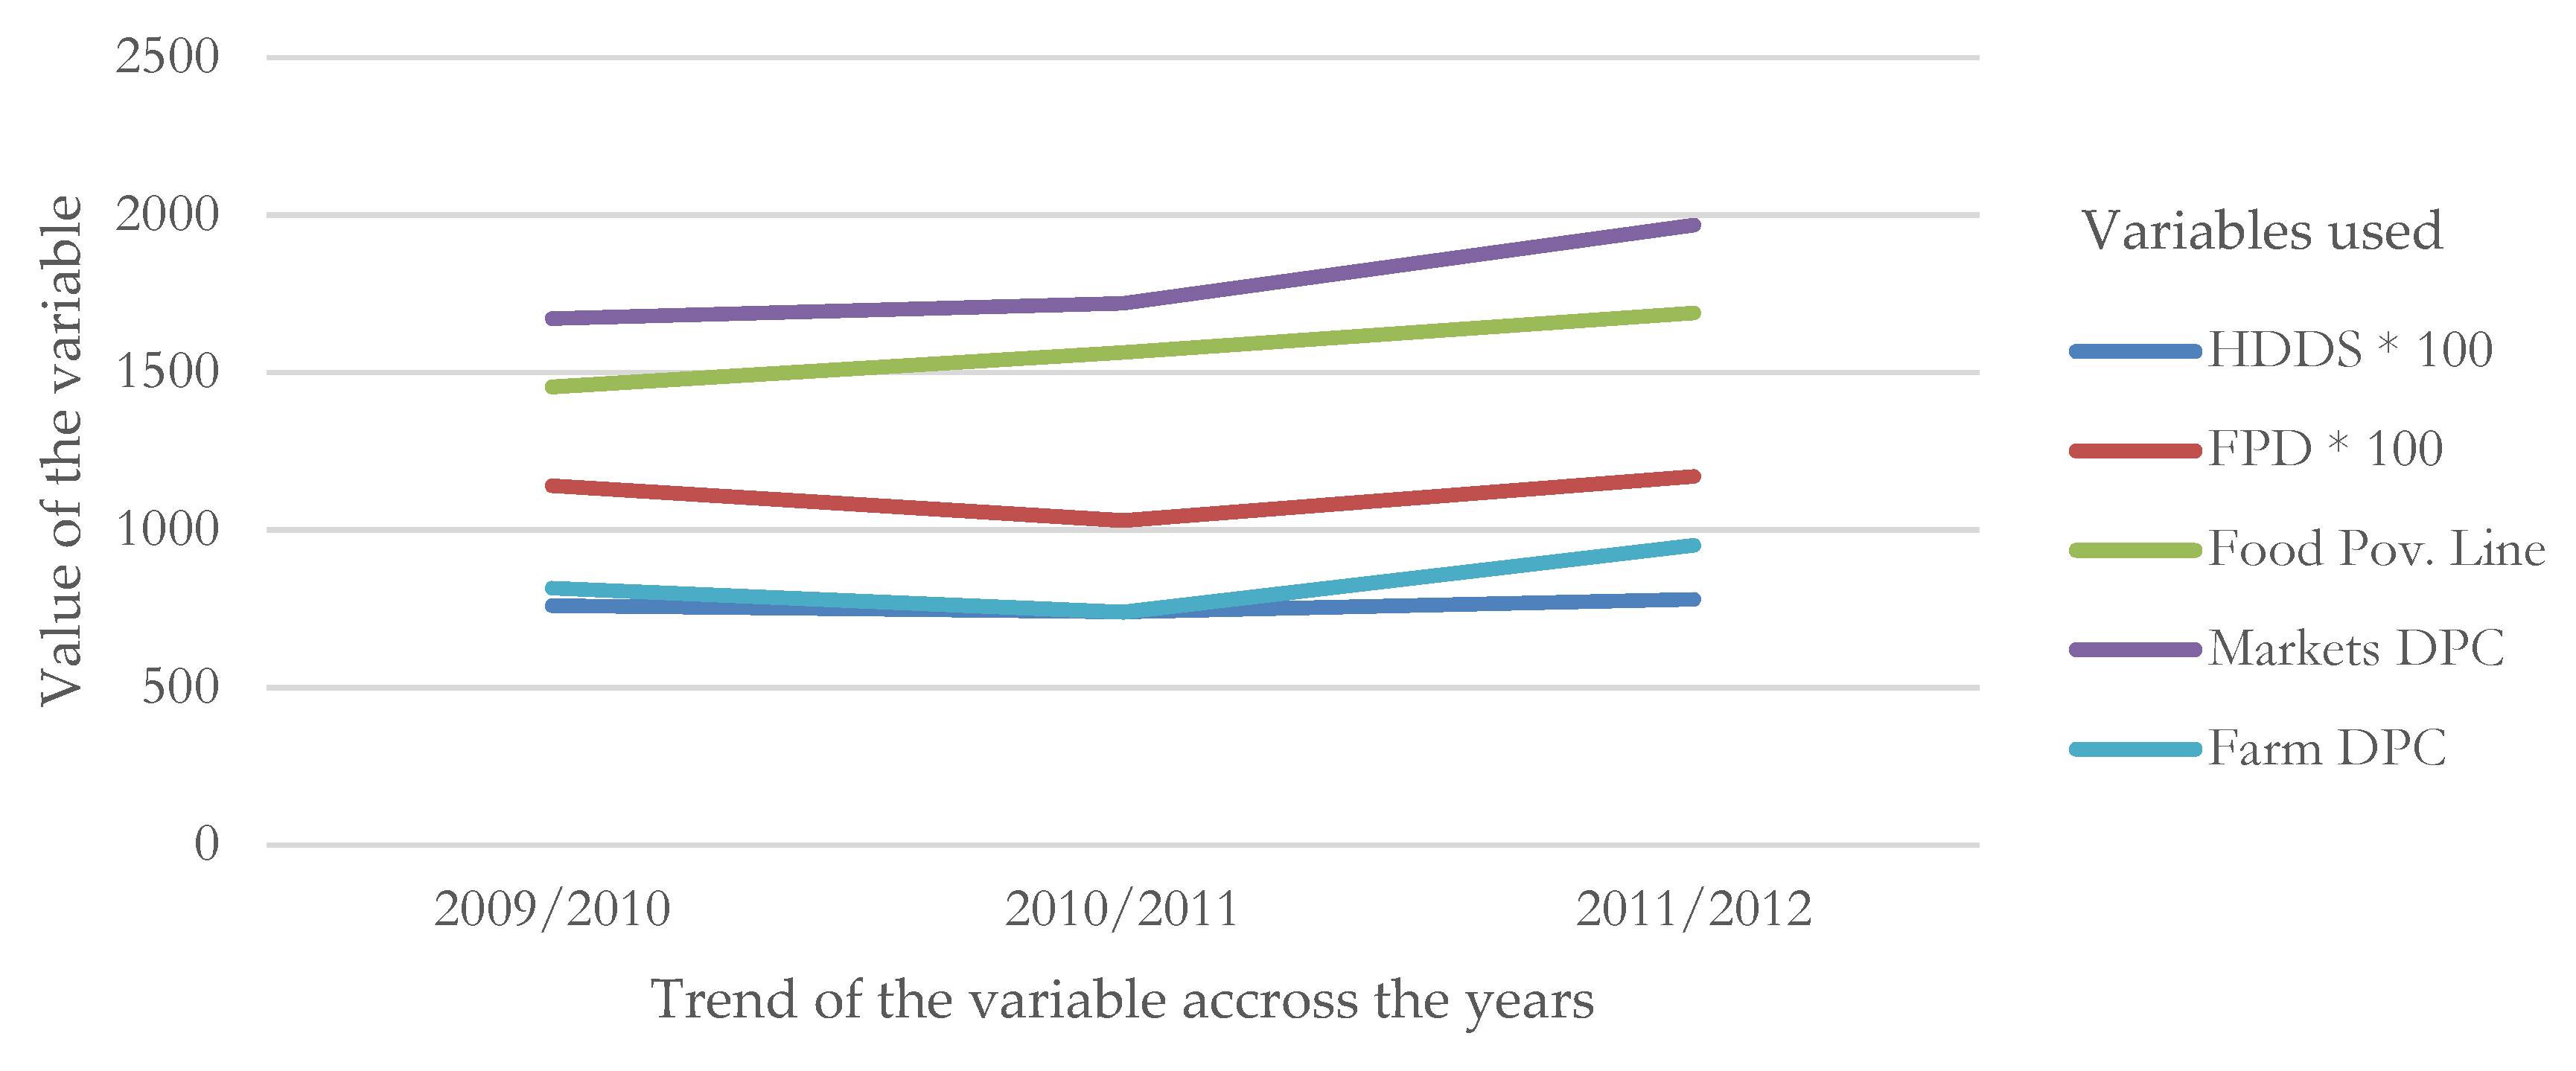
4.1. Descriptive Statistics Results

In Table 1, we presented statistics of variables used in this study. For interpretations, we focused on the mean of the pooled sample. We also presented means of respective data years for trend comparisons, and used some of these for the trend chart in Figure 2. We also presented the range of the pooled sample for insights into dispersions from the mean.
As seen in Table 1, a household consumed 7.6 food groups on average. The mean was close to the range of 11, implying a relatively small dispersion from the central tendency. Households on average produced eleven crops and livestock species on their farms, but with a range of 33. Qualitatively, only about 24% of the sample was food secure across the three data years. In quantitative terms, the daily per capita consumption via markets contributed to total daily per capita consumption nearly twice as much as did the daily per capita consumption from own farm production.
In the middle of Table 1, we presented mean values of explanatory variables. The sample was mostly rural (77%) and male headed (70%). The proportion of male headed households steadily decreased over the years. The sample largely used mobile phones (57%), and users increased steadily across the years. Households on average had seven persons, and the size steadily increased over the years. Household owned land size averaged at 3 acres, but showed steady decreases across years. Household heads spent only 5 years in school (primary level), and were aged 46 years. Households were about 29 km from the nearest market, with a range of 85 km, implying that some households were remote. About 47% of households experienced shocks, for instance; drought, floods, severe illness, deaths, etc. However, the occurrence of shocks steadily decreased over the years.
In Figure 2, we presented trends of key outcome variables. Notably, farm production diversity (FPD) followed a similar trend as that of household dietary diversity score (HDDS). Both farm and markets’ daily per capita expenditures also followed closely similar trends. All these four variables had slight decreases in 2010/2011 before a rise in 2011/2012. The trend for the food poverty line was instead steadily increasing. However, the food security trend (Table 1) showed an upward spike during 2010/2011, the year when FPD and HDDS showed downward spikes.

4.2. Empirical Results

4.2.1. Direct Impact of Farm Production Diversity (FPD) on Food Security and Nutrition

In Table 2, we presented results of panel regression models for the impact of FPD on household food security and HDDS. We used panel logit regression models to analyze influence factors of the food security dummy whose results we presented in models 1 and 2. The Hausman test statistic was significant; thus, we interpreted the fixed effects (FE) model (2).
The probability of households becoming food secure decreased with increasing FPD. However, this directly associated negative impact was not significant, and results were opposite to what we hypothesized. Nevertheless, since only about 24% of the sample was food secure, the food security dummy could have been biased towards the food insecure category. However, a positive and significantly associated impact of FPD on food security (using a continuous variable, the daily per capita consumption in UGX) was established when we checked the robustness of our results, as presented in Appendix Table A1.
HDDS, being a continuous variable, was analyzed using the usual panel regression models. The Hausman test statistic was significant; hence, we interpreted the FE model (4). Results showed that increasing FPD was associated with better HDDS. This was a key finding. In essence, adding a single species of crops or livestock to what households produced on farm was associated with about a 0.04 increment in the food groups consumed. This implied a 0.5% associated increment considering a sample average of 7.6 food groups. Our results indirectly implied that policies aimed at increasing FPD were positively associated with dietary diversity in Uganda.

4.2.2. Food Security Impact Pathways of Farm Production Diversity on Nutrition

To analyze impact pathways, we controlled for these pathways and other household characteristics systematically, and the results are shown in Table 3. The Hausman test statistic was significant in all impact pathways’ analysis models; hence, we interpreted FE models. Results of model 2, where we controlled for aggregated daily per capita food consumption/expenditure in UGX, showed that the associated impact of FPD on HDDS was 0.038 food groups added to dietary diversity for every added species produced on farm. The 0.038 coefficient was a reduction from the 0.043 coefficient in Table 2. This implied that attaining food security was a pathway to attaining dietary diversity. When consumption was disaggregated into pathways (markets and own farm sourced foods) the FPD coefficient remained 0.038. Hence, we confirmed these as pathways of the aggregated food security on dietary diversity. However, the two pathways produced different magnitudes of associated impact on HDDS.
Results in model 4 showed that improved household food security via both the markets and own production pathways was significantly and positively associated with household dietary diversity. Increasing food security expenditure by 1000 UGX via the markets pathway (MFS) was associated with an increase of 0.4 in the number of food groups consumed by a household. This implied an equivalent increase of 5.3 percentage points. An equal incremental expenditure via the own farm production pathway (FFS) was associated with an increase of 0.6 in food groups, implying an 8 percentage point increment.
In models 5 and 6, we controlled for household characteristics. From model 6, FPD coefficients on HDDS decreased in magnitude, but those of daily food consumption via markets (MFS) and daily food consumption from own farm sources (FFS) remained the same. This showed that MFS and FFS were stable food security pathways towards HDDS. However, the decreasing direct importance of FPD towards HDDS pointed to other existing pathways through which FPD influenced HDDS. More notably was the knowledge and information pathway that was realized under mobile phone use, education, and age of household head. Model 6 explained nearly 27% of the variation in household dietary diversity.
Other than FPD, model 6 results also excavated other factors that influenced HDDS, for instance personal characteristics of the household head, such as possession of a mobile phone, age, and education. These were all associated with positive and significant impacts on HDDS. If the head used a mobile phone, this was associated with an increase of 0.42 in food groups consumed, implying a 5.5 percentage point increment. An increasing age of the head was also associated with increased HDDS. Each added year was associated with a 0.01 increase in food groups consumed, implying a 0.13 percentage point increment. An increase in education was also associated with increased HDDS. One added year of formal education was associated with a 0.05 increase in food groups consumed, implying a 0.66 percentage point increment.
An increase in the distance to the nearest market was significantly associated with improvements in HDDS. On average, a one kilometer increase was associated with a 0.01 increase in food groups consumed, implying a 0.13 percentage point increment. We had primarily expected shocks (drought, floods, persistent illnesses, death of household head, etc.) to impact negatively on HDDS. To the contrary, an increase in shocks experienced was associated with better HDDS. Households that experienced any of the above shocks were associated with an increase of 0.09 in food groups consumed, implying a 1.2 percentage point increment. Increases in household size were also associated with significant increases in HDDS. A one-person increase was associated with a 0.29 increase in food groups consumed, implying a 3.8 percentage point increment.
Results in model 6 also showed associated gender influences on HDDS. Male household headship was significantly associated with poorer HDDS. A male head was associated with a 0.5 decrease in food groups consumed, implying a 6.6 percentage point decrease. Similarly, based on 2009/2010, later years (2010/2011, and 2011/2012) were also associated with a negative impact on HDDS. However, wealth indicators like land owned was associated with a positive and significant impact on HDDS. A one-acre increase was associated with a 0.002 increase in food groups consumed, implying a 0.03 percentage point increment.

4.3. Discussion

4.3.1. Descriptive Results Discussion

Previously, average HDDS was found to be 8.7 and 7.5 for central Uganda and western Uganda, respectively [17,35]. At a country level, Sibhatu et al. [16] found HDDS for Kenya and Ethiopia to be 11.4 and 5.4 food groups, respectively. Therefore, our findings are comparable with the existing literature. The literature on farm production diversity (FPD) was scanty for Uganda. However, FPD for Kenya and Ethiopia were found to be 7.8 and 10.2 species, respectively [16]. For Uganda, as Ethiopia, the FPD value was larger than the HDDS value, implying that more crops and livestock species were produced but instead households consumed lesser dietary diversity (compared to Kenya). This could be explained by a heavy dependence on staple foods in Uganda that were mostly cereals, roots and tubers (cassava, sweet potatoes, potatoes), and Matooke (cooking bananas) [9,17]. The relatively large FPD range could also depict large regional (within Uganda) differences in food species diversity across Uganda [9,28].
On the other hand, since own farm production was valued at farm gate prices (usually lower than market prices) the returns per currency unit spent via either pathway may have been different. Therefore, we could not hurriedly interpret these figures to imply that consumption via the market pathway was more important than own farm production. The large range values for consumption figures also point to large differences in consumption capacities across households. The fact that the mean was far smaller than the range depicted the dominance of the subsistence farming nature of our sample. The food consumption expenditure means of our study are quite comparable to literature [4,9,28].
With regards to other explanatory variables, our findings were also comparable to those in the literature. For instance, the mobile phone (MP) use trend was similar to that previously reported in Uganda [35]. The literature also reported a steadily increasing population size, which was perhaps due to high fertility rates [10,33]. The decrease in land size could be explained by the increasing population size leading to land fragmentation [4]. The large range of 47 acres indicated the existence of some large-scale farmers.
Official reports on annual rainfall from 2010 to 2014 showed that either 2010 or 2011 had the lowest rainfall average [4]. This could explain the downward spike in all the FPD, daily markets consumption, own farm consumption, and HDDS variables, since agriculture in Uganda is largely rain dependent. The increasing trend of the food poverty line could instead be explained by the generally increasing food prices over the years [9]. While the upward spike in the food security trend could be explained by food aid or remittances, food aid and remittances have been shown as important food sources for better household food security in Uganda [9,40,41].

4.3.2. Empirical Results Discussion

Results in Table 3 confirmed that both markets and own farm production were stable food security pathways through which farm production diversity impacts household dietary diversity. Although their coefficients were small in size, this only reflects the weak value of the Uganda currency (UGX) in which per capita consumption was measured. Small sized consumption coefficients in studying dietary diversity have been documented in the literature [13]. The own farm production consumption pathway had a stronger effect on HDDS than the market consumption pathway. Most households primarily produced food for home consumption (subsistence); thus, consumption needs were easily addressed through direct consumption from own farm. Our results are in agreement with Islam et al. [13], who found similar results in Bangladesh. However, we contradicted Sibhatu et al. [16], who identified the market pathway as a slightly better alternative. Sibhatu et al. [16] considered more than one country, including Kenya, Ethiopia, Malawi, and Indonesia, whose samples may have been more urban than that of Uganda. Being more urban with better market infrastructure would make it easier to be food secure via markets. For a more rural sample such as Uganda’s (70%, see Table 1), with relatively poorer market infrastructure, dietary diversity was more easily attained via the own farm production pathway. Therefore, for Uganda, own farm production was more important towards improving dietary diversity than markets. Earlier studies on Uganda also concluded that most consumed food was home produced [9,21]. Moreover, even Sibhatu et al. [16] stated that in some situations FPD contributed more importantly towards dietary diversity. Whitney et al. [17] also found FPD to be positively associated with HDDS in Uganda, as did Jones et al. [12] and Koppmair et al. [14] in Malawi.
Among other factors and other possible pathways through which FPD was associated with a significant impact on dietary diversity were the household head’s age, education, and use of a mobile phone. The household head owning and using a mobile phone (MP) influenced dietary diversity through the income and the information and knowledge pathways. Mobile phones enabled access to remittances to smooth consumption. MP usage also enabled communication to relatives or colleagues for businesses from which incomes were generated to smooth consumption. MP usage also enabled access to information and knowledge about types, content, and quality of foods eaten. With such enhanced pathways for remittance income, information, and knowledge, households accessed various food types and also became more aware of the particular importance of specific food stuffs. Our results are in agreement with the literature that found MP usage to positively influence HDDS [35]. With an increasing age, household heads learn through personal experiences and social networks. Such learning benefits heads with vital nutrition knowledge, hence guiding them to better dietary diversity. However, very old age was associated with a negative impact on HDDS (see Appendix Table A1 in Appendix A). Our results are in agreement with earlier findings on Malawi, Bangladesh, and Uganda [13,14,16,35]. With sufficient education, household heads were able to learn and understand feeding basics and compositions of foods (quality) thus enhancing nutrition knowledge that guided households to proper quantities and qualities of foods. Education also had an influence on income pathway. With good education, heads accessed better paying jobs, whose incomes were used in food consumption. Our findings are in line with our expectations and the literature [12,13,14,35].
Remoteness was associated with better dietary diversity. Remoteness was associated with more land available for farming, more so for households that were dominantly subsistent than those in our sample. Moreover, a positive relationship between market distance and HDDS has been previously established in Uganda [35].
Shocks were unexpectedly associated with improved dietary diversity. In times of household specific shocks like persistent illnesses or deaths of heads, households were exposed to remittances from family members. In times of community or regional shocks, for instance floods or droughts, etc., households were usually exposed to national, regional, or international support. Such support usually provided not only reasonable quantities, but also quality foods, including supplements. Thus, this explains the positive association of shocks with dietary diversity. However, these findings must be interpreted with caution, since we used 7-day recall consumption data, which may not represent a full-year scenario. Nevertheless, the panel nature (3 waves across 3 years) may make the results more reliable in depicting a yearly scenario; which may also reflect the persistence of shocks among sample households. With persistent shocks, the remittance pathway may be more reliable than the national or international aid pathway. Remittances have been found to enhance household food consumption [29,40], while food aid has been found to be an important food source in Uganda [9]. To the best of our knowledge, this is the first study that explores relationships between such shocks and HDDS.
Through labor provision towards food production (via farming or wage employment), an increased household size provided more food, and hence better dietary diversity. However, some members like the elderly and young children may be unable to provide such labor yet must be fed, thus increasing the burden on the available food [17]. With our sample’s average age of 45.5 years (Table 1) our sample was of average working age. Our results agree with the existing literature that found household size to be positively associated with HDDS [12,13,35]. However, some literature has concluded with an inverse relationship [14].
Traditionally, women are responsible for the feeding patterns within households, but incomes or decisions on which food stuffs were to be farmed or bought for consumption rested with primary decision makers (heads who were mostly males). This affected dietary diversity negatively, since decisions pertaining to nutrition were taken by secondary decision makers that usually lacked income control to implement such decisions. Our results support recent empirical conclusions where male headship has been found to be negatively associated with HDDS by [12,13,35]. Nevertheless, these results must not be over interpreted. Female headed households in the sample were not by will female headed, as was with male headed households. Female headed households were such because of natural or social disasters, for instance death of the husband or divorce. Furthermore, there were usually no adult males in female headed households. Yet in almost all male headed households, there were adult females that usually helped out males in several aspects, including nutrition. Perhaps the gender associated effects would be more negative if adult household males lived without adult females, as the reverse was found for households referred to here as female headed. Perhaps there was a contribution of females in the coefficient of the male household headship presented here, but this contribution was impossible to disentangle.
Sample households were largely subsistence (43.3% in 2012 [4]); therefore, increments in land allowed farmers to grow more crops or livestock species, thus improving their dietary diversity. These findings are in line with our expectations and the existing literature [14,35]. Finally, negative time effects of later years may have reflected increasing negative effects of climate change or effects of increasing food prices over time. Effects of climate change and food prices could not be thoroughly investigated in this study.

4.4. Robustness Check

We carried out robustness checks on the main empirical results, that is, the impact of FPD on (1) food security and dietary diversity, and (2) food security impact pathways on HDDS. We re-estimated our main results using different methods. We used a Mundlak (MK) approach, which is a pseudo fixed effects estimator [42], to re-estimate the impact of FPD on food security and HDDS, and a three stage least squares (3SLS) approach to re-estimate food security impact pathways on HDDS.
The choice of the Mundlak was based on the fact that, in our main impact results, we interpreted the FE estimator. However, our sample had some households whose headship had changed (due to deaths, divorce, etc.) over the years, hence varying usually time-invariant variables like gender. Subsequently, such variables were not dropped when we ran the FE estimator. Since the Hausman test had indicated the appropriateness of the FE estimator, we found it plausible to run a pseudo fixed effects (MK) estimator for robustness check. The MK estimator contained covariate mean values of explanatory variables as additional covariates, hence controlled for possible biases arising due to time-invariant unobserved heterogeneity [43]. This helped us to control for unobserved heterogeneity of time-invariant covariates, as would be done by the FE estimator [37]. Results in Appendix Table A1, models 2 and 3, respectively, confirmed a positive and significant association between FPD and food security (daily per capita consumption), and HDDS. From both methods, FPD coefficients were nearly the same (0.033 in Table 3, and 0.036 in Table A1).
For impact pathways, we estimated a simultaneous equations system elaborated in Appendix B (in the back matter) following a three-stage least squares approach, the results of which are presented in Appendix Table A2 in the back matter. As in Table 3, results in Table A2 showed that both food markets and own farm production were associated with a positive and significant impact on HDDS. Notably, the own farm production pathway showed stronger associated impact on HDDS, further agreeing with our results, as seen in Table 3. Moreover, our FE interpreted coefficients were more conservative.

5. Conclusions

We indeed found that farm production diversity (FPD) significantly improved household food security and dietary diversity, thus enhancing food and nutrition security. Indirectly, therefore, policies that promoted FPD in Uganda were of relevance in improving food and nutrition security.
More specifically, FPD was associated positively and significantly with household dietary diversity in Uganda. This associated impact was realized via the own farm production and the market consumption food security pathways. However, households realized larger associated impacts of FPD on dietary diversity via the own farm production consumption pathway. The study also found that other impact pathways existed through which FPD influenced household dietary diversity, most notably the information and knowledge pathway realized via the use of mobile phones, better education, and adult age. There were also notable underlying gender effects associated with household dietary diversity. Households that were headed by males were associated with poorer dietary diversity compared to those headed by females. This gender disparity may be explained by the continued dominance of males in controlling household incomes, yet feeding patterns and choices may still be dominantly controlled by females.
Finally, given the various analytical methodologies that we used, but which produced consistently similar and comparable results, we have confidence in the established impact associations, even more so given that closely similar associations have been established elsewhere in the literature. However, we acknowledge the need to use more exact nutrition indicators, for instance micronutrients, for more exactness with respect to dietary quality improvement assessment. Although the availability of such indicators was limited in our data, using them in future research would be valuable.
As a pictorial summary of the conclusion, we generate a replica of Figure 1 and show this in Figure 3, reflecting the findings of our research versus our expectations (Figure 1). We highlight the direction of the findings in green ink (if finding were positive towards household dietary diversity), and in orange ink (if findings were negative) but keep prior expectations in black ink, thus clearly showing established agreements and discrepancies.

Author Contributions

Conceptualization was by H.S. and S.N.; the literature review and early documentation was by H.S. and S.N.; data assembling and analysis was by H.S. and S.N.; the methodological reviews and trials were by H.S., writing, review, and editing was by H.S. All authors have read and agreed to the published version of the manuscript.

Funding

This research was funded by the African Economic Research Consortium (AERC) under Grant No. RT17534. AERC did not participate in any way in the writing of the research, and the authors have no other attachments to AERC.

Acknowledgments

We wish to express our deep appreciation to the African Economic Research Consortium (AERC) for the financial support to carry out this research under Grant No. RT17534. We are also grateful to the AERC resource persons, most notably Victor Okoruwa who was our focal person, Damiano Manda who is managing Research at AERC, and members of AERC’s thematic Group E (Agriculture, Nutrition, Climate change and Natural resource management) for various comments and suggestions that helped the evolution of this study from its inception to completion. We are also indebted to the anonymous referees who reviewed the paper and provided very useful comments and suggestions that helped in shaping and improving the overall quality of the paper. The findings made and opinions expressed in this paper are exclusively those of the authors. Authors are also solely responsible for content and any errors.

Conflicts of Interest

The authors declare that they had no conflict of interest.

Appendix A

Table A1. The Impact of farm production diversity (FPD) on food, and nutrition Security.
VariablesFood Security (Dummy)Daily per Capita Consumption (UGX)Nutrition Indicator (HDDS) 12 Food Groups
Logit-MK (1)MK (2)MK (3)
FPD (biodiversity index)−0.043 ***8.509 **0.036 ***
(0.009)(3.703)(0.006)
Distance to market (kilometers)0.020 *7.324 *0.011 *
(0.012)(4.114)(0.007)
Mobile phone use (dummy)−0.372 ***303.2 ***0.486 ***
(0.114)(45.87)(0.075)
Household size (persons)0.144 ***−66.63 ***0.181 ***
(0.036)(13.77)(0.022)
Male heads (dummy)0.122−97.55−0.318 **
(0.245)(97.67)(0.159)
Age of head (years)0.00253.71 ***0.069 ***
(0.018)(7.385)(0.012)
Age of head squared (years)1.5 × 10⁻⁵−0.462 ***−0.001 ***
(0.0002)(0.093)(0.0002)
Education (years)0.00130.79 ***0.055 ***
(0.015)(5.630)(0.009)
Shock experience (dummy) −0.108133.9 ***0.169 ***
(0.085)(33.62)(0.055)
Land size (GPS acres)0.0030.4320.002
(0.009)(0.875)(0.001)
Year 2010/20110.289 ***−19.63−0.364 ***
(0.079)(31.45)(0.051)
Year 2011/2012−0.174 *356.7 ***−0.168 ***
(0.091)(34.74)(0.057)
Means of Variables
Distance to market (kilometers)−0.019−7.334 *−0.010
(0.012)(4.226)(0.007)
Mobile phone use (dummy)−0.791 ***673.0 ***0.987 ***
(0.158)(69.63)(0.116)
Household size (persons)0.013−63.42 ***−0.097 ***
(0.038)(15.00)(0.025)
Male heads (dummy)−0.299159.10.079
(0.262)(107.3)(0.176)
Age of head (years)0.0071.9920.016
(0.022)(9.192)(0.015)
Age of head squared (years)−4.6 × 10⁻⁵−0.051−0.0001
(0.0003)(0.108)(0.0002)
Education (years)−0.104 ***42.67 ***0.077 ***
(0.020)(8.382)(0.014)
Shock experience (dummy) 0.242 *−78.370.088
(0.145)(65.51)(0.110)
Land size (GPS acres)−0.036 **3.747 *−0.001
(0.015)(1.968)(0.003)
Constant−1.329 ***5093 ***3.259 ***
(0.293)(130.6)(0.221)
Observations861686168616
No. of households330033003300
Wald Chi2 value 487.94 ***1677.90***1787.80 ***
Standard errors in parentheses; *** p < 0.01, ** p < 0.05, * p < 0.1; MK is Mundlak model.

Appendix B

To carryout robustness checks on our established impact pathways of FPD on household nutrition security (HNS), we implemented a simultaneous equations procedure described below. Following our conceptual frame work, we assumed that the sequence of influence stemmed from agricultural policies alongside other household characteristics K i t that guided households on which crops or livestock species to produce. This dictated F P D i t of household i in year t . We modeled this relationship in Equation (A1).
F P D i t = δ 0 + δ 1 K i t + δ 2 T t + ε i t 2
Then, given what was produced on farm ( F P D i t ), this dictated what households consumed at home; here termed as own farm generated food security ( F F S i t ), or what households sold to markets to gain incomes and buy food from markets; here termed as market generated food security ( M F S i t ). Alongside other household characteristics ( K i t ), farm production diversity ( F P D i t ), dictated the nature of ( F F S i t ) or ( M F S i t ). We modeled this relationship in Equation (A2)
F F S i t / M F S i t = β 0 + β 1 F P D i t + β 2 K i t + β 3 T t + ε i t 3
By households consuming directly from the farm via ( F F S i t ) this constituted the own farm generated food security pathway, whereas consumption via markets ( M F S i t ) constituted the markets food security pathway. Subsequently, both pathways, alongside other household characteristics ( K i t ), helped households attain a better household dietary diversity score (HDDS), thus household nutrition security ( H N S i t ). We used HDDS to represent ( H N S i t ). We modeled this relationship in Equation (A3).
H N S i t = α 0 + α 1 F F S i t + α 2 M F S i t + α 3 K i t + α 4 T t + ε i t 4
Where α β and δ are parameters that were estimated, T was a year identifier while ε i t was a random error term. Households usually consumed from markets, and own farm sources simultaneously, yet household characteristics also influenced ( F P D i t ), ( F F S i t ), ( M F S i t ), and ( H N S i t ) simultaneously. Therefore, following our conceptual framework, we modeled the system of Equations (A1) to (A3) simultaneously. This was a three-stage least squares (3SLS) estimations system. Practically, the system at first, estimated individual reduced equations, and then estimated individual structural equations in the second stage; that is estimates of Equation (A1) used in Equation (A2). Note that ( F F S i t ), and ( M F S i t ) equations were separate, and that the composition of the vector of household characteristics ( K ) was different for each equation, based on our observations and literature. In the third stage, estimates from the two-stage least squares (2SLS) equations of ( F F S i t ), and ( M F S i t ) from Equation (A2), were incorporated in the main Equation (A3), and then the entire system was estimated simultaneously. This procedure was based on elaborations and applications in literature [44,45,46]. Interdependencies within our intermediate and final outcome variables ( F P D i t , F F S i t , M F S i t and H N S i t ) as illustrated above led to endogeneity among variables. The 3SLS approach allowed for specification of all endogenous variables, as endogenous, thus controlling for endogeneity. With such specification, equations were then solved simultaneously producing error terms that were consecutively independent; with zero mean, and were homoscedastic [45].
Table A2. Impact pathways of food security towards nutrition security using simultaneous equations.
Variables (1)(2)(3)(4)
Household Nutrition (HDDS)Daily per Capita Consumption via Markets (UGX)Daily per Capita Consumption from Home Production (UGX)Farm Diversity (Biodiversity Index)
Daily per capita consumption via Markets (UGX)0.0025 ***
(0.0001)
Daily per capita consumption from Farm Production (UGX)0.0033 ***
(0.0003)
Farm production diversity (biodiversity index) −87.69 ***114.8 ***
(16.57)(3.968)
Distance to nearest market (kilometers)−0.003−4.613 **
(0.002)(1.925)
Head uses mobile phone (dummy)−5.407 ***2.096 ***38.39
(0.620)(556.4)(109.1)
Household size (persons)0.705 ***−165.5 ***−64.94 ***0.405 ***
(0.040)(14.66)(4.905)(0.017)
Male heads (dummy)−0.450 ***154.7 **−13.700.995 ***
(0.084)(61.35)(21.79)(0.132)
Age of head (years)−0.028 ***4.421−0.6450.046 ***
(0.004)(3.459)(0.736)(0.004)
Education of head (years)0.058 ***7.6779.975 **−0.108 ***
(0.016)(18.92)(4.455)(0.015)
Shock experience (dummy)−0.232 ***221.8 ***−65.49 ***1.469 ***
(0.082)(60.62)(19.67)(0.123)
Land size (GPS meters)−0.001 −1.290 **0.025 ***
(0.002) (0.532)(0.003)
Year 2010/2011−0.486 ***49.47102.7 ***−1.088 ***
(0.085)(73.32)(22.81)(0.145)
Year 2011/2012 −1.453 ***380.0 ***224.2 ***0.004
(0.129)(84.15)(23.86)(0.146)
Urban household (dummy) 882.3 ***
(182.2)
Productive assets (UGX) −2.03 × 10⁻⁹−2.29 × 10⁻⁹ ***
(9.28 × 10⁻⁸)(5.95 × 10⁻¹⁰)
Access to extension services (dummy) 2.996 ***
(0.145)
Free/lease hold land tenure (dummy) 3.038 ***
(0.135)
Annual precipitation (mm) 0.0013 ***
(0.0003)
Elevation (meters) 7.34 × 10⁻⁵
(0.0003)
Constant1.088 ***1.885 ***−1.3300.171
(0.345)(224.5)(64.26)(0.575)
Observations8491849184918491
Notes: Standard errors in parentheses, *** p < 0.01, ** p < 0.05; UGX is Uganda shillings.

References

  1. Food and Agriculture Organization of the United Nations Home page. Sustainable Development Goals. Available online: http://www.fao.org/sustainable-development-goals/overview/en/ (accessed on 23 November 2015).
  2. United Nations Home Page. Sustainable Development Goals. Available online: https://sustainabledevelopment.un.org/sdgs (accessed on 20 February 2017).
  3. Grimm, M.; Wetta, C.; Nikiema, A. Burkina Faso: Shipping around the Malthusian Trap. In Growth and Poverty in Sub-Saharan Africa; Arndt, C., McKay, A., Tarp, F., Eds.; Oxford University Press: Oxford, UK, 2016; pp. 165–189. ISBN 978-0-1987-4479-5. [Google Scholar]
  4. Uganda Bureau of Statistics (UBOS). Statistical Abstract. Available online: https://www.ubos.org/wp-content/uploads/publications/03_2018Statistical_Abstract_2015.pdf (accessed on 13 July 2017).
  5. Ssewanyana, N.S.; Okidi, A.J.; Angemi, D.; Barungi, V. Understanding the determinants of income inequality in Uganda. In Working Paper Series of the Centre for the Study of African Economies (CSAE); University of Oxford: Oxford, UK, 2004; p. 29. [Google Scholar]
  6. Ajakaiye, O.; Jerome, T.A.; Olaniyan, O.; Mahrt, K.; Alaba, A.O. Spatial and Temporal Multidimensional: Poverty in Nigeria. In Growth and Poverty in Sub-Saharan Africa; Arndt, C., McKay, A., Tarp, F., Eds.; Oxford University Press: Oxford, UK, 2016; pp. 218–237. ISBN 978-0-1987-4479-5. [Google Scholar]
  7. Reardon, T.; Taylor, J.E.; Stamoulis, K.; Lanjouw, P.; Balisacan, A. Effects of Non-Farm Employment on Rural Income Inequality in Developing Countries: An Investment Perspective. J. Agric. Econ. 2000, 51, 266–288. [Google Scholar] [CrossRef]
  8. Arndt, C.; Demery, L.; McKay, A.; Tarp, F. Growth and Poverty Reduction in Tanzania. In Growth and Poverty in Sub-Saharan Africa; Arndt, C., McKay, A., Tarp, F., Eds.; Oxford University Press: Oxford, UK, 2016; pp. 238–262. ISBN 978-0-1987-4479-5. [Google Scholar]
  9. Food and Nutrition Technical Assistance II Project (FANTA-2). The Analysis of the Nutrition Situation in Uganda; FHI 360: Washington, DC, USA, 2010. [Google Scholar]
  10. Van Campenhout, B.; Sekabira, H.; Aduayom, H.D. Poverty and its Dynamics in Uganda–Explorations Using a New Set of Poverty Lines. In Growth and Poverty in Sub-Saharan Africa; Arndt, C., McKay, A., Tarp, F., Eds.; Oxford University Press: Oxford, UK, 2016; pp. 138–160. ISBN 978-0-1987-4479-5. [Google Scholar]
  11. Godfray, H.C.J.; Beddington, J.R.; Crute, I.R.; Haddad, L.; Lawrence, D.; Muir, J.F.; Pretty, J.; Robinson, S.; Thomas, S.M.; Toulmin, C.; et al. Food Security: The Challenge of Feeding 9 Billion People. Science 2010, 327, 812–818. [Google Scholar] [CrossRef] [PubMed] [Green Version]
  12. Jones, A.D.; Shrinivas, A.; Bezner-Kerr, R. Farm production diversity is associated with greater household dietary diversity in Malawi: Findings from nationally representative data. Food Policy 2014, 46, 1–12. [Google Scholar] [CrossRef]
  13. Islam, A.H.M.S.; von Braun, J.; Thorne-Lyman, L.A.; Ahmed, U.A. Farm diversification and food and nutrition security in Bangladesh: Empirical evidence from nationally representative household panel data. Food Secur. 2018, 10, 701–720. [Google Scholar] [CrossRef]
  14. Koppmair, S.; Kassie, M.; Qaim, M. Farm production, market access and dietary diversity in Malawi. Public Health Nutr. 2017, 20, 325–335. [Google Scholar] [CrossRef] [PubMed] [Green Version]
  15. Minten, B.; Barrett, C.B. Agricultural technology, productivity, and poverty in Madagascar. World Dev. 2008, 36, 797–822. [Google Scholar] [CrossRef]
  16. Sibhatu, K.T.; Krishna, V.V.; Qaim, M. Production diversity and dietary diversity in smallholder farm households. Proc. Natl. Acad. Sci. USA 2015, 112, 10657–10662. [Google Scholar] [CrossRef] [PubMed] [Green Version]
  17. Whitney, C.W.; Luedeling, E.; Hensel, O.; Tabuti, J.R.S.; Krawinkel, M.; Gebauer, J.; Kehlenbeck, K. The role of home gardens for food and nutrition security in Uganda. Hum. Ecol. 2018, 46, 497–514. [Google Scholar] [CrossRef]
  18. Ministry of Agriculture, Animal Industry and Fisheries (MAAIF). Agriculture for Food and Income Security: Agriculture Sector Development Strategy and Investment Plan: 2010/11-2014/15; Ministry of Agriculture, Animal Industry and Fisheries (MAAIF): Kampala, Uganda, 2010; p. 78.
  19. Ministry of Agriculture, Animal Industry and Fisheries (MAAIF). Agriculture Sector Strategic Plan 2015/16-2019/20. Available online: https://www.agriculture.go.ug/agriculture-sector-strategic-plan-assp/ (accessed on 23 November 2017).
  20. National Planning Authority. Uganda Vision 2040. Available online: http://www.npa.go.ug/uganda-vision-2040/ (accessed on 13 February 2017).
  21. Benson, T. Improving Nutrition as a Development Priority: Addressing under Nutrition in National Policy Processes in Sub-Saharan Africa; International Food Policy Research Institute (IFPRI): Washington, DC, USA, 2008; Research Report 156; pp. 42–68. [Google Scholar]
  22. Haddinott, J. Agriculture, health, and nutrition: Towards conceptualizing the linkages. In Reshaping Agriculture for Nutrition and Health; Fan, S., Pandya-Lorch, R., Eds.; International Food Policy Research Institute (IFPRI): Washington, DC, USA, 2012; Chapter 2; pp. 13–20. ISBN 978-0-8962-9673-2. [Google Scholar]
  23. Mello, J.A.; Gans, K.M.; Risica, P.M.; Kirtania, U.; Strolla, L.O.; Fournier, L. How Is Food Insecurity Associated with Dietary Behaviors? An Analysis with Low-Income, Ethnically Diverse Participants in a Nutrition Intervention Study. J. Acad. Nutr. Diet. 2010, 110, 1906–1911. [Google Scholar] [CrossRef] [Green Version]
  24. Shariff, Z.M.; Khor, G.L. Obesity and Household Food Insecurity: Evidence from a Sample of Rural Households in Malaysia. Eur. J. Clin. Nutr. 2005, 59, 1049–1058. [Google Scholar] [CrossRef] [Green Version]
  25. Webb, P.; Kennedy, E. Impacts of Agriculture on Nutrition: Nature of the evidence and research gaps. Food Nutr. Bull. 2014, 35, 126–132. [Google Scholar] [CrossRef]
  26. Arndt, C.; McKay, A.; Tarp, F. Growth and Poverty in Sub-Saharan Africa; Oxford University Press: Oxford, UK, 2016; ISBN 978-0-1987-4479-5. [Google Scholar]
  27. Arndt, C.; Tarp, F. Measuring Poverty and Wellbeing in Developing Countries; Oxford University Press: Oxford, UK, 2017; ISBN 978-0-1987-4480-1. [Google Scholar]
  28. Van Campenhout, B.; Sekabira, H.; Nattembo, F. Uganda: A New Set of Utility-Consistent Poverty Lines. In Measuring Poverty and Wellbeing in Developing Countries; Arndt, C., Tarp, F., Eds.; Oxford University Press: Oxford, UK, 2017; pp. 139–161. ISBN 978-0-1987-4480-1. [Google Scholar]
  29. Di Falco, S.; Chavas, J.P. On Crop Biodiversity, Risk Exposure, and Food Security in the Highlands of Ethiopia. Am. J. Agric. Econ. 2009, 91, 599–611. [Google Scholar] [CrossRef] [Green Version]
  30. World Bank. Central Data Catalog: Living Standards Measurement Study, Uganda. Available online: https://microdata.worldbank.org/index.php/catalog#_r=1568635091798&collection=&country=&dtype=&from=1890&page=1&ps=&sid=&sk=LSMS%20Uganda&sort_by=rank&sort_order=desc&to=2019&topic=&view=s&vk= (accessed on 21 January 2017).
  31. Arndt, C.; Simler, K.R. Estimating Utility–Consistent Poverty Lines with Applications to Egypt and Mozambique. Econ. Dev. Cult. Change 2010, 58, 449–474. [Google Scholar] [CrossRef] [Green Version]
  32. Swindale, A.; Bilinsky, P. Household Dietary Diversity Score for Measurement of Household Food Access: Indicator Guide; Food and Nutrition Technical Assistance Project (FANTA): Washington, DC, USA, 2006. [Google Scholar]
  33. Kennedy, L.G.; Pedro, L.R.; Seghieri, C.; Nantel, G.; Brouwer, I. Dietary Diversity Score Is a Useful Indicator of Micronutrient Intake in Non-Breast-Feeding Filipino Children. J. Nutr. 2007, 137, 472–477. [Google Scholar] [CrossRef] [Green Version]
  34. Fongar, A.; Gödecke, T.; Aseta, A.; Qaim, M. How well do different dietary and nutrition assessment tools match? Insights from rural Kenya. Public Health Nutr. 2018, 22, 391–403. [Google Scholar] [CrossRef]
  35. Sekabira, H.; Qaim, M. Can mobile phones improve gender equality and nutrition? Panel data evidence from farm households in Uganda. Food Policy 2017, 73, 95–103. [Google Scholar] [CrossRef]
  36. Wanyama, R.; Goedecke, T.; Qaim, M. Food Security and Dietary Quality in African Slums. Sustainability 2019, 11, 5999. [Google Scholar] [CrossRef] [Green Version]
  37. Wooldridge, J.M. Econometric Analysis of Cross Section and Panel Data, 2nd ed.; The MIT Press: Cambridge, MA, USA, 2010; ISBN 978-0-2622-3258-6. [Google Scholar]
  38. Sassi, M. Seasonality and Nutrition-Sensitive Agriculture in Kenya: Evidence from Mixed-Methods Research in Rural Lake Naivasha Basin. Sustainability 2019, 11, 6223. [Google Scholar] [CrossRef] [Green Version]
  39. Baltagi, B.H.; Song, S.H. Unbalanced panel data: A survey. Stat. Pap. 2006, 47, 493–523. [Google Scholar] [CrossRef]
  40. Munyegera, G.K.; Matsumoto, T. Mobile money, remittances, and household welfare: Panel evidence from rural Uganda. World Dev. 2016, 79, 127–137. [Google Scholar] [CrossRef]
  41. S ekabira, H.; Qaim, M. Mobile money, agricultural marketing, and off-farm income in Uganda. Agric. Econ. 2017, 48, 597–611. [Google Scholar] [CrossRef]
  42. Mundlak, Y. On the pooling of time series and cross section data. Econometrica 1978, 46, 69–85. [Google Scholar] [CrossRef]
  43. Cameron, A.C.; Trivedi, P.K. Microeconometrics: Methods and Applications; Cambridge University Press: Cambridge, UK, 2005. [Google Scholar]
  44. Zellner, A.; Theil, H. Three-Stage Least Squares: Simultaneous estimation of simultaneous equations. Econometrica 1962, 30, 54–78. [Google Scholar] [CrossRef]
  45. Arellano, M.; Bover, O. Another look at the instrumental variable estimation of error-components models. J. Econom. 1995, 68, 29–51. [Google Scholar] [CrossRef] [Green Version]
  46. Shankara, V.; Mannering, F. Modeling the endogeneity of lane-mean speeds and lane-speed deviations: A structural equations approach. Transp. Res. Part A Policy Pract. 1998, 32, 311–322. [Google Scholar] [CrossRef]
Figure 1. Conceptual framework for the farm production diversity and household dietary diversity linkages. FFS is food security achieved via consumption of own farm produce, and MFS is food security from market consumables.
Sustainability 12 01028 g001
Figure 2. Trends of key variables. HDDS (household dietary diversity score) and FPD (farm production diversity) were multiplied by 100 for proper scaling. DPC is daily per capita consumption.
Sustainability 12 01028 g002
Figure 3. The conceptual framework showing expected directions of impact (black ink) of explanatory variables towards HDDS, versus the established study findings (green or orange ink).
Sustainability 12 01028 g003
Table 1. Description of dependent and independent variables.
Variable2009/20102010/20112011/2012Pooled Sample
Mean
(Std. Dev.)
Mean
(Std. Dev.)
Mean
(Std. Dev.)
Mean
(Std. Dev.)
Range
Dependent variables
Household dietary diversity score (HDDS)7.629 (2.329)7.436 (2.389)7.772 (2.281)7.616 (2.336)11
Food secure HHs (CPI weighted utility consistent food poverty line) (percentage)21.981 (41.418)28.115 (44.964)21.259 (40.921)23.674 (42.511)100
CPI weighted utility consistent food poverty line (UGX)1453.99 (177.67)1564.24 (189.74)1689.13 (181.44)1568.13 (207.08)675.129
Farm production diversity, FPD (biodiversity index)11.402 (4.889)10.261 (4.010)11.677 (3.681)11.134 (4.278)33
Explanatory variables
Distance to nearest market (kilometers)28.914 (19.385)29.456 (19.154)29.344 (18.795)29.230 (19.114)85.81
Location of HH was urban (percentage)25.849 (43.788)22.496 (41.764)20.491 (40.371)22.995 (42.082)100
Male gender of HH head (percentage)71.899 (44.957)69.591 (46.011)69.263 (46.148)70.286 (45.703)100
Household size (persons)6.293 (3.291)7.059 (3.555)7.511 (3.790)6.946 (3.585)27
Education of HH head (years)5.509 (4.082)5.258 (3.935)5.238 (3.961)5.335 (3.996)16
HH head used mobile phones (percentage)51.554 (49.984)55.962 (49.652)63.471 (48.159)56.909 (49.523)100
Age of the HH head (years)44.732 (15.146)45.935 (15.159)46.064 (15.117)45.561 (15.151)86
HH experienced shocks (percentage)60.082 (48.981)44.034 (49.652)35.671 (47.911)46.854 (49.904)100
Land size (acres measured by GPS)3.744 (5.499)3.235 (4.839)2.932 (4.375)3.346 (4.994)47.34
Pathways analysis variables
Total daily household per capita food consumption (UGX)2317.47 (1948.15)2275.02 (1953.03)2769.67 (2301.63)2456.13 (2086.99)18,860.12
Daily per capita food consumption via markets (UGX) (proxy for MFS)1671.27 (1909.82)1720.38 (1915.32)1967.57 (2180.30)1786.41 (2010.51)18,867.86
Daily per capita food consumption from own production (UGX) (proxy for FFS)815.22 (648.11)739.29 (624.90)950.85 (847.58)836.86 (720.04)8600
Source: Authors’ calculations from UNPS data from 2009/2010, 2010/2011, and 2011/2012; HH is household; CPI is consumer price index, UGX is Uganda shillings, MFS is market food security pathway, FFS is own farm food security pathway.
Table 2. Associated impact of farm production diversity (FPD) on food security and nutrition.
Explanatory VariablesFood Security DummyHDDS with 12 Food Groups
RE (1)FE (2)RE (3)FE (4)
Farm Production Diversity (biodiversity index)0.023 ***−0.0150.036 ***0.043 ***
(0.006)(0.011)(0.005)(0.007)
Year 2010/20110.469 ***0.401 ***−0.214 ***−0.232 ***
(0.073)(0.076)(0.049)(0.051)
Year 2011/2012−0.049−0.0160.0690.057
(0.074)(0.076)(0.048)(0.049)
Constant−2.001 *** 7.147 ***7.140 ***
(0.091) (0.064)(0.077)
Observations8616325086168616
No. of households3300110833003300
Wald χ2 value67.65 *** 101.86 ***
F-value 46.89 *** 29.90 ***
Hausman test value 31.13 *** 10.83 **
Standard errors in parentheses; *** p < 0.01, ** p < 0.05; RE is random effects; FE is fixed effects.
Table 3. Food security impact pathways of farm production diversity on household nutrition.
Explanatory VariablesHousehold Dietary Diversity Score (HDDS of 12 Food Groups)
RE (1)FE (2)RE (3)FE (4)RE (5)FE (6)
Farm production diversity (biodiversity index)0.059 ***0.038 ***0.053 ***0.038 ***0.023 ***0.033 ***
(0.004)(0.006)(0.005)(0.007)(0.005)(0.006)
Daily per capita (DPC) food consumption (UGX)0.0005 ***0.0005 ***
(1.1 × 10⁻⁵)(1.4 × 10⁻⁵)
DPC food consumption via markets (UGX) 0.0004 ***0.0004 ***0.0004 ***0.0004 ***
(1.2 × 10⁻⁵)(1.6 × 10⁻⁵)(1.2 × 10⁻⁵)(1.5 × 10⁻⁵)
DPC food consumption via own production (UGX) 0.0005 ***0.0006 ***0.0006 ***0.0006 ***
(2.9 × 10⁻⁵)(3.5 × 10⁻⁵)(2.8 × 10⁻⁵)(3.4 × 10⁻⁵)
HH head uses a mobile phone (yes = 1) 0.751 ***0.415 ***
(0.052)(0.068)
Distance to market (kilometers) 0.004 **0.014 **
(0.002)(0.006)
Household size (persons) 0.220 ***0.291 ***
(0.009)(0.021)
Male gender of HH head (male = 1) −0.340 ***−0.503 ***
(0.064)(0.143)
Age of HH head (years) 0.0010.011 ***
(0.002)(0.004)
Education of HH head (years) 0.085 ***0.049 ***
(0.006)(0.008)
HH experienced shocks (yes = 1) 0.119 ***0.088 *
(0.044)(0.049)
Land size (GPS acres) 0.0010.002 *
(0.001)(0.001)
Year 2010/2011−0.170 ***−0.229 ***−0.180 ***−0.227 ***−0.391 ***−0.462 ***
(0.0435)(0.0450)(0.0449)(0.0465)(0.045)(0.048)
Year 2011/2012−0.145 ***−0.152 ***−0.139 ***−0.153 ***−0.456 ***−0.562 ***
(0.0431)(0.0445)(0.0445)(0.0460)(0.046)(0.054)
Constant5.779 ***6.002 ***5.920 ***6.085 ***3.981 ***3.211 ***
(0.0646)(0.0742)(0.0675)(0.0772)(0.120)(0.244)
Observations861686168616861686168616
No. of households330033003300330033003300
Wald χ2 value2323.73 *** 1656.74 *** 3461.55 ***
F-value 389.02 *** 231.18 *** 131.70 ***
Hausman test value 37.16 *** 59.46 *** 144.50 ***
Overall R-squared0.2080.2030.1600.1560.3250.266
Standard errors in parentheses; *** p < 0.01, ** p < 0.05, * p < 0.1; HH is household; UGX is Uganda shillings; RE is random effects, FE is fixed effects.

