Analysis of Multi-Stakeholders’ Behavioral Strategies Considering Public Participation under Carbon Taxes and Subsidies: An Evolutionary Game Approach


Abstract
1. Introduction
2. Literature Review
2.1. The Low-Carbon Policy on Enterprises’ Decision-Making
2.2. The Role of Public Participation in Environmental Protection
2.3. The Application of the Evolutionary Game
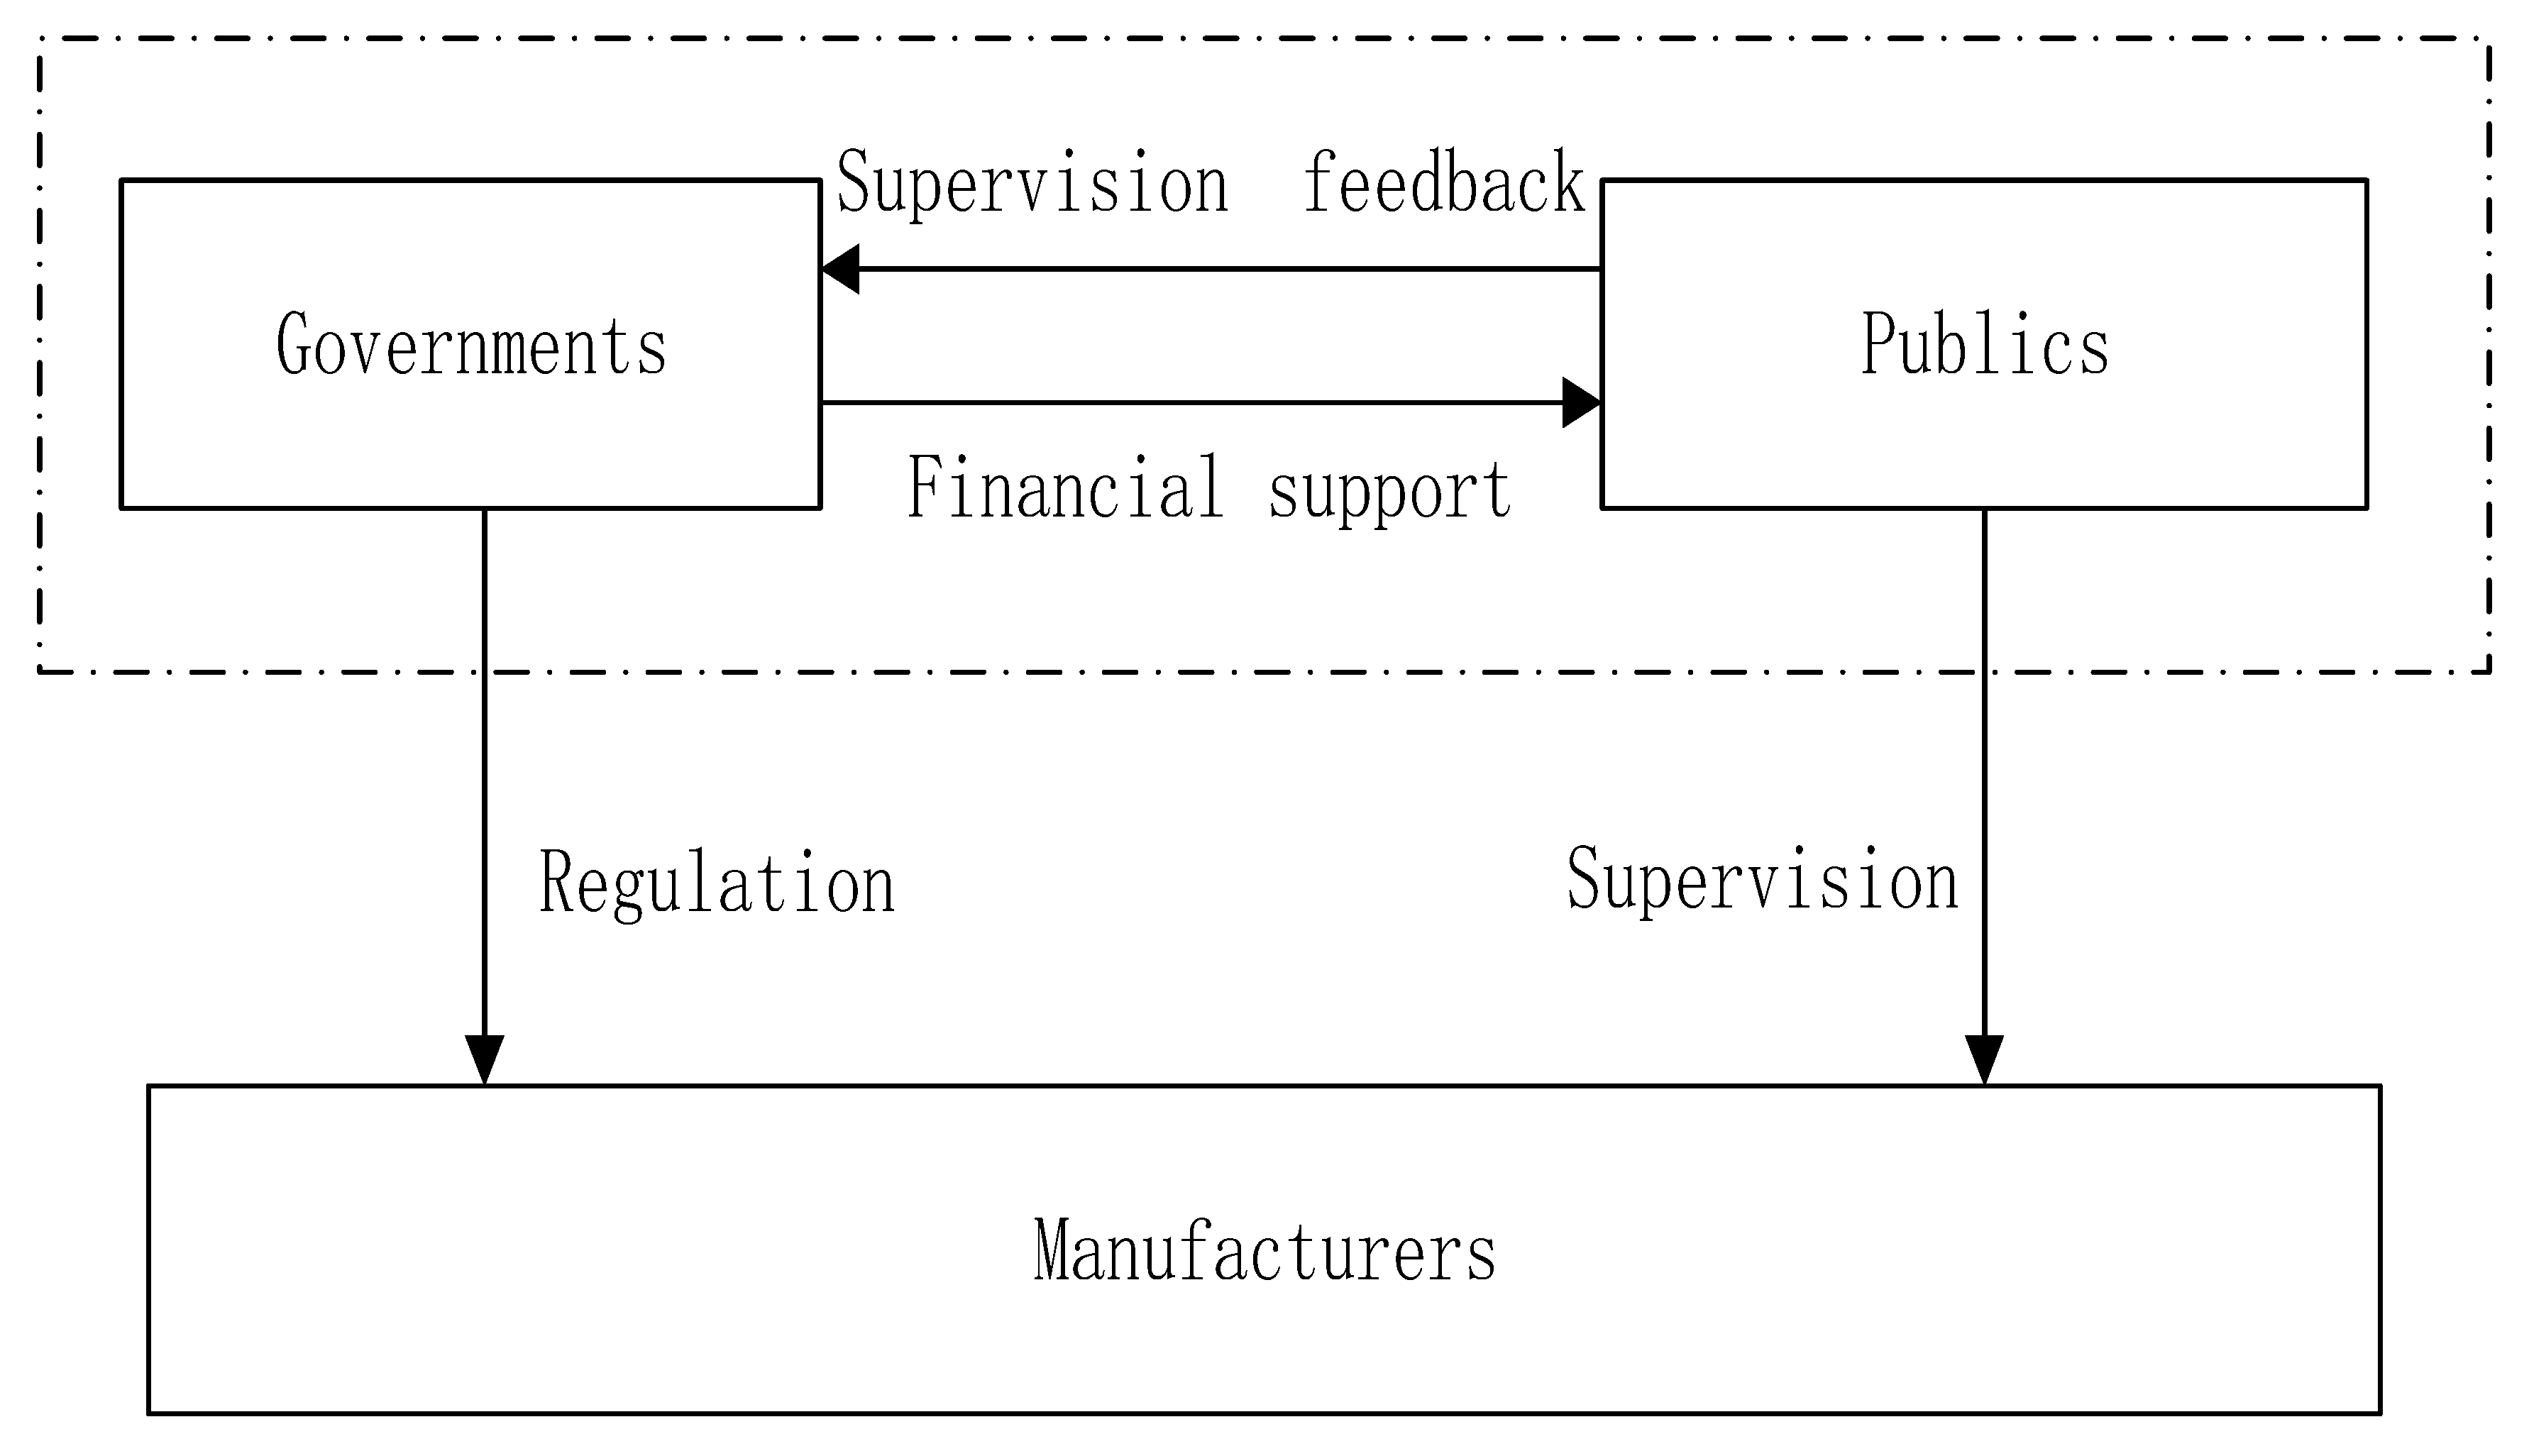
3. Model and Stability Analysis
3.1. Model Assumption
3.2. Model Formulation
3.3. Model Solution
3.3.1. The Replicator Dynamic Behavior of Governments
3.3.2. The Replicator Dynamic Behavior of Manufacturers
3.3.3. The Replicator Dynamic Behavior of Publics
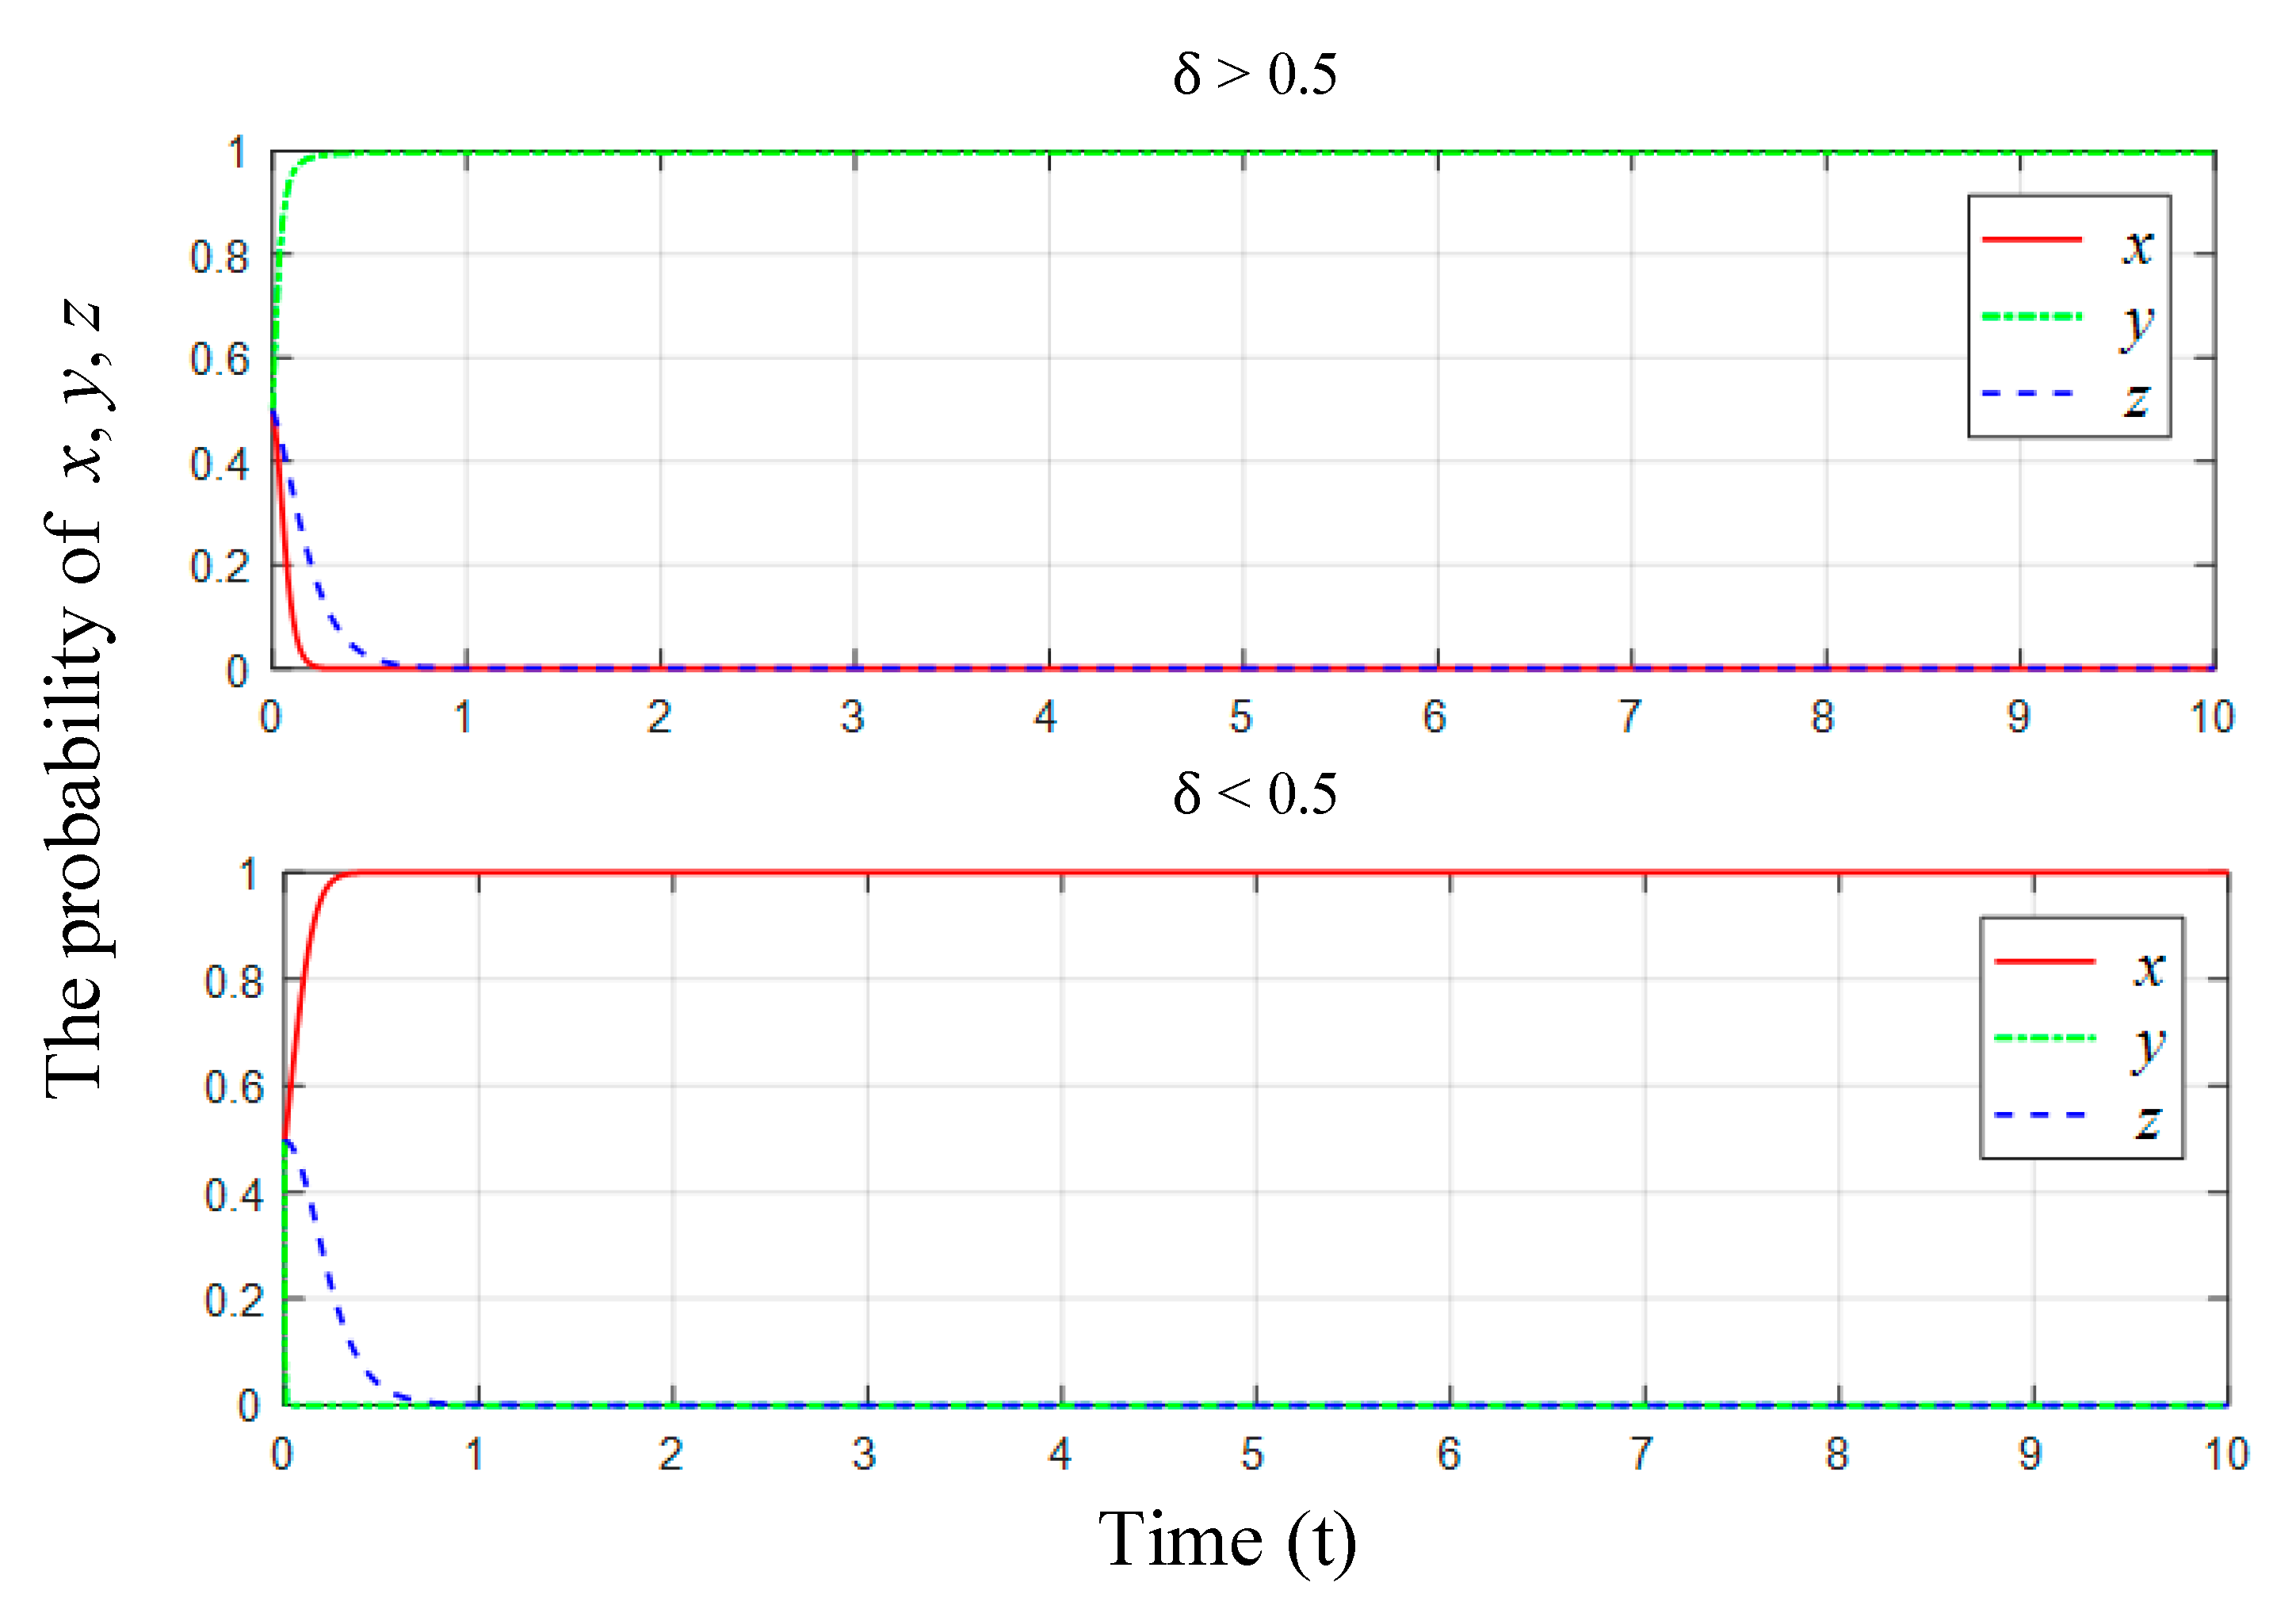
3.4. Stability Analysis
4. Case and Parameters Setting
5. Simulation and Discussion
5.1. The Influence of on Multi-Stakeholders’ Evolutionary Behavior
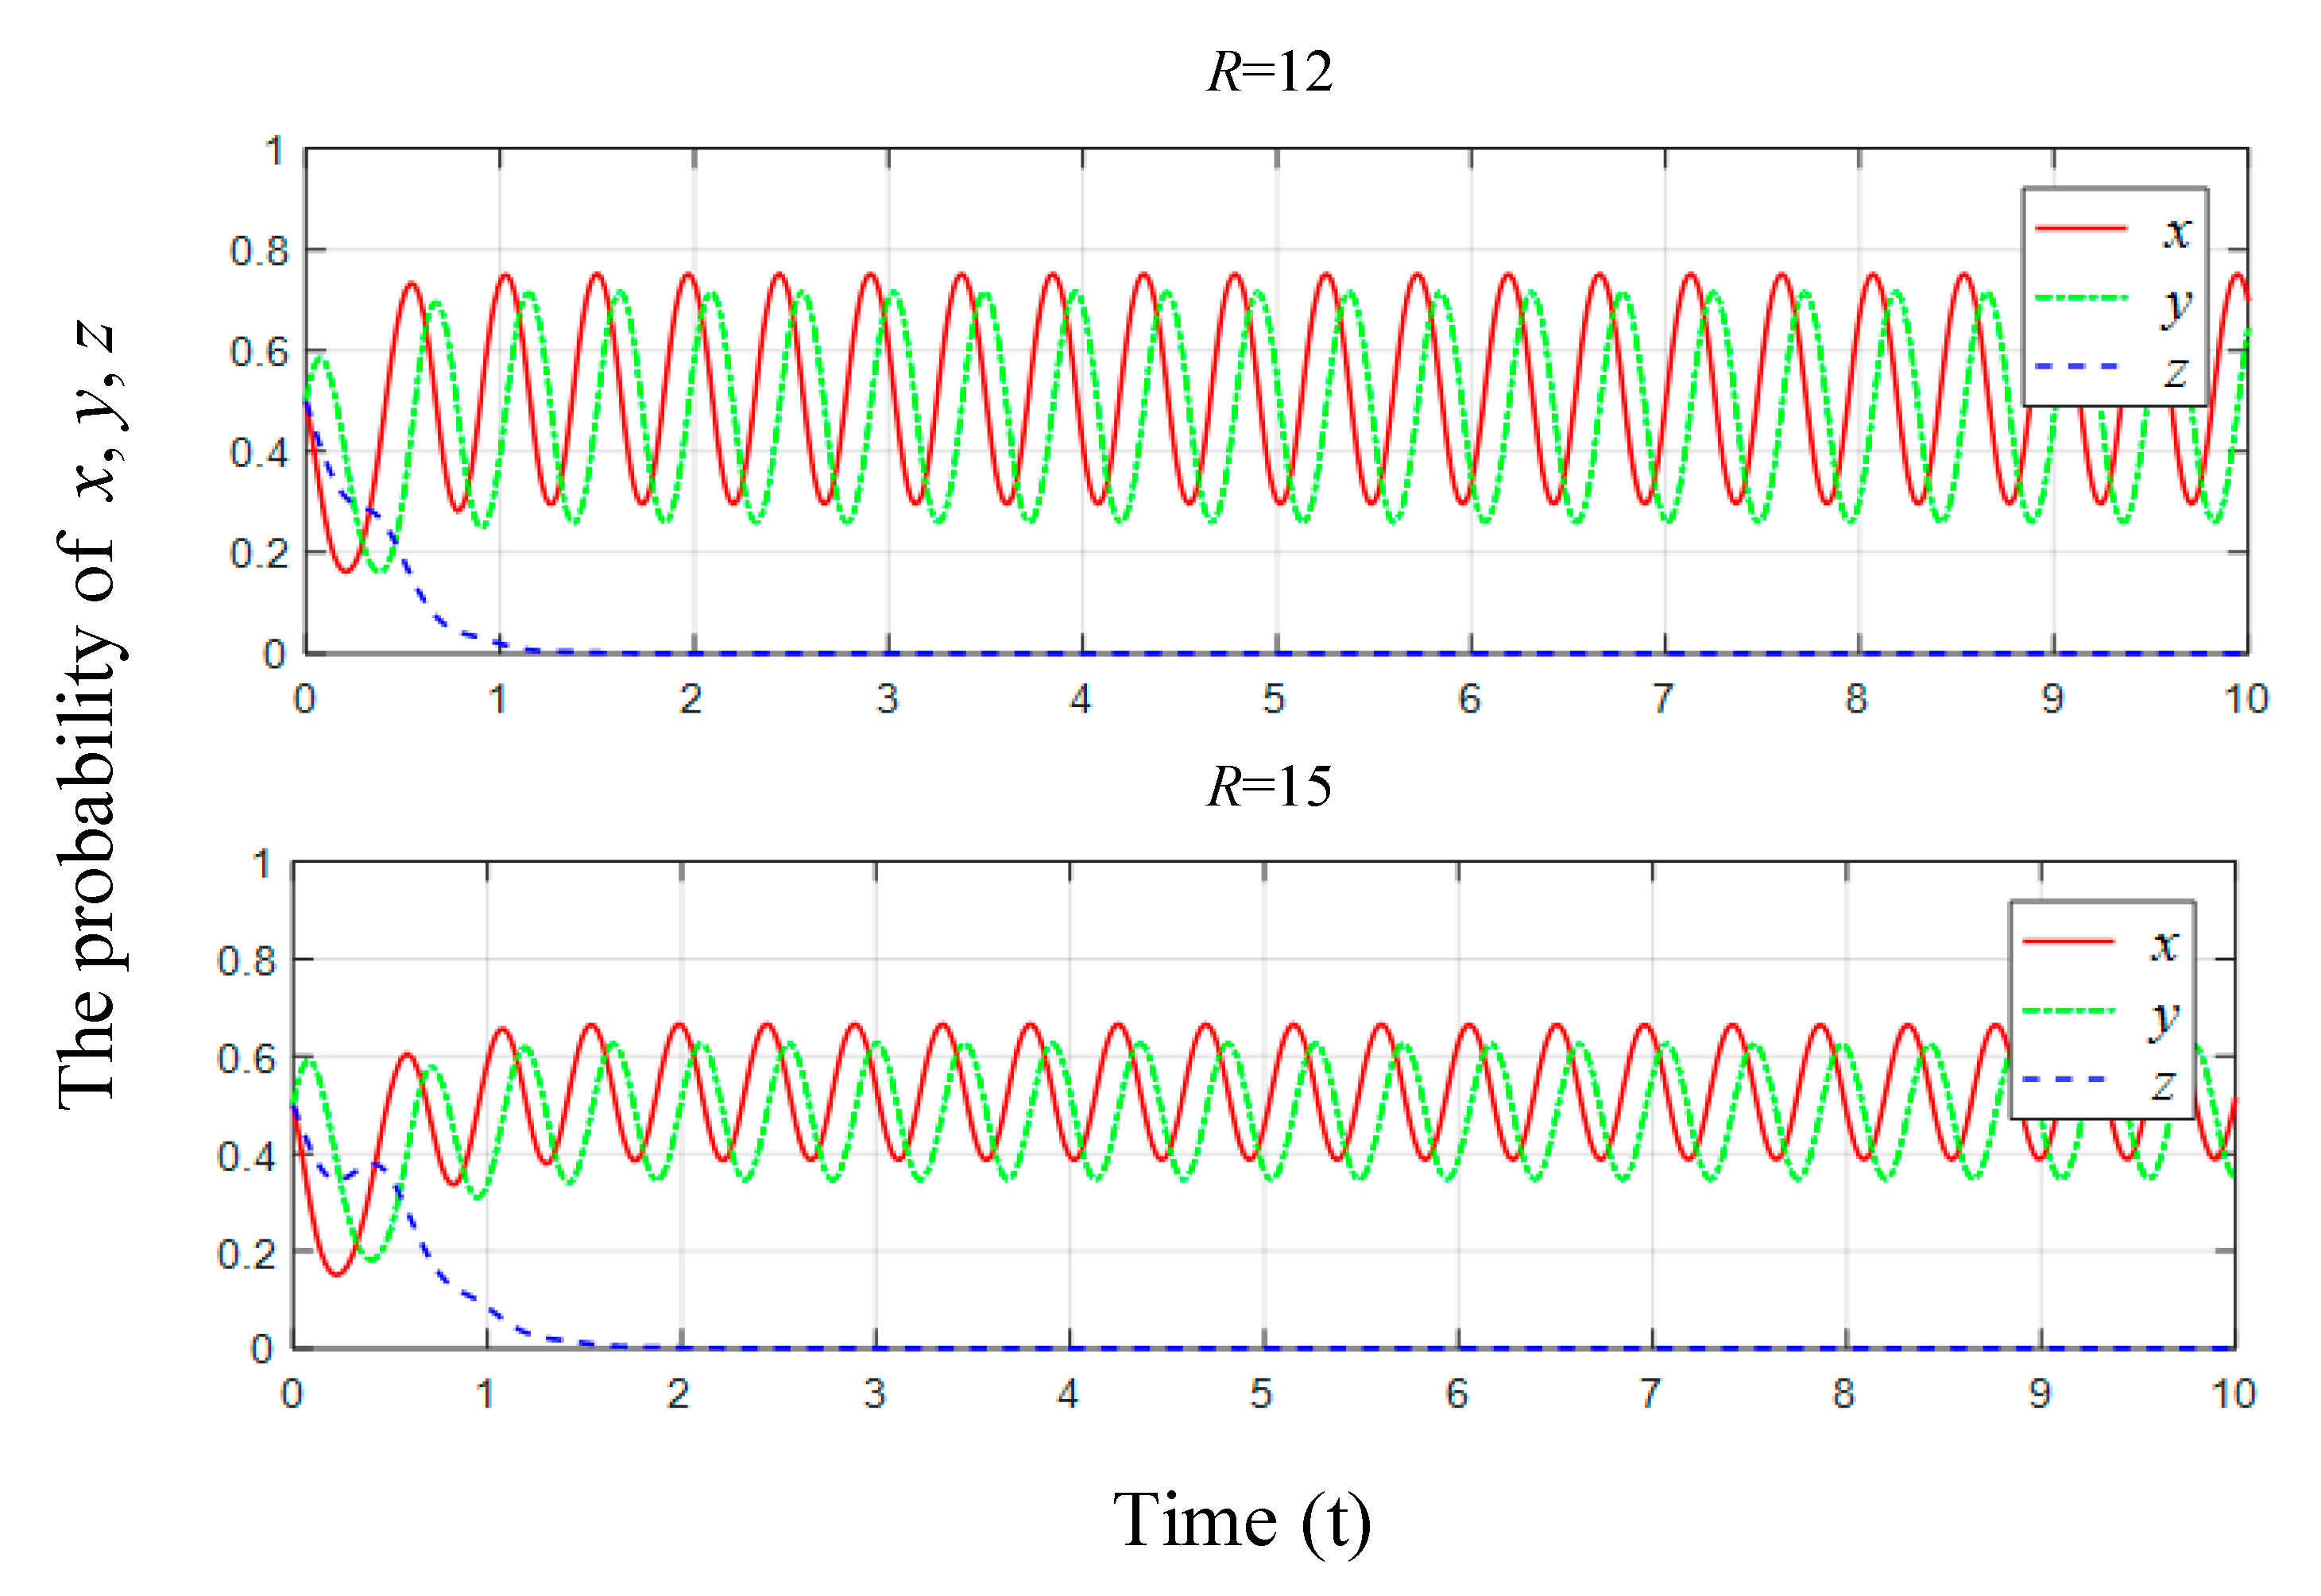
5.2. The Influence of on Multi-Stakeholders’ Evolutionary Behavior
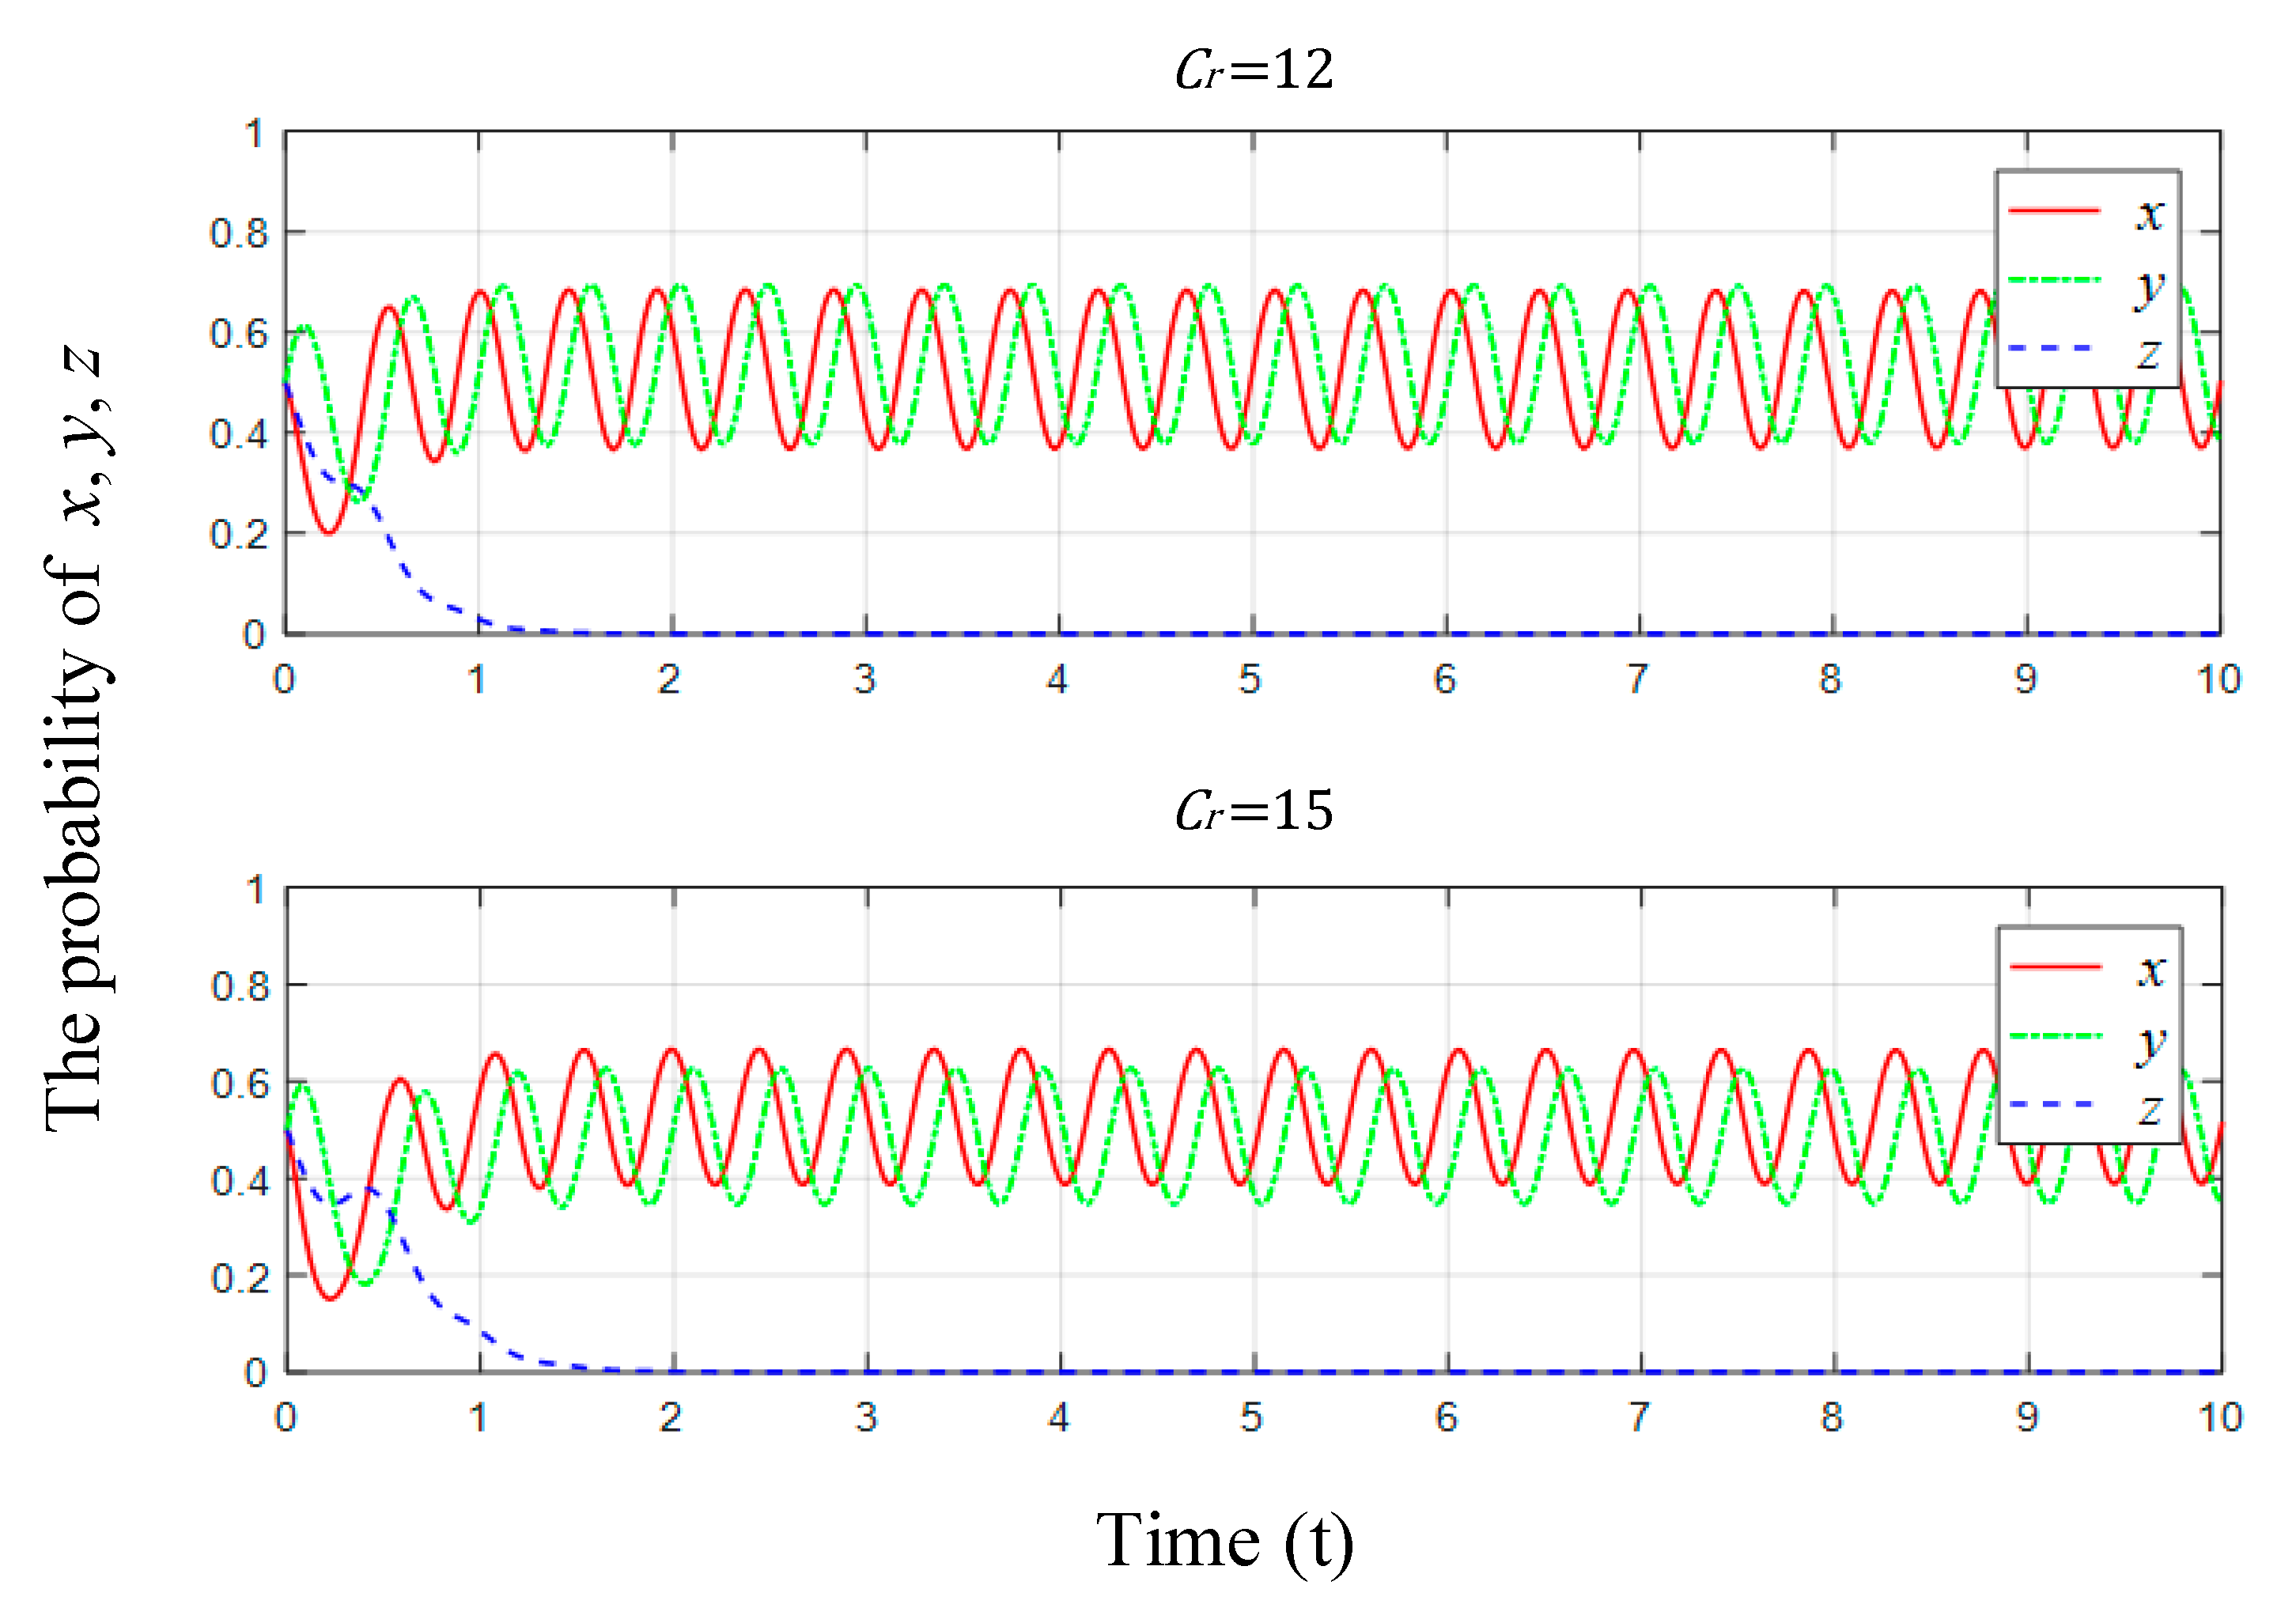
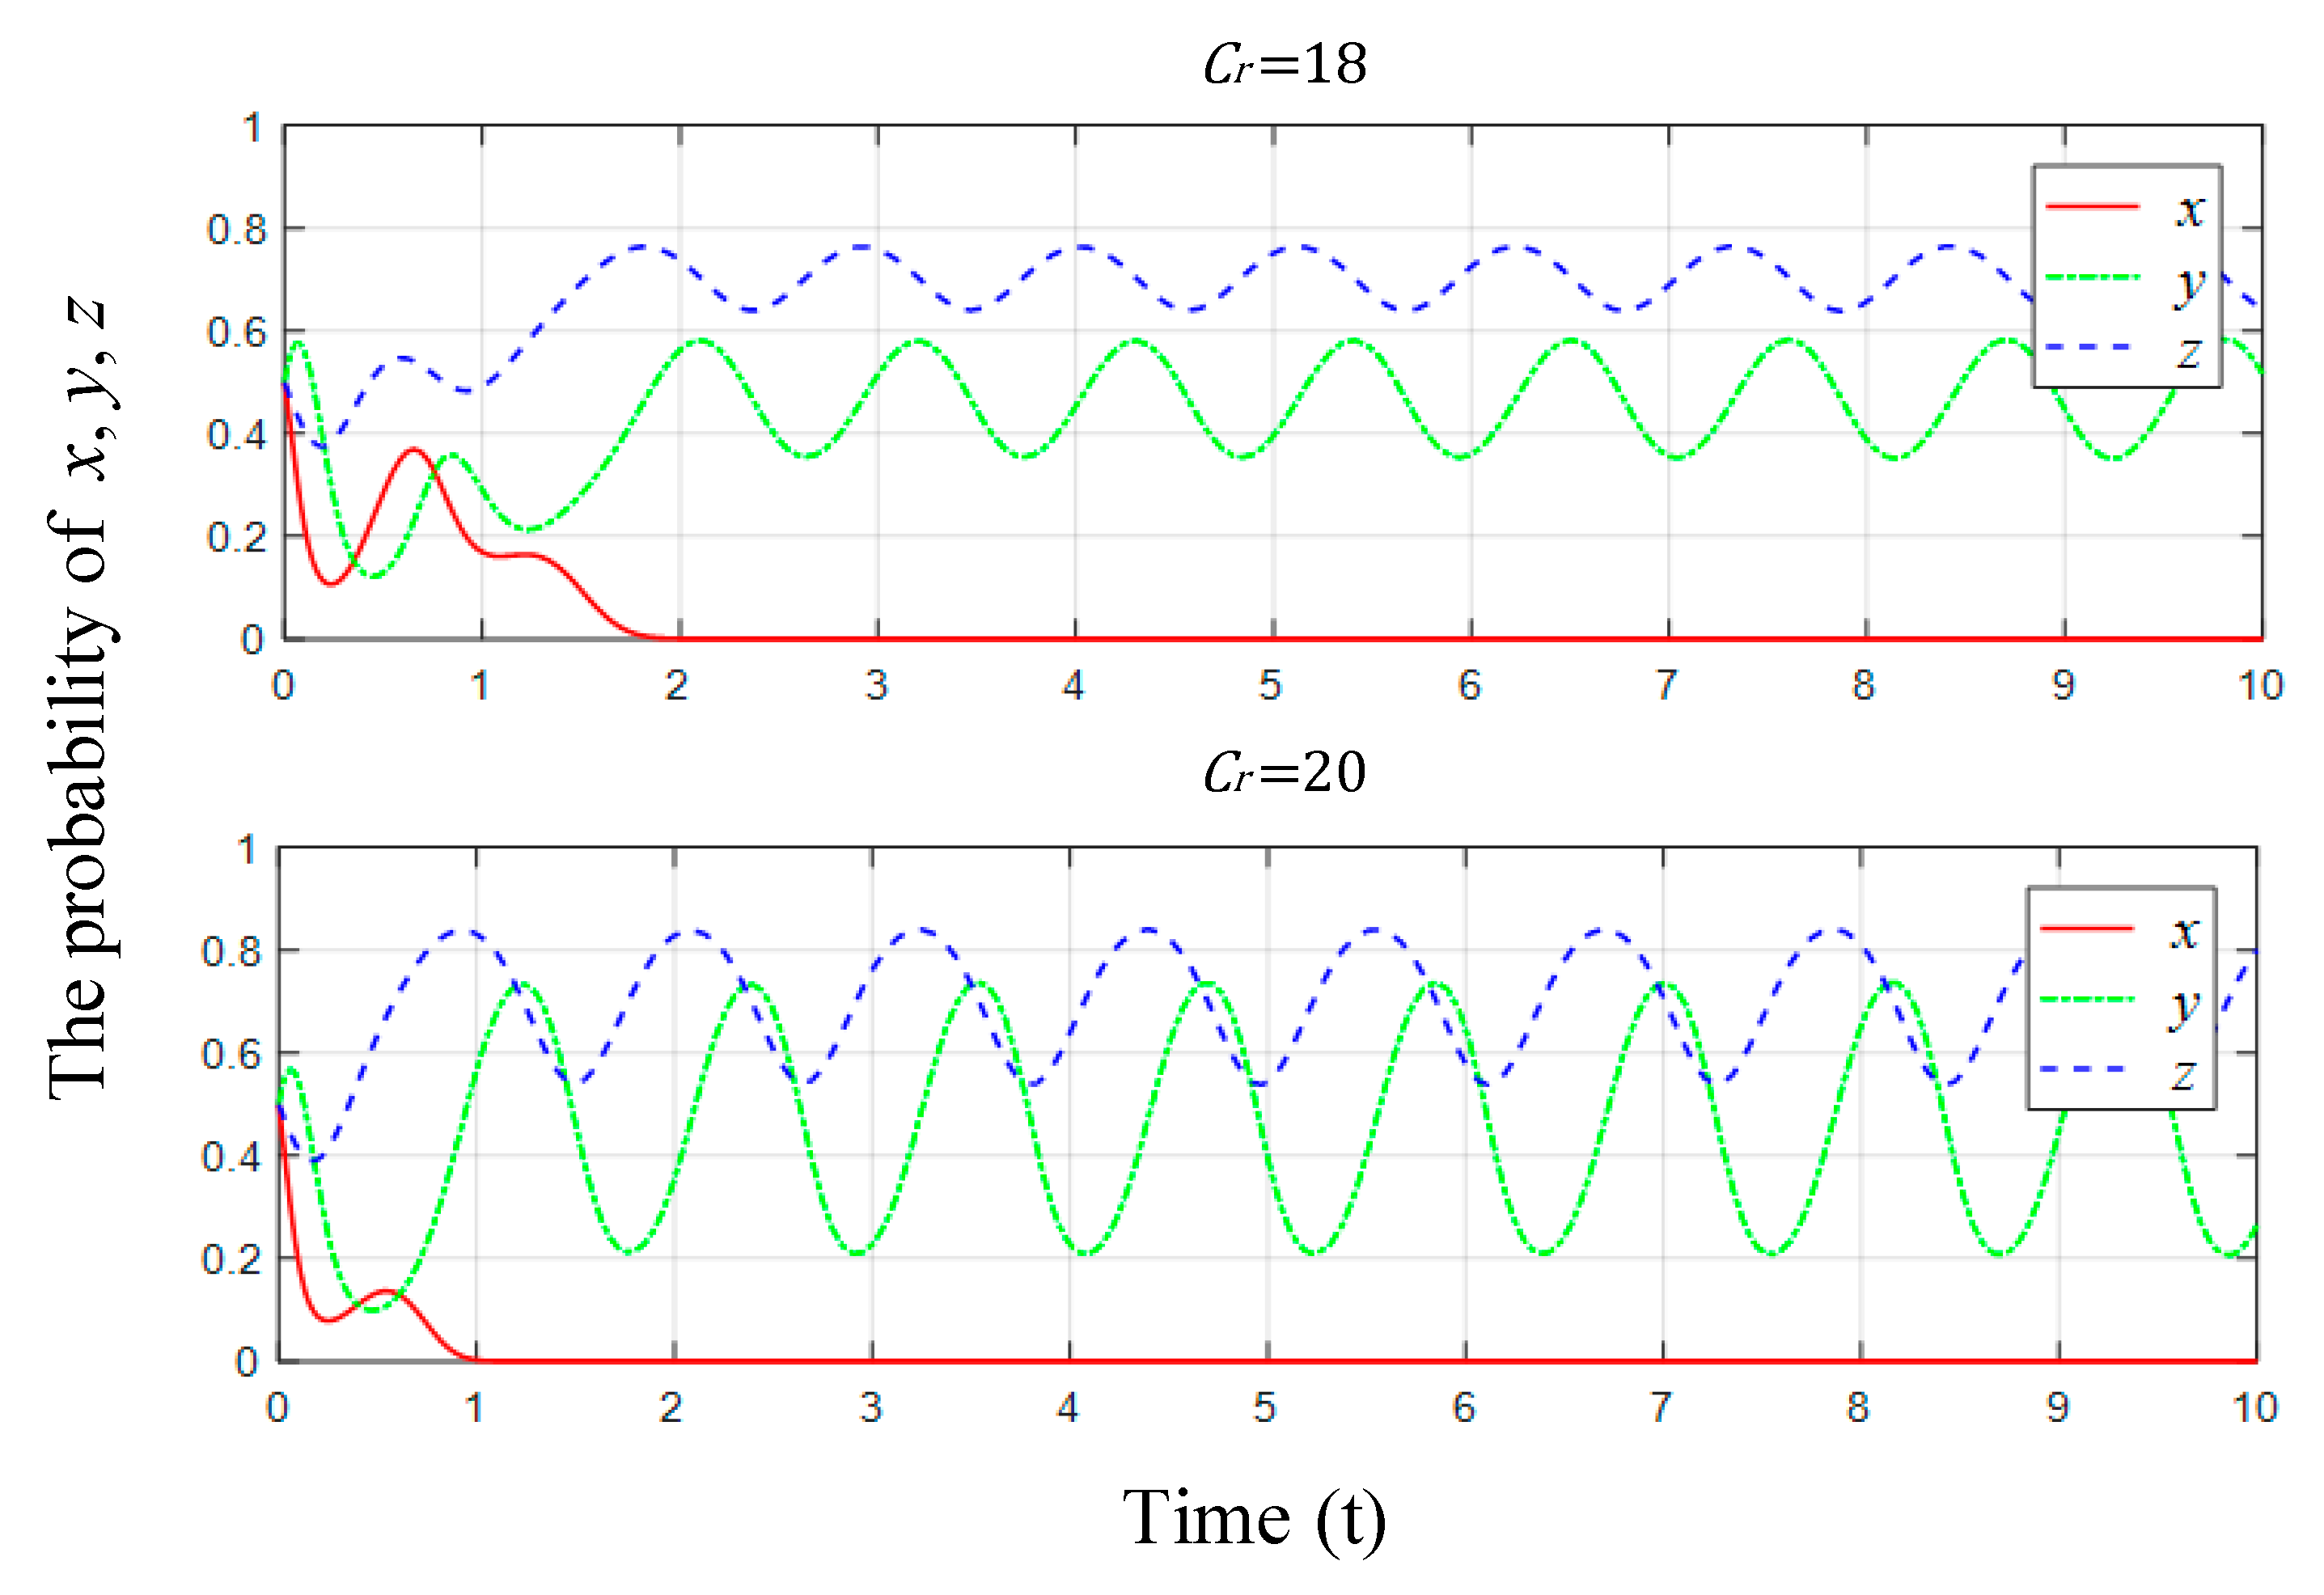
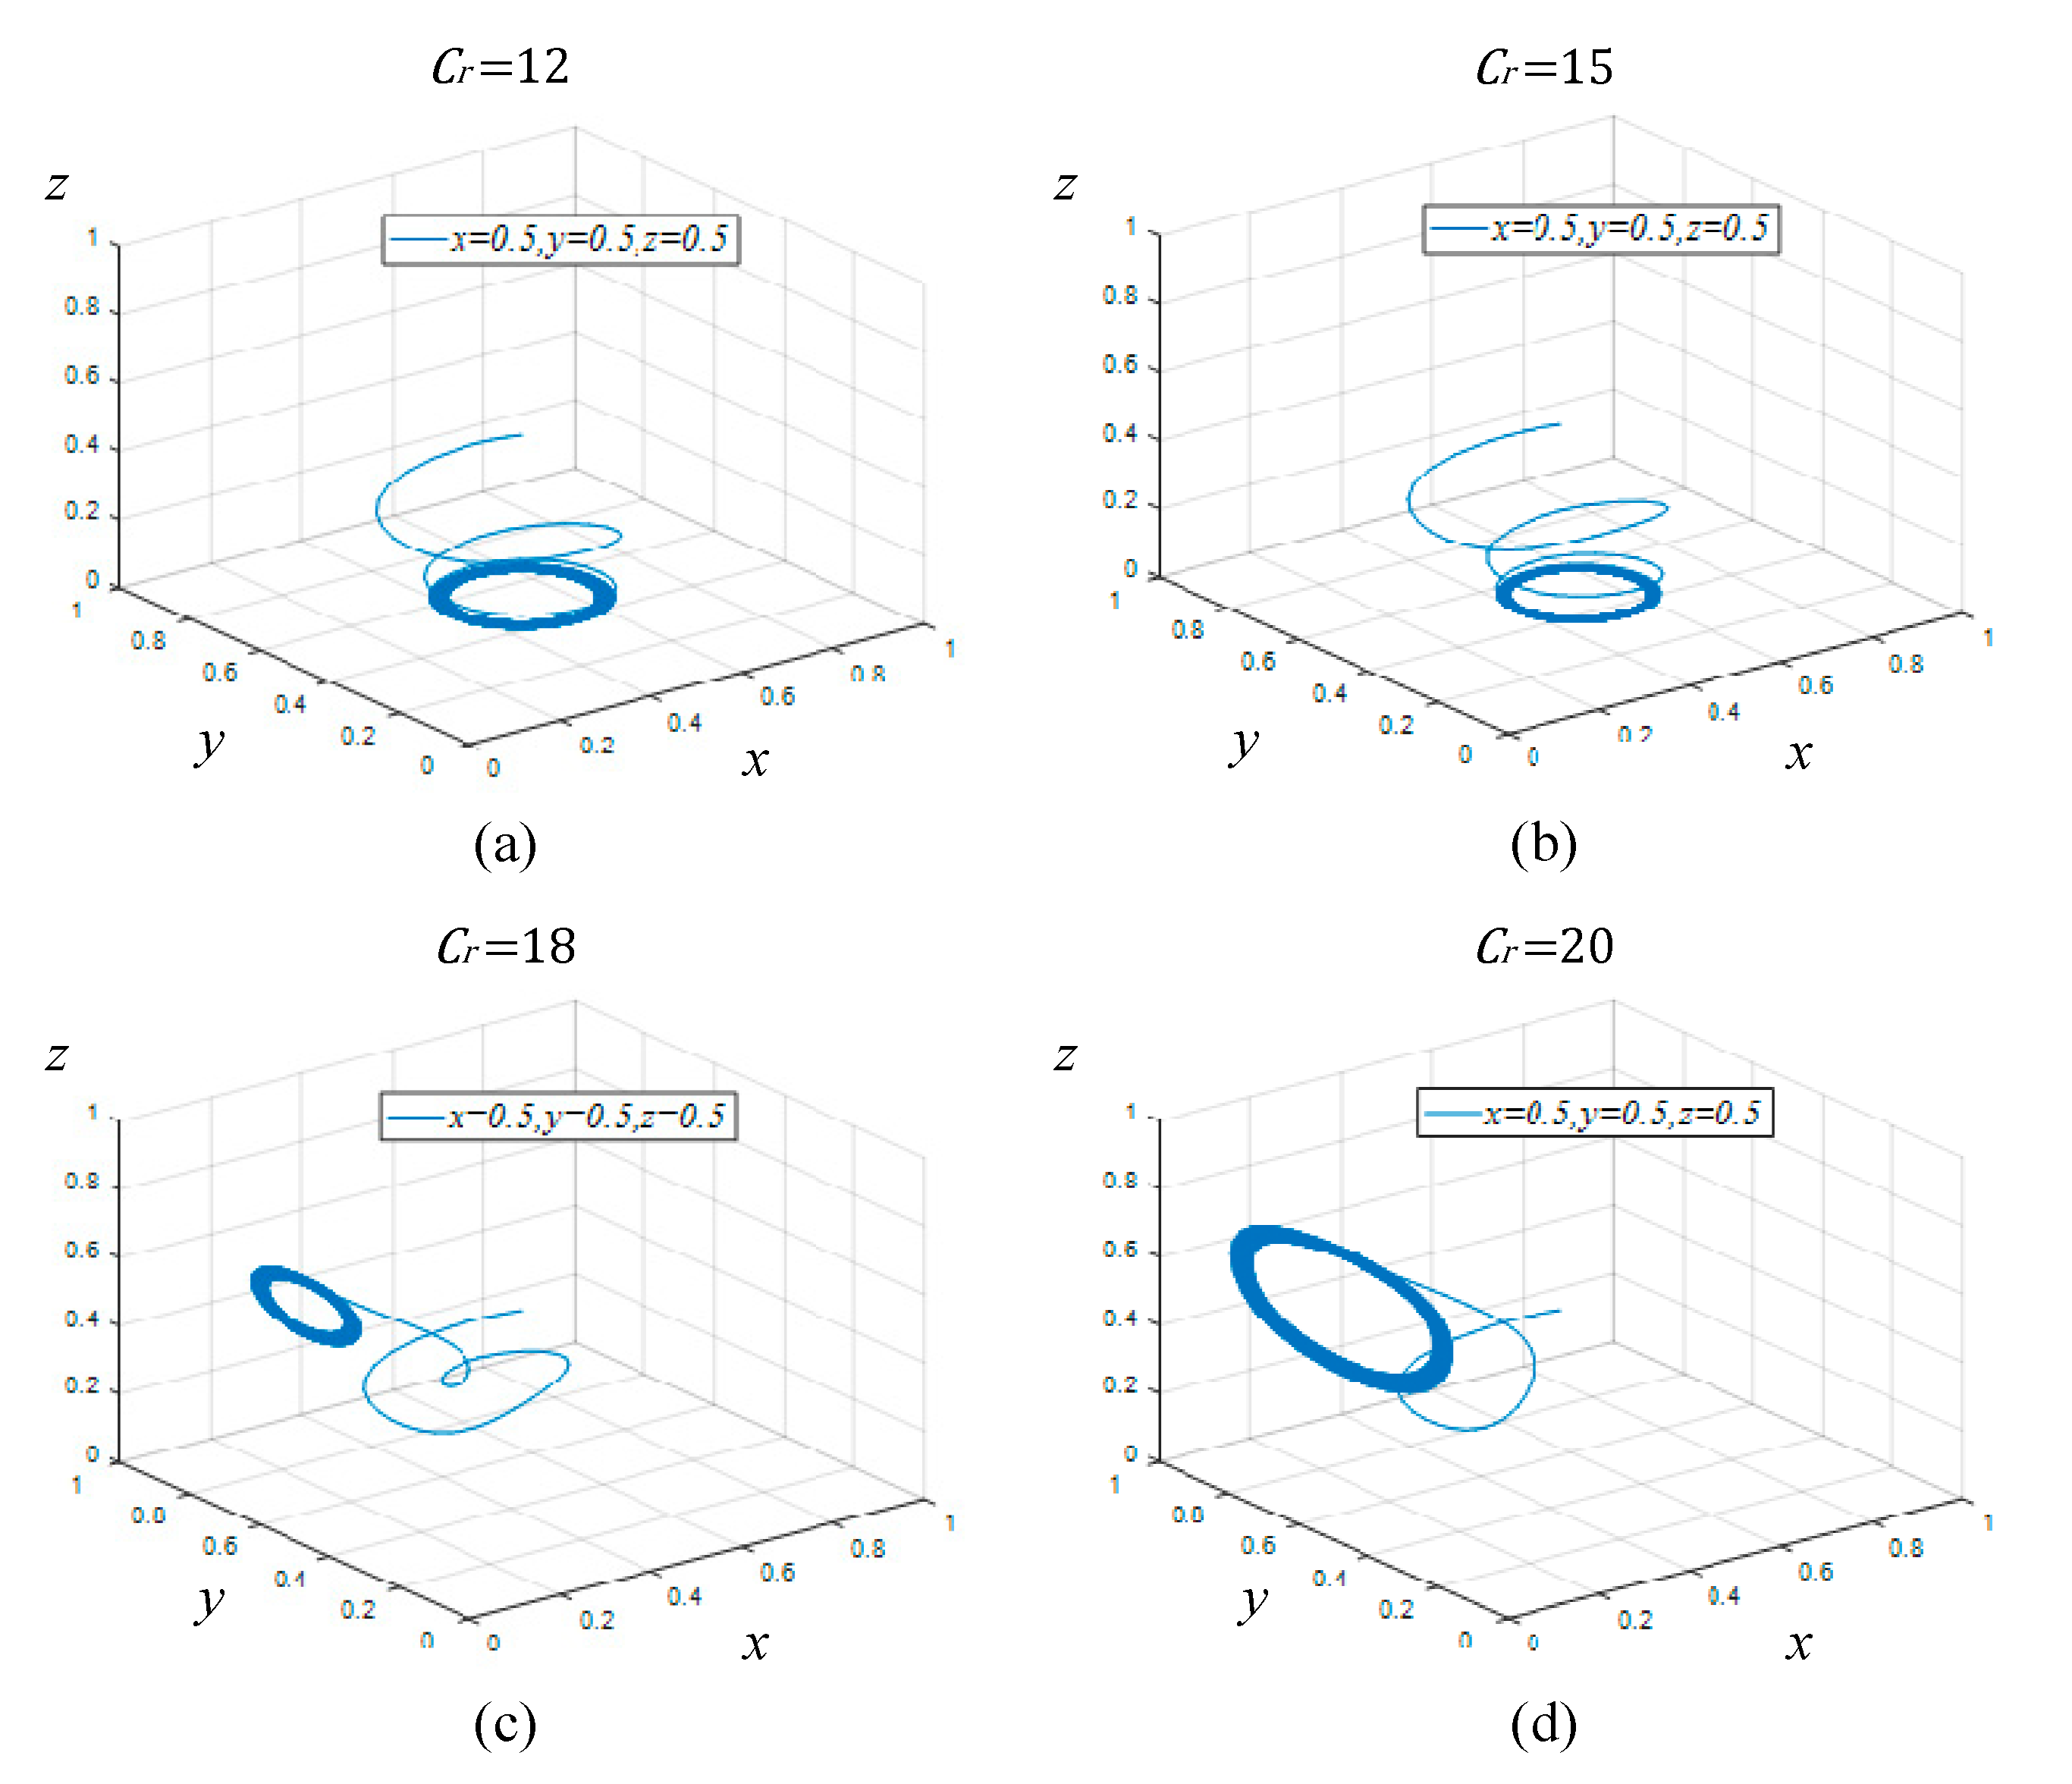
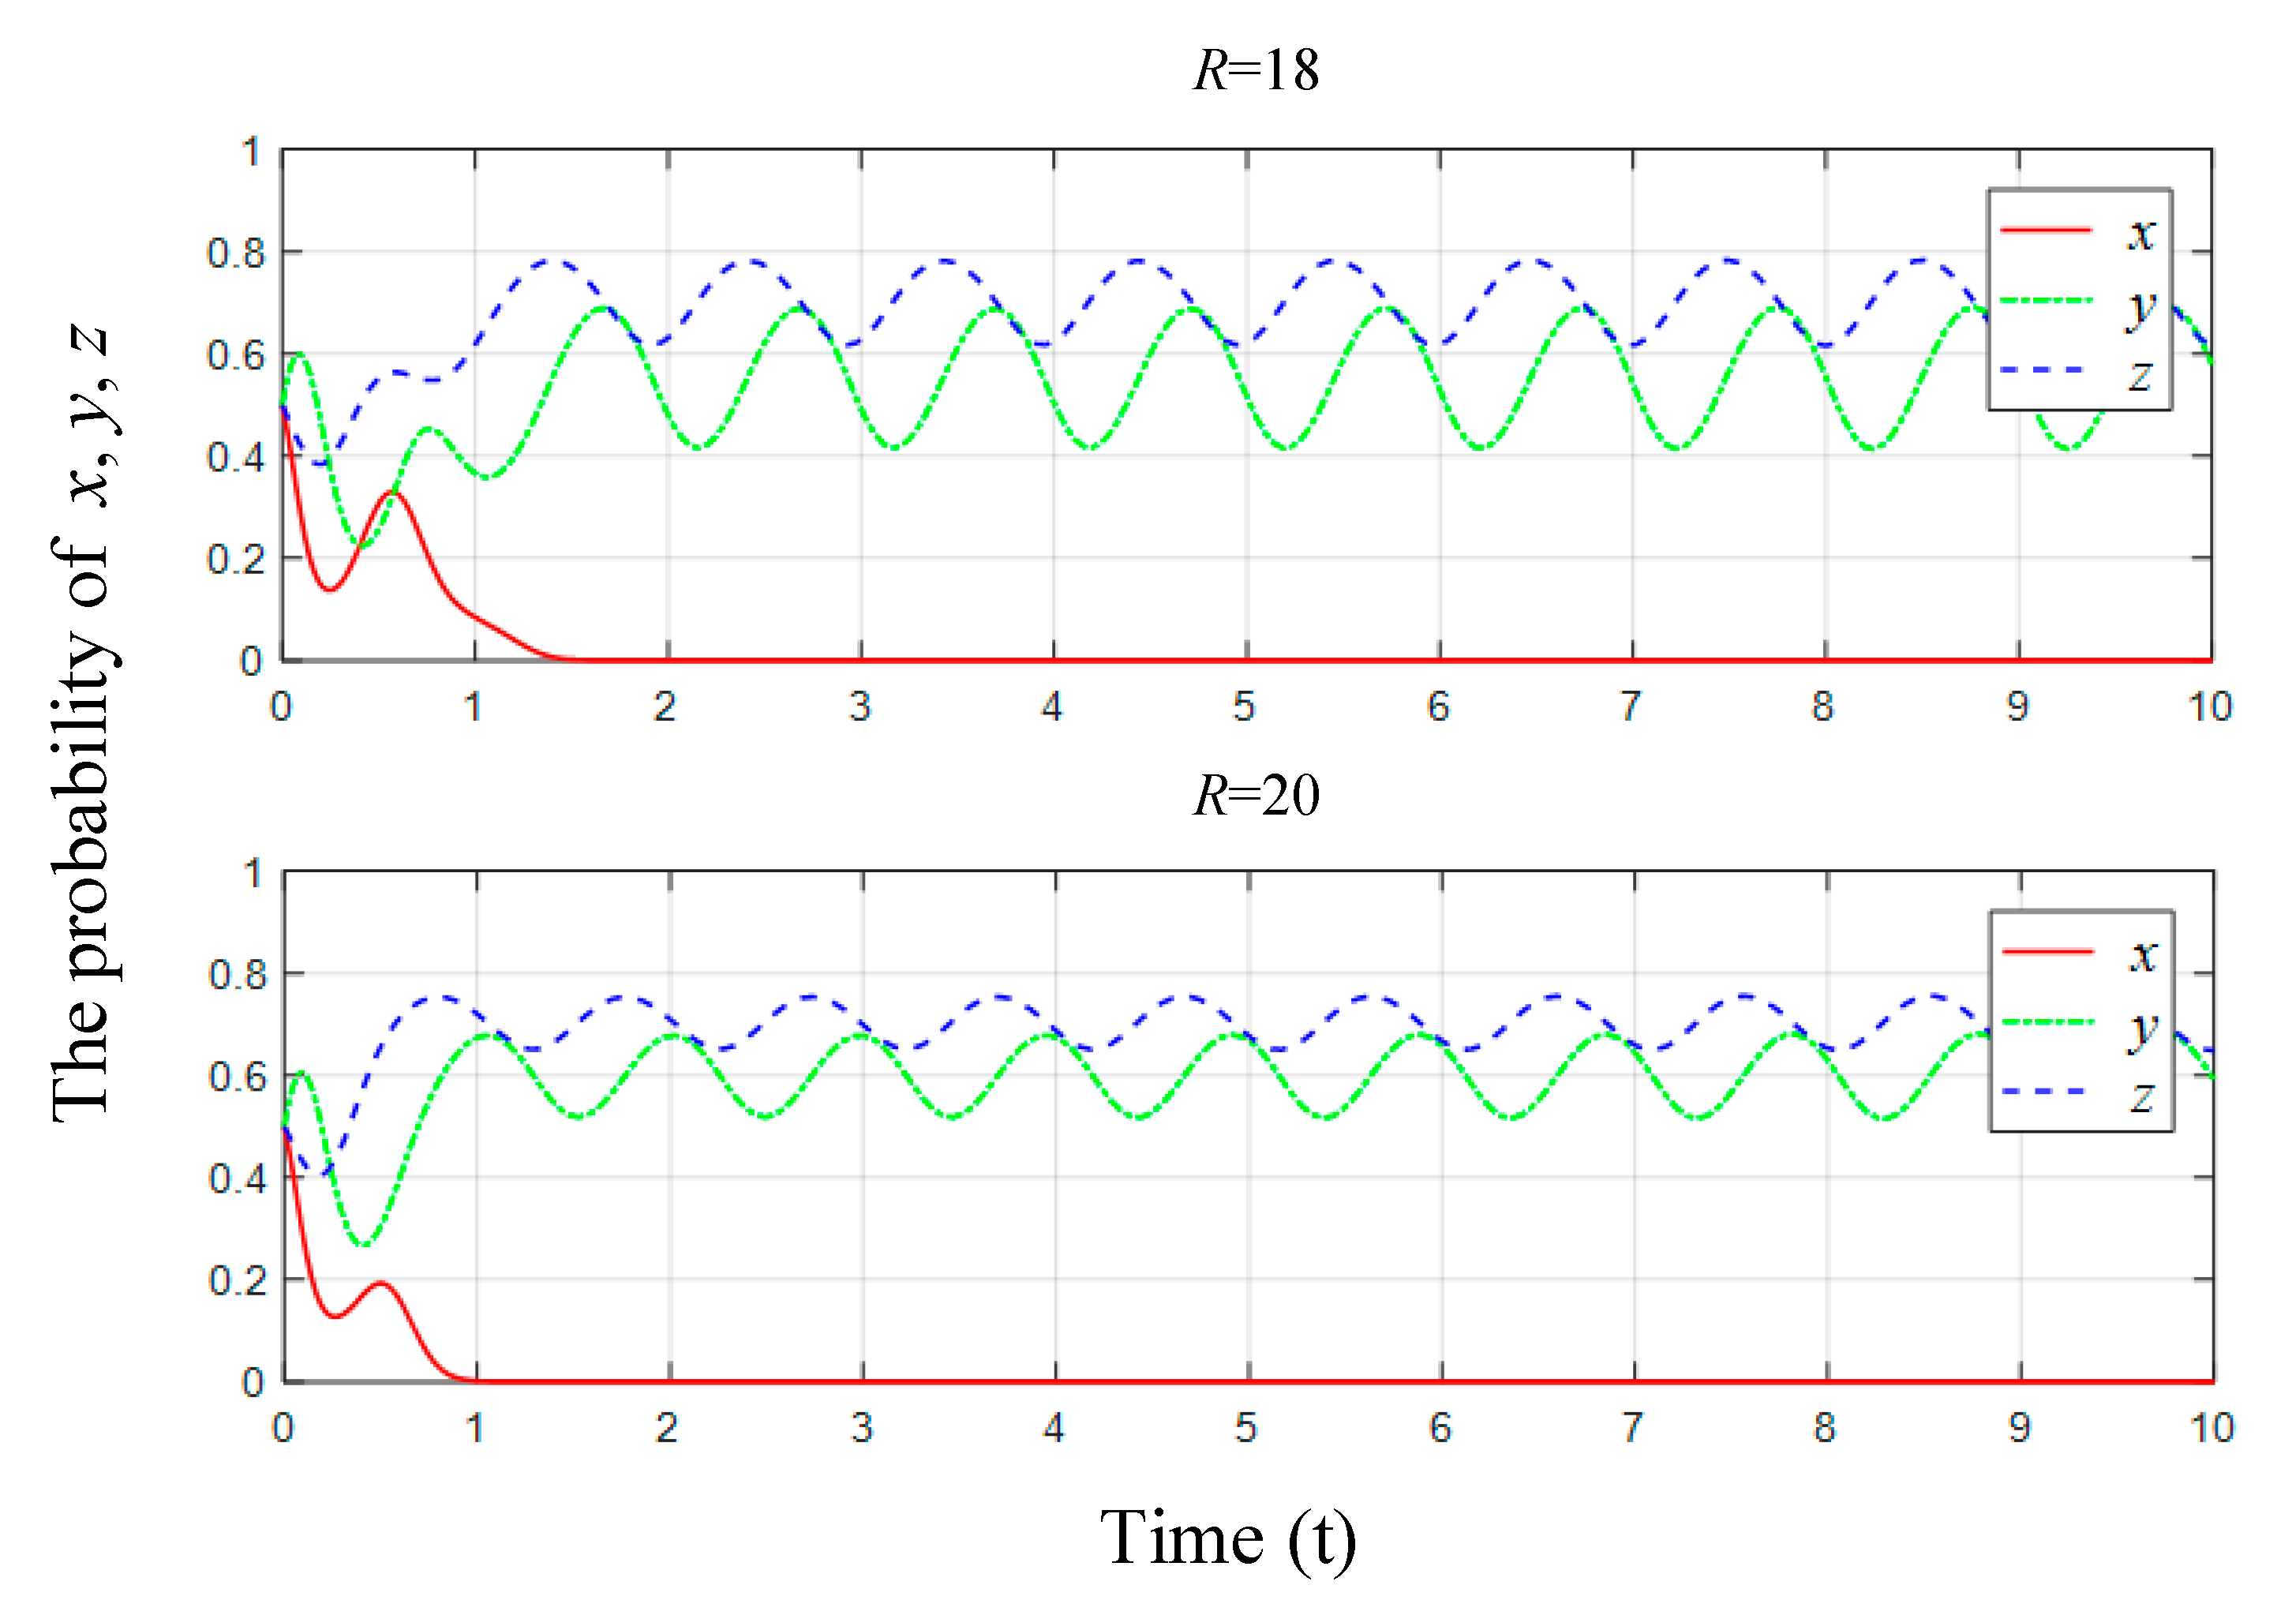
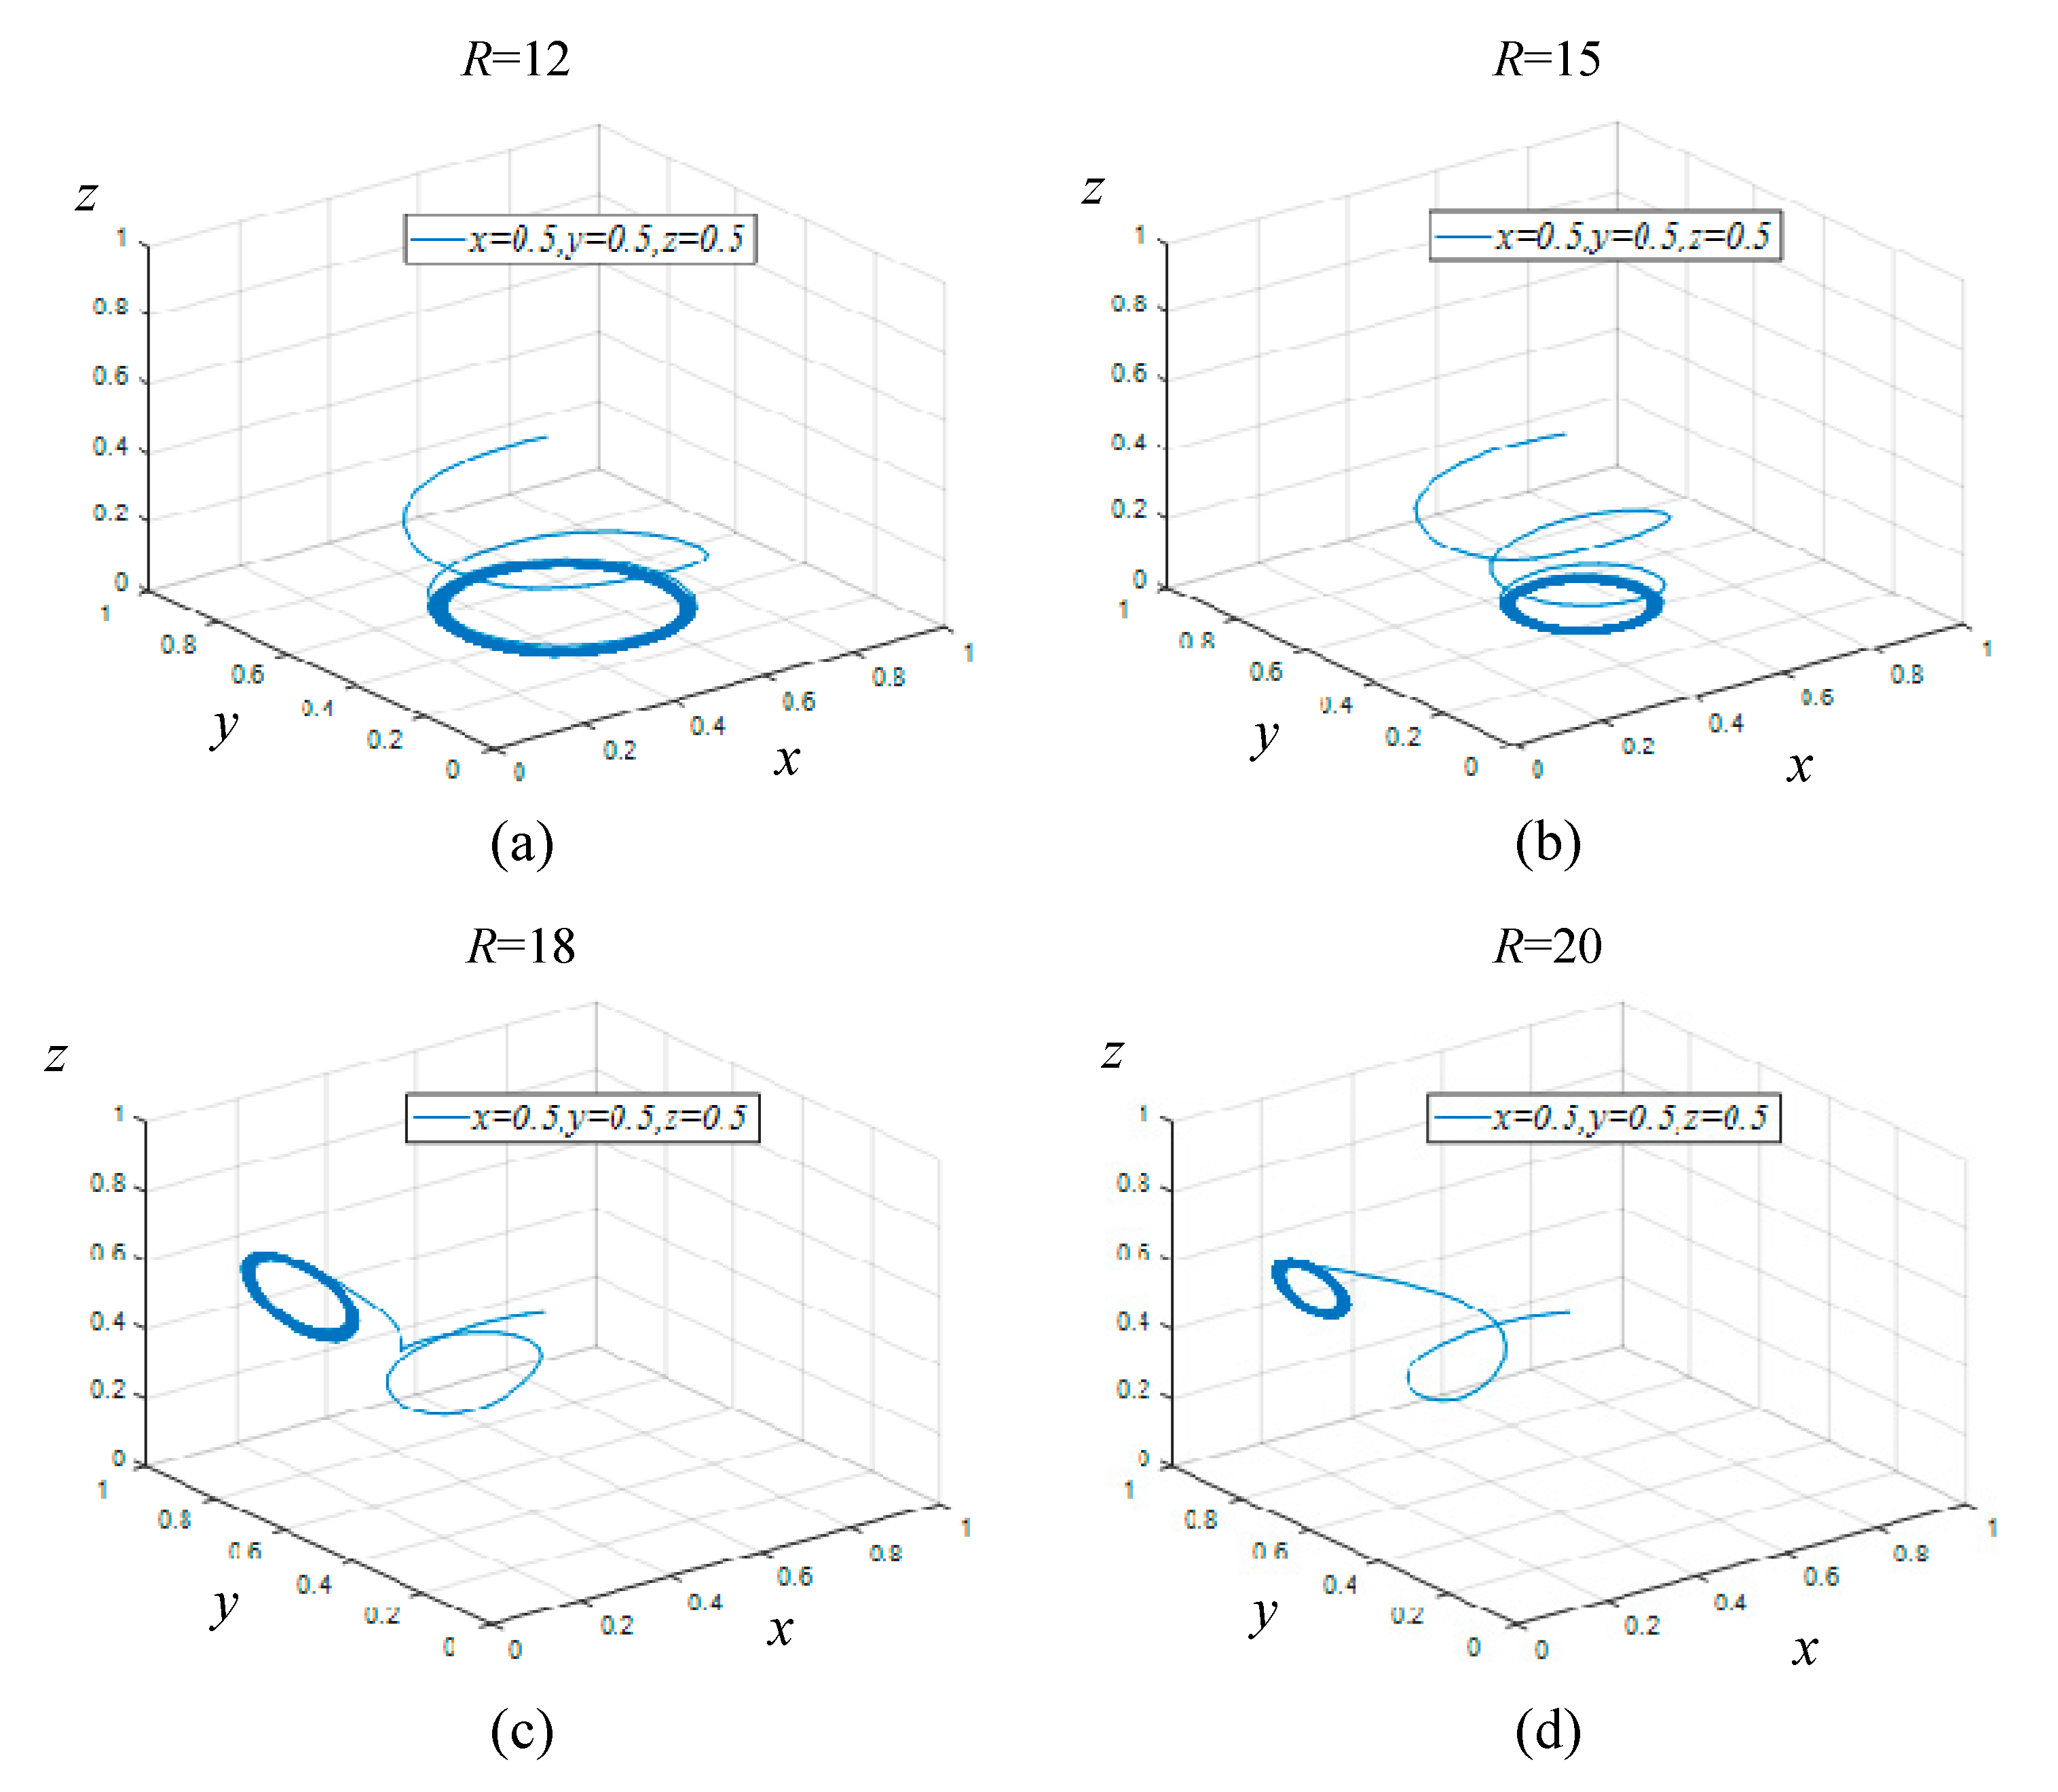
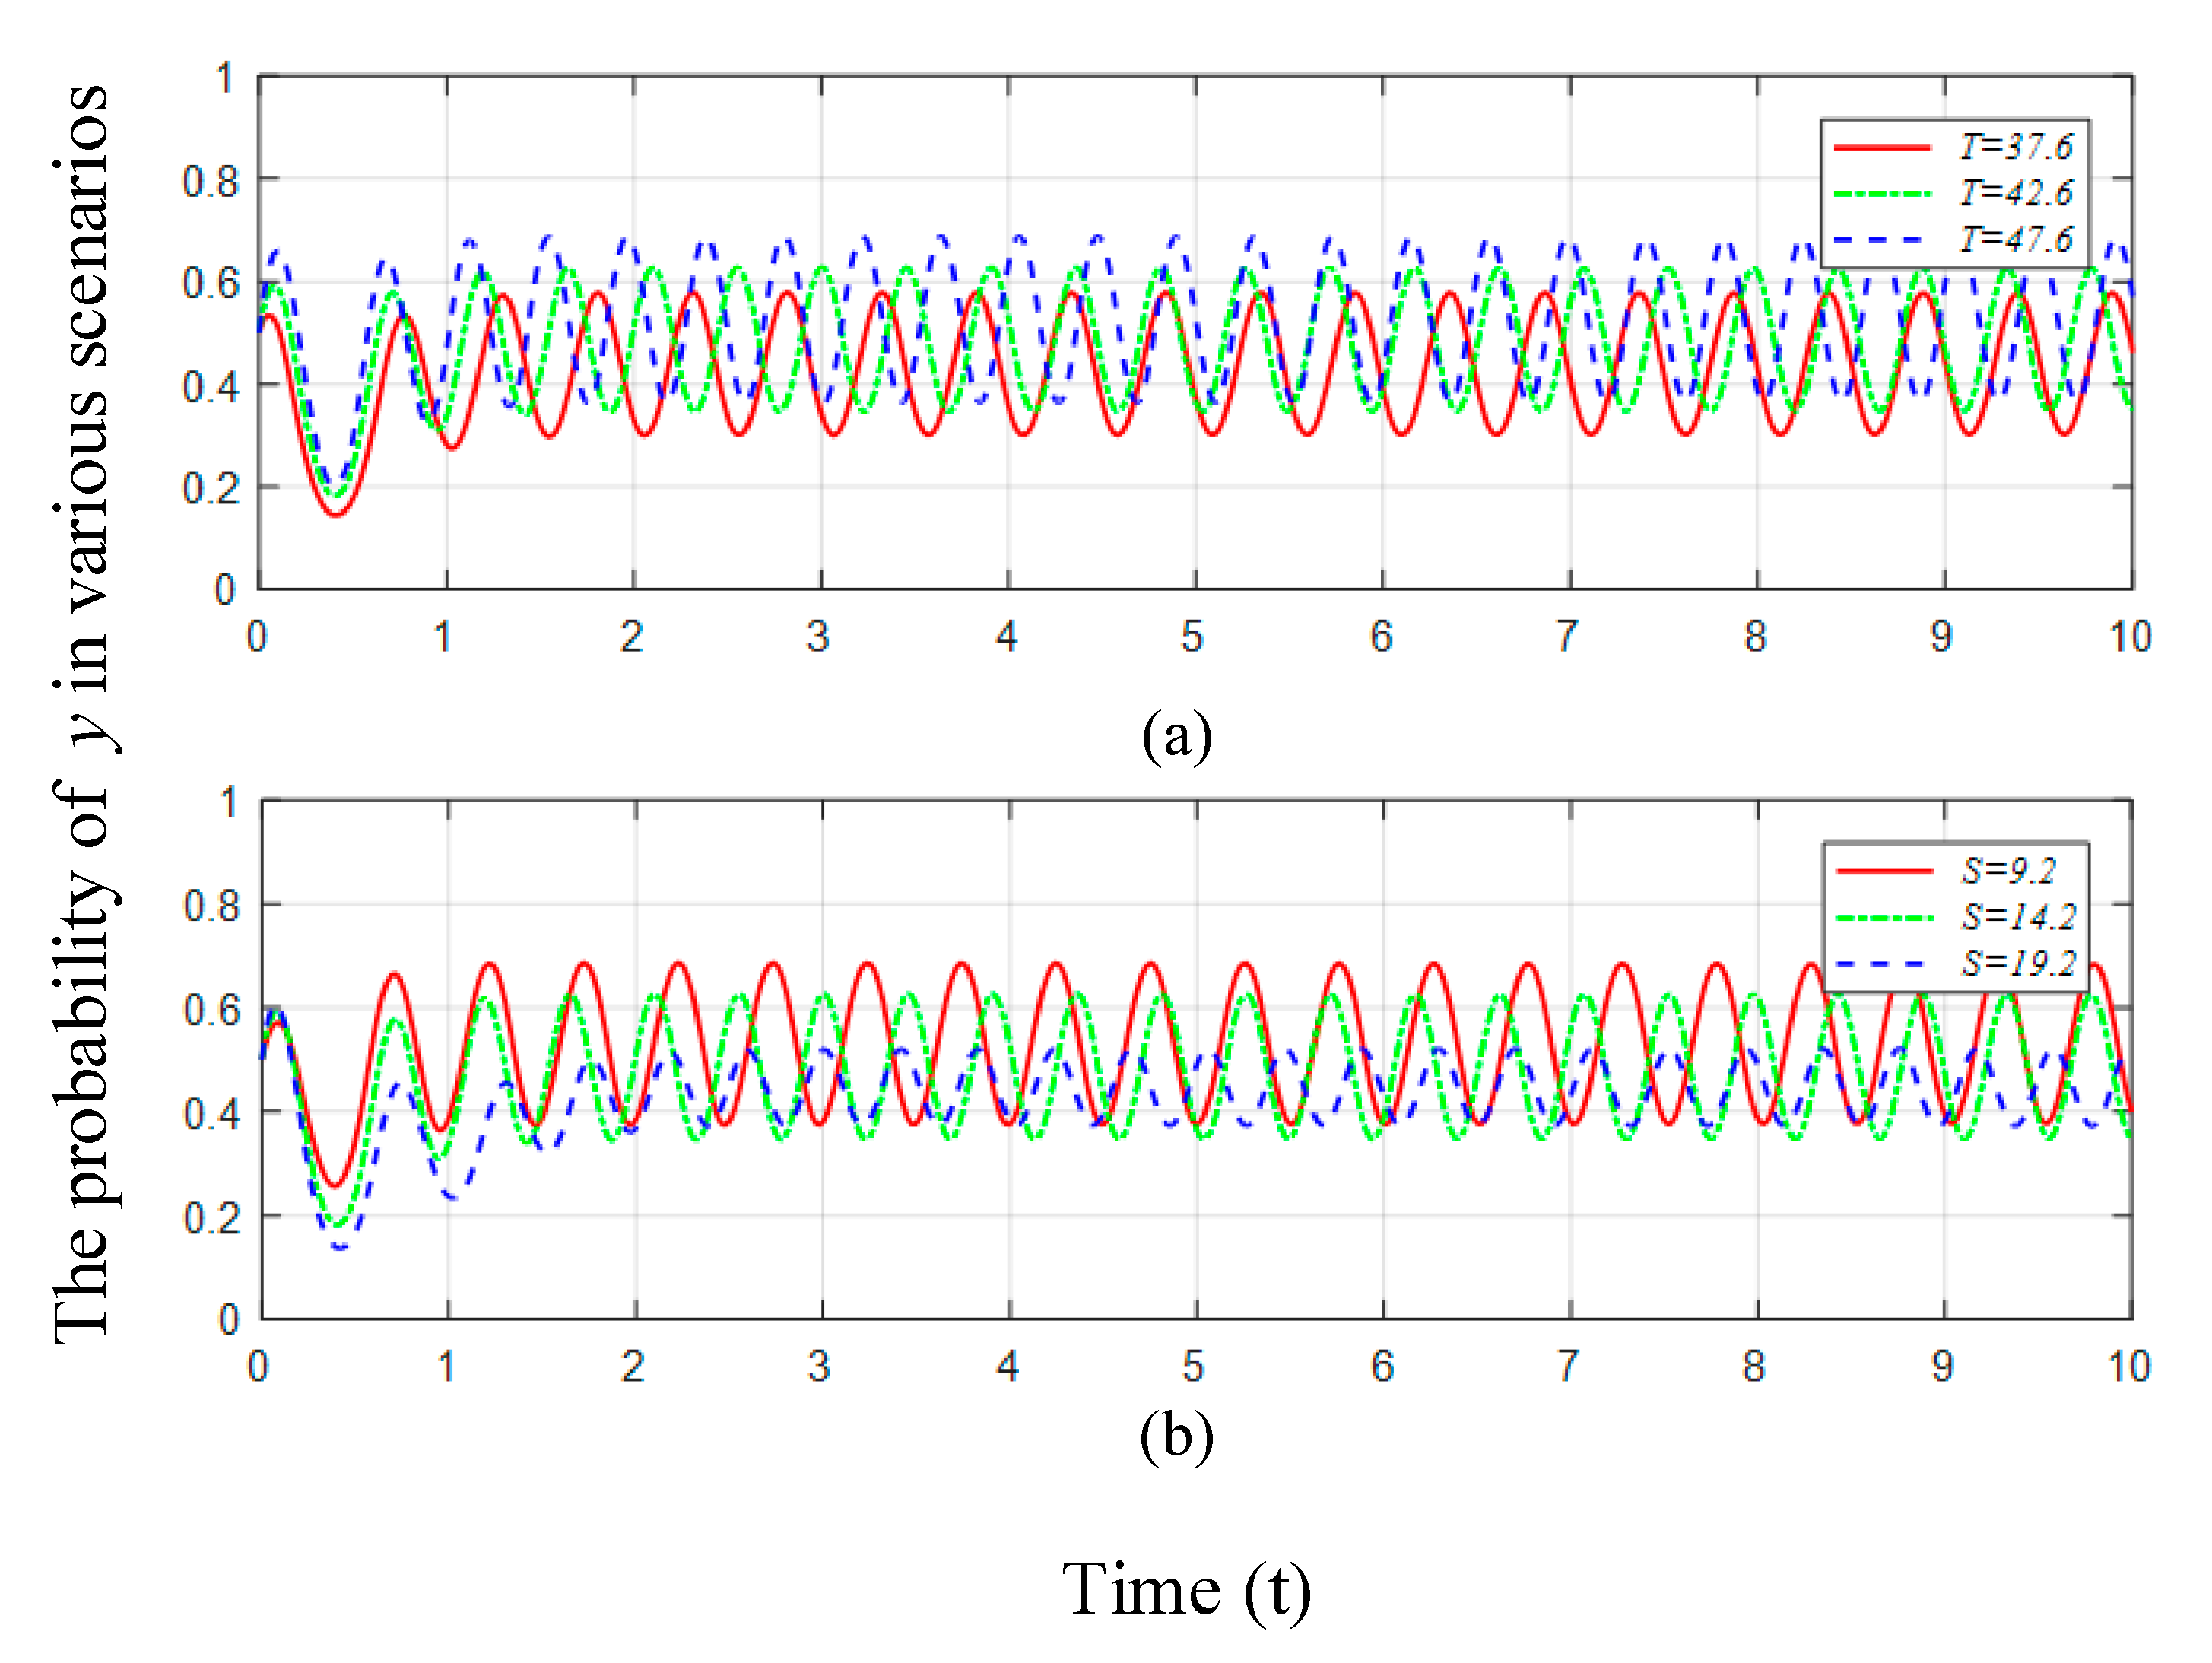
5.3. The Influence of on Multi-Stakeholders’ Evolutionary Behavior
5.4. The Influence of and on Manufacturers’ Evolutionary Behavior
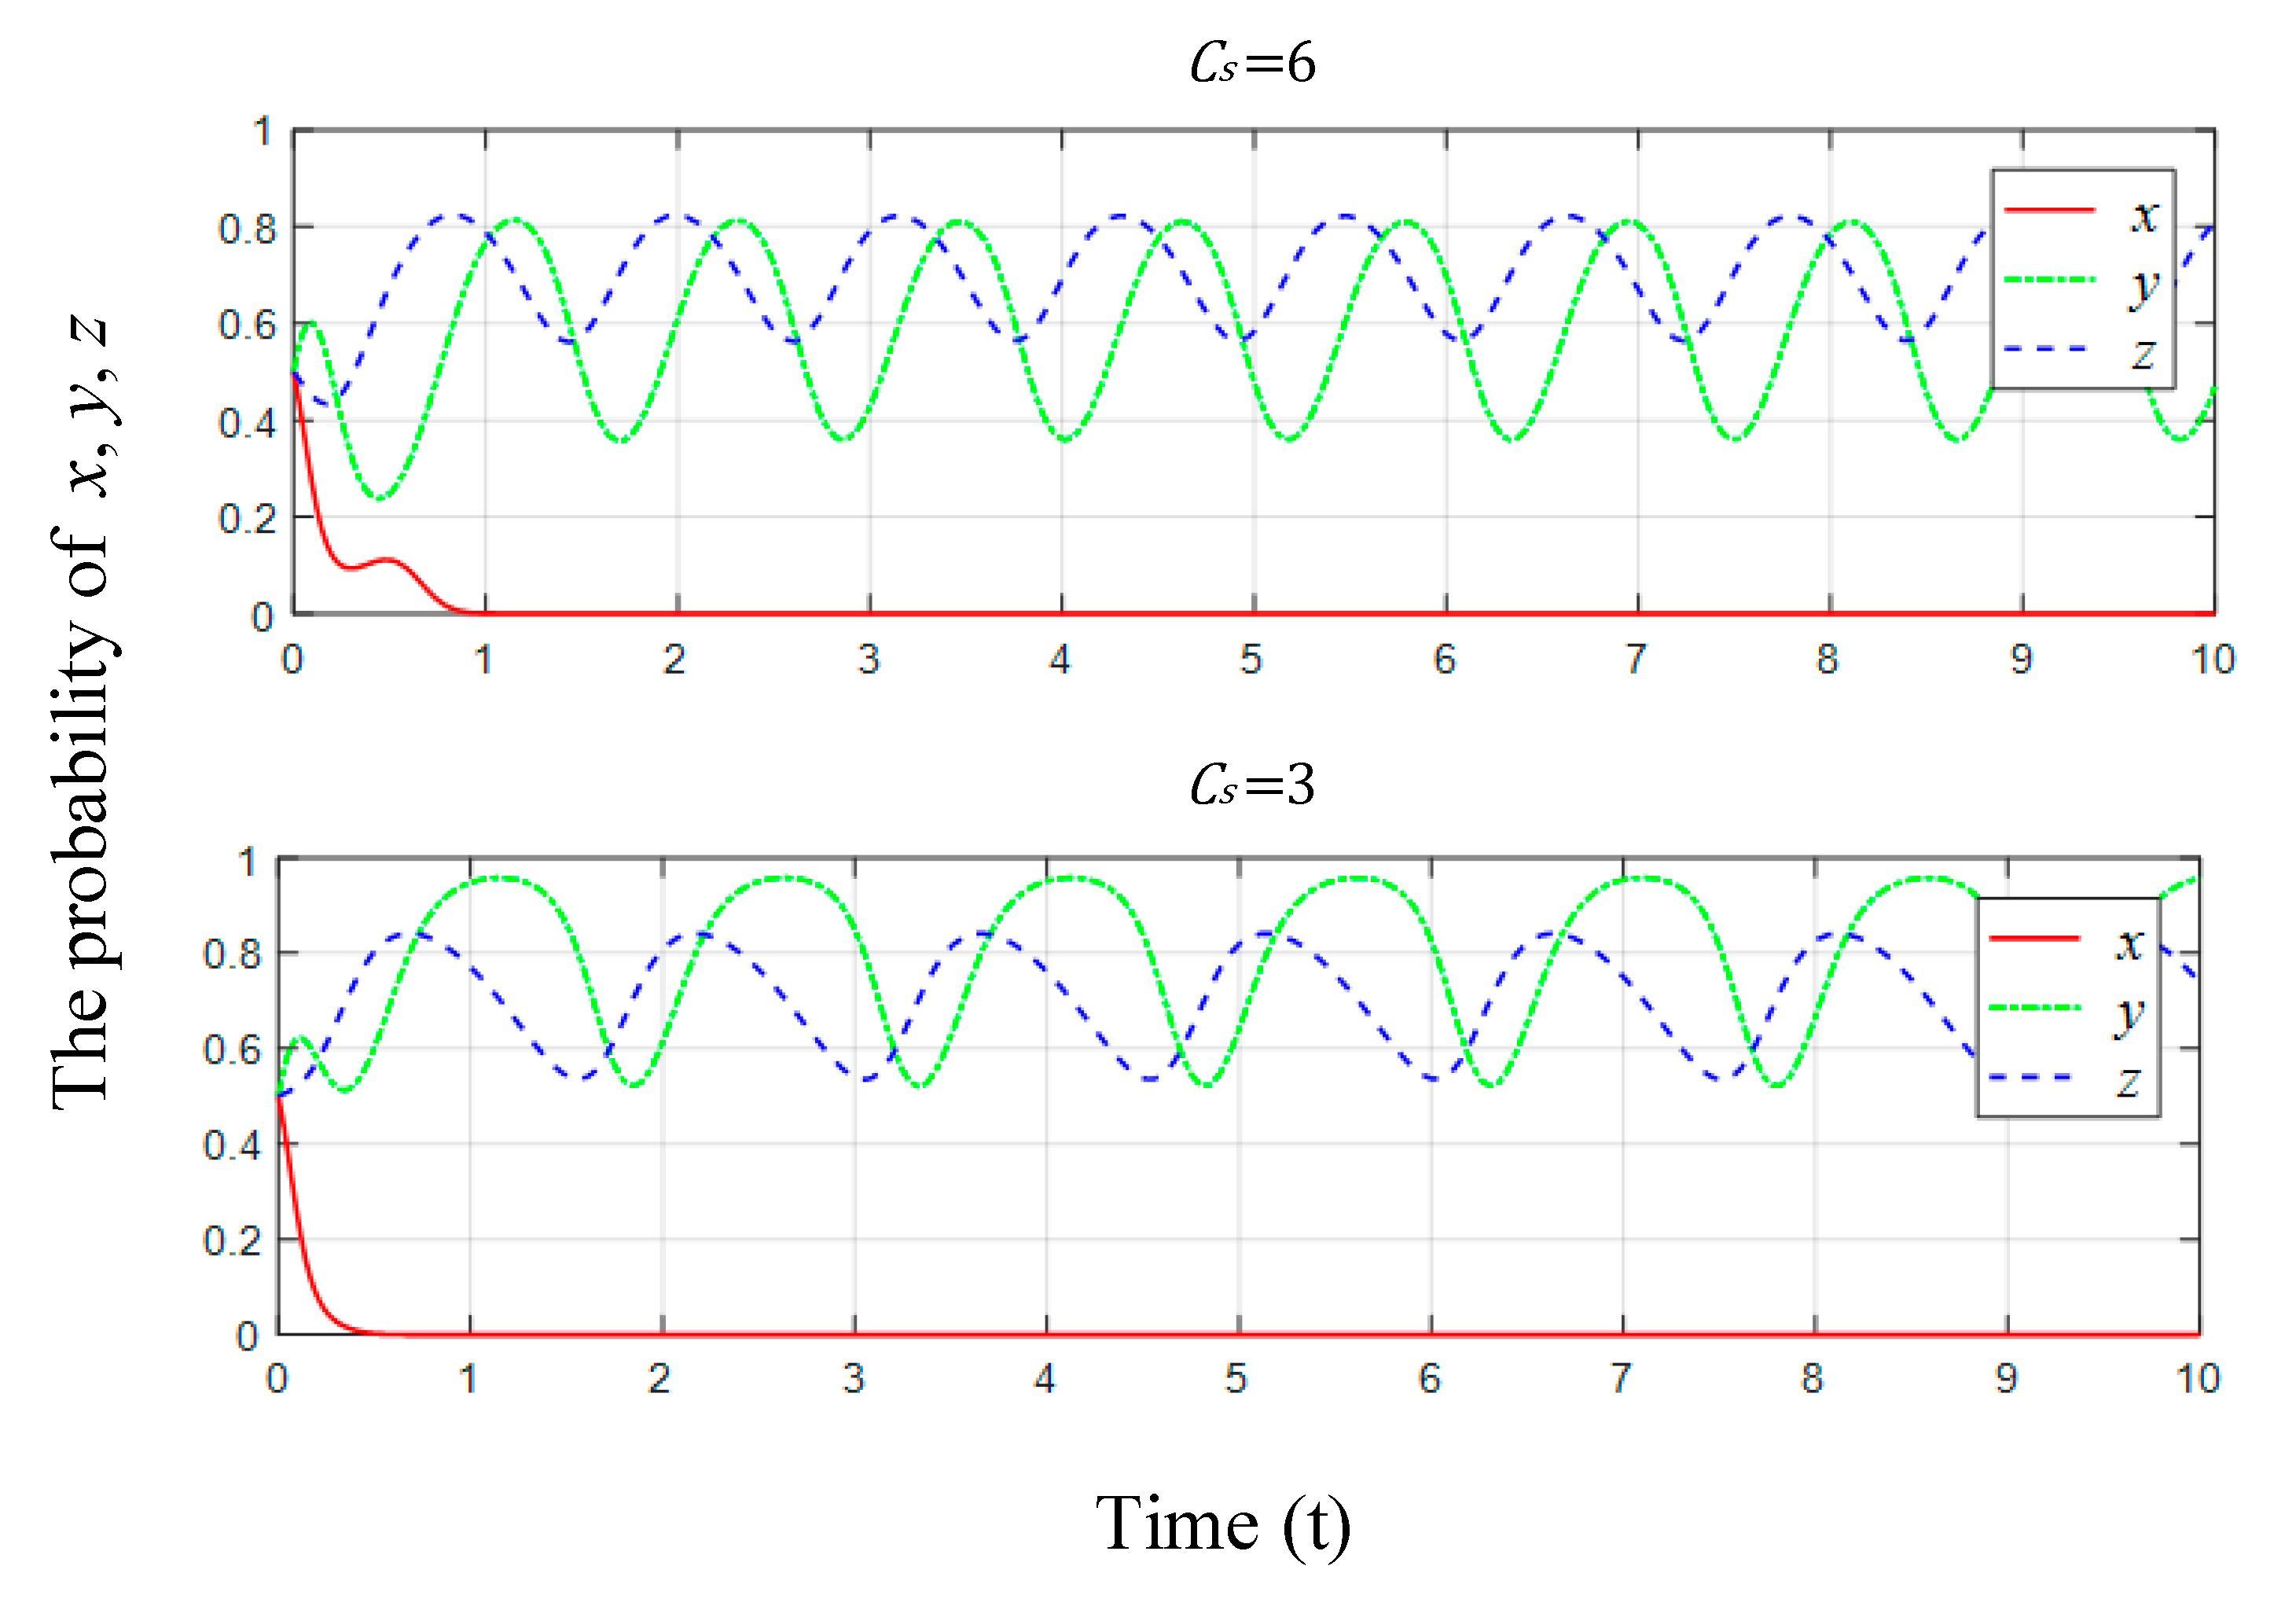
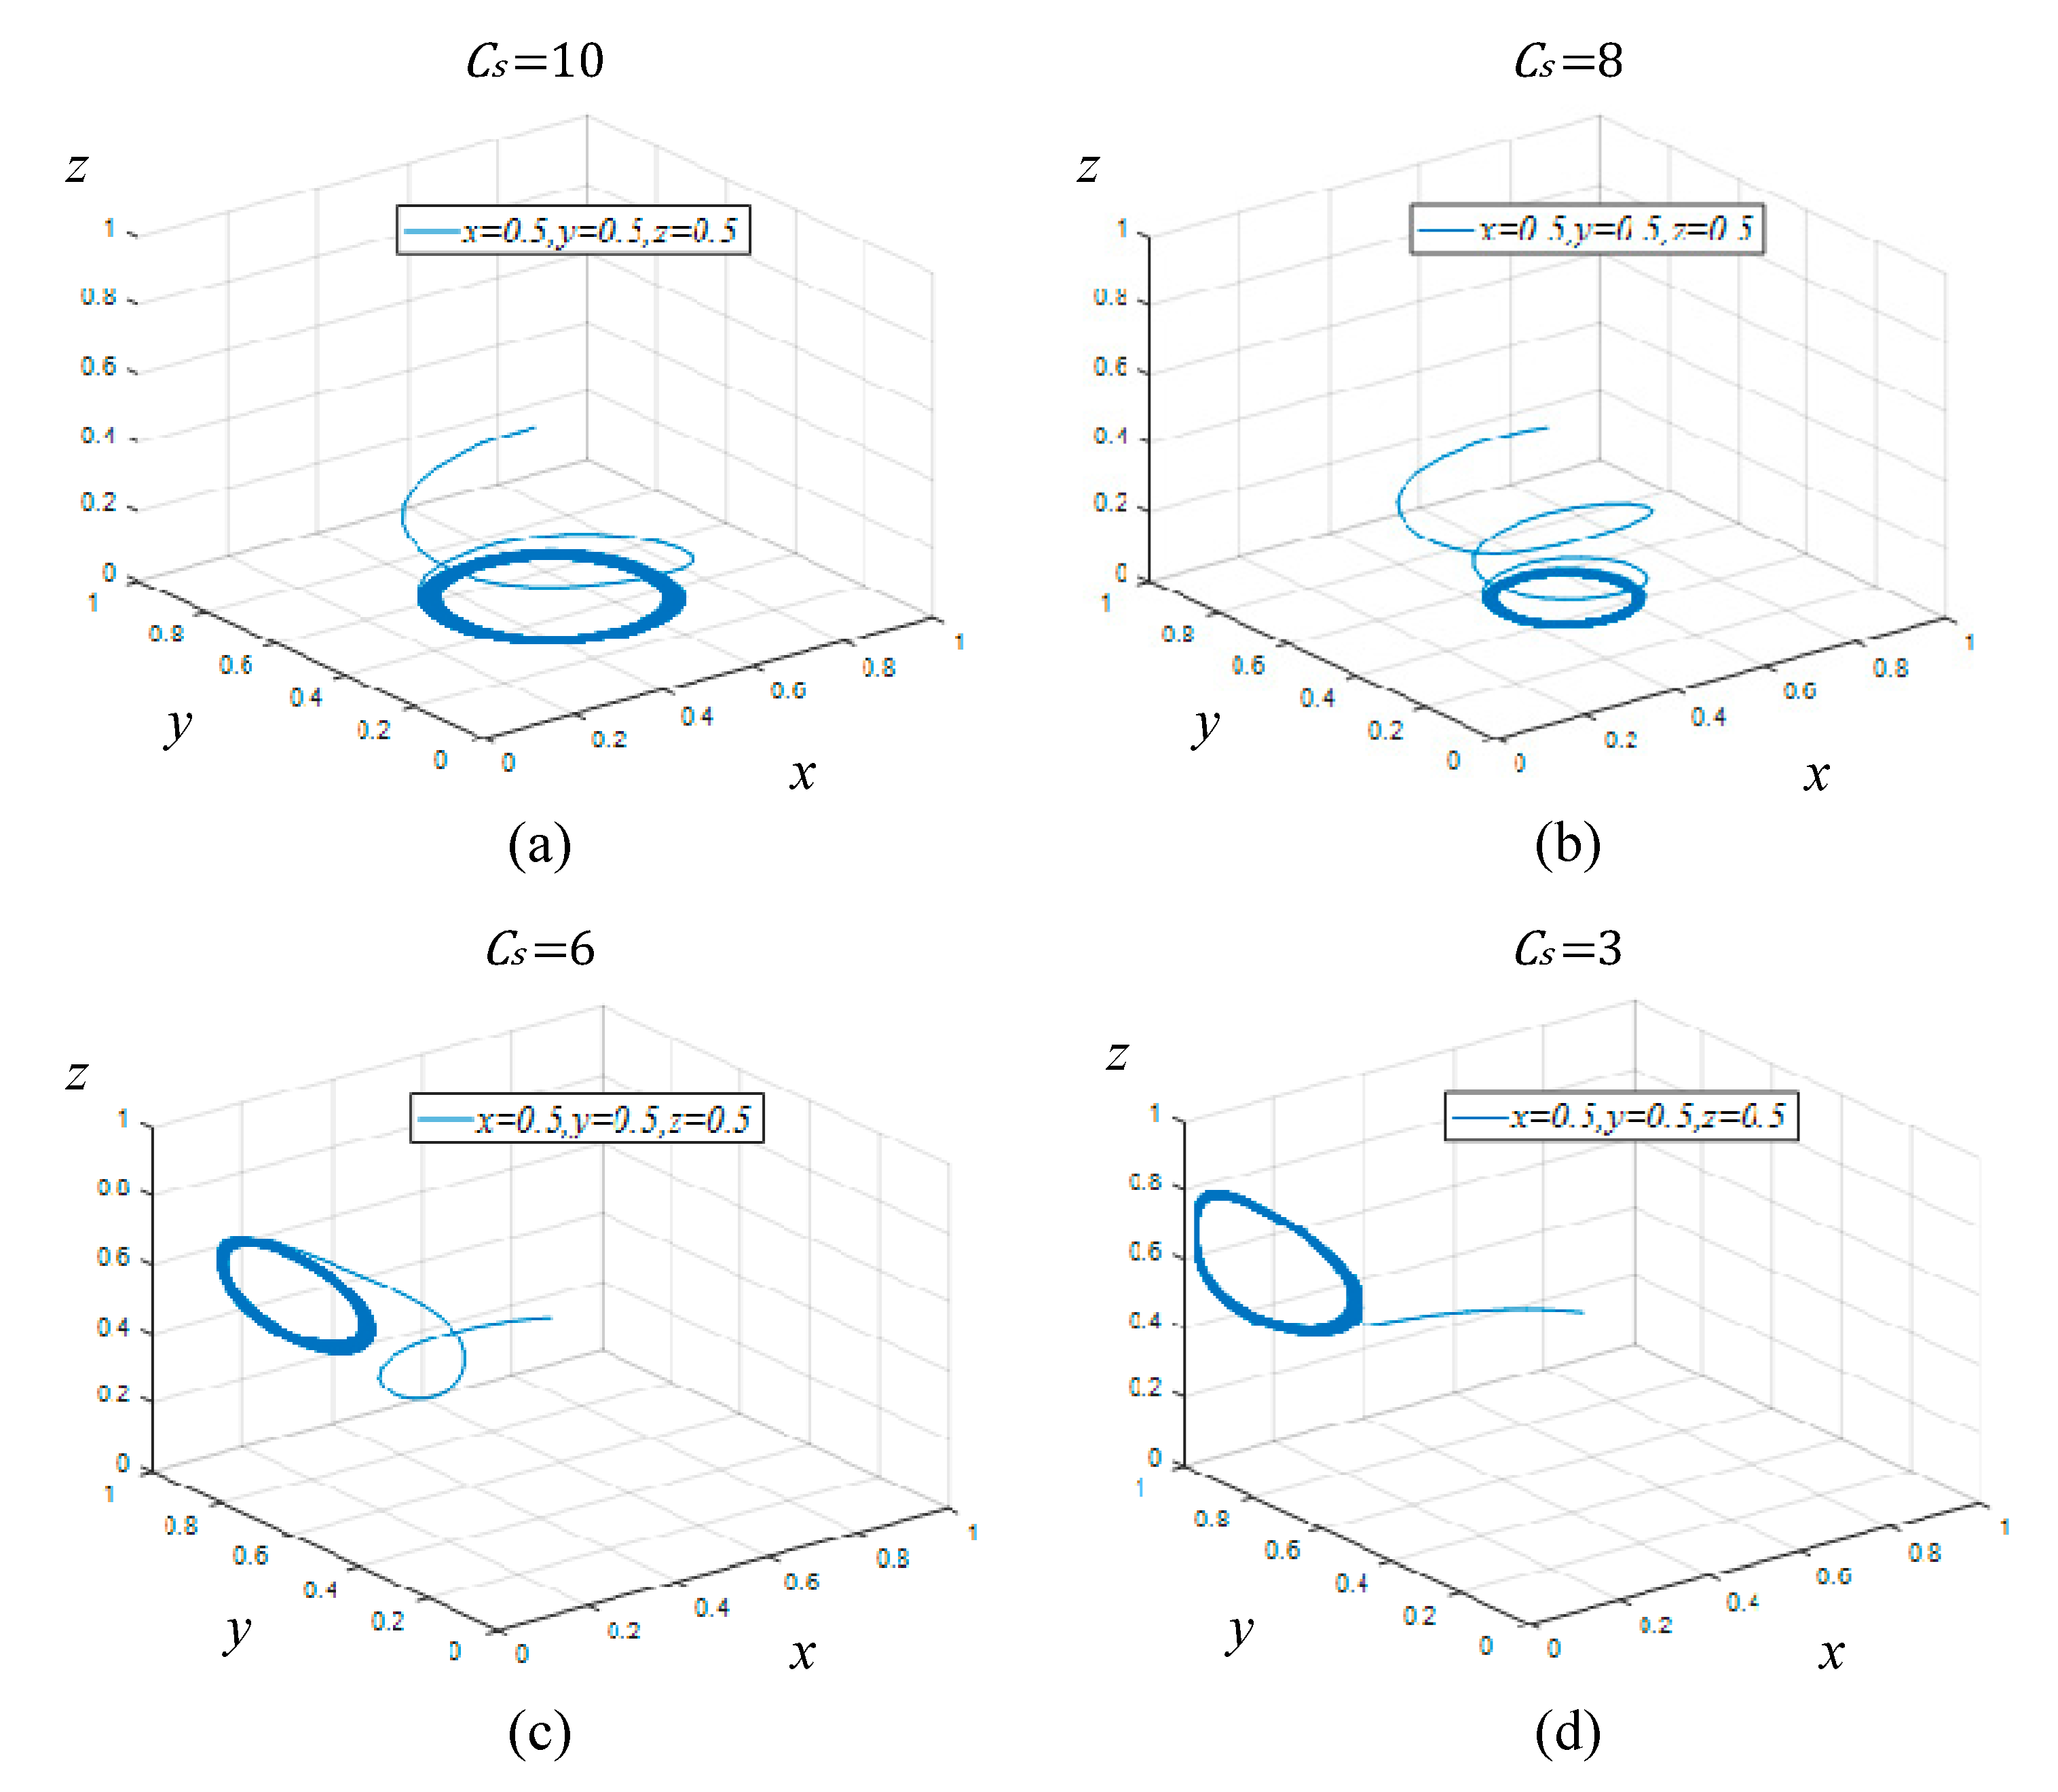
5.5. The Influence of on Multi-Stakeholders’ Evolutionary Behavior
6. Conclusions and Policy Implications
Author Contributions
Funding
Conflicts of Interest
Appendix A
References
- Global Carbon Project. An Annual Update of the Global Carbon Budget and Trends. Available online: https://www.globalcarbonproject.org/carbonbudget/18/data.htm (accessed on 20 September 2019).
- Fukui, H.; Miyoshi, C. The impact of aviation fuel tax on fuel consumption and carbon emissions: The case of the US airline industry. Transport. Res. Part D-Transport. Environ. 2017, 50, 234–253. [Google Scholar] [CrossRef]
- Yi, Y.; Li, J. The effect of governmental policies of carbon taxes and energy-saving subsidies on enterprise decisions in a two-echelon supply chain. J. Clean. Prod. 2018, 181, 675–691. [Google Scholar]
- Haddadsisakht, A.; Ryan, S.M. Closed-loop supply chain network design with multiple transportation modes under stochastic demand and uncertain carbon tax. Int. J. Prod. Econ. 2018, 195, 118–131. [Google Scholar] [CrossRef]
- Xu, X.; Zhang, W.; He, P.; Xu, X. Production and pricing problems in make-to-order supply chain with cap-and-trade regulation. Omega 2017, 66, 248–257. [Google Scholar] [CrossRef]
- d’Agostino, G.; Dunne, J.P.; Pieroni, L. Government Spending, Corruption and Economic Growth. World Dev. 2016, 84, 190–205. [Google Scholar]
- Arminen, H.; Menegaki, A.N. Corruption, climate and the energy-environment-growth nexus. Energy Econ. 2019, 80, 621–634. [Google Scholar] [CrossRef]
- Schroeder, P. Assessing effectiveness of governance approaches for sustainable consumption and production in China. J. Clean. Prod. 2014, 63, 64–73. [Google Scholar] [CrossRef]
- Sun, L.; Zhu, D.; Chan, E.H.W. Public participation impact on environment NIMBY conflict and environmental conflict management: Comparative analysis in Shanghai and Hong Kong. Land Use Pol. 2016, 58, 208–217. [Google Scholar] [CrossRef]
- Yew, W.L.; Zhu, Z. Innovative autocrats? Environmental innovation in public participation in China and Malaysia. J. Environ. Manag. 2019, 234, 28–35. [Google Scholar] [CrossRef]
- Wittneben, B.B.F. Exxon is right: Let us re-examine our choice for a cap-and-trade system over a carbon tax. Energy Policy 2009, 37, 2462–2464. [Google Scholar] [CrossRef]
- Shammin, M.R.; Bullard, C.W. Impact of cap-and-trade policies for reducing greenhouse gas emissions on U.S. households. Ecol. Econ. 2009, 68, 2432–2438. [Google Scholar] [CrossRef]
- Galinato, G.I.; Yoder, J.K. An integrated tax-subsidy policy for carbon emission reduction. Resour. Energy Econ. 2010, 32, 310–326. [Google Scholar] [CrossRef]
- Jiang, J.; Xie, D.; Ye, B.; Bo, S.; Chen, Z. Research on China’s cap-and-trade carbon emission trading scheme: Overview and outlook. Appl. Energy 2016, 178, 902–917. [Google Scholar] [CrossRef]
- Sabzevar, N.; Enns, S.T.; Bergerson, J.; Kettunen, J. Modeling competitive firms’ performance under price-sensitive demand and cap-and-trade emissions constraints. Int. J. Prod. Econ. 2017, 184, 193–209. [Google Scholar] [CrossRef]
- Wang, S.; Wan, L.; Li, T.; Luo, B.; Wang, C. Exploring the effect of cap-and-trade mechanism on firm’s production planning and emission reduction strategy. J. Clean. Prod. 2018, 172, 591–601. [Google Scholar] [CrossRef]
- Krass, D.; Ovchinnikov, A. Environmental Taxes and the Choice of Green Technology. Prod. Oper. Manag. 2013, 22, 1035–1055. [Google Scholar] [CrossRef]
- Zhao, R.; Zhou, X.; Han, J.; Liu, C. For the sustainable performance of the carbon reduction labeling policies under an evolutionary game simulation. Technol. Forecast. Soc. Chang. 2016, 112, 262–274. [Google Scholar] [CrossRef]
- Hafezalkotob, A. Competition, cooperation, and coopetition of green supply chains under regulations on energy saving levels. Transp. Res. Pt. e-Logist. Transp. Rev. 2017, 97, 228–250. [Google Scholar] [CrossRef]
- Wang, Z.; He, S.; Zhang, B.; Wang, B. Optimizing cooperative carbon emission reduction among enterprises with non-equivalent relationships subject to carbon taxation. J. Clean. Prod. 2018, 172, 552–565. [Google Scholar] [CrossRef]
- He, P.; He, Y.; Xu, H. Channel structure and pricing in a dual-channel closed-loop supply chain with government subsidy. Int. J. Prod. Econ. 2019, 213, 108–123. [Google Scholar] [CrossRef]
- Chen, J.-Y.; Dimitrov, S.; Pun, H. The impact of government subsidy on supply Chains’ sustainability innovation. Omega 2019, 86, 42–58. [Google Scholar] [CrossRef]
- Wen, W.; Zhou, P.; Zhang, F. Carbon emissions abatement: Emissions trading vs consumer awareness. Energy Econ. 2018, 76, 34–47. [Google Scholar] [CrossRef]
- Yang, H.; Chen, W. Retailer-driven carbon emission abatement with consumer environmental awareness and carbon tax: Revenue-sharing versus Cost-sharing. Omega 2018, 78, 179–191. [Google Scholar] [CrossRef]
- Yenipazarli, A. Incentives for environmental research and development: Consumer preferences, competitive pressure and emissions taxation. Eur. J. Oper. Res. 2019, 276, 757–769. [Google Scholar] [CrossRef]
- Feucht, Y.; Zander, K. Consumers’ preferences for carbon labels and the underlying reasoning. A mixed methods approach in 6 European countries. J. Clean. Prod. 2018, 178, 740–748. [Google Scholar] [CrossRef]
- O’Faircheallaigh, C. Public participation and environmental impact assessment: Purposes, implications, and lessons for public policy making. Environ. Impact Assess. Rev. 2010, 30, 19–27. [Google Scholar]
- Glucker, A.N.; Driessen, P.P.J.; Kolhoff, A.; Runhaar, H.A.C. Public participation in environmental impact assessment: Why, who and how? Environ. Impact Assess. Rev. 2013, 43, 104–111. [Google Scholar] [CrossRef]
- Wu, J.; Xu, M.; Zhang, P. The impacts of governmental performance assessment policy and citizen participation on improving environmental performance across Chinese provinces. J. Clean. Prod. 2018, 184, 227–238. [Google Scholar] [CrossRef]
- Simpson, N.P.; Basta, C. Sufficiently capable for effective participation in environmental impact assessment? Environ. Impact Assess. Rev. 2018, 70, 57–70. [Google Scholar] [CrossRef]
- Li, L.; Xia, X.H.; Chen, B.; Sun, L. Public participation in achieving sustainable development goals in China: Evidence from the practice of air pollution control. J. Clean. Prod. 2018, 201, 499–506. [Google Scholar] [CrossRef]
- Zhang, G.; Deng, N.; Mou, H.; Zhang, Z.G.; Chen, X. The impact of the policy and behavior of public participation on environmental governance performance: Empirical analysis based on provincial panel data in China. Energy Policy 2019, 129, 1347–1354. [Google Scholar] [CrossRef]
- Kostka, G. Command without control: The case of China’s environmental target system. Regul. Gov. 2016, 10, 58–74. [Google Scholar] [CrossRef]
- Jing, W.; Chang, I.S.; Yilihamu, Q.; Yu, Z. Study on the practice of public participation in environmental impact assessment by environmental non-governmental organizations in China. Renew. Sust. Energ. Rev. 2017, 74, 186–200. [Google Scholar]
- Ayana, A.N.; Arts, B.; Wiersum, K.F. How environmental NGOs have influenced decision making in a ‘semi-authoritarian’ state: The case of forest policy in Ethiopia. World Dev. 2018, 109, 313–322. [Google Scholar] [CrossRef]
- Nowak, M.A.; Karl, S. Evolutionary dynamics of biological games. Science 2004, 303, 793–799. [Google Scholar] [CrossRef]
- Requejo, R.J.; Camacho, J. Evolution of cooperation mediated by limiting resources: Connecting resource based models and evolutionary game theory. J. Theor. Biol. 2011, 272, 35–41. [Google Scholar] [CrossRef]
- Sikhar, B.; Gaurav, A.; Zhang, W.J.; Biswajit, M.; Tiwari, M.K. A decision framework for the analysis of green supply chain contracts: An evolutionary game approach. Expert Syst. Appl. 2012, 39, 2965–2976. [Google Scholar] [CrossRef]
- Ji, P.; Ma, X.; Li, G. Developing green purchasing relationships for the manufacturing industry: An evolutionary game theory perspective. Int. J. Prod. Econ. 2015, 166, 155–162. [Google Scholar] [CrossRef]
- Yang, Z.; Shi, Y.; Li, Y. Analysis of intellectual property cooperation behavior and its simulation under two types of scenarios using evolutionary game theory. Comput. Ind. Eng. 2018, 125, 739–750. [Google Scholar] [CrossRef]
- Tian, Y.; Govindan, K.; Zhu, Q. A system dynamics model based on evolutionary game theory for green supply chain management diffusion among Chinese manufacturers. J. Clean. Prod. 2014, 80, 96–105. [Google Scholar] [CrossRef]
- Mahmoudi, R.; Rasti-Barzoki, M. Sustainable supply chains under government intervention with a real-world case study: An evolutionary game theoretic approach. Comput. Ind. Eng. 2018, 116, 130–143. [Google Scholar] [CrossRef]
- Encarnação, S.; Santos, F.P.; Santos, F.C.; Blass, V.; Pacheco, J.M.; Portugali, J. Paths to the adoption of electric vehicles: An evolutionary game theoretical approach. Transp. Res. Part B Methodol. 2018, 113, 24–33. [Google Scholar]
- Li, J.; Jiao, J.; Tang, Y. An evolutionary analysis on the effect of government policies on electric vehicle diffusion in complex network. Energy Policy 2019, 129, 1–12. [Google Scholar] [CrossRef]
- Friedman, D. Evolutionary Games in Economics. Econometrica 1991, 59, 637. [Google Scholar] [CrossRef]
- Lyapunov, A.M. The general problem of the stability of motion. Int. J. Control 1992, 55, 531–534. [Google Scholar] [CrossRef]
- Chen, W.; Hu, Z.-H. Using evolutionary game theory to study governments and manufacturers’ behavioral strategies under various carbon taxes and subsidies. J. Clean. Prod. 2018, 201, 123–141. [Google Scholar] [CrossRef]
- Sun, T.; She, D. Research on the relationship between the international competitiveness of China’s manufacturing industry and factor price—Based on the empirical analysis of 28 manufacturing industries (In Chinese). Shanghai Econ. Res. 2016, 05, 10–18, 57. [Google Scholar]
- Wang, H.; Wang, F. Study on purification technology of food grade carbon dioxide impurities by adsorption method. Chin. Foreign Wine·Beer Technol. 2017, 6, 20–25. (In Chinese) [Google Scholar]
- China Resources Breweries Co. Ltd. A Brief Introduction to China Resources Beer Co.Ltd. [In Chinese]. Available online: http://www.snowbeer.com.cn/ (accessed on 20 September 2019).
- Yang, J.; Zhong, J.; Zhang, K.; Lu, J. Beer Carbon Footprint and a Case study. Glob. Alcinfo.beer Technol. 2013, 8, 6–14. (In Chinese) [Google Scholar]
- Fourth International Low-carbon City Forum. Carbon Trading of 200–300 yuan/ton Is the Ideal Value. Available online: http://www.nbd.com.cn/articles/2016-06-20/1014398.html (accessed on 20 September 2019).
- Carbon Trading Network. Industry Carbon Intensity Advanced Value Data Query List. Available online: www.tanpaifang.com/tanjiliang/2014/0504/31846.html (accessed on 20 September 2019).
- Weng, Q.; Xu, H. A review of China’s carbon trading market. Renew. Sustain. Energy Rev. 2018, 91, 613–619. [Google Scholar] [CrossRef]


| Parameters | Explanations |
| Unit sale price of K | |
| Unit cost of low-carbon product K of manufactures | |
| Unit cost of ordinary K of manufactures | |
| Monthly profit for low-carbon product K of manufactures | |
| Monthly profit for ordinary K of manufactures | |
| Monthly market demand of K | |
| Consumer preference for purchasing K | |
| Regulation costs of governments | |
| Environmental governance fees of governments | |
| Supervision cost of publics | |
| Environmental benefits for governments | |
| Environmental losses for governments | |
| Environmental quality for publics | |
| Subsidies for low-carbon K | |
| Carbon taxes for ordinary K | |
| Rewards of publics for supervision and report | |
| Damages caused by environmental pollution of publics | |
| Variables | Explanations |
| Probability of governments regulation | |
| Probability of manufactures adoption | |
| Probability of publics supervision |
| Publics (P) | |||||
|---|---|---|---|---|---|
| Supervise (z) | Not Supervise (1 − z) | ||||
| Manufacturers (M) | Manufacturers (M) | ||||
| Adopt (y) | Not Adopt (1 − y) | Adopt (y) | Not Adopt (1 − y) | ||
| Governments (G) | Regulate () | ||||
| Not regulate () | |||||
| Notations | ||||||||||||
|---|---|---|---|---|---|---|---|---|---|---|---|---|
| Values | 6 | 3.03 | 3 | 0.5 | 3000 | 2970 | 2000 | 14.2 | 42.6 | 15 | 8 | 15 |
© 2020 by the authors. Licensee MDPI, Basel, Switzerland. This article is an open access article distributed under the terms and conditions of the Creative Commons Attribution (CC BY) license (http://creativecommons.org/licenses/by/4.0/).
Share and Cite
Chen, W.; Hu, Z.-H. Analysis of Multi-Stakeholders’ Behavioral Strategies Considering Public Participation under Carbon Taxes and Subsidies: An Evolutionary Game Approach. Sustainability 2020, 12, 1023. https://doi.org/10.3390/su12031023
Chen W, Hu Z-H. Analysis of Multi-Stakeholders’ Behavioral Strategies Considering Public Participation under Carbon Taxes and Subsidies: An Evolutionary Game Approach. Sustainability. 2020; 12(3):1023. https://doi.org/10.3390/su12031023
Chicago/Turabian StyleChen, Wanting, and Zhi-Hua Hu. 2020. "Analysis of Multi-Stakeholders’ Behavioral Strategies Considering Public Participation under Carbon Taxes and Subsidies: An Evolutionary Game Approach" Sustainability 12, no. 3: 1023. https://doi.org/10.3390/su12031023
APA StyleChen, W., & Hu, Z.-H. (2020). Analysis of Multi-Stakeholders’ Behavioral Strategies Considering Public Participation under Carbon Taxes and Subsidies: An Evolutionary Game Approach. Sustainability, 12(3), 1023. https://doi.org/10.3390/su12031023