Article

The Role of Socio-Economic Determinants of Horse Farms for Grassland Management, Vegetation Composition and Ecological Value

by
Cecilia Frauke Hüppe
1,
Anja Schmitz
1,*,
Bettina Tonn
1,2 and
Johannes Isselstein
1,2
1
Department of Crop Sciences, University of Göttingen, 37075 Göttingen, Germany
2
Centre of Biodiversity and Sustainable Land Use, University of Göttingen, 37077 Göttingen, Germany
*
Author to whom correspondence should be addressed.
Sustainability 2020, 12(24), 10641; https://doi.org/10.3390/su122410641
Submission received: 30 November 2020 / Revised: 16 December 2020 / Accepted: 17 December 2020 / Published: 19 December 2020
(This article belongs to the Special Issue Socio-Ecological Systems Sustainability)

Abstract

:
Socio-economic context is increasingly seen as a decisive factor for sustainable agricultural land use. The high prevalence of part-time farming and frequent lack of formal agricultural education within the equine sector are often seen as reasons why horse-grazed pastures do not fulfill their biodiversity potential. In spite of the substantial variability within horse farming, little is known about the relationship of socio-economic determinants with vegetation characteristics of horse-grazed grasslands. We surveyed 122 horse farms in Germany, classifying them into four socio-economic classes according to farm income type and farm managers’ agricultural education. We recorded farm structure parameters, grassland management practices and vegetation characteristics. Socio-economic class partly explained the great variability in farm structure that we observed. In contrast to our expectation, income type and agricultural education did not distinctly affect grassland management and were neither directly nor indirectly related to vegetation characteristics. Part-time farming and lack of agricultural education thus did not adversely affect the ecological value of horse-grazed grasslands. By contrast, both farm structure and paddock level management affected grassland vegetation and ecological value. Therefore, the socio-economic context of horse farms should be addressed in further research with strategies targeting the development of sustainable grassland management in horse keeping.

1. Introduction

Grassland management is a key factor controlling ecosystem services and biodiversity of grasslands in the agricultural landscape [1]. Extensive management and grazing, in particular, are important for conserving grassland biodiversity [2,3,4]. The role of horses as a grazer species is becoming more important in Germany [5] and throughout Europe [6]. Horse numbers and thus, the use of grasslands by horse farms, are increasing [7]. Schmitz and Isselstein [5] estimated that 15–20% of the total grassland area in Germany is used for horse keeping. Similar figures were found in other European countries [6].
Grassland utilisation with horses can have numerous ecological benefits. Horses graze on a wide range of different grassland types in contrast to intensive ruminant livestock farming, which uses more uniform grassland with a high production potential [7]. For dairy cows, in particular, highly productive and intensively managed grassland is needed to ensure a high nutritional value and feed intake [8,9]. While highly diverse grasslands in nature conservation areas are usually grazed with small ruminants such as sheep [10], marginal grasslands that do not fall into this latter category are often used by horses [11]. Menard et al. [12] showed that horses have an advantage over cattle in utilising grasslands of poor herbage quality. Thus, horse farming offers an opportunity to use grasslands that are at risk of being abandoned from conventional use with cattle [1,13]. Such grasslands often have a small paddock size, are located on slopes, have poor accessibility and low productivity. They are targeted by High Nature Value (HNV) monitoring as a valuable element to maintain biodiversity in agricultural landscapes since they provide a higher ecological value compared to intensively managed grasslands [14]. Continuing management and utilisation of these grasslands is critical for their maintenance, their biodiversity and functioning. It counteracts the loss of grassland resulting from structural change in agriculture.
The specific grazing behaviour of horses usually leads to the establishment of a heterogeneous grass sward structure [7]. The patchy sward structure of preferentially grazed and mostly avoided areas [7,15] is more pronounced than under cattle or sheep grazing [16]. It can result in a higher botanical diversity, as recently shown in a study comparing horse and cattle pastures [17]. Fleurance et al. [16] highlighted that bird and insect diversity is also positively influenced by horse grazing, while Garrido et al. [18] observed a cascade effect for the entire ecosystem triggered by the reintroduction of horses into semi-natural grassland.
The results of these studies contrast with instances where horse grazing has led to degraded grassland swards. Avoided areas may become dominated by nitrophilous weeds, while trampling and overgrazing of preferred areas may lead to areas of bare soil and increased abundance of ruderal species [17]. Whether positive or negative impacts of horse on grassland ecological value prevail depends on grassland management at the paddock scale, which is controlled by the farmer’s decision and strongly influenced by farmers’ attitudes, priorities and expertise.
The human factor has been widely recognized as a driving force behind biodiversity loss and the socio-economic determinants of land-use [19,20,21,22]. In grassland management, farmers decisions are restricted by socio-economic determinants that include farm managers’ education, the income type of the enterprise (full-time or part-time business) as well as the farm structure (i.e., agricultural area, type of livestock, number of livestock). Farm structure within the equine sector is highly variable. The sector also differs greatly from other farm types in two important aspects. Firstly, horse farming has a higher proportion of part-time farms compared to other livestock enterprises [23]. Whereas the majority of the cattle and sheep in Germany are kept on full-time farms, this is not the case for horses [23]. As the proportion of farmers without agricultural education is higher on part-time farms [24], a large proportion of horse owners, and thus grassland managers, may not have received a professional education in grassland use and thus lack professional competence in grassland management [5,7] as well as knowledge about the interaction between horse and environment [25]. Secondly, horse owners generally tend to be more animal-centred rather than focused on land management. Most domestic horses are kept for leisure activities, sports and recreational aspects [7,26,27,28,29]. Professional education, when present, may be in equine husbandry or veterinary science rather than agriculture, commonly with a limited focus on grassland management. Since the natural behaviour of horses leads to a pronounced need for several hours of daily exercise [30], animal welfare aspects are often the determining factors for grassland use [28], while a large proportion of the required roughage may be purchased rather than produced on the farm [5,7]. In order to develop sustainable grassland management strategies and extension strategies in the context of horse farms, a better understanding of the relation between socio-economic determinants, grassland management and the resulting vegetation is required.
In our study, we therefore investigated the relationship between income type (full-time or part-time) and presence or absence of agricultural education with farm structure, grassland management and grassland vegetation structure. Our aim was to identify the socio-economic context that is associated with a high ecological value of horse-grazed grasslands. We surveyed 122 horse farms in Germany, classifying them based on income type and agricultural education. We collected key farm structure data and management information for four horse-grazed paddocks per farm. On these paddocks, we assessed the abundance and richness of forb species, as well as richness in ecologically valuable and weedy species, as indicators of grassland ecological value.
We tested the following hypotheses:
Hypothesis 1 (H1).
The variability in farm structure observed in horse farms can be explained by income type (part-time vs. full-time) and presence or absence of agricultural education of the farm manager.
Hypothesis 2 (H2).
Income type and agricultural education also explain grassland management at the paddock scale.
Hypothesis 3 (H3).
Income type and agricultural education are related to grassland vegetation, either directly or indirectly via farm structure and management.
Hypothesis 4 (H4).
Grassland vegetation on horse-farms that are run part-time or by farm managers without agricultural education have a reduced ecological value.

2. Materials and Methods
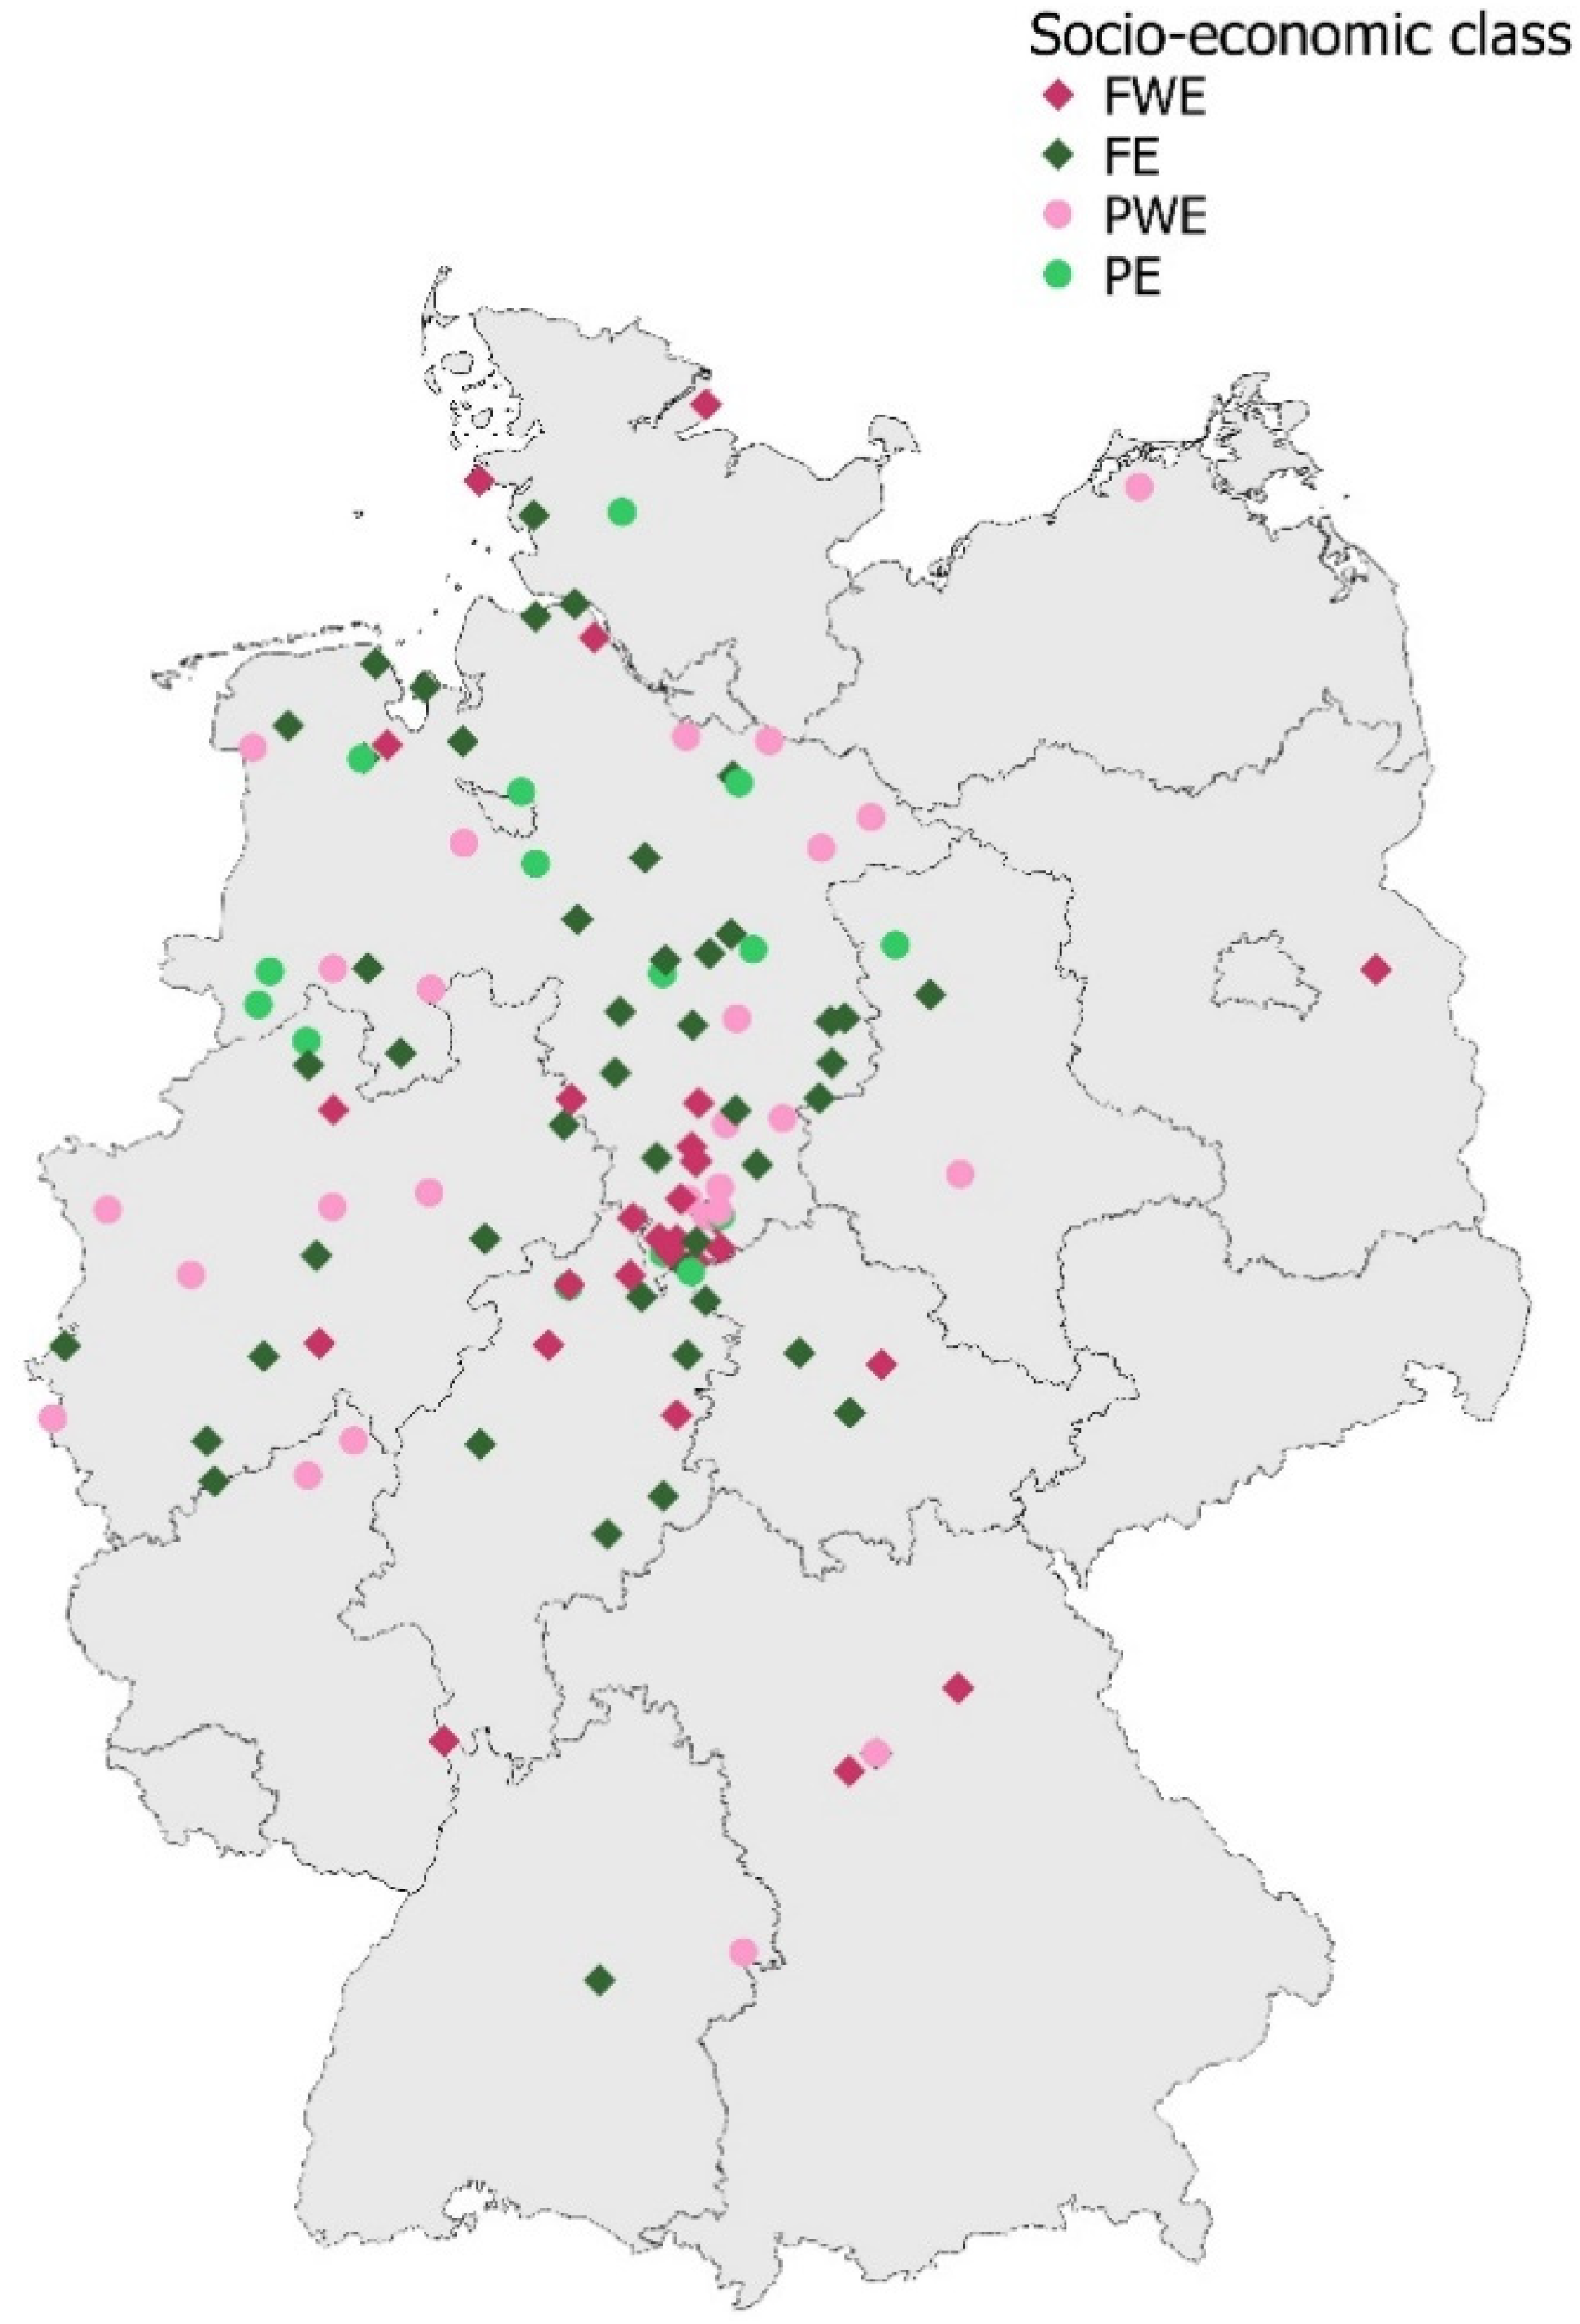
2.1. Study Design

Data were collected over six years (2013–2019) on 122 randomly selected horse farms in Germany with a focus on north-west Germany (Figure 1). Data on income type, farm managers’ agricultural education, farm structure and grassland management were collected through interviews with the farm managers. Vegetation composition was assessed at four paddocks per farm. Only for-profit farms, i.e., no hobby farms or private horse keepers, were included in the study.

2.2. Socio-Economic Class, Farm Structure and Grassland Management

Interviews with farm managers followed a standardised protocol (Supplementary Material Tables S1 and S2). We classified farms into four socio-economic classes based on income type and agricultural education: FE = full-time business with agricultural education, FWE = full-time business without agricultural education, PE = part-time business with agricultural education, PWE = part-time business without agricultural education (Table 1). The income type refers to the entire farm, including possible further agricultural activities beyond horse husbandry. For full-time farms, farming is the main source of income. Part-time farms have other sources of income or the income is mainly generated from non-agricultural activities [31]. Our definition of agricultural education included professional or university education in agriculture, but not education in equine management or veterinary science.
We characterised farm structure through the following parameters: grassland area (ha); grassland area as a proportion of total agricultural area; agricultural area used by horses (ha); proportion of total agricultural area used by horses; percentage of total required roughage that is purchased; number of horses (livestock units (LU), one livestock unit corresponds to 500 kg live weight) and labour force.
Grassland management data were queried for four paddocks per farm (Supplementary Material Table S2) whose vegetation composition we assessed according to a standardised protocol (Supplementary Material Table S3). We then took into account the presence or absence of the following management practices for further analysis: fertilisation (organic or mineral), grassland maintenance practices (collecting dung, harrowing, reseeding, herbicide use, topping, topping plus cuttings removed) and mowing.

2.3. Vegetation Survey

Vegetation composition was investigated at four paddocks per farm. In order to be able to consider the grazing effect of horses, two pastures (utilised only by grazing) and two mown pastures (horse grazing and mowing to obtain fodder) were examined on each farm. Four plot-pairs were established randomly on each paddock in late spring/early summer, leading to a total of eight plots per paddock. Within each plot-pair, one plot was located in a grazed patch and the other in an avoided patch. Plots within a pair were in close proximity to each other (max. 5 m distances).
Each plot had a size of 1 × 1 m2. Vegetation was recorded and documented using a standardised protocol (Supplementary Material Table S3). All herb and legume species were identified and documented by photographs (Supplementary Material Figure S1). The relative abundance of the three functional groups grasses, legumes and non-leguminous forbs was quantified by estimating the percentage of standing vegetation dry mass contributed by each group, the so-called yield share. The vegetation surveys were carried out as part of the coursework within a graduate-level module at the University of Göttingen. Each farm was surveyed by a group of two or three students. Before the surveys, students were trained in species identification and yield share estimation.
As only legumes and non-leguminous forbs were identified to species level, vegetation variables in this study refer exclusively to this group, in the following summarised as ‘forbs’. For each paddock, we calculated the mean yield share of forbs (YS Forbs). Forb species richness (FSR) was analysed at different spatial scales [32]. We calculated the total number of forb species per paddock as alpha-diversity (FSR-alpha), the total number of forb species per farm as gamma diversity (gamma-FSR) and the difference between the two values as beta diversity (beta-FSR).
As forbs include ecologically valuable as well as weedy species, we also identified the richness of two separate groups: High-Nature-Value (HNV) species were identified from the regional plant indicator species lists used by the German Federal Agency for Nature Conservation to determine HNV grassland [14]. The group of weeds and ruderal species (WR; Supplementary Material Table S4) summarises a selection of species considered as typical grassland weeds from an agronomic point of view [33,34]. We calculated the richness of both groups on paddock level (alpha-HNV, alpha-WR), farm level (gamma-HNV, gamma-WR) and between paddocks (beta-HNV, beta-WR) as described above.
To determine the botanical heterogeneity within paddocks that results from differences between grazed and avoided patches, we calculated the Sørensen index [35] for floristic contrast according to the formula: Sørensen index = 2 c/(a + b + 2 c), with a representing species occurring only in grazed patches, b representing species occurring only in avoided patches and c representing species occurring in both patches.
We considered the ecological value of the investigated grassland to be high when forb species richness and abundance were high, particularly when this coincided with a high richness of HNV species and a low richness of WR species.

2.4. Statistical Analysis

All analyses were carried out in R (3.6.3., R Core Team, 2020) using the packages ‘car’ [36], ‘lme4’ [37], ‘nlme’ [38], ‘MuMIn’ [39] and ‘emmeans’ [40].
For each vegetation variable assessed at paddock-level (YS Forbs, alpha-FSR, alpha-HNV, alpha-WR, Sørensen index), three linear mixed effects models were constructed (package ‘nlme’, function ‘lme’). In the first model, we modelled vegetation variables as a function of income type and farm managers’ education and their interaction. In a second model, we added the farm structure data (grassland area, proportion of horse area, percentage of roughage purchased, number of horses, labour force) as further fixed effects. In a third model, we extended the first model to include grassland management parameters. Here, we modelled the respective vegetation variables as a function of income type, farm managers’ education, their interaction and grassland management (fertilisation, grassland maintenance practices, mowing). Due to the study design, we considered the farm as a random term. The vegetation characteristics at the farm level (beta-FSR, gamma-FSR, beta-HNV, gamma-HNV, beta-WR, gamma-WR) were analysed using linear models (package ‘nlme’, function ‘gls’). Analogous to the linear mixed models, we specified model 1 and 2 with the same fixed effects as described above. As grassland management data is available only at the paddock level, model 3 was not used for variables at the farm level.
Furthermore, we modelled farm structure data as a function of income type, farm managers’ education and their interaction using linear models (package ‘nlme’, function ‘gls’). Binomial generalised linear mixed models were set up to model fertilisation, grassland maintenance practices and mowing as a function of income type, farm managers’ education and their interaction, including farm as random term (package ‘lme4’, function ‘glmer’).
We checked each model for multicollinearity between the explanatory variables (fixed effects) visually and then by variance inflation factors (VIF) using the function ‘vif’ from package ‘car’. Only variables with VIF < 3 were used, so that only the farm structure data listed above were included in the models. Then, we checked each model visually for normality of residuals and variance homogeneity. Logit-transformation was carried out for the dependent variables YS Forbs, Sørensen index, proportion of area used directly by horses and percentage of roughage purchase, log-transformation for the dependent variables FSR (alpha-, beta-, gamma-FSR), HNV (alpha-HNV), labour force, number of horses and grassland area. For each model, the secondary Akaike information criterion (AICc) was calculated for each possible combination of fixed effects and based on this, the best model (lowest AICc) was selected using the ‘dredge’ function of the package ‘MuMIn’. The significance of fixed effects was determined using marginal Wald tests, setting the significance level of p < 0.05. If significance was identified for income type and farm managers’ education, a post-hoc Tukey test was performed (package ‘emmeans’).

3. Results

In total, the study assessed 3540 hectares of agricultural land used by a total of 4930 horses. The largest number of farms belonged to the class of full-time farms with agricultural education (FW), followed by full-time farms and part-time farms with and without agricultural education (FWE and PWE, respectively). Part-time farms with agricultural education (PE) formed the smallest class (Table 1).

3.1. Characteristics and Structure of Horse Farms

Full-time farms kept more horses, farmed a larger grassland area and had a larger labour force than part-time farms, but did not differ in the percentage of purchased roughage (Table 2 and Table 3). Farms with agricultural education farmed a larger grassland area and purchased a smaller percentage of their roughage than farms without such education. Full-time farms with agricultural education used a smaller proportion of their agricultural area for horses than full-time farms without such education or part-time farms.

3.2. Grassland Management

The majority of paddocks were fertilised with mineral fertilisers, a smaller proportion were fertilised organically (Table 4), while about a quarter of paddocks received no fertiliser at all. Including farm managers’ agricultural education in the model improved model fit, indicating that mineral fertilsation was more common when such education was present than when it was absent, while the opposite was true for organic fertilisation. In both cases, however, the effect remained non-significant (Table 5).
Across all four farm socio-economic classes, the most common grassland maintenance practices were harrowing (87% of paddocks) and topping (71%), followed by rolling (31%). The collecting of horse dung, application of herbicides and topping with removal of the cuttings were only practiced on less than 15% of the paddocks. In spite of numerical differences between the farm socio-economic classes (Table 4), the only significant effect was found for reseeding (Table 5), which was more commonly practiced on full-time than on part-time farms.

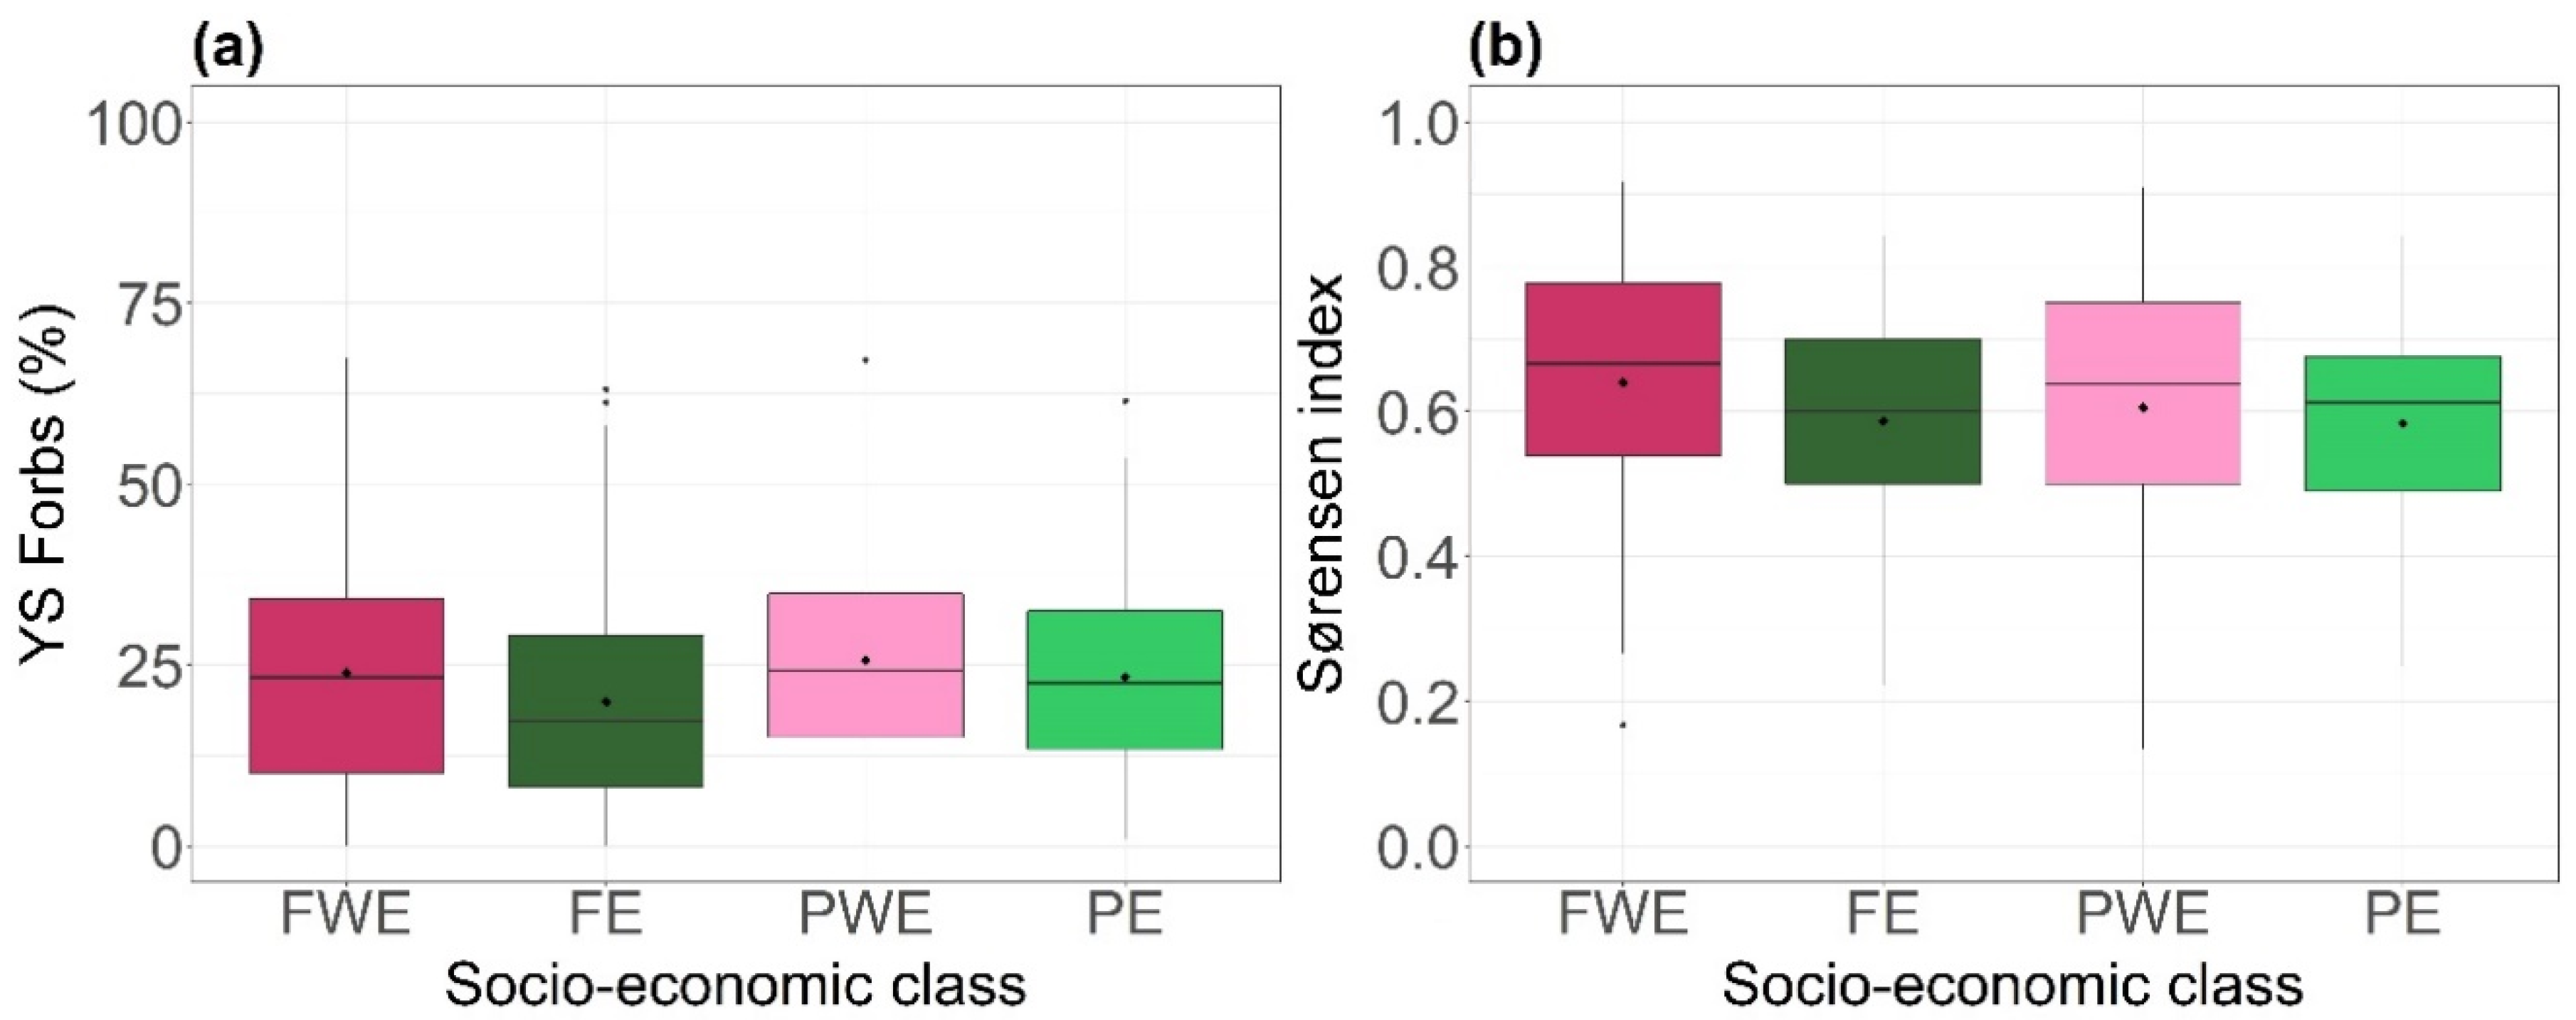
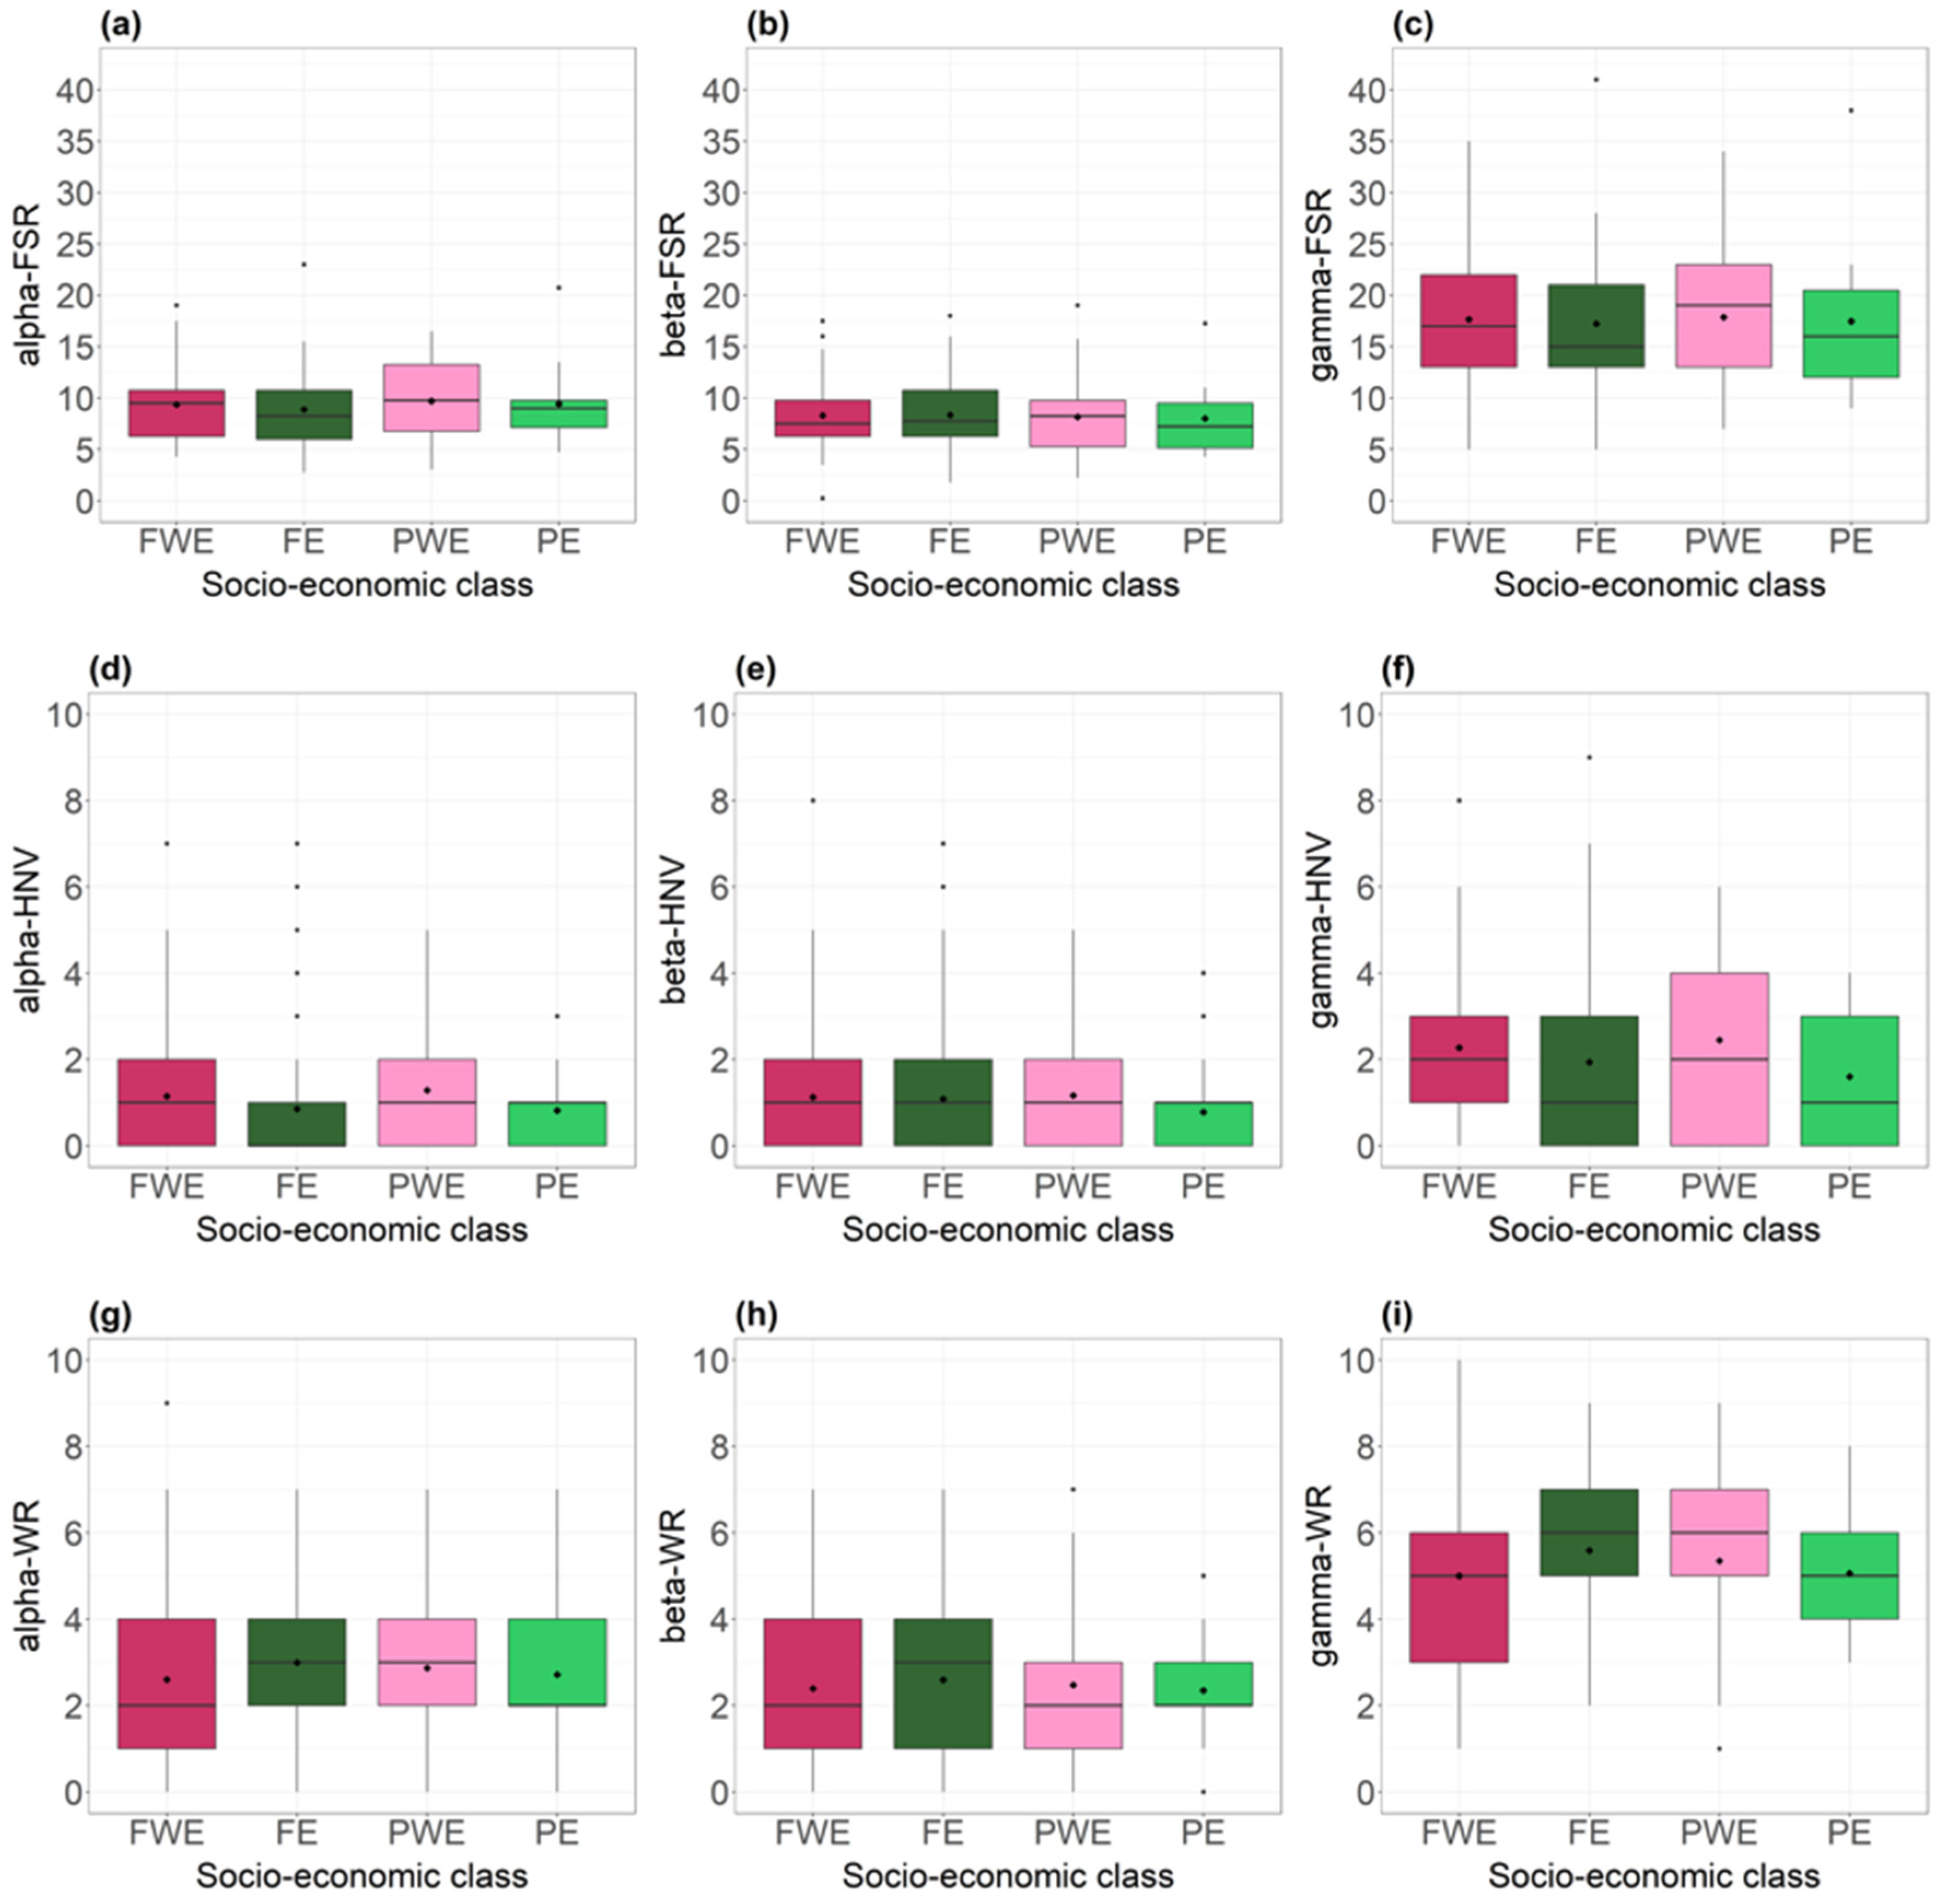
3.3. Vegetation Characteristics and Ecological Value of Horse Farms’ Grasslands

Figure 2 and Figure 3 present the distribution of all vegetation variables for each of the four socio-economic classes. The results of the respective three models explaining variability of vegetation characteristics in response to farm socio-economic class and farm structure are shown in Table 6 and Table 7 (significance of effects) and Supplementary Material Table S5 (model coefficients).
Farm socio-economic class showed very little relationship with vegetation characteristics. Including the effect of agricultural education improved the AICc of the models predicting alpha-HNV, gamma-HNV and Sørensen index. The presence of such education had a negative coefficient for all three variables, but the effect was never significant at p < 0.05. Neither income type nor its interaction with agricultural education were retained in any model. When farm structure or grassland management variables were added to the models, an effect of agricultural education was only retained in the model for the Sørensen index.
Several of the farm structure variables were related to vegetation structure. The proportion of agricultural area used by horses was associated with the largest number of vegetation parameters. An increasing proportion was related to increases in YS Forbs, alpha- and gamma diversity of FSR, HNV and WR and beta-diversity of HNV. Gamma-HNV decreased with number of horses kept, but increased with grassland area. Finally, a greater labour force was associated with a smaller YS Forbs.
Grassland management was also related to differences in grassland structure. Paddocks that were not only grazed, but also mown, had a significantly smaller YS Forbs than paddocks exclusively grazed. Alpha-FSR and alpha-WR were also decreased, but alpha-HNV remained unaffected. Similarly, the collection of dung was related to smaller alpha-FSR and alpha-WR without affecting alpha-HNV. By contrast, reseeding decreased YS Forbs and alpha-HNV, with no effect on alpha-WR. Topping was associated with a decreased Sørensen index, and rolling with greater alpha-WR.

4. Discussion

The relationship between socio-economic determinants in the equine sector and the vegetation characteristics in horse grazed grasslands has not been analysed so far. Collecting data on 122 horse farms in Germany, we found that farm structure was highly variable with differences between socio-economic classes based on farm income type and farm managers’ education. Vegetation was related both to farm structure and grassland management, but not to socio-economic class.

4.1. Variability of Farm Structure across Socio-Economic Classes (H1)

We hypothesised that income type and agricultural education of the farm manager help to explain the variability in farm structure observed in horse farms (H1). The results confirm the great variability among horse farms that has been previously reported [7,28,41]. Farm size varied between 1.1 and 245 hectares, number of horses per farm from 1.8 LU to 200 LU, farms purchased between 0% and 100% of the roughage needed by horses and used between 13% and 100% of their land with horses. The agricultural area used by horses is almost exclusively grassland while the area of arable land to produce fodder for horses is negligible. This was also shown by the strong correlation between the proportion of grassland and the proportion of agricultural land used by horses (Pearson’s r = 0.857), which led us to exclude the proportion of grassland from further analysis to avoid multicollinearity.
The four socio-economic classes partly explained the variability in farm structure we defined based on income type and agricultural education. Full-time farms had a greater labour force, more horses and a larger grassland area than part-time farms. Full-time farms with agricultural education (FE) used the smallest proportion of their agricultural area for horses among the four classes. Farms belonging to this class are typically more conventional agricultural farms for which horse keeping serves as an extension of agricultural production [42]. Resulting from cluster analyses, other studies named this type of horse farms ‘diversified traditional horse farms’ [43] or ‘diversified horse keeping’ [28].
Full-time farms without agricultural education (FWE) represent typical commercial horse farms with a main focus on horses, as farm managers’ education is often horse-orientated, including, e.g., training, breeding and professional equine sports [28,43]. These farms use a high proportion of their agricultural area for horses, in combination with a large number of horses, greater labour force, higher proportion of fodder purchased and smaller grassland area available. Zasada et al. [43] classified farms for professional horse keeping either as ‘intensive equine service’ or as ‘extensive horse-oriented farms’, Hölker et al. [28] subdivide horse-centred farming into ‘pension horse keeping’ and ‘stud horse husbandry for breeding’, according to the farm’s orientation.
A smaller labour force is characteristic of part-time farms [23,28,43]. The number of horses and the grassland area per farm were also smaller. Similar to the full-time farms a large proportion of the area was used with horses, showing that these farms are strongly horse-orientated. Only the purchase of additional roughage differed depending on education, with a larger proportion purchased by farmers without agricultural education, confirming that many horse owners do not produce their own forage [7].
In contrast to the studies of Zasada et al. [43] and Hölker et al. [28], we did not include hobby farming in our study. However, hobby horse keeping is of great importance, especially regarding grassland utilisation [5,11,13,26,28,43]. Hobby farms differ even more from conventional agricultural farms, not only because of their small-scale farm structure [5,28,43]. This suggest that by including hobby horse keeping in future studies, the variability among horse farms could be even more pronounced.

4.2. Socio-Economic Class Explaining Grassland Management (H2)

The variability of income type and farm managers’ agricultural education contributed little to explaining grassland management, leading us to reject hypothesis H2. Except for reseeding, which was more common on full-time than on part-time farms, no significant effect of income type and farm managers’ education was found. Reseeding was significantly related to income type, with less reseeding of paddocks which are used by farms with a secondary income.
In particular, nitrogen fertilisation must be taken into account when considering plant species diversity. Farm managers’ education remained in the models explaining whether mineral or organic fertiliser was applied, but the relationships were not significant.
We chose income type and farm managers’ education as explanatory variables as they capture aspects in which horse farms may be most distinct from other types of farming and which potentially can affect grassland management. Compared to other farming businesses, part-time farming is more common [24] and education about grassland management less frequent in horse farms [5,7,25]. Nevertheless, many factors can be used to describe horse farms, resulting in different types [28,43]. We conclude that more research is needed to identify which socio-economic determinants best predict farm structure and grassland management within horse farms. Furthermore, farm managers’ attitudes and motivations towards grassland management could be assessed across farm types [44].

4.3. Relationship of Farm Socio-Economic Class with Vegetation Characteristics and Ecological Value of Horse Farms’ Grasslands (H3 and H4)

We hypothesised that income type and farm managers’ agricultural education would be related to grassland vegetation characteristics, and that this relationship might be either direct or mediated by farm structure or grassland management (H3). More specifically, we expected grassland of part-time farms and grassland managed by farmers without agricultural education to have a reduced ecological value (H4). Contrary to these expectations, neither income type nor agricultural education was significantly related to any of the vegetation parameters. This was the case both when testing for direct effects only, by including either farm structure (Table 6b) or grassland management (Table 7) in the models, and when testing for direct and indirect effects together by including income type and agricultural education alone (Table 6a).
We thus found no evidence that part-time farming or lack of agricultural education were related to loss of forb species richness, reduced richness in HNV species or increased occurrence of weedy species. In debates about the ecological value of horse grazing, raised by land-use conflicts in peri-urban regions and observations of degradated swards, such incidences are often linked to a lack of agricultural professionalism of horse farms and a lack of knowledge in grassland management. Our results do not support this imputation but rather suggest that even under these conditions, horse farms have the potential to contribute positively to grassland ecological value.

4.4. The Role of Grassland Management for Vegetation Characteristics (H3)

In contrast to income type and farmers’ agricultural education, several management factors affected one or more of the vegetation characteristics included in this study, namely collecting dung, reseeding, rolling, topping and mowing.
Collecting dung is a typical grassland maintenance practice of horse owners, especially if commercial issues of horse-keeping are less central, as evidenced by the numerically higher occurrence on paddocks of part-time farms. It is primarily practiced to improve pasture hygiene, but also to reduce the area of ungrazed patches that are avoided because of the presence of dung. Both grazing avoidance and nutrient transfer through dung [45] lead to a distinct structure and botanical composition of ungrazed patches [12,16], and the consequently higher floristic contrast on paddocks benefits species richness [17]. This is in line with our findings that collecting dung was related to a lower number of forb species (alpha-FSR) and WR species (alpha-FSR) at paddock-scale. However, it did not decrease the floristic contrast between grazed and avoided patches (Sørensen index).
Topping is a pasture maintenance practice used to increase sward quality after grazing and to remove standing biomass from ungrazed areas. It can therefore be expected to result in a more homogeneous sward. Contrary to this expectation, we found that topping was associated with an increased floristic contrast (i.e., a lower value of the Sørensen index). This may be because intensive management is more frequently applied on those paddocks that are perceived as being more heterogeneous. This can also explain the positive relationship between rolling and alpha-WR, because paddocks with more weed species may be rolled more often as a weed management practice. Reseeding is a further practice to affect botanical composition. Its aim is to reduce the proportion of weeds and increase the proportion of productive forage plants, mainly grasses. In line with these aims, reseeding was related to a lower yield share of forbs. At the same time, it was not associated with a smaller number of WR species, but rather with a decreased richness in HNV species (alpha-HNV), and thus the only practice we identified as significantly reducing ecological value.
Besides grassland management practices maintaining sward quality, mowing of pastures for fodder production was strongly related to vegetation composition and species richness. The paddocks used for mowing in addition to grazing had significantly reduced YS Forbs, alpha-FSR, alpha-WR species and a trend (p < 0.1) towards decreased HNV species number on paddock level. This result highlights the critical effect of horse grazing for heterogeneity of pastures and ecological value. In contrast to other studies [46], the presence or absence of fertilisation was not related to any of the vegetation parameters.

4.5. The Role of Farm Structure for Grassland Vegetation Characteristics

Species richness at paddock (alpha-FSR) and farm (gamma-FSR) level were positively related to the proportion of area used by horses on the farm. The same was true for the occurrence of HNV at both scales (alpha-, gamma-HNV) and additionally for the difference between paddocks (beta-HNV). The results thus highlight the importance of horse farms for biodiversity conservation strategies, as found in previous studies [7,15,16,17,47].
It can further be assumed that stocking rate might be important for species richness, as numbers of HNV species were positively related to increasing grassland area and negatively related to the number of horses on the farm. However, farm-scale stocking rate may bear little relationship to stocking rates of individual paddocks. Fleurance et al. [47] did not find an influence of stocking rate on the number of plant species, yet stocking rate was nevertheless relevant for heterogeneity and plant species abundance in horse-grazed grasslands. In general, the effect of grazing intensity on plant diversity should be considered, as adequate grazing pressure was found to be important for plant diversity of different horse-used pasture types in another investigation [15].
Our study showed that taking farm structure into account leads to a better understanding of the grassland use of horse farms and grassland vegetations status. Therefore, socio-economic determinants as basic factors of farm management decisions should be considered additionally to grassland management and environmental site conditions in an integrated approach for sustainable ecosystem development.

5. Conclusions

Grazing with horses is discussed controversially. Several studies have highlighted the potential of horse grazing for maintaining species richness [7,16,17,18,48]. However, part time farming and grassland managers without agricultural education play an important role in the equine sector and have been associated with poor grassland management. For the first time, we link socio-economic determinants to vegetation composition of horse-grazed grassland in order to better understand the driving forces behind grassland management of horse farms. The study presented here confirmed that socio-economic determinants of horse farms are important for farming decisions at different scales. In particular, farm size, labour force and the proportion of agricultural area used for horses affected abundance or species richness of forbs, including HNV indicator species.
Contrary to expectations, income type or agricultural education had limited effects on grassland management and affected vegetation characteristics neither directly nor indirectly. Consequently, these two socio-economic categories should not be considered as particularly important for maintaining grassland biodiversity and improving sustainability in horse husbandry. In particular, farm managers without agricultural education should not be disregarded when pursuing biodiversity aims.
However, there is substantial variation in farm structure among farms and grassland management at the paddock level, which clearly affects vegetation characteristics. This variability offers scope for improving the ecological value of horse-grazed grassland. To realise the biodiversity potential provided by horse farms, grassland-specific education and extension of horse farmers remains crucial, but this need exists independent of income type or agricultural education background.
Therefore, our results suggest that strategies targeting the development of sustainable grassland management in horse keeping need to integrate socio-economic determinants but that additional efforts are necessary to identify further socio-economic drivers that are associated with high ecological value of horse-grazed grasslands.

Supplementary Materials

The following are available online at https://www.mdpi.com/2071-1050/12/24/10641/s1, Figure S1: Examples of photographic botanical documentation of vegetation found on plots; Table S1: Standardised data sheet assessing farm structure data; Table S2: Standardised data sheet assessing grassland management data; Table S3: Standardised data sheet assessing vegetation data; Table S4: Species list according to variable “Weeds and Ruderals” (WR); Table S5: Regression coefficients of models: (a) socio-economic class explaining farm characteristics, grassland management and vegetation characteristics (only target variables with socio-economic parameters remaining in model are shown), (b) socio-economic class and farm structure data explaining vegetation characteristics and (c) socio-economic class and grassland maintenance practices explaining vegetation characteristics; Table S6: Data analysed in this study.

Author Contributions

Conceptualization, C.F.H., A.S. and J.I.; methodology, A.S., J.I., C.F.H.; formal analysis, C.F.H., B.T.; investigation, A.S., J.I.; resources, J.I.; data curation, C.F.H.; writing-original draft preparation, C.F.H.; writing-review and editing, C.F.H., A.S., B.T., J.I.; visualisation, C.F.H.; supervision, A.S., J.I.; project administration, A.S., J.I. All authors have read and agreed to the published version of the manuscript.

Funding

Bettina Tonn’s work was funded through the European Union Horizon 2020 Research and Innovation programme; Grant Agreement 774124, SUPER-G (Developing SUstainable PERmanent Grassland systems and policies). The research received no further external funding.

Acknowledgments

We gratefully thank all farmers involved in our studies for their participation and interest in our research. We thank all students of the Faculty of Agriculture at the University of Göttingen who collected data for their work.

Conflicts of Interest

The authors declare no conflict of interest.

References

  1. Isselstein, J.; Jeangros, B.; Pavlu, V. Agronomic aspects of biodiversity targeted management of temperate grasslands in Europe—A review. Agron. Res. 2005, 3, 139–151. [Google Scholar]
  2. Gossner, M.M.; Lewinsohn, T.M.; Kahl, T.; Grassein, F.; Boch, S.; Prati, D.; Birkhofer, K.; Renner, S.C.; Sikorski, J.; Wubet, T.; et al. Land-use intensification causes multitrophic homogenization of grassland communities. Nature 2016, 540, 266–269. [Google Scholar] [CrossRef]
  3. Rook, A.J.; Dumont, B.; Isselstein, J.; Osoro, K.; WallisDeVries, M.F.; Parente, G.; Mills, J. Matching type of livestock to desired biodiversity outcomes in pastures—A review. Biol. Conserv. 2004, 119, 137–150. [Google Scholar] [CrossRef]
  4. Tälle, M.; Deák, B.; Poschlod, P.; Valkó, O.; Westerberg, L.; Milberg, P. Grazing vs. mowing: A meta-analysis of biodiversity benefits for grassland management. Agric. Ecosyst. Environ. 2016, 222, 200–212. [Google Scholar] [CrossRef]
  5. Schmitz, A.; Isselstein, J. Wieviel Grünland wird in Deutschland für Pferde genutzt? Versuch einer Quantifizierung anhand von Bestands-und Praxisdaten. Ber. Über Landwirtsch. Z. Agrarpolit. Landwirtsch. 2018, 96, 1–31. [Google Scholar]
  6. Liljenstolpe, C. Horses in Europe. Available online: http://www.wbfsh.org/files/eu%20equus%202009.pdf (accessed on 3 October 2020).
  7. Jouven, M.; Vial, C.; Fleurance, G. Horses and rangelands: Perspectives in Europe based on a French case study. Grass Forage Sci. 2016, 71, 178–194. [Google Scholar] [CrossRef]
  8. Bruinenberg, M.H.; Geerts, R.; Struik, P.C.; Valk, H.; Struik, P.C. Dairy cow performance on silage from semi-natural grassland. NJAS Wagening. J. Life Sci. 2006, 54, 95–110. [Google Scholar] [CrossRef] [Green Version]
  9. Dillon, P. Achieving high dry-matter intake from pasture with grazing dairy cows. In Fresh Herbage for Dairy Cattle: The Key to a Sustainable Food Chain; Elgersma, A., Dijkstra, J., Tamminga, S., Eds.; Springer: Dordrecht, The Netherlends, 2006; pp. 1–26. ISBN 978-1-4020-5451-8. [Google Scholar]
  10. Putfarken, D.; Dengler, J.; Lehmann, S.; Härdtle, W. Site use of grazing cattle and sheep in a large-scale pasture landscape: A GPS/GIS assessment. Appl. Anim. Behav. Sci. 2008, 111, 54–67. [Google Scholar] [CrossRef] [Green Version]
  11. Younge, B.; Vial, C. Socio-economic impact of horse production on rural areas: A comparison between Ireland and France. In Forages and Grazing in Horse Nutrition; Saastamoinen, M., Fradinho, M.J., Santos, A.S., Miraglia, N., Eds.; Wageningen Academic Publishers: Wageningen, The Netherlends, 2012; pp. 453–465. ISBN 978-90-8686-755-4. [Google Scholar]
  12. Menard, C.; Duncan, P.; Fleurance, G.; Georges, J.-Y.; Lila, M.; Menard, C.; Duncan, P.; Fleurance, G.; Georges, J.-Y.; Lila, M. Comparative foraging and nutrition of horses and cattle in European wetlands. J. Appl. Ecol. 2002, 39, 120–133. [Google Scholar] [CrossRef] [Green Version]
  13. Sutherland, L.-A.; Barlagne, C.; Barnes, A.P. Beyond ‘Hobby Farming’: Towards a typology of non-commercial farming. Agric. Hum. Values 2019, 36, 475–493. [Google Scholar] [CrossRef] [Green Version]
  14. Bundesamt für Naturschutz. Erfassungsanleitung für den HNV-Farmland-Indikator. 2016. Available online: https://www.bfn.de/fileadmin/BfN/monitoring/Dokumente/Erfassungsanleitung_HNV_V8_2017_06.04_neu_barrfrei.pdf (accessed on 4 October 2020).
  15. Saastamoinen, M.; Herzon, I.; Särkijärvi, S.; Schreurs, C.; Myllymäki, M. Horse welfare and natural values on semi-natural and extensive pastures in Finland: Synergies and trade-offs. Land 2017, 6, 69. [Google Scholar] [CrossRef] [Green Version]
  16. Fleurance, G.; Edouard, N.; Collas, C.; Duncan, P.; Farruggia, A.; Baumont, R.; Lecomte, T.; Dumont, B. How do horses graze pastures and affect the diversity of grassland ecosystems? In Forages and Grazing in Horse Nutrition; Saastamoinen, M., Fradinho, M.J., Santos, A.S., Miraglia, N., Eds.; Wageningen Academic Publishers: Wageningen, The Netherlends, 2012; pp. 147–161. ISBN 978-90-8686-755-4. [Google Scholar]
  17. Schmitz, A.; Isselstein, J. Effect of grazing system on grassland plant species richness and vegetation characteristics: Comparing horse and cattle grazing. Sustainability 2020, 12, 3300. [Google Scholar] [CrossRef] [Green Version]
  18. Garrido, P.; Mårell, A.; Öckinger, E.; Skarin, A.; Jansson, A.; Thulin, C.-G. Experimental rewilding enhances grassland functional composition and pollinator habitat use. J. Appl. Ecol. 2019, 56, 946–955. [Google Scholar] [CrossRef]
  19. Dorresteijn, I.; Loos, J.; Hanspach, J.; Fischer, J. Socioecological drivers facilitating biodiversity conservation in traditional farming landscapes. Ecosyst. Health Sustain. 2015, 1, 1–9. [Google Scholar] [CrossRef]
  20. Van Oudenhoven, A.; Martín-López, B.; Schröter, M.; de Groot, R. Advancing science on the multiple connections between biodiversity, ecosystems and people. Int. J. Biodivers. Sci. Ecosyst. Serv. Manag. 2018, 14, 127–131. [Google Scholar] [CrossRef]
  21. Forester, D.J.; Machlist, G.E. modeling human factors that affect the loss of biodiversity. Conserv. Biol. 1996, 10, 1253–1263. [Google Scholar] [CrossRef]
  22. Haberl, H.; Gaube, V.; Díaz-Delgado, R.; Krauze, K.; Neuner, A.; Peterseil, J.; Plutzar, C.; Singh, S.J.; Vadineanu, A. Towards an integrated model of socioeconomic biodiversity drivers, pressures and impacts. A feasibility study based on three European long-term socio-ecological research platforms. Ecol. Econ. 2009, 68, 1797–1812. [Google Scholar] [CrossRef] [Green Version]
  23. Statistisches Bundesamt. Rechtsformen und Erwerbscharakter-Agrarstrukturerhebung: Fachserie 3 Reihe 2.1.5. 2016. Available online: https://www.destatis.de/DE/Themen/Branchen-Unternehmen/Landwirtschaft-Forstwirtschaft-Fischerei/Landwirtschaftliche-Betriebe/Publikationen/Downloads-Landwirtschaftliche-Betriebe/rechtsformen-erwerbscharakter-2030215169004.pdf?__blob=publicationFile (accessed on 29 September 2020).
  24. Statistisches Bundesamt. Landwirtschaftliche Berufsbildung der Betriebsleiter/Geschäftsführer—Landwirtschaftszählung/Agrarstrukturerhebung 2010: Fachserie 3 Heft 1. 2010. Available online: https://www.destatis.de/DE/Themen/Branchen-Unternehmen/Landwirtschaft-Forstwirtschaft-Fischerei/Landwirtschaftliche-Betriebe/Publikationen/Downloads-Landwirtschaftliche-Betriebe/landwirtschaftliche-berufsbildung-2032801109004.pdf?__blob=publicationFileb (accessed on 29 September 2020).
  25. Rzekęć, A.; Vial, C.; Bigot, G. Green assets of equines in the European context of the ecological transition of agriculture. Animals 2020, 10, 106. [Google Scholar] [CrossRef] [Green Version]
  26. Bomans, K.; Dewaelheyns, V.; Gulinck, H. Pasture for horses: An underestimated land use class in an urbanized and multifunctional area. Int. J. Sustain. Dev. Plan. 2011, 6, 195–211. [Google Scholar] [CrossRef] [Green Version]
  27. Ikinger, C.; Münch, C.; Wiegand, K.; Spiller, A. Studie Reiterleben|Reiterwelten Zielgruppen Zwischen Reitweisen, Motiven und der Liebe zum Pferd. Available online: https://www.uni-goettingen.de/de/document/download/1988e74b5e6a7bf92bf38381a71a47f0.pdf/2013-04%20reitsportstudie_screen.pdf (accessed on 3 October 2020).
  28. Hölker, S.; Wiegand, K.; Spiller, A.; Münch, C. Typologie der deutschen pferdehaltung eine empirische studie mittels two-step-clusteranalyse. Ber. Über Landwirtsch. Z. Agrarpolit. Landwirtsch. 2016. [Google Scholar] [CrossRef]
  29. Hammer, M.; Bonow, M.; Petersson, M. The role of horse keeping in transforming peri-urban landscapes: A case study from metropolitan Stockholm, Sweden. Nor. Geogr. Tidsskr. Nor. J. Geogr. 2017, 71, 146–158. [Google Scholar] [CrossRef]
  30. BMELV. Leitlinien zur Beurteilung von Pferdehaltungen unter Tierschutzgesichtspunkten. Available online: https://www.bmel.de/SharedDocs/Downloads/DE/_Tiere/Tierschutz/Gutachten-Leitlinien/HaltungPferde.pdf;jsessionid=59847675224D927099B45D2603403AA2.internet2831?__blob=publicationFile&v=3 (accessed on 5 October 2020).
  31. Blumöhr, T.; Brandl, M.; Breitenfeld, J.; Dahl, S.; Führer, J.; Gabka, D.; Haffmans, C.; Heinze, S.; Kraft, M.; Schaber, J.; et al. Agrarstrukturen in Deutschland—Einheit in Vielfalt: Regionale Ergebnisse der Landwirtschaftszählung 2010. Available online: https://www.destatis.de/DE/Themen/Branchen-Unternehmen/Landwirtschaft-Forstwirtschaft-Fischerei/Landwirtschaftliche-Betriebe/Publikationen/Downloads-Landwirtschaftliche-Betriebe/agrarstrukturen-in-deutschland-5411203109004.pdf?__blob=publicationFile (accessed on 29 September 2020).
  32. Whittaker, R.H. Evolution of species diversity in land communities. Evol. Biol. 1977, 10, 1–67. [Google Scholar]
  33. Dierschke, H.; Briemle, G. Kulturgrasland. Wiesen, Weiden und verwandte Staudenfluren; Ulmer: Stuttgart, Germany, 2008; ISBN 978-3-8001-5641-2. [Google Scholar]
  34. Elsäßer, M.; Engel, S.; Roßberg, R. DLG Merkblatt 375: Problem-Unkräuter im Grünland. Beschreibung und Integrierte Maßnahmen; DLG e.V. Fachzentrum Land- und Ernährungswirtschaft: Frankfurt am Main, Germany, 2010; Available online: https://www.dlg.org/fileadmin/downloads/landwirtschaft/themen/publikationen/merkblaetter/dlg-merkblatt_357.pdf (accessed on 29 September 2020).
  35. Magurran, A.E. Measuring Biological Diversity, 1st ed.; John Wiley & Sons: New York, NY, USA, 2013; ISBN 978-1-118-68792-5. [Google Scholar]
  36. Fox, J.; Weisberg, S. An R Companion to Applied Regression; Sage: Thousand Oaks, CA, USA, 2019. [Google Scholar]
  37. Bates, D.; Maechler, M.; Bolker, B.; Walker, S.; Christensen, R.H.B.; Singmann, H.; Dai, B.; Scheipl, F.; Grothendieck, G.; Green, P.; et al. Linear Mixed-Effects Models using ‘Eigen’ and S4. 2020. Available online: https://CRAN.R-project.org/package=lme4 (accessed on 29 September 2020).
  38. Pinheiro, J.; Bates, D.; DebRoy, S.; Sarkar, D.; R Core Team. nlme: Linear and Nonlinear Mixed Effects Models. 2018. Available online: https://cran.r-project.org/web/packages/nlme/nlme.pdf (accessed on 29 September 2020).
  39. Bartoń, K. MuMIn: Multi-Model Inference. 2019. Available online: https://cran.r-project.org/web/packages/MuMIn/MuMIn.pdf (accessed on 29 September 2020).
  40. Lenth, R.; Singmann, H.; Love, J.; Buerkner, P.; Herve, M. emmeans: Estimated Marginal Means, aka Least-Squares. 2018. Available online: https://cran.r-project.org/web/packages/emmeans/emmeans.pdf (accessed on 29 September 2020).
  41. Hölker, S.; Wiegand, K.; Münch, C.; Spiller, A. Pferdehaltung Heute Eine Strukturdatenerfassung Pferdehaltender Betriebe in Deutschland; Georg-August-Universität Göttingen & HorseFuturePanel UG: Göttingen, Germany, 2017. [Google Scholar]
  42. Bailey, A.; Williams, N.; Palmer, M.; Geering, R. The farmer as service provider: The demand for agricultural commodities and equine services. Agric. Syst. 2000, 66, 191–204. [Google Scholar] [CrossRef]
  43. Zasada, I.; Berges, R.; Hilgendorf, J.; Piorr, A. Horsekeeping and the peri-urban development in the Berlin Metropolitan Region. J. Land Use Sci. 2013, 8, 199–214. [Google Scholar] [CrossRef]
  44. Becker, T.; Kayser, M.; Tonn, B.; Isselstein, J. How German dairy farmers perceive advantages and disadvantages of grazing and how it relates to their milk production systems. Livest. Sci. 2018, 214, 112–119. [Google Scholar] [CrossRef]
  45. Loucougaray, G.; Bonis, A.; Bouzillé, J.-B. Effects of grazing by horses and/or cattle on the diversity of coastal grasslands in western France. Biol. Conserv. 2004, 116, 59–71. [Google Scholar] [CrossRef]
  46. Klimek, S.; Kemmermann, A.R.G.; Hofmann, M.; Isselstein, J. Plant species richness and composition in managed grasslands: The relative importance of field management and environmental factors. Biol. Conserv. 2007, 134, 559–570. [Google Scholar] [CrossRef]
  47. Fleurance, G.; Dumont, B.; Farruggia, A. How does stocking rate influence biodiversity in a hill-range pasture continuously grazed by horses? In Grassland in a Changing World, Proceedings of the 23th General Meeting of the European Grassland Federation, Kiel, Germany, 29 August–2 September 2010; Schnyder, H., Ed.; Mecke Druck und Verlag: Duderstadt, Germany, 2010; pp. 1043–1045. ISBN 978-3-86944-021-7. [Google Scholar]
  48. Köhler, M.; Hiller, G.; Tischew, S. Year-round horse grazing supports typical vascular plant species, orchids and rare bird communities in a dry calcareous grassland. Agric. Ecosyst. Environ. 2016, 234, 48–57. [Google Scholar] [CrossRef]
Figure 1. Location of horse farms included in the study in Germany according to socio-economic class (FWE = full-time business without agricultural education, FE = full-time business with agricultural education, PWE = part-time business without agricultural education, PE = part-time business with agricultural education).
Sustainability 12 10641 g001
Figure 2. (a) Average yield share of forbs (YS Forbs (%)) per paddock and (b) Sørensen index, representing floristic contrast per paddock, depending on socio-economic class (FWE = full-time business without agricultural education, FE = full-time business with agricultural education, PWE = part-time business without agricultural education, PE = part-time business with agricultural education). Boxplots represent median, 1st and 3rd quartiles, outliers and mean (diamond).
Sustainability 12 10641 g002
Figure 3. Vegetation characteristics of paddocks grazed by horses depending on socio-economic class (FEW = full-time business without agricultural education, FE = full-time business with agricultural education, PWE = part-time business without agricultural education, PE = part-time business with agricultural education). (ac) Forb species richness (FSR) at paddock level (alpha-FSR), farm level (gamma-FSR) and between paddocks (beta-FSR); (df) High-Nature-Value species richness (HNV) at paddock level (alpha-HNV), farm level (gamma-HNV) and between paddocks (beta-HNV); (gi) weed and ruderal species richness (WR) at paddock level (alpha-WR), farm level (gamma-WR) and between paddocks (beta-WR). Boxplots represent median, 1st and 3rd quartiles, outliers and mean (diamond).
Sustainability 12 10641 g003
Table 1. Number of farms included in the study, classified according to socio-economic class (income type and farm managers’ education).
Agricultural Education
Income TypeWithout
(WE)
With
(E)
Total
Full-time business (F)294978
Part-time business (P)291544
Total5864122
Table 2. Farm structure depending on the socio-economic class of horse farms involved in the study (FWE = full-time business without agricultural education, FE = full-time business with agricultural education, PWE = part-time business without agricultural education, PE = part-time business with agricultural education).
VariableSocio-Economic ClassMeansdMinMax
Grassland area (ha)FWE30.638.32.3200.0
FE53.250.42.0245.0
PWE22.239.41.1192.0
PE19.019.41.565.0
Proportion grassland/
agricultural area
FWE0.9250.1640.3151
FE0.5360.3430.0211
PWE0.8150.2610.2341
PE0.8250.3100.1331
Agricultural area used for horses (ha)FWE29.546.01.6250.0
FE40.238.31.8180.0
PWE20.639.01.1192.0
PE15.616.41.555.0
Proportion horse-used/
agricultural area
FWE0.8570.2500.1401
FE0.4450.3610.0191
PWE0.7580.2930.1951
PE0.7460.3340.1331
Additional purchase of total
roughage requirement (%)
FWE44.841.60.0100.0
FE11.122.90.0100.0
PWE32.036.20.0100.0
PE9.517.00.050.0
Horses (LU) FWE45.835.010.2160.0
FE53.140.93.3200.0
PWE15.517.61.872.5
PE17.311.13.443.7
Labour forceFWE4.04.01.018.0
FE2.91.81.012.0
PWE1.40.70.53.0
PE1.10.60.22.3
LU = livestock unit (1 LU = 500 kg live weight).
Table 3. Farm socio-economic class (I = income type, E = education) as explanatory variables on farm structure data variables. Grassland area (ha), proportion of area used by horses (proportion horse-used/agricultural area), additional purchase of total roughage requirement (%), horses (LU) and labour force were tested as target variables. Missing values represent explanatory variables not remaining in model after model selection. Significance levels (p) were obtained by global test (z-statistics). Significant variables at p < 0.05 are shown in bold. Model coefficients shown in Supplementary Material Table S5.
Grassland Area (ha)Proportion Horse-Used/
Agricultural Area
Additional Purchase of Total Roughage Requirement (%)Horses
(LU)
Labour
Socio-
Economic Class
FpFpFpFpFp
Income type14.76<0.0010.950.33--45.77<0.00164.62<0.001
Education4.780.0323.33<0.00112.90<0.001--3.060.08
I × E--9.820.002------
Table 4. Fertilisation and grassland maintenance practices according to farm socio-economic class (FWE = full-time business without agricultural education, FE = full-time business with agricultural education, PWE = part-time business without agricultural education, PE = part-time business with agricultural education). Values represent percentage (%) of all paddocks within a socio-economic class on which fertilisation or the respective maintenance practice is carried out.
FertilisationFWEFEPWEPE
Mineral fertiliser52.666.862.963.3
Organic fertiliser29.342.931.040.0
Grassland maintenance practiceFWEFEPWEPE
Collecting dung10.35.631.915.0
Herbicides14.716.39.520.0
Topping55.276.568.176.7
Topping + cuttings removal8.615.312.913.3
Reseeding58.661.730.238.3
Harrowing79.389.388.891.7
Rolling27.629.135.353.3
Table 5. Farm socio-economic class (I = income type, E = education) as explanatory variable for fertilisation and grassland maintenance practices. Presence of mineral and organic fertiliser application, collecting horse dung, herbicide application, topping, topping with removal of cuttings, reseeding, harrowing and rolling were tested as target variables. Missing values represent explanatory variables not remaining in the model after model selection. Significance levels (p) were obtained by global test (z-statistics). Significant variables at p < 0.05 are shown in bold. Model coefficients are shown in Supplementary Material Table S5.
Mineral FertiliserOrganic FertiliserCollecting DungHerbi-cidesToppingTopping
+ Cutting
Removal
ReseedingHarrowingRolling
Socio-
Economic Class
ChipChipChipChipChipChipChipChipChip
Income type------------35.66<0.001----
Education20.162.270.13--------------
I × E------------------
Table 6. Results of models explaining vegetation characteristics as target variables using (a) socio-economic class (I × E = interaction income type/agricultural education) and (b) socio-economic class and farm structure data (proportion horse area = proportion horse-used/agricultural area, purchase = additional purchase (%) of total roughage requirement) as explanatory variables. Missing values represent explanatory variables not remaining in the model after model selection. Significance levels (p) were obtained by global test (z-statistics). Significant variables at level p < 0.05 are shown in bold. Model coefficients shown in Supplementary Material Table S5.
YS ForbsAlpha-
FSR
Beta-
FSR
Gamma-
FSR
Alpha-
HNV
Beta-
HNV
Gamma-
HNV
Alpha-
WR
Beta-
WR
Gamma-
WR
Sørensen
Index
FpFpFpFpFpFpFpFpFpFpFp
(a) Socio-economic class
Income type----------------------
Education--------2.50.12--2.730.10------3.610.06
I × E----------- ----------
(b) Socio-economic class + farm structure data
Income type----------------------
Education--------------------3.380.07
I × E----------------------
Grassland area--3.060.08--3.020.093.620.06--4.470.03----2.790.1--
Proportion horse area3.30.074.550.04--4.250.045.660.025.590.028.430.01--------
Purchase----------------------
Horses (LU)2.130.15------5.350.02--5.350.022.350.13------
Labour4.620.03--3.090.08----------2.790.1----
Table 7. Results of models explaining vegetation characteristics as target variables using (c) socio-economic class (I × E = interaction income type/agricultural education) and grassland management at paddock level as explanatory variables. Missing values represent explanatory variables not remaining in the model after model selection. Significance levels (p) were obtained by global test (z-statistics). Significant variables at level p < 0.05 are shown in bold. Model coefficients shown in Supplementary Material Table S5.
YS ForbsAlpha-
FSR
Beta-
FSR
Gamma-
FSR
Alpha-
HNV
Beta-
HNV
Gamma-
HNV
Alpha-
WR
Beta-
WR
Gamma-
WR
Sørensen
Index
FpFpFpFpFpFpFpFpFpFpFp
(c) Socio-economic class + fertilisation + grassland management
Income type---- -- -- --
Education---- -- -- 2.250.14
I × E---- -- -- --
Fertilisation-- - -- -- --
Collecting dung3.240.077.890.01 -- 4.380.04 --
Herbicides2.810.13.120.08 -- -- --
Topping3.020.08-- 3.150.08 -- 4.180.04
Topping + cutting removal--2.890.09 3.140.08 -- --
Reseeding4.890.033.350.69 4.310.04 -- --
Harrowing---- -- -- 2.190.14
Rolling---- -- 14.18<0.001 --
Mowing21.66<0.00119.63<0.001 2.80.1 11.03<0.01 --
Publisher’s Note: MDPI stays neutral with regard to jurisdictional claims in published maps and institutional affiliations.

