Article

Results and Lessons Learned from Assessing 50 Industrial Parks in Eight Countries against the International Framework for Eco-Industrial Parks

Vienna International Centre, Department of Environment, Industrial Resource Efficiency Division, United Nations Industrial Development Organization, 1400 Vienna, Austria
*
Author to whom correspondence should be addressed.
Sustainability 2020, 12(24), 10611; https://doi.org/10.3390/su122410611
Submission received: 3 November 2020 / Revised: 15 December 2020 / Accepted: 16 December 2020 / Published: 18 December 2020
(This article belongs to the Collection Industrial Symbiosis and Sustainability)

Abstract

:
Over the past two years the United Nations Industrial Development Organization (UNIDO) assessed 50 parks in eight developing and transition countries against 51 prerequisites and performance indicators outlined in the International Framework for Eco-Industrial Parks (International EIP Framework). The eight countries covered are: Colombia, Egypt, Indonesia, Nigeria, Peru, South Africa, Ukraine, and Viet Nam. This article provides a summary of the analysis and lessons learned from the assessments of the industrial parks and their performance against the International EIP Framework. The methodology is based on assessments of the current and intended performance of the industrial parks on four key categories (park management, environmental, social, and economic), supported by a scoring method. The analysis indicates that the International EIP Framework can be regarded as a practical and relevant means to assess the performance of industrial parks, as well as a basis to identify and prioritize EIP initiatives to strengthen their performance. There is a wide range of performance among the industrial parks assessed. Higher average current performance against the International Framework can be found in Colombia (68%), Indonesia (67%), and Viet Nam (63%). Ukraine and South Africa have the highest improvement potential (27% and 25%, respectively). Across all eight countries, the environmental and social performance categories have a lower compliance (34% and 44%, respectively) compared to economic performance (72% current compliance) and park management (55% compliance). A review of the root-causes indicates that the main compliance issue for 16 prerequisites and performance indicators outlined in the International EIP Framework seems mainly with the industrial park- and country-specific conditions. There is an opportunity to refine the formulation of five prerequisites and indicators outlined in the International EIP Framework. Across all 50 parks assessed, the following topics have the lowest current compliance: energy; local community outreach; environmental and park management and monitoring; waste and material use; and climate change and the natural environment. A low compliance with specific prerequisites and performance indicators under park management, economic, environmental, and social performance indicates a need by the industrial park for technical assistance. If high-performance industrial parks exist in a country, it implies that there is capacity in the country to develop an eco-industrial park. In this scenario, technical assistance should include a stronger focus on knowledge dissemination, sharing experiences, and peer-to-peer learning between industrial parks and the regulating authorities. Industrial parks managed by public–private partnerships and the private sector show a higher average EIP performance than industrial parks managed solely by the public sector. This seems to illustrate that industrial parks perform better if they are run like a private business or public–private partnership, rather than a government-managed initiative. This article is the first academic publication discussing the results from the application of the International EIP Framework with a large number of industrial parks in multiple countries. It is hoped that this article will encourage further EIP assessments to be undertaken in more industrial parks to assist in their transformation into eco-industrial parks.

1. Introduction

There is an increasing need to decouple economic growth from resource consumption in order to meet wider social objectives as emerging economies seek to increase industrial output. The strategic planning and effective management of industrial parks are essential to achieve the desired economic, social, and environmental performance levels. The transformation of traditional industrial parks into eco-industrial parks (EIPs) presents a valuable opportunity to accomplish inclusive and sustainable industrial development and to meet Sustainable Development Goals (SDGs) and the 2030 Agenda objectives [1].
The United Nations Industrial Development Organization (UNIDO) has been advancing EIP practices in multiple countries, together with national governments and local stakeholders, as part of the Global Resource Efficient and Cleaner Production (RECP) Programme (2012–2018) [2] and currently as part of the Global Eco-Industrial Parks Programme (GEIPP, 2019–2023). The objective of the GEIPP is to demonstrate the viability and benefits of making industrial parks “greener” by improving resource productivity and the economic, environmental, and social performances of businesses, thereby contributing to inclusive and sustainable industrial development in the participating developing and transition economies. The GEIPP implements tailor-made national initiatives in seven countries: Colombia, Egypt, Indonesia, Peru, South Africa, Ukraine, and Viet Nam. Further, the GEIPP focuses on the development of specific EIP tools and on the dissemination of lessons learned from international experiences. The GEIPP strongly builds upon activities undertaken during the previous Global RECP Programme and will further advance collaborations between UNIDO and other leading international organizations working on EIPs (e.g., the World Bank Group (WBG) and the German Development Cooperation (GIZ)). The GEIPP is made possible by funding provided by the Swiss Government through the State Secretariat for Economic Affairs of Switzerland (SECO).
The overall objective of this research article is to provide a summary of the analysis and lessons learned from the assessments of 50 industrial parks in eight countries’ performance against the International Framework for Eco-Industrial Parks [3]. Specific objectives of this article are: (a) to present a comparative review of the EIP assessments scorings of all industrial parks assessed to date; (b) to analyze the practicality, relevance, and compliance levels of the prerequisites and performance indicators as outlined in International EIP Framework; (c) to indicate areas of technical assistance needs for transformation towards EIP; and (d) provide tangible conclusions and recommendations for further application and strengthening of the International EIP Framework.

2. Theoretical Framework

The idea of EIPs was first described during a presentation at the United Nations Conference on Environment and Development (UNCED) in Rio de Janeiro 1992. By early 2005, communities in Africa, Asia, Europe, South America, and the United States had initiated EIPs or other eco-industrial development planning processes. Eco-industrial parks are rooted in the application of industrial symbiosis with a spatial (place) dimension [4,5,6]. Kalundborg in Denmark is one of the most published good practice examples on the implementation of industrial symbiosis [7,8,9]. Eco-industrial development offers the potential to achieve greater efficiency by way of “economies of systems integration” [10]. Business collaborations enable the meeting of common needs of services, transportation, infrastructure, and utilities [11]. Taddeo et al. [12] notes that EIPs are a viable solution to increase the sustainability and competitiveness of existing industrial clusters, focusing on geographic and technical requirements, homogeneity and heterogeneity of industries, stakeholders and local community involvement, and regulatory systems for its success.
Multiple works have been published on the transformation of industrial parks into EIPs (for example [4,12,13,14]) as well as research focusing on specific topics within the EIP concept (e.g., industrial symbiosis, social aspects) [15,16,17,18,19,20]. Previous research over the years shows that the EIP concept and approach have evolved over time to address additional, interrelated aspects, including, for example: resource efficient and cleaner production; industrial symbiosis; climate change; pollution; social standards; shared infrastructure; improved spatial zoning; and management. It has become clear that an interdisciplinary approach is required to circumvent barriers and ensure the successful implementation and operation of EIPs.
Multiple different terminologies are used in relation to eco-industrial parks, for example low-carbon zones, sustainable industrial parks, and green industrial areas [21,22,23,24]. All terminologies commonly apply to a dedicated area for industrial development supported with park-level infrastructures and utility services that enhance business performance, while at the same time addressing technical, infrastructural, managerial, environmental, social, economic, and monitoring aspects in order to make the area more sustainable. The EIP definition of Lowe [22] is referenced by many organizations active in this area (including UNIDO): “A community of manufacturing and service businesses located together on a common property. Member businesses seek enhanced environmental, economic, and social performance through collaboration in managing environmental and resource issues”.
The kinds of economic, environmental, and social benefits emerging from EIPs vary considerably and often go beyond typical business case benefits [24,25,26]. Eco-industrial developments can be regarded as learning systems which seek multiple benefits from economic activities. For example, an integrated resource recovery system increases resource efficiencies and reduces pollution while also creating business opportunities and strengthening the local/regional economy [27]. The benefits are also strategic, leading to reduced risks and improved competitiveness and productivity, as well as an improved stakeholder reputation. The EIP concept can assist industrial parks and their tenant firms in transforming environmental challenges into business opportunities through improved resource efficiency, utilization and recycling, company collaborations, and shared infrastructures as well as utility services. In short, the EIP concept is about creating more resource-efficient and cost-effective industrial parks which are more competitive, attractive for investment, and risk resilient [28]. The Sustainable Development Goals (SDGs) make reference to inclusive and sustainable industrialization. Eco-industrial parks can serve as a catalyst to all SDGs to various extents (e.g., SDGs 5, 8, 9, 12, and 13). However, the link with EIPs is most explicitly to SDG 9, to build resilient infrastructure, promote inclusive and sustainable industrialization, and foster innovation. Moreover, SDG 9 has strong positive correlations with SDG 2 (Zero Hunger), SDG 3 (Good Health and Well-being), SDG 4 (Quality Education), and SDG 7 (Affordable and Clean Energy) [29].
Over the past two decades, multiple initiatives, good practices, and certification programs have been established to formulate standards and benchmarks which are directly and indirectly related to the EIP concept. Examples of these initiatives include: a practitioner’s handbook for low-carbon zones [21]; global assessment of eco-industrial parks in developing and emerging economies [24], guidelines for sustainable industrial areas [23]; green growth indicators [30]; a national eco-industrial park standard for promoting industrial symbiosis in China [17];a green special economic zone rating system [31]; the eco-industrial park handbook for Asian developing countries [22]; and industrial and commercial zone planning according to the requirements of sustainable development [32]. These initiatives and publications provide valuable insights and highlight key features of EIPs. However, there was still no consolidated and internationally accepted criteria or performance indicators for what constitutes an eco-industrial park prior to the joint development of the International EIP Framework by UNIDO, the World Bank Group, and the GIZ [3]. This International Framework is further discussed in Section 3.2 of this article.
An overview of existing tools related to EIPs is provided in an earlier publication by UNIDO [33]. This review of existing tools (e.g., [34,35,36,37]) showed that a limited number of practical tools customized to the development and implementation of EIPs are freely available. It was found that existing tools do not yet fully meet the specific needs of UNIDO’s EIP activities in the project countries. The approach taken by UNIDO was to develop a customized set of EIP tools and to incorporate and reference specific components of existing tools on a case-by-case basis, including the UNIDO tool discussed in this article to assess the current and intended EIP performance of industrial parks (the EIP Assessment Tool, discussed in Section 3.3 of this article).
To our knowledge, this article is the first academic publication discussing the comparative results and datasets from the practical application of the International EIP Framework [3] with a large number of industrial parks in multiple countries. This is the novelty of this article and the research gap it is filling.

3. Materials and Methods

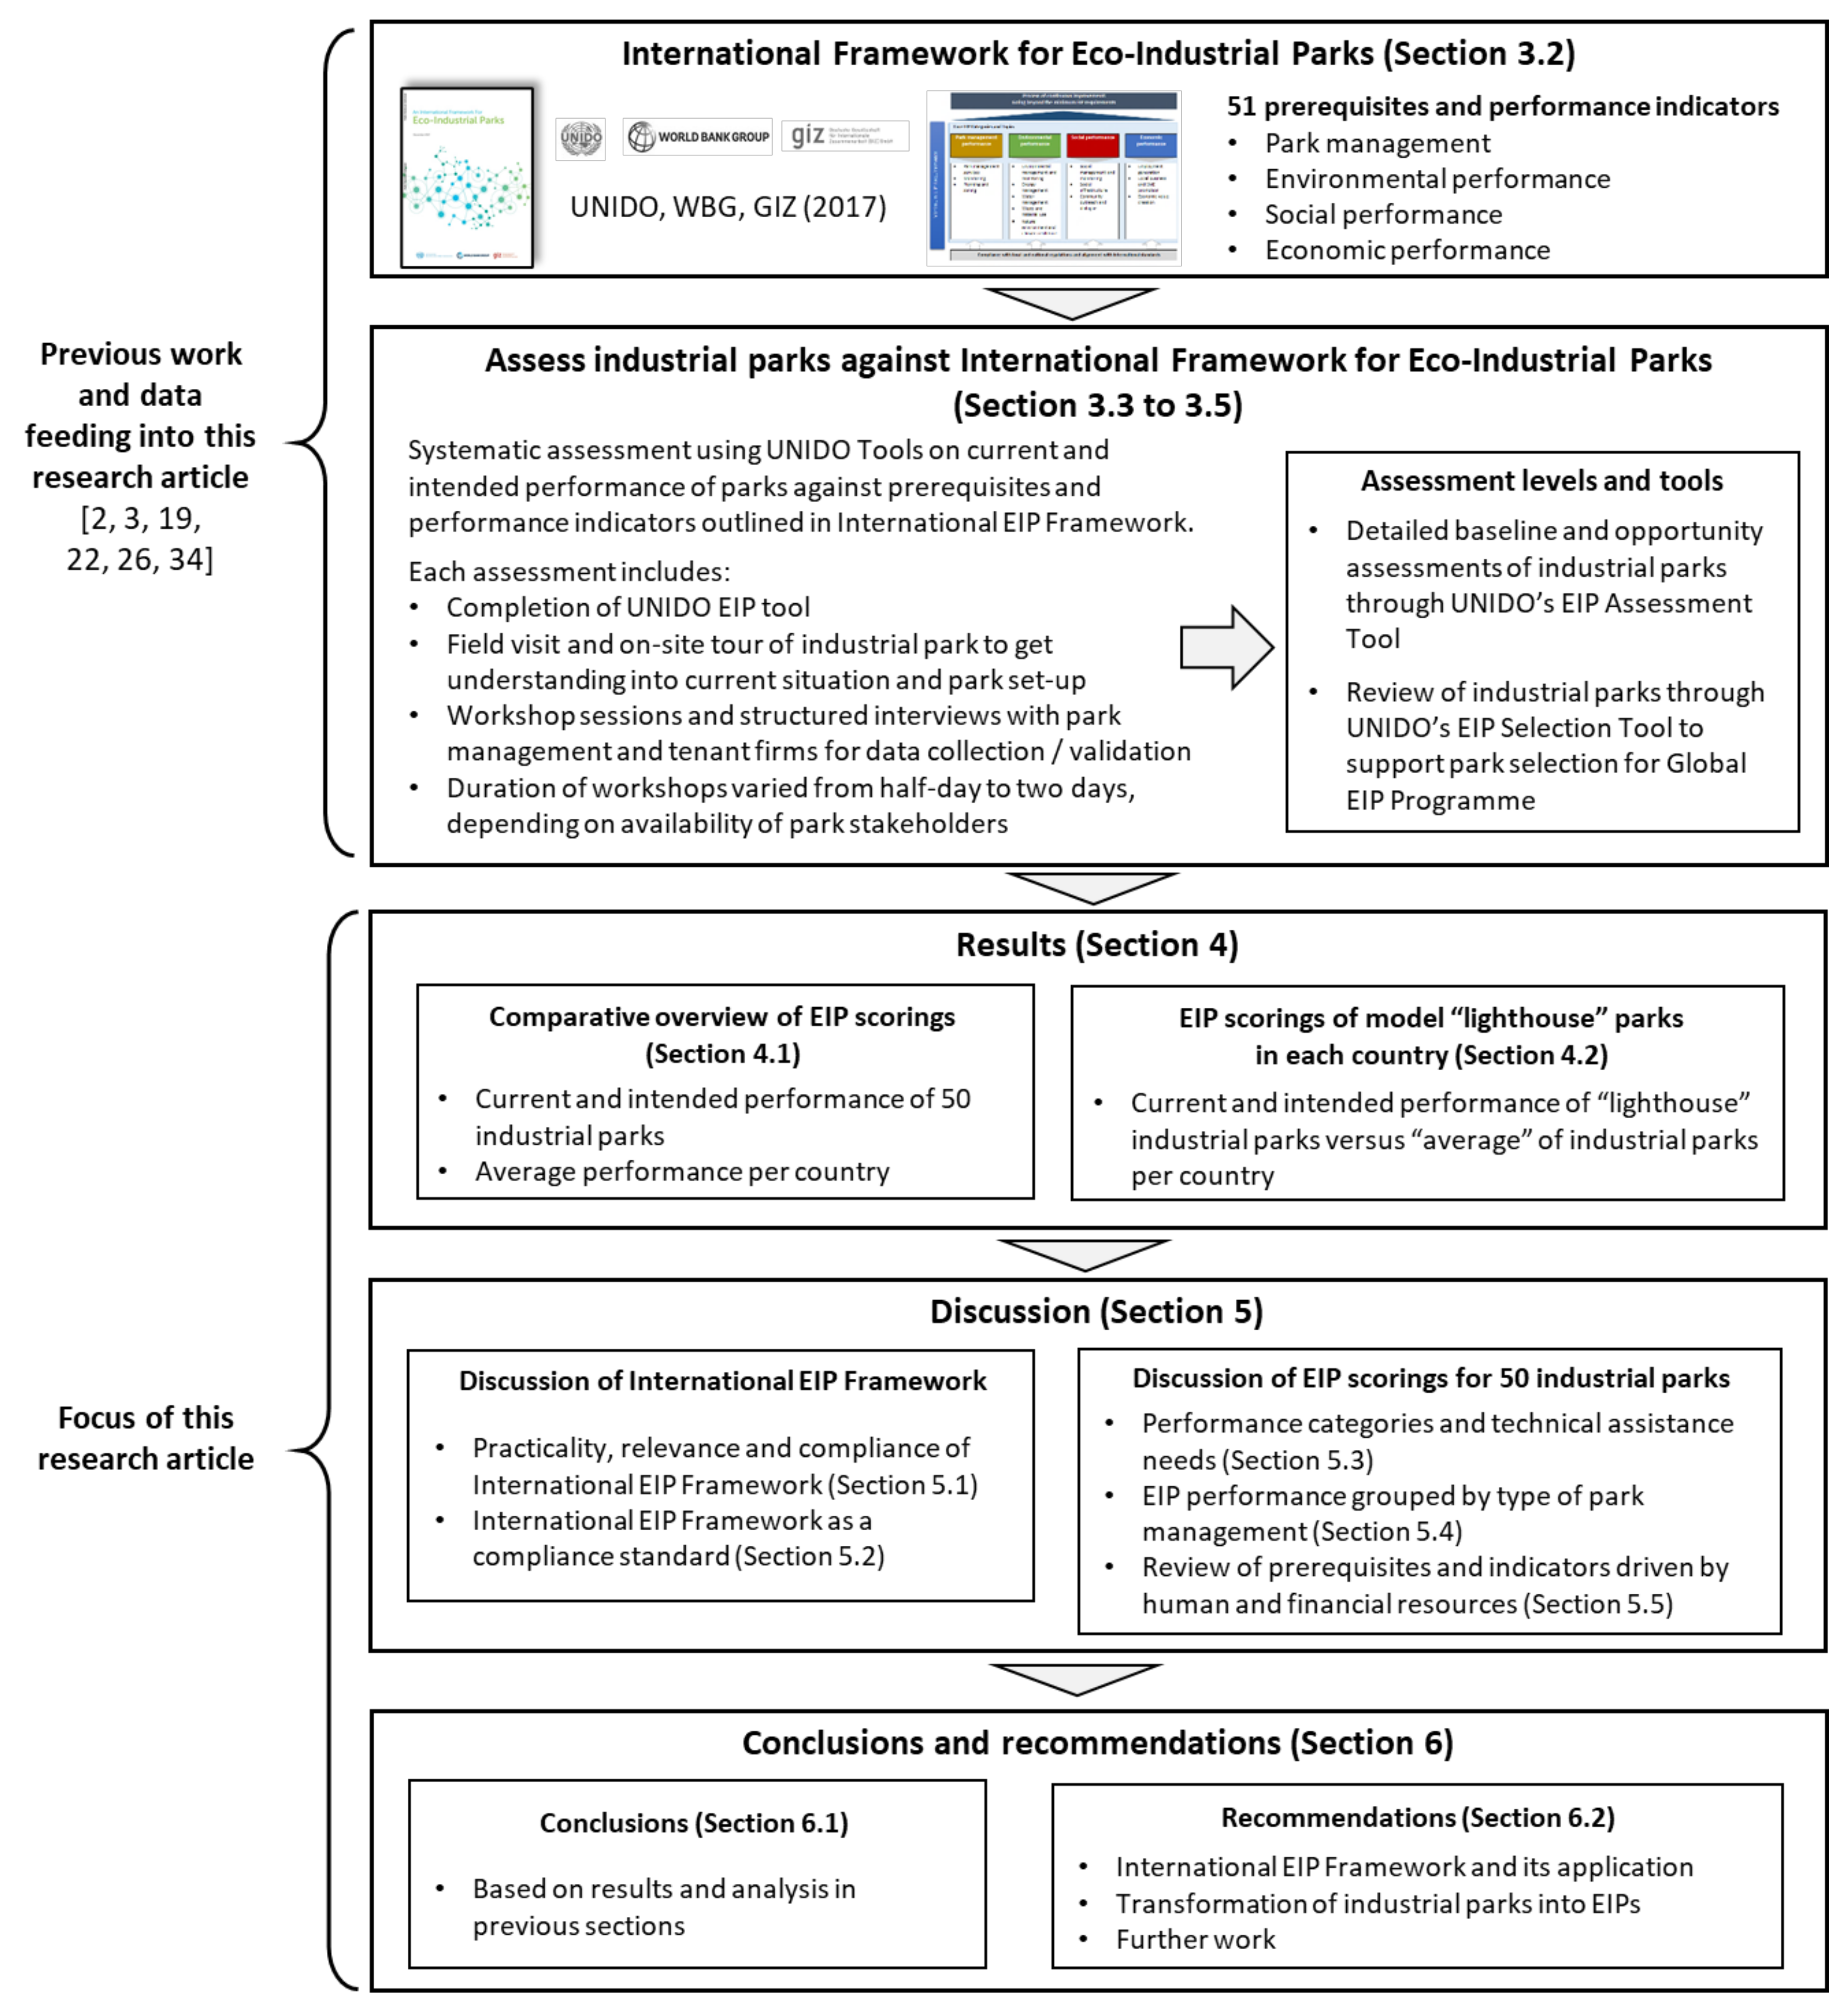
3.1. Methodology to Assess EIP Performance of Industrial Parks and to Evaluate Results

The overall methodology applied by UNIDO to assess the performance of the 50 industrial parks against the International EIP Framework, and the subsequent analysis of the lessons learned from these assessments, is presented in Figure 1. Each step of the methodology is further explained in the cross-referenced sections of this research article.
It is noted that the results of the analysis presented in this chapter may include some margin of variability. The EIP assessments were conducted by a small team of two/three experts, covering disciplines of engineering, management consulting, and social science. However, given the significant number of industrial parks assessed (50) and the use of the standardized rating options in UNIDO’s EIP Assessment Tool (i.e., “Yes, No, Partly, To be confirmed”), the statistical error is by some means mitigated.

3.2. International Framework for Eco-Industrial Parks

Interest in advancing the economic, environmental, and social sustainability of industrial parks has grown substantially in recent decades. However, this growth in interest also came with inconsistencies in the understanding of what an eco-industrial park entails.
There are a number of complementary tools and processes to assist industrial parks, governments, and other stakeholders in implementing inclusive and sustainable industrial development. Yet, a consolidated and targeted framework for outlining a common understanding of EIP concepts was largely lacking at the international level prior to the publication of the International EIP Framework [3]. Industrial park stakeholders and their country counterparts (e.g., national ministries) were increasingly requesting ‘standards’ or benchmarks from international development agencies (such as UNIDO, the WBG, and the GIZ) for ensuring that envisioned industrial developments are sustainable and aligned with EIP principles.
As a result, UNIDO, the World Bank Group, and the GIZ have collaborated to develop an International EIP Framework which provides guidance on what constitutes an eco-industrial park and how an industrial park can work towards becoming an eco-industrial park. The purpose of the International Framework for Eco-Industrial Parks is (a) to assist relevant stakeholders in developing and transitioning to EIPs; (b) to consistently approach, encourage, and recognize EIPs; and (c) to improve the performance, sustainability, and inclusiveness of the industrial sector and to move toward an international standard on eco-industrial parks. In short, park management entities can use the International EIP Framework as a practical reference document when working with their stakeholders (e.g., tenant firms, local and national government agencies, local community) to establish an understanding of their current EIP performance and subsequently identify performance gaps and opportunities for improvement.
An overview of the International Framework for Eco-Industrial Parks (International EIP Framework) is presented in Figure 2. It is based on four key categories: park management performance, environmental performance, social performance, and economic performance. The requirements within each category are divided into 51 “prerequisites” and “performance indicators,” that can be verified and measured in qualitative and/or quantitative terms. The prerequisites highlight the basic requirements for EIPs, and the performance indicators cover the performance levels that EIPs must meet. A full list of the framework’s 51 prerequisites and performance indicators is provided in Appendix B of this article. Further details on the International EIP Framework can be downloaded from [3].
The innovative approach applied by the International EIP Framework is to set “minimum requirements” or “sustainability performance standards” for industrial parks, covering legal compliance as well as socio-economic, environmental, and management aspects. Compliance with national and local regulations is a minimum requirement for all industrial parks, regardless of their specific geographic location and characteristics. The focus of the framework is to encourage industrial parks to exceed compliance with local and national regulations.
The International EIP Framework provides prerequisites and performance indicators for assessing and retrofitting existing industrial parks as well as improving the planning of new industrial parks.

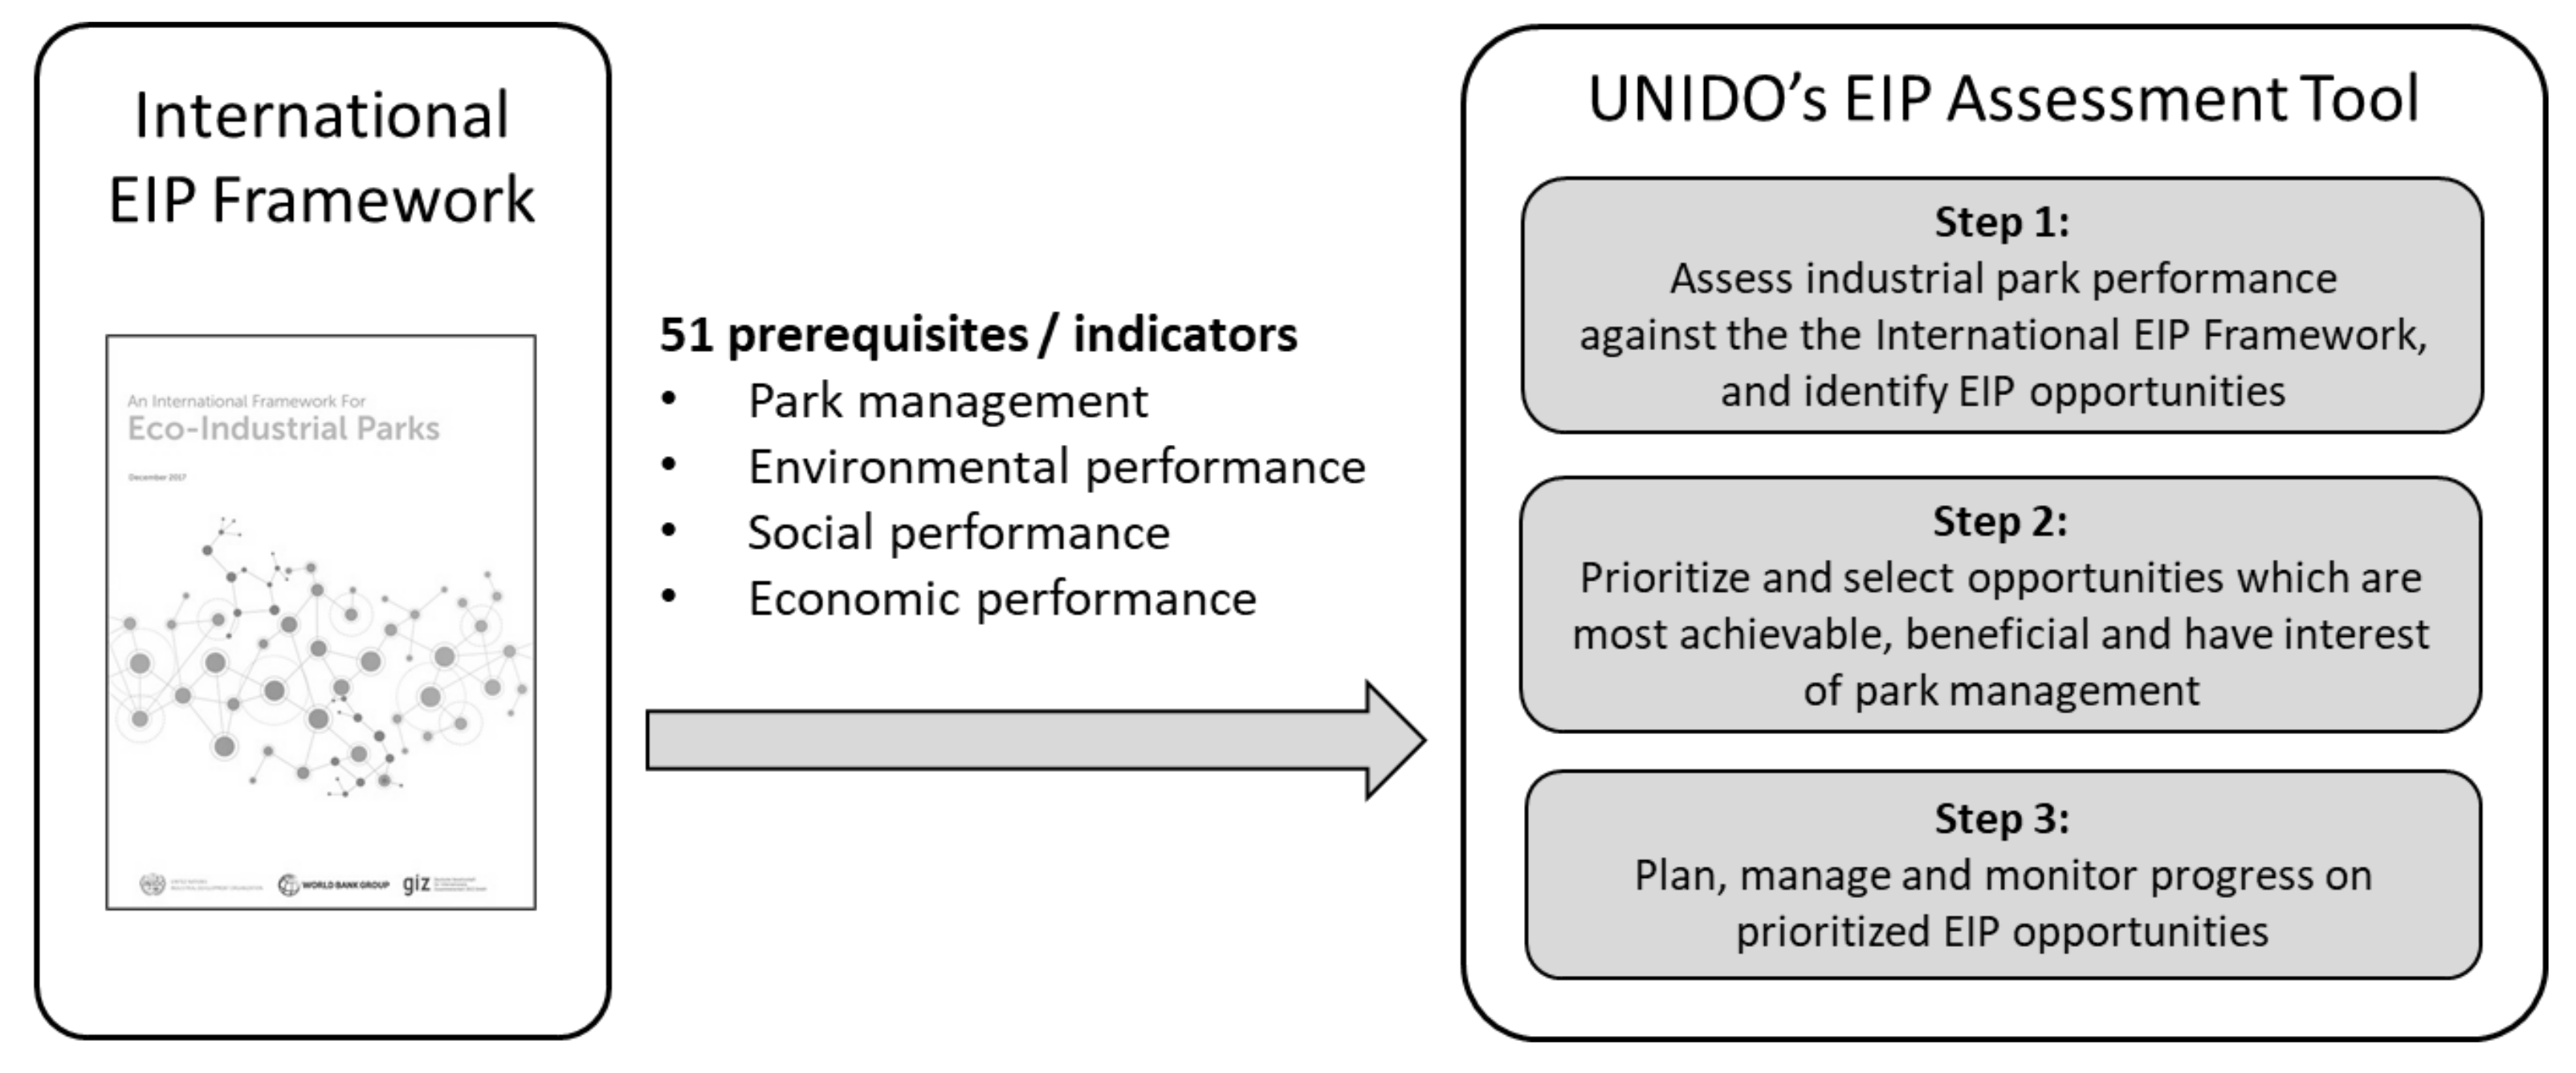
3.3. UNIDO’s EIP Assessment Tool

Various guidelines and handbooks are available which bring together the experience of UNIDO in developing and implementing EIP projects [3,24,28,38]. To support these publications, UNIDO’s EIP Toolbox [39] was developed, including a set of a practical tools to assist practitioners with various components of EIP development and implementation (e.g., policy development, industrial symbiosis identification, monitoring). Following the development of the International EIP Framework, UNIDO developed an EIP Assessment Tool to operationalize the framework. The tool assesses an industrial park against the International EIP Framework to subsequently prioritize, plan, manage, and monitor its EIP initiatives (see Figure 3). The EIP Assessment Tool can be used and adapted to all types of existing industrial parks and management structures (e.g., private company, public authority, public–private set-up, real estate).
The purpose of the tool is to provide a pragmatic and qualitative approach to understand the current and intended performance of the industrial park in relation to the International EIP Framework and to identify concrete EIP opportunities and monitor their implementation.
To assist in the prioritization and selection of industrial parks for their participation in the GEIPP (as introduced in Section 1), the EIP Assessment Tool provided the approach to assess industrial parks against the International EIP Framework.
UNIDO’s EIP Toolbox is available from: https://greenindustryplatform.org/GEIPP. Lessons learned from the application of the UNIDO EIP Toolbox are detailed in [33].
The selection of industrial parks in each country discussed in the article is based on a number of criteria, including:
  • A review of available national databases and consultation with national stakeholders is undertaken to arrive at consolidating list of existing industrial parks in the country. The long-list of industrial parks identified is screened in order to obtain a short-list of industrial parks. Screening criteria are unique for each country and national context, but generally include: the park is operational and an existing “brownfield” development; contact information is available; the park is in an accessible location;
  • The pre-selection of industrial parks is based on minimum selection criteria (e.g., a distinct park management entity exists, the park area is larger than 100 hectares, a sufficient number of firms are operating in park, and there are clear signs that industries and park management want to work with the project team to improve their environmental, social, and economic performance);
  • The prioritization of pre-selected industrial parks is based on a set of qualitative criteria formulated as statements. Each statement needs to be answered for the pre-selected parks, by giving scores from 1 (totally incorrect) to 6 (totally true). The weight of each prioritization statement can be changed to reflect specific country priorities. Prioritization statements cover park management, environment/social/economic aspects, replication, and visibility.
A detailed overview of the approach and criteria for the pre-selection and prioritization of industrial parks for their participation in the EIP assessments are provided in Appendix A. A full list of all criteria is available from UNIDO’s EIP Selection Tool which is freely available online (weblink to the EIP Toolbox is provided above). Further details on the park selection approach are also available from [33].
Altogether, 50 industrial parks in eight countries have been assessed to date on their current and intended performance against the International EIP Framework. These parks are:
  • Colombia (5 industrial parks): Parque Industrial Malambo (PIMSA), Zona Franca de Occidente, Zona Franca La Candelaria, Zona Franca del Cauca, and Zona Franca del Pacífico;
  • Egypt (3 industrial parks): El Robbiki Industrial Park (IP), Polaris International and Al Zamil IP, and SIDC Industrial Park (in the Suez Canal Special Economic Zone (SEZ));
  • Indonesia (11 industrial parks): Batamindo IP, Bintan Inti, BSBcity, Gresik, Kabil IP, KIIC, Maspion, MM2100, Modern Cikande, Safe n Lock, and Suryacipta;
  • Nigeria (2 industrial parks): Calabar Free Trade Zone and Lekki Free Zone;
  • Peru (6 industrial parks): Adepia IP, Ancón Private IP, Indupark, La Chutana IP, Lurin IZ, and Sector 62 IP;
  • South Africa (11 industrial parks): Atlantis SEZ, Babelegi IP, Bodirelo IP, Botshabelo IP, Dube TradePort SEZ, East London IDZ, Ekandustria IP, Puthaditjaba IP, Rosslyn Automotive Supplier Park, Seshego IP, and Vulindlela IP;
  • Ukraine (4 industrial parks): IP Agromash (Zaporizhzhia), IP BTsVAK, IP Chemical metallurgical plant, and IP Patriot;
  • Viet Nam (8 industrial parks): Amata, Deep C1&C2, Hiep Phuoc, Hoa Khanh, Khanh Phu, Long Thanh, Pho Noi A, and Tra Noc 1&2.

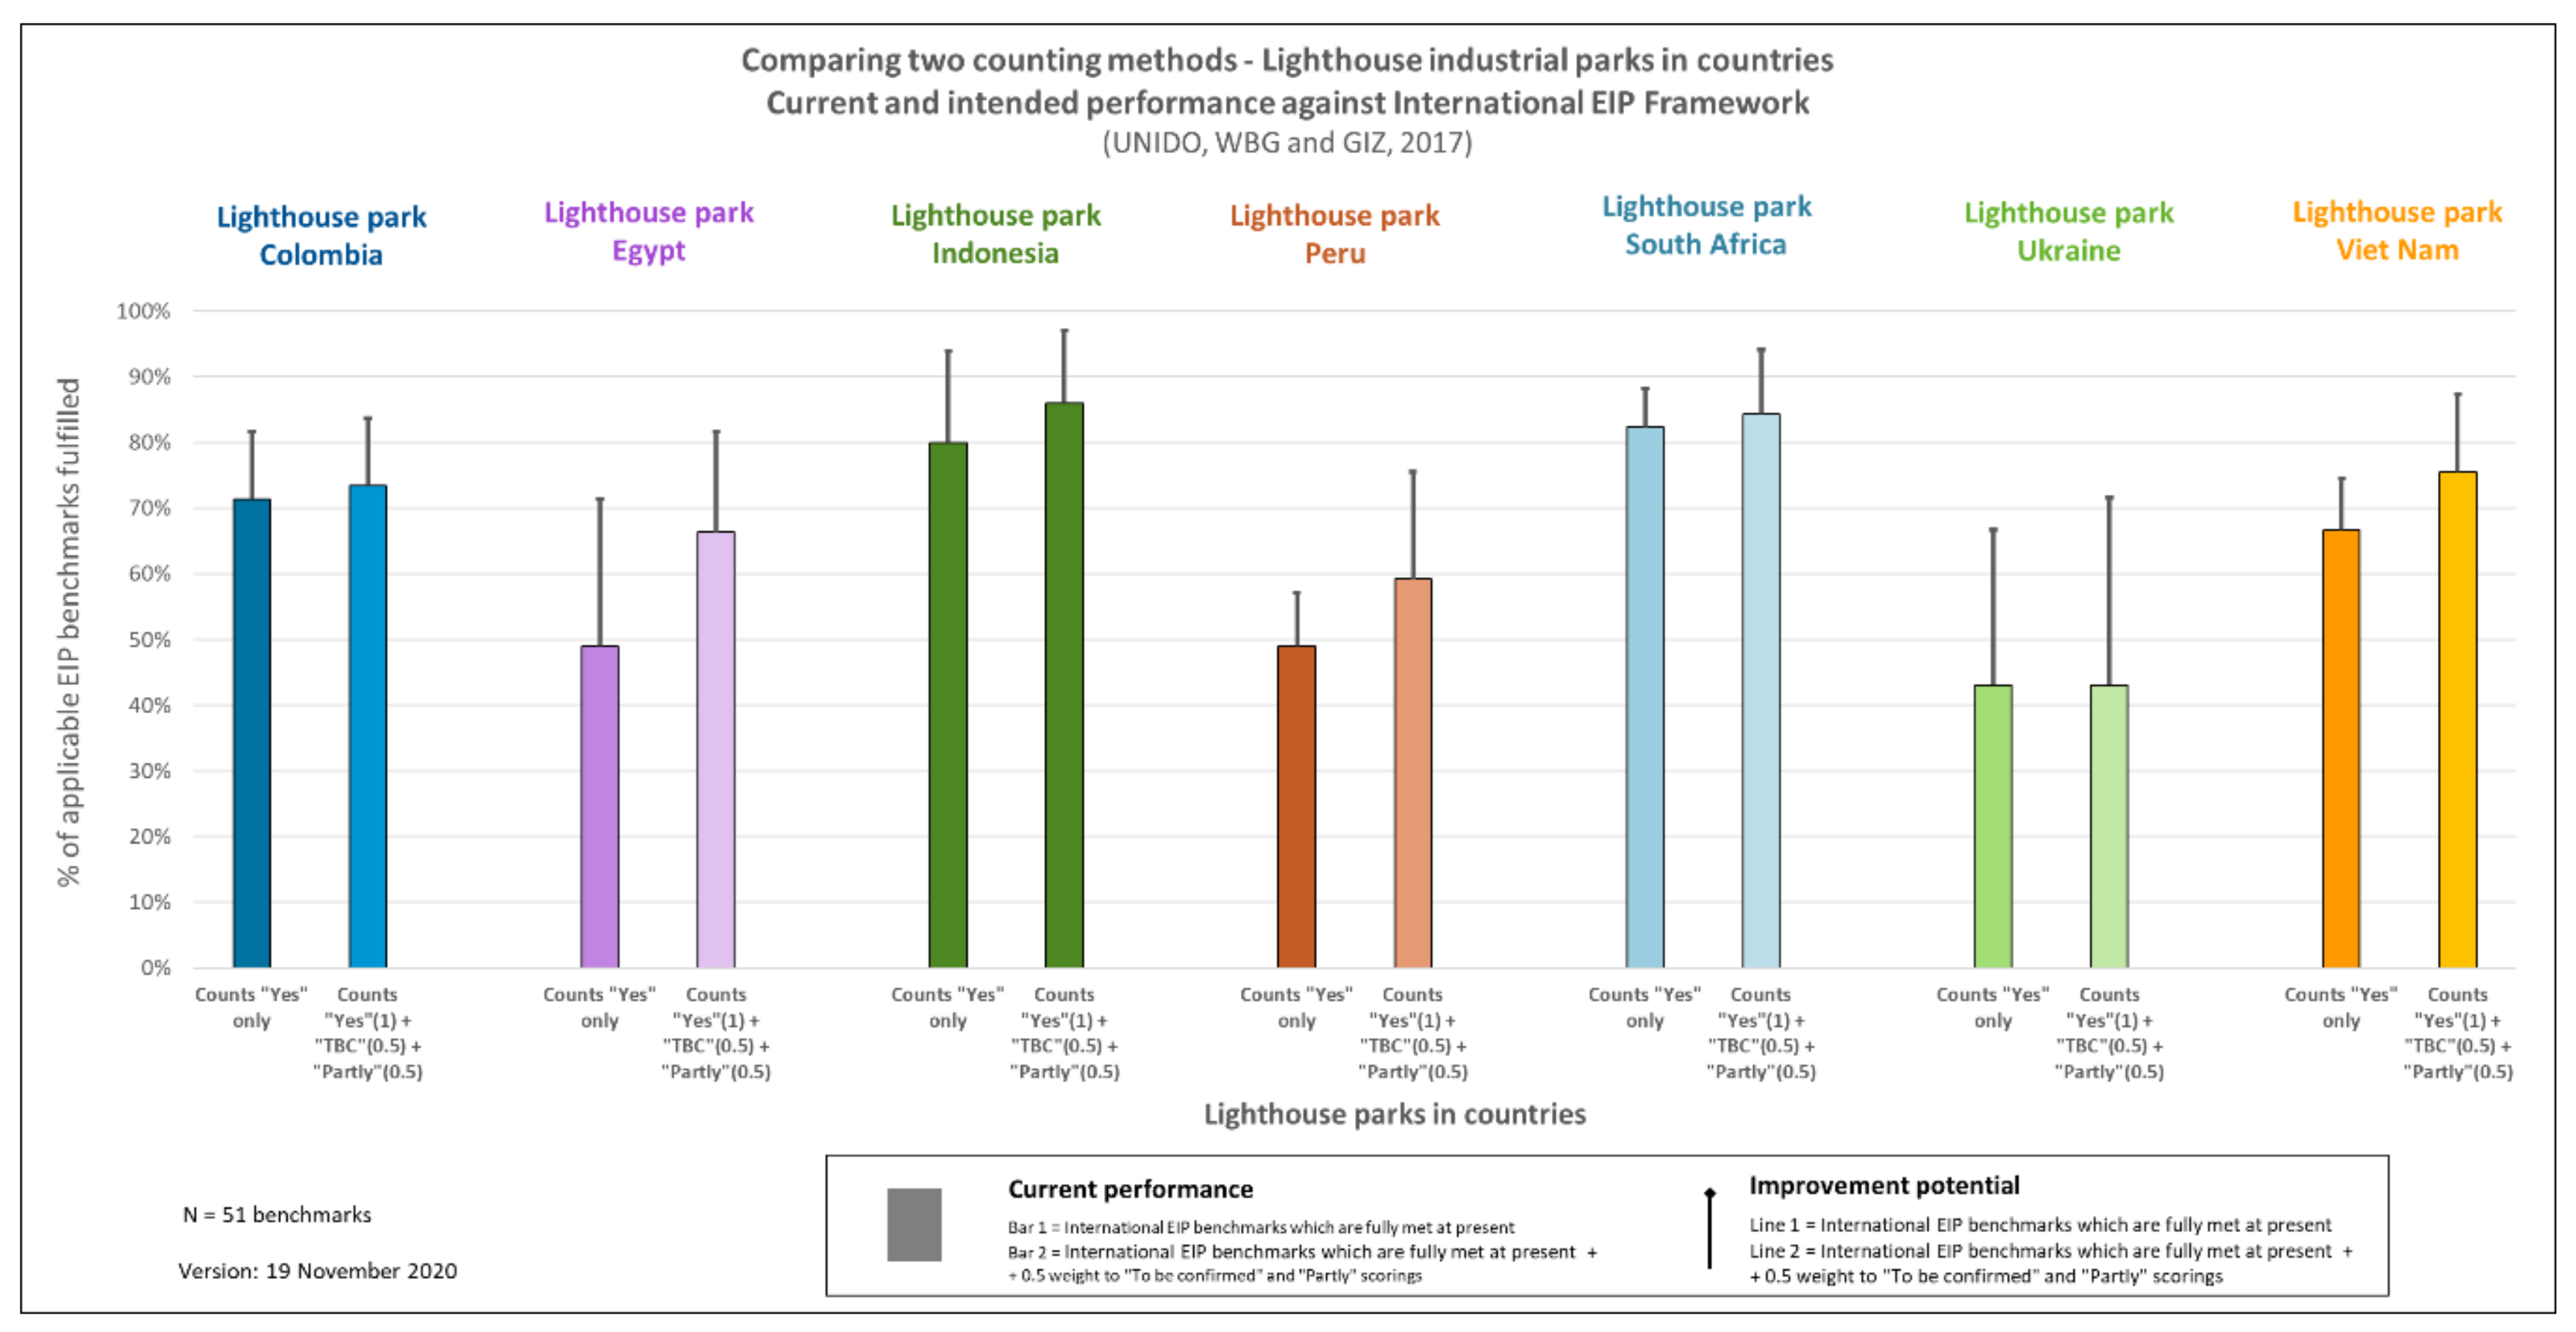
3.4. EIP Scoring Method

Within the context of this research article and UNIDO’s work on assessing the performance of industrial parks, the total EIP scoring is defined as the total share of the 51 prerequisites and performance indicators of the International EIP Framework which are met by an industrial park. All prerequisites and performance indicators are counted equally in the total EIP scoring, covering the following categories and topics:
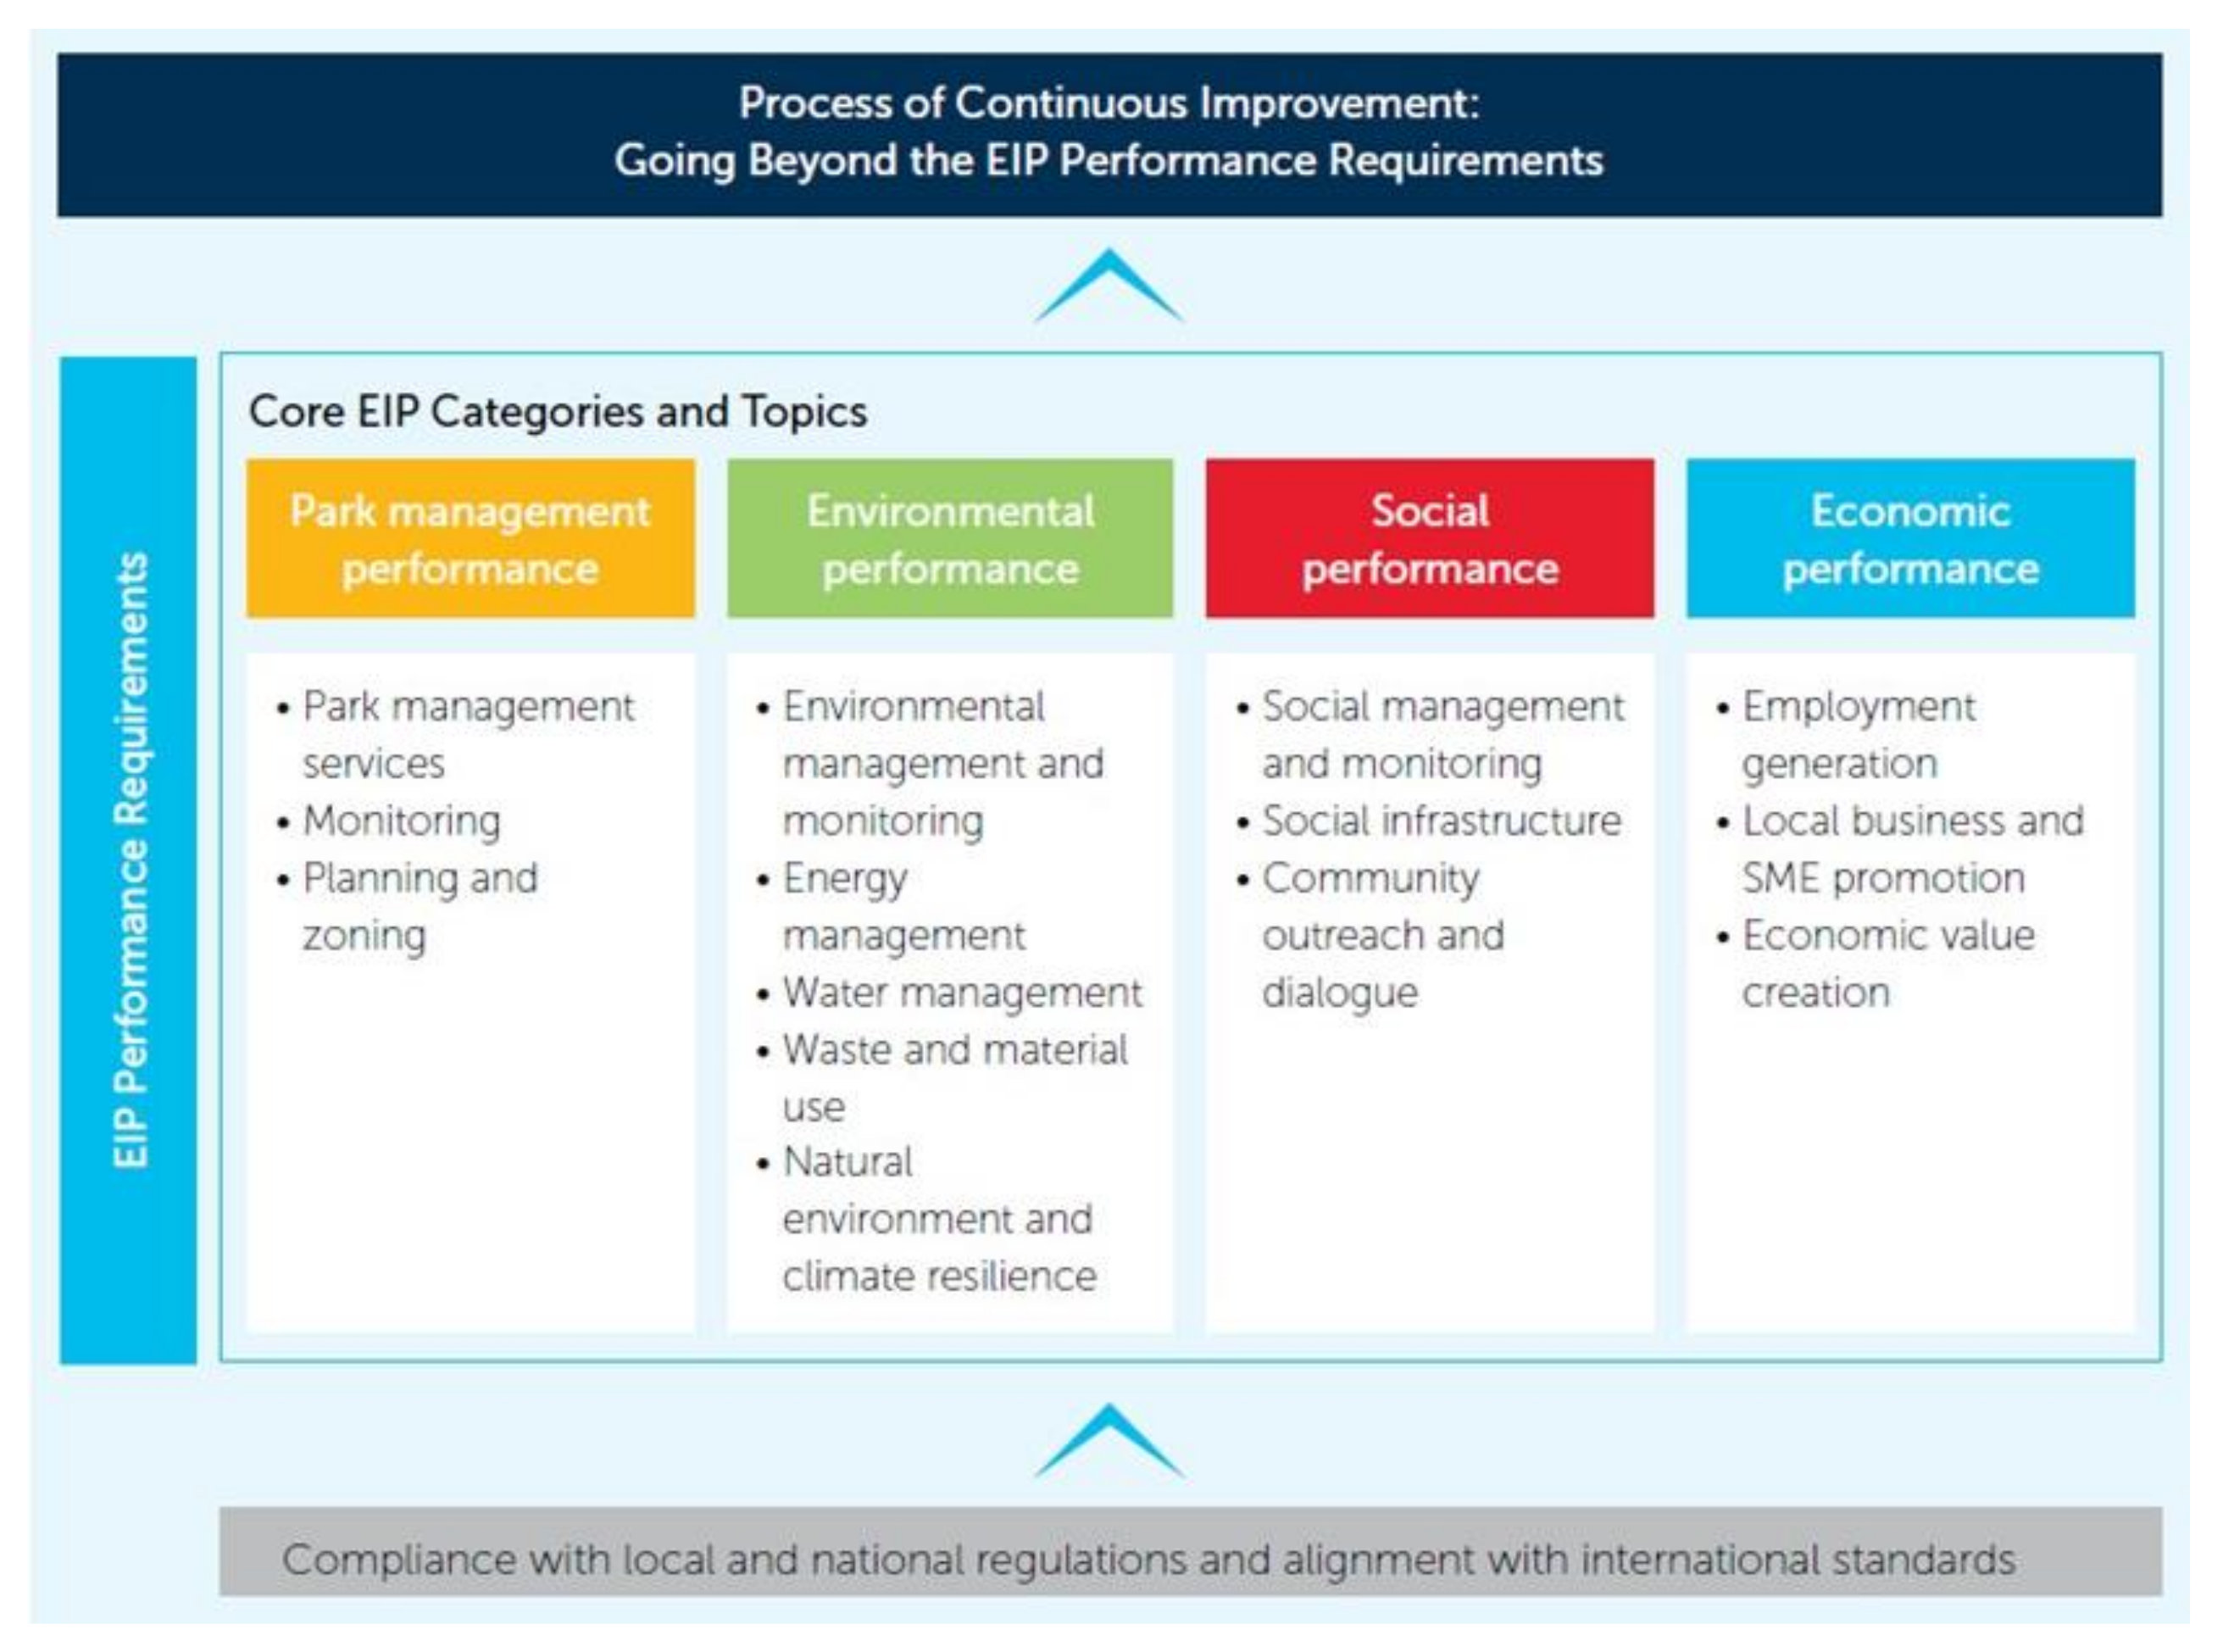
  • Park management (6 prerequisites, 3 performance indicators): Park management services, monitoring, and planning and zoning;
  • Environmental performance (6 prerequisites, 14 performance indicators): Environmental management and monitoring, energy management, water management, waste and material use, and natural environment and climate resilience;
  • Social performance (2 prerequisites, 11 performance indicators): Social management and monitoring, social infrastructure, and community outreach and dialogue;
  • Economic performance (4 prerequisites, 5 performance indicators): Employment creation, local business and SME promotion, and economic value creation.
Currently, UNIDO’s EIP Assessment Tool provides the following options for rating the current and intended performance of industrial parks against each prerequisite and performance indicator outlined in the International EIP Framework [3]:
  • “Yes”: Industrial park fully meets the prerequisite/performance indicator;
  • “No”: Industrial park does not fully meet the prerequisite/performance indicator;
  • “Partly”: Industrial park meet large parts of the prerequisite and has made efforts to work on this, but the requisite is not yet fully met. The “Partly” rating is only possible for prerequisites, as performance indicators include percentage levels which are either met or not;
  • “To be confirmed”: Further data is required to decide on whether or not park meets the prerequisite/performance indicator;
  • “Not applicable”: Prerequisite/performance indicator is not applicable to the industrial park under analysis (e.g., park does not have firms employing more than 250 people).
In order to derive at a reliable total EIP scoring, “Partly” has been used for prerequisites, but not for the performance indicators, since prerequisites are mostly qualitative statements which consist of multiple sub-components for the industrial parks to meet. There are situations where industrial parks have successfully implemented multiple sub-components of a prerequisite, but not all. In these cases, the “Partly” rating is used. A “Partly” scoring is valuable in understanding which topics of the International EIP Framework have already been worked on by the industrial park, but there is still a need for further efforts to fully meet the prerequisite and thereby transform the park into an EIP over time. Further, a “Partly” scoring is also given to acknowledge industrial park management for their efforts to date on the particular prerequisite. The EIP performance indicators in the International EIP Framework cover specific performance percentages (e.g., “At least 95% of industrial wastewater generated by the industrial park and resident firms is treated to appropriate environmental standards.”). Therefore, a performance percentage can either be met or not. Using a “Partly” rating for the performance indicators would result in a discussion on when it is acceptable (e.g., at which threshold or percentage) to use “Partly”. This would add another layer of complexity to the assessment.
If a rating is “To be confirmed” because data is currently not available, the actual real performance can either be a “Yes” or “No”. Therefore, this approach allocates a weighting of 0.5 to “To be confirmed” ratings. Prerequisites rated as “Partly” are reflected in the total EIP scoring in order to acknowledge the efforts of park management and tenant firms to implement the prerequisites. Therefore, this approach allocates a weighting of 0.5 to “Partly” ratings. The formula for total EIP scoring is: (counts “Yes” + counts “To be confirmed” ∗ 0.5 + counts “Partly” ∗ 0.5)/(total number of responses − counts “Not applicable”).
Well-designed indicators should include a clear methodology for their calculation allowing binary indicators to be clearly measured. However, when data is not available or the resources for the assessment are not sufficient, like for the ‘quick EIP assessments’ which took place in view of the design of the GEIPP, a ‘To be confirmed’ and ‘Partly’ rating was used.

3.5. Analysis of Practicality, Relevance, and Compliance Levels

In order to arrive at learnings for the current version of the International EIP Framework [3] (provided in December 2017) through a systematic process, the ratings of the prerequisites and performance indicators for the 50 industrial parks were analyzed on their practicality, relevance, and compliance levels.
The analysis of the practicality of the 51 prerequisites and performance indicators focuses on which and how many of the prerequisites and performance indicators were rated as “To be confirmed”. A high number of “To be confirmed” ratings indicate that a prerequisite/indicator may not be very practical as data is mostly not available or collected to validate its performance. The formula to calculate the proportion of prerequisites and indicators which do not have “To be confirmed” as a rating has been defined as follows:
Practicality % = (counts “Yes”, “No”, “Partly”)/(total number of responses − counts “Not applicable”).
The analysis of the relevance of the prerequisites and performance indicators is centered around which and how many prerequisites and performance indicators were rated as “Not applicable”. Prerequisites and performance indicators with a high proportion of “Not applicable” ratings across all assessed parks imply an overall lesser relevance of the specific prerequisites and indicators. The formula to calculate the proportion of prerequisites and indicators which do not have “Not applicable” as a rating is as follows:
Relevance % = 1 − (counts “Not applicable”/total number of responses).
A “Yes” rating implies full compliance with a specific prerequisite and performance indicator of the International EIP Framework. The analysis of the compliance levels focuses on which and how many prerequisites and performance indicators were rated as “Yes”.
The formula applied to calculate the proportion of applicable prerequisites and performance indicators which are fully met by industrial parks is as follows:
Compliance % = counts “Yes”/(total number of responses − counts “Not applicable”).
The discussion on applying these formulas appears in Section 5.1.

4. Results

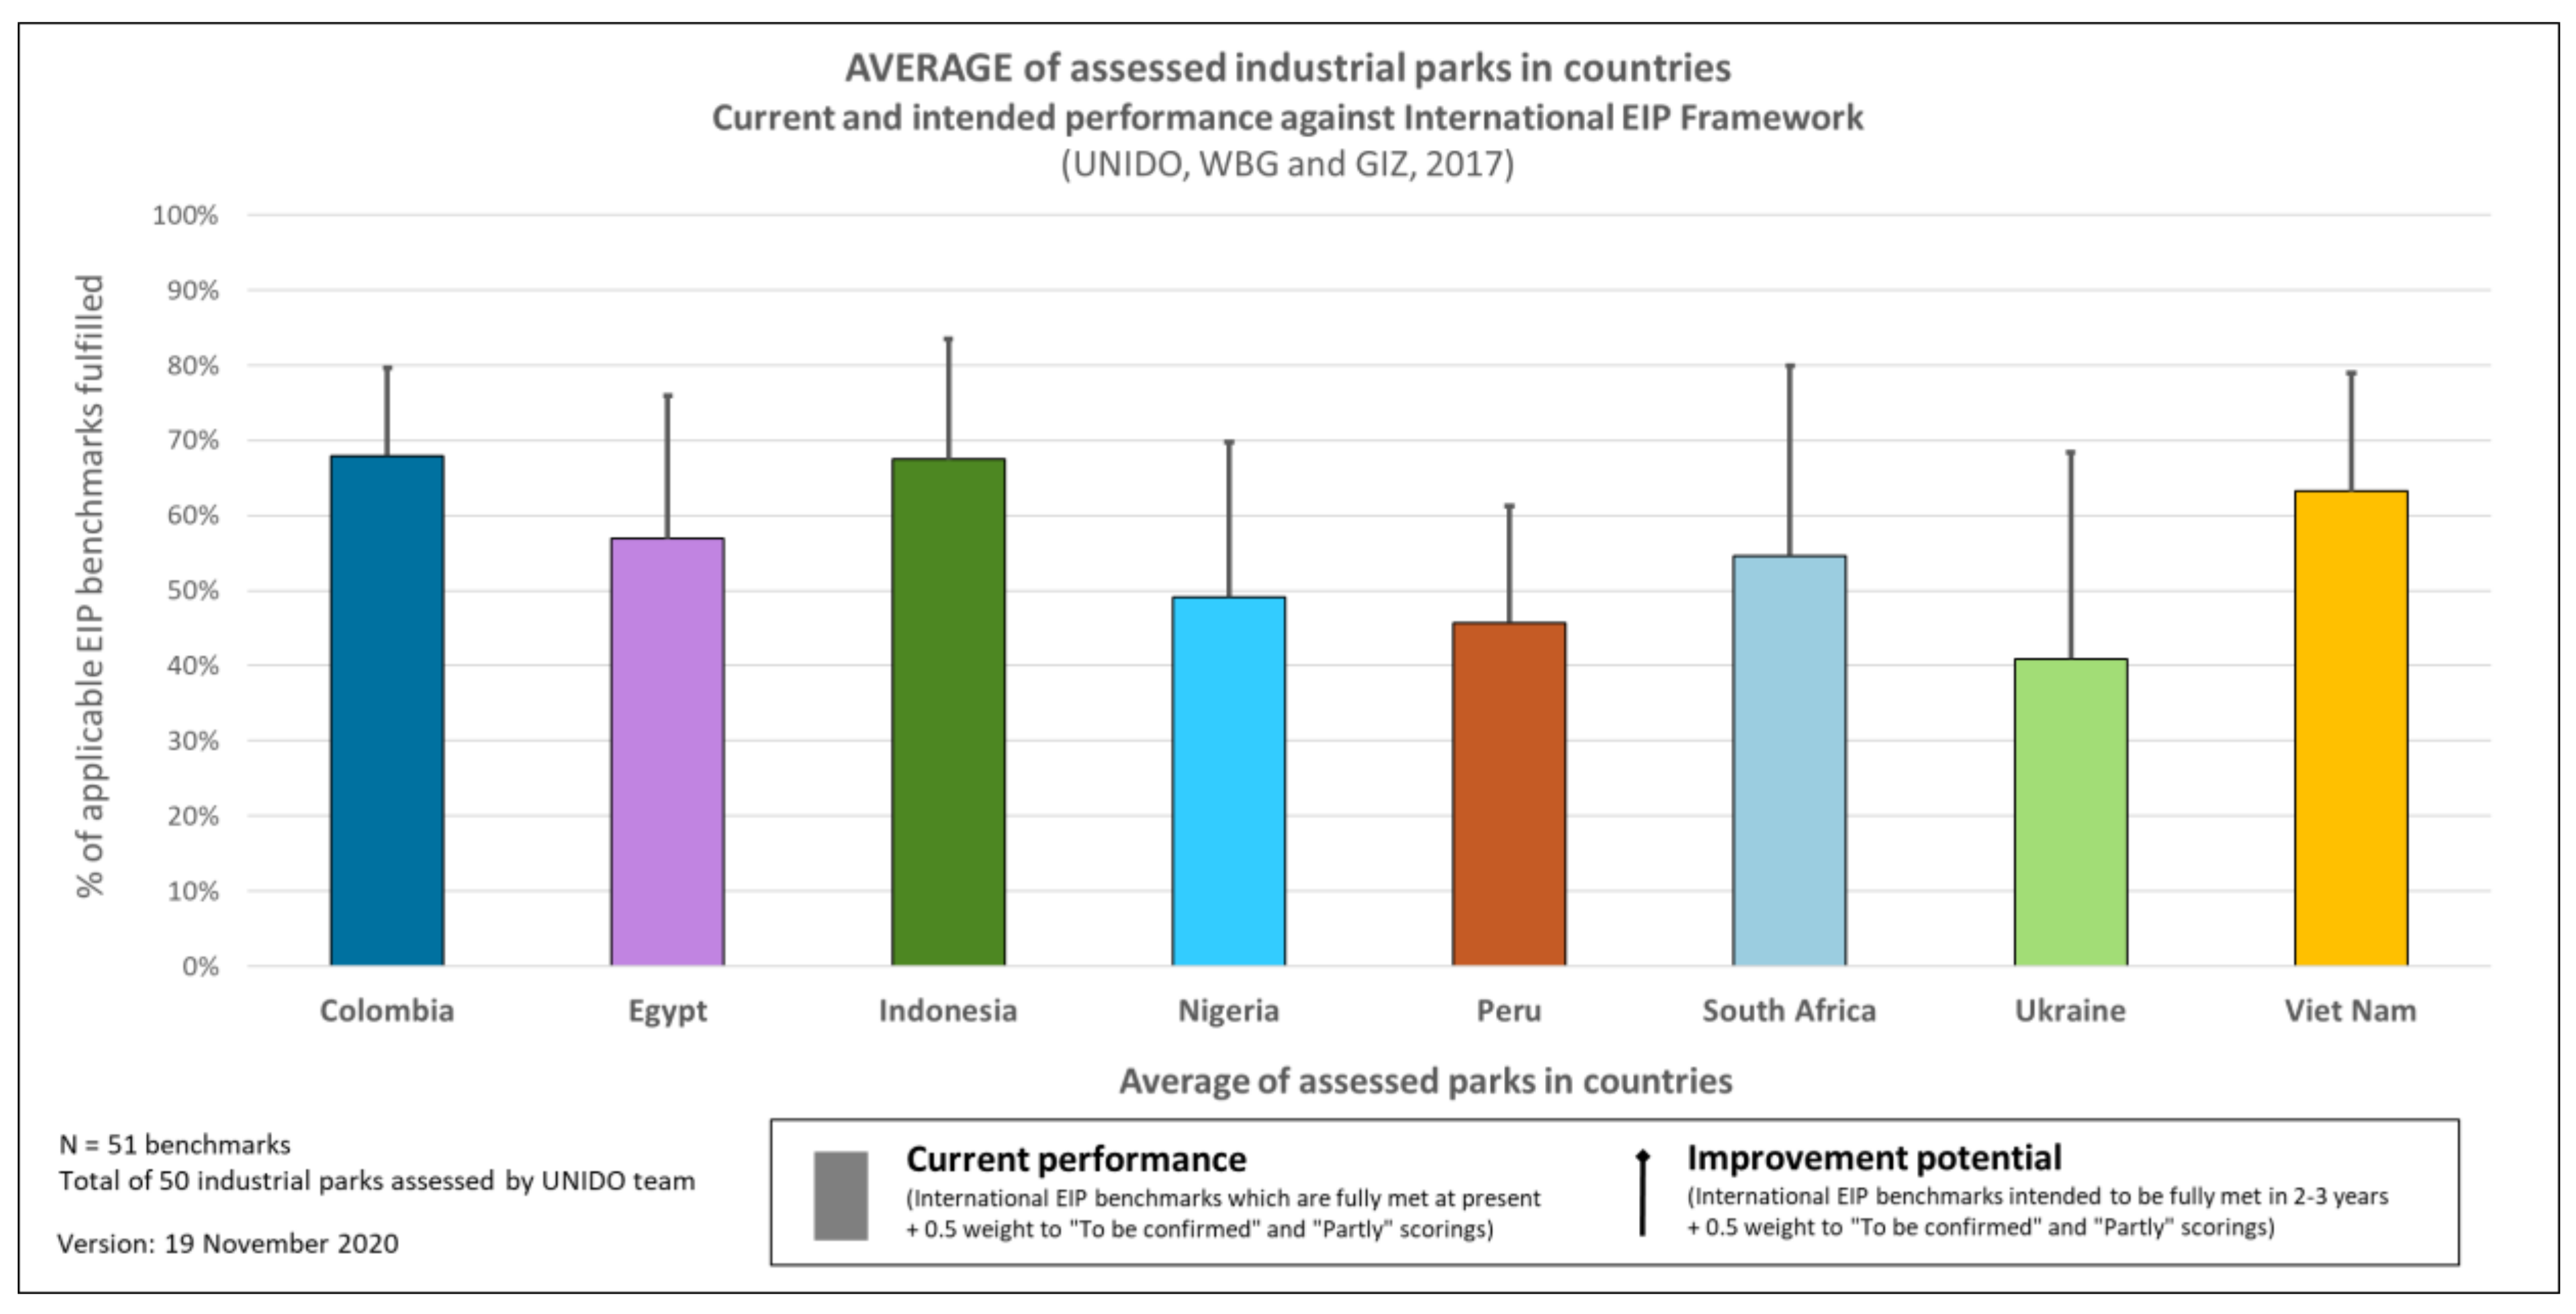
4.1. Comparative Overview of EIP Scorings of 50 Industrial Parks in Eight Countries

The EIP scorings of the current and intended performance of the 50 industrial parks assessed in the eight countries are presented in Figure 4. Current performance scoring reflects the EIP assessments undertaken between January 2018 and June 2020. The intended performance of a park is the proportion of the EIP prerequisites and performance indicators which park management and the tenant companies envisage they will meet with the required technical assistance by 2024, the end of the current phase of the Global Eco-Industrial Parks Programme.
Figure 4 illustrates that there is a wide range in the performances measured against the International EIP Framework. The countries with overall highest EIP scorings are Colombia, Indonesia, and Viet Nam.
The average EIP scoring of the current and intended performance of all industrial parks assessed per country is visually presented in Figure 5. The figure illustrates that higher average current performance against the International Framework can be found in Colombia (68%), Indonesia (67%), and Viet Nam (63%). Ukraine and South Africa have the highest improvement potential (27% and 25%, respectively), meaning they have the highest difference between their current performance against the International EIP Framework and their intended performance (e.g., in three years’ time at the end of the current phase of the Global EIP Programme).
Going into more detail, Table 1 provides a listing of the EIP scorings of the 50 industrial parks assessed and some of their basic characteristics, including park ownership, total land area, and the proportion of the industrial land that has been occupied to date. Across all 50 parks, the average current and intended performance (EIP scoring) is 58% and 77% respectively, given an average improvement potential against the International EIP Framework of 19% per park. Further, Table 1 illustrates that the average size of the 50 industrial parks is 536 ha with an average 63% of their land currently developed. Peru and Ukraine are the countries with the lowest average size of industrial parks, while Nigeria, Indonesia, and Viet Nam have highest average land sizes of industrial parks. A general observation is that many older and fully occupied parks have a lower EIP scoring in comparison to parks which are in their earlier development stages (e.g., modern parks which are not fully occupied yet).
A review of the EIP scorings by type of park management (e.g., private, public, public–private partnership) is provided in Section 5.4.

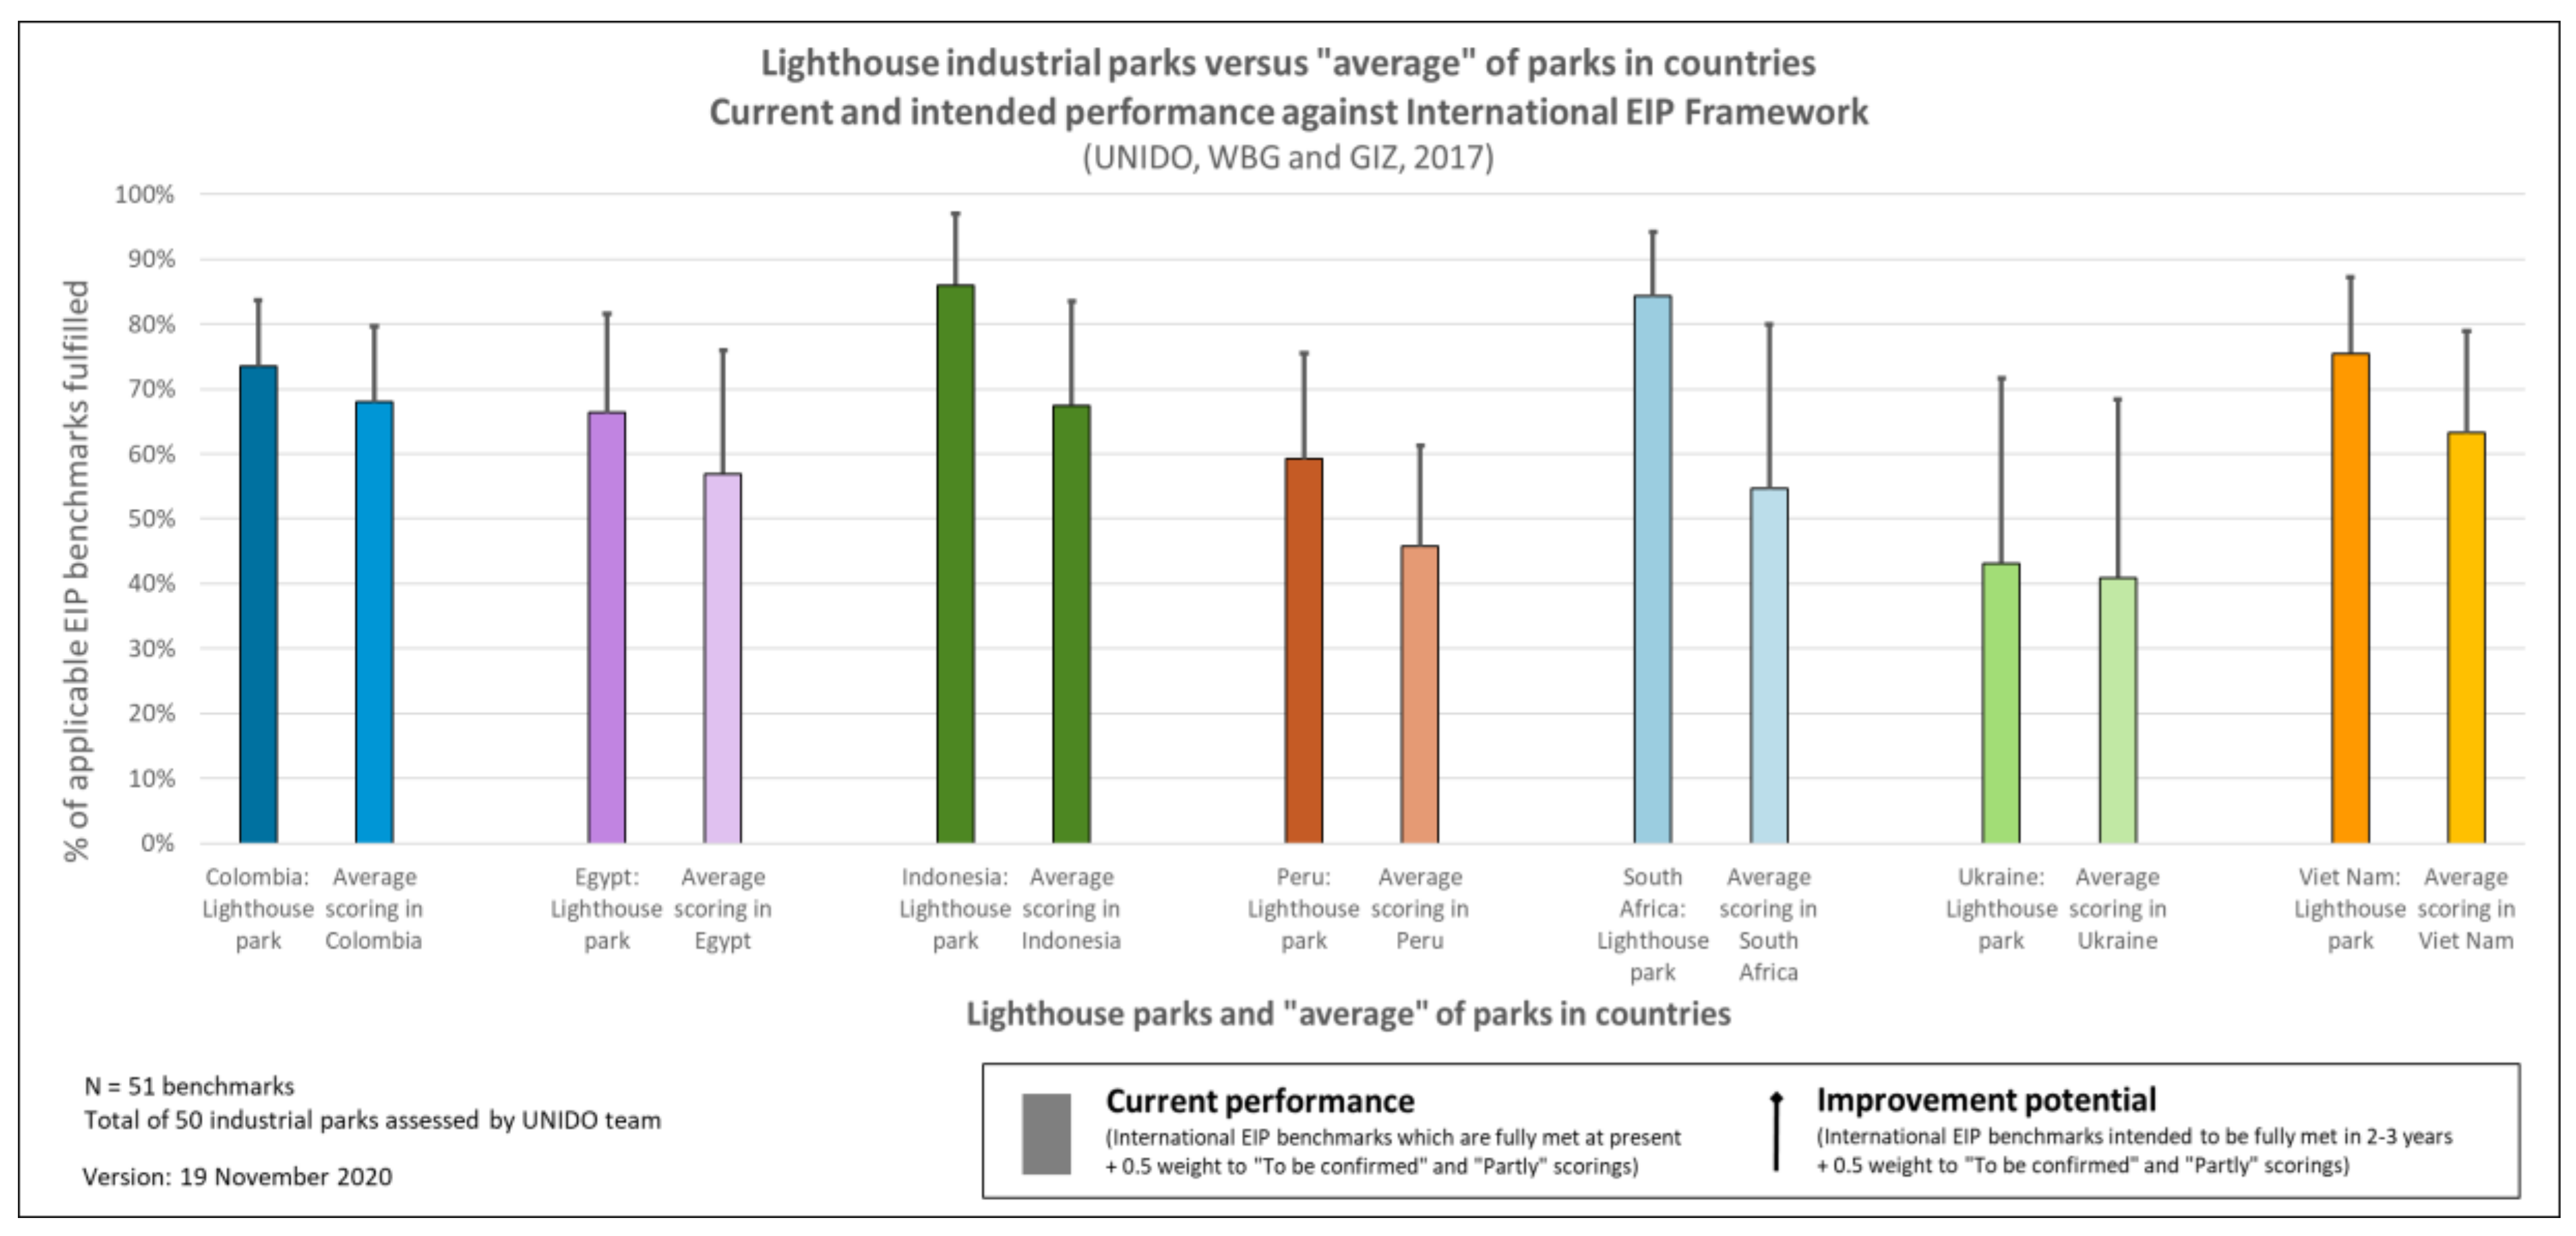
4.2. EIP Scorings of Model “Lighthouse” Parks in Each Country

The GEIPP selected one “lighthouse” industrial park in each of the participating countries. The lighthouse parks have a high EIP scoring with regards to International EIP Framework and serve as a real-life and practical example of an EIP in the country as the GEIPP progresses over time. In addition to high EIP scorings, the lighthouse parks were selected based on a set of multi-disciplinary criteria including:
  • A high interest and commitment of park management towards their transformation into an eco-industrial park;
  • Sufficient resources (e.g., human, financial) of the park management/developer to work towards an eco-industrial park;
  • The total number and the diversity of industries located in the park is sufficient to develop industrial synergies and to undertake cleaner production opportunity assessments with individual firms;
  • The industrial activities present in the park are representative of the national economic landscape;
  • The industrial park is sufficiently large and productive to be visible at a national scale;
  • The industrial park is aligned with existing policies and priorities of local, regional, and national government.
The performances of the lighthouse parks are compared with the average EIP scoring of all assessed parks per country in Figure 6. Data from Nigeria is not included in this figure as Nigeria is currently not participating in UNIDO’s GEIPP. Therefore, a leading “lighthouse” industrial park has not been selected in Nigeria.
Figure 6 illustrates that the lighthouse parks with the highest EIP scorings can be found in Indonesia (a park with a current performance of 86% and an intended performance of 97%) and South Africa (a park with current a performance of 84% and an intended performance of 94%). Ukraine has the lighthouse park with the highest improvement potential (29% difference between the current and intended performance).
As expected, the lighthouse parks have a higher total EIP scoring than the average score of the industrial parks assessed in their respective countries. The most substantial difference between the lighthouse park and the average performance of the parks can be found in Indonesia and South Africa, indicating differences in park management approaches and the ability of parks to attract new “modern” tenant firms. Ukraine has the smallest difference, which may imply that the overall performance of the parks in Ukraine is relatively similar.
If there is no lighthouse park with a very high EIP performance in a country, it is likely that there is limited capacity, knowledge, and/or experience available at country level to develop eco-industrial parks. In these cases, technical assistance should have a stronger focus on capacity building and support to government agencies to drive EIP policy development and implementation. On the other hand, with comparatively even park scoring, similar support may be suited for a large number of industrial parks in the country for advancing their EIP transformation.

5. Discussion

5.1. Practicality, Relevance, and Compliance of Prerequisites and Indicators of International EIP Framework

5.1.1. Practicality of EIP Prerequisites and Performance Indicators

Applying the practicality formula outlined in Section 3.5 to all ratings of the EIP assessments undertaken shows that 19% of all ratings (current and intended performance) given to applicable prerequisites and performance indicators were “To be confirmed”. Overall, all prerequisites and indicators in the International EIP Framework have an overall practicality of 81%. This means that the International EIP Framework can be regarded as a practical means to assess the EIP performance of an industrial park.
Five EIP performance indicators had a practicality lower than 60%, meaning that over 40% of the ratings given for these indicators were “To be confirmed”. These five indicators are:
  • At least 75% of all firms in industrial park with more than 250 employees have a harassment prevention and response system in place (55% practicality);
  • At least 80% of the surveyed employees report satisfaction with social infrastructure (37% practicality);
  • At least 20% of the female workforce benefit from available supporting infrastructure/programs for skills development (56% practicality);
  • At least 80% of surveyed community members are satisfied with the community dialogue (47% practicality);
  • At least 25% of resident firms use local suppliers or service providers for at least 80% of their total procurement value (46% practicality).
Four out of these five indicators listed above are in the “social performance” category of the International EIP Framework. Underpinning reasons for this are that a large proportion of the assessed parks do not yet extend their data collection systems to community outreach (e.g., periodic surveys with communities are not yet done) and/or parks do not yet have implementation mechanisms in place to undertake community dialogues. This finding highlights an opportunity (e.g., for UNIDO but also for other development organizations) to provide technical assistance to park management on these topics. As part of the next revision of the International EIP Framework, there is an opportunity to further strengthen the formulation and practicality of the five indicators listed above in order to lower the number of “To be confirmed” ratings in future EIP assessments.

5.1.2. Relevance of EIP Prerequisites and Performance Indicators

The application of the relevance formula (see Section 3.5) to all EIP assessments undertaken by UNIDO shows that only 2% of all ratings (current and intended performance) given to prerequisites and indicators were “Not applicable”. The prerequisites and performance indicators of the International EIP Framework have an overall relevance of 98%. A key finding from this analysis is that almost all prerequisites and performance indicators outlined in the International EIP Framework are relevant to the industrial parks in developing and transition countries.
Only one prerequisite has a relevance lower than 70%, namely “park management entity has plans to generate specific numbers and types of jobs (including diversity and inclusiveness) in line with government targets (66% relevance)”. As part of the development process of the next revision of the International EIP Framework, this finding provides an option to strengthen the formulation of this specific prerequisite in the International EIP Framework to make it more relevant to all industrial parks. In fact, in some countries, there are no government targets for employment and therefore this indicator cannot be applied as it stands.

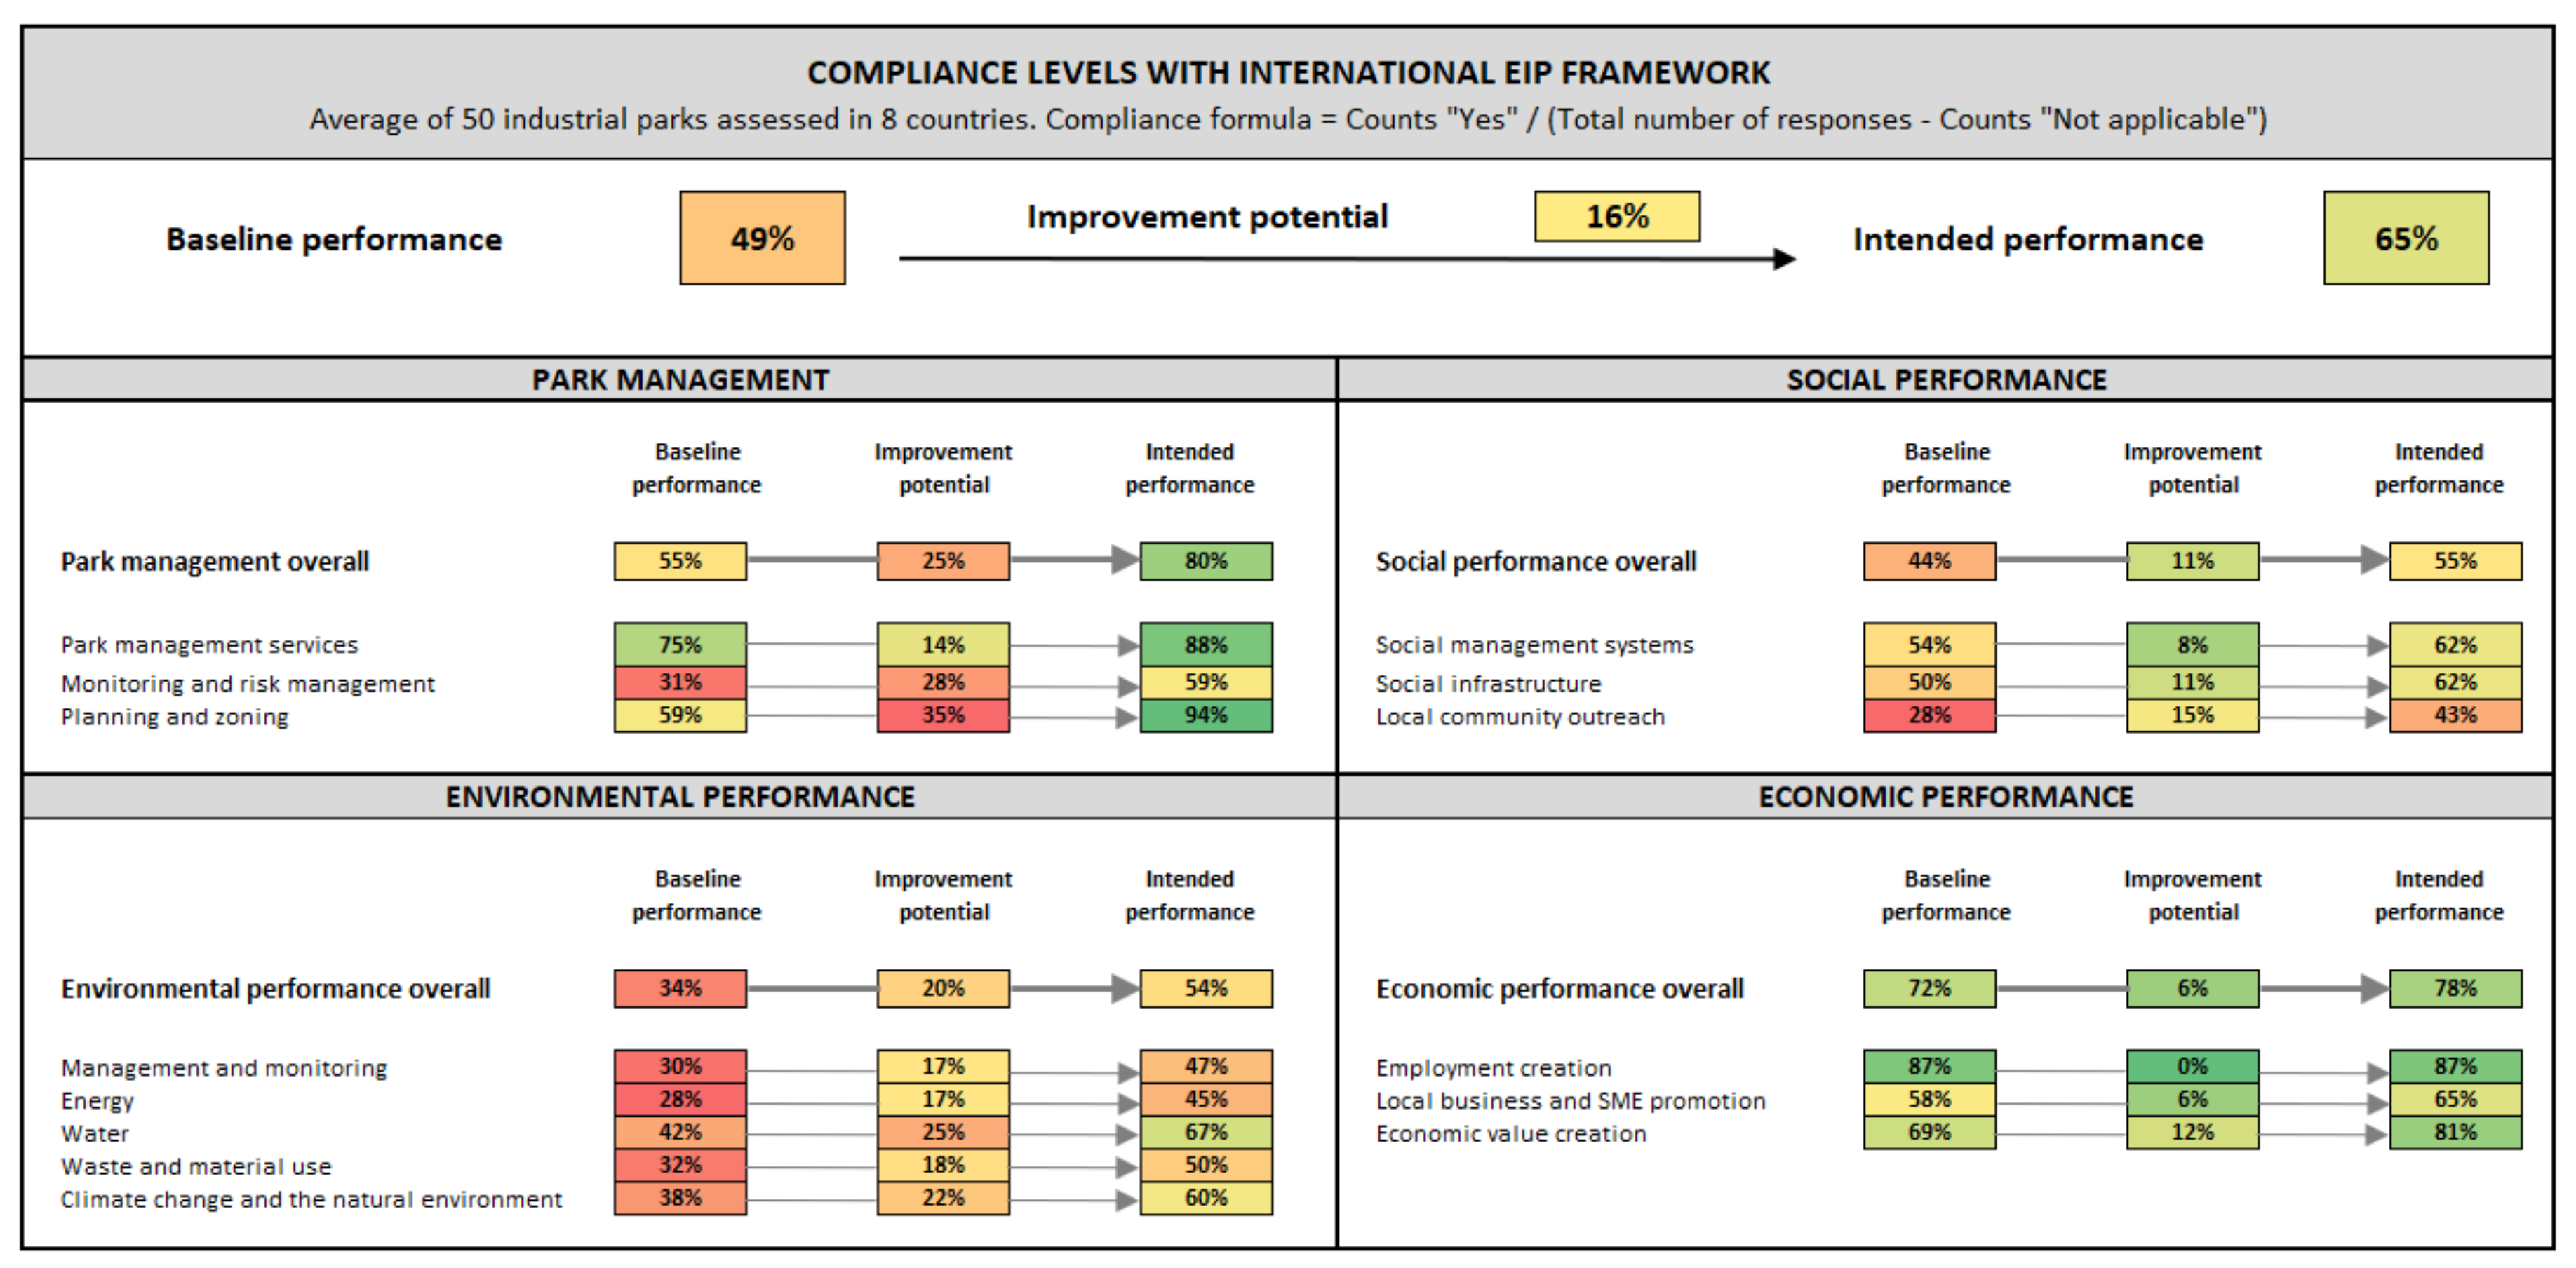
5.1.3. Compliance Levels of EIP Prerequisites and Performance Indicators

The application of the compliance formula outlined in Section 3.5 to all ratings (including current and intended performance) of the EIP assessments illustrates that the prerequisites and performance indicators in the International EIP Framework have an overall compliance of 57%.
Across all 50 industrial parks assessed, 21 prerequisites and performance indicators had a compliance level lower than 50%. A review was made of root-causes of these 21 prerequisites and performance indicators. The review was centered around the following question: is compliance an issue with the industrial park- and country-specific conditions, or is there a potential need to modify the EIP prerequisite or performance indicator? The details and results of this review are presented in Appendix C. In summary, the results show that the main compliance issue for 16 of the 21 prerequisites and performance indicators seems to be with the industrial park- and country-specific conditions. As part of the development process of the next revision of the International EIP Framework, there is an opportunity to refine the formulation of 5 of the 21 prerequisites and indicators so they can become more useful benchmarks when assessing adherence with the International EIP Framework.

5.2. The International EIP Framework as a Compliance Standard

If the International EIP Framework is applied as a strict compliance standard, an alternative counting method, using only binary indicators (Yes/No) would be applied. Such a “compliance” counting method would be different from the “realistic performance” method applied so far (as explained in Section 3.4), since it would assess only which prerequisites and performance indicators are fully met by an industrial park. The total EIP score of this approach is calculated by only counting the “Yes” ratings, so excluding any “To be confirmed“ and "Partly“ ratings.
The compliance formula for the total EIP score = (counts “Yes”)/(total number of responses − counts "Not applicable").
The realistic performance counting method considers “Partly” and “To be confirmed” ratings and therefore this method delivers a slightly higher total EIP scoring compared to the compliance method. A “Partly” scoring is valuable in understanding which topics of the International EIP Framework have already been worked on by the industrial park, but where there is still a need for further efforts (and possibly technical assistance) to fully meet the prerequisite. “To be confirmed” ratings indicate where additional efforts are required to validate the park’s performance on specific prerequisites and performance indicators.
The compliance method will be most suitable in the future when the developments around the International EIP Framework move towards an international standard in which industrial parks can be nationally certified as an eco-industrial park (or national standards where countries adapt the International EIP Framework). The realistic performance method is most applicable in settings where the International EIP Framework is used as a basis to understand the actual performance of an industrial park and subsequent identification and implementation of EIP initiatives to improve their performance over time.
The GEIPP selected one leading “lighthouse” industrial park in each country which has a high EIP scoring with regards to the International EIP Framework. These lighthouse parks serve as real-life and practical example of an eco-industrial park in each country. The compliance and realistic performance counting methods are compared in Figure 7 for selected lighthouse parks in GEIPP countries as an illustrative example. In most countries, there is only a minor difference between the two counting methods. However, the difference between the two counting methods is higher in Egypt and Peru where the parks had a higher number of “Partly” and “To be confirmed” ratings.
The realistic performance method facilitates an understanding of the actual performances of industrial parks and lessons learned for the further development of eco-industrial parks through UNIDO’s Global EIP Programme. In this context, it should be noted that the International EIP Framework is not intended as a compliance-driven approach where industrial parks will be certified. The current version of the International EIP Framework (December 2017) serves as a practical means to assist park management and tenant firms in knowing where they stand with regards to international benchmarks and use this as a basis to identify, prioritize, and develop EIP initiatives for the parks.

5.3. Performance Categories and Technical Assistance Needs

As outlined in Section 3.4, the International EIP Framework and EIP scoring covers four categories: park management, environmental performance, social performance, and economic performance. Figure 8 presents the average compliance levels of the 50 industrial parks assessed per category and topic of the International EIP Framework.
Overall, the environmental and social performance categories have lower compliance (34% and 44%, respectively) compared to economic performance (72% current compliance) and park management (55% compliance). However, park management shows the highest intended improvement potential (25%) compared to other categories.
Across all eight countries, the following topics have the lowest current compliance levels, indicating that technical assistance overall should prioritize these topics covered by the International EIP Framework:
  • Energy (28%);
  • Local community outreach (28%);
  • Environmental management and monitoring (30%);
  • Park monitoring and risk management (31%);
  • Waste and material use (32%);
  • Climate change and the natural environment (38%).
Across all eight countries, the following topics have the highest current compliance levels indicating overall that park management and tenant firms need less intensive technical assistance on these topics covered by the International EIP Framework:
  • Employment generation (87%);
  • Economic value creation (78%);
  • Basic park management services (75%).
The type and level of required technical assistance to industrial parks in their transformation towards an EIP is subject to their compliance with specific prerequisites and indicators under park management, economic, environmental, and social performance. Low compliance levels with prerequisites and indicators may indicate a higher need for technical assistance to the parks in the respective countries.
The core focus of this article is on the analysis and lessons learned from the assessments of industrial parks and their performance against the International EIP Framework. It is outside the scope of this article to discuss in detail the technical assistance needs per topic and country. However, some key points on the technical assistance for the EIP transformation in the countries are:
  • The technical assistance for the EIP transformation generally covers training and capacity building, technical advisory services, facilitation of investment opportunities, and policy support. Specific prerequisites and performance indicators under park management, economic, environmental, and social performance that the industrial park does not fulfill indicate topics for technical assistance. Therefore, the analysis of the compliance scorings by category and topic at global and country levels will be used by GEIPP as an input to determine the type and level of required assistance for specific countries;
  • The main entry point for the technical assistance to the parks on most topics of the International EIP Framework is the park management entity (“bottom-up approach”). However, for a number of topics there is potential key role for government agencies to support the EIP transformation through policy support (“top-down approach”). Key examples include the strengthening of policy support on the planning and zoning of industrial parks in a country, expanding the requirements and incentives to industrial parks/firms to address and adapt to climate change, and streamlining regulations to facilitate the safe reuse and recycling of industrial by-products and effluent streams between tenant firms. These are often regulatory challenges faced by industrial park management and tenant firms [16,17,19,26,34,40,41];
  • For the EIP transformation and technical assistance to the parks it is key to focus on the implementation of both short-term (up to 2 years) as well as medium-/long-term initiatives (up to 5 years). The short-term initiatives should focus on low-cost and “quick-win” measures to deliver concrete benefits, thereby secure ongoing commitment and interest amongst park stakeholders of the EIP concept. The medium-term initiatives should focus more on investment opportunities which deliver strategic and substantial benefits to the park and its stakeholders. In this regard, Appendix B provides an indication on which prerequisites and performance indicators of the International EIP Framework are largely driven by either human efforts or financial investments;
  • At some industrial parks, a low current performance as well as a low improvement potential for a specific topic is identified. In such cases, awareness raising to park management on EIP benefits of these topics is needed for a commitment to a higher intended performance level.

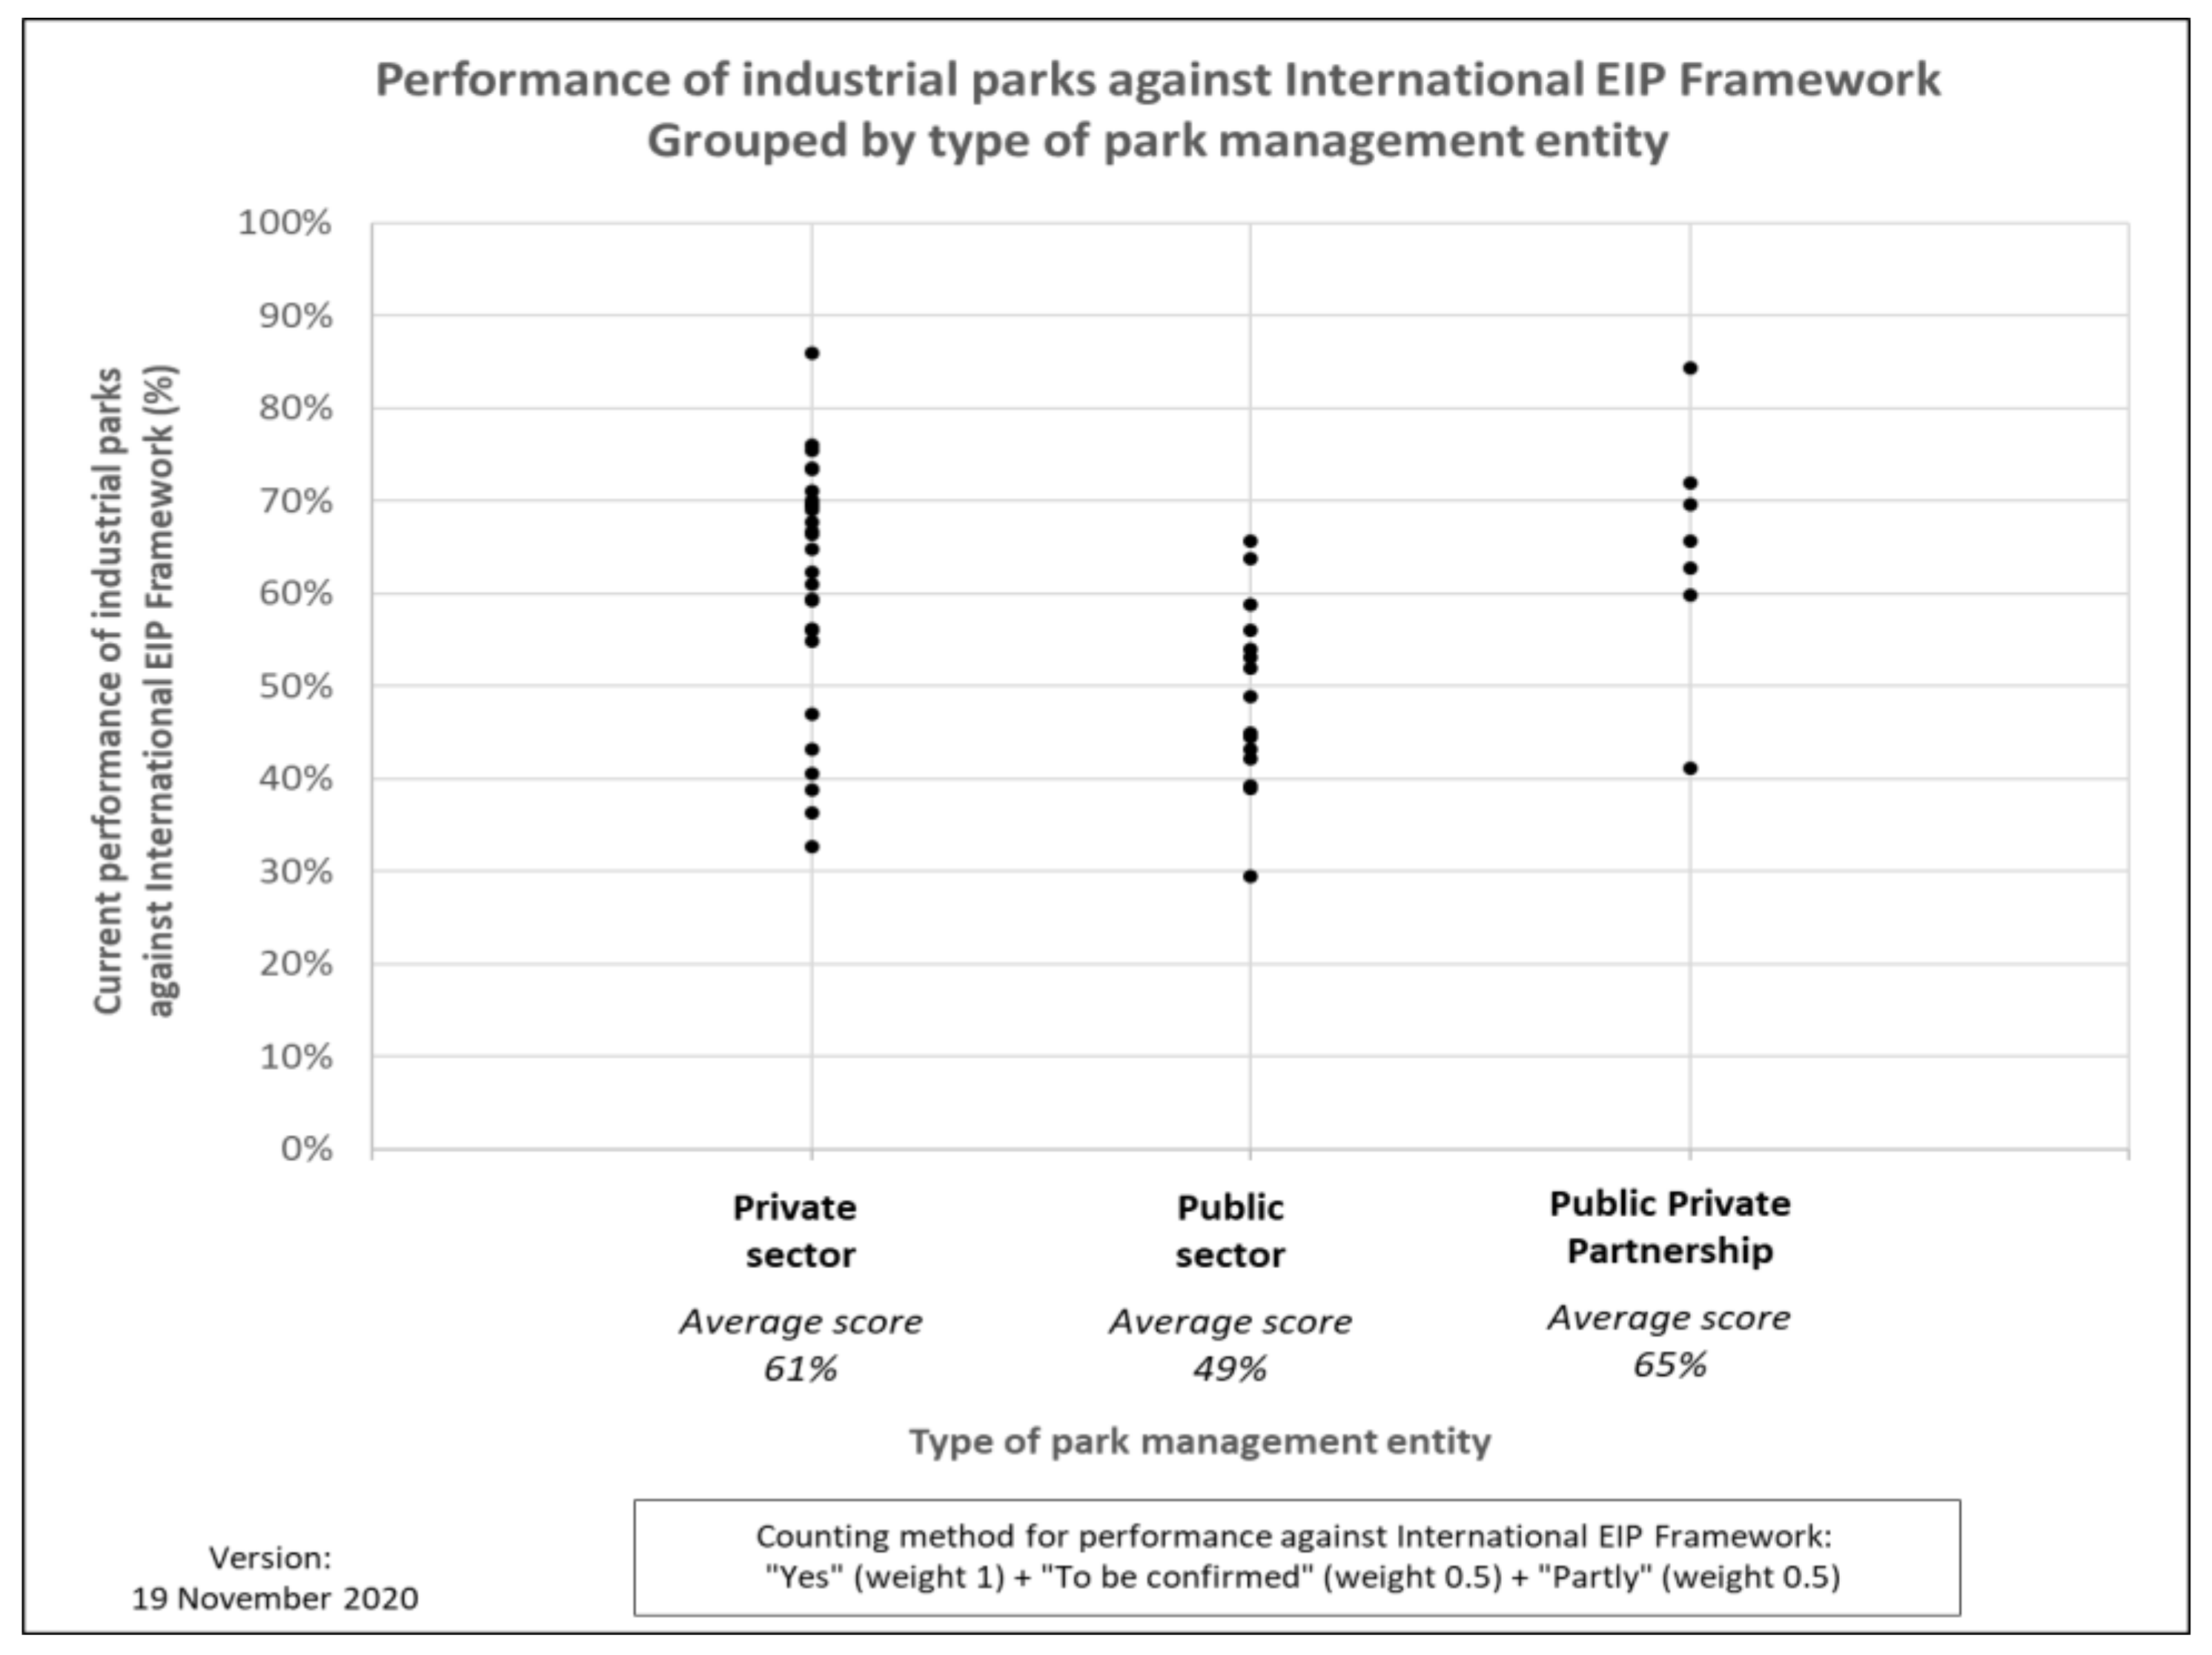
5.4. Performance Measured against the International EIP Framework, Grouped by Type of Park Management

Park management plays a critical role as the entry point and driver to the achievement of EIP objectives in close collaboration with resident firms, relevant government agencies, and the wider community. Therefore, it is of interest to review the relationship between the different types of park management entity and the performance of the parks against the International EIP Framework.
The EIP scorings of the current performance of the assessed industrial parks are presented in Figure 9, and grouped by type of management entity (i.e., private sector, public sector, and public–private partnership (PPP)). The figure clearly indicates that industrial parks managed by public–private partnerships and the private sector have higher average EIP scorings than parks managed solely by the public sector. This finding seems to illustrate that industrial parks perform better if they are operated like a private business or public–private partnership, rather than a government-managed initiative.
Across all 50 parks in eight countries, there are 28 private parks, 15 public parks, and 7 PPP parks. Colombia and Viet Nam have the private parks with highest EIP scorings (68% and 67%, respectively). Viet Nam operates the public parks with the highest average EIP scorings (59%), which demonstrates that there are also some well-operated government owned industrial parks.
Public–private partnership parks with the highest average EIP scorings are in South Africa, which is in contrast with the low EIP scorings in the country (average of 44%). This highlights the opportunity for public–private partnerships to drive the transformation of parks into EIPs, at least for South Africa.
For five out of the eight countries (e.g., Egypt, Indonesia, Peru, South Africa, and Viet Nam), private sector parks have higher EIP scorings compared to public sector parks. For the three other countries covered by this article the following is noted: (a) all five parks assessed in Colombia are private sector parks; and (b) all four parks assessed in Ukraine have similar total EIP scorings.
It is acknowledged that each country has a unique mix of private, public sector, and public–private partnerships parks. Further, the national context is different in each country (e.g., policy enabling environment, governance models, type and level of private sector investments). Therefore, further research and additional EIP assessments with industrial parks are required to confirm these results.

5.5. Review of Prerequisites and Performance Indicators Driven by Human and Financial Resources

As with any business decision, the implementation of prerequisites and performance indicators by park management and tenant firms is subject to their ease of implementation, cost implications, and economic feasibility.
Appendix B of this article presents a list of the 51 prerequisites and performance indicators of the International Framework for Eco-Industrial Parks, including a categorization of potential cost implications (e.g., is the implementation of the prerequisite or the indicator largely driven by human efforts or by financial investments?). It is understood that there may be exemptions to this categorization as each industrial park and its context is unique. If and where needed, this categorization can be customized to a specific park. Also, further assessment is needed to understand the levels of human efforts and investment levels made by the various industrial parks/tenant companies in order to comply/fulfill a particular EIP indicator. Results are based on the authors experience and interpretation of the International Eco-Industrial Parks Framework. Using this categorization, Table 2 presents the EIP scorings of the industrial parks categorized by prerequisites and indicators which are largely driven by human efforts and those largely driven by financial investment.
Overall, all 50 industrial parks show a higher performance against prerequisites and performance indicators largely driven by human efforts and lower financial investments (60%), with regards to the prerequisites and performance indicators largely driven by financial investment (50%).
Based on the authors’ experiences with the industrial parks, it is argued that higher performing parks (EIP scoring > 70%) have often implemented more “easy-to-do” and low-cost EIP initiatives driven by human resources, as well as initiatives which require financial investment. Lower performing parks are in their earlier EIP development stages, so therefore they can be expected to focus their EIP efforts first on prerequisites and indicators largely driven by human resources rather than those driven by financial investments.
The type and level of required support to industrial parks in their transformation towards an EIP can be viewed in relation to their compliance with specific prerequisites and performance indicators of the International EIP Framework. Lower performance levels of compliance with the prerequisites and performance indicators imply a higher need for support to the parks in the respective countries.

6. Conclusions and Recommendations

6.1. Conclusions

This article is the first academic publication presenting and discussing the results from the practical application of the International EIP Framework with a large number of industrial parks in multiple countries. The experience and analysis presented in this article will help in refining and streamlining future revisions of the International EIP Framework and assessments made using this framework. It is hoped that this article will encourage further EIP assessments to be undertaken in more industrial parks in other countries.
Following the analysis of the EIP prerequisites and performance indicators, it can be concluded that the International EIP Framework provides a practical and relevant means to assess the EIP performance of an industrial park. The 50 industrial parks assessed to date in eight countries have an overall compliance of 57% against all 51 prerequisites and performance indicators outlined in the current version (December 2017) of the International EIP Framework. A total of 21 prerequisites and performance indicators had a compliance lower than 50% across all industrial parks assessed. The main compliance issue for 16 of these prerequisites and performance indicators seems closely related with the industrial park- and country-specific conditions, while there is an opportunity to refine the formulation of the other five EIP prerequisites and indicators as part of the development process for the next revision of the International EIP Framework. UNIDO, the World Bank, and the GIZ are currently updating the International EIP Framework, and the results from this article are feeding into this process.
The assessments of the 50 industrial parks in eight countries show that there is a wide range in the performance of the industrial parks, measured against the International EIP Framework. Higher average current performances measured against the International Framework are in Colombia (68%), Indonesia (67%), and Viet Nam (63%). The highest average improvement potentials (the difference between current and intended performance) can be found in South Africa (25% improvement potential) and Ukraine (27% improvement potential).
The Global Eco-Industrial Parks Programme selected one “lighthouse” industrial park in each of the participating countries in order to serve as real-life and practical example of an eco-industrial park in their respective country. The model “lighthouse” parks with the highest EIP scorings are in Indonesia and South Africa. The presence of a high-performing lighthouse park in a country implies that there is capacity to develop further eco-industrial parks in the country, meaning that technical assistance should include a stronger focus on knowledge dissemination, sharing experiences, and peer-to-peer learning between industrial parks.
The type and level of technical assistance required by industrial parks in their transformation towards an EIP is subject to their compliance with the International EIP Framework under park management, economic, environmental, and social performance. Low compliance levels indicate a higher need for technical assistance to the parks. Overall, the environmental and social performance categories have a lower compliance level (34% and 44%, respectively) compared to economic performance and park management (72% and 55% compliance, respectively). The six topics with the lowest current compliance levels across the 50 parks assessed are (a) energy (28% compliance); (b) local community outreach (28% compliance); (c) environmental management and monitoring (30% compliance); (d) park monitoring and risk management; (31% compliance); (e) waste and material use (32% compliance); and (f) climate change and the natural environment (38% compliance).
The International EIP Framework focuses on prerequisites and performance indicators that can be controlled or influenced by the industrial park’s management. Therefore, park management plays a critical role in the EIP transformation and working towards the International EIP Framework. Across the 50 industrial parks assessed in eight countries, the average current performance of private sector and public–private partnership parks is 61% and 65%, respectively, while the average performance of public sector parks is 49%. Overall, this seems to confirm that industrial parks perform better against the International EIP Framework if they are operated like a private business or public–private partnership, rather than a government-managed initiative.
It is noted that the results of the analysis may include some margin of variation as the EIP assessments were conducted by multiple experts. However, given the significant number of industrial parks assessed (50) and the use of the standardized rating options in UNIDO’s EIP Assessment Tool (i.e., “Yes, No, Partly, To be confirmed”), the statistical error is somehow mitigated.

6.2. Recommendations

Recommendations on the International EIP Framework and its application:
  • A key recommendation is for UNIDO, the WBG, and the GIZ to consider and follow-up on the prerequisites and performance indicators recommended for modification in the next revision of the International EIP Framework.
  • The analysis of the number of “To be confirmed” ratings of the 51 prerequisites and performance indicators outlined in the International EIP Framework highlights the need for park management and tenant firms to extend their data collection systems, in particular in the “social performance” category. The improvement of existing data collection systems and subsequent use for decision making is a recommendation, also with regards to the type of technical assistance which is provided as part of the GEIPP.
Recommendations on the transformation of industrial parks into EIPs:
  • The EIP assessments undertaken to date provide insights into the current and intended performance of industrial parks and their specific technical assistance needs. It is therefore recommended that the EIP assessment results are analyzed in the context of each country to formulate customized approaches for technical assistance to the parks and to guide the planning and implementation of country-level GEIPP activities. For the EIP transformation across all eight countries, it is recommended that the topics of the International EIP Framework which have the lowest current compliance levels are prioritized, as highlighted in this article.
  • Business-oriented approaches should be promoted and embedded with parks managed solely by the public sector. Examples include the streamlining of decision-making processes within park management without unnecessary government bureaucracies, park management services which meet the needs of resident firms, and addressing key common challenges facing tenant firms (e.g., secure water and energy supply, shared utilities, and infrastructures).
  • Although the main entry point for the technical assistance to the parks is the park management entity, it is recommended that technical assistance providers (such as UNIDO) and industrial parks work closely with government agencies in the countries on the EIP transformation through conducive policies (“top-down approaches”) on specific topics. Examples of these topics include the planning and zoning of industrial parks, incentives for companies to improve their energy efficiency, climate change mitigation and adaptation, and streamlining regulations to facilitate the safe reuse and recycling of industrial by-products and effluent streams.
Recommendations for further work:
  • This research article reports on the work with industrial parks in transition and developing countries. It is recommended that further EIP assessments are undertaken with industrial parks in countries in Europe, North America, and Oceania. Expanding the pool of assessed parks to more countries would provide further comparative insights in applying the International EIP Framework in multiple national/economic contexts and to assess similarities/differences in their EIP performance levels.
  • Further research and analysis into the root-causes of the differences and similarities of the EIP scorings at industrial park and country levels is desired (e.g., sampling, policy and regulations, access-to-finance, human and technical capabilities, local and national conditions).

Author Contributions

D.v.B., K.T., A.F. and C.B. were core members of the UNIDO team involved in the EIP assessments of the industrial parks as discussed in the article. They wrote and collaborated on this article together. C.S., UNIDO Project Manager of the Global Eco-Industrial Parks Programme, contributed to and reviewed the paper. All authors have read and agreed to the published version of the manuscript.

Funding

The Global Eco-Industrial Parks Programme (GEIPP) (2019–2023) is made possible by funding provided by the Swiss Government through the State Secretariat for Economic Affairs of Switzerland (SECO).

Acknowledgments

Acknowledgements to all UNIDO team members and experts who led, managed and/or contributed to EIP assessments of the 50 industrial parks in eight countries on which this report is based upon. Special acknowledgements to Frédéric Meylan, former UNIDO Project Coordinator for his inputs into the initial stages of the analysis presented in this research article. Acknowledgements go to all national counterparts, staff members of the park management and tenant firms of the industrial parks which participated in and contributed to UNIDO’s baseline and opportunity assessments against the International Framework for Eco-Industrial Parks. This research article is based on the same data set as the GEIPP Report “Lessons Learned from Assessing 50 Industrial Parks in Eight Countries against the International Framework for Eco-Industrial Parks”, which is also produced as part of UNIDO’s Global Eco-Industrial Parks Programme.

Conflicts of Interest

The authors declare no conflict of interest.

Appendix A

Appendix A.1. Pre-Selecting Industrial Parks for Their Participation in the EIP Assessments

The objective of this step is to pre-select industrial parks which meet the minimum criteria. The pre-selection criteria are presented in Table A1.
The minimum criteria are binary criteria which can be answered with “Yes” or “No”. A “No” answer to one or more criteria initiates a discussion within the project team on the suitability of the respective industrial park for its participation in the EIP assessments.
Table A1. Pre-selection criteria.
Pre-Selection CriteriaDescription
Park managementA distinct park management entity or alternative agency, where applicable, exists to handle park planning, operations and management, and monitoring.
SizeThe park area is larger than 100 hectares
Industrial activitiesA sufficient number of industries (>15) with distinct productive activities (e.g., not warehouses) are located in the industrial park.
Industrial park supports SMEs, either directly in industrial park or indirectly outside the park or through large corporations in the park.
Law and regulationNo signs of criminal activities or illegal businesses in the industrial park (difficulties to comply with environmental or social norms can be addressed by the EIP project).
Secrecy and confidentialityNo very sensitive and confidential industrial activities in the park.
RiskThe industrial park is not located in a very sensitive or high-risk area (e.g., flood-prone).
LocationThe industrial park can be easily accessed by practitioners who will work on the EIP project (e.g., national and international consultants).
CommitmentThere are clear signs that industries and park management want to work with project team to improve the environmental, social, and economic performances of the industrial park.

Appendix A.2. Prioritization of Industrial Parks for Their Participation in the EIP Assessments

The prioritization of pre-selected industrial parks is based on a set of qualitative criteria formulated as statements, as presented in Table A2. Each of the questions is answered for the pre-selected parks, by giving scores from 1 (totally disagree) to 6 (totally agree).
Table A2. Prioritization Criteria.
Prioritization CriteriaDescription
Park managementThe park management/developer has sufficient resources (e.g., human, financial) to work towards an EIP.
The industrial park is designed according to available master planning documents (e.g., zoning of infrastructure and utilities).
The park management demonstrates a clear commitment and willingness to work on the EIP project (rapid answer to mail, enthusiastic people, and commitment from senior park management staff, etc.).
Environmental aspectsThe total number (and the diversity) of industries located in the park is sufficient to envisage developing industrial synergies.
It is technically possible to improve the environmental aspects of the industrial park (e.g., free space for construction of wastewater treatment plant, potential for renewable electricity generation).
The park management and the industries demonstrate a clear willingness to develop resource efficiency and cleaner production.
Social aspectsThe reputation of the park is sufficiently good to allow for the development of long-term and advanced community and/or government collaborations.
The industries and the park management take care of labor condition (e.g., working conditions comply with national and sectoral norms).
Park management and tenant companies show commitment to improve gender equality.
Economic aspectsPark management and industries have capacity to invest (or attract investment) in the development of new infrastructures or the modification existing infrastructures and utilities.
The industrial park stimulates local economy (i.e., attract industries, contribute to local business development and job creation, etc.).
ReplicabilityThe industrial activities present in the park are representative of the national economic landscape.
The size of companies (in terms of number of workers) and of the industrial park (in terms of land area) is representative of their national averages.
The features (e.g., tax regime, geographic location) of the industrial park are representative of other industrial parks in the country.
Developer/management company operates more than one industrial park in the country or internationally.
VisibilityThe industrial park is sufficiently large and productive to be visible at a national scale.
The industrial park has significant potential for collaborations with other sustainable development projects in the country.
The industrial park is aligned with existing policies and priorities of local, regional, and national government
Stakeholders implied in the EIP development would be interested in sharing their experience (e.g., participation in conferences, workshop, interviews).

Appendix B

Table A3. List of 51 prerequisites and performance indicators as outlined in the International Framework for Eco-Industrial Parks (December 2017 version) [3], including categorization of potential cost implications of prerequisites and performance indicators. Note: Table highlights the main categories of the International EIP Framework in different background colors.
CategoryTopicDescription/RequirementReview of Potential Cost Implications
of Prerequisites and Performance Indicators
Largely Driven by Human EffortsLargely Driven by Financial Investments
Park managementPrerequisites
Park management servicesA distinct park management entity (or alternative agency, where applicable) exists to handle park planning, operations and management, and monitoring.X
Park management entity to manage and maintain the industrial park property, common infrastructure, and services as prescribed in the tenant contract and the park’s Master Plan. This should include, but is not limited to the following:
  • Property management, including plot allotments, re-allotments, development, land use monitoring, and so on.
  • Utilities, roads, and technical units such as waste and wastewater treatment plants and operations, power and energy systems.
  • Waste collection areas and services.
  • Maintenance and repair workshops.
  • Security and emergency response services and facilities.
  • Common landscaping, buffer zones, street lighting, security surveillance, and street cleaning.
  • Common employee and tenant facilities.
  • Provide facilitating services to and between tenant firms (for example, networking, collaboration, and training opportunities).
  • Engagement with the park’s stakeholders and business representatives.
X
Monitoring and risk managementPark management entity maintains a monitoring system in place, tracking:
  • Progress on environmental, social, and economic performance at the park level.
  • Critical risk factors and related responses, at least for:
    Risk points where the accidental release of poisonous solid, liquid, and gaseous effluents, including during transportation and disposal when fire hazards are possible; and
    Applicable natural disaster risks (for example, earthquakes)
X
Where required, park management has a plan in place to react to possible negative impacts due to climate change risks (heat waves and droughts, storms and floodwater events). All adaption needs for infrastructure and services are identified and in place for the industrial estate to protect against climate change risks and potential damages.X
Park management entity has a functioning system in place to comply with local/national regulations and international standards applicable to the industrial park. Park management informs compliance by resident firms including compliance information that firms share with the park management entity.X
Planning and zoningA Master Plan (or equivalent planning document) for any new and existing industrial park has been developed and is reviewed periodically (and updated if required), including the following core elements:
  • Site selection study based on various risk analyses; essential and efficient infrastructure, utilities, and transportation network; environmental and social issues; internal park land zoning; buffer zone around the park; procedure to safely locate high-risk industries; and cluster synergistic industries.
  • Integration into Master Plan of relevant requirements specified in these international EIP benchmarks that have spatial implications.
X
Performance indicators
Park management services100% of firms in the industrial park have signed a residency contract/ park charter/code of conduct (depending on what is legally binding on park firms according to the existing legislation in the country); and additional legally binding arrangements that empower the park management entity to perform its responsibilities and tasks and charge fees (sometimes absorbed in rental fees) for common services. This may include transparent fees for services pertaining to the achievement of EIP performance targets.X
At least 75% of resident firms indicate satisfaction with regards to the provision of services and common infrastructure by the park management’s entity (or alternative agency, where applicable). X
Monitoring and risk managementAt least every six months, the park management entity monitors and prepares consolidated reports regarding the achievement of target values (as documented in this framework) to encompass the following:
  • Environmental performance;
  • Social performance;
  • Economic performance; and
  • Critical risk management at the level of the park.
X
Environmental performancePrerequisites
Management and monitoringPark management entity operates an environmental/energy management system in line with internationally certified standards, monitoring park performance and supporting resident firms in the maintenance of their own firm-level management systems.X
EnergySupporting programs and documents are in place to improve the energy efficiency of resident firms, especially for the top 50% of major energy-consuming businesses in the park.X
An industrial heat-recovery strategy is in place to investigate opportunities for heat and energy recovery for the major energy-consuming firms in the park. (Typically, these are firms that individually consume at least 10–20% of the total firm-level energy consumption). X
WaterPark management entity has demonstrable plans and (preferably) prior documented evidence to increase water reuse in the short and medium term. This would be achieved by either reuse of industrial effluents, or by rainwater/storm water collection. X
Climate change and the natural environmentA program is established to monitor, mitigate, and/or minimize greenhouse gas (GHG) emissions, such as carbon dioxide (CO2), methane (CH4), nitrogen oxide (NOx), and so on. There is clear evidence of steps taken to introduce mitigation activities. X
The park management entity has a plan in place to assess operational environmental impacts and aims to limit the impact on prioritized local ecosystem services.X
Performance indicators
Management and monitoringAt least 40% of resident firms with more than 250 employees have an environmental/energy management system in place that is in line with internationally certified standards.X
EnergyAt least 90% of combined park facilities and firm-level energy consumptions have metering and monitoring systems in place.X
Total renewable energy use in the industrial park is equal to or greater than the annual national average energy mix. X
Park management entity sets and works toward ambitious (beyond industry norms) maximum carbon intensity targets (maximum kilograms of carbon dioxide equivalent (kg CO2-eq)/kilowatt hour (kWh) for the park and its residents. Targets should be established for the short, medium, and long term, in line with local norms and industry sector benchmarks. X
Park management entity sets and works toward ambitious maximum energy intensity targets per production unit (kWh/$ turnover) for the park and its residents. Targets should be established for the short, medium, and long term, in line with local norms and industry sector benchmarks. X
Water100% of the total water demand from firms in the industrial park does not have significant negative impacts on local water sources or local communities. X
At least 95% of industrial wastewater generated by the industrial park and resident firms is treated to appropriate environmental standards. X
At least 50% of total industrial wastewater from firms in the park is reused responsibly within or outside the industrial park. X
Waste and material useAt least 20% of solid waste generated by firms is reused by other firms, neighboring communities, or municipalities. X
100% of firms in the park appropriately handle, store, transport, and dispose of toxic and hazardous materials. X
Less than 50% of wastes generated by firms in the industrial park goes to landfills. X
Climate change and the natural environmentAt least 5% of open space in the park is used for native flora and fauna.X
At least 50% of firms in park have pollution prevention and emission reduction strategies to reduce the intensity and mass flow of pollution/emission release beyond national regulations. X
At least 30% of the largest polluters in industrial park have a risk management framework in place that: (a) identifies the aspects which have an impact on the environment; and (b) assign a level of significance to each environmental aspect.X
Social performancePrerequisites
Social management systemsDedicated personnel exist (as part of the park management entity) to plan and manage social quality standards.X
Social infrastructureEssential primary social infrastructure has been adequately provided in the site master plan and is fully operational in the park. X
Performance indicators
Social management systemsAt least 75% of all firms in the industrial park with more than 250 employees have a well-functioning OH&S management system in place.X
100% of grievances received by the park management entity are addressed within 90 days.X
At least 60% of grievances received by the park management entity are brought to conclusion.X
At least 75% of all firms in the industrial park with more than 250 employees have a code of conduct system in place to deal with grievances.X
At least 75% of all firms in the industrial park with more than 250 employees have a harassment prevention and response system in place.X
Social infrastructureAt least 80% of the surveyed employees report satisfaction with social infrastructure. X
100% of reported security and safety issues are adequately addressed within 30 days. X
75% of all firms in the industrial park with more than 250 employees have a program for skills/vocational training and development.X
At least 20% of the female workforce benefit from available supporting infrastructure/programs for skills development.X
Local community outreachAt least 80% of surveyed community members are satisfied with the community dialogue.X
At least two outreach activities that are implemented by the park management entity annually are regarded as positive by over 80% of the surveyed community members.X
Economic performancePrerequisites
Employment generationThe park management entity has plans to generate specific numbers and types of jobs (including diversity and inclusiveness) in line with government targets.X
Local business & SME promotionThe park management entity allows and promotes the establishment of SMEs that provide services and add value to park residents. X
Economic value creationA market demand and feasibility study, supported by a business plan, for specific “green” infrastructure and service offerings has been undertaken to justify planning and implementation in the industrial park.X
Tracked by the park management entity, the industrial park fulfils relevant government targets, including domestic, foreign direct investment, and tax revenues.X
Performance indicators
Employment generationAt least 60% of total workers employed in industrial park live within daily commuting distance.X
At least 25% of total firm workers in industrial park are employed through direct employment (that is, not employed on a fee-for-output basis or provided through a labor supply firm) and permanent contracts.X
Local business and SME promotionAt least 25% of resident firms use local suppliers or service providers for at least 80% of their total procurement value.X
At least 90% of total procurement value of the park management entity is supplied by local firms or service providers.X
Economic value creationOn average, the occupancy rate of space available for resident firms was >50% over the last 5 years.X

Appendix C

Table A4. Root-cause review of the 21 prerequisites and performance indicators with a compliance lower than 50%. Note: Table highlights the main categories of the International EIP Framework in different background colors.
International EIP Framework CategoryEIP Prerequisites and
Performance Indicators
Root-Causes of Low Compliance with Prerequisites/Performance Indicators
At Least 7 out of 8 Countries Have Compliance ≤ 50%:At Least 2 out of 8 Countries Have Compliance ≥ 50%:Comments on Root-Causes for Low Compliance
Consider Modification of Prerequisite/IndicatorCompliance Seems Mainly with Industrial Park/Country Specific Conditions
Park managementWhere required, park management has a plan in place to react to possible negative impacts due to climate change risks (heat waves and droughts, storms and floodwater events). XThis is a binary prerequisite which should not be edited to increase compliance levels. it is important for EIPs to address this issue.
At least every six months, park management entity monitors and prepares consolidated reports regarding the achievement of target values (as documented in this framework) to encompass the following: environmental performance; social performance; economic performance; and critical risk management at the level of the park.X Many parks assessed do not report periodically on their sustainability performance. It could be argued that the reporting frequency of six months should be changed to annually.
Environmental performancePark management entity operates an environmental/energy management system in line with internationally certified standards, monitoring park performance and supporting resident firms in the maintenance of their own firm-level management systems. XThis is a binary prerequisite which should not be edited to increase compliance levels. It is important for EIPs to address this issue. However, there the prerequisite could be rephrased to increase clarity (e.g., environmental and/or energy management system?)
Supporting programs and documents are in place to improve the energy efficiency of resident firms, especially for the top 50% of major energy-consuming businesses in the park. XThis is a binary prerequisite which should not be edited to increase compliance levels. It is important for EIPs to address this issue.
An industrial heat-recovery strategy is in place to investigate opportunities for heat and energy recovery for the major energy-consuming firms in the park.X Prerequisite is mostly relevant to very advanced industrial parks which have energy intensive heat streams. Heat recovery is mainly done at firm level, rather than at park level.
Park management entity has demonstrable plans and (preferably) prior documented evidence to increase water reuse in the short and medium term. This would be achieved by either reuse of industrial effluents, or by rainwater/storm water collection. XThis is a binary prerequisite which should not be edited to increase compliance levels. It is important for EIPs to address this issue.
A program is established to monitor, mitigate, and/or minimize GHG emissions, such as carbon dioxide (CO2), methane (CH4), nitrogen oxide (NOx), and so on. XThis is a binary prerequisite which should not be edited to increase compliance levels. It is important for EIPs to address this issue.
The park management entity has a plan in place to assess operational environmental impacts and aims to limit the impact on prioritized local ecosystem services. XThis is a binary prerequisite which should not be edited to increase compliance levels. It is important for EIPs to address this issue.
Park management entity sets and works toward ambitious (beyond industry norms) maximum carbon intensity targets (maximum kilograms of carbon dioxide equivalent (kg CO2-eq)/kilowatt hour (kWh) for the park and its residents.X These two performance indicators are too ambitious for many industrial parks and require data that is most often not available. It is very difficult to obtain a meaningful data series over a time period to measure progress on this indicator. The number and types of firms in industrial park is not a constant factor. It will be very challenging to collect data to calculate indicators consistently and reliably.
Park management entity sets and works toward ambitious maximum energy intensity targets per production unit (kWh/$ turnover) for the park and its residents.X
At least 50% of total industrial wastewater from firms in the park is reused responsibly within or outside the industrial park.X This performance level of this indicator seems too stringent for most industrial parks.
At least 20% of solid waste generated by firms is reused by other firms, neighboring communities, or municipalities. XAlthough this performance indicator could be clearer defined (e.g., distinguish between water reuse and recycling), it is important for EIPs to address this issue.
Less than 50% of wastes generated by firms in the industrial park goes to landfills. XAlthough this performance indicator could be clearer defined (e.g., indicator to cover both landfilling and waste burning without proper incineration infrastructure), it is important for EIPs to address this issue.
At least 50% of firms in the park have pollution prevention and emission reduction strategies to reduce the intensity and mass flow of pollution/emission release beyond national regulations. XAlthough the formulation of this performance indicator is relatively complex, it is important for EIPs to address this issue, although the ‘beyond national regulations’ reduces drastically its applicability.
Social performanceAt least 75% of all firms in the industrial park with more than 250 employees have a harassment prevention and response system in place. XLow compliance levels across these social indicators may indicate that a large proportion of the assessed parks do not yet have the implementation mechanisms, data collection systems on OH&S and human resources, confidence, and/or capabilities to undertake the community outreach and dialogues.
At least 80% of the surveyed employees report satisfaction with social infrastructure X
At least 20% of the female workforce benefit from available supporting infrastructure/programs for skills development. X
At least 80% of surveyed community members are satisfied with the community dialogue. X
At least two outreach activities that are implemented by the park management entity annually are regarded as positive by over 80% of the surveyed community members. X
Economic performanceA market demand and feasibility study, supported by a business plan, for specific “green” infrastructure and service offerings has been undertaken to justify planning and implementation in the industrial park. XAlthough the formulation of this performance indicator is relatively complex, it is important for EIPs to address this issue.
At least 25% of resident firms use local suppliers or service providers for at least 80% of their total procurement value. XThis indicator is naturally linked to the sectors/products of the specific park under analysis. Further, a main issue with this indicator seems to be with the data compilation by tenant firms and park management.

References

  1. United Nations. Transforming our World: The 2030 Agenda for Sustainable Development; General Assembly of United Nations: New York, NY, USA, 2015. [Google Scholar]
  2. United Nations Industrial Development Organization. Eco-Industrial Parks: Achievements and Key Insights from the Global RECP Programme 2012–2018; United Nations Industrial Development Organization: Vienna, Austria, 2019. [Google Scholar]
  3. United Nations Industrial Development Organization; World Bank Group; Deutsche Gesellschaft für Internationale Zusammenarbeit. An International Framework for Eco-Industrial Parks, © World Bank. License: CC BY 3.0 IGO; World Bank: Washington, DC, USA, 2017. [Google Scholar]
  4. Côté, R.; Cohen-Rosenthal, E. Designing eco-industrial parks: A synthesis of some experience. J. Clean. Prod. 1998, 6, 181–188. [Google Scholar] [CrossRef] [Green Version]
  5. Chertow, M.R. The eco-industrial park model reconsidered. J. Ind. Ecol. 2008, 2, 8–10. [Google Scholar] [CrossRef]
  6. Lowe, E.A.; Moran, S.R.; Holmes, D.B. Eco-Industrial Parks: A Handbook for Local Development Teams; Indigo Development: Oakland, CA, USA, 1995. [Google Scholar]
  7. Jacobsen, N.B. Industrial symbiosis in Kalundborg, Denmark: A quantitative assessment of economic and environmental Aspects. J. Ind. Ecol. 2006, 10, 239–255. [Google Scholar] [CrossRef]
  8. Valero, A.; Usón, S.; Costa, J. Exergy analysis of the industrial symbiosis model in Kalundborg. Proc. ECOS 2012, 25, 218/1–218/11. [Google Scholar]
  9. Valentine, S.V. Kalundborg symbiosis: Fostering progressive innovation in environmental networks. J. Clean. Prod. 2016, 118, 65–77. [Google Scholar] [CrossRef]
  10. Ayres, R. Industrial metabolism: Theory and policy. In The Greening of Industrial Ecosystems; Richards, D., Allenby, B., Frosch, R., Eds.; National Academy of Science: Washington, DC, USA, 1995. [Google Scholar]
  11. Baas, L. Cleaner production and industrial ecosystems, a Dutch experience. J. Clean. Prod. 1998, 6, 189–197. [Google Scholar] [CrossRef]
  12. Taddeo, R.; Simboli, A.; Morgante, A. Implementing eco-industrial parks in existing clusters. Findings from a historical Italian chemical site. J. Clean. Prod. 2012, 33, 22–29. [Google Scholar] [CrossRef]
  13. Ribeiro, P.; Fonseca, F.; Neiva, C.; Bardi, T.; Lourenço, J.M. An integrated approach towards transforming an industrial park into an eco-industrial park: The case of Salaise-Sablons. J. Environ. Plan. Manag. 2018, 61, 195–213. [Google Scholar] [CrossRef]
  14. Yu, C.; de Jong, M.; Dijkema, G.P.J. Process analysis of eco-industrial park development. The case of Tianjin, China. J. Clean. Prod. 2014, 64, 464–477. [Google Scholar] [CrossRef]
  15. Zheng, H.M.; Zhang, Y.; Yang, N.J. Evaluation of an eco-índustrial park based on a social network analysis. Procedia Environ. Sci. 2012, 13, 1624–1629. [Google Scholar] [CrossRef] [Green Version]
  16. Chertow, M.R. Industrial symbiosis: Literature and taxonomy. Annu. Rev. Energy Environ. 2000, 25, 313–337. [Google Scholar] [CrossRef] [Green Version]
  17. Geng, Y.; Zhang, P.; Côté, R.P.; Fujita, T. Assessment of the national eco-industrial park standard for promoting industrial symbiosis in China. J. Ind. Ecol. 2009, 13, 15–26. [Google Scholar] [CrossRef]
  18. Fujii, M.; Fujita, T.; Dong, L.; Lu, C.; Geng, Y.; Behera, S.K.; Park, H.-S.; Chiu, A.S.F. Possibility of developing low-carbon industries through urban symbiosis in Asian cities. Post Foss. Carbon Soc. Regen. Prev. Eco-Ind. Dev. 2016, 114, 376–386. [Google Scholar] [CrossRef]
  19. Van Beers, D.; Corder, G.; Bossilkov, A.; van Berkel, R. Industrial symbiosis in the Australian minerals industry–The cases of Kwinana and Gladstone. J. Ind. Ecol. 2007, 11, 55–72. [Google Scholar] [CrossRef] [Green Version]
  20. Van Berkel, R.; Fujita, T.; Hashimoto, S.; Fujii, M. Quantitative assessment of urban and industrial symbiosis in Kawasaki, Japan. Environ. Sci. Technol. 2009, 43, 1271–1281. [Google Scholar] [CrossRef] [PubMed] [Green Version]
  21. World Bank Group. Low-Carbon Zones–A Practitioner’s Handbook; World Bank Group, Investment Climate Department: Washington, DC, USA, 2014. [Google Scholar]
  22. Lowe, E.A. Eco-Industrial Park Handbook for Asian Developing Countries; Asian Development Bank: Manila, Philippines, 2001. [Google Scholar]
  23. Deutsche Gesellschaft für Internationale Zusammenarbeit. Guidelines for Sustainable Industrial Areas-Version 1.0 (October); Deutsche Gesellschaft für Internationale Zusammenarbeit (GIZ) GmbH: Eschborn, Germany, 2015. [Google Scholar]
  24. United Nations Industrial Development Organization. Global Assessment of Eco-Industrial Parks in Developing and Emerging Countries: Achievements, Good Practices and Lessons Learned from Thirty-Three Industrial Parks in Twelve Selected Emerging and Developing Countries; United Nations Industrial Development Organization: Vienna, Austria, 2016. [Google Scholar]
  25. World Bank Group. Mainstreaming Eco-Industrial Parks; World Bank Group: Washington, DC, USA, 2016. [Google Scholar]
  26. Van Berkel, R. Regional Resource Synergies for Sustainable Development in Heavy Industrial Areas: An Overview of Opportunities and Experiences; Curtin University of Technology: Perth, Australia, 2006. [Google Scholar]
  27. Batten, D. Converting waste into wealth: The scope for eco-industrial complexes in Australian regions. In Proceedings of the World Congress of the International Solid Waste Association (ISWA), Melbourne, Australia, 9–14 November 2003. [Google Scholar]
  28. United Nations Industrial Development Organization. Implementation Handbook for Eco-Industrial Parks; United Nations Industrial Development Organization: Vienna, Austria, 2017. [Google Scholar]
  29. Fonseca, L.M.; Domingues, J.P.; Dima, A.M. Mapping the Sustainable Development Goals relationships. Sustainability 2020, 12, 3359. [Google Scholar] [CrossRef] [Green Version]
  30. Organisation for Economic Co-operation and Development. Green Growth Indicators Framework; Organisation for Economic Co-operation and Development: Paris, France, 2017. [Google Scholar]
  31. Indian Green Building Council. Green Special Economic Zone (SEZ) Rating System; Indian Green Building Council: Hyderabad, India, 2010. [Google Scholar]
  32. Von Hauff, M.; Fischer, K. Industrial and commercial zone planning according to the requirements of sustainable development. In Sustainable Development Policy: A European Perspective; Routledge: Abingdon, UK; New York, NY, USA, 2017. [Google Scholar]
  33. Van Beers, D.; Flammini, A.; Meylan, F.D.; Stucki, J. Lessons Learned from the Application of the UNIDO Eco-Industrial Park Toolbox in Viet Nam and Other Countries. Sustainability 2019, 11, 4687. [Google Scholar] [CrossRef] [Green Version]
  34. Deutsche Gesellschaft für Internationale Zusammenarbeit. Sustainable Industrial Area Toolbox. Available online: https://www.sia-toolbox.net/ (accessed on 22 August 2020).
  35. CII–Godrej GBC. Resource Efficient and Cleaner Production (RECP) Pilot Project to Foster Eco-Industrial Development in Eco-Industrial Parks in India; Confederation of Indian Industry Green Business Centre: Hyderabad, India, 2016. [Google Scholar]
  36. World Bank Group. Public-Private Dialogue (PPD) Stakeholder Mapping Toolkit: A Practical Guide for Stakeholder Analysis in PPD Using the Net-Map Method; World Bank Group: Washington, DC, USA, 2016. [Google Scholar]
  37. United Nations Industrial Development Organization; UN Environment Programme. Enterprise-Level Indicators for Resource Productivity and Pollution Intensity: A Primer for Small and Medium-Sized Enterprises; United Nations Industrial Development Organization and United Nations Environment Programme: Vienna, Austria; Paris, France, 2010. [Google Scholar]
  38. United Nations Industrial Development Organization; World Bank Group; Deutsche Gesellschaft für Internationale Zusammenarbeit; Ministry of Trade, industry and Energy. Practitioner’s Handbook for Eco-Industrial Parks; World Bank: Washington, DC, USA, 2018. [Google Scholar]
  39. United Nations Industrial Development Organization. Eco-Industrial Parks (EIP) Toolbox; United Nations Industrial Development Organization: Vienna, Austria, 2017. [Google Scholar]
  40. International Finance Corporation; MPI. National Technical Guidelines for Eco-Industrial Parks in Viet Nam; International Finance Corporation and and Ministry of Planning and Investment of Viet Nam: Hanoi, Vietnam, 2018. [Google Scholar]
  41. Van Beers, D.; Bossilkov, A.; Lund, C. Development of large scale reuses of inorganic by-products in Australia: The case study of Kwinana, Western Australia. Resour. Conserv. Recycl. 2009, 53, 365–378. [Google Scholar] [CrossRef]
Figure 1. Methodology to assess EIP performance of industrial parks and evaluate results.
Sustainability 12 10611 g001
Figure 2. Overall framework for describing eco-industrial parks [3].
Sustainability 12 10611 g002
Figure 3. Overview of UNIDO’s EIP Assessment Tool.
Sustainability 12 10611 g003
Figure 4. Current and intended performance of 50 industrial parks measured against the International EIP Framework.
Sustainability 12 10611 g004
Figure 5. Average performance of assessed industrial parks measured against the International EIP Framework.
Sustainability 12 10611 g005
Figure 6. EIP scorings of lighthouse parks versus the “average” of industrial parks.
Sustainability 12 10611 g006
Figure 7. Comparing two counting methods for total EIP scoring of industrial parks.
Sustainability 12 10611 g007
Figure 8. Compliance levels per category and topic of International EIP Framework.
Sustainability 12 10611 g008
Figure 9. EIP scorings grouped by type of park management entity.
Sustainability 12 10611 g009
Table 1. Basic characteristics and EIP scorings of the 50 assessed industrial parks.
Industrial Parks AssessedBasic CharacteristicsEIP Scorings
OwnershipTotal Area% Land OccupiedCurrent PerformanceIntended PerformanceImprovement Potential
Average
50 parks
53663%58%77%19%
Colombia–Average 117 ha65%58%77%19%
Park 1Private sector116 ha65%62%76%13%
Park 2Private sector200 ha45%73%83%9%
Park 3Private sector64 ha75%70%79%9%
Park 4Private sector134 ha80%68%84%15%
Park 5Private sector70 ha60%65%76%11%
Egypt–
Average
31468%57%76%19%
Park 6Public sector332 ha50%45%73%28%
Park 7Private sector310 ha90%66%82%15%
Park 8Public–private partnership300 ha65%60%74%14%
Indonesia–
Average
84374%67%83%16%
Park 9Private sector1400 ha60%71%89%18%
Park 10Private sector1400 ha80%69%90%21%
Park 11Private sector3500 ha75%61%87%26%
Park 12Private sector350 ha90%68%82%15%
Park 13Private sector540 ha75%70%90%21%
Park 14Private sector270 ha60%76%91%15%
Park 15Public sector140 ha100%53%58%5%
Park 16Private sector442 ha90%74%84%11%
Park 17Private sector307 ha40%56%71%15%
Park 18Private sector115 ha50%59%78%18%
Park 19Private sector805 haUp to 100%86%97%11%
Nigeria–
Average
157650%54%76%22%
Park 20Public sector152 ha80%42%69%26%
Park 21Public sector3000 ha<20%66%83%18%
Peru–
Average
21645%46%61%16%
Park 22Private sector137 ha60%33%56%23%
Park 23Private sector526 ha<10%56%68%12%
Park 24Private sector207 ha<10%47%64%17%
Park 25Private sector208 ha<10%59%76%16%
Park 26Private sector150 ha80%41%58%18%
Park 27Private sector66 ha100%39%45%6%
South Africa–
Average
53852%55%80%25%
Park 28Public–private partnership236 ha50%84%94%10%
Park 29Public sector250 ha75%45%78%33%
Park 30Public–private partnership130 ha30%72%84%12%
Park 31Public sector455 ha40%52%83%31%
Park 32Public sector222 ha>80%29%66%36%
Park 33Public sector124 ha80%56%82%26%
Park 34Public sector154 ha50%39%73%34%
Park 35Public sector125 ha>80%49%75%26%
Park 36Public sector300 ha50%39%68%28%
Park 37Public–private partnership119 ha21%66%94%28%
Park 38Public–private partnership3800 ha15%70%83%14%
Ukraine–
Average
13563%41%68%27%
Park 39Private sector270 ha70%36%65%28%
Park 40Private sector8.5 ha75%43%69%25%
Park 41Public–private partnership10 ha70%41%69%27%
Park 42Public sector250 ha35%43%72%28%
Viet Nam-
Average
63878%63%79%16%
Park 43Private sector948 ha50%70%81%12%
Park 44Private sector596 ha81%55%81%26%
Park 45Public sector351 ha70%59%74%15%
Park 46Public sector394 ha100%64%78%15%
Park 47Public sector300 ha95%54%77%24%
Park 48Private sector1686 ha45%67%76%10%
Park 49Public–private partnership488 ha90%63%75%13%
Park 50Private sector344 ha94%75%87%12%
Table 2. Parks’ performances on prerequisites and indicators: categorized by lower and higher cost implications.
Industrial ParksCurrent Performance of Industrial Parks
All 51 Prerequisites
and Indicators
(total EIP Scoring)
Prerequisites and Indicators Largely Driven by Human Efforts and Low InvestmentsPrerequisites and Indicators Largely Driven by Financial Investments
All 50 assessed parks58%60%50%
Performance Category Averages
Parks with higher EIP performance
(EIP scoring > 70%)
74%77%63%
Parks with medium EIP performance
(EIP scoring between 50% and 70%)
61%63%53%
Parks with lower EIP performance
(EIP scoring < 50%)
41%42%34%
Publisher’s Note: MDPI stays neutral with regard to jurisdictional claims in published maps and institutional affiliations.

