Article

The Impact of Structure Similarity of Nontariff Measures on Agricultural Trade

1
Department of Applied Economics, Jeju National University, Jeju 63243, Korea
2
Department of Agricultural, Food and Resource Economics, Michigan State University, East Lansing, MI 48824, USA
3
Department of Agricultural and Resource Economics, Kangwon National University, Chuncheon 24341, Korea
*
Author to whom correspondence should be addressed.
Sustainability 2020, 12(24), 10545; https://doi.org/10.3390/su122410545
Submission received: 5 November 2020 / Revised: 2 December 2020 / Accepted: 15 December 2020 / Published: 16 December 2020
(This article belongs to the Section Sustainable Agriculture)

Abstract

:
This study quantifies the structure similarity of nontariff measures between countries and estimates its impact on bilateral agricultural trade using a structural gravity model. The findings show that a similar structure of technical barriers to trade (TBT) between countries is likely to expand their bilateral trade. However, a similar structure of sanitary and phytosanitary measures (SPS) is shown to have negative impacts on agricultural trade. We also discuss the effects of regulatory harmonization on sustainable development.

1. Introduction

Due to the proliferation of bilateral and multilateral trade agreements, tariff barriers between nations have been reduced, but nontariff measures continue to hamper exports [1,2]. As the world has pursued “free trade” during the past 70 years, the global economy has grown rapidly in line with the expansion in trade. In contrast, distribution between domestic industries has not been properly achieved and polarization has intensified. As global economic growth has slowed, willingness by countries to protect their industries and maintain market competitiveness has stimulated the use of nontariff measures (NTMs), rather than direct tariffs measures, as an indirect means of protection. In particular, after the 2008 financial crisis, due to the Chinese economic slowdown and political and economic stagnation in the eurozone, countries expanded their use of import restrictions. Due to a trend of strengthening protectionism in major countries around the world, nontariff measures are expected to continue to increase.
However, as the United Nations noted, “NTMs are not inherently good or bad” [3]. NTMs are various and broad regulations imposed by governments to serve legitimate and necessary purposes to protect human, animal, and plant health, and also to protect industry from serious threats caused by increased imports. NTMs consist of technical measures, such as sanitary and phytosanitary measures (SPS) and technical barriers to trade (TBT), and nontechnical measures, such as antidumping and countervailing duties and safeguards. Many nontechnical measures are contingent trade protection measures. In contrast, technical measures, such as SPS and TBT, typically relate to issues of standards and human, animal, and plant safety. These include, for example, tolerance limits for residuals; restrictions on the use of additives and poisonous substances; hygienic and quarantine requirements; other measures to prevent dissemination of diseases; labelling, marketing, and packaging requirements; and conformity of assessment procedures [3,4]. These may affect trade, but their intent is not discriminatory or protectionist [3].
Due to the rise of nontariff measures and the development of an NTM database, previous studies have examined the impact of NTMs on trade volume and price [5,6,7]. These have shown several different effects in several respects. Disdier et al. [7] analyzed the impact of SPS and TBT measures of countries of the Organization for Economic Cooperation and Development (OECD) on the export of agricultural and food products. Analysis results showed that OECD countries’ exports were not affected by SPS and TBT measures of other OECD countries, whereas developing countries were negatively affected by NTMs. Beghin et al. [5] also analyzed the effect of NTMs on trade using meta-analysis, finding that NTMs in the agricultural and food industry negatively affected exporting countries compared to those in other industries. In particular, the SPS measures hinder the export of agricultural and food products from developing countries to developed markets, and this effect was greater than the impact of similar measures on trade between developing countries. Alternatively, other studies [8,9,10,11] have shown that NTMs (in this case, introduction of national regulations) may promote trade depending on the country or industry. For example, Anders and Caswell [11] empirically found that the introduction of Hazard Analysis Critical Control Point (HACCP) in the U.S. aquatic products sector for major exporting countries may act as a facilitator or a barrier depending on the country type. Moenius [9] found that NTMs have an effect of promoting trade in the manufacturing sector but had a negative effect on the agricultural sector.
In addition to efforts to diminish the adverse effect in each country of NTMs that hinder trade, the OECD also strives to reduce the regulatory divergences across countries through the International Regulatory Cooperation (IRC) mechanism [12]. Furthermore, the Asia-Pacific Economic Cooperation (APEC) and the World Trade Organization (WTO) pursue regulatory cooperation and work to harmonize regulations to facilitate trade [13,14]. The harmonization of regulations is the strongest form of regulatory cooperation via the adoption of uniform standards and systems across countries [3]. Adherence to international standards is one means of regulatory harmonization [3]. In regard to regulatory cooperation and harmonization, a number of recent studies have introduced the concept of regulatory distance and modeled the harmonization impact to evaluate the impact of harmonization within a regional group [3,15,16].
This study attempts to evaluate the effect of regulatory harmonization by analyzing the effects of NTM structure similarity on trade. Although technical and nontechnical NTMs exist, this study focuses on technical NTMs that can be compared across countries. In the following section, we outline the status of the NTMs around the world. We then describe our model, methods, and data used for the analysis. Then, we show the estimation results. Finally, we discuss the results and implications and possible expansions of this study.

2. Trend of Nontariff Measures (NTMs)

2.1. The Entire Industry

NTMs for all industries have steadily increased since the 2000s, recording their highest level in 2010 (3181 measures; Figure 1). Among these, NTMs related to agricultural and food products accounted for 34.2% of the total NTMs on average.
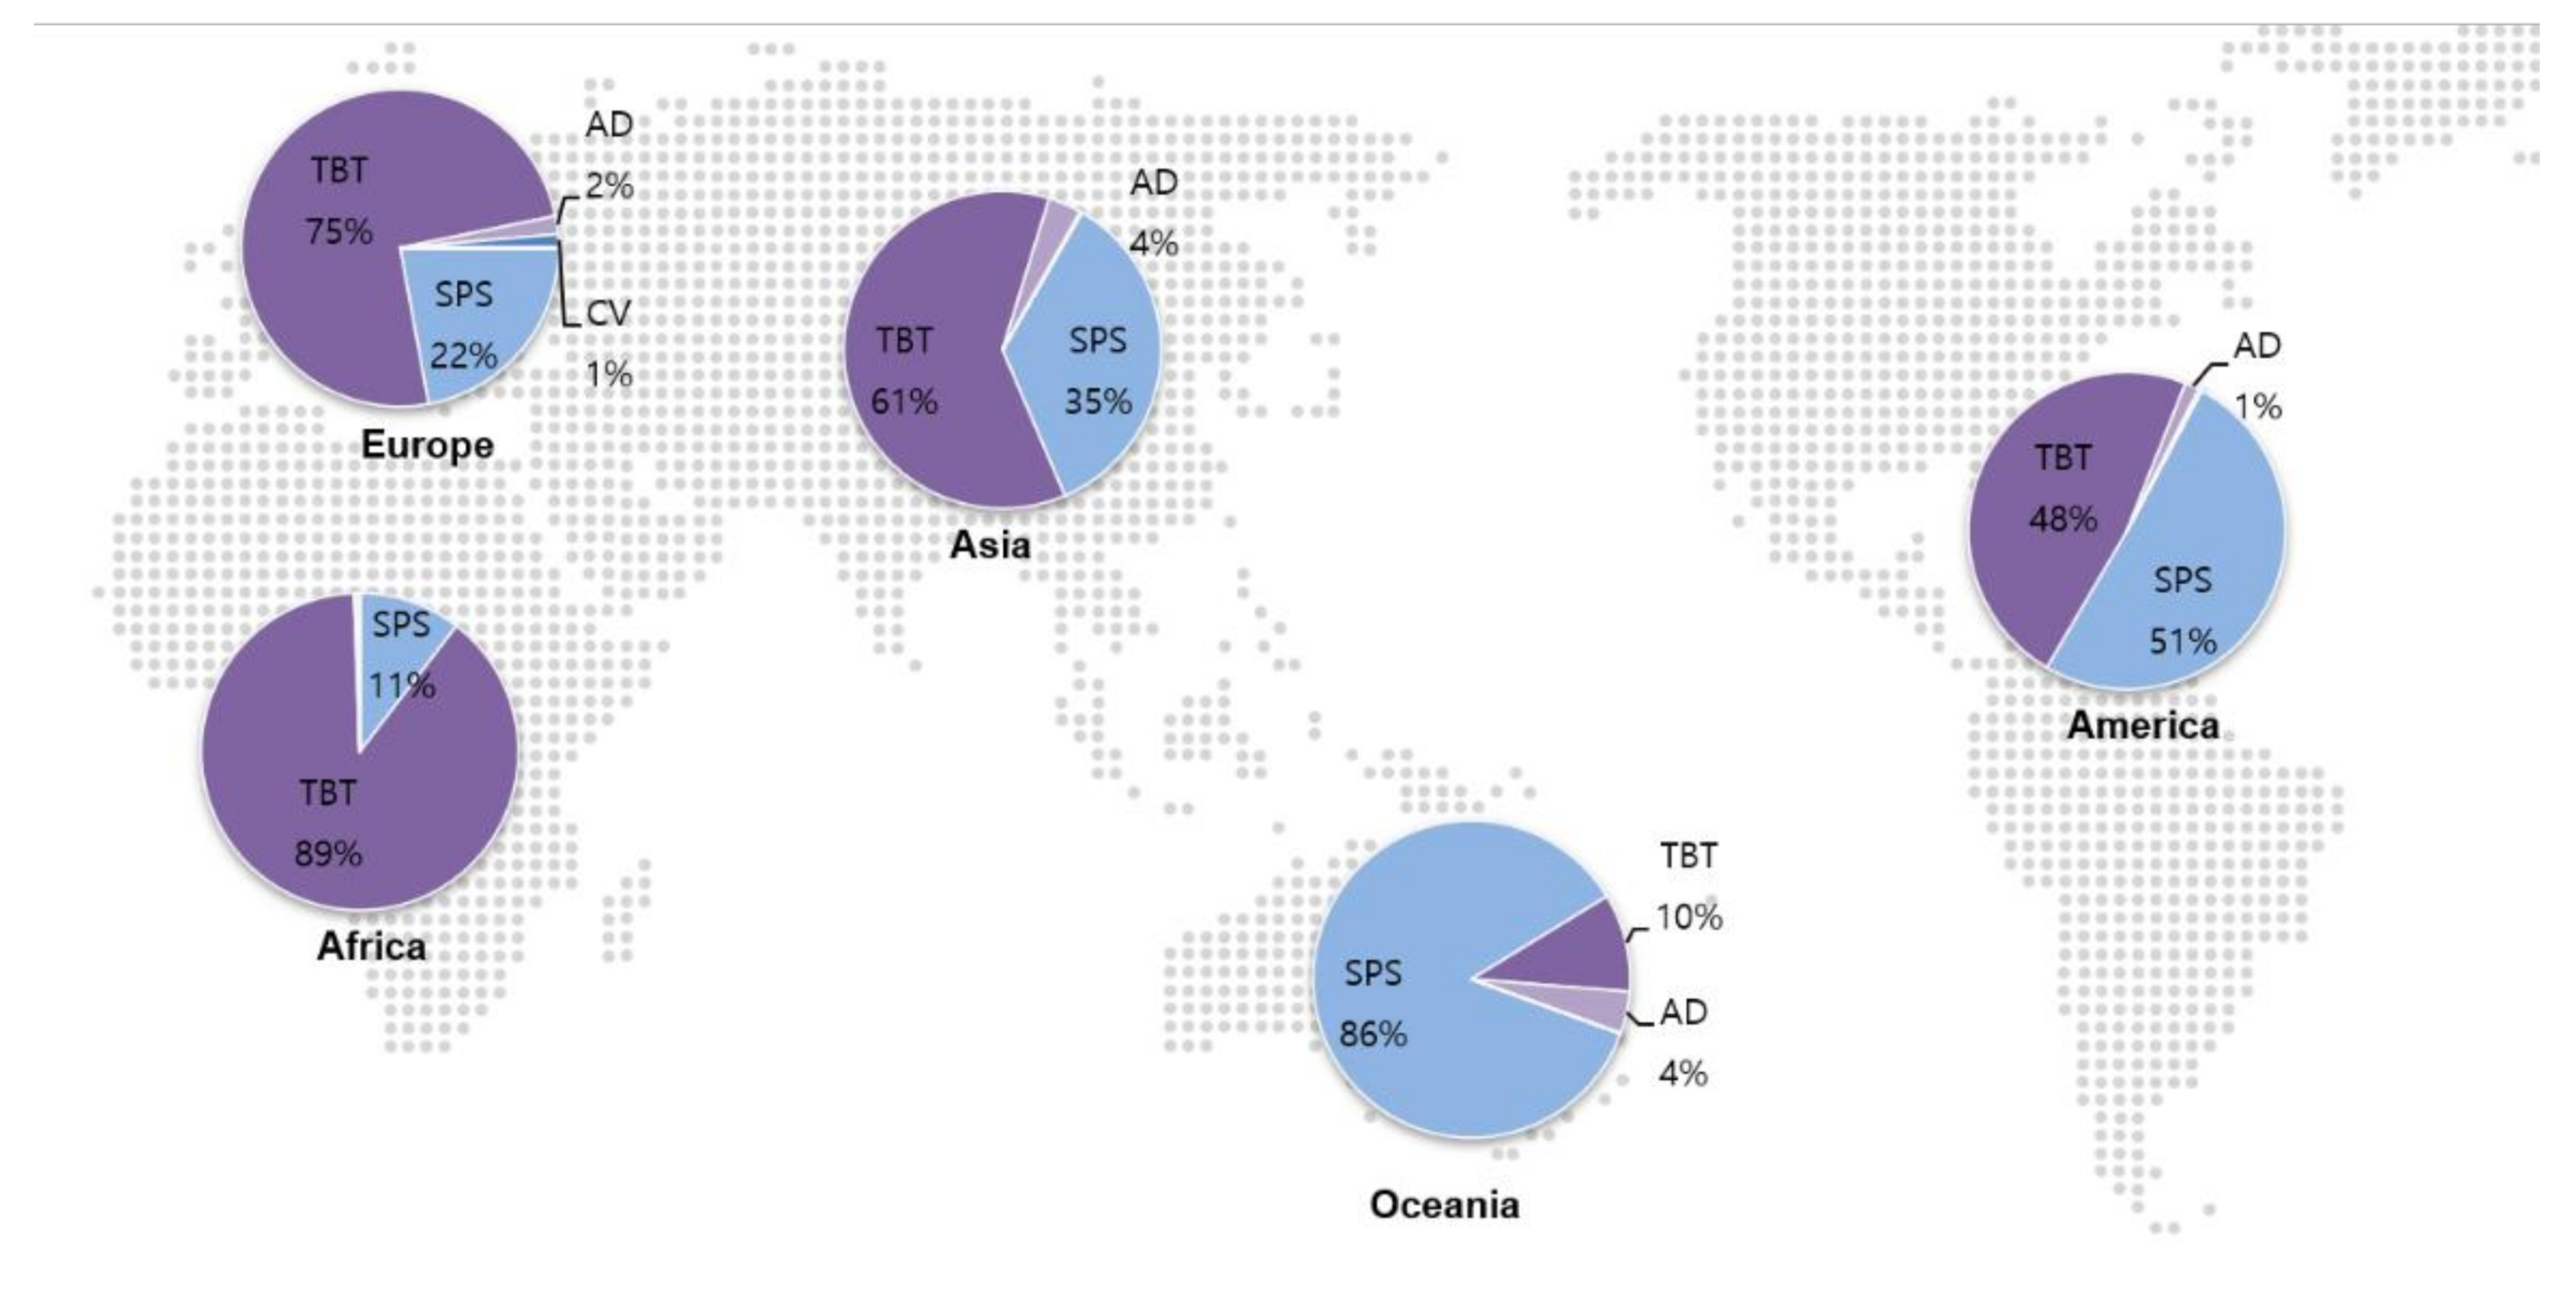
As of 2016, the total NTMs were mostly concentrated on SPS and TBT. Figure 2 shows the status by continent of total NTMs in 2016. Of these, Asia had the most NTMs. In Asia, high numbers of NTMs were imposed, in the order of TBT, SPS, and antidumping. In the Americas, most NTMs were SPS and TBT. In Africa and Europe, most NTMs were TBT and SPS, whereas Oceania mostly had SPS-related measures.
Figure 3 shows major NTMs and top countries with the highest number of measures by type. First, in the case of SPS, the United States shows an overwhelmingly higher number than other countries. Since the 2000s, the United States recorded a total of 2775 SPS measures. Between 2000 and 2006, its number of SPS measures was significantly different from that of other countries. China, Canada, and Peru have recorded the highest number of SPS in recent years (2014–2016).
In the case of TBT, the number of measures taken by the United States during the same period was the highest. Furthermore, the United States’ use of TBT increased more in recent years (2014–2016) than in the early 2000s (2000–2006). In the case of China and Israel, the number of TBT measures was the highest between 2007 and 2010, and the number used by Saudi Arabia has increased since 2007. It was found that the number of TBT measures increased in the EU and Korea in 2014–2016. In the case of quantity restrictions, the number of measures taken in Australia was the largest, but they do not appear to have been implemented since 2013. Hong Kong, New Zealand, Russia, and Thailand also had a large number of measures to restrict quantity in the early 2000s, but the number has declined significantly since 2014. In the case of antidumping, the largest numbers of countermeasures were found in the order of India, the United States, the EU, Brazil, and Turkey. In the case of special safeguards, the largest numbers of measures were found in the order of the US, Poland, Barbados, Korea, and Japan. It was found that a small number of measures were initiated recently. With the exception of Korea and Japan, other countries have not initiated special safeguard measures since 2013; Korea’s last measure was in 2013 and Japan’s last measure was in 2015. In the early 2000s, NTMs were comprehensively applied in various ways, including antidumping measures, special safeguards, SPS, TBT, and quantity restrictions. However, after 2014, the main implementation was SPS and TBT.

2.2. The Agricultural and Food Industry

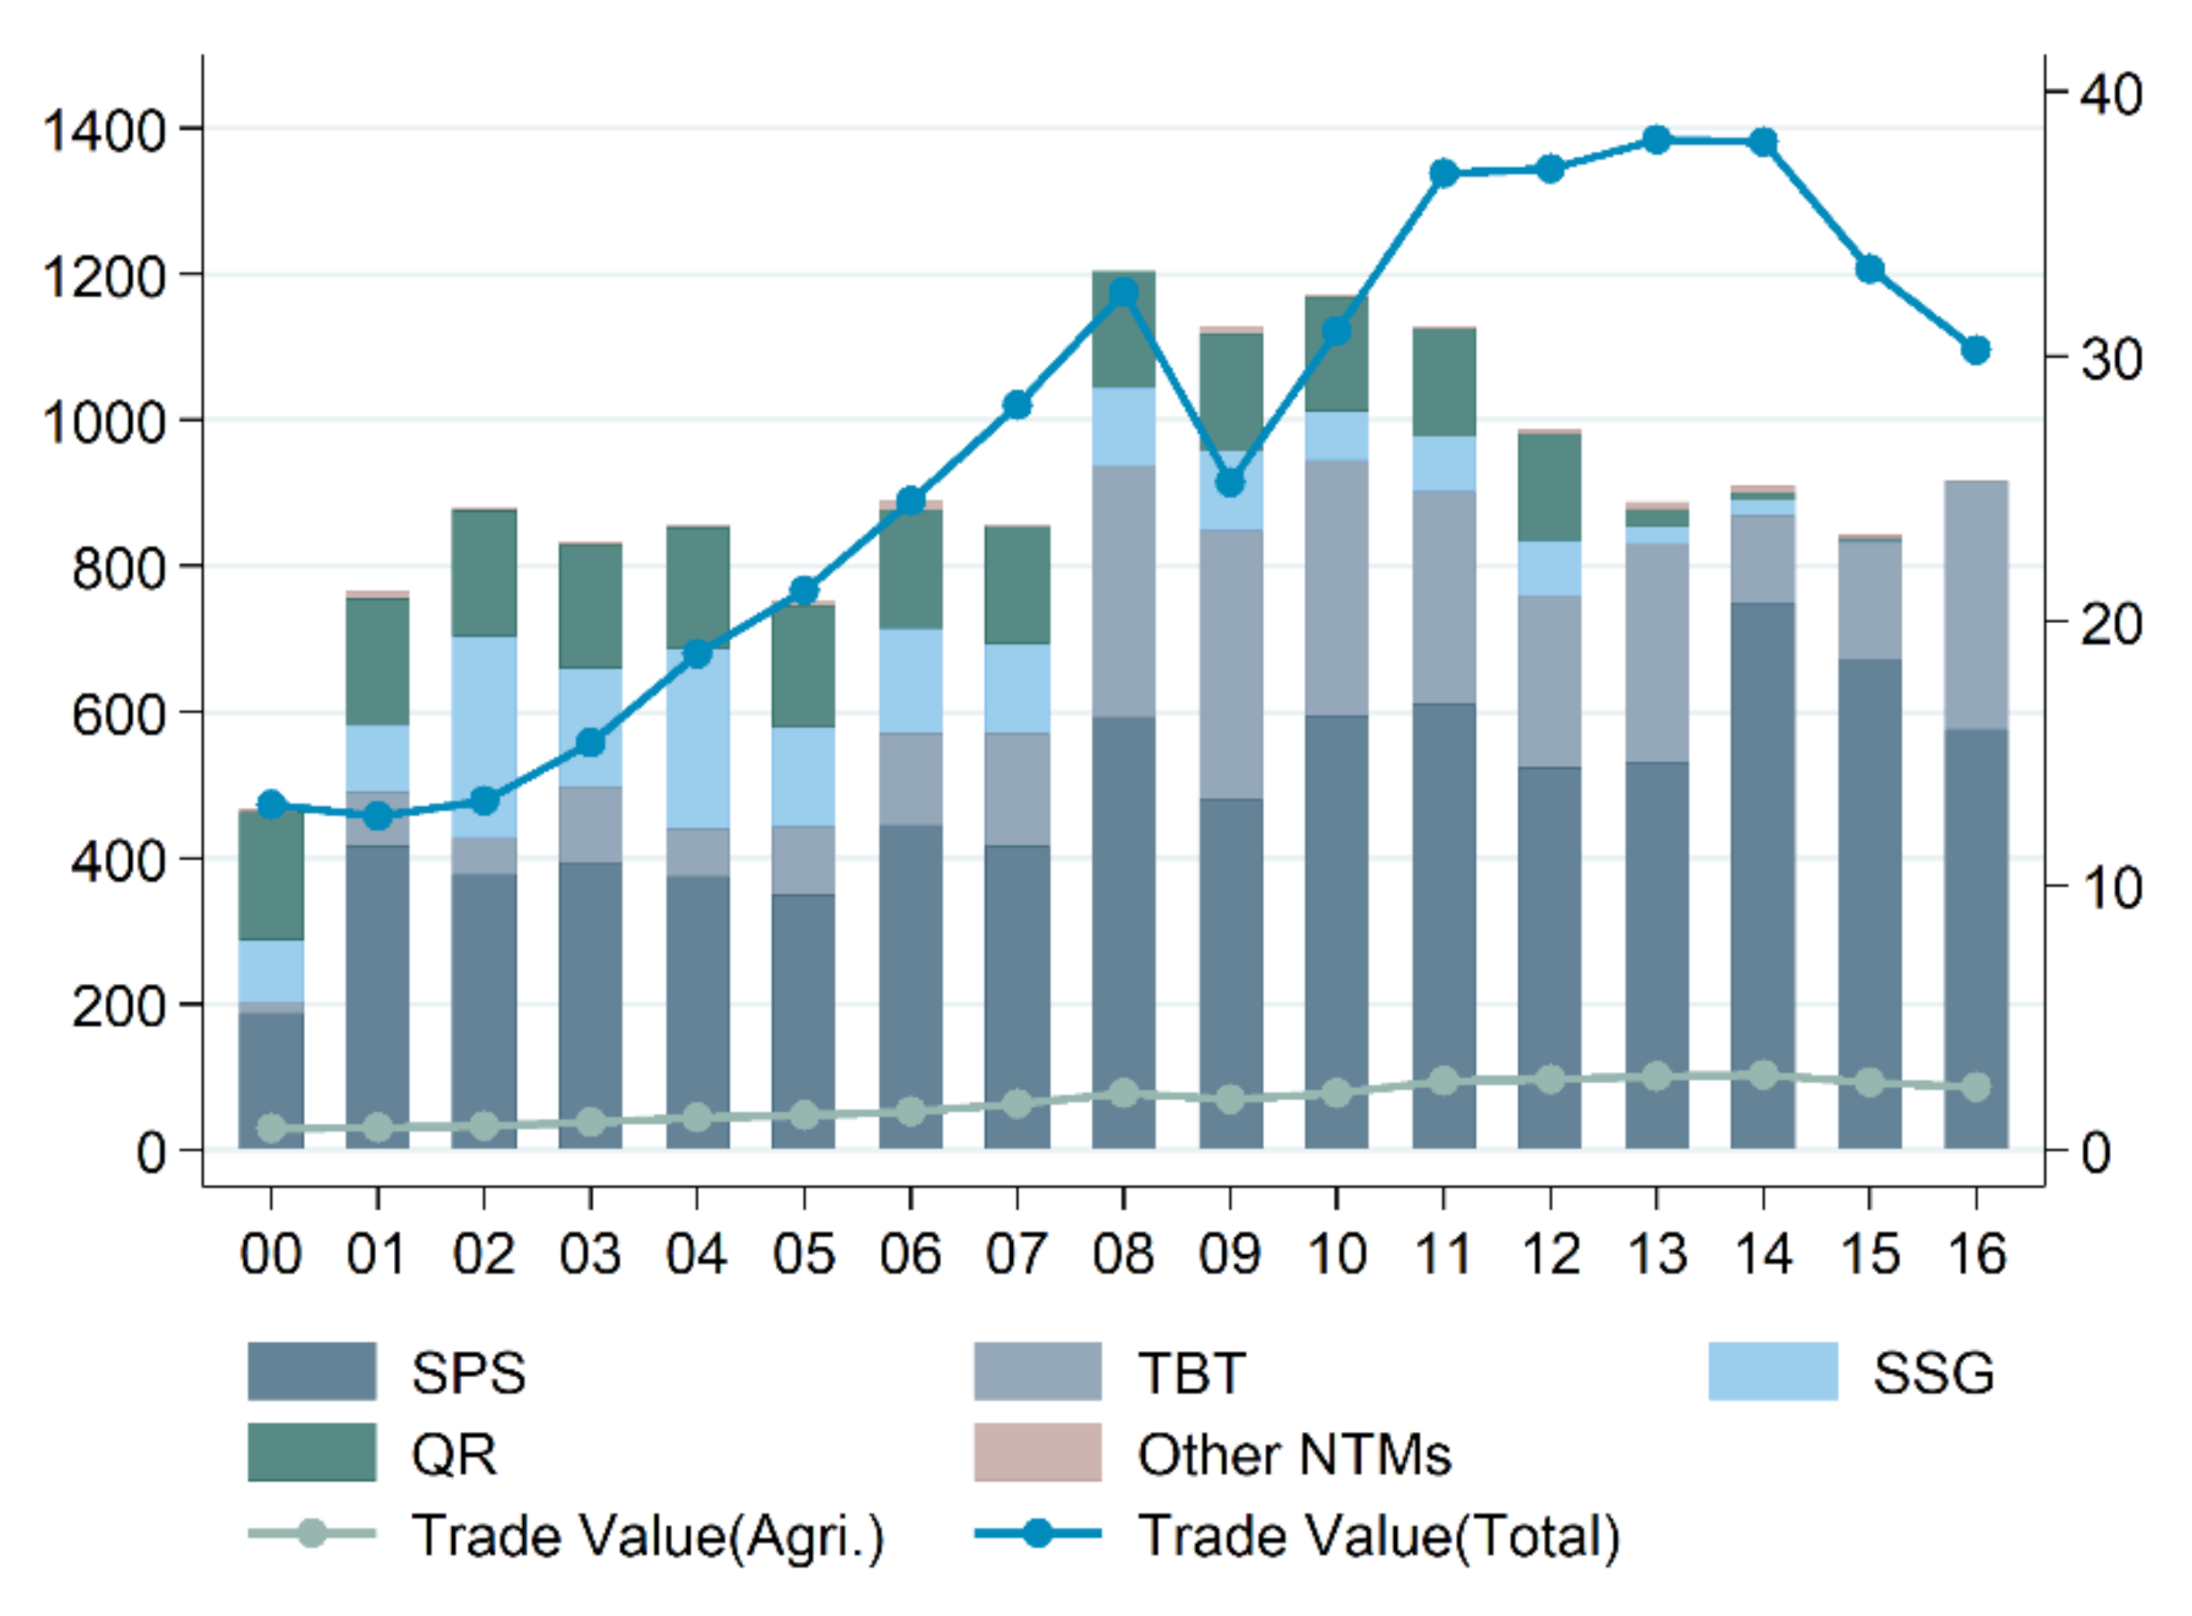
The volume of global trade has steadily increased since the inauguration of the WTO and before the global financial crisis in 2008. The total number of NTMs for agricultural and food products also showed an increasing trend consistent with that of the trade volume (Figure 4). NTMs for agricultural and food products include SPS, TBT, special safeguards, and quantity restrictions. Although the number of SPS and TBT measures increased, the number of special safeguards and quantity restrictions gradually decreased.
Following the global financial crisis in 2008, the volume of world trade began to decrease following a period of growth. In the wake of the financial crisis, as the domestic economy of each country slowed, the number of NTMs increased sharply to reach 1204 cases (Figure 4). In particular, the number of notifications of TBT measures on agricultural and food products in 2008 increased by more than 120% compared to the previous year. In addition, the implementation of TBT and SPS measures, which were limited to the United States and Brazil in the early 2000s, diversified to numerous countries by the late 2000s.
Due to the economic recovery in 2009–2011, the volume of trade increased but reached a decline as the rate of growth slowed over the last five years (2012–2016). Since 2012, the annual average number of NTMs for all agricultural and food products has declined to a level similar to that before the financial crisis (Figure 4). In contrast, the number of SPS and TBT measures gradually increased, accounting for about 99% of all NTMs for agricultural and food products after 2015. Because the standards for implementing some NTMs, such as quantity restrictions, were gradually strengthened by the Uruguay Round and the WTO Agricultural Agreement, implementation of NTMs for agricultural and food products, mainly in SPS and TBT measures, is expected to continue.
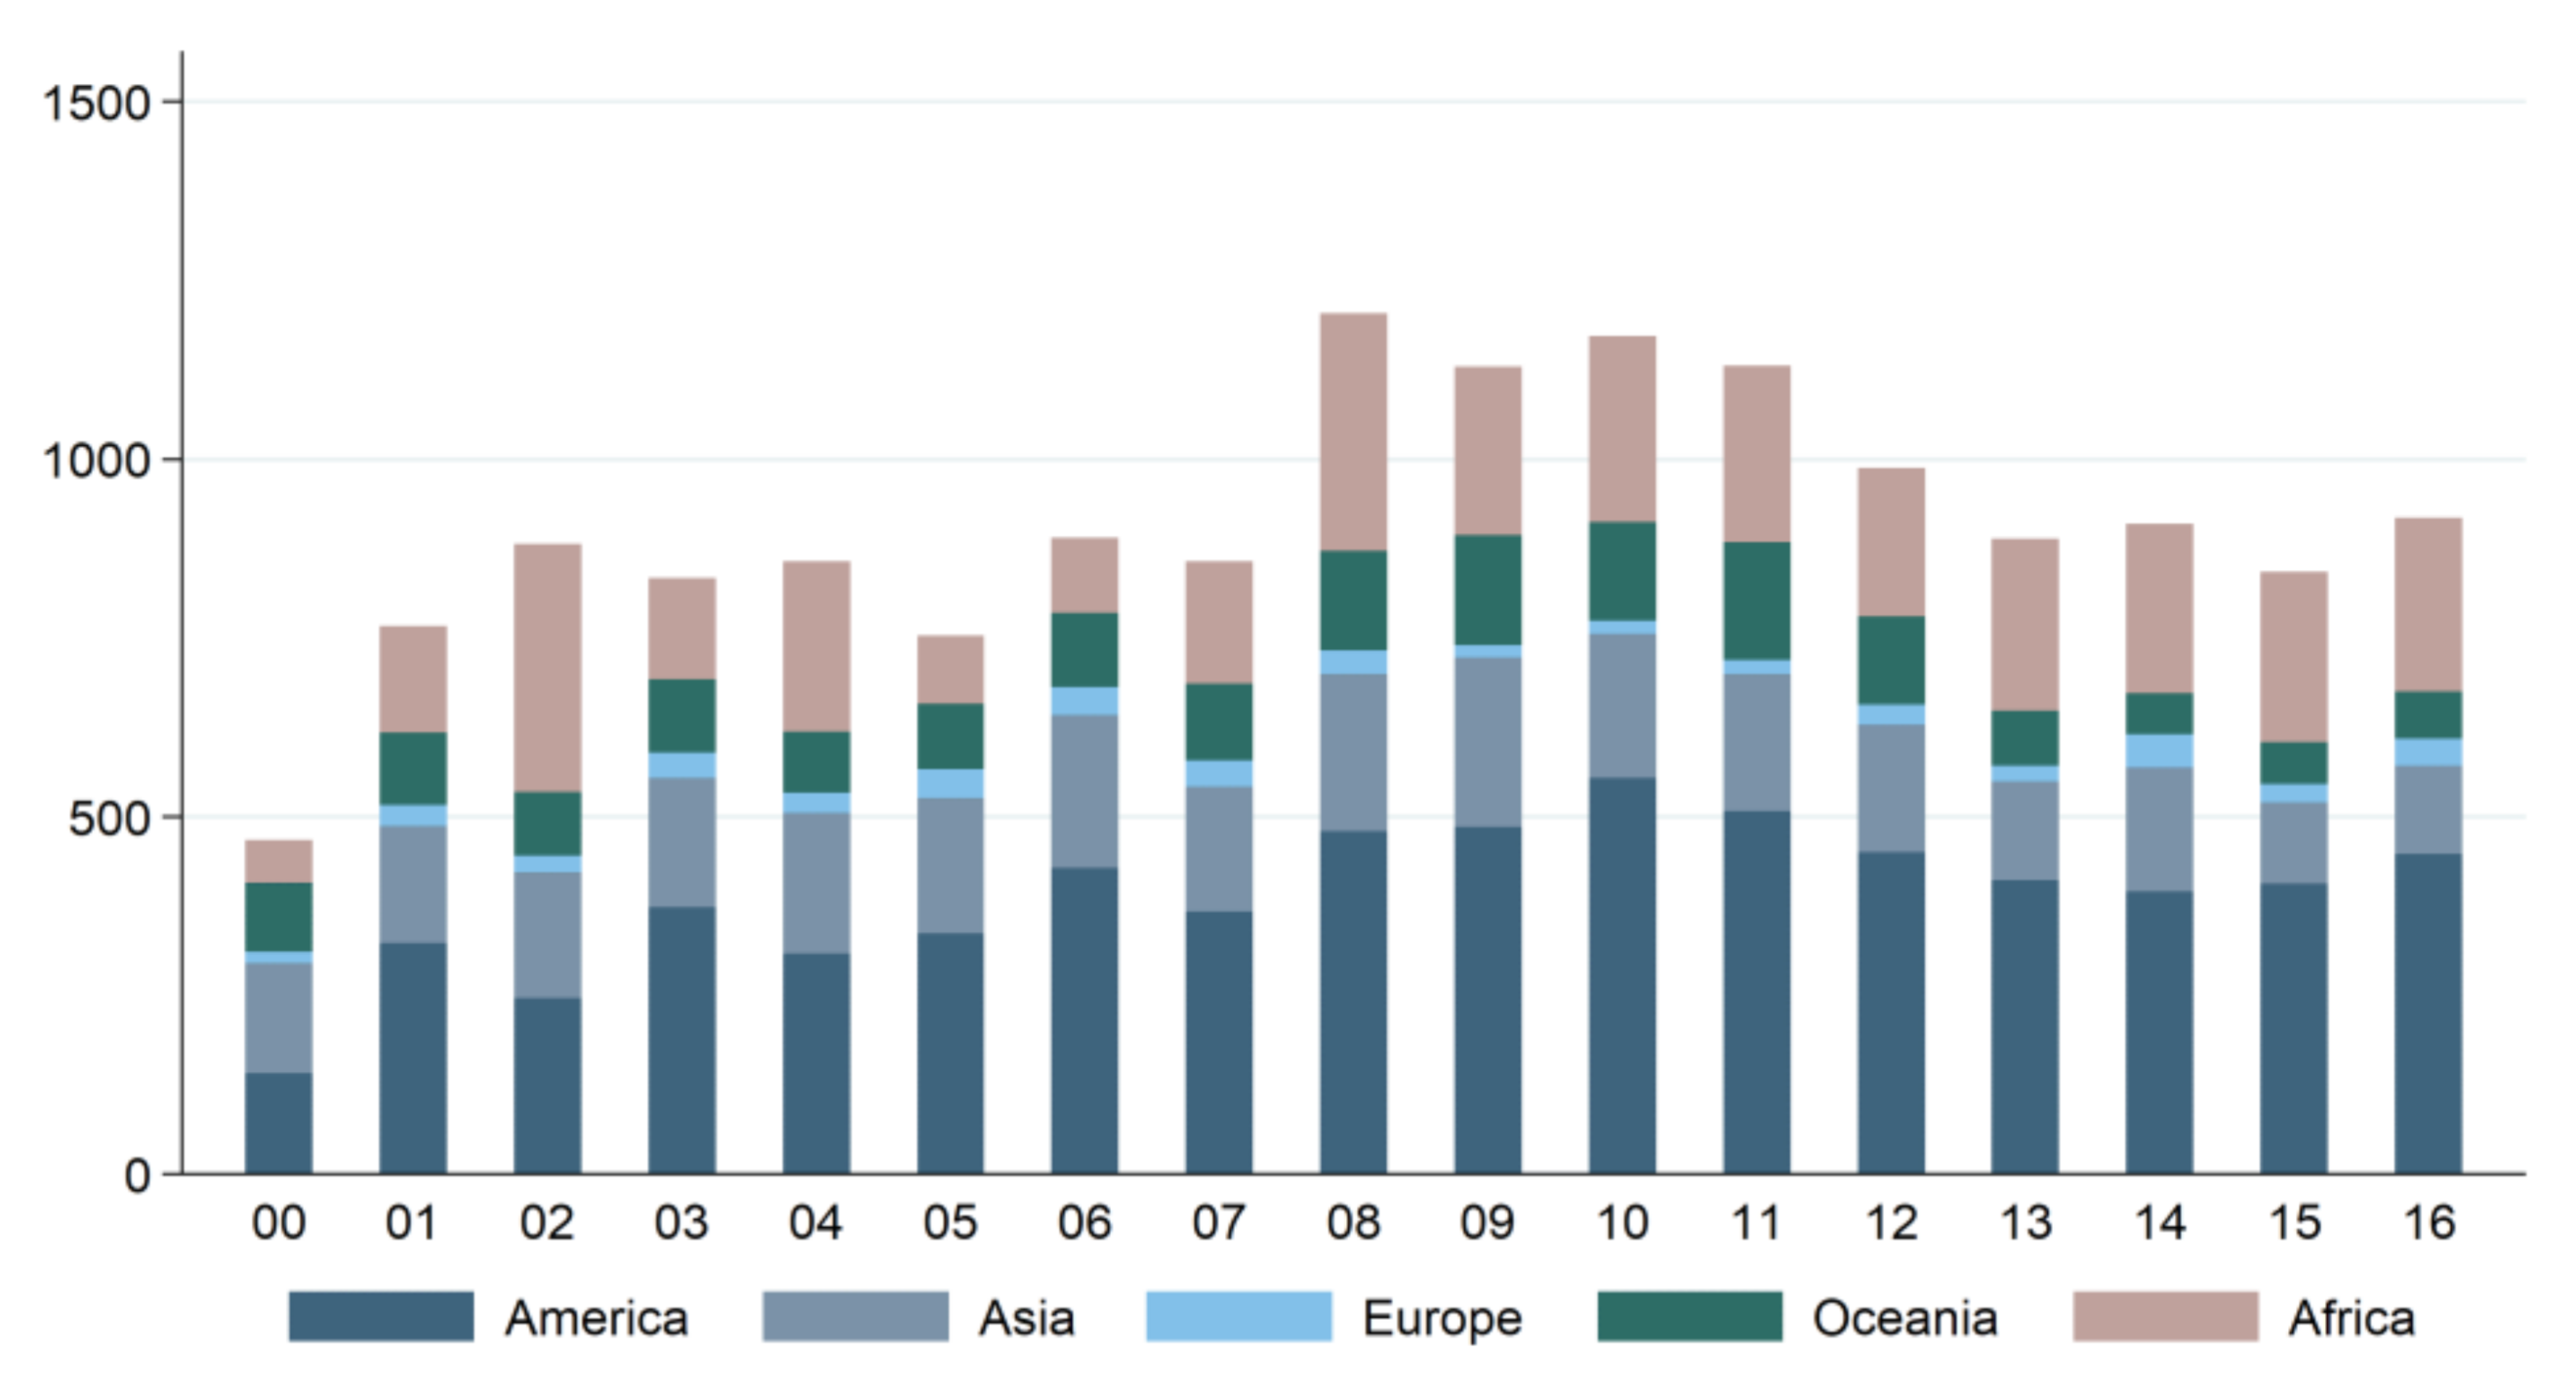
The trend of NTMs for agricultural and food products by continent is shown in Figure 5. The number of NTMs for agricultural and food products was the largest in the Americas, followed by Europe, Asia, Oceania, and Africa. In 2000, the proportion of NTMs for agricultural and food products in the Americas and Asia was similar. Whereas NTMs in the Americas gradually increased, NTMs for agricultural and food products in Europe accounted for a large share after 2002 and 2008.
As discussed above, the structure of NTMs has changed depending on the timing and region. This study verified the effect of the similarity of nontariff structures between countries on trade.

3. Methods

3.1. Quantifying NTM Structure Similarity

In the literature, a variety of methodologies are used to identify NTMs, including the frequency index and/or coverage ratio [18,19,20] and ad valorem equivalents (AVEs) [21,22]. Analysis can be conducted of the impact of NTMs introduced in individual items or tariff lines on trade. Furthermore, Cadot et al. [15] proposed a measurement of regulatory distance of NTMs to examine whether two countries have similar regulatory structures at the national level. Inspired by this concept, we devised the index explained below to examine the similarity of NTM structure by industry (HS code 2 level) between two countries.
To quantify the similarity of NTM structure in bilateral trade, we consider the population ratios of items affected by NTMs in each industry at the HS 2-digit level (g = 1, 2, …, 99). Suppose each industry g has M HS code 6 level tariff lines (Mg). For each industry, g, hmgi, and hmgj belong to the same tariff line m, and hmgi (or hmgj) = 0 if tariff line m does not have NTMs and hmgi (or hmgj) = 1 if tariff line m has NTMs. Mathematically, the NTM structural similarity of industry g between two countries, ηgij, is measured as follows:
η g i j = 1   m = 1 M g h m g i h m g j 2 M g f o r   a l l   g , i ,   j
The similarity index values range between zero and one, and the higher the values, the more similar the structure of NTMs of the industry between countries. Although the similarity of NTM structure has already been considered in previous studies, this study is considered to be the first attempt to show that the similarity of the nontariff structure and the relationship between trade may differ depending on the type of nontariff measure or by the type of product.

3.2. The Similarity of NTM Structure in the Gravity Equation

The Anderson and van Wincoop [23] gravity equation presented in Santos Silva and Tenreyro [24] and Baier and Bergstrand [25] can be expressed with our (importer or exporter)–time and pair dimensions as follows:
T i j t = exp β x i t + γ i t + δ j t + π i j + ϵ i j t
where Tijt is the trade flow from exporter i to importer j at time t; xijt is a vector of covariates; γit, δjt, and πij are exporter-time, importer-time, and exporter-importer fixed effects, respectively; and ϵijt is an error term.
The similarity index of the NTM structure between two countries including HS 2-digit level industries (g) can be incorporated with the covariates of interest recited in Equation (2) as follows:
T g i j t = exp β 1 l n t a r i f f g i j t + β 2 F T A i j t + β 3 η g i j t + γ g i t + δ g j t + π i j + ϵ g i j t
where lntariff indicates the logarithm of average tariff rates imposed on the imports in the industry g of the importer i from exporter j. FTA indicates whether regional or free trade agreements are in effect between i and j. We included industry—(importer or exporter)—time fixed effects, average tariffs, and similarity indices at the HS 2-digit level to examine the distinct impacts of tariffs and NTMs on trade flows.
Following Baier and Bergstrand [25], we employed pair-specific fixed effects to address potential endogeneity problems of free trade agreements and similarity indices. Although time-invariant variables such as distance in traditional gravity equations cannot be included in the model due to the pair fixed effects, we chose to include the pair fixed effects because estimates made without accounting for endogeneity are likely to be biased downward [25].
In this study, Equation (3) was estimated using the pseudo-Poisson maximum likelihood (PPML) estimator with industry–country–time fixed effects. As Santos Silva and Tenreyro [24] noted, PPML takes into account not just zero trade values but also heteroscedasticity, which in general leads to inconsistent estimates in log-linearized models by ordinary least squares. The estimations were performed with a user-written command ppmlhdfe developed by Correira et al. [26] in the Stata 14 software [27].
The summary statistics of all observations are listed in Table 1. Data for bilateral free trade relationships (FTAs) were obtained from Head and Mayer [28]. Tariff and NTM data were obtained from United Nations Conference on Trade and Development (UNCTAD) [29]. This study used BACI for trade flows, developed and reconciled by Centre d’ Études Prospectives et d’ Informations Internationales (CEPII). Average tariffs were constructed by using the sum of most-favored nation (MFN) applied or preferential tariff rates divided by national tariff lines in the industry. Both tariffs were calculated considering ad valorem equivalent using the method of UNCTAD. Preferential tariff rates were bilaterally estimated between countries, considering the tariff concessions of regional trade agreements.
This study included similarity indices for sanitary and phytosanitary measures (SPS) and technical barriers to trade (TBT). The Trade Analysis Information System (TRAINS) NTM data have 85 country groups, including the European Union as a country group. We separated the trade flows in the EU countries and set the average tariffs to zero, with NTM similarity indices being one of the members.
The model was estimated using the data of (108 × 62) countries over five years (2012 to 2016). Due to the special characteristics of agriculture that are likely affected by SPS and TBT, we separately estimated the effects of NTMs in agriculture, including HS 1 to 24, with the exception of 3 codes and nonagricultural industries. In addition, we considered two different types of tariffs: most-favored nation (MFN) applied tariffs with free trade agreement effects and bilateral preferential tariffs. Because bilateral preferential tariff rates are assumed to be already affected or reduced by regional trade agreements, we omitted the FTA dummy for the model with preferential tariffs.
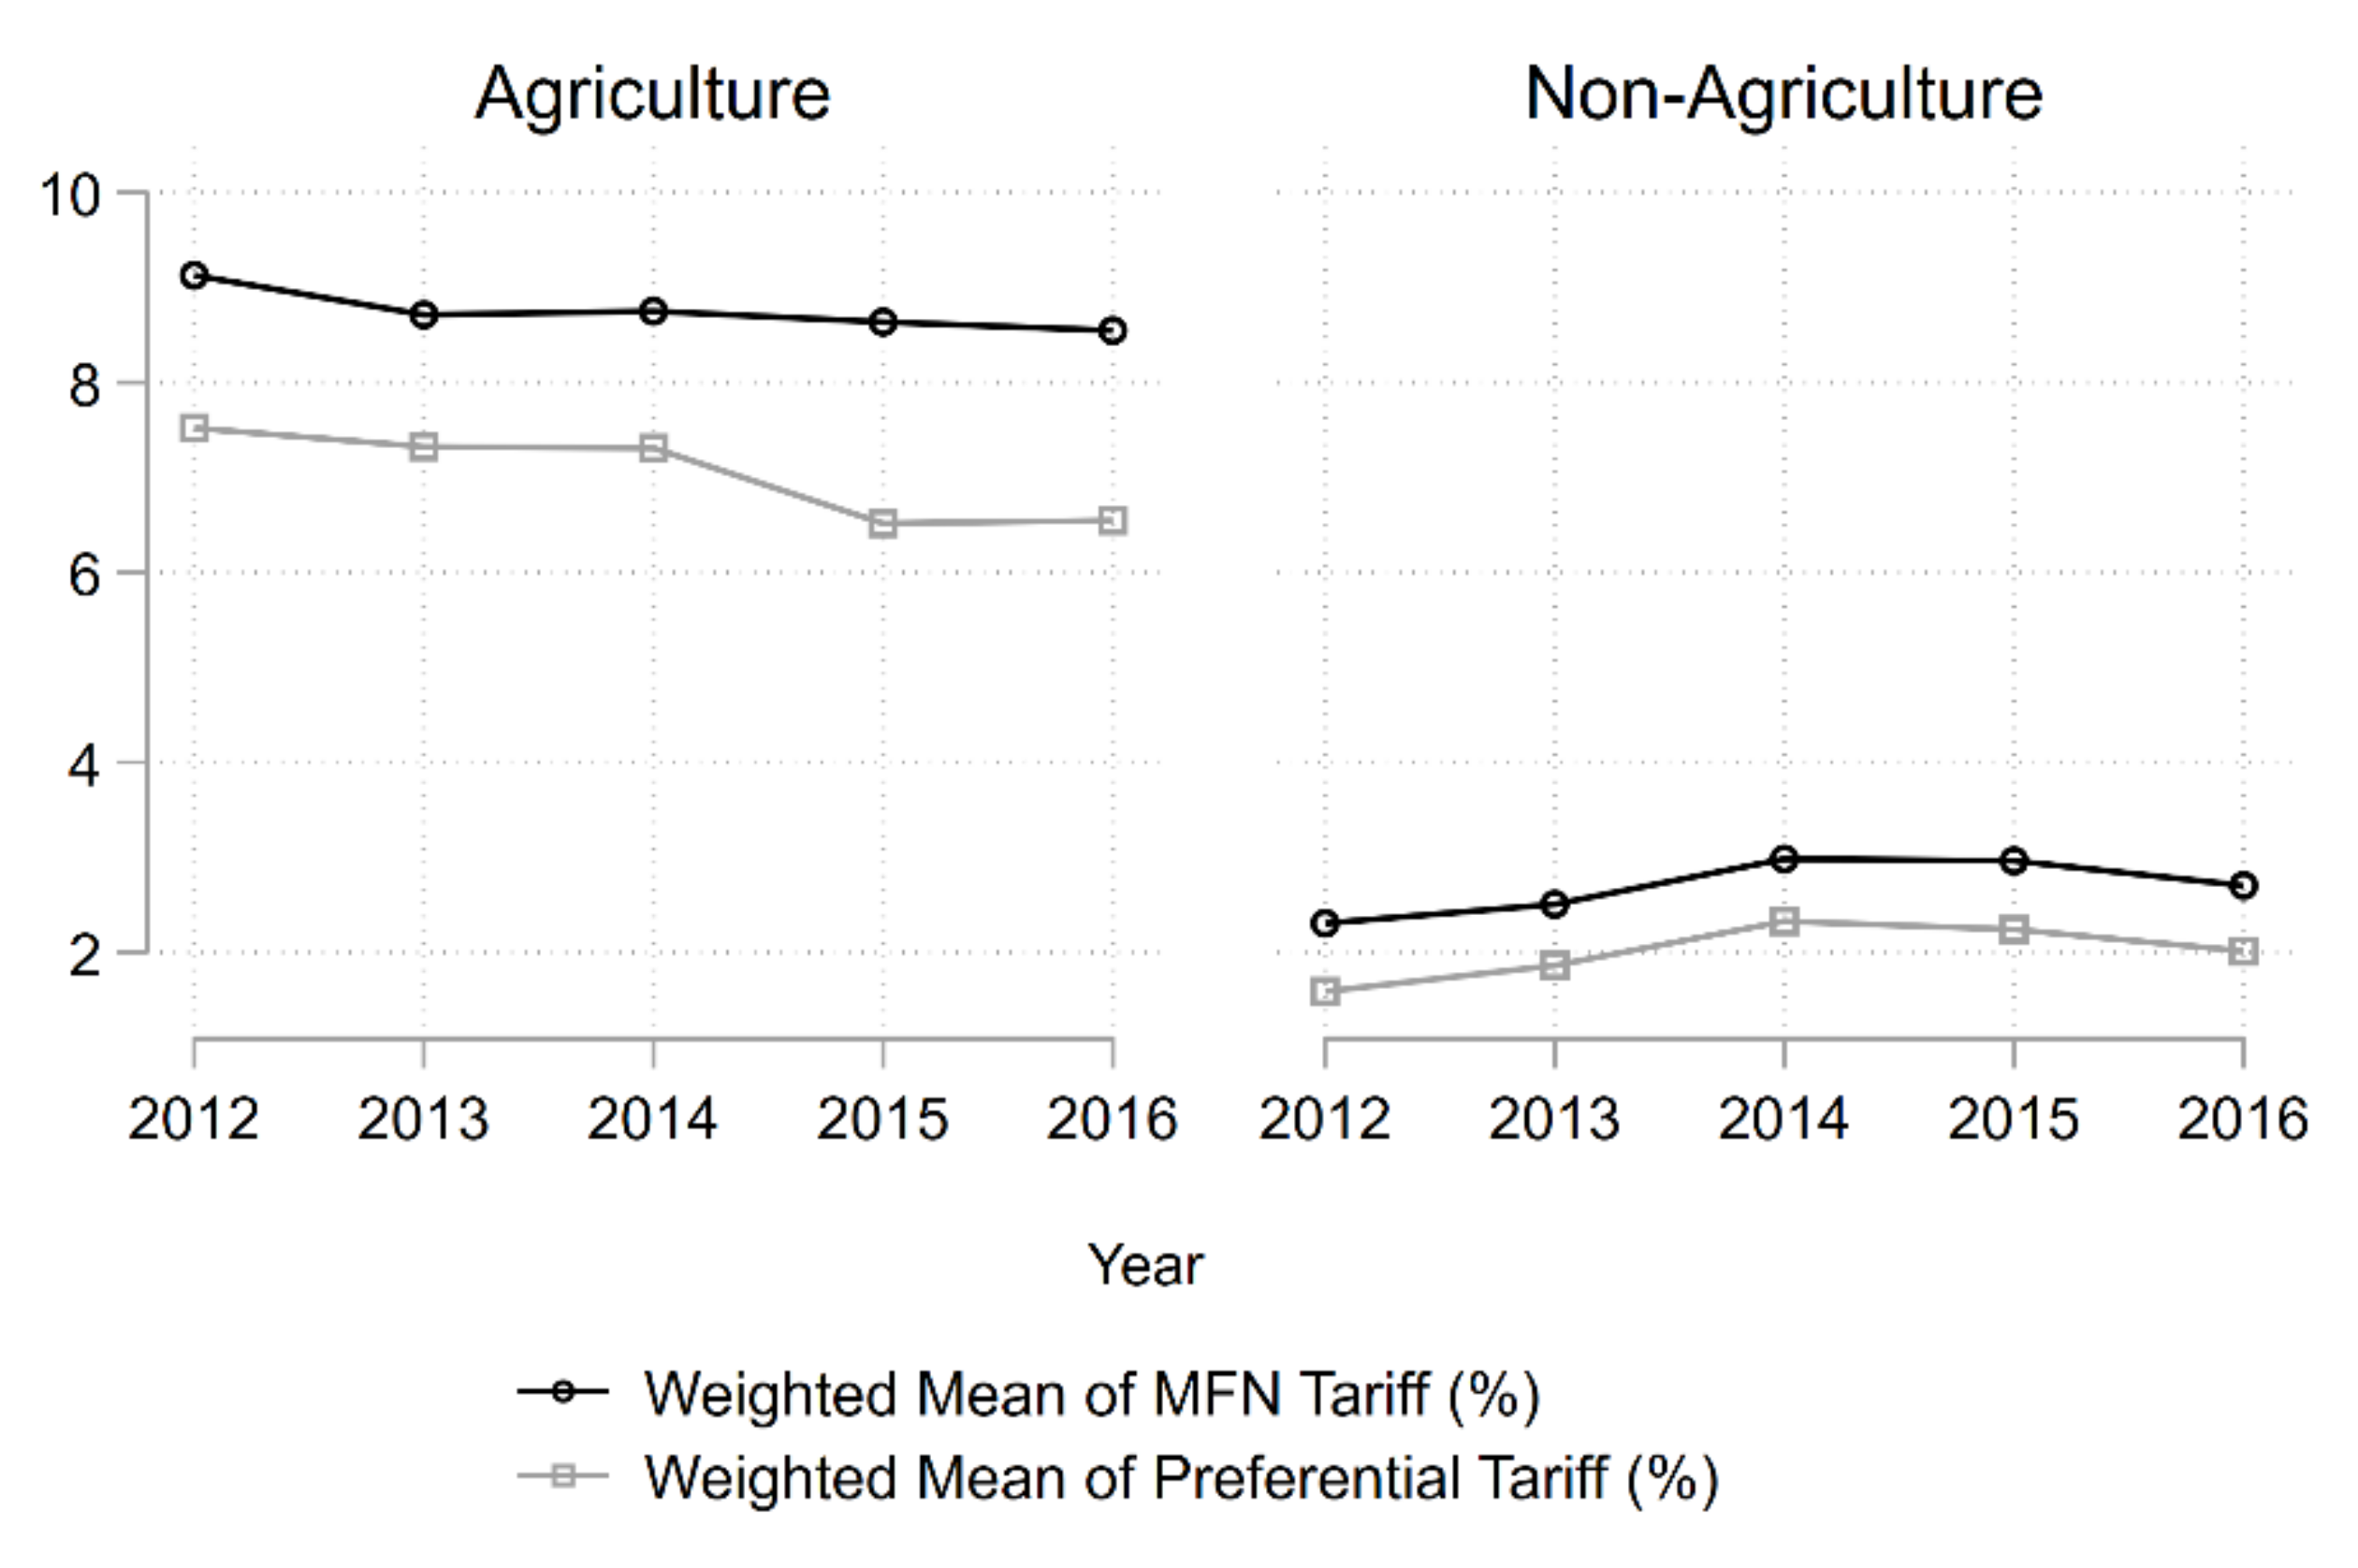
Average tariff rates weighted by trade flows in the sample between sectors are shown by year in Figure 6. Both MFN and preferential tariffs have similar time trends, but the MFN rates are higher than the preferential rates. In the agricultural sector, the weighted means of both tariff rates are found to decrease in general during the sample period, although the average preferential tariff rates increase slightly from 2015 to 2016. This may result from the trend of more trade flows of the products at higher preferential tariff rates in these years. The average MFN and preferential tariff rates in the nonagricultural sector move in similar fashions but decrease after 2014 followed by increases in the 2012–2014 period. This may be because more trade flows occurred in the products with lower tariff rates during this period. Overall, the average tariff rates are significantly lower in the nonagricultural sector than in the agricultural sector.

4. Results

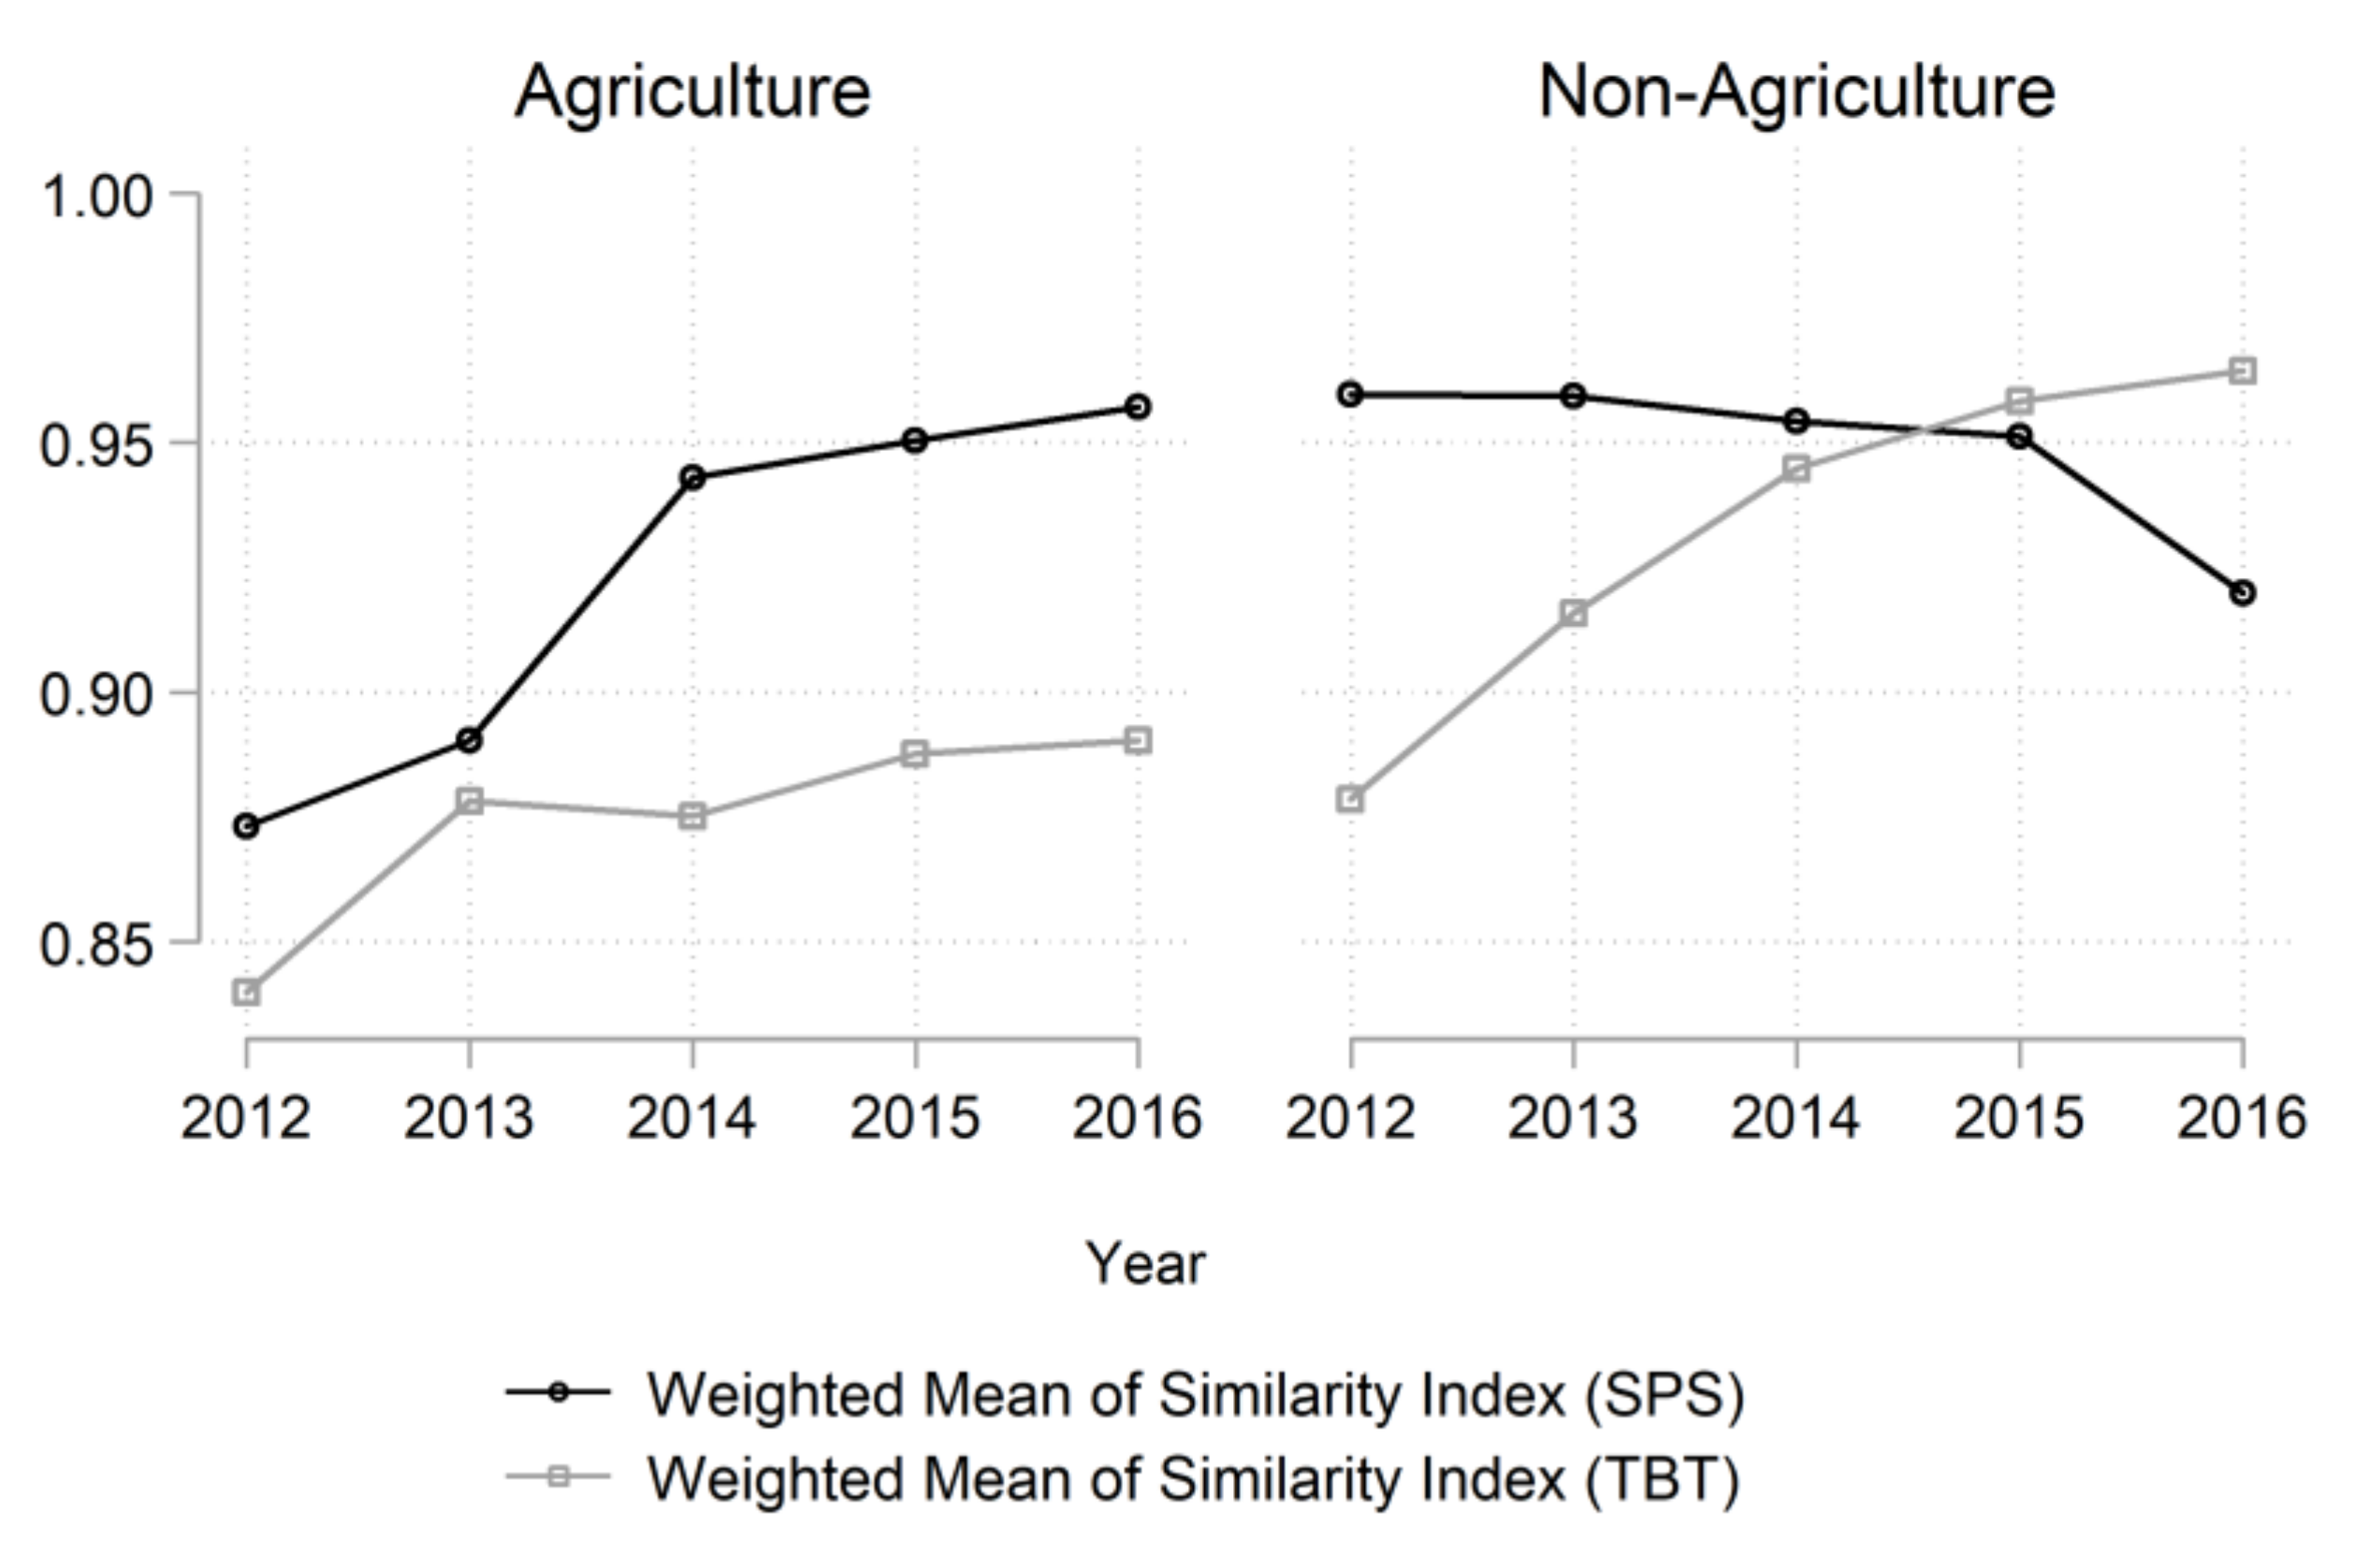
The estimated similarity indices are shown as follows. The following Figure 7 shows the changes of the trade-weighted mean of similarity indices by year between sectors. The average TBT similarity indices were found in general to increase during the period in both sectors, which implies that trade flows of the products with high structural similarity of TBT measures or overall similarities increased during the period. However, the average SPS similarity indices move upward in the agricultural sector, whereas they move downward in the nonagricultural sector. This implies either increased trade volume of the products with similar structure of SPS measures, improved overall SPS similarities in the agricultural sector, or both, while the trade volumes or overall TBT similarity decreased in the nonagricultural sector.
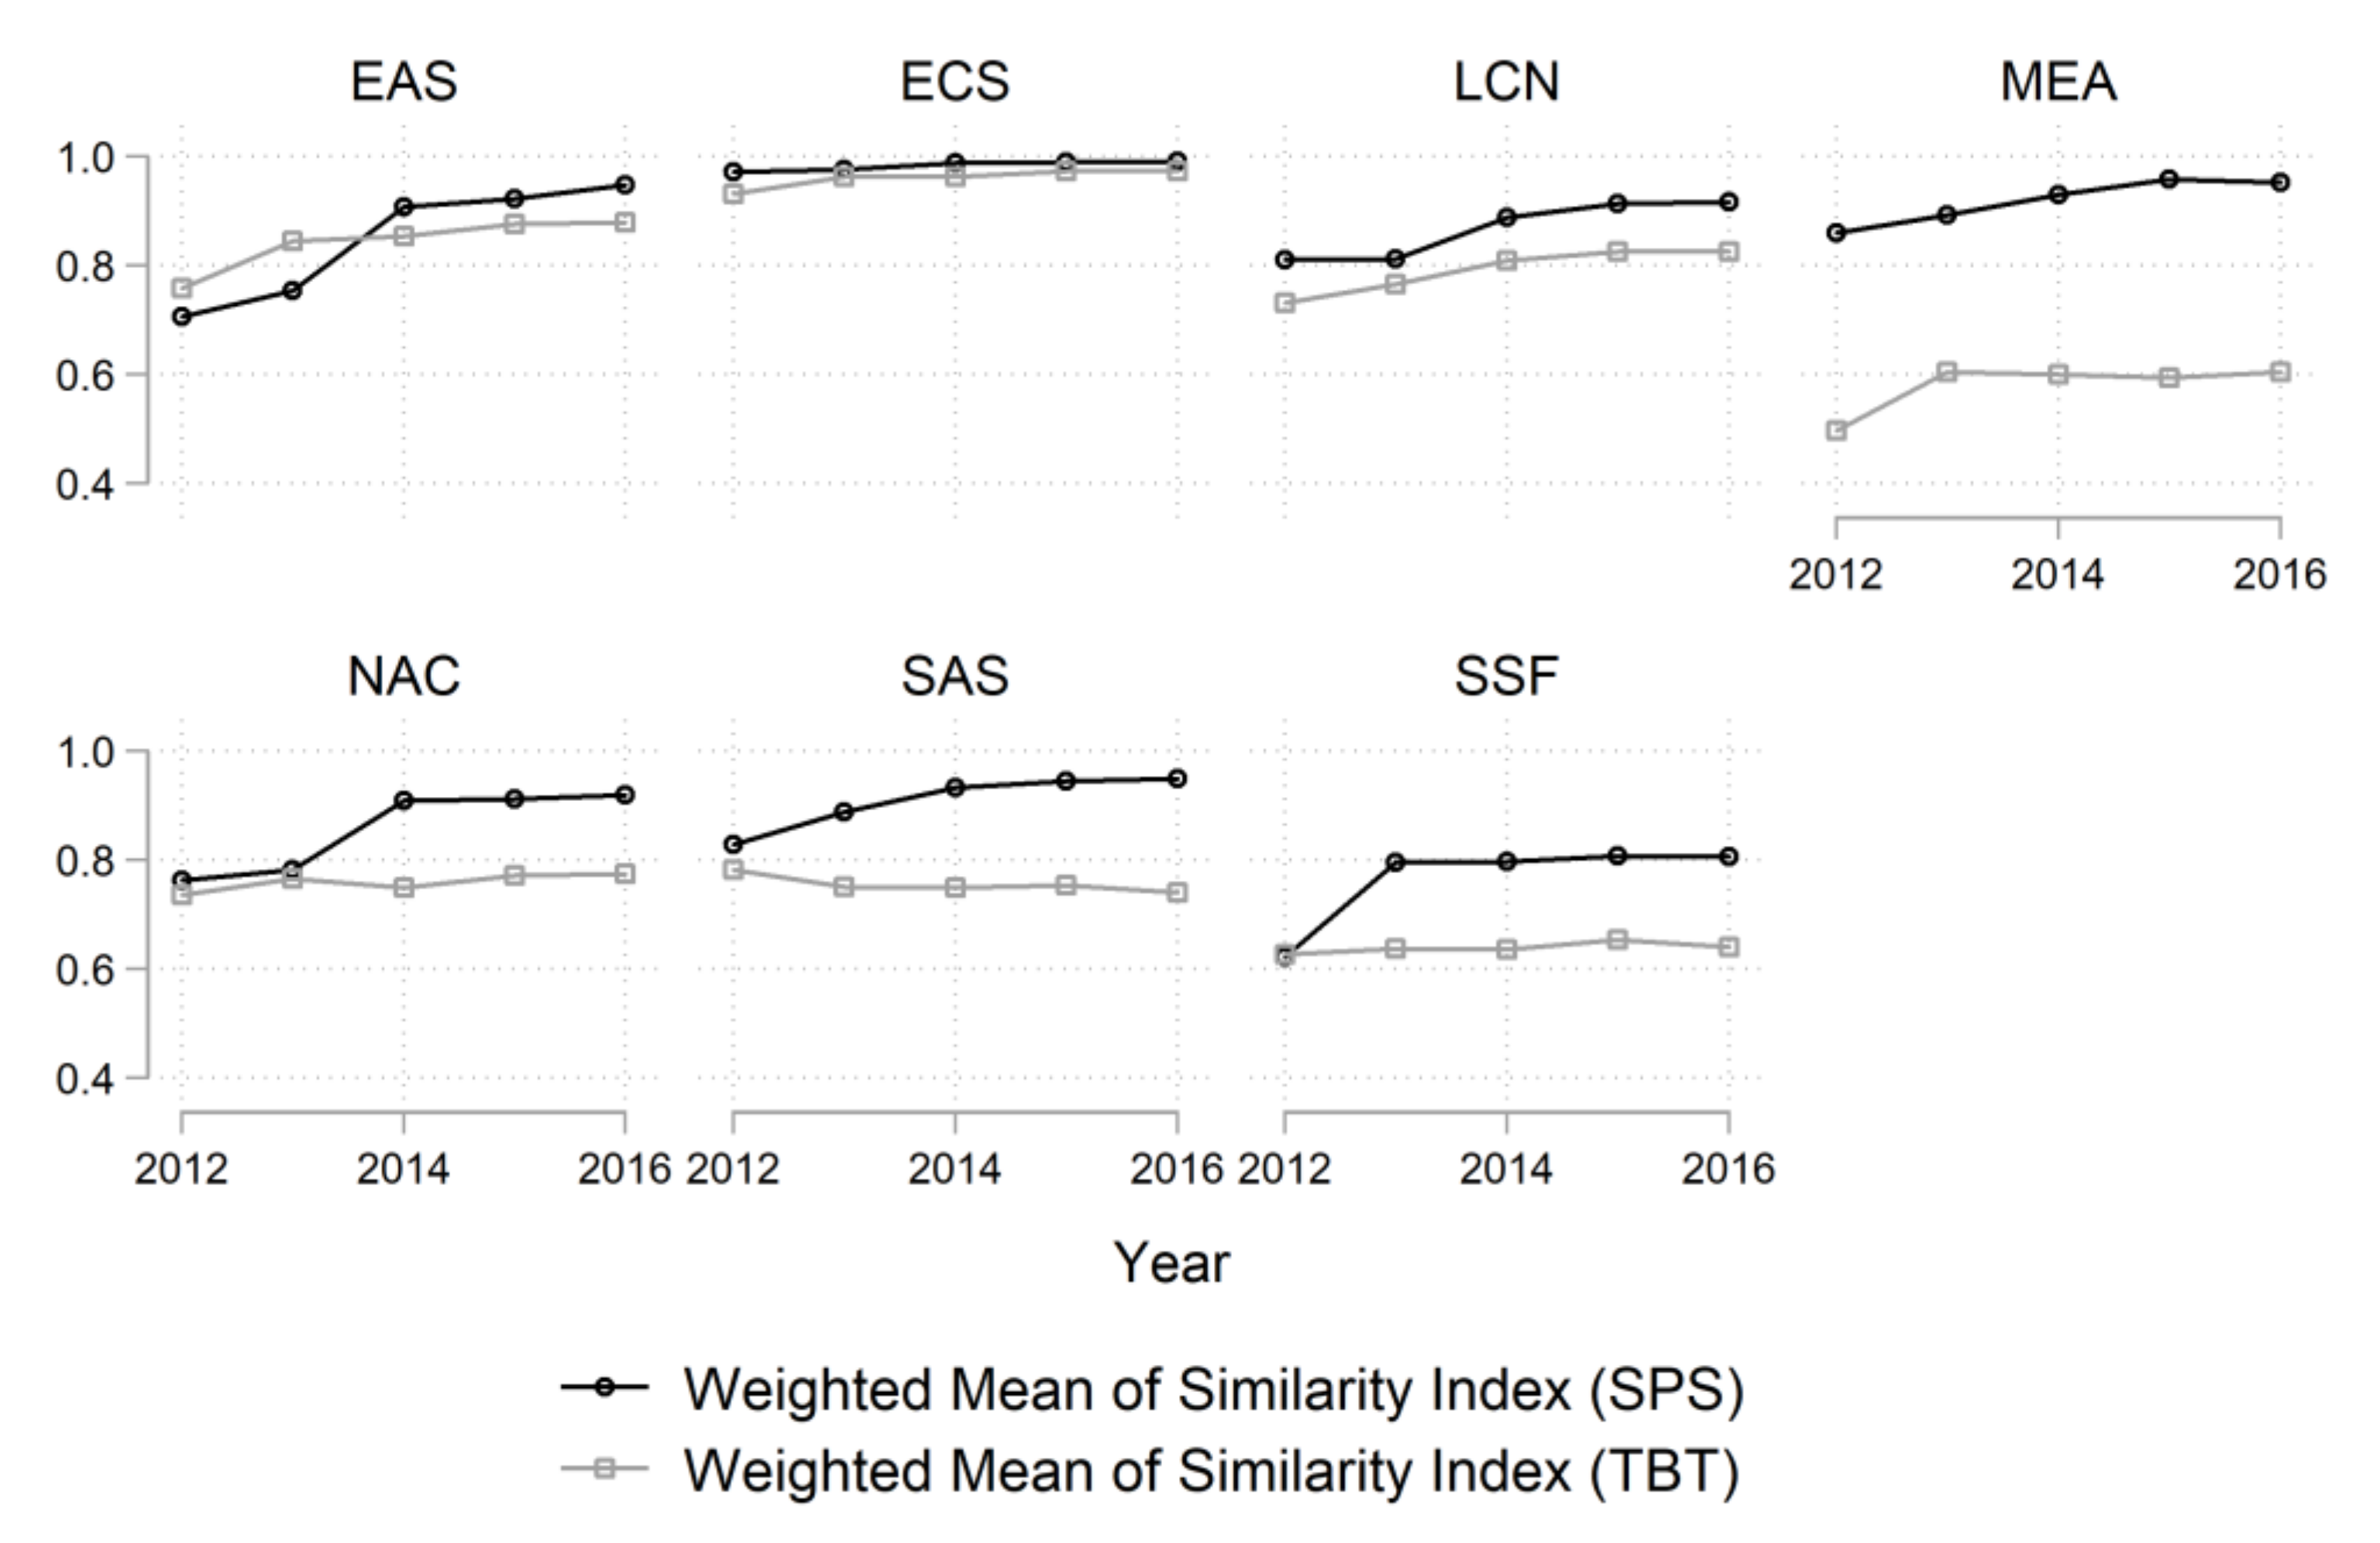
The time trends of similarity indices by year over regions are drawn with the references of the reporter (exporter) group. In the agricultural sector, trade-weighted means of SPS (see Figure 8) similarity indices increased across all of the regions during the period. The weighted means of TBT similarity indices move upward with some fluctuations but South Asia experienced a decreasing trend of these similarity indices. Overall, both similarity indices have the highest values in the Europe and Central Asia region. It is also notable that Middle East and North Africa has the lowest similarity index on TBT measures while the region has high SPS similarity indices. This implies that the region may have imposed new TBT measures, which have not been imposed in other countries, on food with a high trade volume.
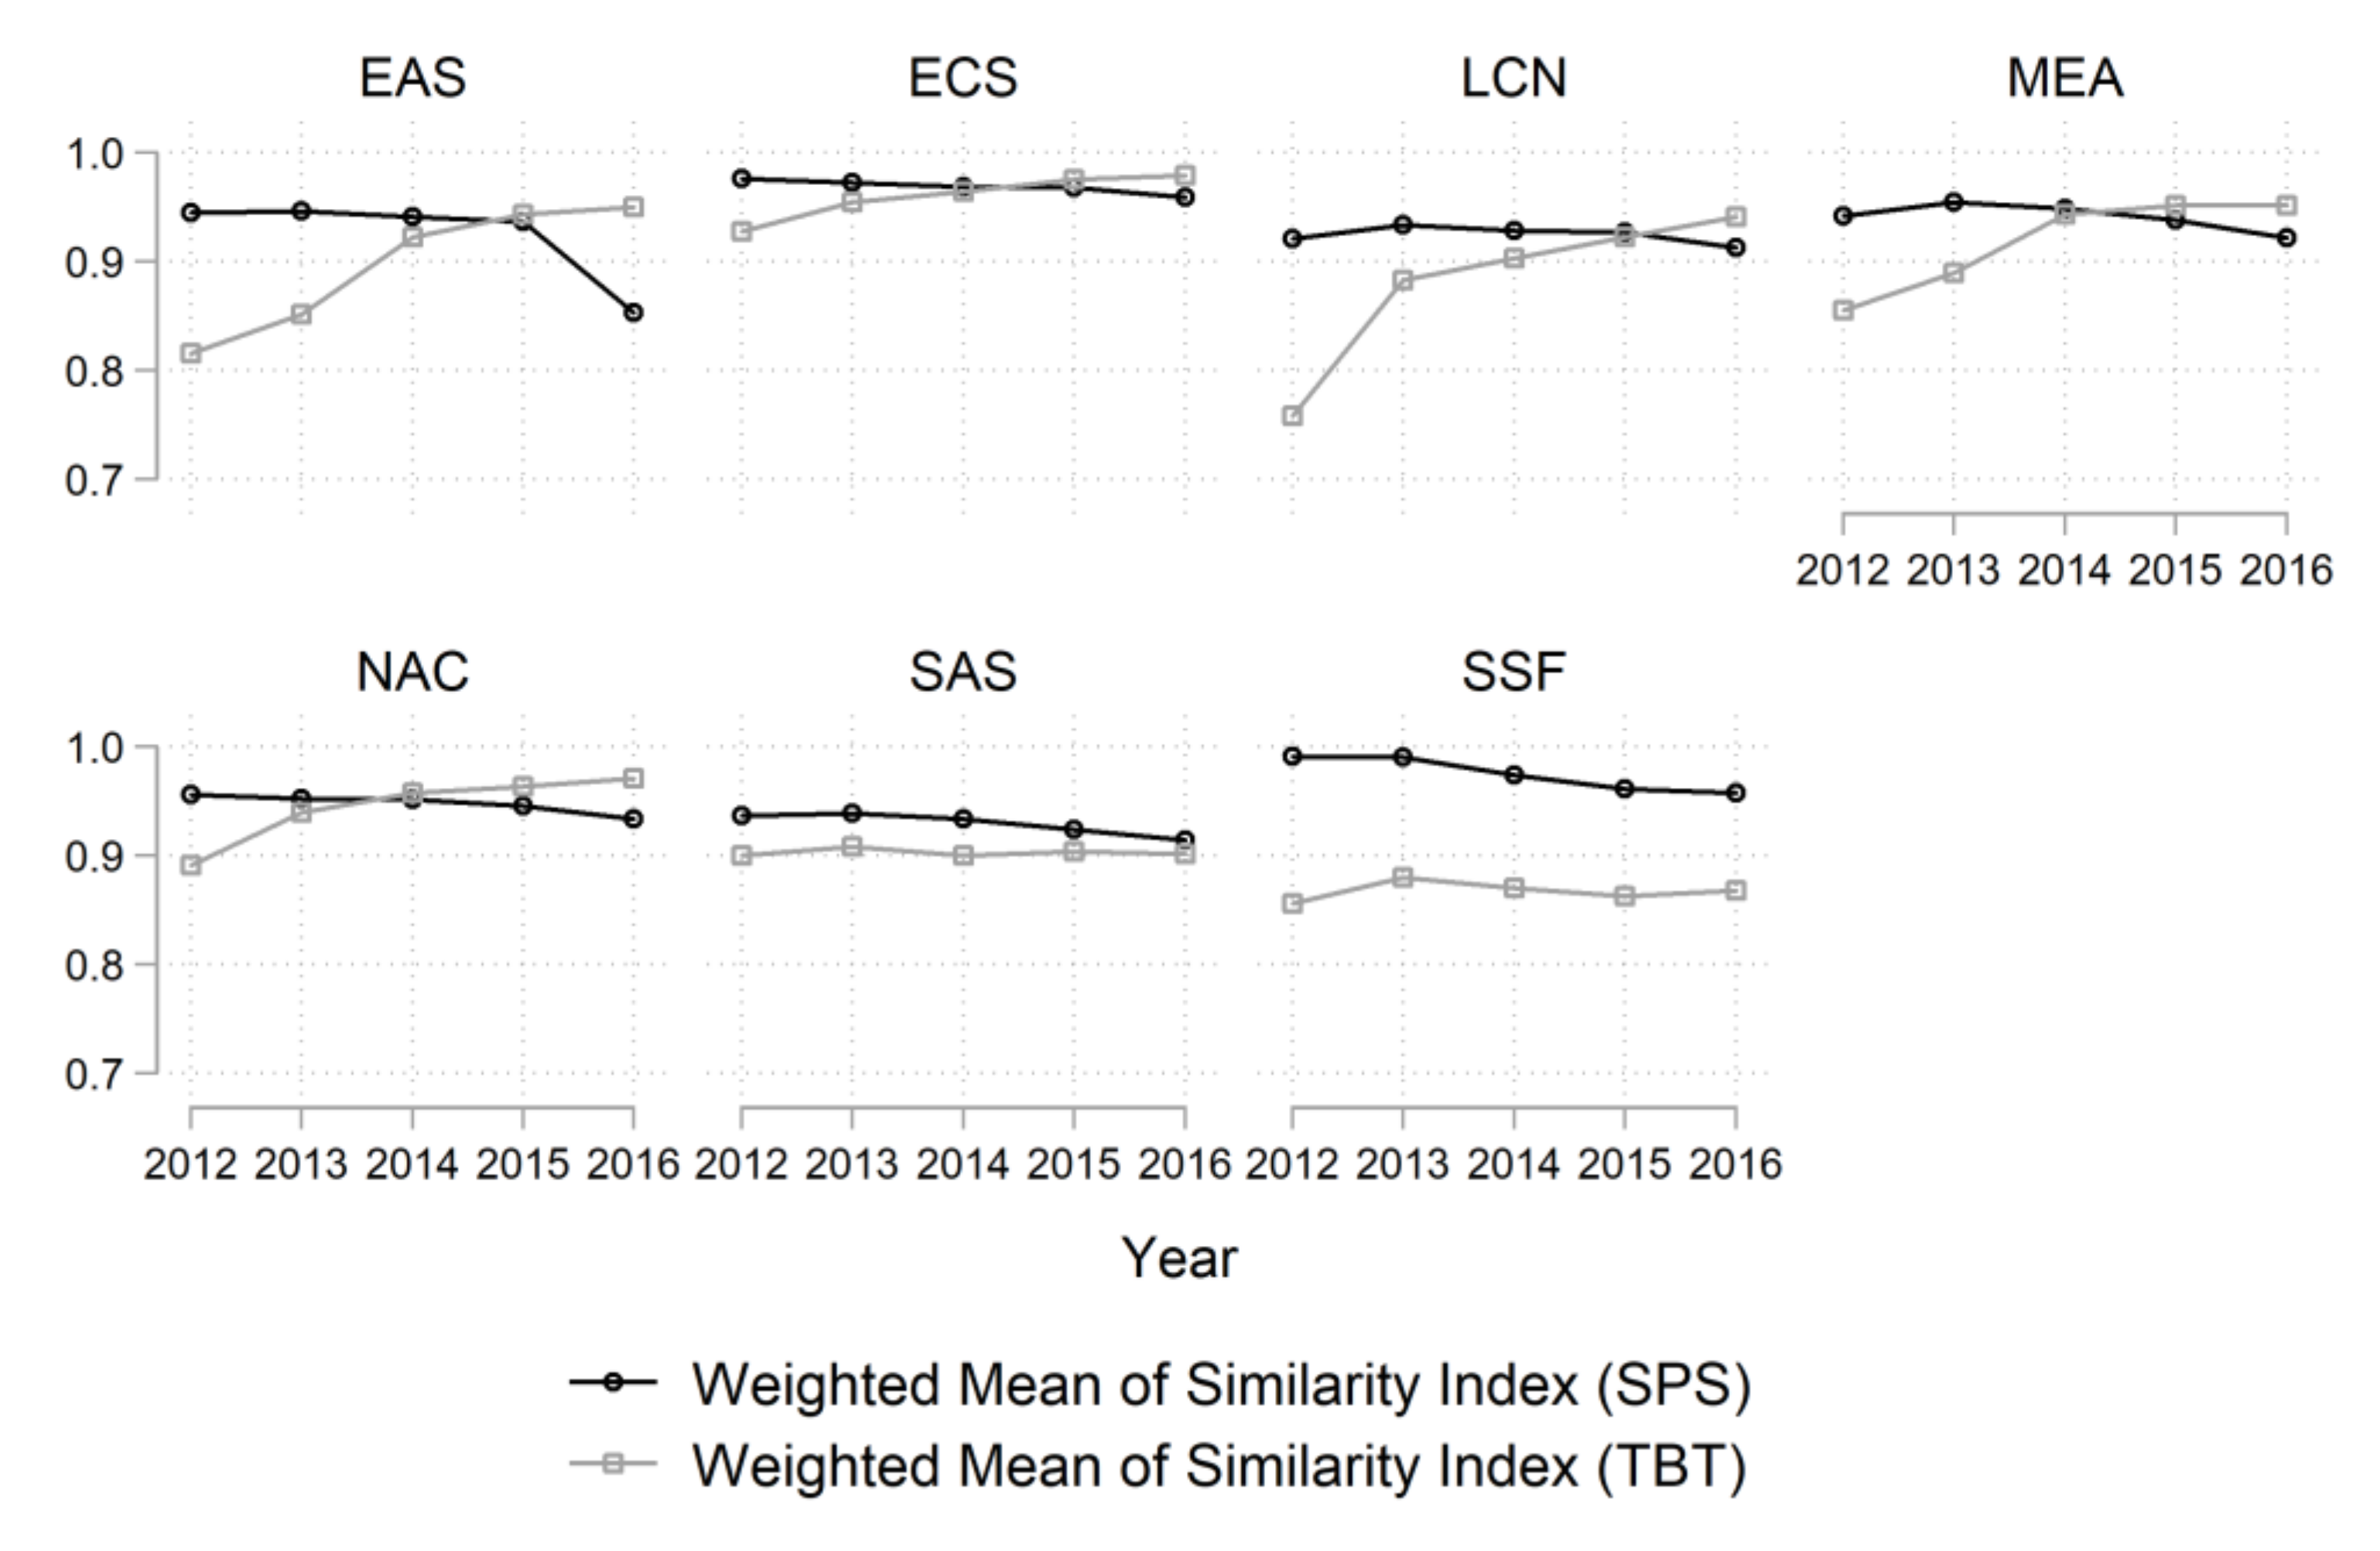
In the nonagricultural sector, the weighted mean of the similarity index for SPS measures was found to decrease during the sample period in all regions (see Figure 9). However, the weighted mean of the similarity index for TBT was found to be increasing in most regions, with the exception of South Asia and Sub-Saharan Africa. Sub-Saharan Africa has the highest mean value of similarity indices for SPS in 2012–2013, which implies that most trade flows occurred in the nonagricultural products with high SPS similarity indices. However, the highest overall similarity indices were found in Europe and Central Asia.
The results in Table 2 show that, at the HS 2-digit level, both preferential tariff rates and MFN applied tariff rates have negative impacts on trade flows at the 1% level. However, the impacts of FTA on the trade flows are not significant at the 5% level in both sectors. These results do not confirm the previous empirical findings of Baier and Bergstrand [25] and others who analyzed the industries as a whole, possibly because FTAs have mixed effects on the HS 2-digit level industries; for example, some industries may be positively affected but others may be negatively affected by the FTAs. Moreover, annual changes of the FTAs may have been minor for the study period, thus the country pair fixed effects may already reflect the FTA effects.
Similarity indices have different effects. Similarity indices for SPS measures have significant effects on trade only in the agricultural industry but only those for TBT measures are significant in nonagricultural industries. This is possibly due to the fact that SPS measures usually relate to food, plants, and livestock, which comprise mostly agricultural products. The similar structure of TBT measures between countries is likely to expand their bilateral trade because their similar structure may reduce the trade cost entailed by regulatory heterogeneity. TBT measures include labelling requirements, packaging, and conformity assessments. When these regulations are aligned it lowers the cost by reducing the number of tests, certificates required, and conformity burden. However, the similar structure of SPS measures is shown to have negative impacts on bilateral trade. This is possibly because SPS measures are used in a protectionist manner to protect a country’s sensitive products, including agricultural products, from imports. In addition, this result may reflect the nature of SPS measures to ensure the safety of food and animal and plant health. The risk factors vary due to differences in climate, existing diseases and pests, production practices, and general safety controls. The structural similarity in SPS measures indicates that two countries recognize similar risk factors, thus they may implement conservative measures to achieve a certain level of heath protection.

5. Discussion and Conclusions

In general, the introduction of nontariff measures has been recognized as an impediment to trade. However, the results of this study showed that certain nontariff measures, such as TBT, promote trade if good harmony exists between countries. Many existing studies [30,31,32,33] suggest that the expansion of trade triggers economic growth and promotes the sustainability of society. By comparison, the results of this study also show that trade is hindered as the similarity between the two countries increases in certain nontariff measures such as SPS. This means that in the case of SPS measures, quantitative aspects such as the number of implementations are similar in the two countries but not in qualitative aspects, that is, in actual content. Therefore, to contribute to the promotion of trade and the resulting economic growth and sustainability, it is implied that in the case of SPS measures, content harmonization is necessary.
The results of this study demonstrate that the harmonization of trade regulations has a significant effect on trade. In particular, this supports the need for international efforts to harmonize the regulatory framework and include efforts to harmonize TBT measures. The harmonization of TBT measures, which requires a high level of technological innovation to reduce the environmental burden and eliminate harm to humans, facilitates the contribution of technology development to the environment.
The results of this study on the effect of the harmonization of SPS measures on trade may be controversial in terms of the contribution of SPS measures to agricultural development in less developed countries that mainly export agricultural products. The higher degree of harmonization of SPS measures has led to a decrease in agricultural trade. However, if harmonization of SPS measures plays a major role in terms of food security and protection of human health, it may contribute to development. Therefore, the relationship between the harmonization of SPS measures and sustainability is difficult to judge, because the effect of the harmonization of the SPS measures on trade, in addition to factors such as trade, the domestic food supply system, and the health level of the people, must be analyzed together.
In this study, there was a limit to the use of available data in the analysis of quantitative techniques. According to Lampe et al. [34], regulations can be horizontally and vertically differentiated. In this respect, the regulatory divergence between two countries can arise from both horizontal and vertical levels. In this paper, the similarity index we introduced captures well the horizontal differences, which merely represent the different structures of regulations. However, it is not likely to reflect the level of difference from a vertical perspective. To identify the similarities at the vertical level, it is difficult to compare the contents of all measures of each country sequentially. Future research should focus on exploring other similarity indexes that can measure vertical differences.

Author Contributions

Conceptualization, S.H.L.; methodology, S.H.L. and S.J.C.; formal analysis, S.J.C.; data collection, S.O.; writing—original draft preparation, S.H.L., S.O. and S.J.C.; writing—review and editing, S.H.L. All authors have read and agreed to the published version of the manuscript.

Funding

This study was supported by 2018 Research Grant from Kangwon National University (No. 520180032).

Acknowledgments

Section 2 “Trend of Non-Tariff Measures” is a partial revision of Cho et al. [35].

Conflicts of Interest

The authors declare no conflict of interest.

References

  1. Kee, H.L.; Nicita, A.; Olarreaga, M. Estimating Trade Restrictiveness Indices. Econ. J. 2009, 119, 172–199. [Google Scholar]
  2. Orefice, G. Non-Tariff Measures, Specific Trade Concerns and Tariff Reduction. World Econ. 2017, 40, 1807–1835. [Google Scholar] [CrossRef]
  3. United Nationas Economic and Social Commission for Asia and the Pacific (UNESCAP); United Nations Conference on Trade and Development (UNCTAD). Navigating Non-Tariff Measures towards Sustainable Development; United Nations Publication: New York, NY, USA, 2019; ISBN 978-92-1-120795-8. [Google Scholar]
  4. World Trade Organization (WTO). The WTO Agreement Series: Sanitary and Phytosanitary Measures; WTO: Geneva, Switzerland, 2010; ISBN 978-92-870-3803-6. [Google Scholar]
  5. Beghin, J.; Disdier, A.-C.; Marette, S.; Tongeren, F.V. Welfare costs and benefits of non-tariff measures in trade: A conceptual framework and application. World Trade Rev. 2012, 11, 356–375. [Google Scholar] [CrossRef] [Green Version]
  6. Cadot, O.; Gourdon, J.; van Tongeren, F. Estimating Ad Valorem Equivalents of Non-Tariff Measures: Combining Price-Based and Quantity-Based Approaches; OECD Publishing: Paris, France, 2018. [Google Scholar]
  7. Disdier, A.-C.; Fontagné, L.; Mimouni, M. The Impact of Regulations on Agricultural Trade: Evidence from the SPS and TBT Agreements. Am. J. Agric. Econ. 2008, 90, 336–350. [Google Scholar] [CrossRef] [Green Version]
  8. Swann, P.; Temple, P.; Shurmer, M. Standards and Trade Performance: The UK Experience. Econ. J. 1996, 106, 1297–1313. [Google Scholar] [CrossRef]
  9. Moenius, J. Information Versus Product Adaptation: The Role of Standards in Trade; Working Paper; International Business & Market Research Center: Evanston, IL, USA, 2004. [Google Scholar]
  10. Chevassus-Lozza, E.; Latouche, K.; Majkovič, D.; Unguru, M. The importance of EU-15 borders for CEECs agri-food exports: The role of tariffs and non-tariff measures in the pre-accession period. Food Policy 2008, 33, 595–606. [Google Scholar] [CrossRef]
  11. Anders, S.M.; Caswell, J.A. Standards as Barriers Versus Standards as Catalysts: Assessing the Impact of HACCP Implementation on U.S. Seafood Imports. Am. J. Agric. Econ. 2009, 91, 310–321. [Google Scholar] [CrossRef] [Green Version]
  12. Organisation for Economic Co-operation and Development (OECD). International Regulatory Co-Operation and Trade; OECD Publishing: Paris, France, 2017. [Google Scholar]
  13. Asia-Pacific Economic Cooperation (APEC). Reducing Trade Transaction Costs: Harmonization of Standards and Conformity Assessments in APEC; APEC Secretariat, APEC Policy Support Unit: Singapore, 2011; p. 46. [Google Scholar]
  14. World Trade Organization (WTO). Agreement on Trade Facilitation; WTO: Geneva, Switzerland, 2014. [Google Scholar]
  15. Cadot, O.; Asprilla, A.; Gourdon, J.; Knebel, C.; Peters, R. Deep Regional Integration and Non-Tariff Measures: A Methodology for Data Analysis; Policy Issues in International Trade and Commodities Research Study Series No. 69; United Nations Conference on Trade and Development (UNCTAD); United Nations Publication: New York, NY, USA; Geneva, Switzerland, 2015. [Google Scholar]
  16. Webb, M.; Strutt, A.; Walmsley, T. Regulatory harmonization in the ASEAN region: The effects of applying different types of non-tariff measures. In Proceedings of the 22nd Annual Conference on Global Economic Analysis, Warsaw, Poland, 19–21 June 2019. [Google Scholar]
  17. World Trade Organization (WTO). Integrated Trade Intelligence Portal. Available online: http://i-tip.wto.org/goods (accessed on 4 October 2020).
  18. Bora, B.; Kuwahara, A.; Laird, S. Quantification of Non-Tariff Measures; Policy issues in international trade and commodities; United Nations: New York, NY, USA, 2002; ISBN 978-92-1-112555-9. [Google Scholar]
  19. Fernandes, A.M.; Klenow, P.J.; Meleshchuk, S.; Pierola, D.; Rodríguez-Clare, A. The Intensive Margin in Trade; National Bureau of Economic Research: Cambridge, MA, USA, 2018. [Google Scholar]
  20. Peterson, E.; Grant, J.; Roberts, D.; Karov, V. Evaluating the Trade Restrictiveness of Phytosanitary Measures on U.S. Fresh Fruit and Vegetable Imports. Am. J. Agric. Econ. 2013, 95, 842–858. [Google Scholar] [CrossRef]
  21. Fugazza, M. The Economics Behind Non-Tariff Measures: Theoretical Insights and Empirical Evidence; UNCTAD: Geneva, Switzerland, 2013. [Google Scholar]
  22. Gourdon, J. CEPII NTM-MAP: A Tool for Assessing the Economic Impact of Non-Tariff Measures; CEPII: Paris, France, 2014; p. 21. [Google Scholar]
  23. Anderson, J.E.; van Wincoop, E. Gravity with Gravitas: A Solution to the Border Puzzle. Am. Econ. Rev. 2003, 93, 170–192. [Google Scholar] [CrossRef] [Green Version]
  24. Santos Silva, J.; Tenreyro, S. The log of gravity. Rev. Econ. Stat. 2006, 88, 641–658. [Google Scholar] [CrossRef] [Green Version]
  25. Baier, S.L.; Bergstrand, J.H. Do free trade agreements actually increase members’ international trade? J. Int. Econ. 2007, 71, 72–95. [Google Scholar] [CrossRef] [Green Version]
  26. Correia, S.; Guimarães, P.; Zylkin, T. Fast Poisson estimation with high-dimensional fixed effects. Stata J. 2020, 20, 95–115. [Google Scholar] [CrossRef]
  27. StataCorp. Stata Statistical Software: Release 14; StataCorp LP: College Station, TX, USA, 2015. [Google Scholar]
  28. Head, K.; Mayer, T. Chapter 3—Gravity Equations: Workhorse, Toolkit, and Cookbook. In Handbook of International Economics; Gopinath, G., Helpman, E., Rogoff, K., Eds.; Elsevier: Amsterdam, The Netherlands, 2014; Volume 4, pp. 131–195. ISBN 1573-4404. [Google Scholar]
  29. United Nations Conference on Trade and Development (UNCTAD). TRAINS NTMs: The Global Database on Non-Tariff Measures; UNCTAD: New York, NY, USA, 2017. [Google Scholar]
  30. Berg, M.A.; Krueger, A.O. Trade, Growth, and Poverty: A Selective Survey; IMF Working Paper No. 03-30; International Monetary Fund: Washington, DC, USA, 2003; pp. 1–50. [Google Scholar]
  31. Bhagwati, J.; Srinivason, T.N. Trade and Poverty in the Poor Countries. Am. Econ. Rev. 2002, 92, 180–183. [Google Scholar] [CrossRef] [Green Version]
  32. Busse, M.; Königer, J. Trade and Economic Growth: A Re-Examination of the Empirical Evidence; HWWI Research Papers; Hamburg Institute of International Economics: Hamburg, Germany, 2012. [Google Scholar]
  33. Dollar, D.; Kraay, A. Trade, Growth, and Poverty. Econ. J. 2004, 114, F22–F49. [Google Scholar] [CrossRef] [Green Version]
  34. von Lampe, M.; Deconinck, K.; Bastien, V. Trade-Related International Regulatory Co-Operation; OECD Publishing: Paris, France, 2016. [Google Scholar]
  35. Cho, S.J.; Oh, S.; Kim, S. Agro-Food Trade Strategies under Changing Patterns of Global Trade: A Study on Non-tariff Measures; Research Report R821; Korea Rural Economic Institute: Naju, Korea, 2018; Available online: https://bit.ly/3648vTZ (accessed on 4 October 2020).
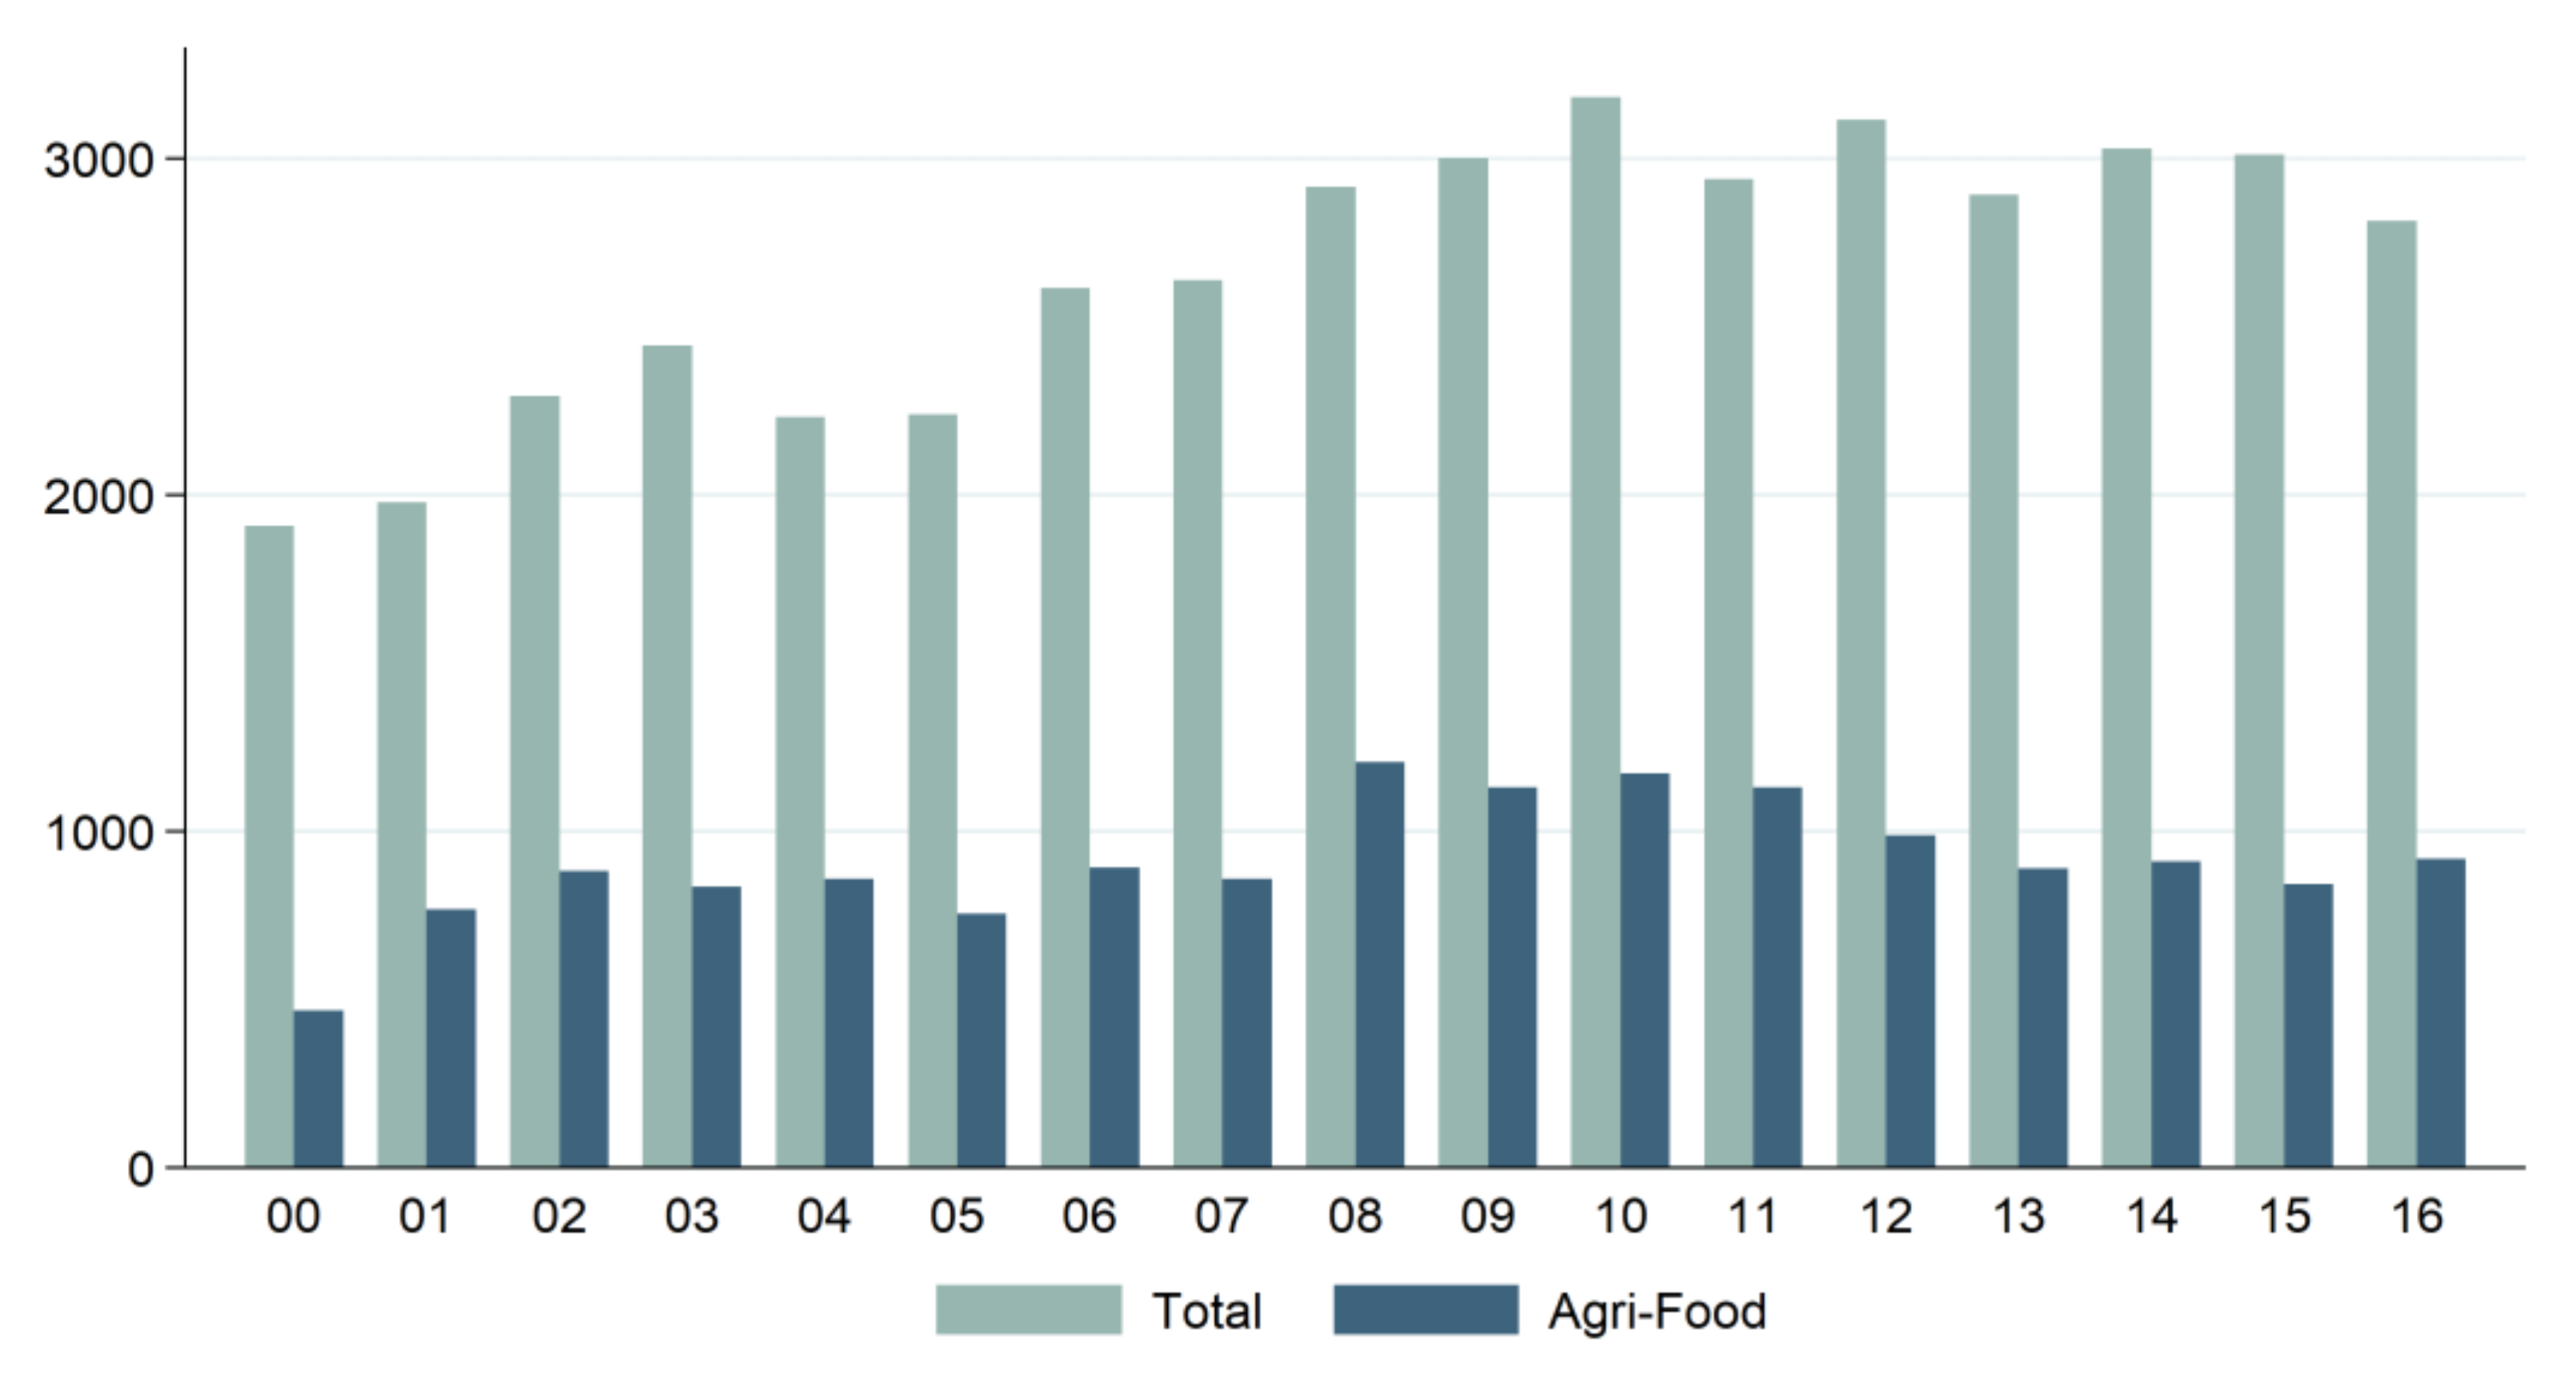
Figure 1. Trends of overall nontariff measures (NTMs) and NTMs for agricultural and food products (unit: cases). Source: [17].
Sustainability 12 10545 g001
Figure 2. Status of NTMs by continent (2016) (SPS: sanitary and phytosanitary measures; TBT: technical barriers to trade; AD: antidumping duties; CV: countervailing duties). Source: [17].
Sustainability 12 10545 g002
Figure 3. Major NTMs and current state of measures by country (unit: cases; SPS: sanitary and phytosanitary measures; TBT: technical barriers to trade; QR: quantitative restrictions; AD: antidumping duties; SSG: special safeguard). Source: [17].
Sustainability 12 10545 g003
Figure 4. Trade value and NTMs for agricultural and food products (unit: cases, trillion dollars; SPS: sanitary and phytosanitary measures; TBT: technical barriers to trade; QR: quantitative restrictions; SSG: special safeguards). Source: [17].
Sustainability 12 10545 g004
Figure 5. Trend of NTMs for agricultural and food products by continent (unit: cases). Source: [17].
Sustainability 12 10545 g005
Figure 6. Trade-weighted mean of tariff rates by year and sector.
Sustainability 12 10545 g006
Figure 7. Trade-weighted mean of similarity indices by year and sector.
Sustainability 12 10545 g007
Figure 8. Trade-weighted mean of similarity indices by year and region in the agricultural sector (EAS—East Asia and Pacific; ECS—Europe and Central Asia; LCN—Latin America and Caribbean; MEA—Middle East and North Africa; NAC—North America; SAS—South Asia; SSF—Sub-Saharan Africa).
Sustainability 12 10545 g008
Figure 9. Trade-weighted mean of similarity indices by year and region in the nonagricultural sector. (EAS—East Asia and Pacific; ECS—Europe and Central Asia; LCN—Latin America and Caribbean; MEA—Middle East and North Africa; NAC—North America; SAS—South Asia; SSF—Sub-Saharan Africa).
Sustainability 12 10545 g009
Table 1. Summary statistics.
VariablesDescriptionMeanStandard
Deviation
MinMax
Agriculture (N = 241,960)
TValue of trade (1000 USD)18,607130,9961.0016,625,120
lnTprefln(1 + Preferential tariff)1.341.340.006.07
lnTmfnln(1 + MFN tariff)1.661.350.006.29
FTA1 = RTA0.430.500.001.00
SI_spsSimilarity Index (SPS)0.900.230.001.00
SI_tbtSimilarity Index (TBT)0.770.360.001.00
Nonagriculture (N = 648,322)
TValue of trade (1000 USD)72,799883,1631118,465,968
lnTprefln(1 + Preferential tariff)0.810.970.005.04
lnTmfnln(1 + MFN tariff)1.090.970.005.33
FTA1 = RTA0.440.500.001.00
SI_spsSimilarity Index (SPS)0.930.170.001.00
SI_tbtSimilarity Index (TBT)0.900.220.001.00
Table 2. Estimated effects of structural similarity of nontariff measures on trade flows.
AgricultureNonagriculture
(1)(2)(3)(4)
ln(1 + Preferential tariff)−0.208** −0.190**
(0.037) (0.026)
ln(1 + MFN tariff) −0.756** −0.390**
(0.073) (0.055)
FTA −0.063 0.097
(0.045) (0.052)
Similarity Index (SPS)−0.329**−0.320**−0.113 −0.163
(0.121) (0.121) (0.093) (0.094)
Similarity Index (TBT)0.058 0.059 0.173*0.179*
(0.075) (0.076) (0.077) (0.077)
Constant12.675**13.504**14.498**14.716**
(0.135) (0.157) (0.114) (0.129)
Exporter–Sector–Year FEYes Yes Yes Yes
Importer–Sector–Year FEYes Yes Yes Yes
Pair FEYes Yes Yes Yes
Pseudo R20.917 0.918 0.959 0.959
N241,878 240,834 647,976 646,537
Note: * and ** represents significant levels at 5% and 1% respectively. FE indicates fixed effects. Pair-clustered robust standard errors are in parentheses. Additional “strict exogeneity” tests (inclusion of future lead of the FTA and similarity indices) show that any future lead variables are not statistically different from zero, and it implies reverse causality is not evident [25]. Test results are available upon request.
Publisher’s Note: MDPI stays neutral with regard to jurisdictional claims in published maps and institutional affiliations.