Article

Research on the International Roughness Index Threshold of Road Rehabilitation in Metropolitan Areas: A Case Study in Taipei City

1
Department of Civil Engineering, National Taipei University of Technology, 1, Sec. 3, Zhongxiao E. Rd., Taipei 10608, Taiwan
2
Department of Civil Engineering and Geomatics, Cheng Shiu University, No. 840, Chengching Rd., Niaosong District, Kaohsiung 83347, Taiwan
3
Center for Environmental Toxin and Emerging-Contaminant Research, Cheng Shiu University, No. 840, Chengching Rd., Niaosong District, Kaohsiung 83347, Taiwan
4
Super Micro Mass Research and Technology Center, Cheng Shiu University, No. 840, Chengching Rd., Niaosong District, Kaohsiung 83347, Taiwan
5
Taipei City Government, No. 1, City Hall Rd., Xinyi District, Taipei City 110204, Taiwan
6
Department of Agribusiness Management, National Pingtung University of Science and Technology, No. 1, Shuefu Rd., Neipu, Pingtung 91201, Taiwan
*
Author to whom correspondence should be addressed.
Sustainability 2020, 12(24), 10536; https://doi.org/10.3390/su122410536
Submission received: 24 October 2020 / Revised: 14 December 2020 / Accepted: 14 December 2020 / Published: 16 December 2020

Abstract

:
The International Roughness Index (IRI) is the standard scale for evaluating road roughness in many countries in the world. The Taipei City government actively promotes a Road Smoothing Project and plans to complete the rehabilitation of the main and minor roads within its jurisdiction. This study aims to detect the road surface roughness in Taipei City and recommend appropriate IRI thresholds for road rehabilitation. A total of 171 asphalt concrete pavement sections in Taipei City with a total length of 803.49 km were analyzed and compared by IRI. The longitudinal profile of the detected road sections was measured using an inertial profiler. The statistical analysis showed that the IRI value prior to road leveling was mainly distributed between 5 and 8 m/km, while the IRI value after road leveling was mainly distributed between 3 and 4.5 m/km. This confirms that the implementation of the Road Smoothing Project has a significant effect on improving road smoothness. Moreover, based on the analysis results, it is recommended that the IRI threshold value for road rehabilitation in Taipei City be set at 4.50 m/km.

1. Introduction

Cities are areas with a high density of living environments and active economic activities. Due to human communication and economic activities, urban roads are usually planned as interconnected networks. Basically, urban roads are composed of roadways, sidewalks, green belts, drainage systems, transportation facilities, intersections and auxiliary facilities. Generally speaking, urban road design needs to meet the traffic characteristics and traffic needs of its service objects (people, goods, cars, etc.). The pros and cons of road service performance are often reflected in the quantity, quality, and form. In other words, the scale of road construction should be sufficient, the road structure can ensure safe driving, the road network layout and road alignment should be reasonable, and the auxiliary facilities and management standards should be matched. Therefore, providing complete roads and good service performance is not only one of the important functions of modern cities, but also the foundation of sustainable urban development.
Roadways can be divided into flexible pavements and rigid pavements according to their structural properties [1]. In a flexible pavement, the wheel loads are transferred by grain-to-grain contact of the aggregate through the granular structure. This kind of pavement usually adopts a multi-layer design; from bottom to top, there are the subgrade (also known as the bed), subbase course, base course, and surface course. In a rigid pavement, the wheel loads are transferred to the subgrade soil through the bending strength of the pavement, and the pavement is like a rigid slab (such as a cement concrete pavement). Overall, the flexible pavement has proper bending resistance and sufficient stability to support the traffic load. As a result, urban roadways are mostly designed with flexible pavements. Pavement smoothness (sometimes termed roughness) is commonly estimated using a pavement profile (a measure of minute elevation changes in the pavement surface). According to a survey conducted by the Federal Highway Administration in 2002 [2], pavement smoothness is regarded as the most important indicator of user satisfaction. Since pavement smoothness is an important factor affecting the performance of roadway services, many researchers have been engaged in this field [3,4,5,6,7,8,9,10,11,12,13,14,15,16,17,18,19,20,21,22,23,24,25,26,27]. Commonly used pavement smoothness indicators include the International Roughness Index (IRI), Profile Index (PI), Maysmeter Index (MI), Root Mean Square Vertical acceleration (RMSVA), and Ride Number (RN), etc. In addition, because pavement service capacity is mainly affected by roughness, pavement performance indicators such as Present Serviceability Index (PSI) or Present Serviceability Rating (PSR) are also used to represent pavement roughness [4,8]. Regardless of the index, the goal is to mathematically reflect the level of comfort experienced by users while driving.
Taipei City is located in the Taipei Basin in northern Taiwan. It is the central city of the Taipei Metropolitan Area and northern Taiwan, and it is also an international city. Roads in Taipei City can be divided into express roads, main roads, secondary roads, and branch roads. Among them, express roads and main roads are the backbones of urban traffic, ensuring the connectivity of various areas in the city, while secondary roads and branch roads function as auxiliary main roads to ensure the accessibility of the regional road network. Urban roads are the facilities that most directly affect the experience of pedestrians, the quality of driving, and the safety of driving. They must have the characteristics of stability, comfort, and safety, and provide the service quality that satisfies road users under moderate maintenance. Therefore, how to maintain road quality with limited maintenance funds has become an important issue for relevant authorities. If a systematic method can be used to manage the pavement, the limited engineering funds will be able to maximize the benefits and maintain the service level of the overall road network.
For the sustainable development of the city, the Taipei City government has conducted the Road Smoothing Project since 1998 to improve the quality of roads under its jurisdiction. In addition to the smoothness test of the original asphalt concrete pavement before it is demolished, after the new asphalt concrete pavement of the road is completed, the smoothness test is conducted in conjunction with the supervision department and the construction manufacturer. However, compared with the U.S. states that currently use IRI values to assess road conditions and control the construction quality of individual highway projects, the threshold set by Taiwan’s current laws and regulations has room for adjustment. Furthermore, it has been mentioned in many previous documents that a higher initial roughness not only shortens the service life of the pavement but also increases the number of rehabilitations [11]. On the other hand, due to the low speed on urban roads, comfortable driving can still be achieved under high IRI values. It is necessary to determine the acceptable IRI threshold for urban roads with various speed limits.
Due to heavy traffic, the high frequency of pipeline excavation, and inaccurate backfilling, the rate of damage to the roads in Taipei City has accelerated, which not only increases the burden of maintenance work but also causes many human casualties. From this perspective, the implementation of quality maintenance work and the maintenance of good road service performance are urgent tasks of the Taipei City Government. In view of the above, this study aims to detect the road surface smoothness in Taipei City and examine the threshold values of acceptance for pavement surface characteristics to clarify whether there is room for adjustment of the current regulations.

2. International Roughness Index

2.1. The Analysis Mode of International Roughness Index

The IRI value was proposed by a study promoted by the World Bank in the 1980s [8]. It is calculated by using the dynamic response of vehicles to calculate the road profile, and then simulated by the so-called quarter car system. The quarter car simulation model consists of two parts: A sprung mass and an unsprung mass, as shown in Figure 1 [9,14]. The former represents the vehicle body, while the latter represents the set of wheel/tire and half axle/suspension. The sprung mass is connected to the unsprung mass through the suspension, and the suspension is simulated by a damper and a spring. In this model, the sprung and unsprung masses that correspond to one corner of the vehicle are represented by ms and mu, respectively. The suspension system is denoted by a linear spring with a stiffness of ks and a linear damper with a damping rate of cs, while the tire is modelled by a linear spring with a stiffness of kt. y represents the input of road unevenness. In the simulation process, the quarter car system drives on the longitudinal profile of the test road. The profile is measured in the field at a constant speed of 80 km/h. The roughness on this surface causes dynamic excitation of the quarter car system, resulting in different vertical speeds ( Z ˙ s and Z ˙ u ) or accelerations ( Z ¨ s and Z ¨ u ) in the sprung and unsprung masses. The result is a relative movement between the chassis and the wheel-axle of the imaginary vehicle. The vertical acceleration can be measured using accelerometers mounted on the body and front axle (or rear axle) of the vehicle. The transducer converts the strain of accelerometers into an electrical signal. By drawing free body diagrams and applying Newton’s Second Law, we get the following differential equations [9,14]:
m s Z ¨ s + c s ( Z ˙ s Z ˙ u ) + k s ( Z s Z u ) = 0 ,
m s Z ¨ s + m u Z ¨ u + k t ( Z u y ) = 0
Dividing both sides of Equations (1) and (2) by ms at the same time, the equations of motion can be simplified to Equations (3) and (4):
Z ¨ s + C ( Z ˙ s Z ˙ u ) + K 2 ( Z s Z u ) = 0 ,
Z ¨ s + u Z ¨ u + K 1 Z u = K 1 y
where C = c s / m s = 6   ( 1 / s ) ; u = m u / m s = 0.15 ; K 1 = k t / m s = 653   ( 1 / s 2 ) ; K 2 = k s / m s = 63.3   ( 1 / s 2 ) [9]. The National Cooperative Highway Research Program (NCHRP) research led to specific set of parameters for a quarter-car computerized response system, called the Golden Car [9]. The name was intended to convey that this computer representation was a calibration reference. The vertical displacement change of the vehicle can be obtained through quadratic integration, and then the distance between the vehicle and the pavement measured by the displacement sensor is added or subtracted to obtain the longitudinal profile elevation data of the pavement. Therefore, the IRI value for a given road section length can be calculated according to Equation (3) [9,14,28,29,30].
IRI = 1 L 0 L | Z s Z u | d x ,
Here, IRI = International Roughness Index (m/km); L = length of the section (km). Equations (3) and (4) are the simplest differential equations of motion corresponding to the vehicle model. They are described in the time domain t, that is, all variables such as Z s , Z u and their derivatives and y are functions of time. From the above analysis, we can see that IRI is achieved by solving Equations (3) and (4). There are many ways to solve the differential Equations (3) and (4), either analytical methods or numerical methods (such as Taylor Series Expansion, Euler’s Method, Second and Fourth Order Runge-Kutta) can be used [28,29]. Due to the discontinuity of the elevation function of the road section, it is difficult to express it with a unified mathematical function. Therefore, the numerical method is generally used to calculate the result to get the IRI. When the World Bank proposed IRI, it gave the calculation formula of the transfer matrix method [8]. At present, this numerical calculation method is generally used when calibrating IRI.

2.2. The Application of International Roughness Index

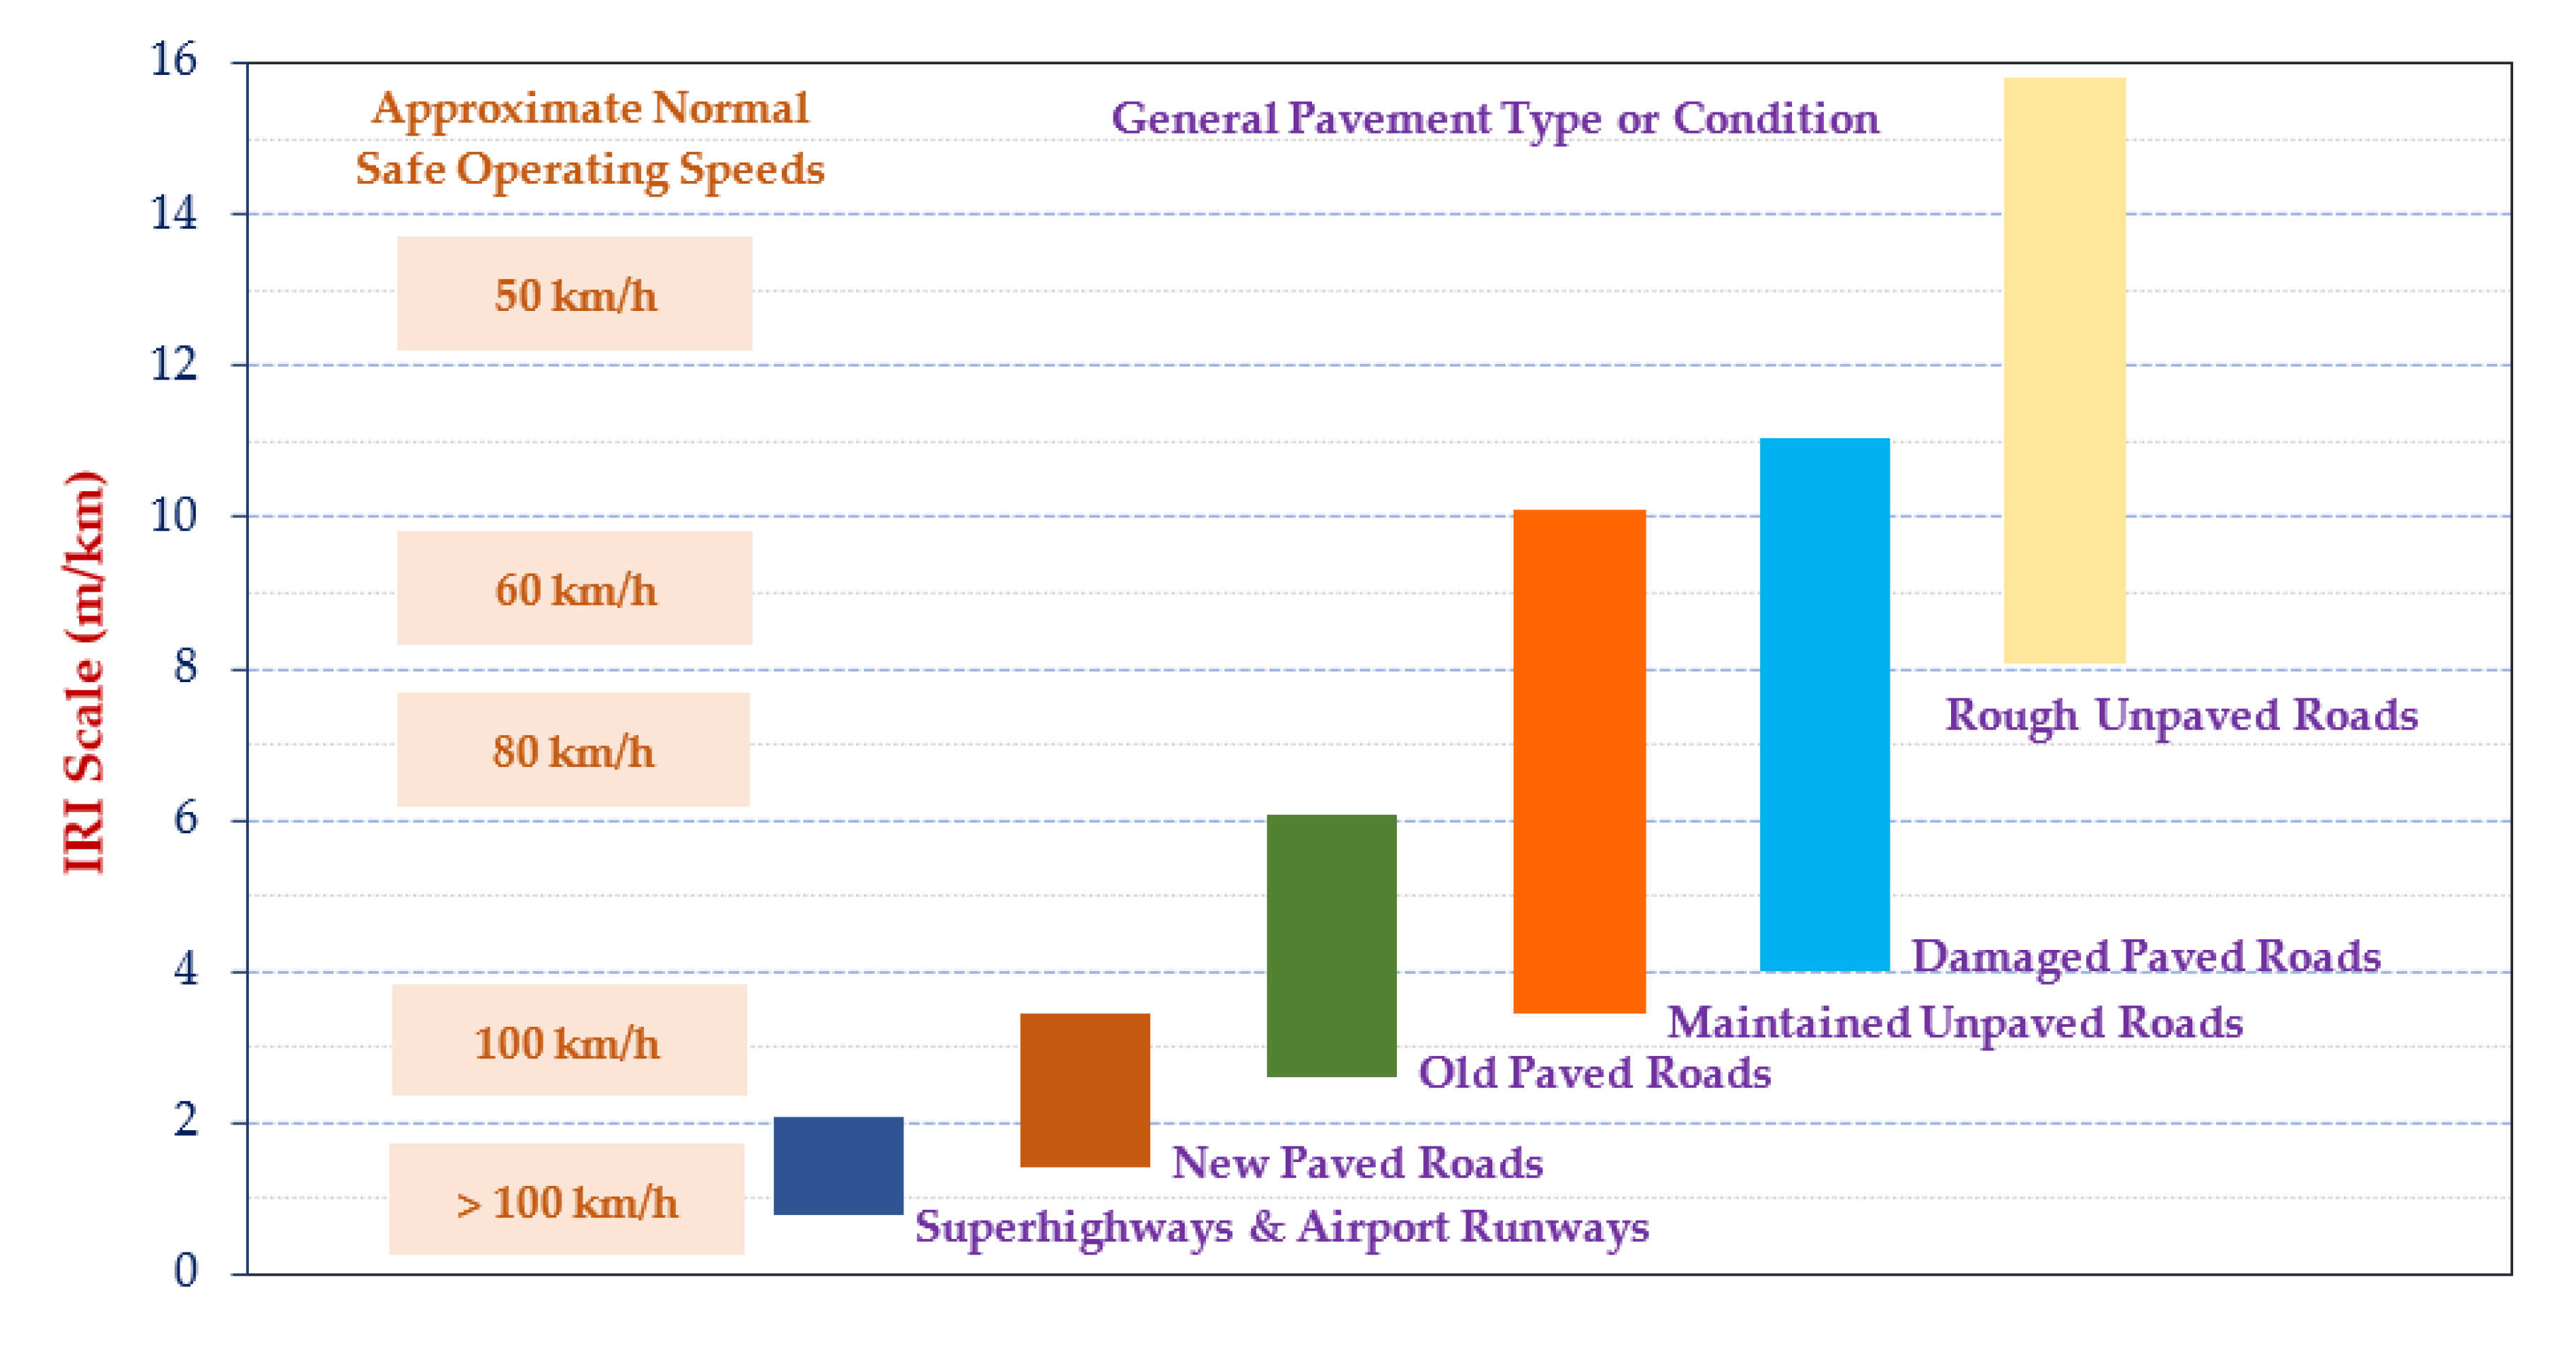
The unit of the IRI is usually meters per kilometer or inches per mile [6]. At present, IRI is a common international roughness evaluation index, which has the advantages of objectively measuring the pavement smoothness and not being interfered with by human factors. It is the first smoothness index that can be widely used in different types of pavement smoothness instruments and is supplemented by a set of program software to calculate the IRI value. The American Society for Testing and Materials (ASTM) has also included it in their specifications [14], so it is more efficient, practical, and fair than other smoothness evaluation indicators. Therefore, the IRI value can generally be used as an index to evaluate the quality of smoothness, as shown in Figure 2 [9]. In particular, it has linear characteristics and can be used to compare different smoothness values and objectively detect pavement smoothness. However, the IRI thresholds used around the world vary widely [16]. This is mainly because the IRI limit value depends on the following aspects: road surface type (i.e., flexible or rigid road surface), road function category, average annual daily flow (AADT), legal speed limit, and the length of the road section considered in the IRI calculation [31]. In addition, their changes depend on new roads or the reconstruction of roads that are still in use. Among the different parameters that affect the IRI specifications, the most important is undoubtedly the maximum allowable driving speed on the road, the roughness level of which should be evaluated [31]. In view of this, some researchers proposed speed-related IRI thresholds to evaluate the ride quality [32,33]. For example, Yu et al. [33] defined five ride quality levels, based on the jolt and jerk experienced by the evaluator in the speed range of 10 km/h to 120 km/h, and provided corresponding IRI thresholds, as shown in Table 1.
With the rapid advancement of science and technology, the techniques and methods used to measure road roughness are constantly innovating. A variety of roughness measurement instruments have been developed internationally. Bridgelall et al. [34] evaluated the increase in accuracy that can be achieved by adding standard speed bumps or existing anomalies to standard locations to enhance conventional geofencing systems to establish reference inertial markers. Their research results indicated that transportation agencies will benefit from using connected vehicle methods to achieve a level of precision and accuracy comparable to existing laser-based inertial profilers. Zhang et al. [35] used machine learning technology to estimate the roughness category and roughness index from inertial sensors on at least two connected vehicles. Their research results showed that the classification and estimation accuracy exceed 90%. Abeygunawardhana et al. [36] investigated the influence of road roughness on the speed patterns of different road sections under different traffic levels. The IRI measured through a smartphone application was used as an indicator of road roughness. The influence of road roughness was studied at free-flow speed (85th percentile speed) and 50th percentile speed, which was determined using the speed distribution that occurred during a specific time interval. In addition, the above behaviors were analyzed separately for junctions, mid-block sections, and horizontal curves to represent different road conditions. Moreover, remote sensing provides another method for IRI assessment. Meyer et al. [37] studied the applicability of satellite radar remote sensing data, especially the high-resolution synthetic aperture radar (SAR) data acquired in the X-band, to the network-wide mapping of pavement roughness of roads in the United States. Their research showed the capacity of X-band SAR for road surface roughness mapping.

3. Implementation of the Road Smoothing Project

3.1. Contents of the Road Smoothing Project

New road projects in Taipei City have become saturated, so the maintenance and repair of the existing road network are becoming increasingly important and large in number. The roads under the jurisdiction of Taipei City are all urban roads, with a maintenance area of approximately 20 million square meters, of which approximately 13 million square meters are for roads over 8 m, with the goal of rehabilitation once every 5 years; roads under 8 m are approximately 7 million square meters, with the goal of cyclical rehabilitation once every 10 years. The Taipei City Government actively promotes the Road Smoothing Project and plans to complete the rehabilitation of the main and minor roads within its jurisdiction in 6 years. The annual plan is to update an area of approximately 1.68 million square meters. In order to improve and maintain the overall serviceability of road systems, the order of implementation will be arranged according to the road conditions (such as road aging and damage, frequency of excavation, etc.). In this study, before and after the first phase of the Road Smoothing Project, 70 road sections in Taipei City were analyzed and compared using the IRI. In addition, in the second phase of the Road Smoothing Project, 101 road sections in Taipei City were analyzed using the IRI.

3.2. Measuring Equipment

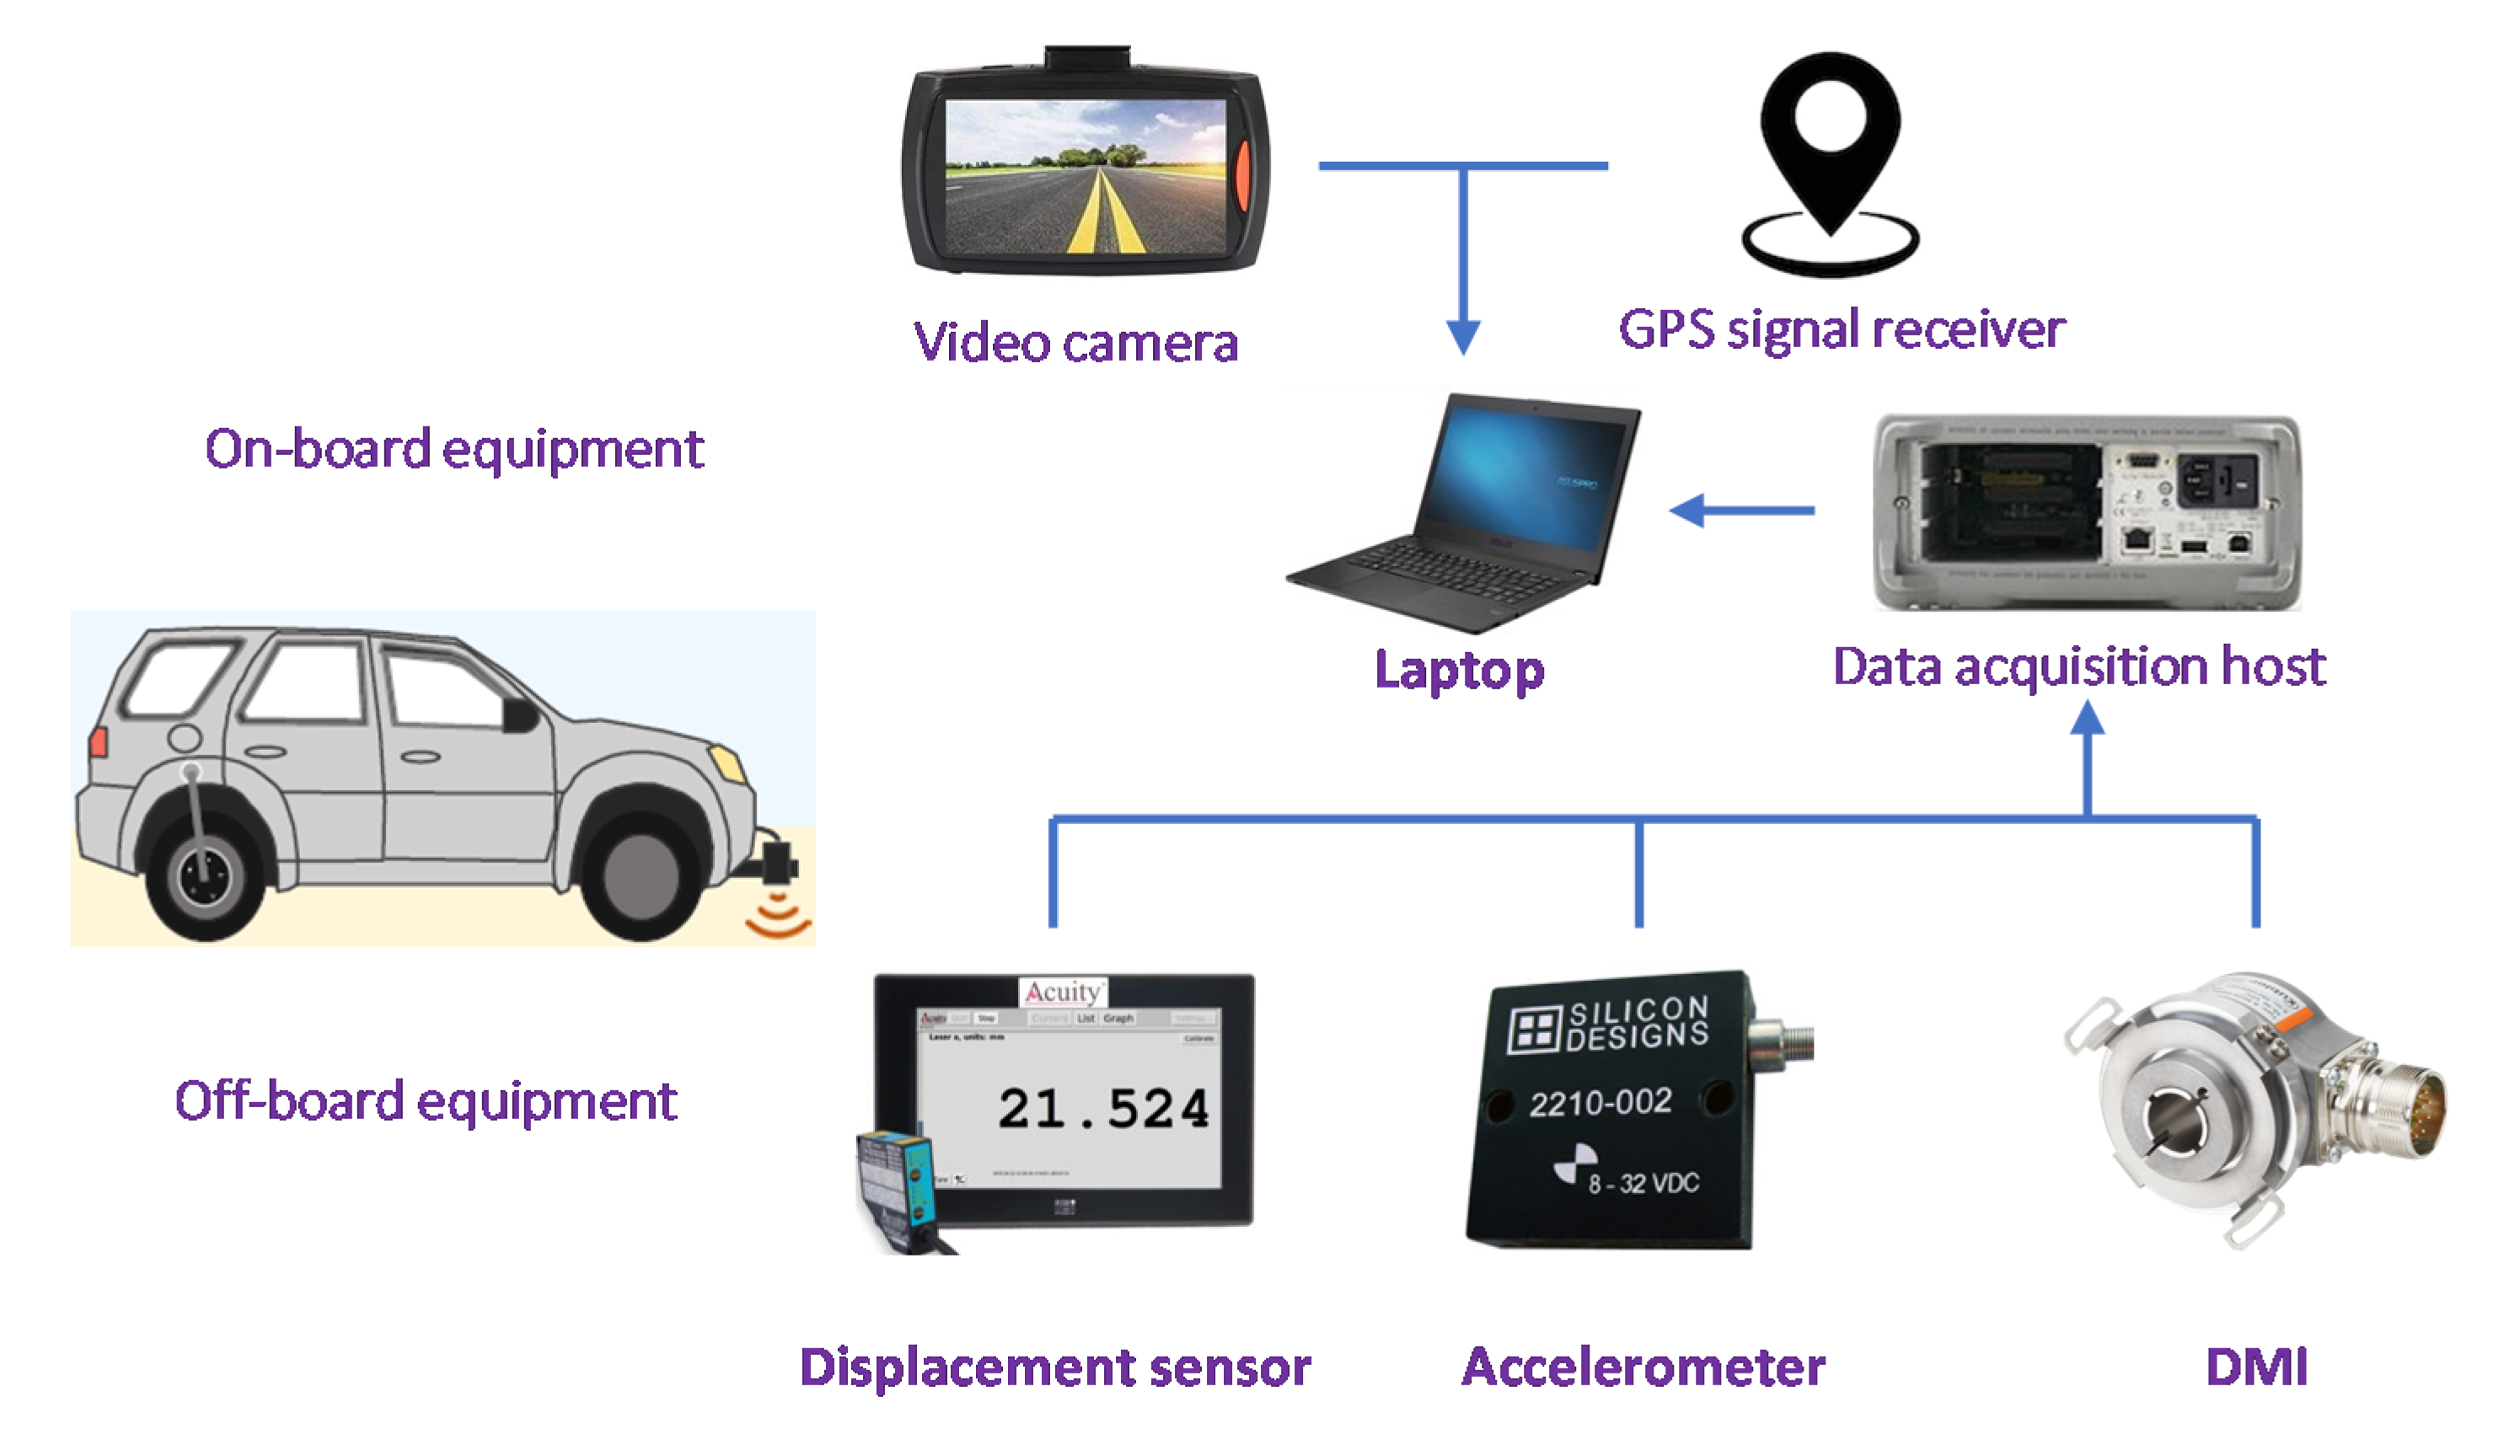
During the course of half a century of development, engineers and scientists have invented several techniques and methods for measuring road roughness. With the advancement of technology, highly efficient, automated and highly repeatable inertial profilometers have been developed. In this study, an inertia profiler was used to detect the current road surface smoothness in Taipei City. The inertial profiler is a test vehicle conforming to E 950 Class I [38], of which the system architecture is divided into two parts: on-board equipment and off-board equipment, as shown in Figure 3. The laser rangefinder was mounted on the front bumper of the vehicle. The main function of the displacement sensor is to receive the vertical relative distance between the vehicle and the road, while the accelerometer measures the acceleration value where the displacement sensor is located. Using the aforementioned data and the travel distance measured in conjunction with the distance measurement instrument (DMI), the change in the longitudinal profile of the detected road survey line can be calculated. The displacement sensor, accelerometer, and DMI directly transmit the signal to the data acquisition host installed in the car, and the host transmits the data to the notebook computer via a USB cable. With GPS signal receivers and video cameras, the system can analyze numerical outputs, IRI calculations, and GPS positioning data, and perform right-of-way photography integration. This system supports a variety of GPS signal receivers and video cameras, which can record driving position and road conditions. Moreover, the calibration and validation tests were used to confirm that the inertial profiler can operate properly.
Due to the impact of the urban road environment (such as traffic lights, traffic conditions, etc.), the test vehicle may not be able to reach the simulated speed of the quarter car of 80 km per hour. However, it can be corrected by the analysis software developed by the software development company [39]. The analysis software system automatically detects and analyzes the longitudinal profile data at the track of the inspection wheel using high-frequency sampling, and records one data point every 25 cm. During the detection process, the vehicle speed, travel distance, laser rangefinder measurement value, and acceleration value are displayed on the software screen in real time, and the program detects the length of the vehicle approaching the detection section (default is 100 m), instantly calculating and outputting the IRI value at the wheel tracking. The calculation of IRI is based on the average rectified slope (ARS), which is a filtered rate of the cumulative suspension movement of the test vehicle divided by the distance traveled by the vehicle during the measurement.

3.3. On-Site Inspection Method

Before the on-site inspection operation starts, the relevant information of the inspection section must first be confirmed, including the length of the section, the number of inspection lanes, the starting and ending points of the section, etc., and the inspection operation record sheet for the use of on-site records must be created. In the actual inspection process, the inspector will turn on the inspection program system before driving into the inspection section to observe whether the readings of the various sensors are normal. At this time, the data will be regarded as the preliminary section data, and it is necessary to ensure that the detection speed is stable. When the test vehicle drives into the starting point of the inspection section, it starts to collect the smoothness data; when the test vehicle drives out of the end of the inspection section, it stops collecting data. In addition, in order to avoid excessively low vehicle speeds or unstable detection speeds due to excessive traffic volume, the detection operation will avoid the peak traffic time or arrange it to be carried out in a period of low traffic flow. The smoothness inspection operation is carried out at a stable speed under the limit of the on-site road speed limit. Furthermore, if the road area is watery, the laser rangefinder may produce scattering phenomena, which will affect the accuracy of the detection value. Therefore, the detection is carried out when there is no water on the road and the weather is good.

4. Analysis and Discussion of Actual Measurement Results

4.1. Detection and Analysis of the IRI Value Before and After Road Leveling

Since 2007, the Taipei City government has successively carried out annual IRI testing projects to conduct testing, analysis, and comparison of the IRI values of major roads before and after leveling. The detection direction of the inspection lane is divided into the forward direction (from the starting point to the ending point) and reverse direction (from the ending point to the starting point). In this study, 50 m was used as a detection interval, and the vehicle speed, left (left wheel tracking) IRI, right (right wheel tracking) IRI, and average IRI were recorded in the record sheet. If the interval was less than 50 m, it was merged into the previous detection interval. Subsequently, the average IRI value was used as the basis for various statistical analyses and calculations. Take the IRI of the road number 28 before leveling as an example; the total length of the inspection was 3100 m (forward and reverse lanes), the average IRI value of the forward lane was 6.52 m/km, and the average IRI value of the reverse lane was 7.72 m/km, so the total average IRI value of this section before leveling was 7.12 m/km, as shown in Table 2.
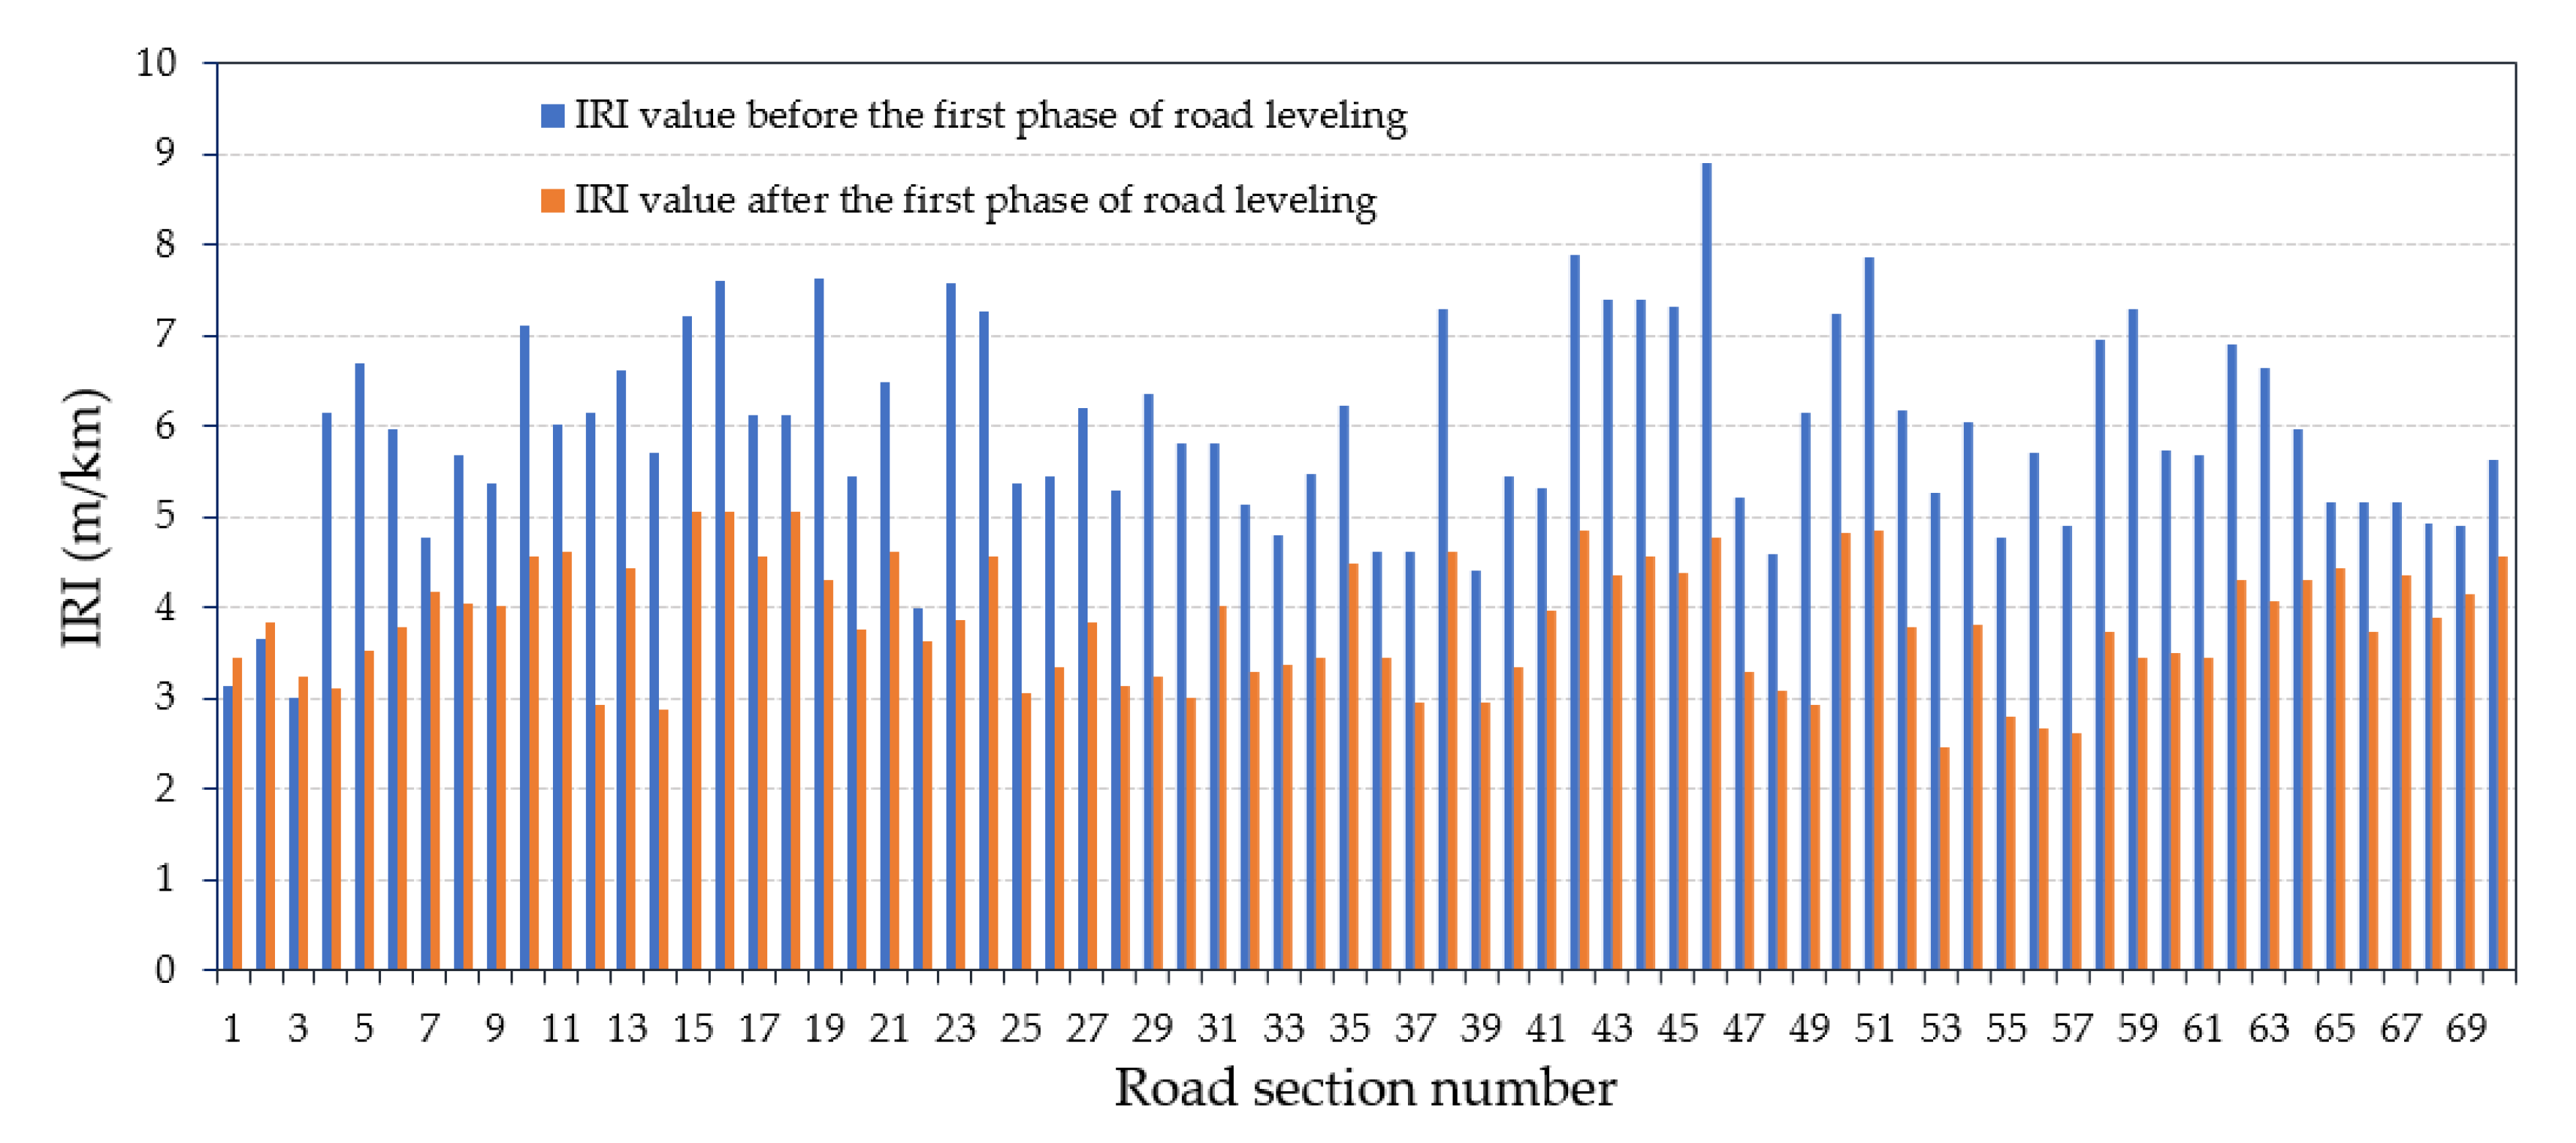
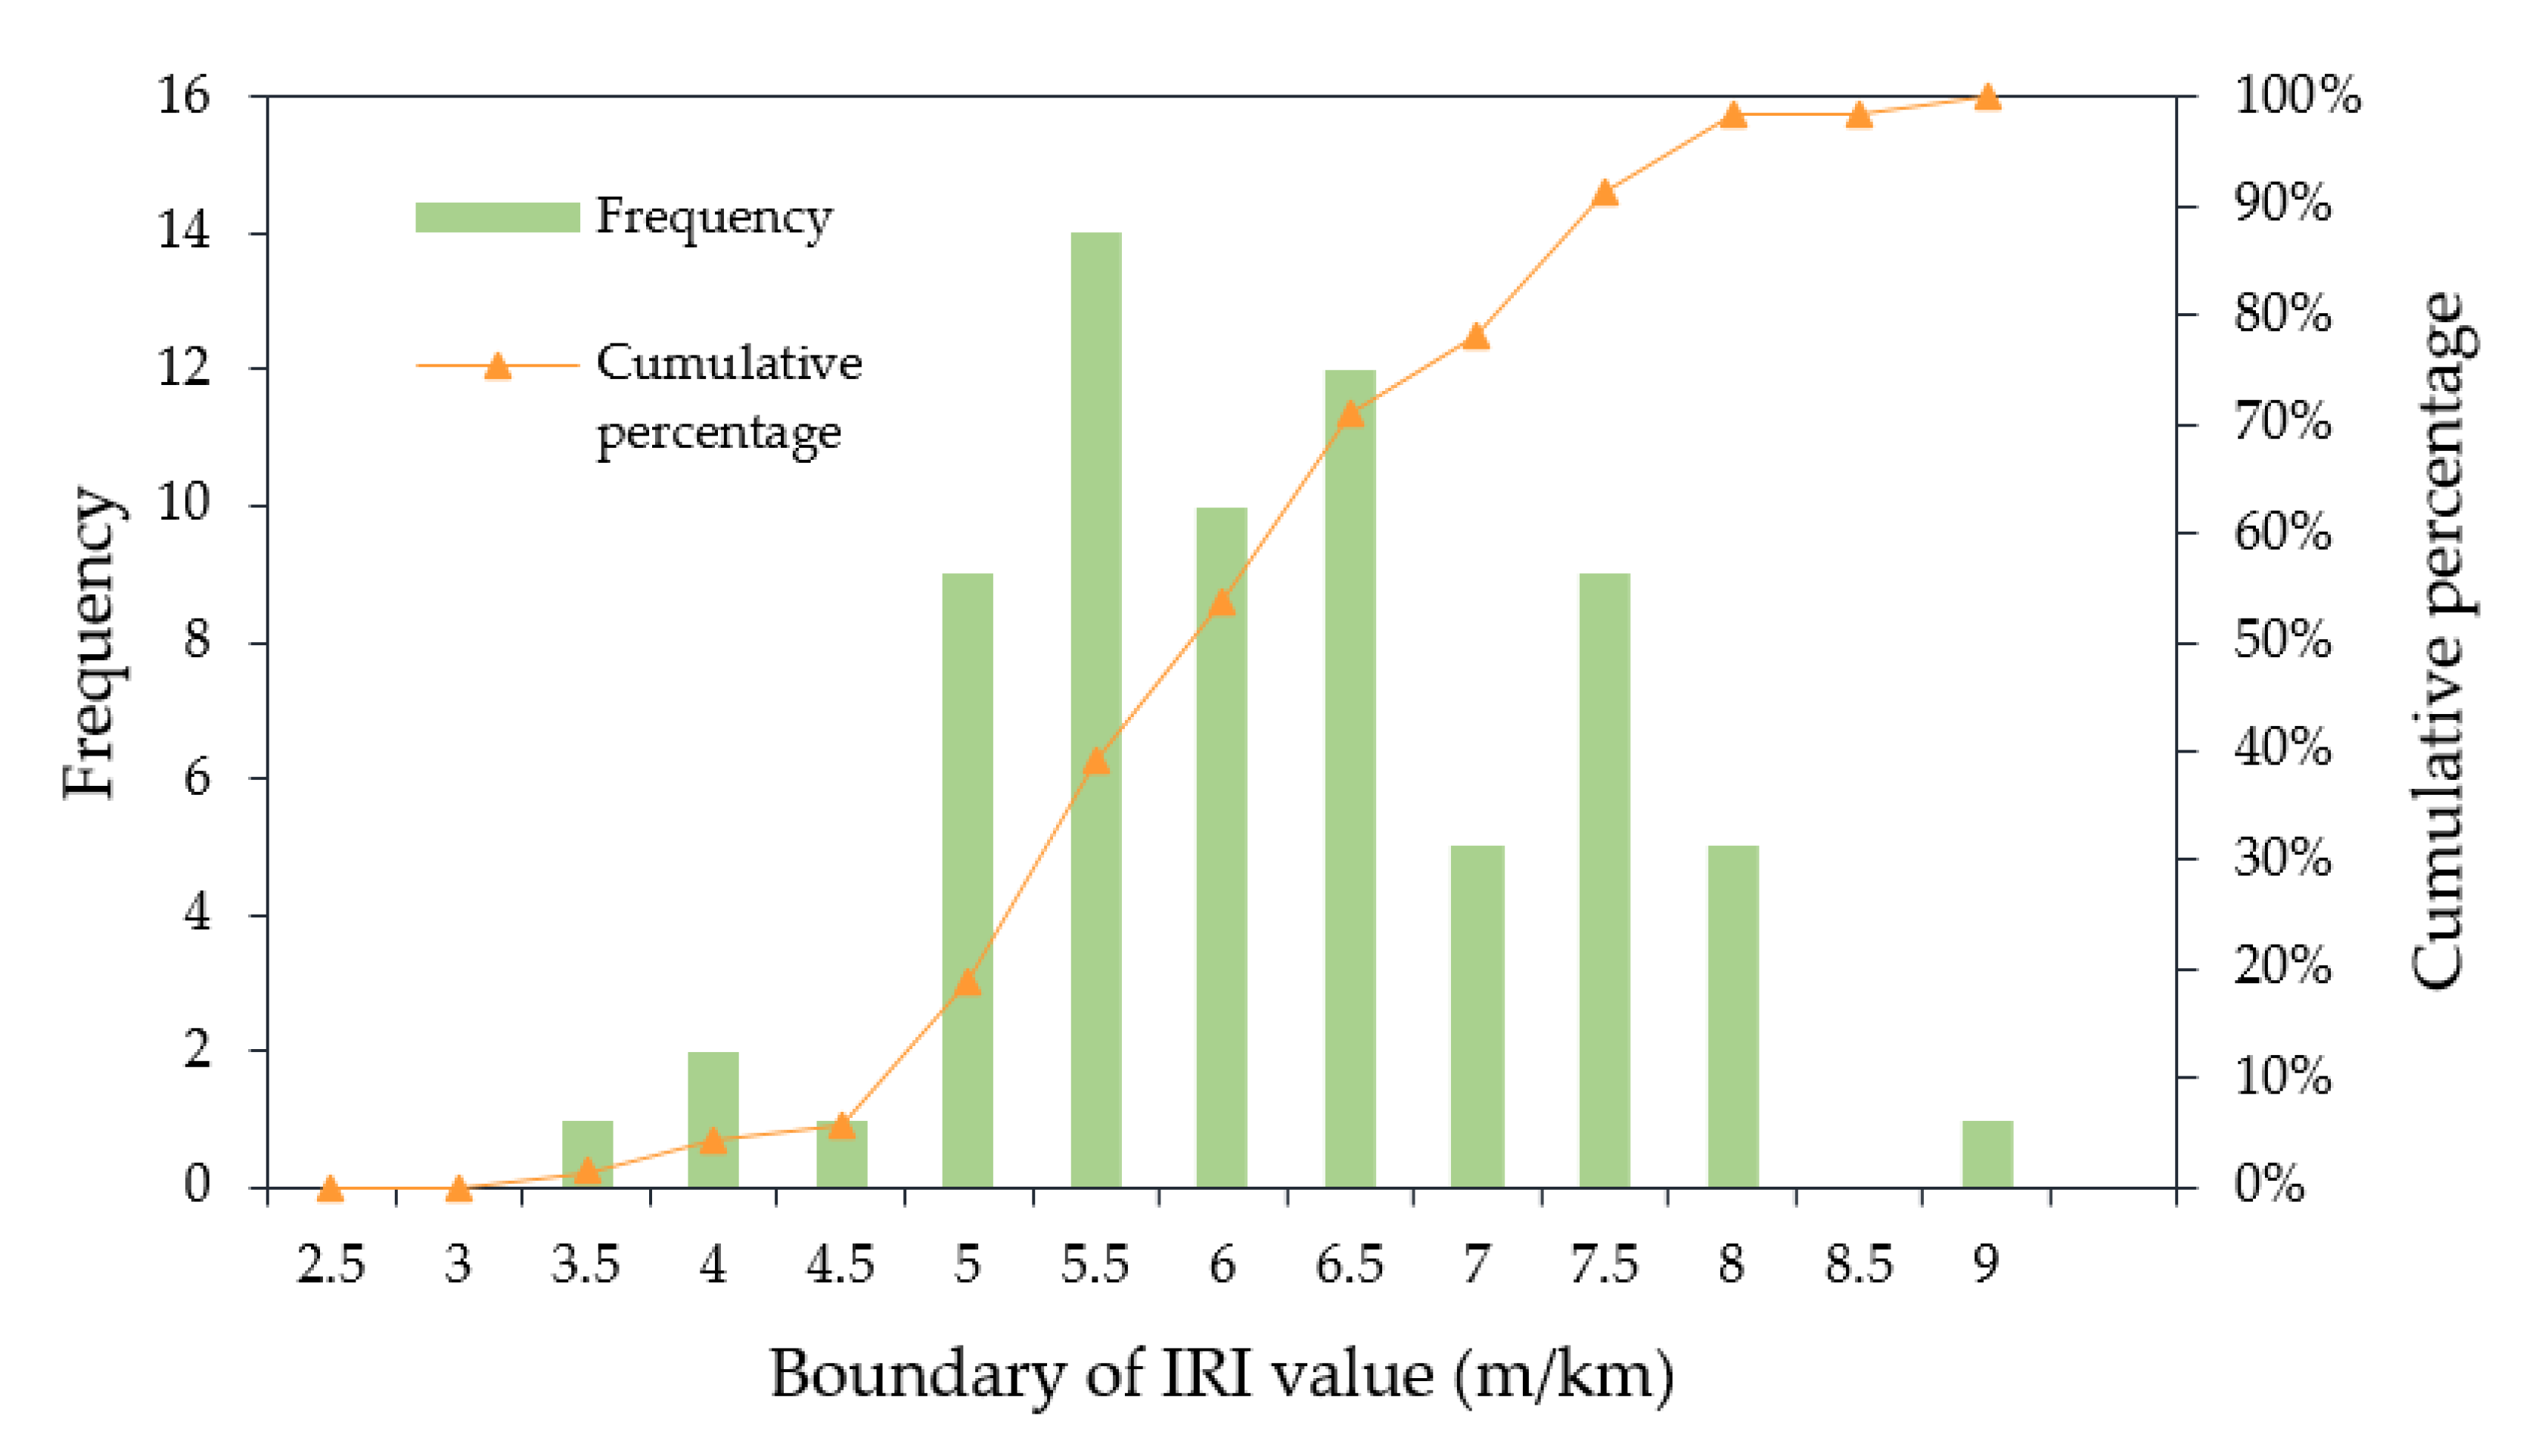
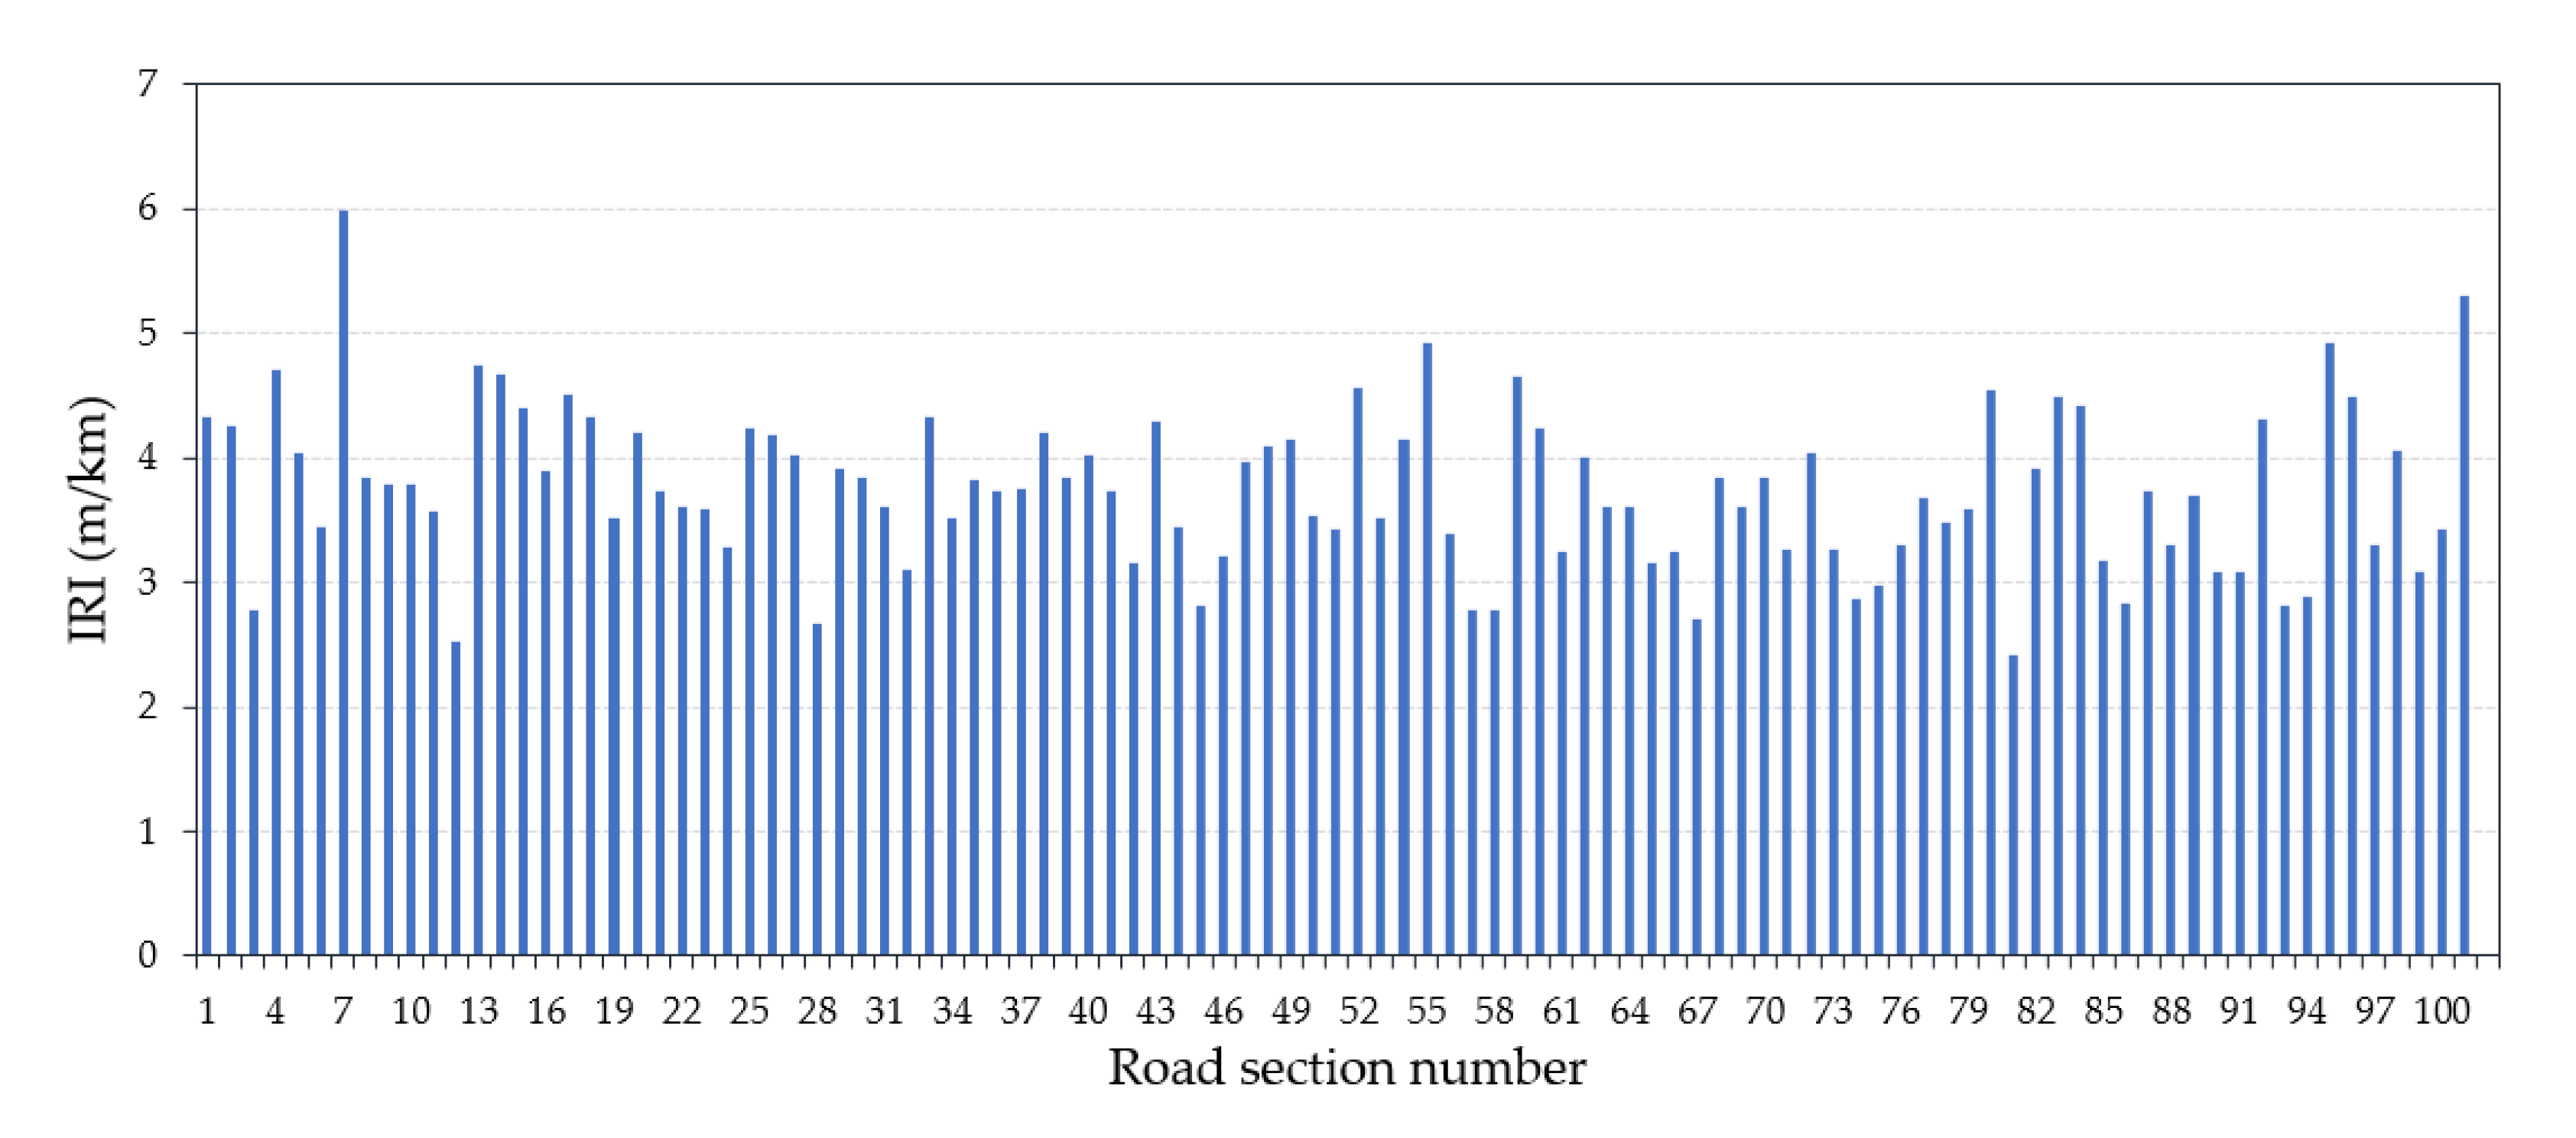
Figure 4 shows the IRI values of the 70 road sections in the first phase of the Road Smoothing Project. It can be seen from Figure 4 that the IRI data before road leveling covers a wide range of road smoothness. Statistical analysis shows that the average IRI value before leveling was 5.91 m/km, and the average IRI value after leveling was 3.84 m/km. In addition, the histograms of the calculated IRI distribution before and after road leveling are shown in Figure 5 and Figure 6, respectively. Figure 5 shows that the IRI value before road leveling was mainly distributed between 5 and 8 m/km, while Figure 6 shows that the IRI value after road leveling was mainly distributed between 3 and 5 m/km. The IRI value of the tested road section shows a downward trend, showing that the implementation of the Road Smoothing Project has a significant effect on improving road smoothness. On the other hand, the statistical data of the test results of the 101 road sections in the second phase of the Road Smoothing Project (as shown in Figure 7) shows that the IRI value after road leveling was mainly distributed between 2 to 4.5 m/km, with an average of 3.74 m/km. Overall, the IRI value of the second phase of road leveling was smaller than that of the first phase, indicating that the quality of the road was better.

4.2. Statistical Analysis of the IRI Value

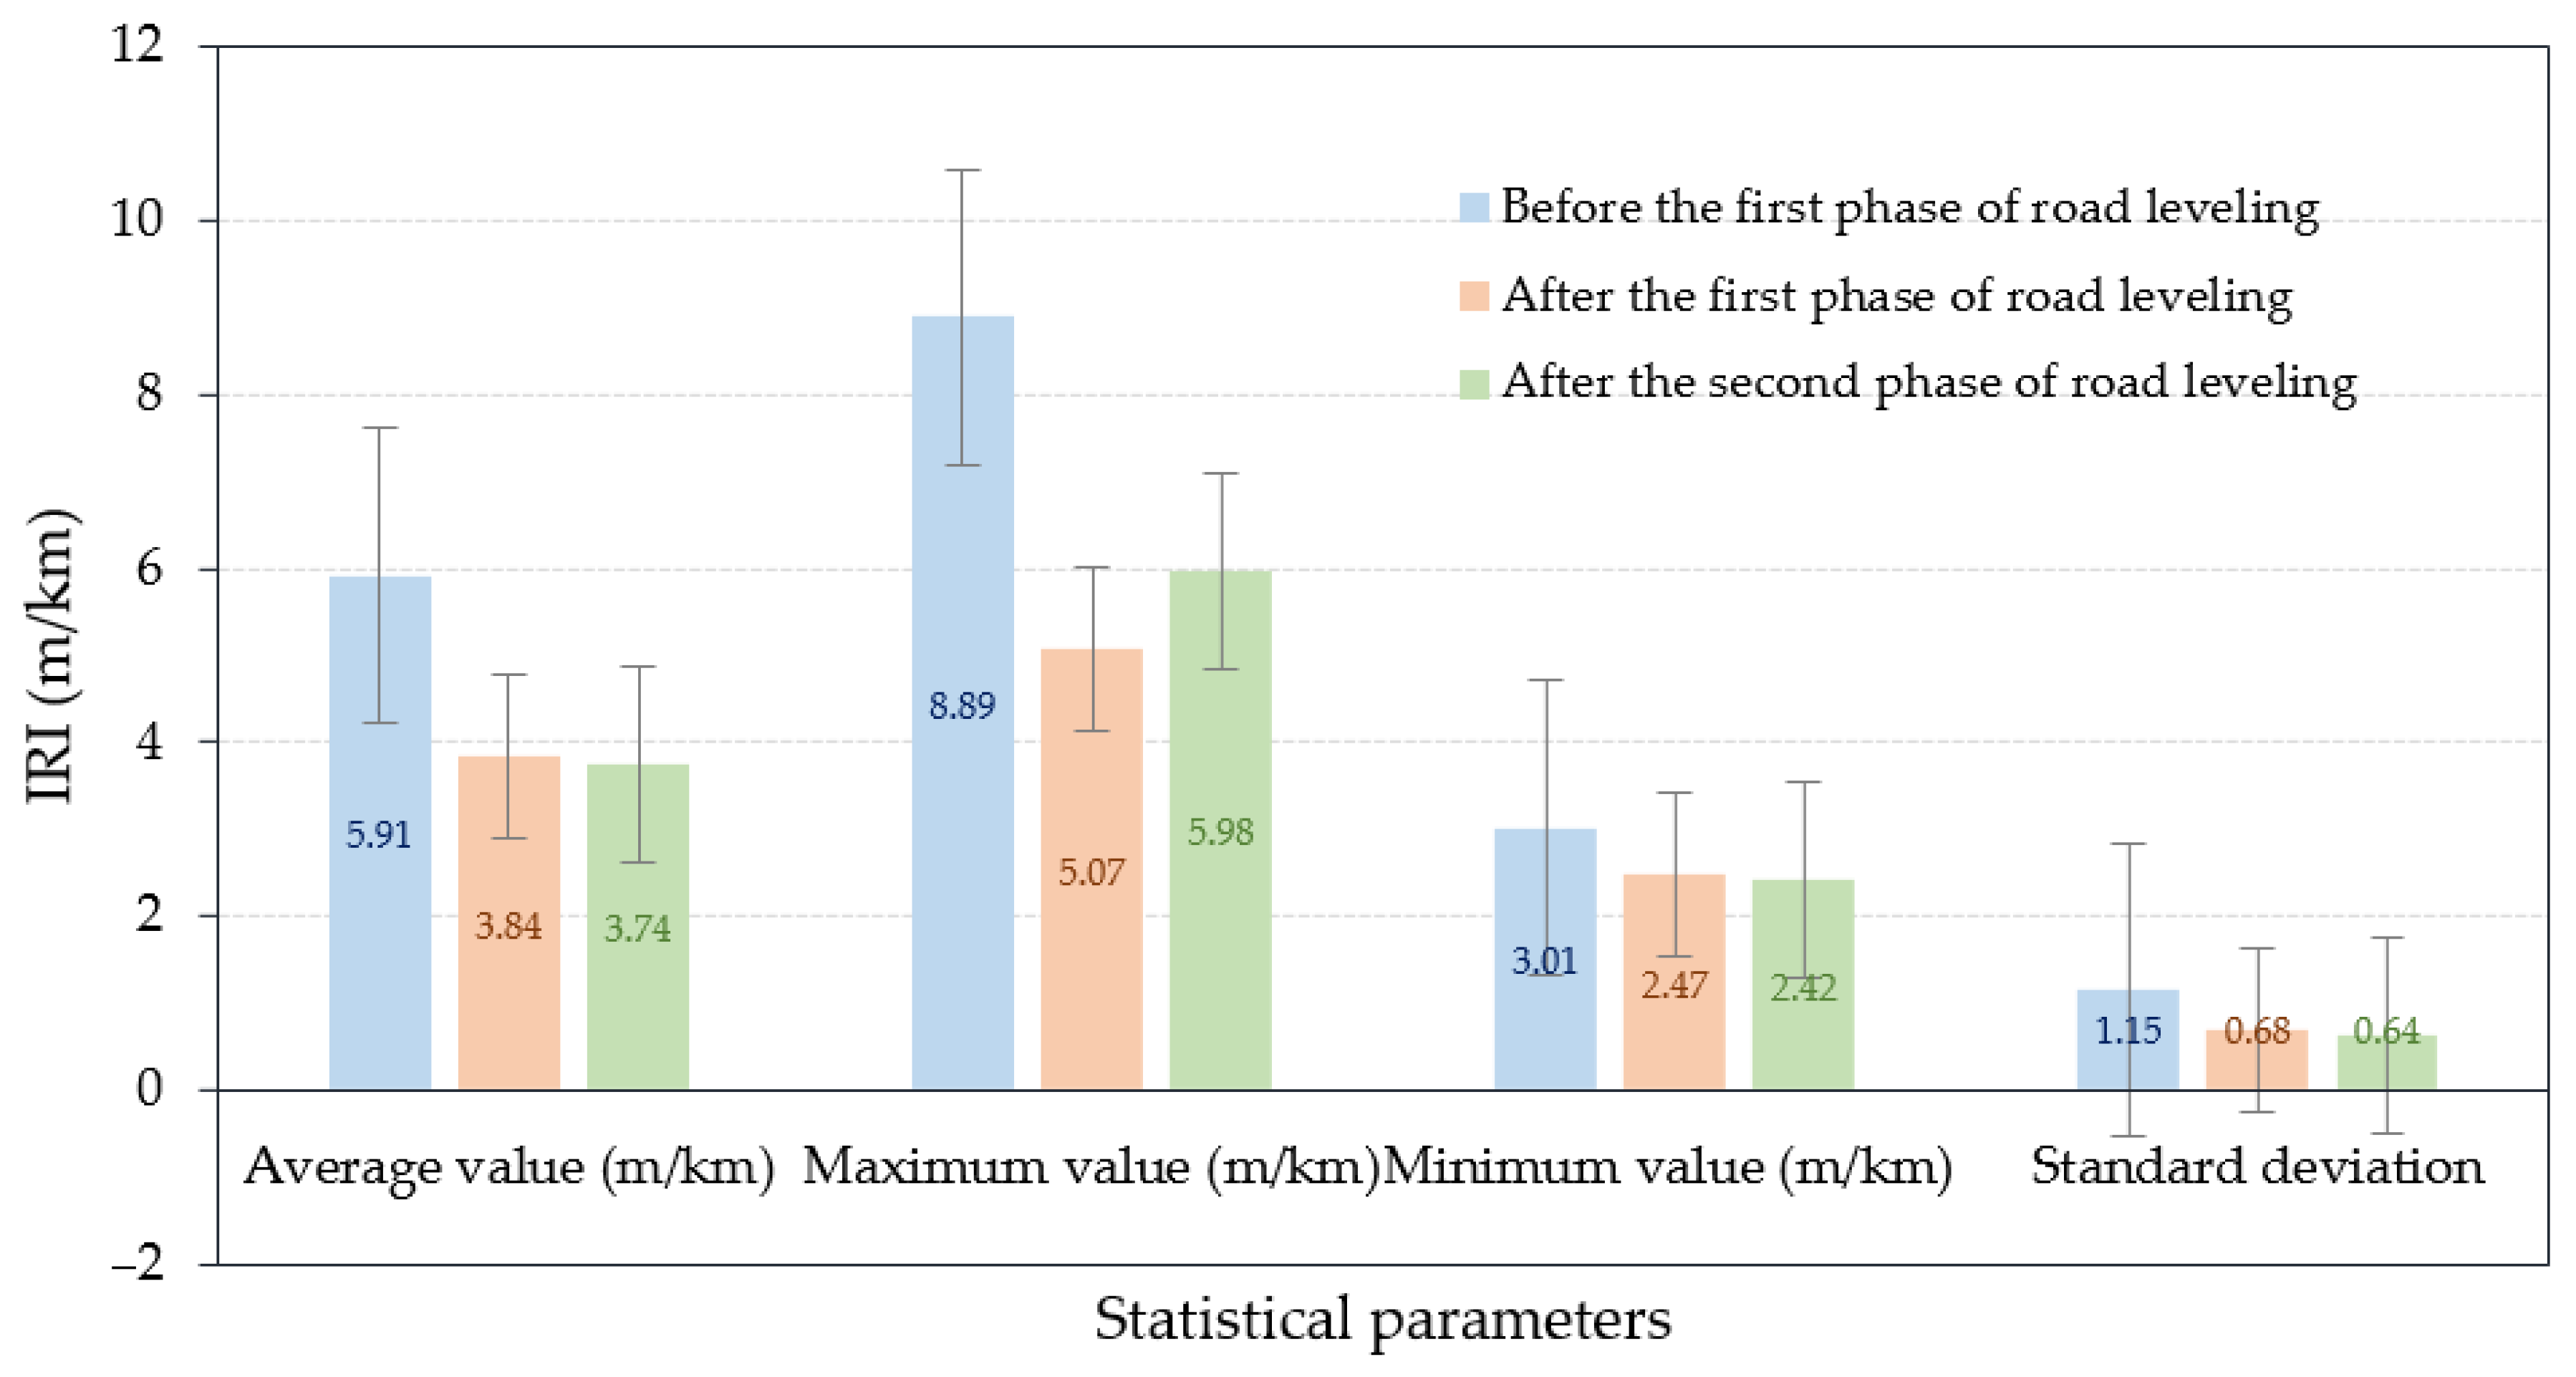
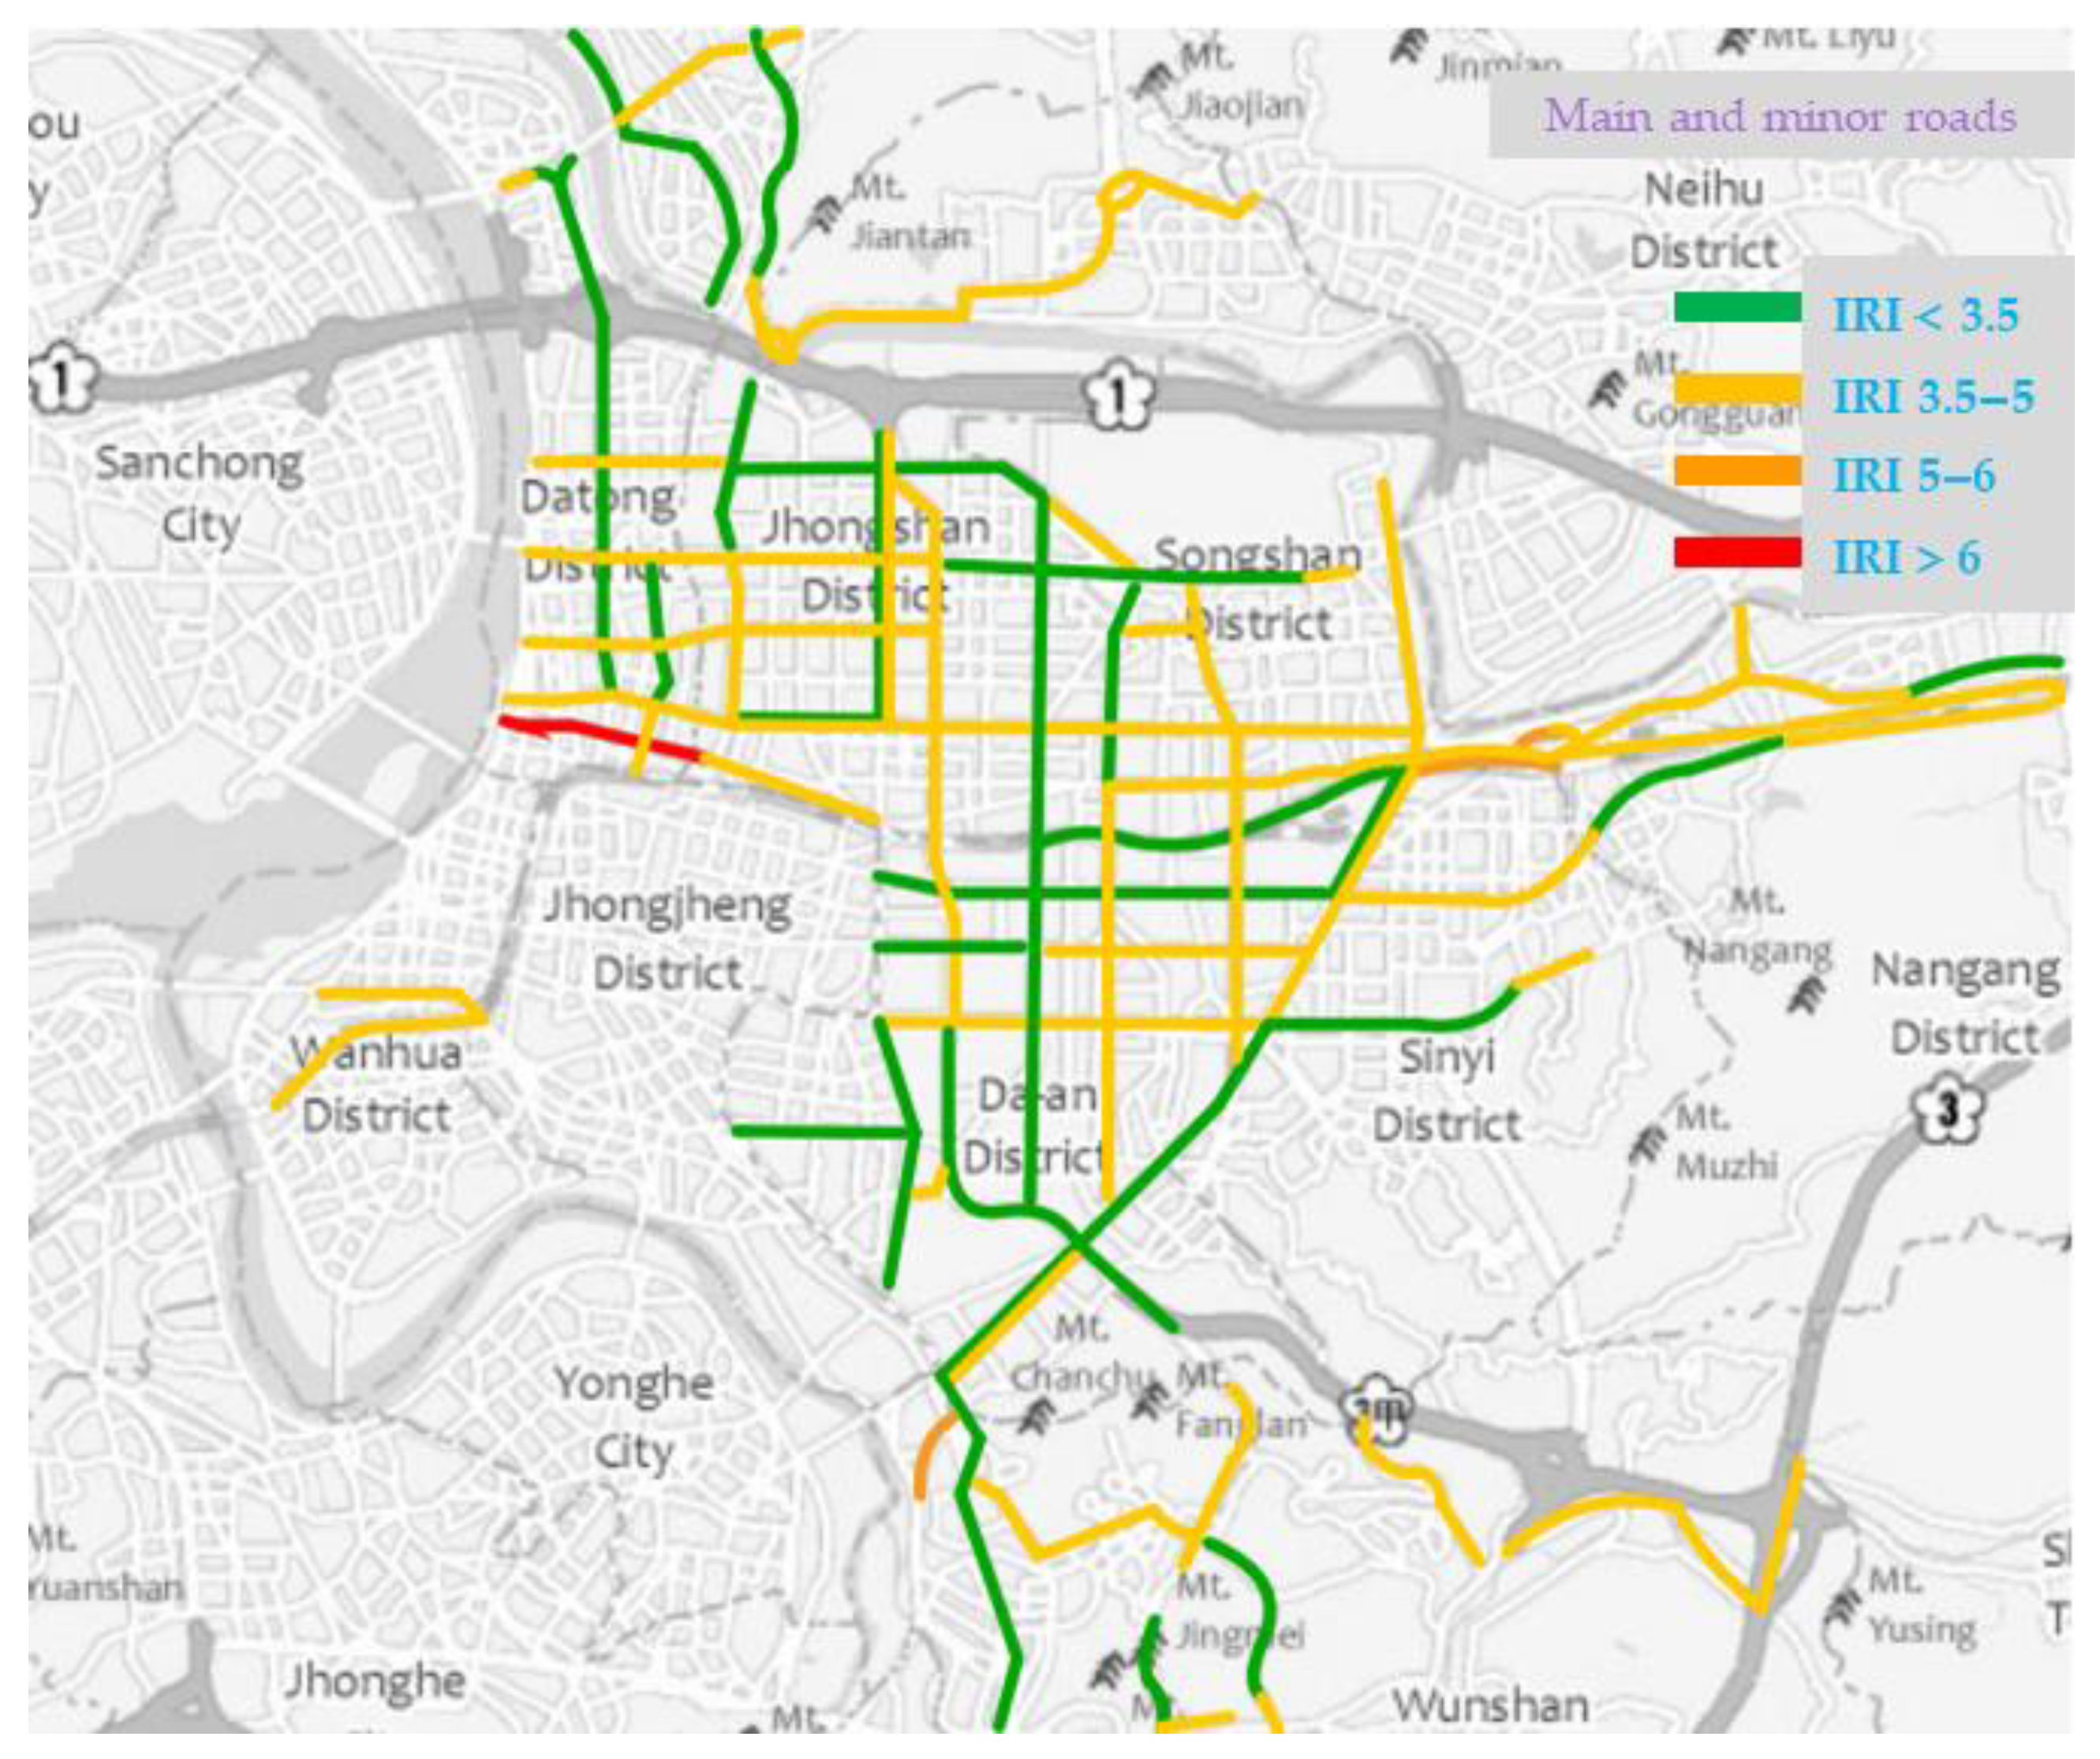
The average IRI value of each detected road section is a single data point. Statistical parameters such as average value, maximum value, minimum value, range, variance, and standard deviation for the data IRI values were calculated and are summarized in Table 3. The “range” in the statistical parameters is the difference between the maximum value and the minimum value of the road IRI value, and the calculated value is used to determine whether the road smoothness is good or bad. It can be seen from Figure 8 that the average value and standard deviation of the IRI of the detected road section after road leveling were significantly improved. In other words, after the road was leveled, the smoothness was improved. Therefore, as far as the inspected road sections were concerned, the quality control after road leveling was excellent. The current IRI distribution map of the main roads and minor roads in Taipei City according to the detection data of this research is shown in Figure 9. It had a considerable contribution to the judgement of construction quality.

4.3. Inspection on the Appropriateness of the IRI Threshold Value for Road Rehabilitation in Taipei City

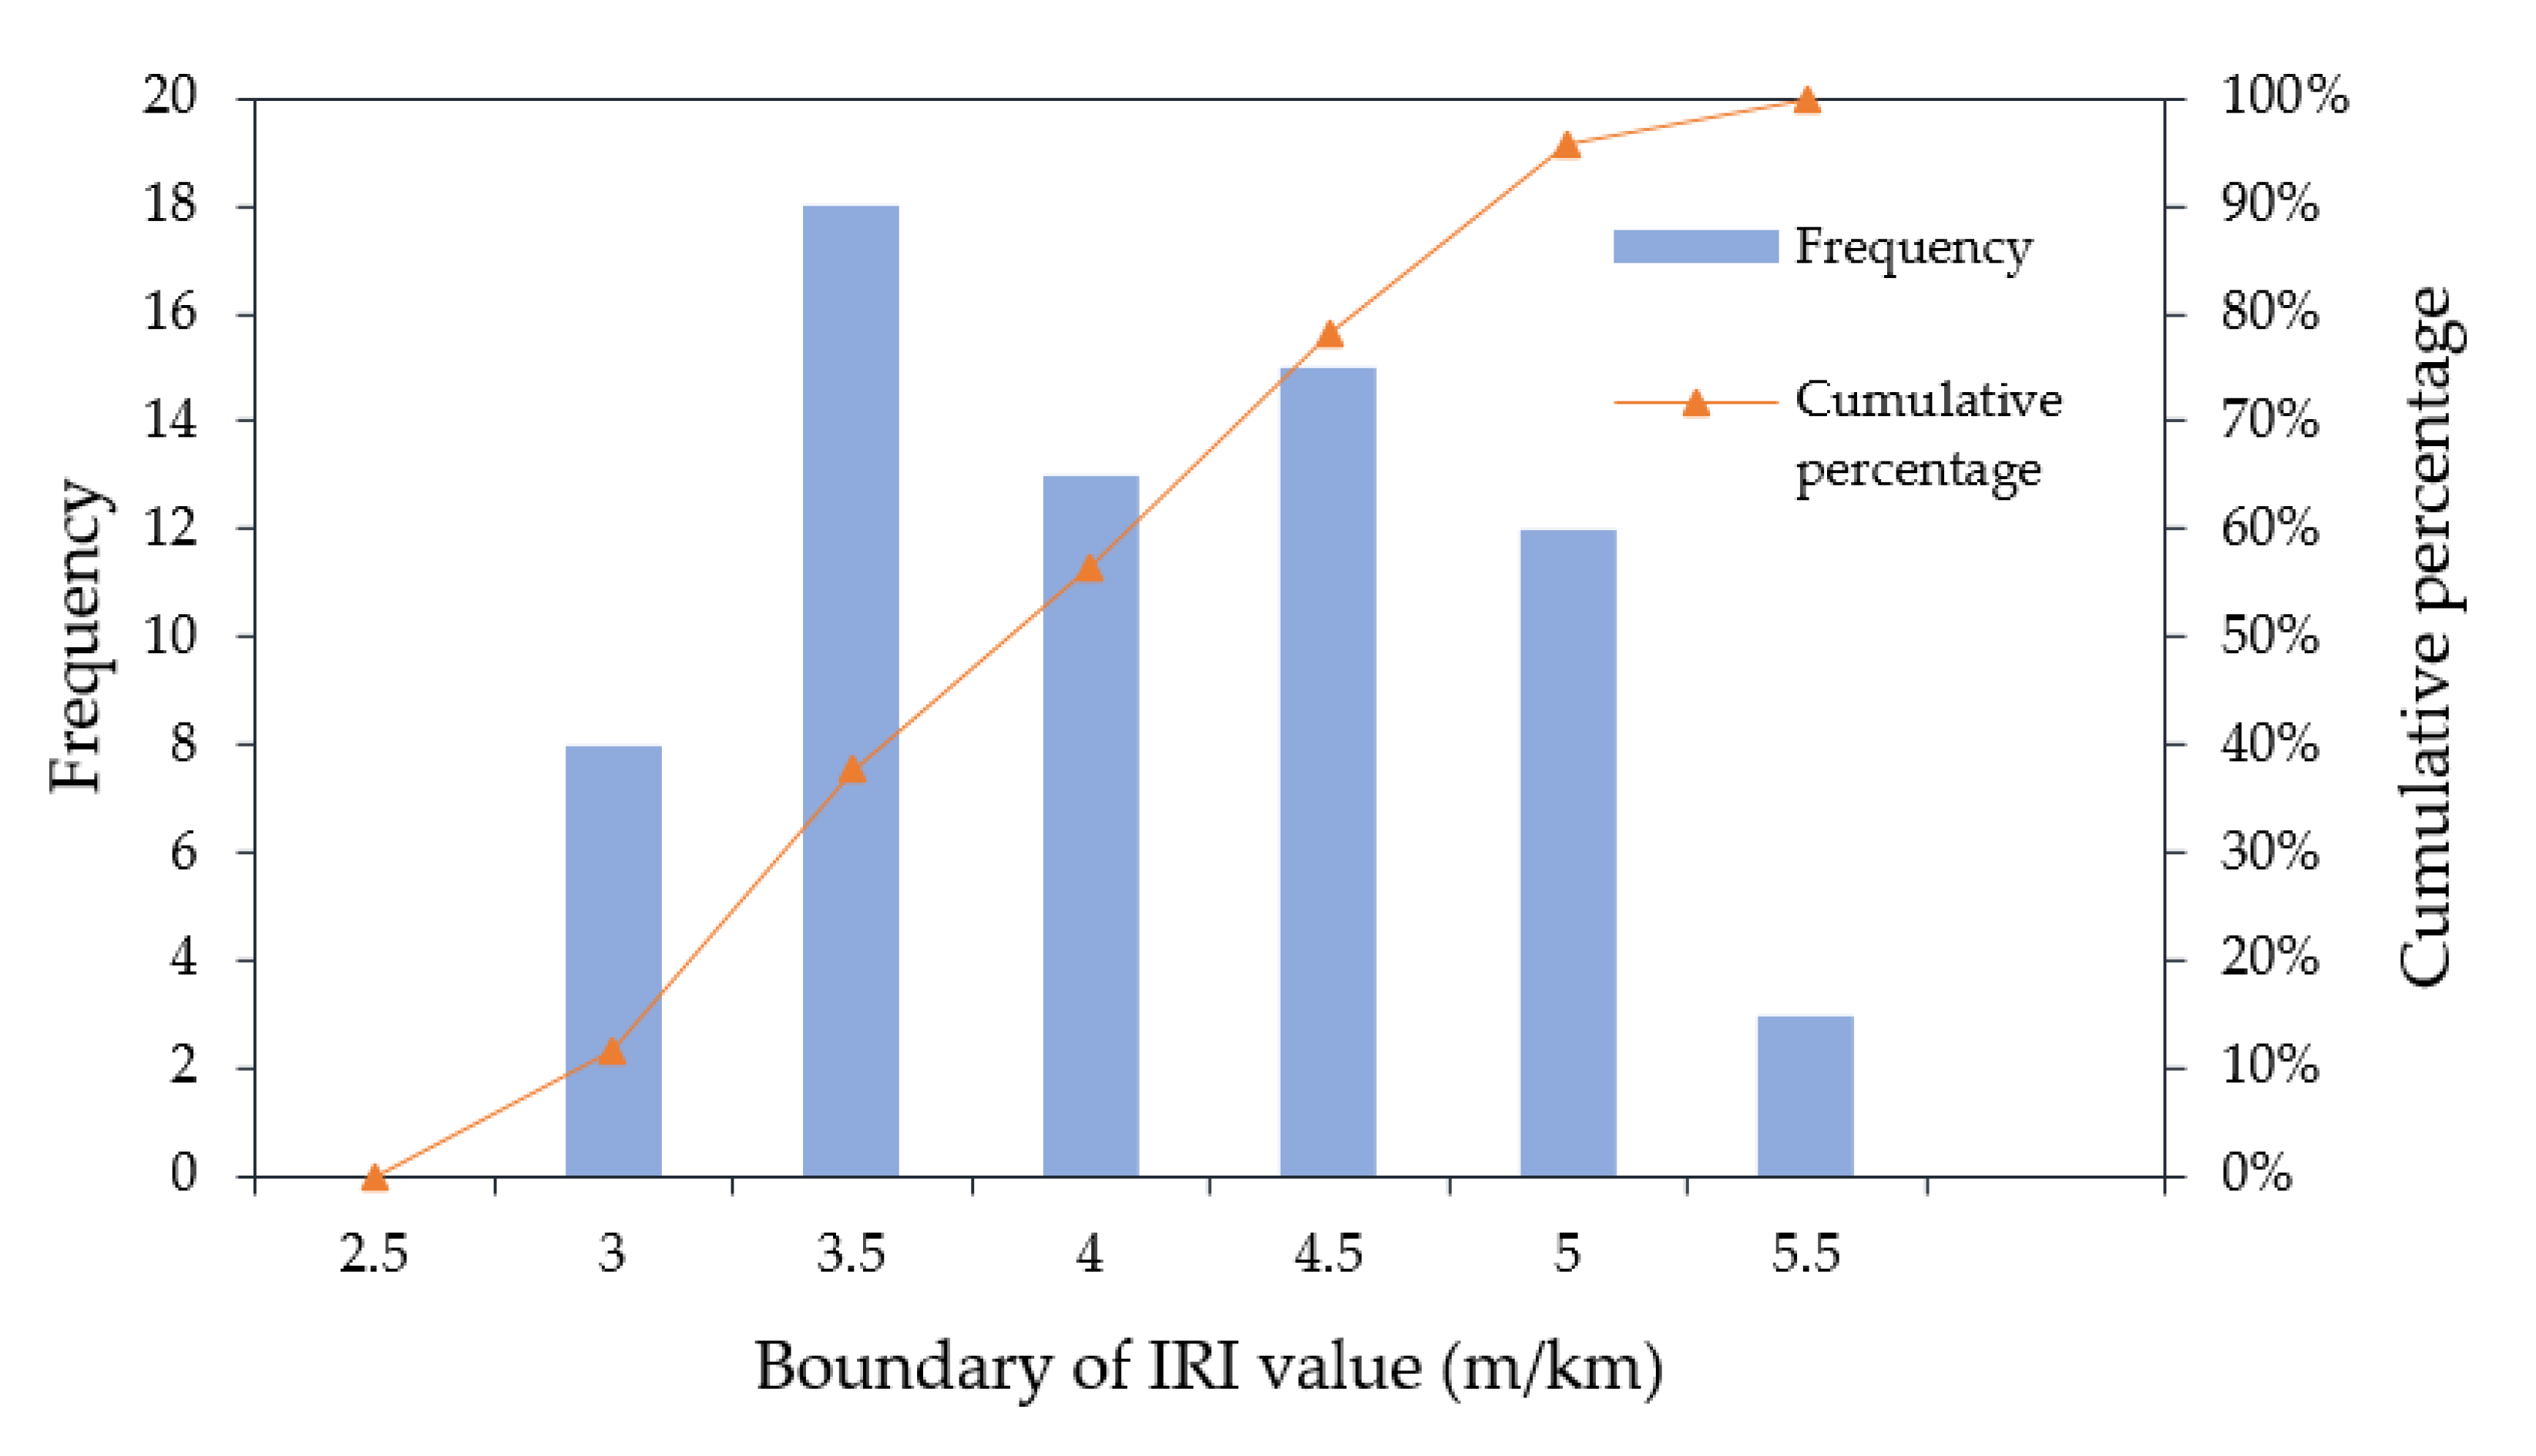
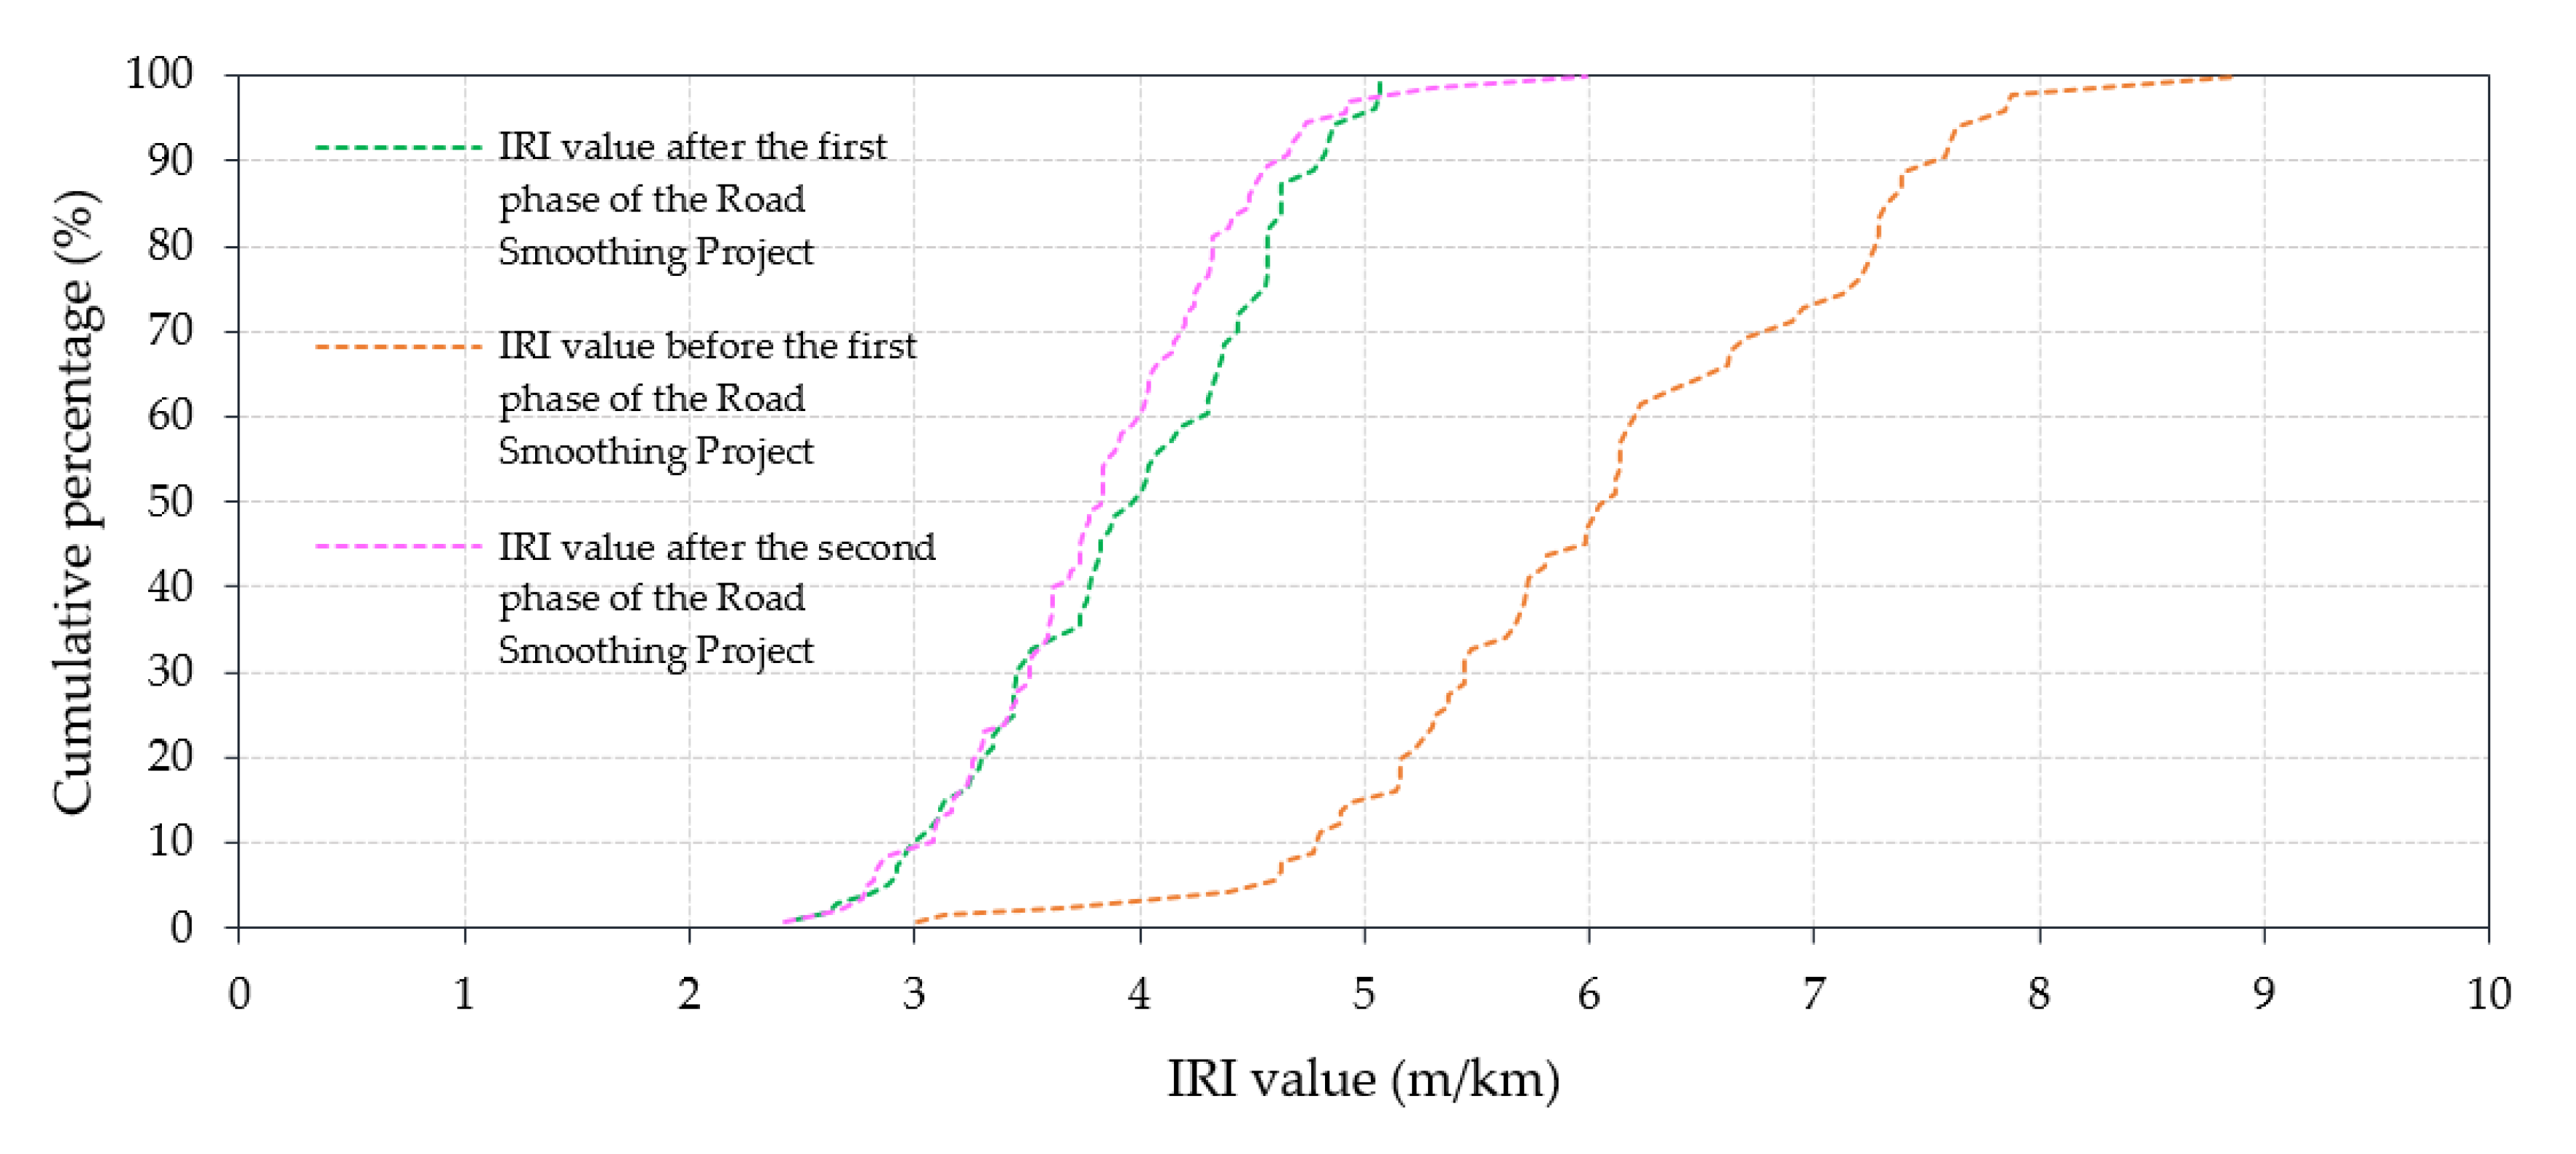
Based on the detected results of each road section, the cumulative percentage of IRI values before and after road leveling can be calculated. Figure 10 shows the cumulative percentage curve of IRI values in the detected road. Regarding the three cumulative curves in Figure 10, the cumulative curve after road leveling shifted significantly to the left, indicating that the IRI value of the detected road sections showed a downward trend, mainly distributed from 2.86 to 4.49 m/km. Taking the road section with IRI 5 m/km as an example, the cumulative percentage before road leveling was 14.77%, and after road leveling, it increased to 94.35%.
Many countries have established IRI thresholds for road maintenance and rehabilitation scheduling. Taiwan’s current pavement smoothness inspection standards are IRI < 3.5 m/km or a standard deviation of three-meter-long straightedge < 2.4 mm for general roads and IRI < 1.75 m/km or a standard deviation of three-meter-long straightedge < 2.6 mm for highways [40]. These two indicators have a high degree of correlation when the pavement smoothness is increased [40], which shows that the two can be interconverted in a linear manner. However, when the pavement smoothness is poor, such as an IRI greater than 2.0 m/km, the relationship between the two is not stable and the standard deviation of three-meter-long straightedge is relatively loose. Moreover, the draft specification completed in 2005 by the Construction and Planning Agency, Ministry of the Interior, R.O.C., Taiwan, suggested that the smoothness of urban roads should be tested with the IRI as the testing standard. The acceptance evaluation standards of urban roads are detailed in Table 4 and Table 5 [41]. Table 4 is mainly used as the acceptance evaluation standard when the original IRI value of urban roads is greater than 6.5 m/km. Table 5 is the acceptance evaluation standard for the construction of new urban roads or when the original IRI value is not greater than 6.5 m/km. Table 4 and Table 5 divide the road into four grades, namely expressway, main and minor road, general minor road, and laneway. Taking the main and minor road in Table 4 as an example, if the original IRI is between 6.5–7.5 m/km, and the IRI after road leveling is less than 4.5 m/km, the evaluation result belongs to the qualified area. On the other hand, the current road smoothness inspection standards of the Taipei City Government are IRI < 2.8 m/km for new construction urban roads, IRI < 5.5 m/km for main road maintenance, and IRI < 6.5 m/km for minor road maintenance. As other countries tend to have stricter pavement smoothness standards, this study uses the actual measurement data of urban roads to review the suitability of the above standards.
Among the 70 detected sections in the first phase of the Road Smoothing Project, 53 sections had an original IRI value less than or equal to 6.5 m/km. Calculated according to the acceptance evaluation criteria in Table 5, the evaluation results are shown in Table 6. Among them, 26 road sections were qualified areas, 5 road sections were correction areas, and 22 road sections were redo areas. Among the 70 sections in the first phase of the Road Smoothing Project, 17 sections had original IRI values greater than 6.5 m/km. According to the acceptance evaluation criteria in Table 4, the evaluation results were calculated, as shown in Table 7. Among them, 13 road sections were qualified areas, but 4 road sections were correction areas. From the above results, it can be seen that the qualified percentage of road sections with original IRI values greater than 6.5 m/km after road leveling was 72.5%, while the qualified percentage of road sections with original IRI values less than or equal to 6.5 m/km after road leveling was only 49.1%. This means that the current regulations of urban roads by the Construction and Planning Agency have stricter requirements for road sections with original IRI values less than or equal to 6.5 m/km after road leveling. In contrast, according to the current road smoothness inspection standards of the Taipei City government, the IRI values of all detected sections after road leveling meet the requirements.
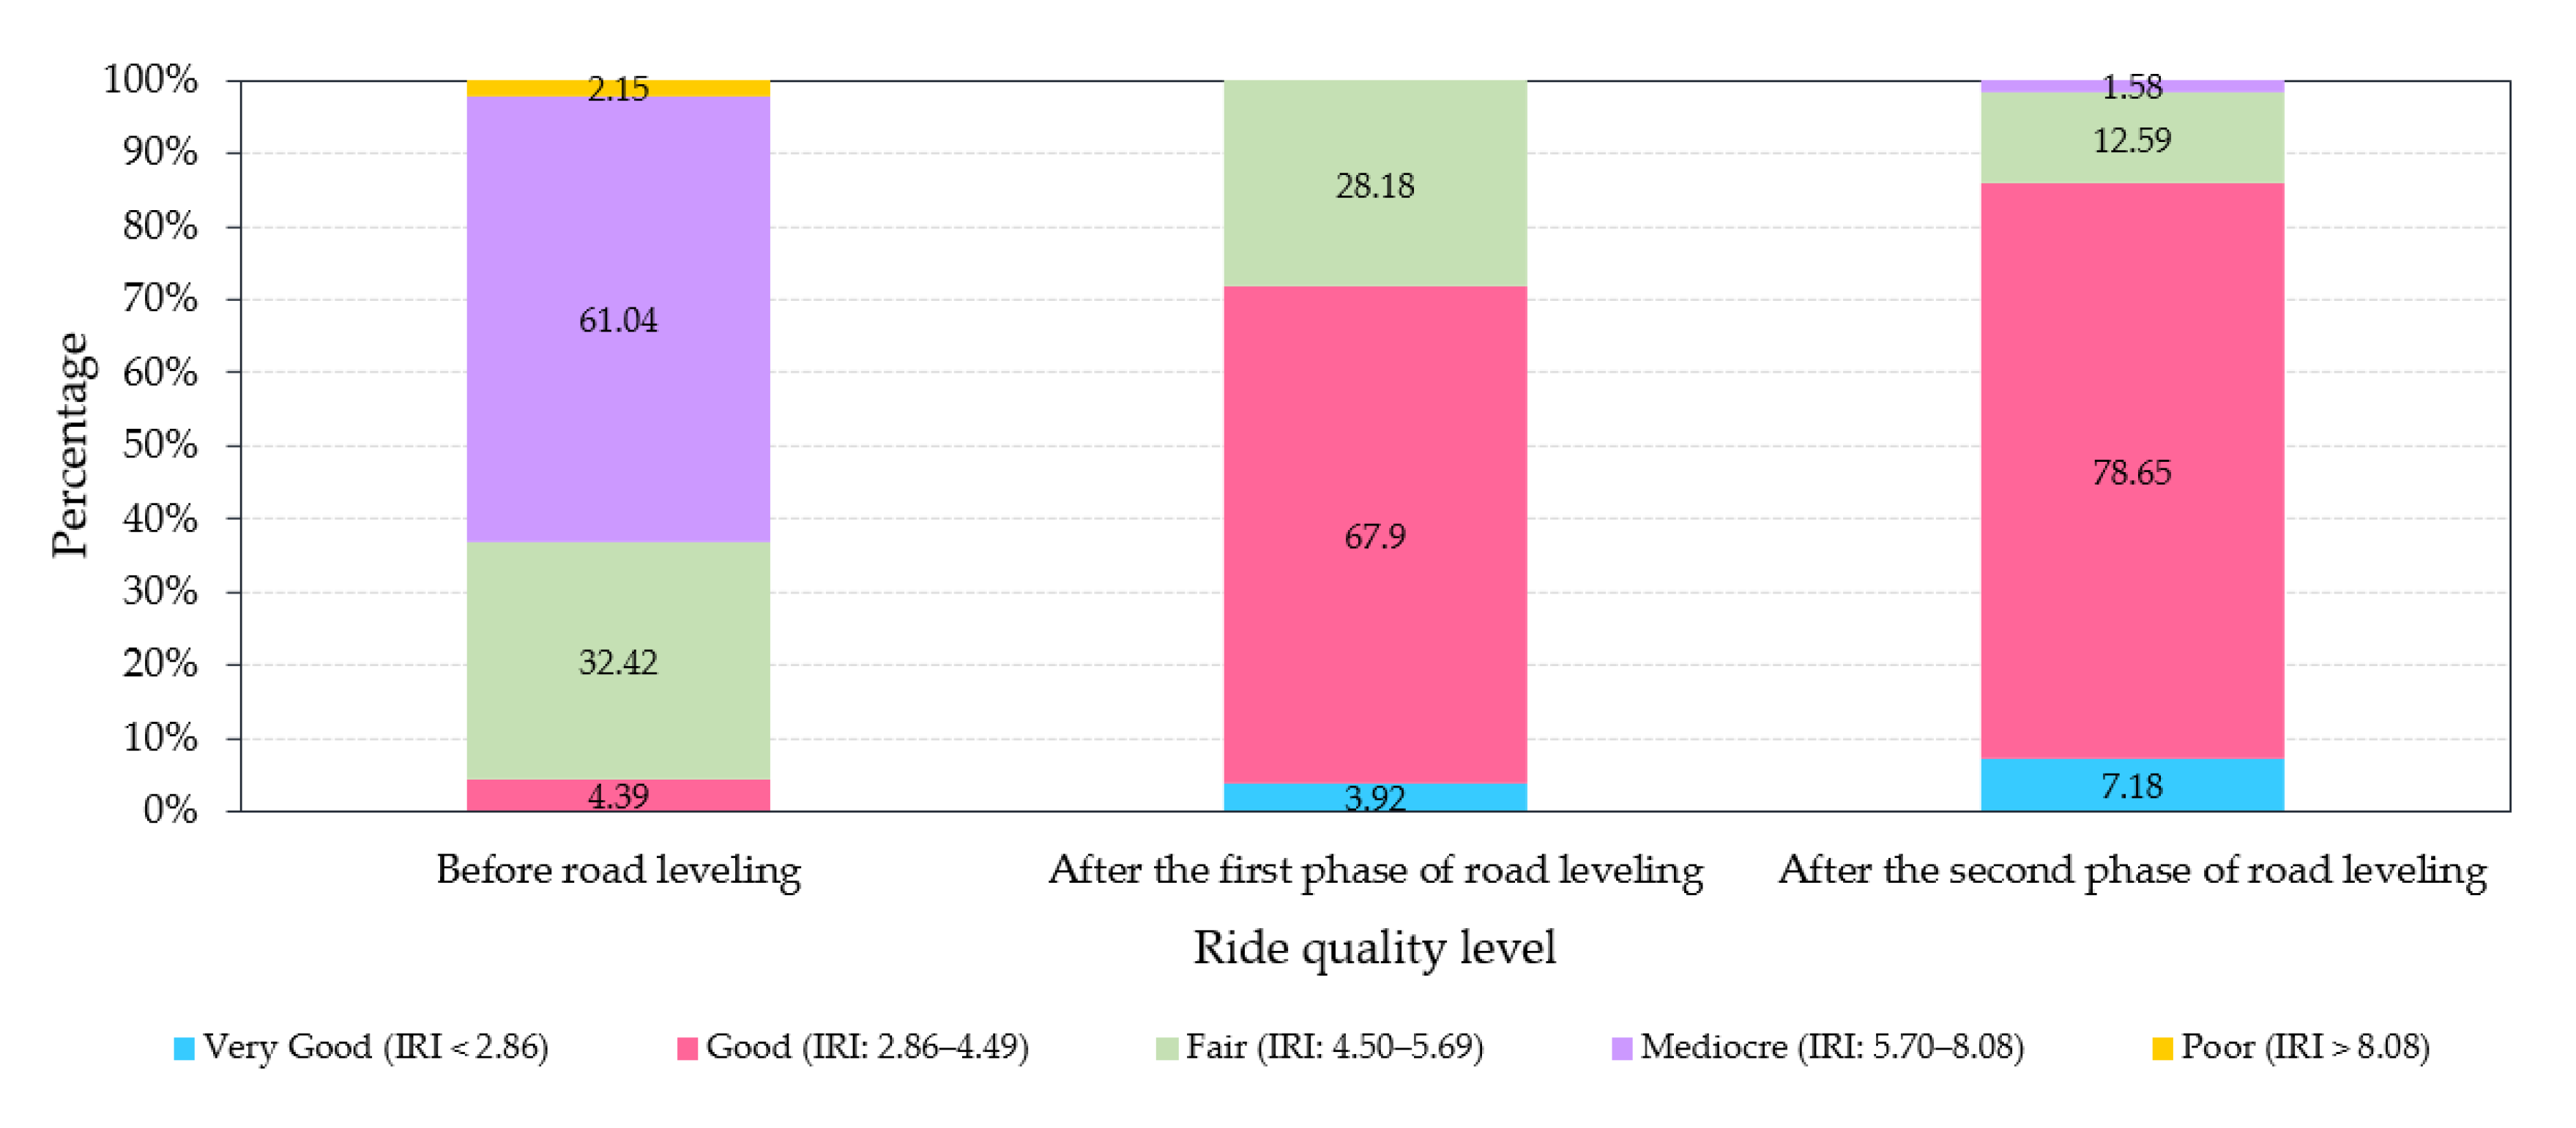
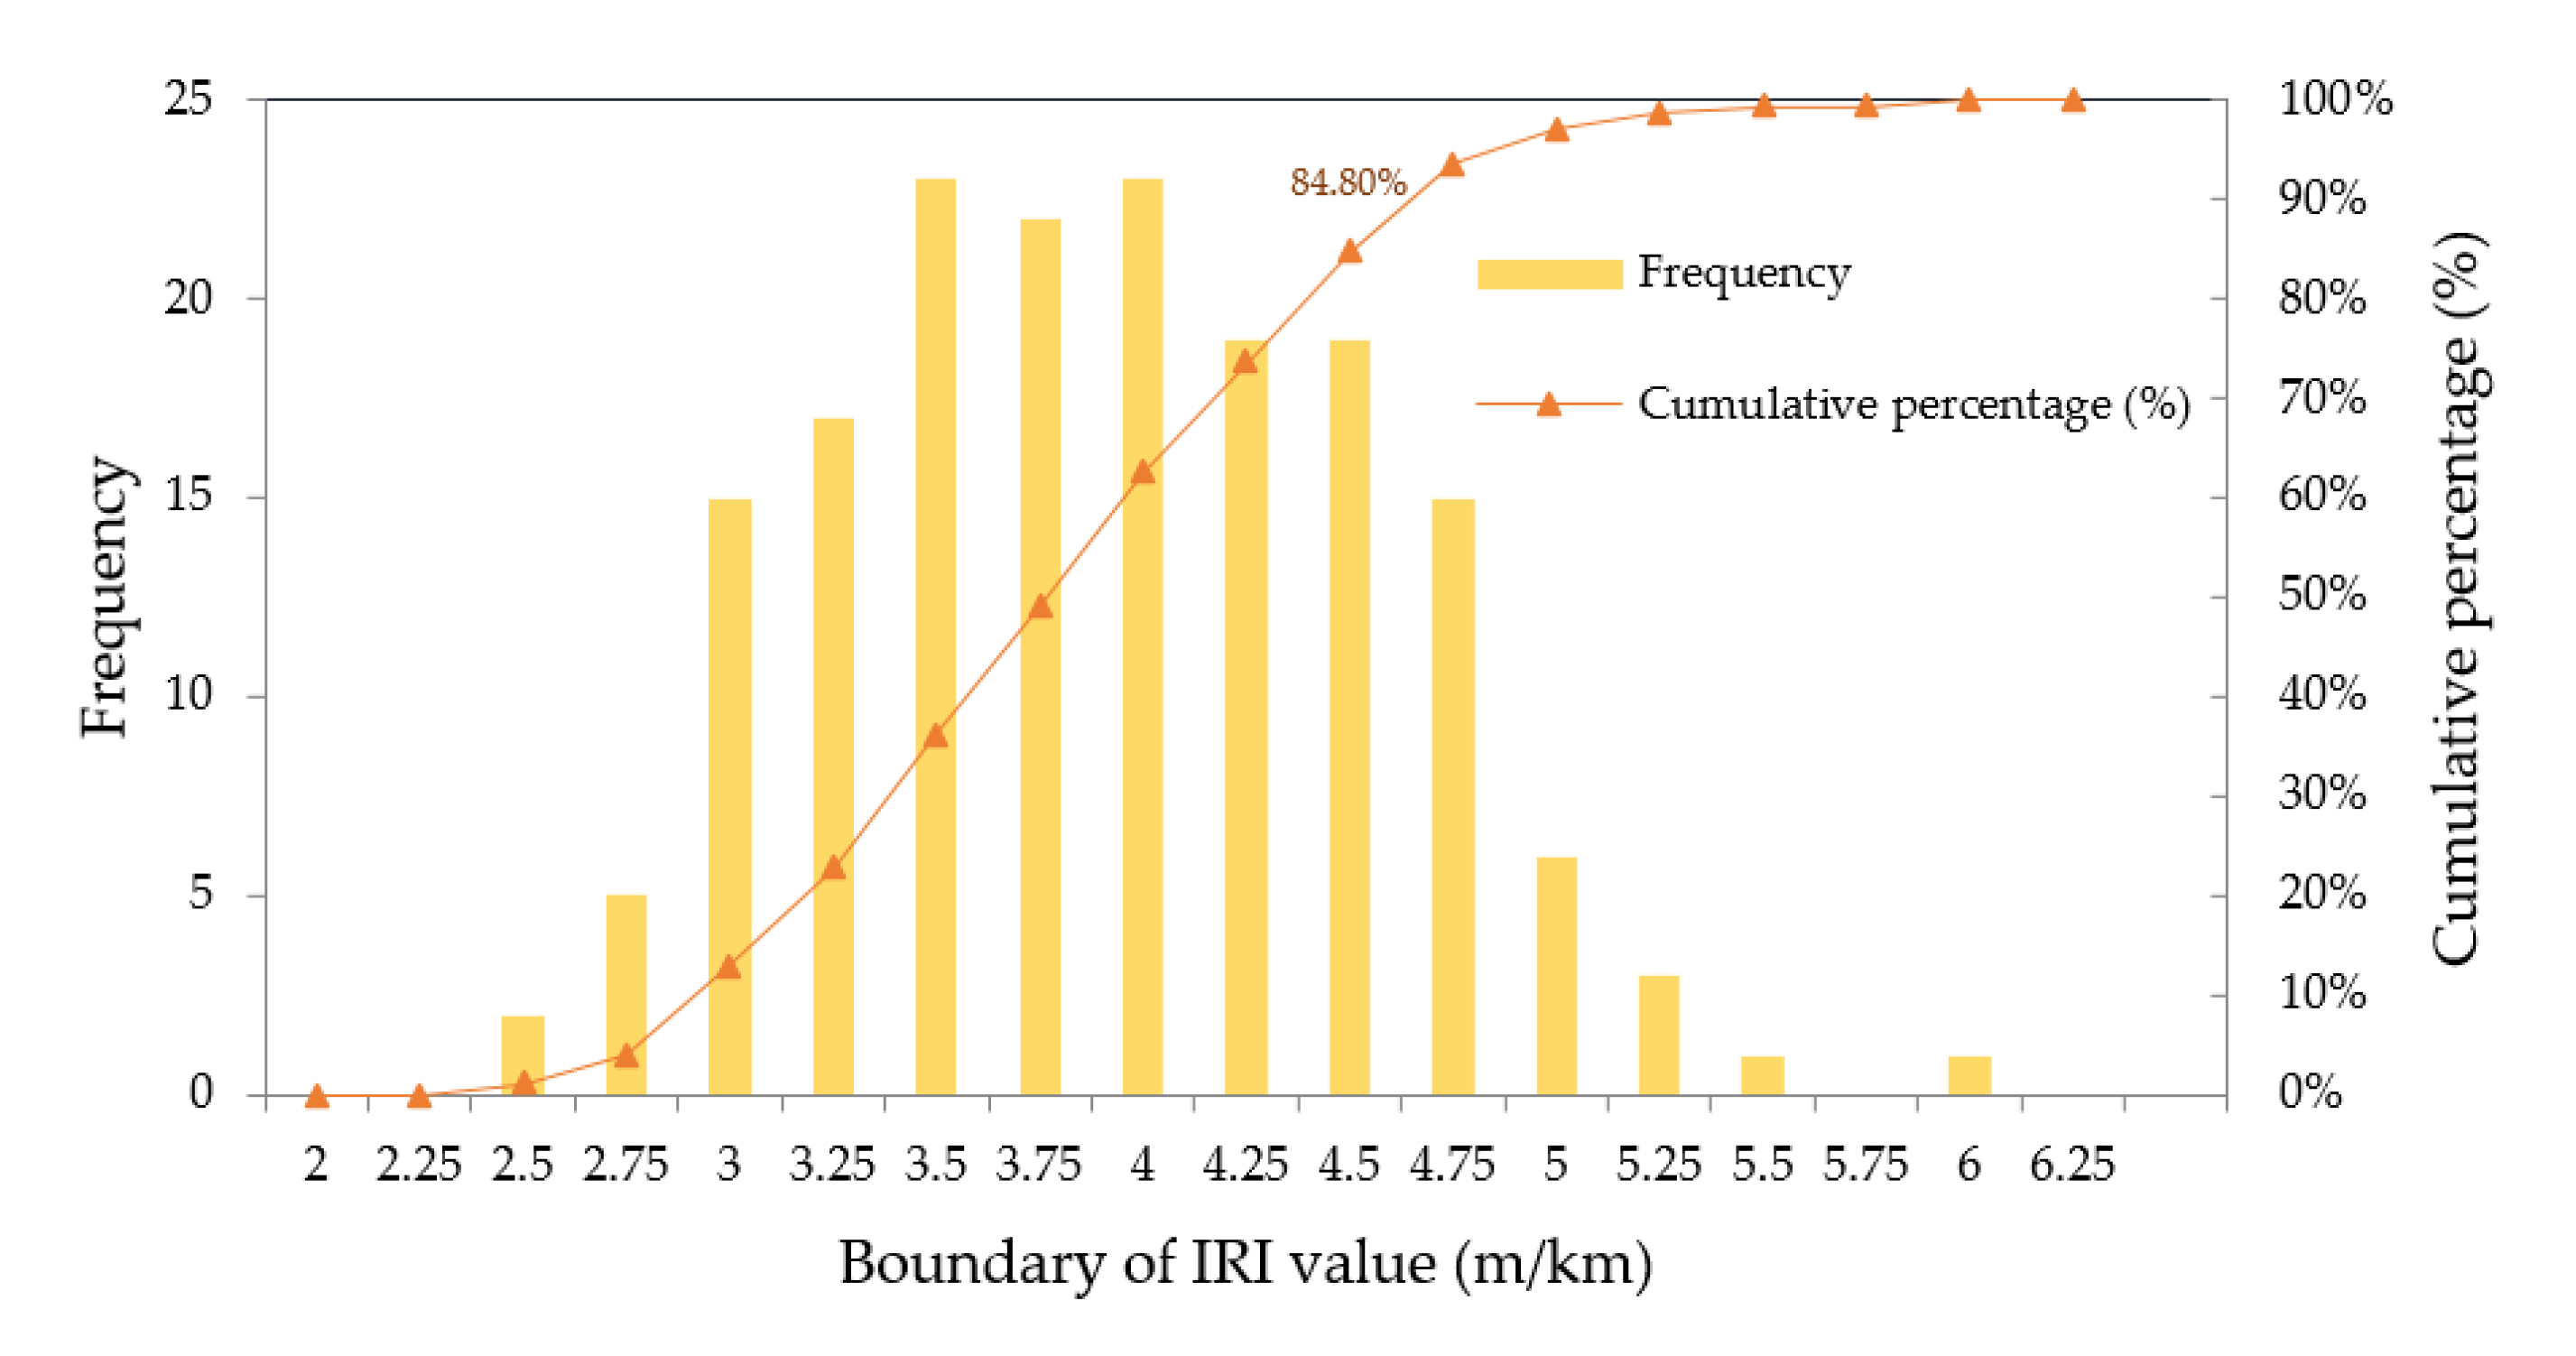
As mentioned earlier, the IRI thresholds used around the world are quite different. The maximum allowable driving speed on the road is the key factor. The speed of the test vehicle in this study was between 13.7 and 37.4 km/h. Therefore, if the driving speed is 40 km/h, the speed-related IRI thresholds can be determined from the ride quality level in Table 1 [33]. The results are shown in Figure 11. An IRI less than 2.86 m/km means that the ride quality rating is “very good”; an IRI between 2.86 and 4.49 m/km means that the ride quality rating is “good”; an IRI between 4.50 and 5.69 m/km means that the ride quality rating is “fair”; an IRI between 5.70 and 8.08 m/km means that the ride quality rating is “mediocre”; an IRI greater than 8.08 m/km means that the ride quality rating is “poor”. In addition, it can be seen from the distribution of the IRI range in Figure 11 that more than 60% of the detected road sections had poor smoothness prior to leveling, which may make passers-by feel “quite uncomfortable”, but after leveling, no IRI of any road section fell into this range. The IRI of the road section falling into the “comfortable” range increased significantly from 4.39% before leveling to 85.83%, indicating that the smoothness after leveling improved significantly. The histograms of the calculated IRI distribution of the 171 asphalt concrete pavement sections are shown in Figure 12. It can be clearly seen that 84.80% of repaired roads had an IRI < 4.5 m/km. Based on the above results, it is recommended that the IRI threshold value for road rehabilitation in Taipei City be set at 4.50 m/km. This threshold is higher than Taiwan’s current pavement smoothness inspection standards (i.e., IRI < 3.5 m/km) for general roads, but lower than Taipei City’s road smoothness inspection standards (i.e., IRI < 5.5 m/km for main road maintenance and IRI < 6.5 m/km for minor road maintenance). Considering the traffic factors, such as the manhole and hand hole problems in the metropolitan areas, it should be a reasonable standard. In particular, moderately lowering the IRI threshold for road maintenance in Taipei City can conform to the trend that other countries have set for gradually tightening the IRI threshold for roads.

4.4. Analysis of the Effectiveness of Road Leveling

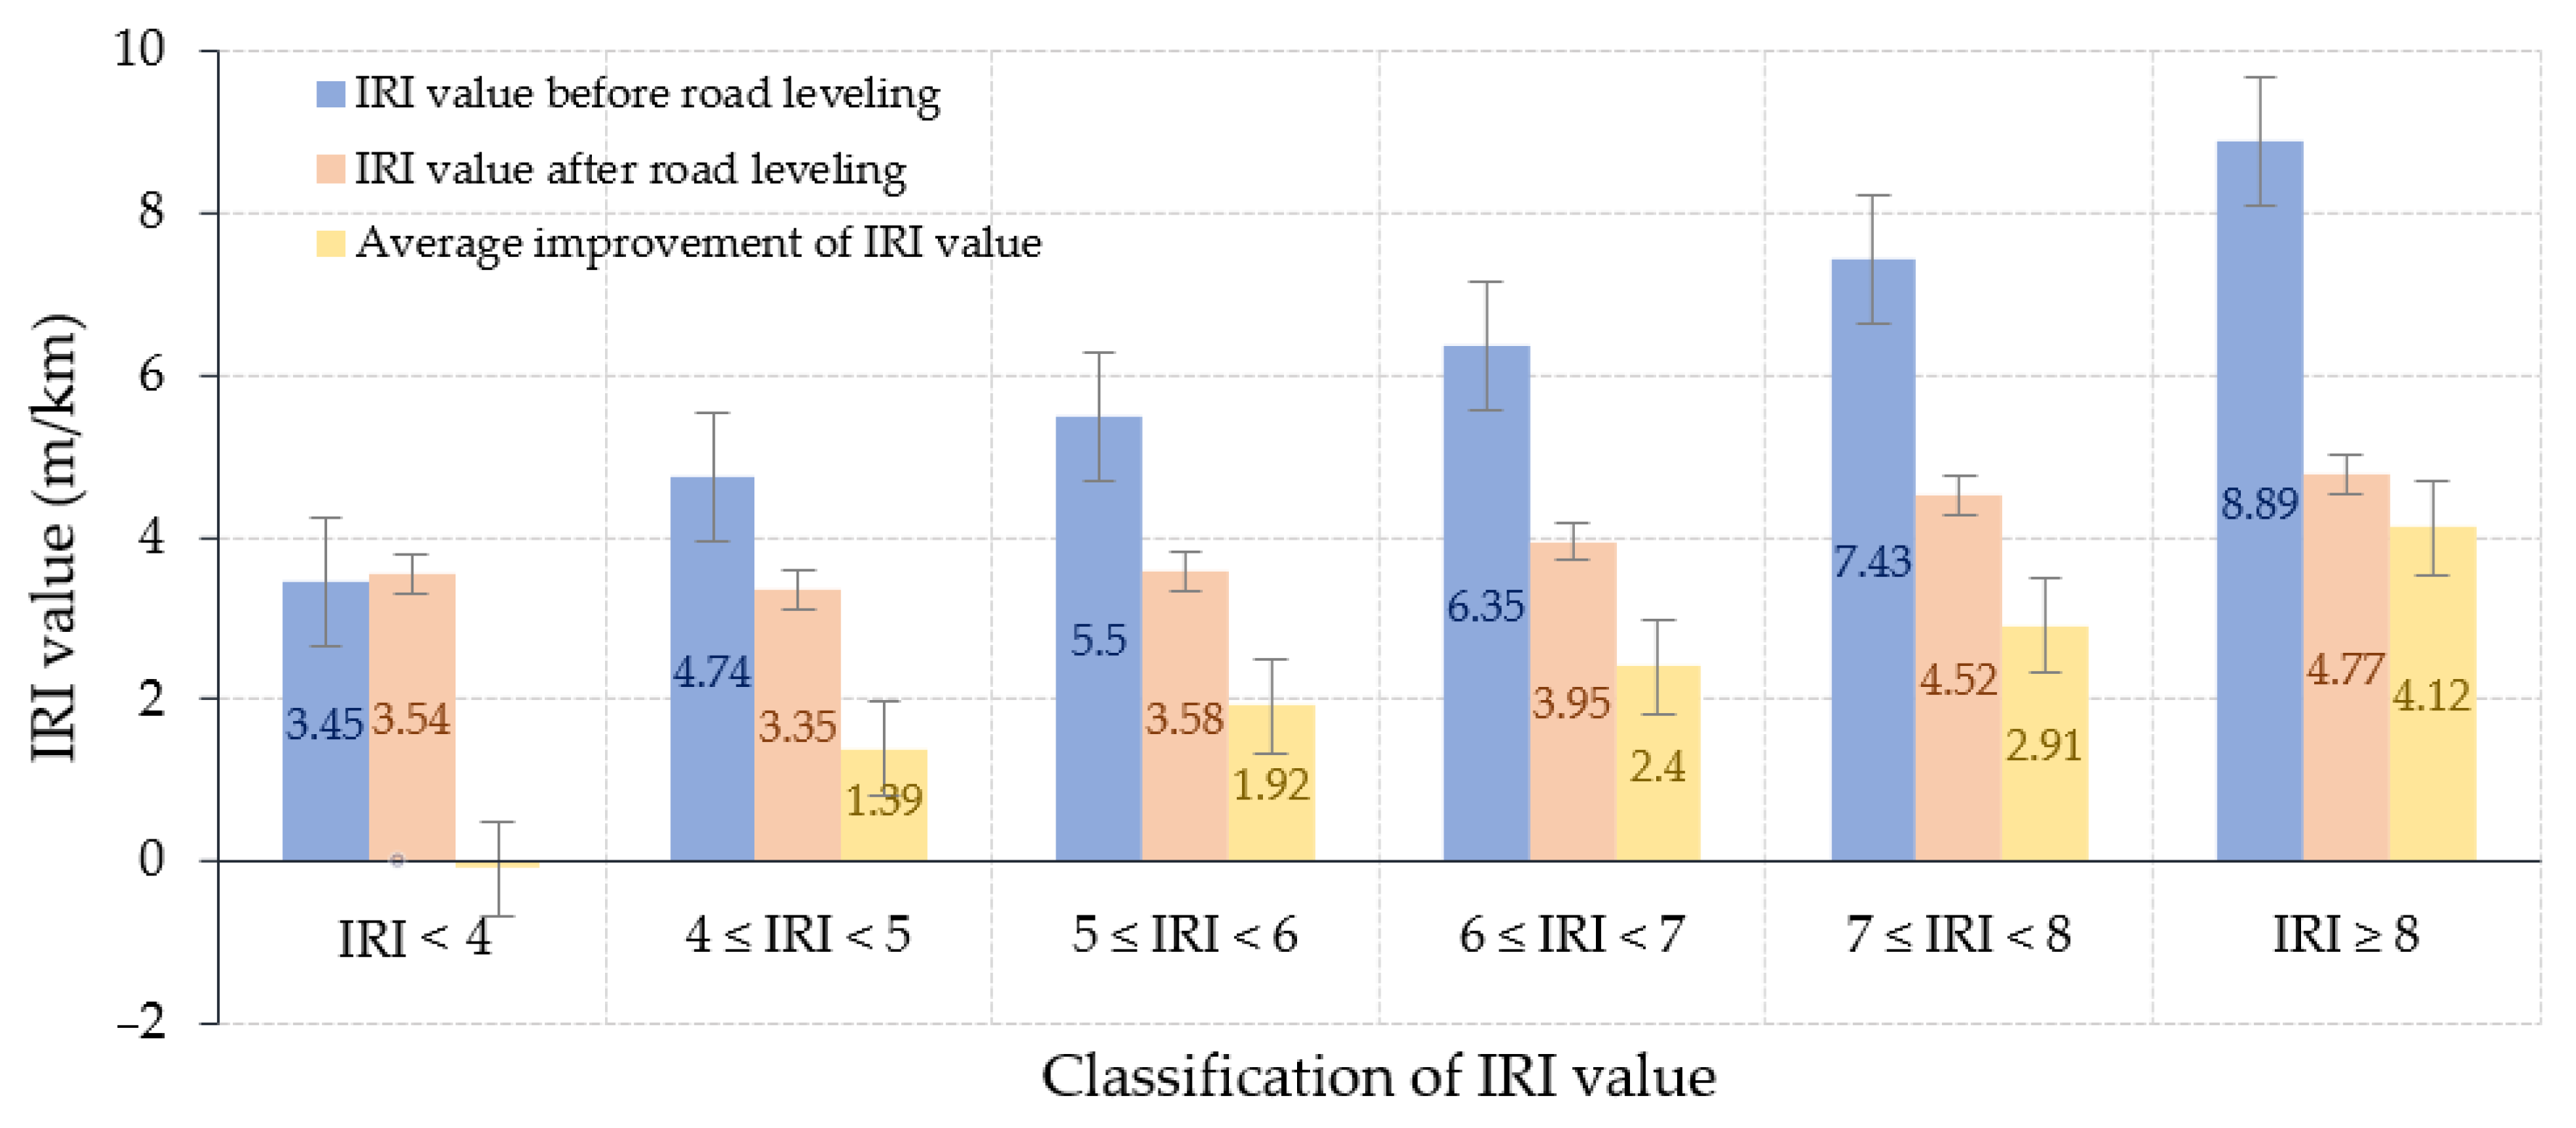
Generally speaking, the speed of urban roads is low, so comfortable driving can still be achieved under high IRI values. If acceptable IRI thresholds for urban roads with various speed limits can be set, it will help road managers to objectively compare the driving quality of roads with different speed limits. Moreover, in the case of limited budgets, in order to maximize the effectiveness of road maintenance funds, it is necessary to consider which roads should be improved first to improve the overall service standard. However, it is not an easy task to decide how to make the most effective use of limited road maintenance funds. According to this study, if the smoothness classification before road leveling is used as the basis, the average improvement in IRI can be calculated. The results are shown in Table 8 and Figure 13. It can be seen from Table 8 and Figure 13 that when the original IRI value of the road is less than 3 m/km and the smoothness is quite good, the IRI value of the road is not significantly improved after the improvement is completed. When the original smoothness value is poor, the improvement is more obvious. From the above discussion, it can be seen that if priority is given to road sections with poor smoothness, the number of road sections with poor service quality will be effectively reduced and the overall road service level will be improved. Using Figure 12 and some basic information about the road, we can arrange the budget for the number of roads with IRI values greater than the threshold value, or estimate how much budget is needed to improve the roads with an IRI above a certain value.

5. Conclusions

This research detected the longitudinal profiles of asphalt concrete pavements in Taipei City and examined the threshold values of acceptance for pavement smoothness to determine whether there is a need to reasonably adjust the current acceptance threshold for maintenance and rehabilitation scheduling. Based on the analysis results, the following conclusions can be obtained.
  • The IRI value before road leveling was mainly distributed between 5 and 8 m/km, while the IRI value after road leveling was mainly distributed between 3 and 5 m/km. The IRI value of the detected road section showed a downward trend, indicating that the implementation of the road leveling project had a significant effect on improving road smoothness.
  • According to the histogram and cumulative curve of IRI values for the 171 asphalt concrete pavement sections, 84.80% of repaired roads had an IRI of < 4.5 m/km. Accordingly, it is recommended to set the IRI threshold for road rehabilitation in Taipei City to 4.50 m/km. This threshold is higher than Taiwan’s current ordinary road surface smoothness inspection standard. However, the speed of urban roads is relatively low, and comfortable driving can still be achieved under high IRI values. Therefore, considering the characteristics of traffic factors in metropolitan areas, this should be a reasonable standard.
  • The cumulative distribution curve of IRI values can quickly estimate the number of kilometers of roads that must be maintained, and by using sorting and some basic information about the road conditions, we can quickly determine the section requiring maintenance and estimate the maintenance budget.
  • Moderately lowering the IRI threshold for road maintenance in Taipei City can conform to the trend that other countries have set for gradually tightening the IRI threshold for roads.

Author Contributions

Conceptualization, S.-L.C.; methodology, C.-H.L.; software, S.-L.C.; validation, S.-L.C. and C.-H.L.; formal analysis, C.-W.T. and C.-K.C.; investigation, S.-L.C. and C.-H.L.; resources, L.-P.C.; data curation, L.-P.C.; writing—original draft preparation, C.-H.L. and L.-P.C.; writing—review and editing, C.-W.T.; visualization, C.-W.T. and C.-K.C.; supervision, S.-L.C.; project administration, S.-L.C.; funding acquisition, S.-L.C. All authors have read and agreed to the published version of the manuscript.

Funding

The research was funded by the Ministry of Science and Technology of Taiwan grant number MOST 105-2221-E-027-018-MY3.

Acknowledgments

The authors sincerely thank the Ministry of Science and Technology of Taiwan for funding this research work, and thank Integrated Engineering Evaluations for providing some instrument photos. In addition, the authors thank Guo-ping Zhou, General Secretary of New Construction Office, Public Works Department, Taipei City Government for his valuable assistance.

Conflicts of Interest

The authors declare no conflict of interest.

References

  1. Papagiannakis, A.T.; Masad, E.A. Pavement Design and Materials; John Wiley & Sons, Inc.: Hoboken, NJ, USA, 2012. [Google Scholar]
  2. Federal Highway Administration (FHWA). Pavement Smoothness Technologies. 2006. Available online: http://www.fhwa.dot.gov/teams/pavement/pave_5psm.cfm (accessed on 21 July 2020).
  3. Paterson, W.D.O. International Roughness Index: Relationship to Other Measures of Roughness and Riding Quality. Transportation Research Record 1084. In Proceedings of the 65th Annual Meeting of the Transportation Research Board, Washington, DC, USA, 13–16 January 1986. [Google Scholar]
  4. Sayers, M.W.; Gillespie, T.D.; Queiroz, C.A.V. The International Road Roughness Experiment: A Basis for Establishing a Standard Scale for Road Roughness Measurement; Transportation Research Record 1084; Transportation Research Board, National Research Council: Washington, DC, USA, 1986. [Google Scholar]
  5. Sayers, M.W.; Gillespie, T.D.; Queiroz, C.A.V. International Experiment to Establish Correlations and Standard Calibration Methods for Road Roughness Measurements; Technical Paper Number 45; World Bank: Washington, DC, USA, 1986. [Google Scholar]
  6. Sayers, M.W.; Gillespie, T.D.; Paterson, W.D. Guidelines for the Conduct and Calibration of Road Roughness Measurements; Technical Paper No. 46; World Bank: Washington, DC, USA, 1986. [Google Scholar]
  7. Al-Omari, B.; Darter, M.I. Relationship between International Roughness Index and Present Serviceability Rating; Transportation Research Record 1435; TRB: Washington, DC, USA, 1994. [Google Scholar]
  8. Sayers, M.W. On the Calculation of International Roughness Index from Longitudinal Road Profile. Available online: https://trid.trb.org/view/452992 (accessed on 30 September 2020).
  9. Sayers, M.W.; Karamihas, S.M. The Little Book of Profiling: Basic Information about Measuring and Interpreting Road Profiles; University of Michigan Transportation Research Institute: Ann Arbor, MI, USA, 1998. [Google Scholar]
  10. Hall, K.T.; Munoz, C.E.C. Estimation of Present Serviceability Index from International Roughness Index; Transportation Research Record 1655; Transportation Research Board: Washington, DC, USA, 1999. [Google Scholar]
  11. Swanlund, M. Enhancing Pavement Smoothness. Public Roads 2002, 64, 20–22. [Google Scholar]
  12. Du, Y.; Liu, C.; Wu, D.; Jiang, S. Measurement of International Roughness Index by Using Z-Axis Accelerometers and GPS. Math. Probl. Eng. 2014, 928980. [Google Scholar] [CrossRef] [Green Version]
  13. Arhin, S.A.; Williams, L.N.; Ribbiso, A.; Anderson, M.F. Predicting Pavement Condition Index Using International Roughness Index in a Dense Urban Area. J. Civil Eng. Res. 2015, 5, 10–17. [Google Scholar]
  14. ASTM International. Standard Practice for Computing International Roughness Index of Roads from Longitudinal Profile Measurements; ASTM E1926-08; ASTM International: West Conshohocken, PA, USA, 2015. [Google Scholar]
  15. Loprencipe, G.; Zoccali, P. Use of Generated Artificial Road Profiles in Road Roughness Evaluation. J. Mod. Transp. 2017, 25, 24–33. [Google Scholar] [CrossRef] [Green Version]
  16. Múčka, P. International roughness index specifications around the world. Road Mater. Pavement Des. 2017, 18, 929–965. [Google Scholar] [CrossRef]
  17. Loprencipe, G.; Pantuso, A.; Di Mascio, P. Sustainable pavement management system in urban areas considering the vehicle operating costs. Sustainability 2017, 9, 453. [Google Scholar] [CrossRef] [Green Version]
  18. Nguyen, L.H. Research on the Correlation Between International Roughness Index (IRI) and Present Serviceability Index (PSI), Recommendations on Evaluation Rates in Vietnam’s Conditions. Int. J. Eng. Res. Technol. 2017, 6, 266–271. [Google Scholar]
  19. Uechi, S.T.; Uechi, H. The Profiling of International Roughness Index (IRI) Based on Lagrangian Method. World J. Eng. Technol. 2018, 6, 885–902. [Google Scholar] [CrossRef] [Green Version]
  20. Singh, D.K.; Gundaliya, P.J. Flexible Pavement Evaluation Using Profilometer for Unevenness. Int. Res. J. Eng. Technol. 2018, 5, 1024–1028. [Google Scholar]
  21. Zang, K.; Shen, J.; Huang, H.; Wan, M.; Shi, J. Assessing and Mapping of Road Surface Roughness based on GPS and Accelerometer Sensors on Bicycle-Mounted Smartphones. Sensors 2018, 18, 914. [Google Scholar] [CrossRef] [Green Version]
  22. Kırbaş, U. IRI Sensitivity to the Influence of Surface Distress on Flexible Pavements. Coatings 2018, 8, 271. [Google Scholar] [CrossRef] [Green Version]
  23. Mahmoudzadeh, A.; Golroo, A.; Jahanshahi, M.R.; Firoozi Yeganeh, S. Estimating Pavement Roughness by Fusing Color and Depth Data Obtained from an Inexpensive RGB-D Sensor. Sensors 2019, 19, 1655. [Google Scholar] [CrossRef] [PubMed] [Green Version]
  24. Loprencipe, G.; Zoccali, P.; Cantisani, G. Effects of Vehicular Speed on the Assessment of Pavement Road Roughness. Appl. Sci. 2019, 9, 1783. [Google Scholar] [CrossRef] [Green Version]
  25. Mirtabar, Z.; Golroo, A.; Mahmoudzadeh, A.; Barazandeh, F. Development of a crowdsourcing-based system for computing the international roughness index. Int. J. Pavement Eng. 2020. [Google Scholar] [CrossRef]
  26. Hossain, M.; Gopisetti, L.S.P.; Miah, M.S. Artificial neural network modelling to predict international roughness index of rigid pavements. Int. J. Pavement Res. Technol. 2020, 13, 229–239. [Google Scholar] [CrossRef]
  27. Liu, Y.; Du, T.; Xie, J. Development of the flatness detection system for cement concrete pavement construction phase. Mater. Sci. Eng. 2020, 892, 012040. [Google Scholar] [CrossRef]
  28. Song, Y.; Chen, R. Analysis method of vehicle Vibration response caused by pavement roughness. J. Traffic Transp. Eng. 2007, 7, 39–43. [Google Scholar]
  29. Wang, J.; Ma, J.; Ma, R. Study on calculation of dynamic displacement from time-frequency integration of acceleration. Comput. Sci. 2010, 37, 201–207. [Google Scholar]
  30. Thite, A.N.; Banvidi, S.; Ibicek, T.; Bennett, L. Suspension parameter estimation in the frequency domain using a matrix inversion approach. Veh. Syst. Dyn. 2011, 49, 1803–1822. [Google Scholar] [CrossRef]
  31. Loprencipe, G.; Zoccali, P. Ride Quality Due to Road Surface Irregularities: Comparison of Different Methods Applied on a Set of Real Road Profiles. Coatings 2017, 7, 59. [Google Scholar] [CrossRef] [Green Version]
  32. Cantisani, G.; Loprencipe, G. Road roughness and whole body vibration: Evaluation tools and comfort limits. J. Transp. Eng. 2010, 136, 818–826. [Google Scholar] [CrossRef]
  33. Yu, J.; Chou, E.; Yau, J.T. Development of speed-related ride quality thresholds using international roughness index. Transp. Res. Rec. J. Transp. Res. Board. 2006, 1, 47–53. [Google Scholar] [CrossRef]
  34. Bridgelall, R.; Huang, Y.; Zhang, Z.; Deng, F. Precision enhancement of pavement roughness localization with connected vehicles. Meas. Sci. Technol. 2016, 27, 025012. [Google Scholar] [CrossRef]
  35. Zhang, Z.; Sun, C.; Bridgelall, R.; Sun, M. Application of a machine learning method to evaluate road roughness from connected vehicles. J. Transp. Eng. Part B Pavements 2018, 144, 04018043. [Google Scholar] [CrossRef]
  36. Abeygunawardhana, C.; Sandamal, R.M.K.; Pasindu, H.R. Identification of the Impact on Road Roughness on Speed Patterns for Different Roadway Segments. In Proceedings of the 2020 Moratuwa Engineering Research Conference (MERCon), Moratuwa, Sri Lanka, 28–30 July 2020. [Google Scholar]
  37. Meyer, F.J.; Ajadi, O.A.; Hoppe, E.J. Studying the Applicability of X-Band SAR Data to the Network-Scale Mapping of Pavement Roughness on US Roads. Remote Sens. 2020, 12, 1507. [Google Scholar] [CrossRef]
  38. ASTM International. Standard Test Method for Measuring the Longitudinal Profile of Traveled Surfaces with an Accelerometer-Established Inertial Profiling Reference; ASTM E950/E950M-09(2018); ASTM International: West Conshohocken, PA, USA, 2018. [Google Scholar]
  39. Taipei City Government. Phase II Test Results Report of Urban Road Smoothness; Public Works Department, Taipei City Government: Taipei, Taiwan, 2020. (In Chinese)
  40. Chou, C.P. Modification of the Urban Road Pavement Damage Detection System and Smoothness Acceptance Mechanism; Research Report Commissioned by the Construction Department; Construction and Planning Agency, Ministry of the Interior, R.O.C.: Taipei, Taiwan, 2011. (In Chinese) [Google Scholar]
  41. Specification for Acceptance of Urban Road Smoothness (Draft). Construction and Planning; Ministry of the Interior, R.O.C.: Taipei, Taiwan, 2005. (In Chinese) [Google Scholar]
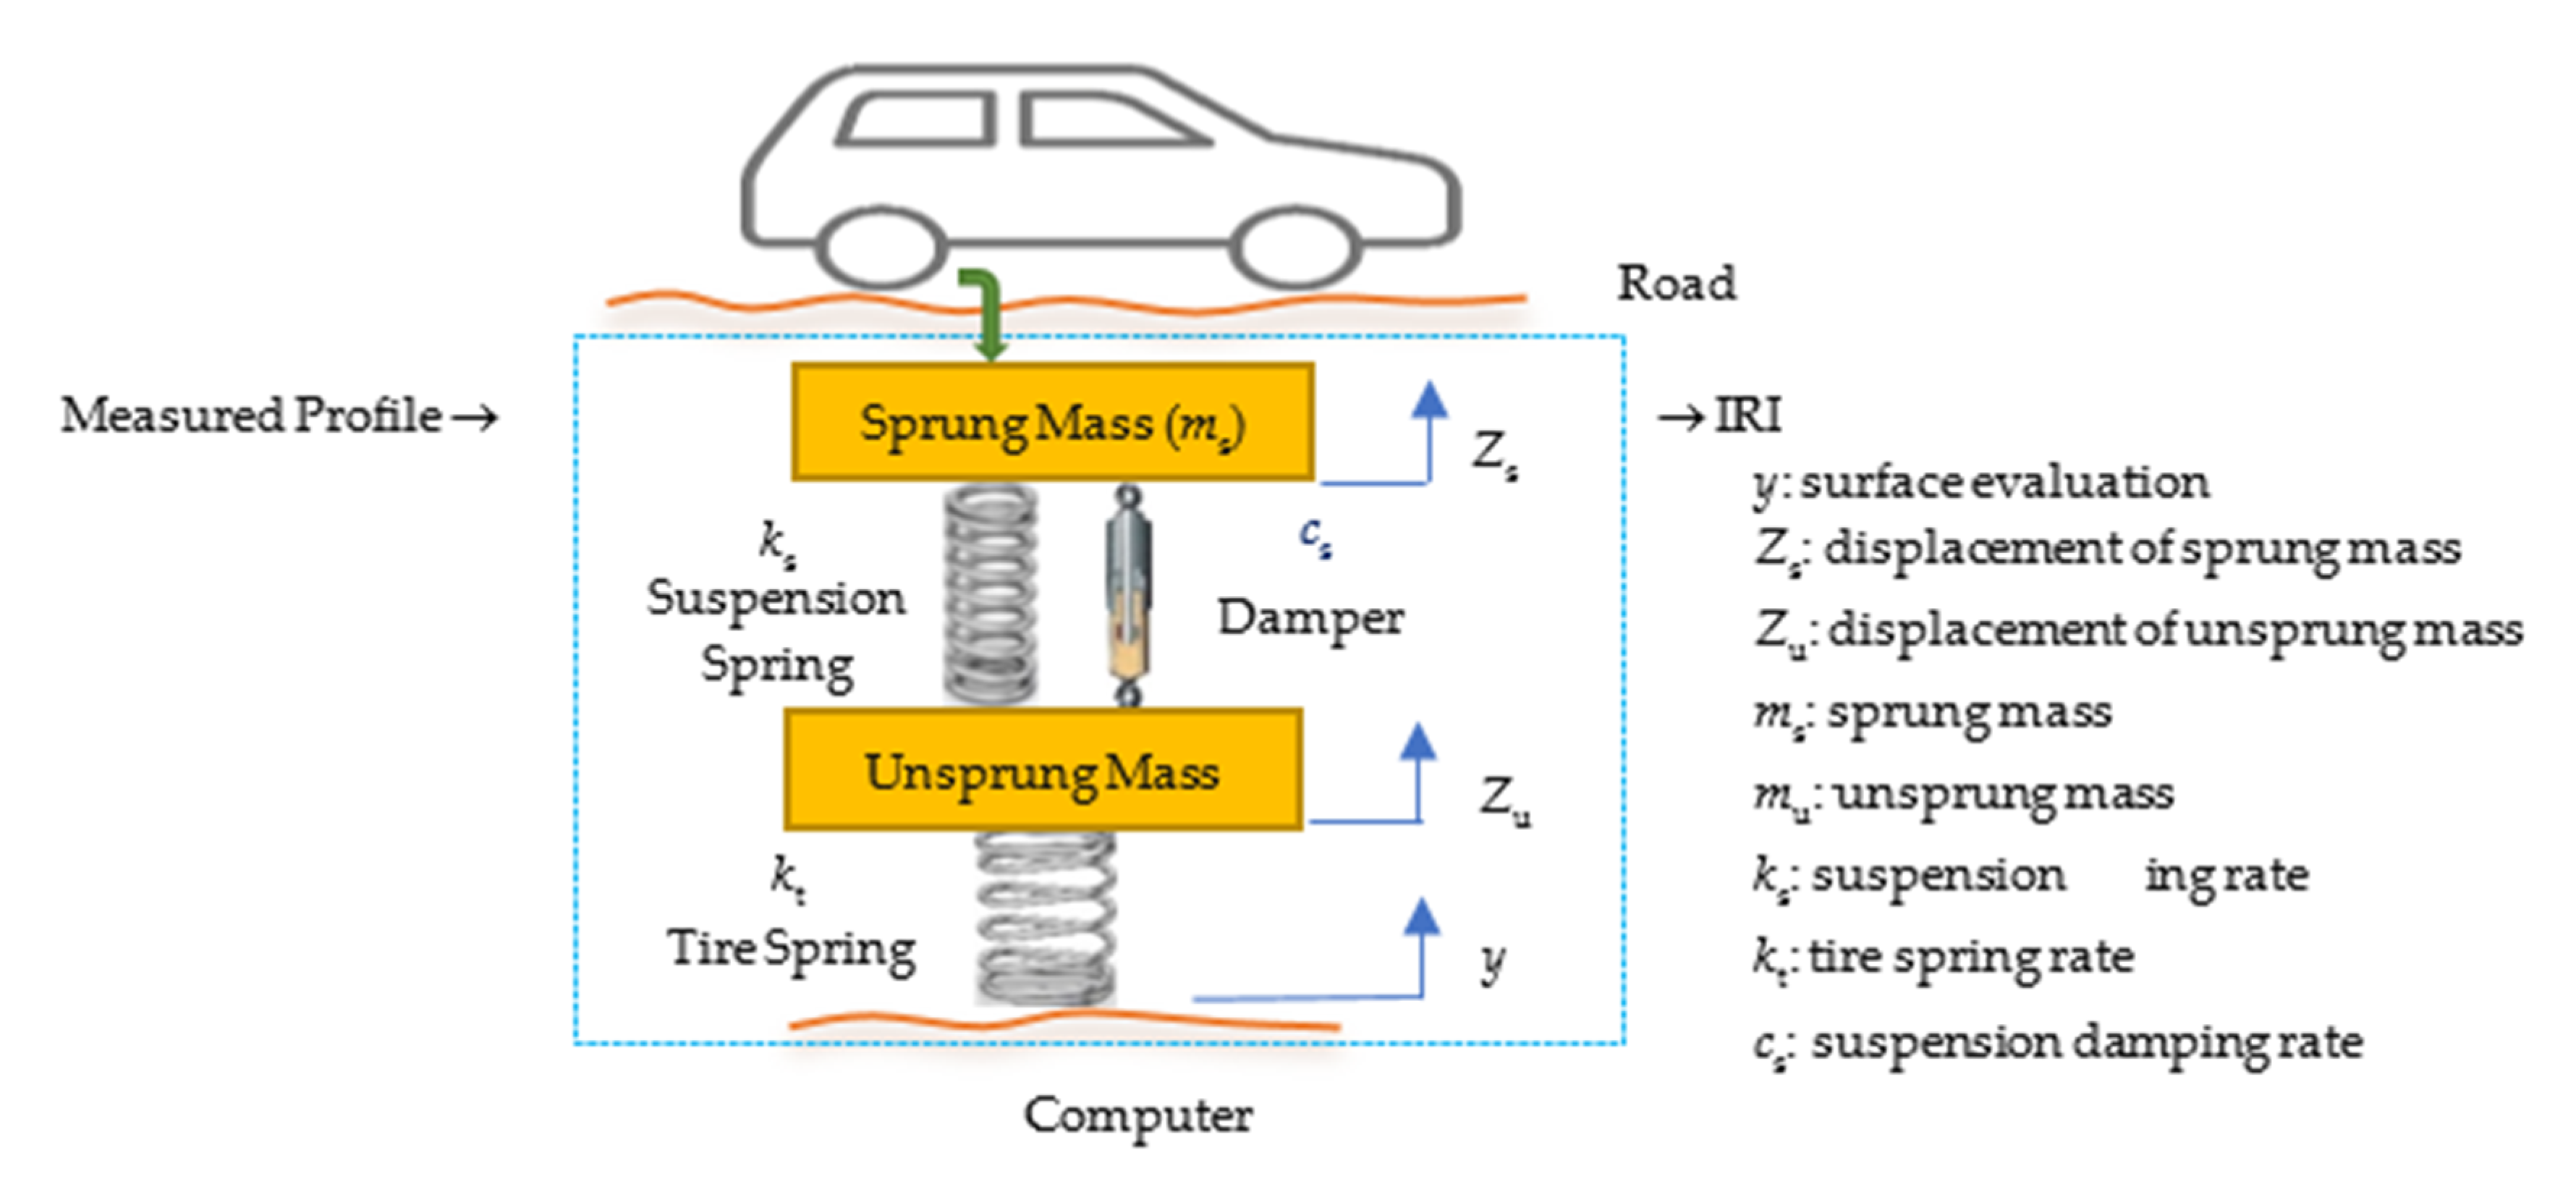
Figure 1. Illustration of computer algorithm used to compute the International Roughness Index (IRI) [9,14].
Sustainability 12 10536 g001
Figure 2. Illustration of the IRI scale for different pavements [9].
Sustainability 12 10536 g002
Figure 3. System architecture diagram of testing equipment.
Sustainability 12 10536 g003
Figure 4. Comparison of IRI values before and after the first phase of the Road Smoothing Project.
Sustainability 12 10536 g004
Figure 5. Histogram and cumulative curve of IRI values before the first phase of the Road Smoothing Project.
Sustainability 12 10536 g005
Figure 6. Histogram and cumulative curve of IRI values after the first phase of the Road Smoothing Project.
Sustainability 12 10536 g006
Figure 7. IRI value after the second phase of the Road Smoothing Project.
Sustainability 12 10536 g007
Figure 8. Comparison of IRI values before and after the Road Smoothing Project.
Sustainability 12 10536 g008
Figure 9. IRI distribution map of major and minor roads in Taipei City.
Sustainability 12 10536 g009
Figure 10. Cumulative percentage curve of IRI values before and after the Road Smoothing Project.
Sustainability 12 10536 g010
Figure 11. Comparison of IRI values before and after the Road Smoothing Project.
Sustainability 12 10536 g011
Figure 12. Histogram and cumulative curve of IRI values for the 171 asphalt concrete pavement sections.
Sustainability 12 10536 g012
Figure 13. Average improvement of IRI values before and after the first phase of the Road Smoothing Project.
Sustainability 12 10536 g013
Table 1. Speed-related IRI thresholds at different speeds suggested by Yu et al. [34].
Ride Quality
Level
IRI Thresholds at Different Speeds (m/km)
20406080100120
Very Good<5.72<2.86<1.90<1.43<1.14<0.95
Good5.72–8.992.86–4.491.90–2.991.43–2.241.14–1.790.95–1.49
Fair9.00–11.394.50–5.693.00–3.792.25–2.841.80–2.271.50–1.89
Mediocre11.40–16.165.70–8.083.80–5.402.85–4.052.28–3.241.90–2.70
Poor>16.16>8.08>5.40>4.05>3.24>2.70
Table 2. Inspection record of the first phase of road smoothness.
ItemStake (m)Forward LaneReverse Lane
Car Speed
(km/h)
IRI
(m/km)
Car Speed
(km/h)
IRI
(m/km)
15022.59.0720.99.51
210028.87.3618.88.49
315030.05.7415.99.14
420031.86.0923.99.40
525028.46.8823.97.58
630021.25.5722.17.39
735021.26.0120.58.75
840028.04.1320.39.10
945030.66.5918.08.26
1050031.68.3519.78.12
1155020.26.5318.79.15
1260027.27.7515.66.73
1365029.17.4121.66.34
1470029.05.6920.66.72
1575027.97.7022.27.44
1680022.27.5428.17.73
1785016.77.8419.28.24
1890015.16.7820.37.77
1995024.05.6521.37.50
20100025.96.2022.97.74
21105027.111.4032.18.63
22110024.55.4331.88.37
23115025.85.2230.77.10
24120028.03.8229.37.55
25125031.33.4831.84.65
26130024.43.0632.34.59
27135013.75.8032.27.67
28140025.16.2033.45.12
29145023.97.9933.34.37
30150035.58.8531.210.53
31155037.45.9524.99.76
Average value26.16.5224.47.72
Standard deviation-1.73-1.52
Maximum value37.411.4033.410.53
Minimum value13.73.0615.64.37
Table 3. IRI values before and after the Road Smoothing Project.
Statistical ParametersBefore the First Phase of Road LevelingAfter the First Phase of Road LevelingAfter the Second Phase of Road Leveling
Average value (m/km)5.913.843.74
Maximum value (m/km)8.895.075.98
Minimum value (m/km)3.012.472.42
Range (m/km)5.882.603.56
Variance1.330.460.40
Standard deviation (m/km)1.150.680.64
Table 4. Acceptance evaluation criteria for urban roads with an original IRI greater than 6.5 m/km [41].
Road GradeOriginal IRI Value
(m/km)
Evaluation Result (m/km)
Qualified AreaCorrection AreaRedo Area
ExpresswayIRI > 7.5IRI 4.54.5 < IRI 5.0IRI > 5.0
6.5 < IRI 7.5IRI 4.04.0 < IRI 4.5IRI > 4.5
Main and minor road
(Road width > 20 m)
IRI > 7.5IRI 5.05.0 < IRI 5.5IRI > 5.5
6.5 < IRI 7.5IRI 4.54.5 < IRI 5.0IRI > 5.0
General minor road
(11 m < Road width < 20 m)
IRI > 7.5IRI 5.05.0 < IRI 5.5IRI > 5.5
6.5 < IRI 7.5IRI 4.54.5 < IRI 5.0IRI > 5.0
Laneway
(8 m < Road width < 11 m)
IRI > 7.5IRI 5.55.5 < IRI 6.0IRI > 6.0
6.5 < IRI 7.5IRI 5.05.0 < IRI 5.5IRI > 5.5
Table 5. Acceptance evaluation criteria for construction of new urban roads or those with an original IRI not greater than 6.5 m/km [41].
Road GradeOriginal IRI Value
(m/km)
Evaluation Result (m/km)
Qualified AreaCorrection AreaRedo Area
ExpresswayIRI 6.5IRI 3.23.2 < IRI 3.5IRI > 3.5
Main and minor road
(Road width >20 m)
IRI 7.0IRI 3.53.5 < IRI 3.8IRI > 3.8
General minor road
(11 m < Road width < 20 m)
IRI 7.0IRI 3.53.5 < IRI 3.8IRI > 3.8
Laneway
(8 m < Road width < 11 m)
IRI 7.5IRI 4.04.0 < IRI 4.3IRI > 4.3
Table 6. Evaluation result of detected sections with original IRI values not greater than 6.5 m/km.
Road Section
Number
IRI Value Before
Leveling
IRI Value After
Leveling
Length of Road Section (m)Evaluation Result
13.133.454000Qualified area
23.663.834100Redo area
33.013.252900Qualified area
46.143.112500Qualified area
65.983.794600Correction area
74.784.182400Redo area
85.694.043600Redo area
95.374.035000Redo area
107.124.573100Redo area
116.014.632700Redo area
126.142.921400Qualified area
145.712.885300Qualified area
157.215.052700Redo area
167.65.075600Redo area
176.124.573750Redo area
186.125.073750Redo area
205.443.772100Correction area
216.484.632600Redo area
223.993.623500Correction area
255.373.063200Qualified area
265.443.352800Qualified area
276.23.834300Redo area
285.33.131300Qualified area
296.363.242200Qualified area
305.83.011500Qualified area
315.814.011400Redo area
325.143.293500Qualified area
334.83.384000Qualified area
345.473.454300Qualified area
356.234.51700Redo area
364.633.442000Qualified area
374.632.972300Qualified area
394.42.952400Qualified area
405.443.352800Qualified area
415.313.963200Redo area
475.223.32100Qualified area
484.63.12200Qualified area
496.142.921400Qualified area
526.173.786400Correction area
535.262.471200Qualified area
546.043.81700Redo area
554.772.81600Qualified area
565.722.662400Qualified area
574.92.622700Qualified area
605.733.491800Qualified area
615.673.443700Qualified area
645.984.33500Redo area
655.164.442400Redo area
665.163.732400Correction area
675.164.372200Redo area
684.943.893600Redo area
694.94.141500Redo area
705.634.572300Redo area
Table 7. Evaluation result of detected road sections with original IRI values greater than 6.5 m/km.
Road Section NumberIRI Value Before LevelingIRI Value After
Leveling
Length of Road Section (m)Evaluation Result
56.73.522600Qualified area
136.614.442300Qualified area
197.634.31000Qualified area
237.583.87900Qualified area
247.274.561400Correction area
387.294.631350Correction area
427.884.862100Qualified area
437.394.351400Qualified area
447.394.571400Correction area
457.324.381500Qualified area
468.894.771000Qualified area
507.244.821500Correction area
517.854.843200Qualified area
586.953.731700Qualified area
597.293.442300Qualified area
626.94.32900Qualified area
636.634.082200Qualified area
Table 8. Effectiveness of the first phase of the Road Smoothing Project.
Classification of IRI ValueIRI Value Before Road LevelingIRI Value After Road LevelingAverage IRI After Improvement
IRI < 43.453.54−0.09
4 ≤ IRI < 54.743.351.39
5 ≤ IRI < 65.503.581.92
6 ≤ IRI < 76.353.952.40
7 ≤ IRI < 87.434.522.91
IRI ≥ 88.894.774.12
Publisher’s Note: MDPI stays neutral with regard to jurisdictional claims in published maps and institutional affiliations.