Article

Sustainable Technology Analysis of Blockchain Using Generalized Additive Modeling

Department of Big Data and Statistics, Cheongju University, Chungbuk 28503, Korea
*
Author to whom correspondence should be addressed.
Sustainability 2020, 12(24), 10501; https://doi.org/10.3390/su122410501
Submission received: 28 October 2020 / Revised: 5 December 2020 / Accepted: 14 December 2020 / Published: 15 December 2020

Abstract

:
Blockchain is a secure distributed management technology for data. Until now, blockchain technology has been intensively developed in financial fields such as Bitcoin. As the blockchain technology develops, the application fields of blockchain are expected to further expand. We proposed a technology analysis method for sustainability of blockchain technology. We analyzed the patent documents related to blockchain for sustainable technology analysis. To carry out the technology analysis, we preprocessed the patent documents and built a structure data, document-term matrix. In general, most elements of this matrix are zeros, so it is very skewed. Due to the skewness, technology analysis by traditional methods of statistics has analytical difficulty. To overcome this problem, we proposed a technology analysis method based on generalized additive modeling. To show how our proposed method can be applied to practical fields, we collected and analyzed the patent documents of blockchain technology.

1. Introduction

Since technology has various effects on many areas of our society, we need to understand and cope with technology correctly. Technology changes society, and society calls for new developments that can improve the quality of human life [1]. Much research into technology analysis has been performed in various areas [2,3,4,5]. Choi et al. (2016) introduced a patent analysis method for sustainable technology management. They used the result of patent analysis for management of technology (MOT) with sustainability. Park and Jun (2017) selected the technology of three-dimensional printing for technology analysis. They also considered technological sustainability as the main goal of their technology analysis because sustainable technology is important to competitiveness of companies in the market. Kim et al. (2017) carried out a technology analysis of the Apple company according to the products of Apple such as the iPhone, iPad, and iPod. The authors showed an approach to product-based technology analysis in MOT. Kim et al. (2019) combined the statistical method and machine learning algorithm to analyze sustainable technology. In most of the studies related to previous technology analysis, patent documents were used for quantitative technology analysis. The researchers searched patent documents related to target technology, and transformed the collected documents into structured data for patent technology analysis by statistics and machine learning algorithms. This is because most of the analysis methods based on statistics and machine learning require structured data in the form of a matrix. Each row and column of this matrix are patent document and term respectively. The element of this matrix represents the frequency with which the term occurred in a patent document. In general, this matrix is very sparse because many of the element values are zero [6,7,8]. Jun et al. (2014) tried to overcome the sparsity by dimension reduction and support vector machine. They reduced the column size of the document-term matrix using principal component analysis and solved the sparseness by combining the columns of high correlation. In the dimensional reduction process, information loss occurs for the entire data set, which leads to a problem that the performance of the analysis model is degraded. Jun (2018) and Uhm et al. (2020) studied Bayesian approaches to settle the sparseness problem of patent document-term matrix. In addition, the data with the zero-sparsity problem have a skewed distribution with a long tail toward zero. We proposed a technology analysis using generalized additive modeling to solve the sparsity and skewed distribution problem in this research. We also applied this proposed method to sustainable technology analysis of blockchain. Generalized additive model (GAM) uses diverse smoothers such as regression spline to deal with the problems of sparseness and skewness [9,10,11,12]. In this paper, we studied technology analysis methods to find sustainable technologies in the blockchain field. In particular, we proposed an objective and quantitative technology analysis method rather than the existing subjective technology analysis method. To this end, after collecting and preprocessing patent documents related to the blockchain, sustainable technical analysis was performed using statistical analysis methods. In order to overcome the sparsity and skewed bias problems of structured data in this process, we studied and proposed a sustainable technology analysis method based on the generalized additive model. The remainder of our paper is organized as follows. In Section 2, we explain the concept of blockchain technology related to our study. We show the proposed method of sustainable technology analysis of blockchain using generalized additive modeling in Section 3. The next section provides the result of our case study for blockchain technology analysis. In the discussion section, we present the motivation and subject of our research, the importance and contribution to the research results, and the limitations. Lastly, we conclude our research and describe our future works related to sustainable technology analysis of blockchain.

2. Research Background

2.1. Blockchain Technology

With the introduction of bitcoin in 2009, interest in digital currency and cryptocurrency have been focused. The central banks in each country have been discussing various changes in monetary policy, such as supplementing the payment system using bitcoin. Along with this, interest in blockchain, the underlying technology that supports the use of bitcoin in the Internet environment, has increased significantly. Blockchain technology, which started from the underlying technology of bitcoin, shows the possibility of unique application in various fields other than the bitcoin field. Figure 1 shows the web search result of Google Trends related to blockchain technology [13].
The meaning of each number on the Y-axis in Figure 1 is a proportional representation of the search volume for a specific term when the total search volume is set to 100. That is, the highest point is set at 100 and the remaining amount is expressed as a relative value. As shown in Figure 1, interest in blockchain exploded between 2017 and 2018, and various companies, mainly financial companies, have been developing the blockchain technology. In addition, blockchain technology has rapidly emerged in the startup market, and venture capitalists are also investing a lot of capital in blockchain-related startups. Table 1 shows various definitions of blockchain from the previous research [14,15,16].
From various studies related to blockchain so far, we define blockchain as a secure distributed management technology for data, that is, a technology that shares and manages a large volume of total transaction information (ledger), and block-level information is connected and stored in a chain. [17,18,19,20,21]. Until now, blockchain technology has been used in diverse forms in various fields [A3–A5]. Hussien et al. (2019) and Kumar et al. (2018) applied blockchain technology to healthcare applications [22,23]. Derbentsev et al. (2018) studied a forecasting model for cryptocurrency prices using a machine learning algorithm [24]. Maksimov et al. (2020) proposed a statistical model for checking blockchain-based applications [25]. We carried out technology analysis of blockchain technology and tried to find the technological sustainability of blockchain.

2.2. Additive Modeling

GAM provides a general form of extending the linear model by allowing nonlinear functions for each variable while maintaining additivity [26]. Like the linear model, GAM can be applied to both categorial and continuous response variables. GAM can be applied to regression and classification problems at the same time. First, in the regression task, we consider multiple linear regression as follows.
y i = β 0 + β 1 x i 1 + β 2 x i 2 + + β k x i k + ε i ,   i =   1 ,   2 ,   ,   n
where β 0 and β i are intercept and regression coefficients of x i , respectively. In addition, n and k are the numbers of data points and explanatory variables, respectively. In GAM, each linear coefficient of this model is replaced by the nonlinear function g ( · ) as follows [26].
y i = β 0 + j = 1 k g j ( x i j ) + ε i
Using this model, we can overcome obstacles of the linear regression models. Second, the following equation represents a logistic model for binary classification tasks.
l n ( p 1 p ) = β 0 + β 1 x i 1 + β 2 x i 2 + + β k x i k + ε i ,   i =   1 ,   2 ,   ,   n
where p is P ( y i = 1 ) . y i = 1 means that an event of interest has occurred. Like Equation (2), we transform this model to the following nonlinear classification model.
l n ( p 1 p ) = β 0 + j = 1 k g j ( x i j ) + ε i
This model is also an efficient approach to various classification tasks. In this paper, we apply GAM to regression tasks of patent keyword analysis for sustainable technology analysis.

3. Generalized Additive Modeling for Sustainable Technology Analysis of Blockchain

With the introduction of blockchain technology more than 10 years ago, it is now time for us to prepare for the blockchain era. Until now, studies on blockchain technology fell into one of two categories. The first category was studies on the social ramifications of blockchain technology. The second category was research on the underlying technology that can efficiently apply blockchain to the financial field. However, research on the methodology to objectively analyze the developed blockchain technology and use the results to confirm the sustainability of this technology in the future has not been conducted so far. Sustainable technology analysis of blockchain enables effective contribution to research and development (R&D) planning and technology management of blockchain technology in the future. In this paper, we studied generalized additive modeling for sustainable technology analysis of blockchain using text mining, statistical analysis, and visualization. The goal of this paper was to study solutions to the following two research questions (RQs):
(RQ.1)
How can we find the technological structure and relationships for sustainability of blockchain technology?
(RQ.2)
How can we solve the skewed and sparse problems that occur in the preprocessing of patent big data?
In order to answer RQ.1, we surveyed the previous research related to sustainability in technology areas and technological relations between various technologies. Sott et al. (2020) used network analysis and machine learning algorithms to find emerging technologies in the coffee sector [27]. Several studies have also been introduced on how to identify or evaluate the sustainability of a technology [28,29,30,31,32]. In addition, Schinckus (2020) showed a survey result of sustainability of blockchain from a management and financial point of view [33]. This paper provided good and bad aspects of blockchain technology in societal issues. In our research, we proposed a new approach to find the sustainability of blockchain technology. We tried to understand the sustainability of blockchain technology through an objective analysis of the technology itself. Therefore, for RQ.1, we searched patent documents related to blockchain technology and analyzed patent data. Using the results of the blockchain patent data analysis, we a constructed technology diagram of blockchain for understanding the sustainability of blockchain technology. Generally, we had to build structured data by data preprocessing for technology patent analysis. In this process, we encountered a skewed, sparse problem in structured data, that is a matrix with patent (row) and keyword (column). To solve RQ.2, we dealt with a method based on advanced statistical analysis called the generalized additive model. From the two RQs in our research, we proposed a new method for blockchain technology analysis with sustainability.
For technology analysis, we had to prepare patent or paper documents related to target technology. In this paper, we collected patent documents related to blockchain technology from worldwide patent databases. The collected documents were used for sustainable technology analysis of blockchain. First of all, we preprocessed the document data using text mining methods because statistics or machine learning algorithms require a structured data type for data analysis. From the preprocessing result, we made structured data with a matrix. This matrix consisted of patent documents and keywords for rows and columns, respectively. Each element of the matrix was the frequency at which a keyword occurred in a patent document. In general, this matrix was very sparse because most elements were zeros. Therefore, the distributions of keyword frequencies were skewed to zero. However, most of the previous research related to patent data analysis carried out the statistical methods not considering the skewed data distribution. The skewness problem of patent data degrades the model performance in statistical technology analysis. To solve this problem, we proposed a technology analysis model using generalized additive modeling. In addition, we focused on patent analysis on sustainability of blockchain technology.
Given a dependent variable (keyword) y and independent vector (keyword vector) ( x 1 ,   x 2 ,   ,   x k ) , the generalized additive model is expressed in Equation (5) [9,11]
y = β 0 + f 1 ( x 1 ) + f 2 ( x 2 ) + + f k ( x k ) + ε
where f j ( x j ) is an unspecified nonparametric function such as smoothing spline and the function is mapped to y by various link functions such as Poisson and negative binomial distributions [10,34]. In addition, β 0 and ε are the bias (or intercept) and error of the statistical model, respectively. In generalized additive modeling, we compute f j ( x j ) for each x j and then sum f j ( x j ) for all x j , j = 1, 2, …, k. So, the generalized additive model (GAM) is an extended version of the generalized linear model (GLM) as in (6).
β 0 + i = 1 k β i x i   ( GLM )   β 0 + i = 1 k f i ( x i )   ( GAM )
Using the smoother f j ( · ) in Equation (5), we can overcome the problem in the patent-keyword matrix. In this paper, we used regression spline as a smother, so we represent this function in Equation (7).
f ( x ) = i = 1 k β i ϕ i ( x )
where ϕ ( x ) and β are basis function and model parameter, respectively. To fit the model parameters, we minimized the following objective in Equation (8).
G ( β 0 , f 1 ( · ) , f 2 ( · ) , , f k ( · ) ) = i = 1 n ( y i β 0 j = 1 k f j ( x i j ) ) 2 + j = 1 k λ j f j ( w j ) 2 d w j
In Equation (8), λ j represents the regularized strength for f j ( · ) . So, we have to minimize the objective function of GAM. In our research, y was keyword blockchain and ( x 1 ,   x 2 ,   ,   x k ) were explanatory keywords that affect blockchain. So, we built GAM to explain the technological trend of blockchain based on the influences by other technological keywords as follows.
blockchain = b 0 + f 1 ( k e y w o r d 1 ) + f 2 ( k e y w o r d 2 ) + + f k ( k e y w o r d k )
In Equation (9), We used all patent keywords except blockchain as independent variables. Each keyword represents a detailed sub-technology of blockchain. For example, the keyword blockchain represents the blockchain technology. In addition, the keyword bitcoin also illustrates the detailed technology related to bitcoin. Therefore, we present the proposed method step-by-step as follows.
Step 1.
Collecting patent documents related to blockchain technology from patent databases.
Step 2.
Preprocessing collected patent documents using text mining techniques.
Step 3.
Selecting significant keywords that affect technological development of blockchain using GAM.
Step 4.
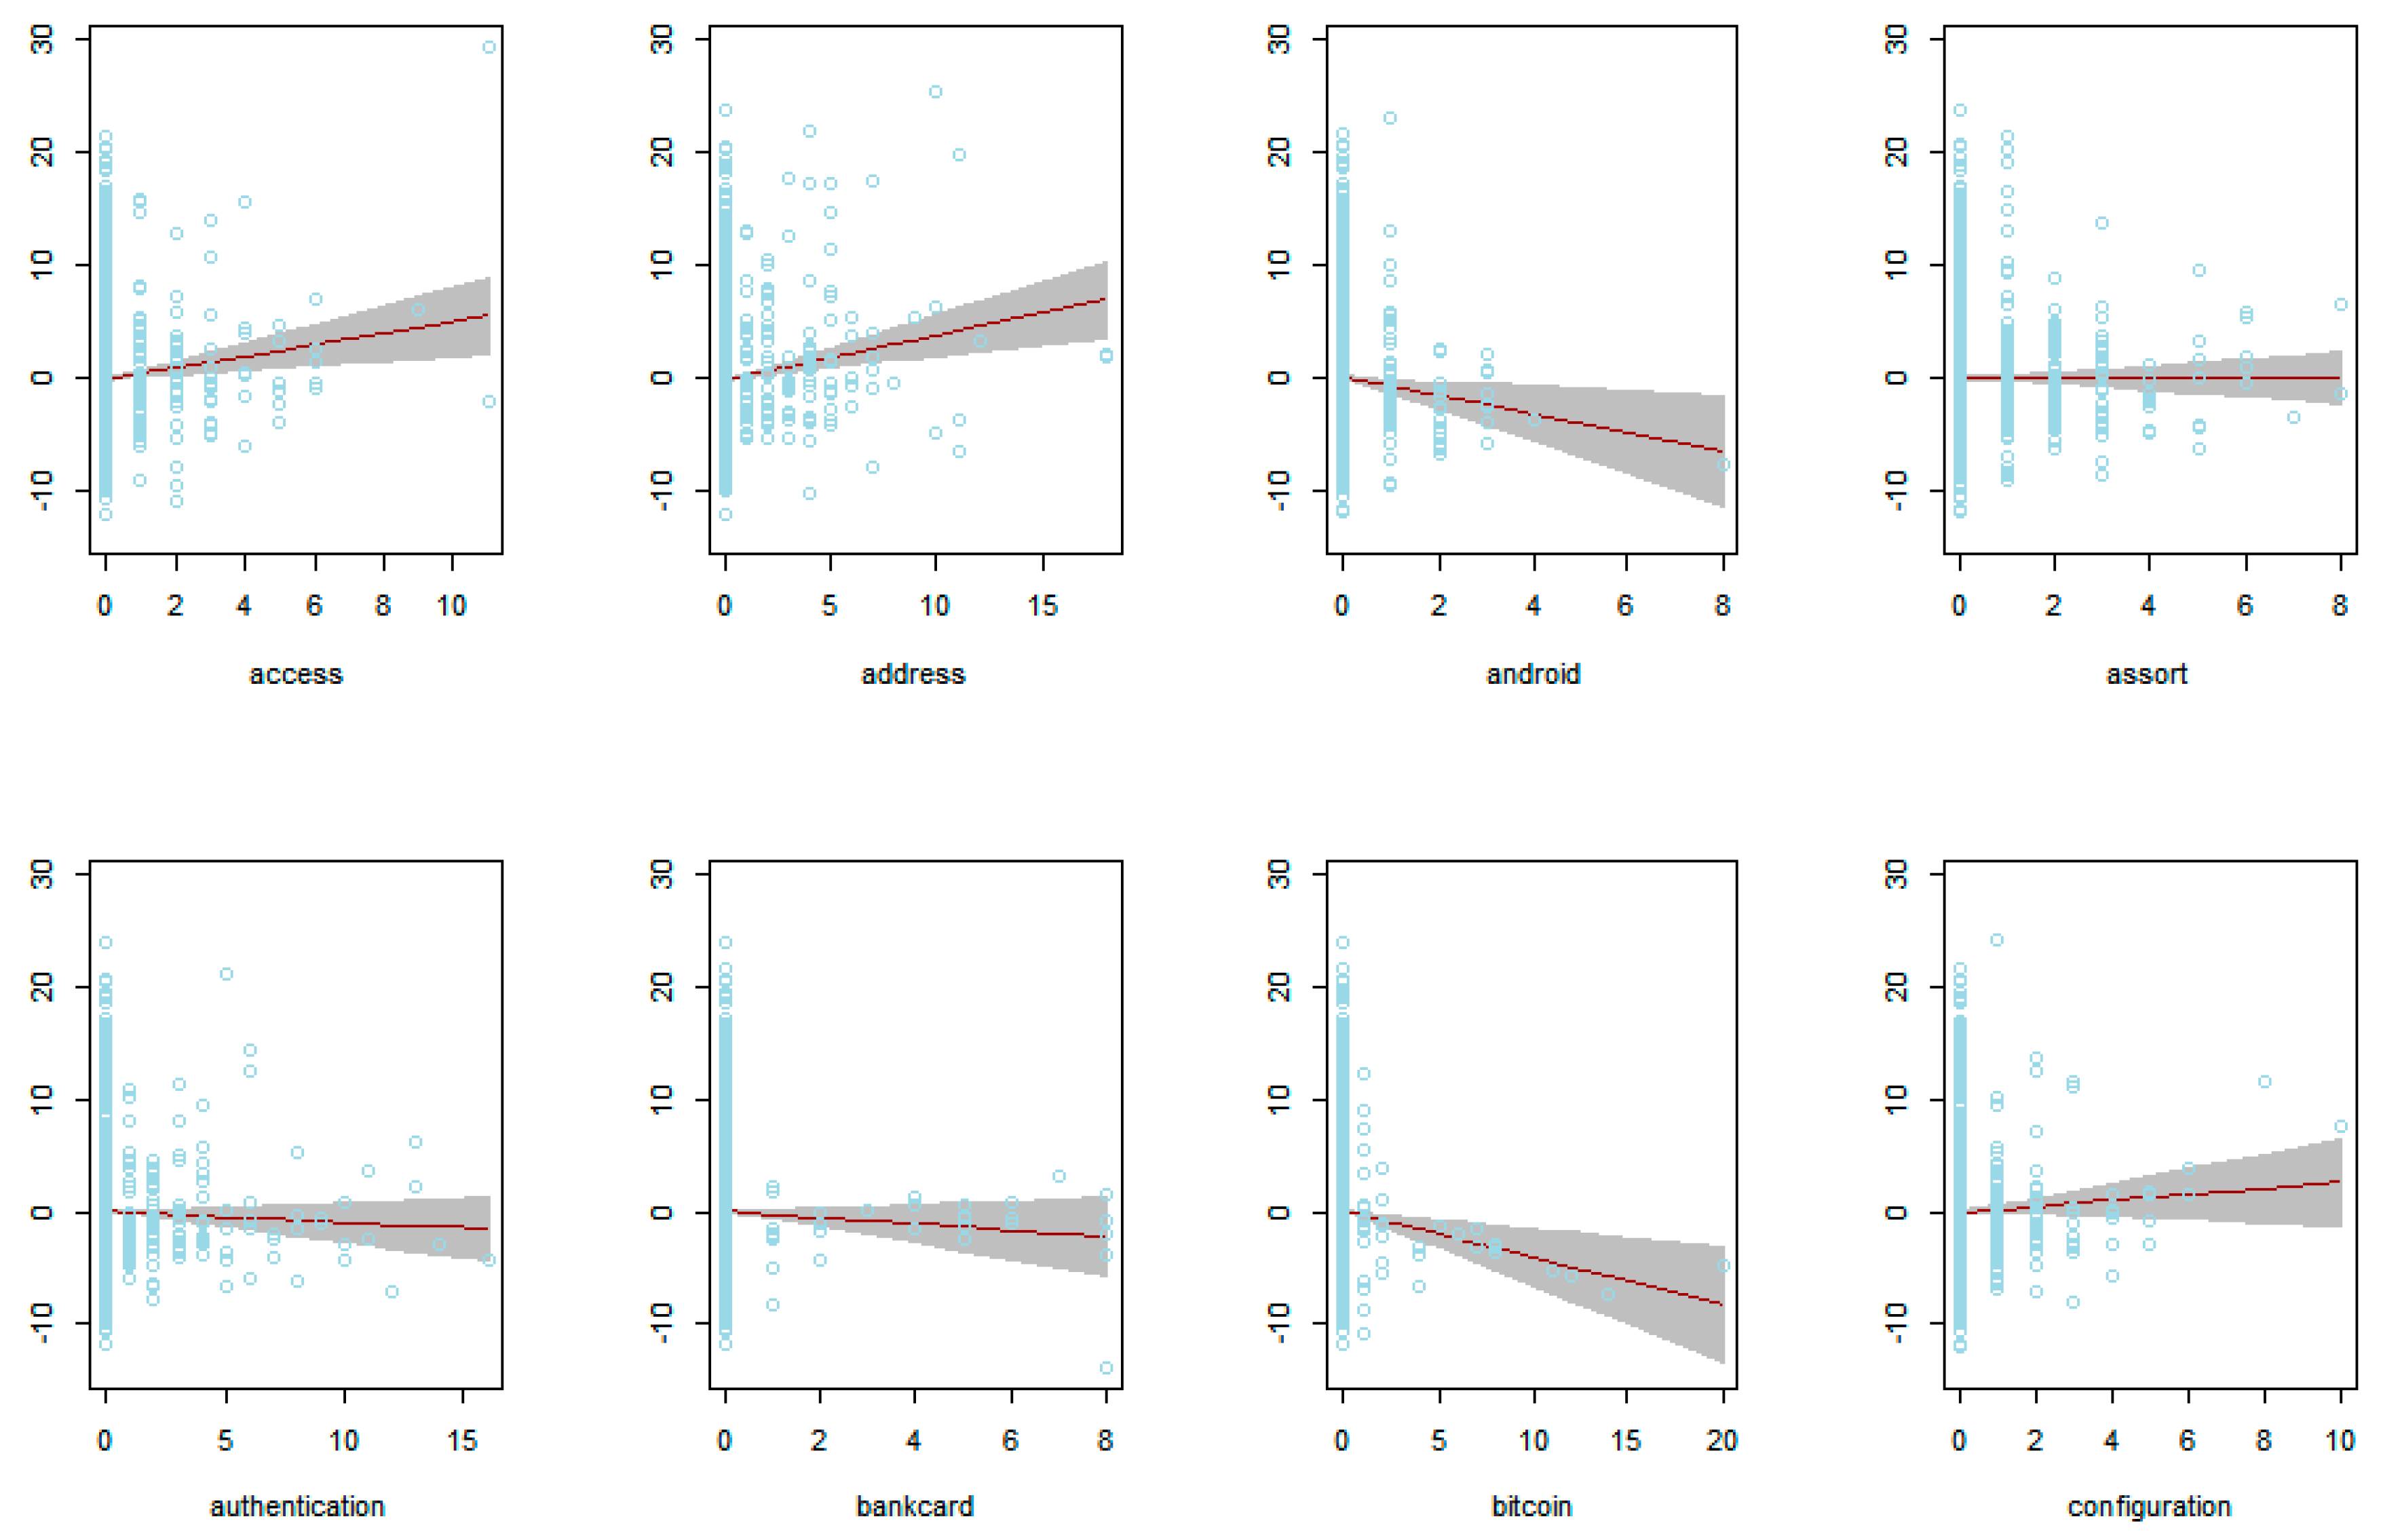
Performing trend analysis of significant keywords for blockchain technology using regression plotting.
Step 5.
Building a technology diagram for understanding sustainability of blockchain technology.
In Step 1, we searched for patent documents related to blockchain technology from patent databases around the world such as The United States Patent and Trademark Office (USPTO) [35]. The search equation for searching blockchain patents was as follows; ((bitcoin or distribution or decentralization or decentral) and (ledger or exchange or database or storage or consensus)) or (bankcard and (authentication and encash)) or cryptocurrency or (crypto and currency) or (coin and cyber) or (virtual and (currency or money)) and blockchain or (block and chain) or network and (secretkey and nonaccount). The searched patents have to be transformed into a structured data type such as patent-keyword matrix for generalized additive modeling. So, we preprocessed the collected patent documents using various text mining methods in Step 2. We used R data language and its provided package for text mining [36,37]. Figure 2 shows our text mining process for making structured data.
This figure illustrates all text mining phases from patent data collection to patent data analysis. Using the collected patent documents, we constructed text corpus and parsed the corpus to build a text database [37]. By extracting technology keywords from the text database, we made a patent-keyword matrix with structured data for patent analysis of GAM. From the structured data in Step 2, we made a patent-keyword matrix consisting of patent and keyword for row (observation) and column (variable), respectively. The columns of this matrix represent technology keywords extracted from the blockchain technology patents, and were used as the dependent and independent variables in GAM. Of course, the dependent variable was the keyword blockchain in our generalized additive modeling. In Step 3, we carried out our generalized additive modeling. First, we found the best GAM among various link functions in Equation (5). We considered Poisson, negative binomial, Poisson inverse Gaussian, and normal distribution as our link functions [38,39,40]. In addition, the best model among competitive GAMs was determined by Akaike information criterion (AIC) and Bayesian information criterion (BIC). AIC and BIC are computed by the following equations [11,38].
AIC = 2 log ( p ( x | θ ^ ) ) + 2 k
BIC = 2 log ( p ( x | θ ^ ) ) + klog ( n )
where θ ^ is the maximum likelihood estimator (MLE) of parameter θ . k and n are the number of parameters and data size, respectively. We had to choose the GAM with the smallest AIC and BIC values. We used the p-value from the best GAM result to select statistically significant variables for the blockchain variable. Finally, we selected the independent variables with p-values less than 0.1 (under 90% confidence level) [41]. In Step 4, we visualized the trend of the significant variable (X-axis) on blockchain keywords (Y-axis) using the result of Step 3. Using the visualization results, we classified explanatory variables for blockchain keywords in positive or negative trends. Lastly, we built a technology diagram using the results of Steps 3 and 4 to understand the sustainability of blockchain technology. Using the results, we can perform management of sustainable technology in the blockchain field.
We also visualized regression plots of explanatory keywords (x) and blockchain (y) using a prediction interval. The 100(1 − α)% prediction interval at x = x 0 is defined in Equation (12) [42,43].
( y ^ 0 t α 2 ( n 1 ) M S R ( 1 + x 0 2 i = 1 n x i 2 ) , y ^ 0 + t α 2 ( n 1 ) M S R ( 1 + x 0 2 i = 1 n x i 2 ) )
where y ^ 0 is prediction value of y at x = x 0 , n is data size, and ( n 1 ) is degree of freedom in t distribution. Mean square residual (MSR) is calculated as follows.
MSR = i = 1 n ( y i y ^ i ) 2 n 1
In Equation (13), y i and y ^ i are observed and predictive values at i. In this paper, we selected the keywords that affect blockchain using the trend and variance values of the prediction confidence interval. Finally, we performed hypothesis testing for feature selection in our proposed model. The null and alternative hypotheses for testing significance of x i are shown as follows [42].
H 0 :   β i = 0         v s .           H 1 :   β i 0
In Equation (14), the null hypothesis H 0 represents the model coefficient of x i ( β i ), which is zero. This means that x i cannot explain response variable y. So, when H 0 is rejected, the explanatory variable is statistically significant, and the variable is selected as a feature for the final model. In general, we used p-value as a criterion of hypothesis testing. The p-value has probability values between 0 to 1, and we can reject H 0 when the p-value is less than 0.1 or 0.05 on 90% or 95% confidence levels [34]. Next, we illustrate how our proposed model can be applied to a real domain by a case study using patent documents related to blockchain. We illustrate the overall procedure of our proposed method in the following figure.
As shown in Figure 3, using the keyword equation of blockchain, we retrieved the patent documents related to blockchain technology from patent databases. Next, we made a patent-keyword matrix using text mining techniques. This matrix was used for patent keyword analysis by generalized additive modeling. To build the technology diagram of blockchain, we used the GAM results and regression plots of keywords. Finally, we found the sustainable technology structure of blockchain from the technology diagram. This can be used for various areas of management of blockchain technology such as R&D planning and new service developments.

4. Case Study Using Patent Data of Blockchain

We collected patent documents related to blockchain technology from patent databases [23,44]. We used patent documents filed and registered by 2020 for our case study. Using text mining techniques, we extracted 96 keywords from the patents related to blockchain technology as follows: “access”, “account”, “address”, “android”, “assign”, “assort”, “authentication”, “authority”, “bankcard”, “bitcoin”, “blockchain”, “carrier”, “central”, “certificate”, “client”, “code”, “communication”, “computer”, “configuration”, “conflict”, “connection”, “content”, “contract”, “creation”, “credit”, “cryptocurrency”, “cryptography”, “currency”, “customer”, “databank”, “database”, “deduction”, “device”, “disconnect”, “distributor”, “emission”, “encash”, “encryption”, “endorse”, “equivalent”, “event”, “exclusive”, “forbid”, “furcation”, “genetics”, “identity”, “importexport”, “inalterable”, “individual”, “infra”, “intelligent”, “joint”, “legal”, “media”, “metadata”, “metric”, “network”, “nonaccount”, “ocsp”, “onhook”, “oscillate”, “overdue”, “passcode”, “pay”, “probability”, “profit”, “program”, “prolong”, “publicaccess”, “publickey”, “rebate”, “recognition”, “redemption”, “safestorage”, “scan”, “secretkey”, “separate”, “sever”, “simplification”, “speed”, “storehouse”, “ledger”, “trace”, “transaction”, “transcript”, “transform”, “transmit”, “tree”, “url”, “utxo”, “variable”, “variation”, “visible”, “voucher”, “wearable”, “word”.
In this paper, we used R data language and its packages for preprocessing based on text mining [36,37]. In our patent preprocessing, we firstly extracted titles and abstracts from the collected patent documents. Next, we built a document-term matrix as structured data for generalized additive modeling. The matrix contained patent and term for row and column, respectively. In addition, an element of the matrix was frequency with which the term in the patent occurred. Using the matrix, we carried out a case study of sustainable technology analysis for blockchain. We built GAMs according to various probability distributions. The keyword blockchain was used as a dependent variable and all other keywords were used as independent variables. Table 2 shows the performance comparison results between GAMs with different distributions.
In Table 2, the AIC value of GAM with negative binomial family is the smallest, so we can select the GAM based on negative binomial as the best model for blockchain technology analysis. In addition, the GAM with negative binomial distribution has the smallest BIC model, this means that the model of the negative binomial is the most like the result of the AIC. Therefore, in this paper, we used generalized additive modeling with negative binomial distribution. Table 3 represents the result of the GAM with negative binomial for blockchain technology analysis based on one dependent variable (keyword blockchain) and 95 independent variables (all remaining keywords excluding keyword blockchain).
In Table 3, we show 32 keywords with p-values less than 0.1. They explain that the dependent variable (keyword blockchain) is statistically significant. Each of the 32 keywords represents a detailed technology for blockchain technology development. For example, the p-value of keyword databank is 0.0019. This means that the technology related to databank affects the technology development of blockchain significantly. Other keyword-based technologies, like databank technology, influence blockchain’s technological development. In this paper, we used the 32 keywords of Table 3 for sustainable technology analysis of blockchain. The keywords of address, android, bankcard, bitcoin, configuration, cryptocurrency, currency, databank, ledger, media, metric, secretkey, trace, transform, and voucher were more significant than others because the p-values of these keywords were less than 0.01 (99% confidence level). Next, we illustrated the regression plots of each keyword and blockchain using the 32 keywords in Table 3. Figure 4 shows the regression plots of keyword group I with access, address, android, assort, authentication, bankcard, bitcoin, and configuration.
In Figure 4, the Y-axis represents the keyword blockchain and the x-axis is one of the 32 keywords of Table 3. In Figure 4, we found the keywords of access, address, and configuration were positively correlated with the keyword blockchain. On the other hand, the slopes of android, bankcard, and bitcoin tended to decrease as blockchain increased. In addition, the predictive variances of android, bitcoin, and configuration were relatively large, because their interval bands for prediction have an increasing trend. Figure 5 illustrates the regression plots of next eight keywords, cryptocurrency, currency, databank, disconnect, distributor, encash, exclusive, and forbid.
Figure 5 shows the trend of each keyword and the confidence interval of the predicted value. In particular, the interval also provides the degree of dispersion (variance) for the prediction. In Figure 5, we knew the keywords of databank, disconnect, encash, and forbid were positively correlated with blockchain, because the slopes of the keywords increased. In addition, we could not find the keywords with large variance of prediction. Next, Figure 6 represents the results of regression plots for the eight keywords genetics, individual, infra, ledger, media, metric, network, and nonaccount.
The keywords of genetics, ledger, media, metric, network, and nonaccount were correlated with blockchain positively. Two keywords, individual and media had larger predictive variance than that of the other keywords in keyword group III. We show the regression plots of the remaining keywords, rebate, scan, secretkey, trace, transform, url, voucher, and wearable, in Figure 7.
The three keywords rebate, transform, and url showed increasing trends in their regression plots. So, the keywords were positively correlated with blockchain. However, the keywords scan, secretkey, trace, voucher, and wearable were negatively correlated with blockchain, because their slopes were decreasing in the regression plots. The predictive variance was relatively large in the keywords rebate, scan, trace, and url. The results of influence of independent variables (32 keywords with statistical significance) on blockchain are shown in Table 4.
In Table 4, we identified how and which keywords correlate with blockchain. Sixteen keywords were positively correlated with blockchain, and 12 keywords were negatively correlated. In addition, only 4 keywords were weakly correlated with blockchain. Table 5 shows the keywords that had a relatively large dispersion of prediction compared to other keywords.
Table 5 shows keywords that had a relatively large dispersion of prediction compared to other keywords. Because the keywords shown in Table 5 fluctuate largely, they had more influence on blockchain than other keywords. Because the keywords configuration, media, rebate, and url in Table 5 belong to the positive-influence group in Table 4, the technologies based on these four keywords were expected to have a lot of influence on technology development of blockchain. In contrast, the keywords android, bitcoin, distributor, individual, scan, and trace in Table 5 are in the negative-influence group in Table 4. Therefore, we have to manage the technologies related to these six keywords efficiently and effectively for sustainability of blockchain technology. Using all previous experimental results, we built a technology diagram as shown in Figure 8.
In this paper, we proposed a methodology for sustainable technology analysis of blockchain using generalized additive modeling. Figure 8 is the final result of our proposed methodology for understanding blockchain technology from point of view of sustainability. The extracted 32 keywords from 96 keywords related to blockchain technology were divided into three classes according to their trend directions: positive, negative, and normal (neutral). The positive trend class had 16 keywords of access, address, configuration, databank, disconnect, encash, forbid, genetics, ledger, media, metric, network, nonaccount, rebate, transform, and url, and we use dthe technologies based on these keywords for collaborating with blockchain technology. Next, four keywords, assort, authentication, exclusive, and infra, represented normal or neutral trend on blockchain. So, we considered the technologies related to these keywords as a technological field by general management. The most important technologies to be dealt with for sustainable technology management of blockchain are the keyword class with a negative trend, including the 12 keywords android, bankcard, bitcoin, cryptocurrency, currency, distributor, individual, scan, secretkey, trace, voucher, and wearable. Therefore, we have to deal with the various technologies based on these keywords effectively and efficiently.
In development of target technology, we have to consider positive and negative technologies on the target technology at the same time. In addition, the technologies with normal trends with target technology are meaningful. In Figure 7, we represent the positive, negative, and normal technologies influencing blockchain technology for understanding sustainability of blockchain. This means that we can manage the blockchain technology more efficiently than previous technology analysis approaches allowed. Technology experts can use this diagram for their technology management of blockchain technology.

5. Discussion

We selected blockchain as the target technology in this paper because this technology is very important and will continue to be so in the future. We studied the sustainability of blockchain technology by analyzing technological keywords extracted from patent documents related to blockchain technology. To analyze the patent documents, we constructed a patent-keyword matrix as the structured data for statistical analysis. Each element of this matrix was the frequency with which a keyword occurred in the patent documents. In this matrix, most elements were zero values, so the matrix was skewed to zero and sparse. However, in the previous research, we found that few attempts had been made to solve this problem. In our research, we also met this skewed problem in our patent data. In this paper, we proposed a methodology of blockchain technology analysis using GAM, and we overcame the problem and analyzed the patent data of blockchain successively. This paper contributes to the technology analysis field of patent document analysis. We did not consider objective and efficient metrics for evaluating the validity of the proposed technology analysis model such as accuracy or mean squared error (MSE). Instead, we illustrated how the proposed research can be applied to practical domains of blockchain. To develop the metric, we should consider a data science approach to technology analysis. Using various evaluation methods such as resampling of bootstrap, we plan to make an objective metric for verifying the performance of technology analysis in our future works.

6. Conclusions

In this paper, we proposed a technology analysis method for the sustainability of blockchain technology. We collected patent documents related to blockchain technology for technology analysis. First, we preprocessed the documents by text mining techniques and built structured data for statistical data analysis. The structured data was a matrix in which patent documents and technology keywords made up rows and columns, respectively. Each element of this matrix represented the frequency at which the keywords appeared in the patent documents. In general, this patent-keyword matrix was very sparse because most elements were zero values. So, the matrix was extremely skewed. This problem influences the performance degradation of patent analysis models. To solve this problem, we considered generalized additive modeling for blockchain technology analysis. From the experimental results, we made a technology diagram of blockchain. This shows various technological relationships between sub-technologies based on keywords for sustainability of blockchain technology. The diagram can be used for R&D planning, new service developments, etc. in the MOT of blockchain.
In our future works, we will study more advanced methods for technology analysis of blockchain. We will use research papers related to blockchain as well as patents. We will illustrate business applications of blockchain and apply new developed models to improve the competitiveness and sustainability of blockchain technology.

Author Contributions

S.J. designed this study and collected the data for the experiment. S.P. preprocessed the data and selected valid patents and analyzed the data to show the performance of the study. S.J. and S.P. wrote the paper and carried out all the research steps. All authors have read and agreed to the published version of the manuscript.

Funding

This research was supported by Basic Science Research Program through the National Research Foundation of Korea (NRF) funded by the Ministry of Education (NRF-2020R1I1A3A04037885).

Acknowledgments

We thank anonymous reviewers for valuable suggestions and comments.

Conflicts of Interest

The authors declare no conflict of interest.

References

  1. Roper, A.T.; Cunningham, S.W.; Porter, A.L.; Mason, T.W.; Rossini, F.A.; Banks, J. Forecasting and Management of Technology; John Wiley & Sons: Hoboken, NJ, USA, 2011. [Google Scholar]
  2. Choi, J.; Jun, S.; Park, S. A patent analysis for sustainable technology management. Sustainability 2016, 8, 688. [Google Scholar] [CrossRef] [Green Version]
  3. Park, S.; Jun, S. Statistical Technology Analysis for Competitive Sustainability of Three Dimensional Printing. Sustainability 2017, 9, 1142. [Google Scholar] [CrossRef] [Green Version]
  4. Kim, J.; Jun, S.; Jang, D.; Park, S. An Integrated Social Network Mining for Product-based Technology Analysis of Apple. Ind. Manag. Data Syst. 2017, 117, 2417–2430. [Google Scholar] [CrossRef]
  5. Kim, J.; Sun, B.; Jun, S. Sustainable Technology Analysis Using Data Envelopment Analysis and State Space Models. Sustainability 2019, 11, 3597. [Google Scholar] [CrossRef] [Green Version]
  6. Jun, S.; Park, S.; Jang, D. Document Clustering Method Using Dimension Reduction and Support Vector Clustering to Overcome Sparseness. Expert Syst. Appl. 2014, 41, 3204–3212. [Google Scholar] [CrossRef]
  7. Jun, S. Bayesian Count Data Modeling for Finding Technological Sustainability. Sustainability 2018, 10, 3220. [Google Scholar] [CrossRef] [Green Version]
  8. Uhm, D.; Ryu, J.; Jun, S. Patent Data Analysis of Artificial Intelligence Using Bayesian Interval Estimation. Appl. Sci. 2020, 10, 570. [Google Scholar] [CrossRef] [Green Version]
  9. Hastie, T.J.; Tibshirani, R.J. Generalized Additive Models; Chapman & Hall: New York, NY, USA, 1990. [Google Scholar]
  10. Stasinopoulos, D.M.; Rigby, R.A. Generalized Additive Models for Location Scale and Shape (GAMLSS) in R. J. Stat. Softw. 2007, 23, 1–46. [Google Scholar] [CrossRef] [Green Version]
  11. Murphy, K.P. Machine Learning: A Probabilistic Perspective; MIT Press: Cambridge, MA, USA, 2012. [Google Scholar]
  12. Efron, B.; Hastie, T. Computer Age Statistical Inference; Cambridge University Press: New York, NY, USA, 2016. [Google Scholar]
  13. Google Trends. Available online: https://trends.google.com/trends (accessed on 21 September 2020).
  14. Melanie, S. Blockchain: Blueprint for a New Economy, 1st ed.; O’Reilly: Farnham, UK, 2015. [Google Scholar]
  15. Chuen, D.L.K. Handbook of Digital Currency: Bitcoin, Innovation, Financial Instruments, and Big Data; Elsevier: Waltham, MA, USA, 2015. [Google Scholar]
  16. Aderibole, A.; Aljarwan, A.; Rehman, M.H.U.; Zeineldin, H.H.; Mezher, T.; Salah, K.; Damiani, E.; Svetinovic, D. Blockchain Technology for Smart Grids: Decentralized NIST Conceptual Model. IEEE Access 2020, 8, 43177–43190. [Google Scholar] [CrossRef]
  17. Nadarajah, S.; Chu, J. On the inefficiency of Bitcoin. Econ. Lett. 2017, 150, 6–9. [Google Scholar] [CrossRef] [Green Version]
  18. Syed, T.A.; Alzahrani, A.; Jan, S.; Siddiqui, M.S.; Nadeem, A.; Alghamdi, T. A Comparative Analysis of Blockchain Architecture and its Applications: Problems and Recommendations. IEEE Access 2019, 7, 176838–176869. [Google Scholar] [CrossRef]
  19. Lu, H.; Huang, K.; Azimi, M.; Guo, L. Blockchain Technology in the Oil and Gas Industry: A Review of Applications, Opportunities, Challenges, and Risks. IEEE Access 2019, 7, 41426–41444. [Google Scholar] [CrossRef]
  20. Vranken, H. Sustainability of bitcoin and blockchains. Curr. Opin. Environ. Sustain. 2017, 28, 1–9. [Google Scholar] [CrossRef] [Green Version]
  21. Giungato, P.; Rana, R.; Tarabella, A.; Tricase, C. Current Trends in Sustainability of Bitcoins and Related Blockchain Technology. Sustainability 2017, 9, 2214. [Google Scholar] [CrossRef] [Green Version]
  22. Hussien, H.M.; Yasin, S.M.; Udzir, S.N.I.; Zaidan, A.A.; Zaidan, B.B. A Systematic Review for Enabling of Develop a Blockchain Technology in Healthcare Application: Taxonomy, Substantially Analysis, Motivations, Challenges, Recommendations and Future Direction. J. Med. Syst. 2019, 43, 320. [Google Scholar] [CrossRef] [PubMed]
  23. Kumar, T.; Ramani, V.; Ahmad, I.; Braeken, A.; Harjula, E.; Ylianttila, M. Blockchain Utilization in Healthcare: Key Requirements and Challenges. In Proceedings of the 2018 IEEE 20th International Conference on e-Health Networking, Applications and Services, Ostrava, Czech Republic, 12 November 2018; pp. 1–7. [Google Scholar]
  24. Alessandretti, L.; ElBahrawy, A.; Aiello, L.M.; Baronchelli, A. Forecasting of Cryptocurrency Prices Using Machine Learning. Advanced Studies of Financial Technologies and Cryptocurrency Markets; Springer: Berlin/Heidelberg, Germany, 2018; p. 8983590. [Google Scholar]
  25. Maksimov, D.B.; Yakimov, I.A.; Kuznetsov, A.S. Statistical model checking for blockchain-based applications. IOP Conf. Ser. Mater. Sci. Eng. 2020, 734, 012152. [Google Scholar] [CrossRef]
  26. James, G.; Witten, D.; Hastie, T.; Tibshirani, R. An Introduction to Statistical Learning with Applications in R; Springer: New York, NY, USA, 2013. [Google Scholar]
  27. Sott, M.K.; Furstenau, L.B.; Kipper, L.M.; Giraldo, F.D.; Lopez-Robles, J.R.; Cobo, M.J.; Zahid, A.; Abbasi, Q.H.; Imran, M.A. Precision Techniques and Agriculture 4.0 Technologies to Promote Sustainability in the Coffee Sector: State of the Art, Challenges and Future Trends. IEEE Access 2020, 8, 149854–149867. [Google Scholar] [CrossRef]
  28. Escobar, N.; Laibach, N. Sustainability check for bio-based technologies: A review of process-based and life cycle approaches. Renew. Sustain. Energy Rev. 2021, 135, 110213. [Google Scholar] [CrossRef]
  29. Li, W.; Ren, X.; Ding, S.; Dong, L. A multi-criterion decision making for sustainability assessment of hydrogen production technologies based on objective grey relational analysis. Int. J. Hydrog. Energy 2020, 45, 34385–34395. [Google Scholar] [CrossRef]
  30. Tomatis, M.; Jeswani, H.K.; Stamford, L.; Azapagic, A. Assessing the environmental sustainability of an emerging energy technology: Solar thermal calcination for cement production. Sci. Total Environ. 2020, 742, 140510. [Google Scholar] [CrossRef]
  31. Bai, C.; Dallasega, P.; Orzes, G.; Sarkis, J. Industry 4.0 technologies assessment: A sustainability perspective. Int. J. Prod. Econ. 2020, 229, 107776. [Google Scholar] [CrossRef]
  32. Tasleem, M.; Khan, N.; Nisar, A. Impact of technology management on corporate sustainability performance the mediating role of TQM. Int. J. Qual. Reliab. Manag. 2020, 36, 1574–1599. [Google Scholar] [CrossRef]
  33. Schinckus, C. The good, the bad and the ugly: An overview of the sustainability of blockchain technology. Energy Res. Soc. Sci. 2020, 69, 101614. [Google Scholar] [CrossRef]
  34. Wood, S.N. Generalized Additive Models: An Introduction with R; Chapman & Hall/CRC: London, UK, 2017. [Google Scholar]
  35. USPTO. The United States Patent and Trademark Office. Available online: http://www.uspto.gov (accessed on 15 March 2020).
  36. R Development Core Team. R: A Language and Environment for Statistical Computing; R Foundation for Statistical Computing: Vienna, Austria, 2019; Available online: http://www.R-project.org (accessed on 9 April 2020).
  37. Feinerer, I.; Hornik, K. Package ‘tm’ Ver. 0.7–5, Text Mining Package, CRAN of R Project. 2018. Available online: https://cran.r-project.org/web/packages/tm/tm.pdf (accessed on 1 January 2020).
  38. Gelman, A.; Carlin, J.B.; Stern, H.S.; Dunson, D.B.; Vehtari, A.; Rubin, D.B. Bayesian Data Analysis, 3rd ed.; Chapman & Hall/CRC Press: Boca Raton, FL, USA, 2013. [Google Scholar]
  39. Hilbe, J.M. Negative Binomial Regression, 2nd ed.; Cambridge University Press: Cambridge, UK, 2011. [Google Scholar]
  40. Zha, L.; Lord, D.; Zou, Y. The Poisson inverse Gaussian (PIG) generalized linear regression model for analyzing motor vehicle crash data. J. Transp. Saf. Secur. 2016, 8, 18–35. [Google Scholar] [CrossRef] [Green Version]
  41. Ross, S.M. Introduction to Probability and Statistics for Engineers and Scientists, 4th ed.; Elsevier: Seoul, Korea, 2012. [Google Scholar]
  42. Montgomery, D.C.; Peck, E.A.; Vining, G.G. Introduction to Linear Regression Analysis; John Wiley & Sons: Hoboken, NJ, USA, 2012. [Google Scholar]
  43. Chatterjee, S.; Hadi, A.S. Regression Analysis by Example, 5th ed.; Wiley: Hoboken, NJ, USA, 2012. [Google Scholar]
  44. WIPSON. WIPS Corporation. Available online: http://global.wipscorp.com (accessed on 15 January 2020).
Figure 1. Google trends result of blockchain technology.
Sustainability 12 10501 g001
Figure 2. Text mining process for constructing structured data. GAM: generalized additive model.
Sustainability 12 10501 g002
Figure 3. Proposed sustainable technology analysis of blockchain.
Sustainability 12 10501 g003
Figure 4. Regression plots of keyword group I-access, address, android, assort, authentication, bankcard, bitcoin, and configuration.
Sustainability 12 10501 g004
Figure 5. Regression plots of keyword group II-cryptocurrency, currency, databank, disconnect, distributor, encash, exclusive, and forbid.
Sustainability 12 10501 g005
Figure 6. Regression plots of keyword group III-genetics, individual, infra, ledger, media, metric, network, and nonaccount.
Sustainability 12 10501 g006
Figure 7. Regression plots of keyword group IV-rebate, scan, secretkey, trace, transform, url, voucher, and wearable.
Sustainability 12 10501 g007
Figure 8. Technology diagram of blockchain.
Sustainability 12 10501 g008
Table 1. Definitions of blockchain.
AuthorsDefinitions of Blockchain
Melanie (2015)Open transparent and decentralized database
Aderibole et al. (2020)Distributed data structure whereby all data items are permanently recorded after they are verified by majority of the nodes in peer-to-peer network
Chuen (2015)Sequence of blocks which holds a complete list of transaction records like conventional public ledger
Table 2. Comparison of GAMs according to probability distributions.
Evaluation MeasurePoissonNegative BinomialPoisson Inverse GaussianNormal
AIC7772560556477213
BIC8260609761407705
Table 3. Analysis result of the GAM with negative binomial distributions.
Keywordp-ValueKeywordp-ValueKeywordp-ValueKeywordp-Value
access0.0464cryptocurrency0.0002genetics0.0191rebate0.0475
address0.0001currency0.0002individual0.0292scan0.0340
android0.0007databank0.0019infra0.0147secretkey0.0083
assort0.0299disconnect0.0599ledger0.0001trace0.0003
authentication0.0246distributor0.0907media0.0074transform0.0049
bankcard0.0003encash0.0116metric0.0001url0.0630
bitcoin0.0001exclusive0.0115network0.0223voucher0.0001
configuration0.0021forbid0.0301nonaccount0.0134wearable0.0716
Table 4. Influences of independent variables on blockchain.
InfluenceIndependent Variables
Positive (16)access, address, configuration, databank, disconnect, encash, forbid, genetics, ledger, media, metric, network, nonaccount, rebate, transform, url
Neutral (4)assort, authentication, exclusive, infra
Negative (12)android, bankcard, bitcoin, cryptocurrency, currency, distributor, individual, scan, secretkey, trace, voucher, wearable
Table 5. Influences of independent variables on blockchain.
GroupKeyword
Iandroid, bitcoin, configuration
IIdistributor
IIIindividual, media
IVrebate, scan, trace, url
Publisher’s Note: MDPI stays neutral with regard to jurisdictional claims in published maps and institutional affiliations.

