Article

Stakeholders Mapping for Sustainable Biofuels: An Innovative Procedure Based on Computational Text Analysis and Social Network Analysis

1
Dipartimento di Psicologia dei Processi di Sviluppo e Socializzazione, Sapienza Università di Roma, 00185 Roma, Italy
2
Integrated Research on Energy, Environment and Society, Faculty of Science and Engineering, University of Groningen, 9747 Groningen, The Netherlands
3
CIRPA Centro Interuniversitario di Ricerca in Psicologia Ambientale, Sapienza Università di Roma, 00185 Roma, Italy
*
Authors to whom correspondence should be addressed.
Sustainability 2020, 12(24), 10317; https://doi.org/10.3390/su122410317
Submission received: 11 October 2020 / Revised: 30 November 2020 / Accepted: 4 December 2020 / Published: 10 December 2020

Abstract

:
The identification and engagement of stakeholders is a challenge whose outcomes have a strong impact on a project’s success. This is even more relevant when the project concerns the introduction of sustainable technologies; these technologies are often less competitive on the market than traditional ones, both in terms of development complexity and production costs. This paper presents a stakeholder identification and mapping procedure, based on an Interest x Influence model, that emphasizes a quantitative methodological approach. The method has been applied on publicly available online data to identify and map potential stakeholders of a European research project aiming at creating a new biomass-derived biofuel. A semi-supervised procedure, built by combining computational text analysis and social network analysis techniques, has been used to calculate Interest and Influence scores for each potential stakeholder toward the project. The results show that stakeholders can be ranked on both dimensions and mapped on a bi-dimensional space according to their level of Interest and Influence. Within projects aiming at developing technologies for sustainability in which a wide range of stakeholders are involved at a transnational level, this stakeholder mapping technique provides a useful tool that can be adopted even with little knowledge on specific fields of application. A further asset of this approach lies in the possibility of profiling stakeholders on the basis of their Interest in the target project: this allows us to know the contents of a stakeholder (or stakeholders category) Interest, and therefore to have useful information for addressing the targeted stakeholder by means of a content design which is based on specific content categories, substantiating the stakeholder(s) Interest in the specific project.

1. Introduction

Stakeholders strongly influence a project’s success. This is particularly true for complex projects, and this is very relevant for any project aiming at introducing new technologies for sustainability, such as in the field of sustainable transports. This topic is addressed by many contemporary research projects worldwide. Within such a global trend, this study—part of the EC Horizon 2020 Research and Innovation Programme called “ABC-Salt” (Advanced Biomass Catalytic Conversion to Middle Distillates in Molten Salts)—aims to validate at laboratory scale a novel route to produce sustainable liquid biofuels (middle distillates) from various lignocellulosic waste streams for the transport industry, both on roads (biodiesel) and in the air (jet fuel). The design, production and social introduction of new biofuels requires taking into account multiple and heterogeneous stakeholders, from the economic, political and social context; moreover, such a process involves emerging markets, which are underexplored and constantly evolving. Within such a scenario, stakeholder analysis techniques became familiar within environmental social sciences literature because of their key relevance for project management: as a result, the literature in the field offers a wide range of tools to manage and engage with potentially (non-)supportive stakeholders. It is therefore crucial to identify and map the relevant stakeholders before managing and engaging them: this means, first of all, to deploy a stakeholder analysis or mapping.

1.1. Stakeholder Analysis

According to Grimble and Wellard, “stakeholder analysis can be defined as a holistic approach or procedure for gaining an understanding of a system, by means of identifying the key actors or stakeholders and assessing their respective interests in the system” [1] (p. 175). Reed et al. [2] defined stakeholder mapping (or stakeholder analysis) as a process that defines aspects of a social and natural phenomenon affected by a decision or action: it identifies individuals, groups and organizations who are affected by, or can affect, those parts of the phenomenon; and it prioritizes these individuals and groups for involvement in a decision-making process.
The methods used to identify stakeholders range from semi-structured interviews to the experts’ opinion in the field under investigation. Snow-ball sampling and top-down/bottom-up categorization are also among the methods used to classify stakeholders and to investigate stakeholders’ relationships [2,3]. Typically, once key stakeholders—namely those with significant influence within an organization relevant for the project—are identified, they are translated into a visual representation (a table or a graph) [4]. Several models have been proposed to organize a sample of identified stakeholders [5]: alternatives range from the simplest to the more complex, and they can be justified according to different purposes. In the present study, a classical model for stakeholders mapping was chosen: the Mendelow’s matrix [2]. This choice was motivated by its being one of the most used among the classical models, due to its parsimonious structure and to its wider adoption across a range of contexts [6]. This model is based on a 2 × 2 matrix which considers two main dimensions useful to describe each stakeholder given a certain project: namely, its Interest in the specific project and its Influence or power on the specific project. The grid resulting from these two dimensions creates four quadrants in which the stakeholders are inserted according to their degree of Interest/Influence in the project. This model is not used only for mapping stakeholders. It is also adopted to assess the social acceptance of sustainable technology [7,8].
However, such a model’s adoption and implementation typically follow qualitative methodologies, where Interest and/or Influence are operationalized by means of interpretative and non-quantitative, or at least non-automatic, procedures [9,10]. In order to avoid a “subjective” qualitative approach in the operationalization of both dimensions considered by the Mendelow’s matrix, a quantitative approach is adopted in the present study by means of the general framework of Social Network Analysis (SNA). Therefore, the main innovation within the present contribution lies in the quantitative and automatic procedures adopted to operationalize both dimensions of the Mendelow’s matrix, namely Interest (by means of a Structural Topic Model) and Influence (by means of Social Network Analysis). In fact, to compute both dimensions of “Interest” and “Influence”, in order to finally map the project’s stakeholders, an innovative methodology for such a purpose is here proposed, by adopting a mainly quantitative approach relying on a semi-supervised procedure which consists of the following two main phases.
(1)
A computational text analysis technique for the identification of each stakeholder’s discursive topics, capable of detecting their interests in terms of such topics’ matching degree with the ABC-Salt project’s core contents. To operationalize the “Interest” dimension, keywords are extracted from the core ABC-Salt project’s publicly produced concepts and contents. Then, the core contents of the ABC-Salt project are extracted from both Factiva and ProQuest, two well-known digital databases of business contents frequently used as data source for management studies [11,12,13]. Finally, a Structural Topic Model (STM) is applied to highlight topics relevant for the ABC-Salt project’s related contents. The “Interest” dimension of the ABC-Salt stakeholders is then calculated through the adherence between such ABC-Salt-related topics and the stakeholders’ publicly produced contents: specifically, it is operationalized as the Evidence Lower Bound [14,15,16], i.e., ELBO, an index of fit between a stakeholder’s textual content and the ABC-Salt topic model. In sustainability acceptance terms, it is important to know to what extent the contents characterizing each stakeholder overlap with the contents of the actor proposing the new sustainable technology.
(2)
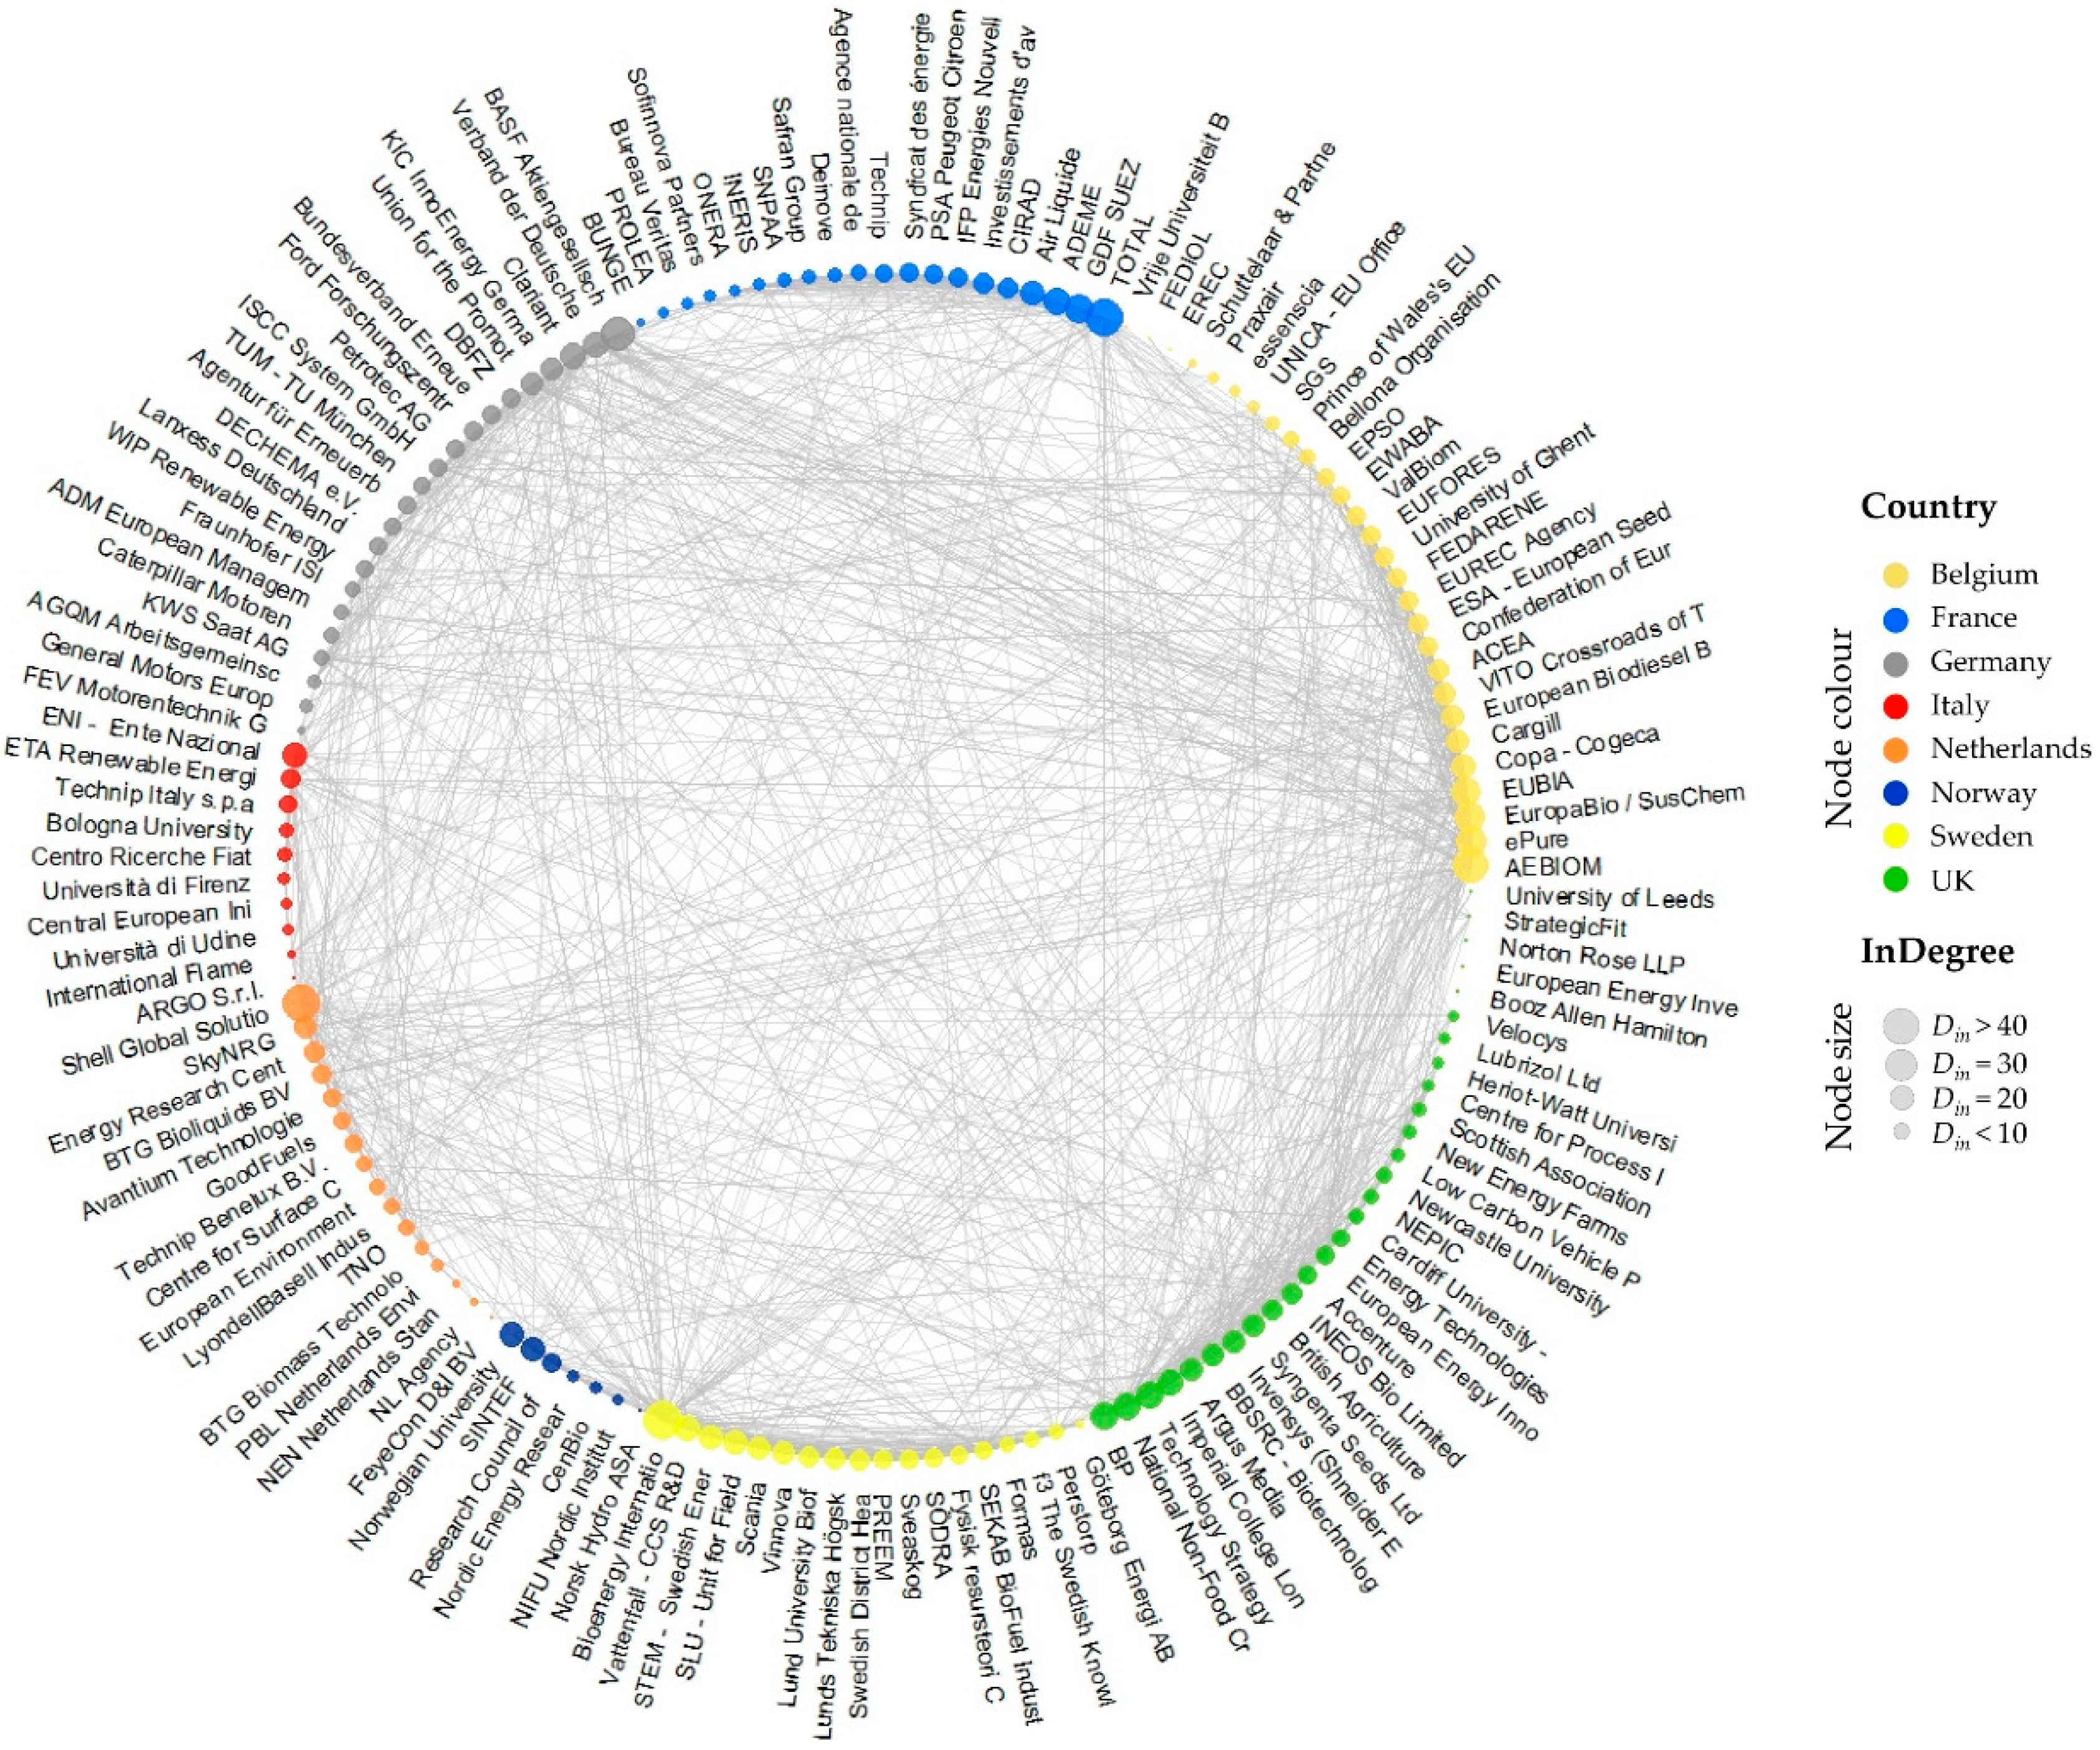
A quantitative SNA approach for the construction of the stakeholder network. To operationalize the dimension of “Influence”, instead, a preliminary search of the ABC-Salt project’s potential stakeholders is made from the online database ETIP (European Technology and Innovation Platform, in particular the ETIP Bioenergy: http://biofuelstp.eu/); then, through Twitter API’s (Application Programming Interface, a set of functions and procedures allowing the creation of applications that access Twitter features or data), information is extracted from the specific stakeholders identified (see Section 2.2). This allows us to build a network based on mutual relations to enable the computation of “Influence” through the In-degree Centrality index. In sustainability acceptance terms, it is important to know to what extent each stakeholder is central, i.e., influent, within the social network of stakeholders which are relevant for the proposed new sustainable technology.

1.1.1. Structural Topic Model

In the last decade, machine-assisted text analysis tools have found an excellent context of application in terms of Big Data [17]. In fact, the possibility of operating on large corpora has made it possible to overcome (or at least overlook) problems deriving from stylistic and lexical variability, thereby increasing the accuracy of the instrument. Moreover, the computational analysis of textual data has allowed for the overcoming of the cognitive limits involved in human coding, increasing the possibilities of studying large-scale economic and social phenomena [18]. If correctly used, topic modeling provides an efficient reading of the text and high substantial interpretability of the latent topics in it. This guarantees at the same time a lower impact of the biases implied by textual human coding. The Structural Topic Model (STM) [19,20,21] represents a recent evolution in the field of computational textual analysis methods.
Like other topic models, the STM is a generative model of word counts. It is possible to explore textual corpora in search of latent semantic structures through a quantitative approach and a semi-supervised procedure. These semantic regularities, representative of topics, are recurring patterns of terms, i.e., clusters of words, characterized by high reciprocal co-occurrence. Unlike the traditional manual coding of texts, the algorithm underlying the generative process allows us to estimate the optimal number of topics, the probability of occurrence of terms within them and the distribution of these topics in the corpus. This allows, at the same time, for the minimization of human intervention. The STM enables the use of metadata as parameters involved in the definition of the topics. The metadata are able to influence the content (topical content) and the proportion (topic prevalence) in the corpus [14].

1.1.2. Social Network Analysis

Social Network Analysis (SNA) examines any relationship within a set of actors, i.e., within a social network composed of actors (nodes) connected by relations (links): they are described in terms of attributes emerging from the links between the nodes, by means of mathematical formulas for the study of line models according to graph theory [22].
The SNA approach is particularly useful in representing and analyzing, through a social graph, any kind of interaction and information transfer within a group of users connected by any media, such as social media, for example [23]. The social graph or sociogram is a graphical representation of the map of actors and their relationships. The fundamental concepts at the basis of its construction are: (i) the actors, i.e., social entities (whether individuals, companies, communities, organizational units, etc.) represented by “nodes” (usually dots); and (ii) the relational link or the connection between two actors, represented by an arc that connects the two nodes (typically a line). Any social network is therefore a finite set of actors and the relationships that unite them. Among the basic statistics used in the SNA approach, there are density and centrality. Density is used as a general model of network cohesion. From the mathematical point of view, it is the proportion of present bonds on all possible bonds. Centrality allows us to define the positioning of any actor within its own network in relational terms. The centrality of a node can be based on different criteria, such as the degree (how many entry/exit connections it has), the closeness to the other nodes or the basis of its being intermediate between the nodes [24].
Previous literature on stakeholder analysis in which the Social Network Analysis approach is taken as a measurement tool typically considers the centrality developed by Freeman [24] as a basic indicator to study the relationships between the actors. Centrality assesses the degree to which stakeholders are interconnected. From this point of view, Social Network Analysis is particularly suitable for identifying different evaluation criteria, such as the influence generated on other stakeholders or within a project, their level of involvement and authoritativeness [25]. The power of the stakeholders, their importance and the level with which the stakeholders are able to mobilize a network and to influence other stakeholders is therefore assumed by the Centrality measure.
Social Network Analysis has shown that actors with strong links tend to influence each other more than those with weak links, and therefore it is easier for the former to share resources and effectively communicate information and tasks [26]. The stakeholders mapping framework designed for the ABC-Salt project aims to capture the relational structure existing between its potential stakeholders, as drawn from a given broad set of them. Therefore, the Social Network Analysis represents here the ideal approach to understand and analyze the processes of mutual influence taking place between the relevant actors [27].

1.2. Aims

According to the above-mentioned two-phase process, two corresponding main aims are envisaged and targeted via two different automatic procedures, respectively based on STM and on SNA, with a third final aim given by their crossing:
  • To identify a limited amount of topics capable to describe the ABC-Salt project’s main sustainability contents and then to measure, within a given stakeholders network, the degree by which each stakeholder’s produced textual data overlap with such project’s topic contents (by means of the Evidence Lower Bound index);
  • To identify, within a given stakeholders network on that sustainability issue, each stakeholder’s centrality (by means of the In-degree index);
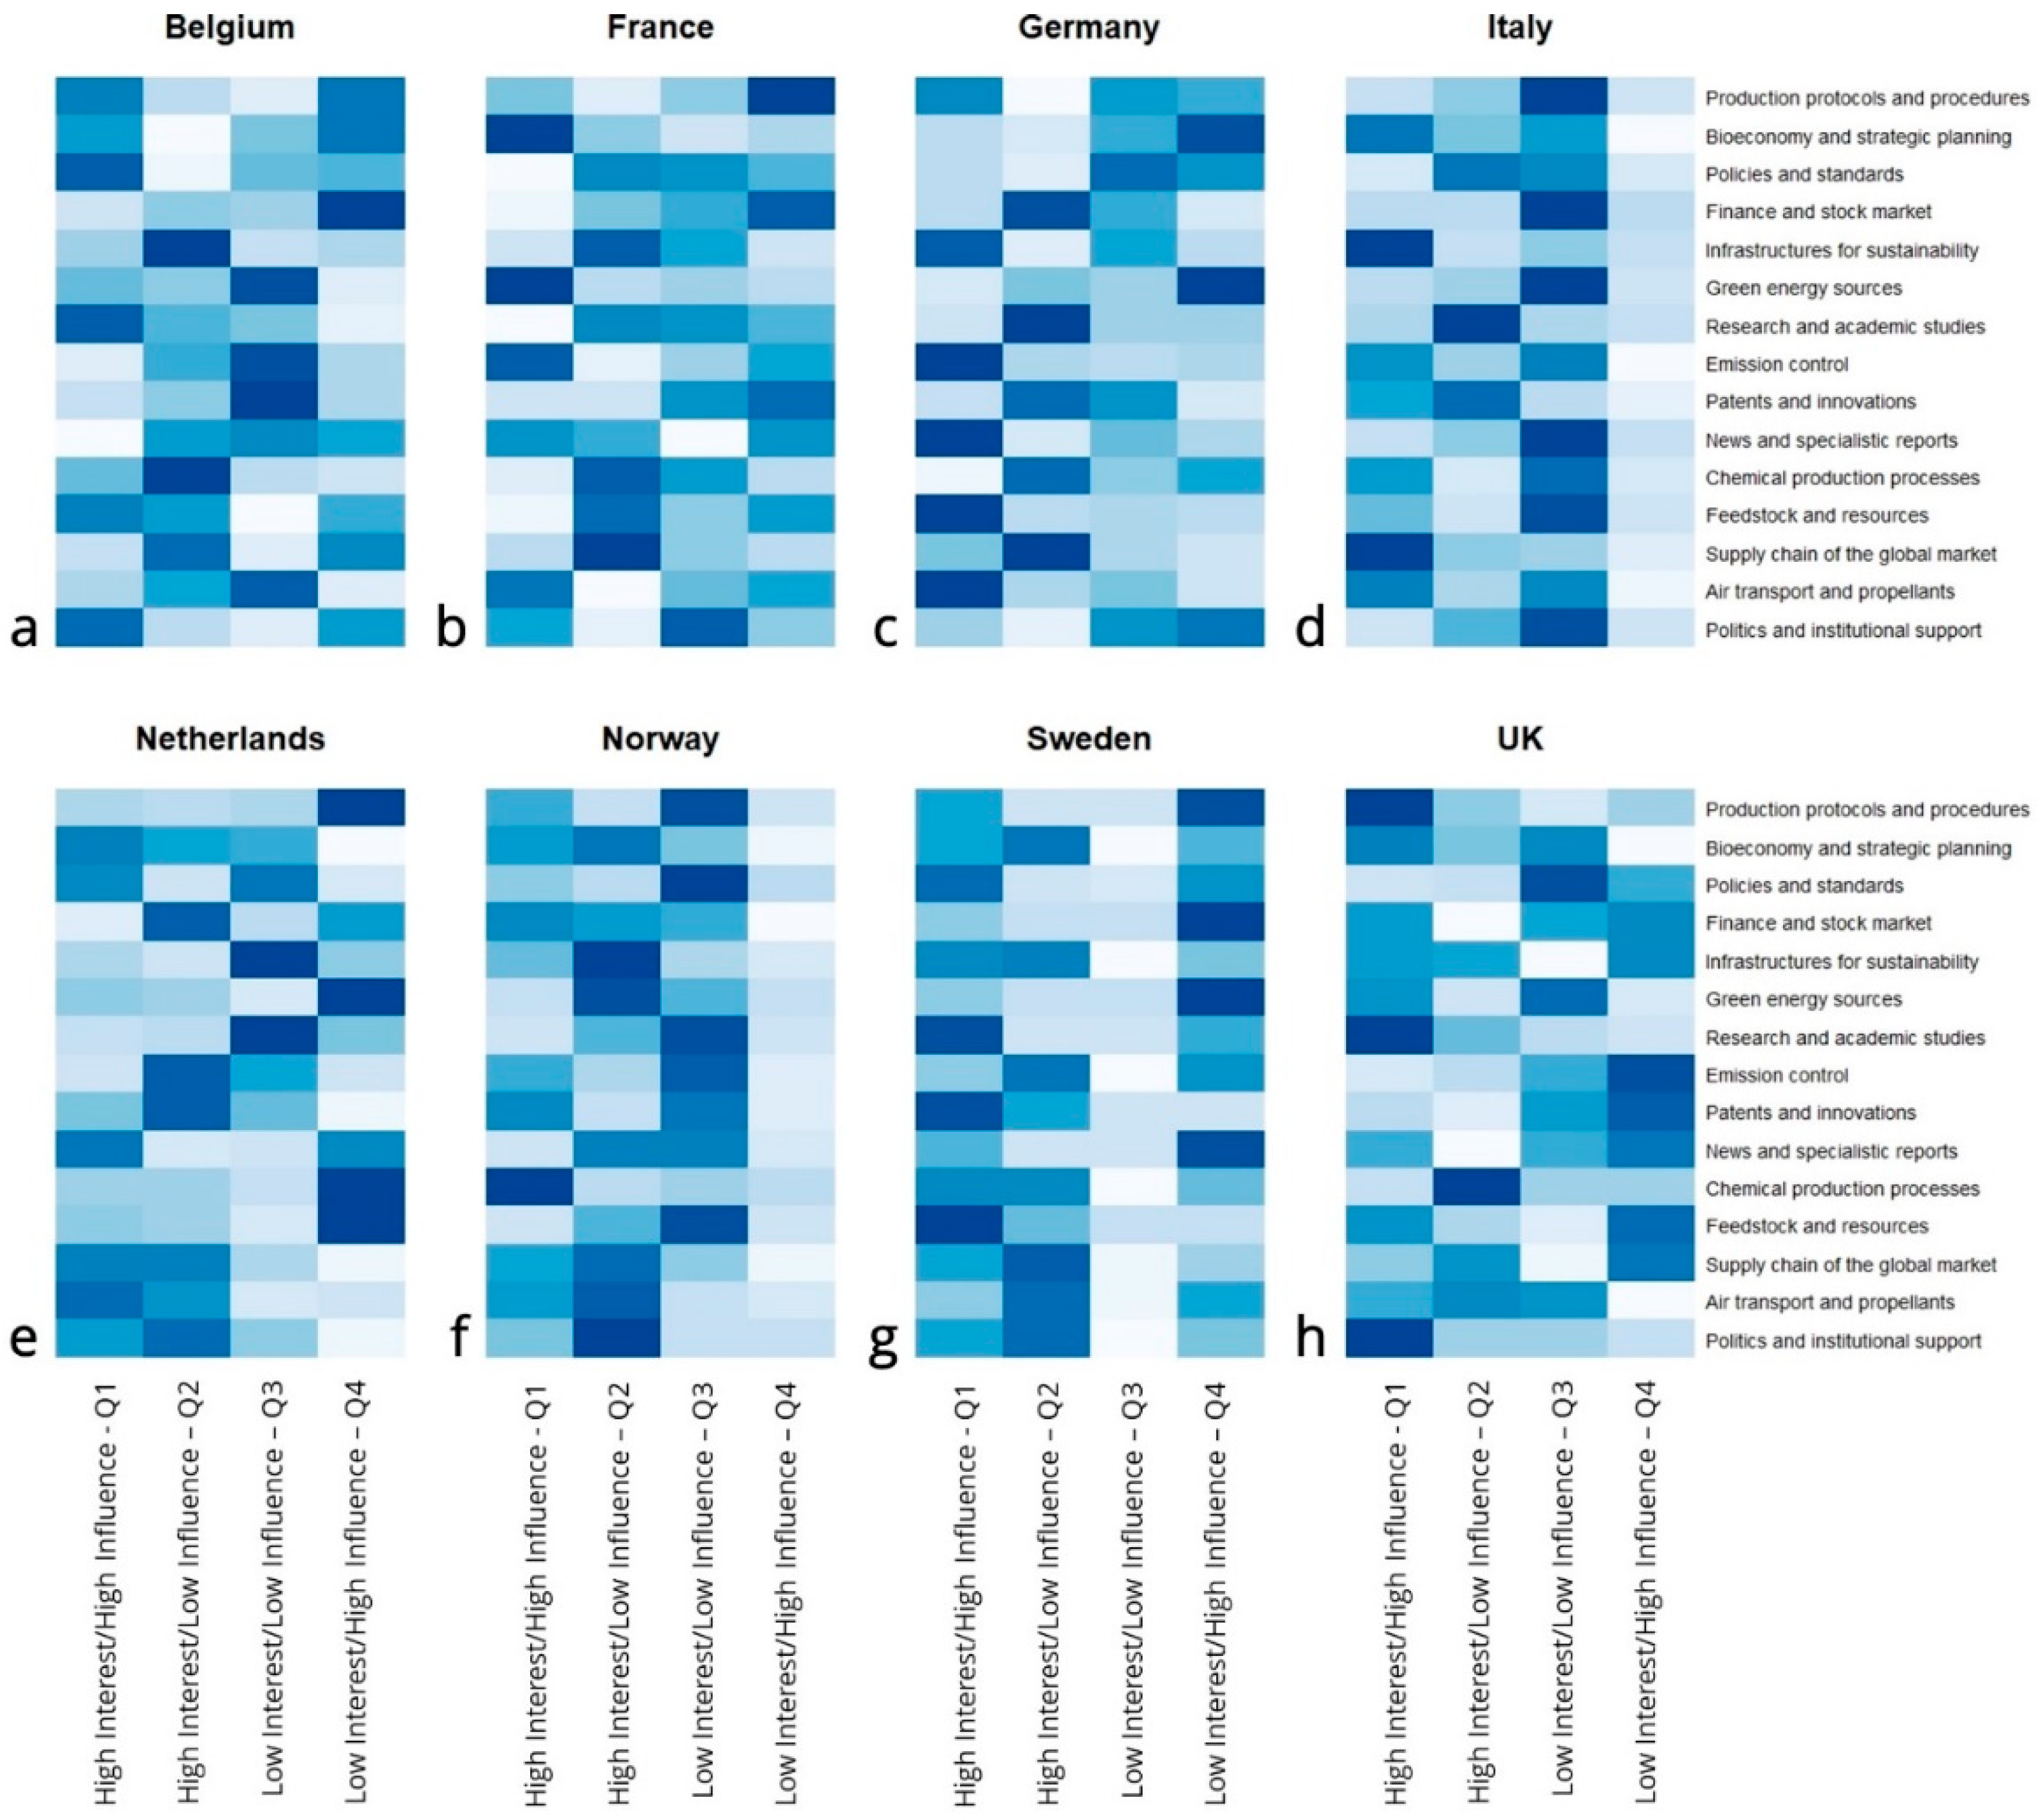
  • To populate an Interest by Influence Mendelow’s matrix by means of all sampled stakeholders, within the considered set, by crossing the two aforementioned metrics. Moreover, in order to provide a more detailed stakeholders profiling: to describe the matrix quadrants via the contents of interest (topics) characterizing the stakeholders within each specific quadrant.

2. Materials and Methods

In Section 2.1 and relative sub-sections, the STM procedure is described to achieve content identification and a measure of each stakeholder’s sustainability content overlap with the ABC-Salt project’s topic contents (i.e., Interest operationalization and measurement); subsequently, in Section 2.2 and relative sub-sections, the SNA procedure is described to determine the stakeholders’ position in the relevant sustainability social network and a measure of each stakeholder’s centrality in it (i.e., Influence operationalization and measurement).

2.1. Keywords and Topic Extraction (STM Procedure)

In order to identify the thematic areas which are relevant for the ABC-Salt project and to compute the Interest of potential stakeholders in the activities carried out by the ABC-Salt project, ABC-Salt core contents/texts produced in digital contexts are considered.

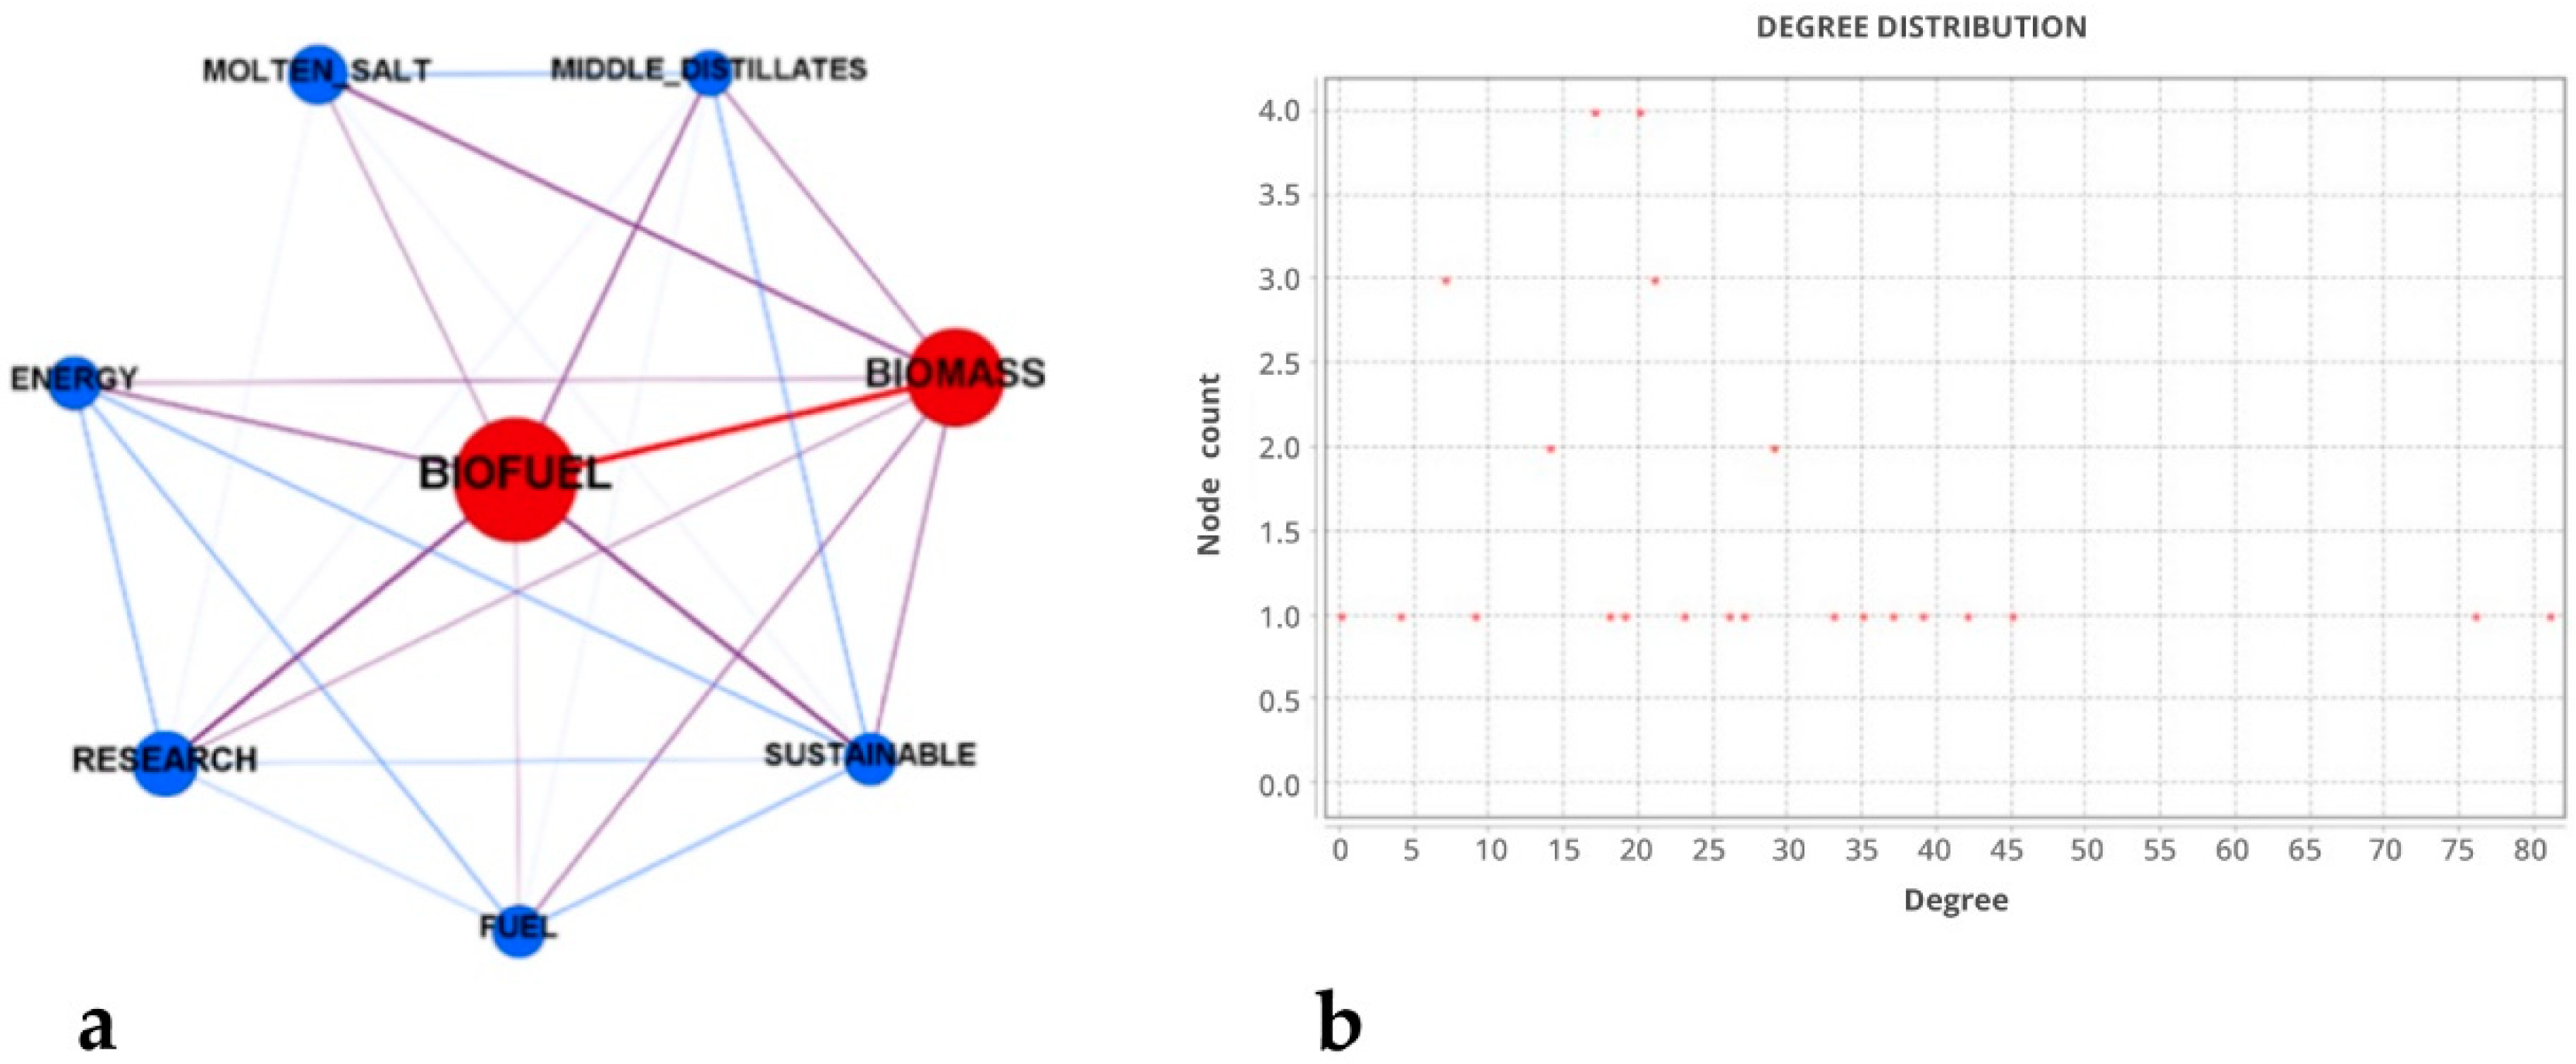
2.1.1. ABC-Salt Contents Definition

The text data produced by the ABC-Salt project were scraped using the institutional website [28], the Grant Agreement Project Summary and the tweets produced by the ABC-Salt Twitter account (from 25 February 2018 to 25 January 2019) as data sources. The resulting dataset is then divided into paragraphs and organized into a corpus of 48 documents.
The documents are then pre-processed through tokenization; exclusion of symbols, numbers and punctuation; HTML and URL removal; stop-word removal; term inclusion for f > 2; distinctive terms normalization (e.g., from “circulareconomy” to “circular economy”). Following the pre-processing procedure, only 34 out of 509 terms are included in subsequent analyses (see Table 1). Subsequently, the mutual co-occurrence relationships are calculated. The terms’ frequency and their respective co-occurrences are then used to build a semantic network of the most representative keywords of the ABC-Salt’s activity.
Within the network, some nodes are extremely prominent both in terms of absolute frequency and in terms of number and strength of the links (Weighted Degree). As evidenced in Figure 1, these “top keywords” are central to the communication acts promoted by the ABC-Salt project.
In particular, it is possible to distinguish two distinct groups between these “Top Keywords”:
  • First Level Keywords are the two biggest nodes, circa 95th percentile in Weighted Degree Distribution (WD > 72.9): “Biofuel” and “Biomass”;
  • Second Level Keywords are the subsequent six nodes, 75th percentile (WD > 30): “Research”, “Molten salts”, “Energy”, “Sustainable”, “Fuel”, “Middle Distillates”.

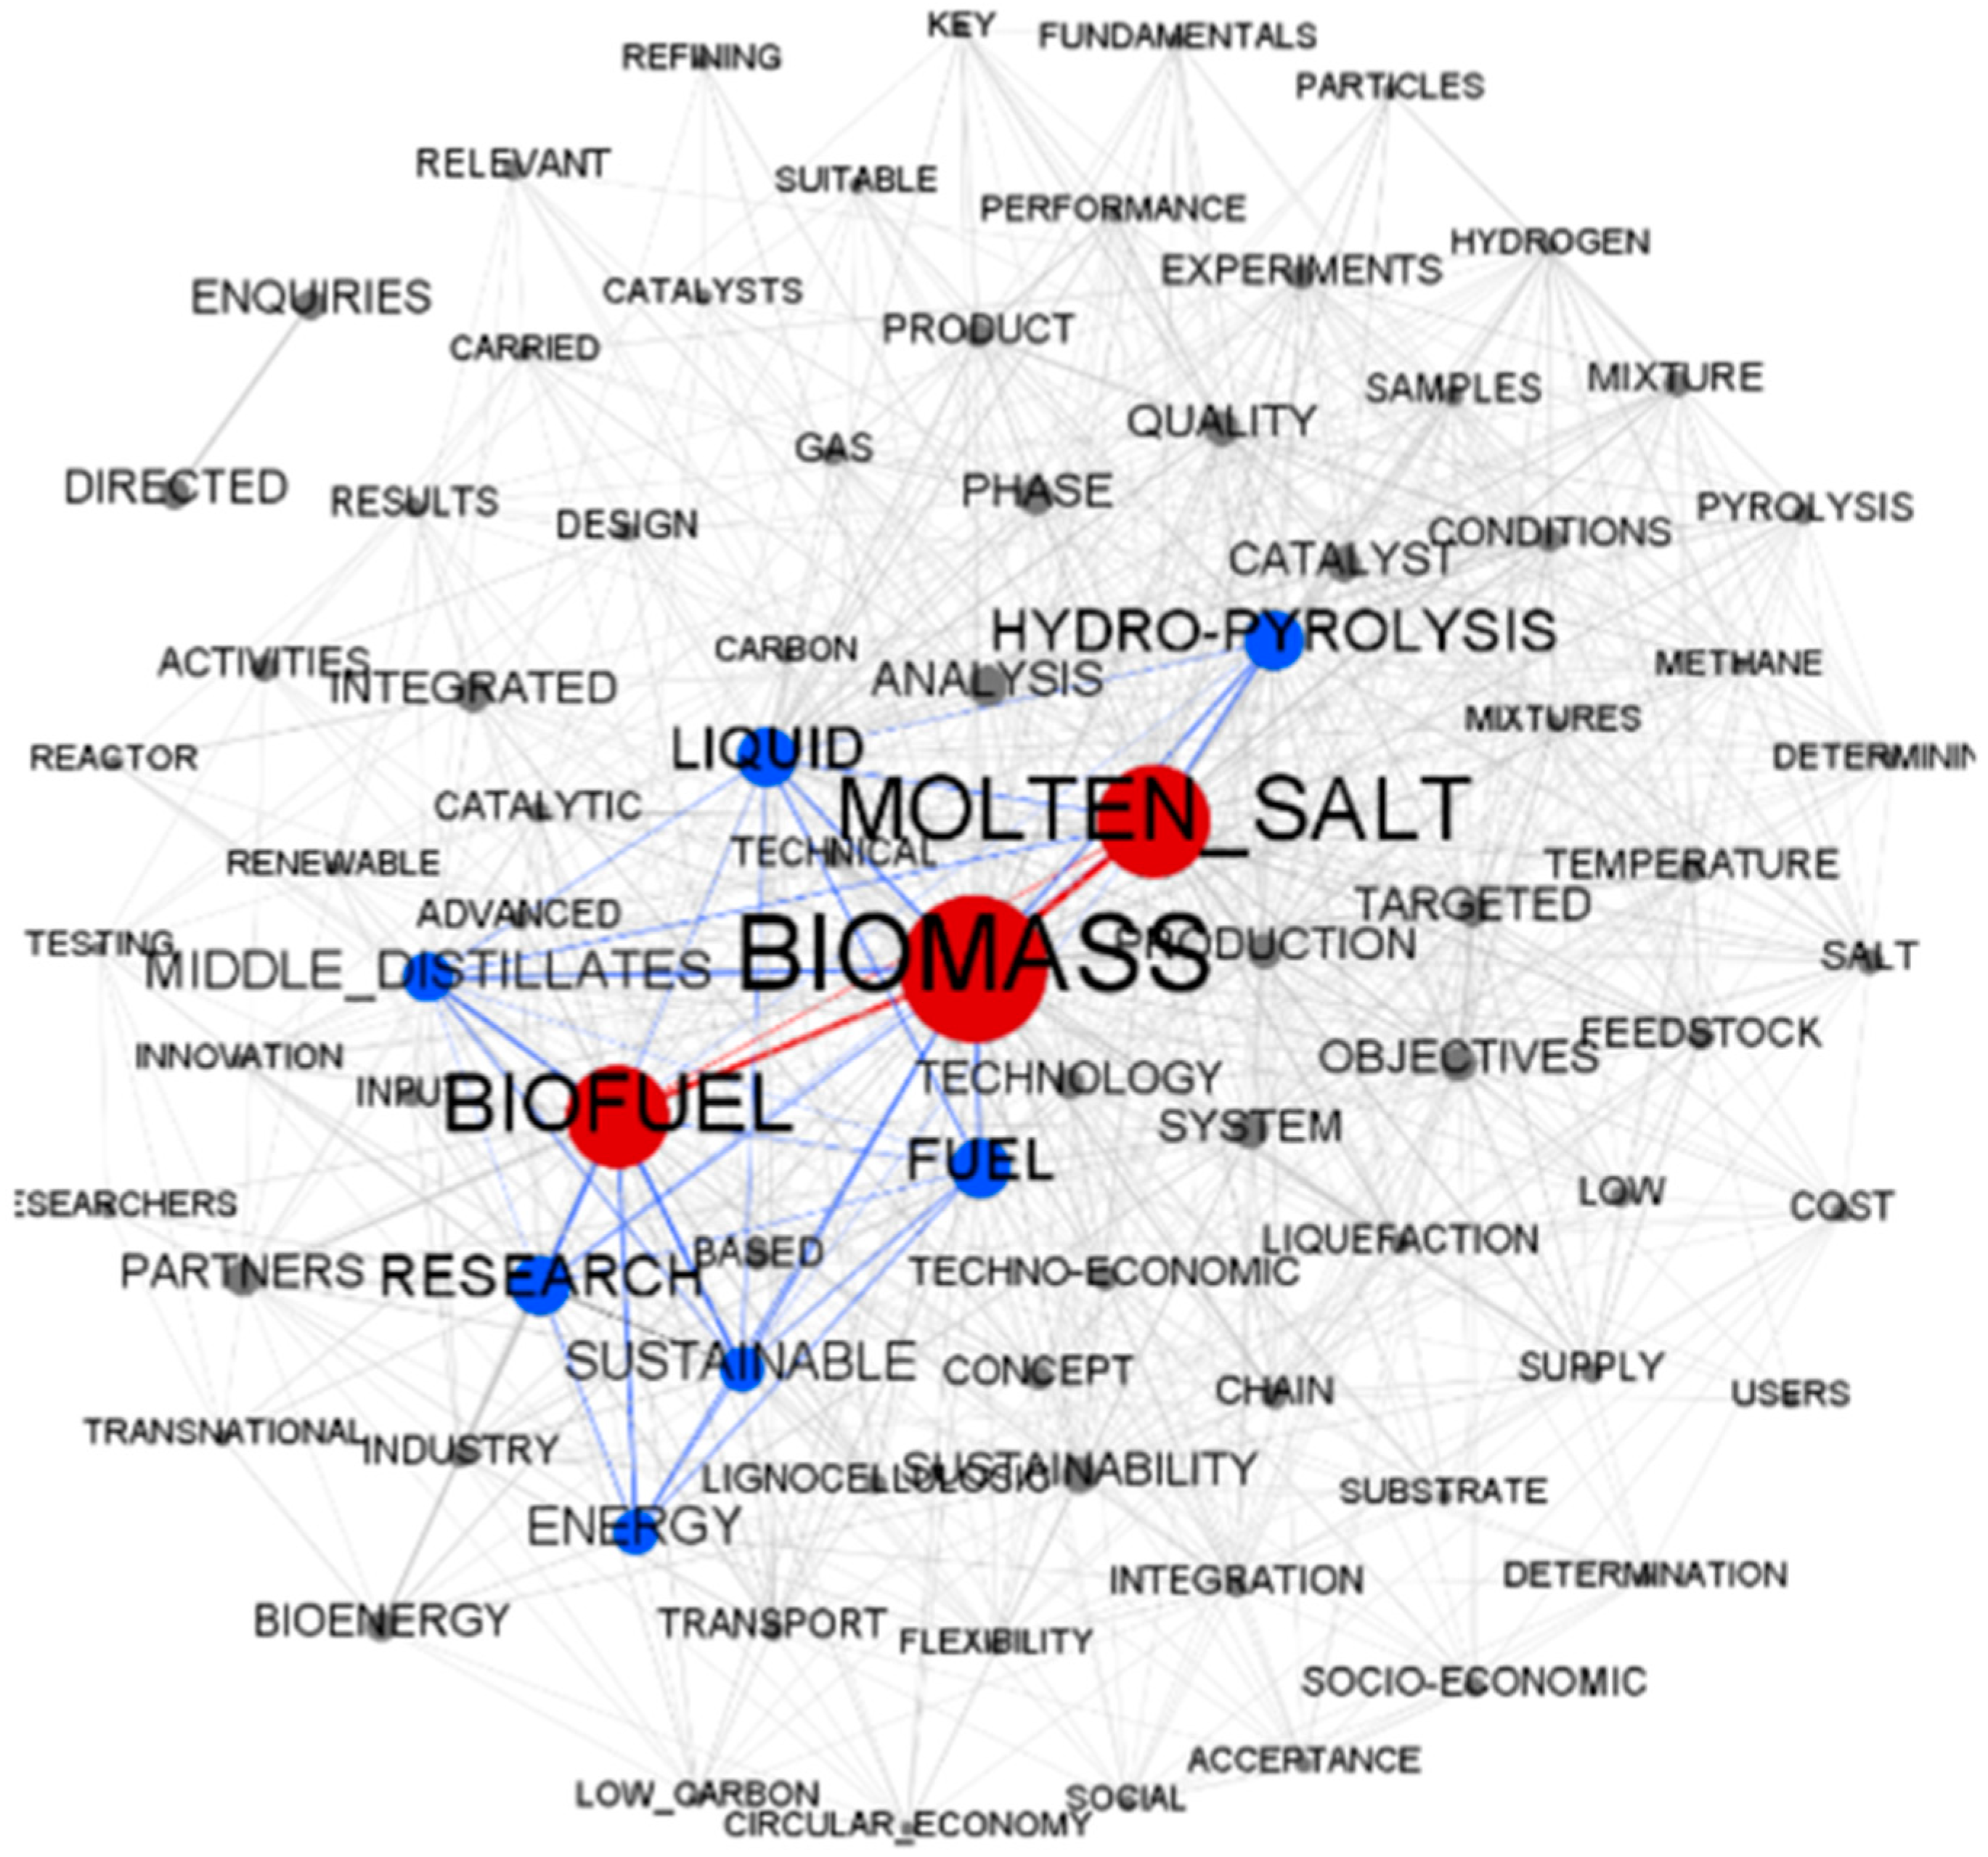
2.1.2. Validation via a Concurrent Strategy for ABC-Salt-Related Content Extraction

In order to verify the correctness and thoroughness of the set of extracted keywords, a double-check was carried out through a competing extraction strategy. In particular, the sample of textual data to be analyzed was extended by adding to the original corpus the descriptions of the ABC-Salt project’s most technical Work Packages, namely WPs 2 to 6. The new corpus, consisting of 91 documents (vs. 48 in the original strategy) was subjected to the same procedure of data pre-processing and of occurrence and co-occurrence links calculation. The semantic network obtained includes 84 nodes (terms) related by a denser number of links (Figure 2).
Despite this, the number and composition of both the First and Second Level Keywords underwent very few changes:
  • First Level Keywords are the three bigger red nodes: “Biofuel”, “Biomass” and “Molten Salt”;
  • Second Level Keywords are the subsequent seven smaller blue nodes: “Research”, “Energy”, “Sustainable”, “Fuel”, “Middle Distillates”, “Liquid” and “Hydro-Pyrolysis”.
This set of ten keywords was used to compose queries of extraction from Factiva and ProQuest, following the main procedure described above. The second strategy provides an additional contribution in terms of corpus dimensions equal to 3.99% (252 documents) only. The negligible contribution provided by the competing strategy is considered a confirmation of the goodness of the first solution, also on the basis of parsimoniousness.

2.1.3. ABC-Salt-Related Contents from Global News Databases

The previously extracted First Level Keywords and Second Level Keywords were then used to download contents related to the ABC-Salt activity scenario from trusted global news databases: Factiva and ProQuest. Some limitations have been applied to the extraction criteria: time interval limited to the last five years; news with abstract only; English language only. More specifically, the extraction queries were composed using the First Level Keywords as search criteria, in conjunction with one or more of the Second Level Keywords, as in the example below:
“Biofuel*” AND/OR “Biomass**” AND (one or more of all the six Second Level Keywords)
At the end of the extraction, the ABC-Salt related corpus was made up of 6311 documents, reduced to 5473 after the filtering of duplicates. For each document, the following information was collected: title; abstract; publication date; publication state; document type (e.g., news, interview, patent, conference, etc.); source. To allow the exploration of the themes underlying the corpus, both the title and the abstract of the documents were used as a basis for textual analysis.

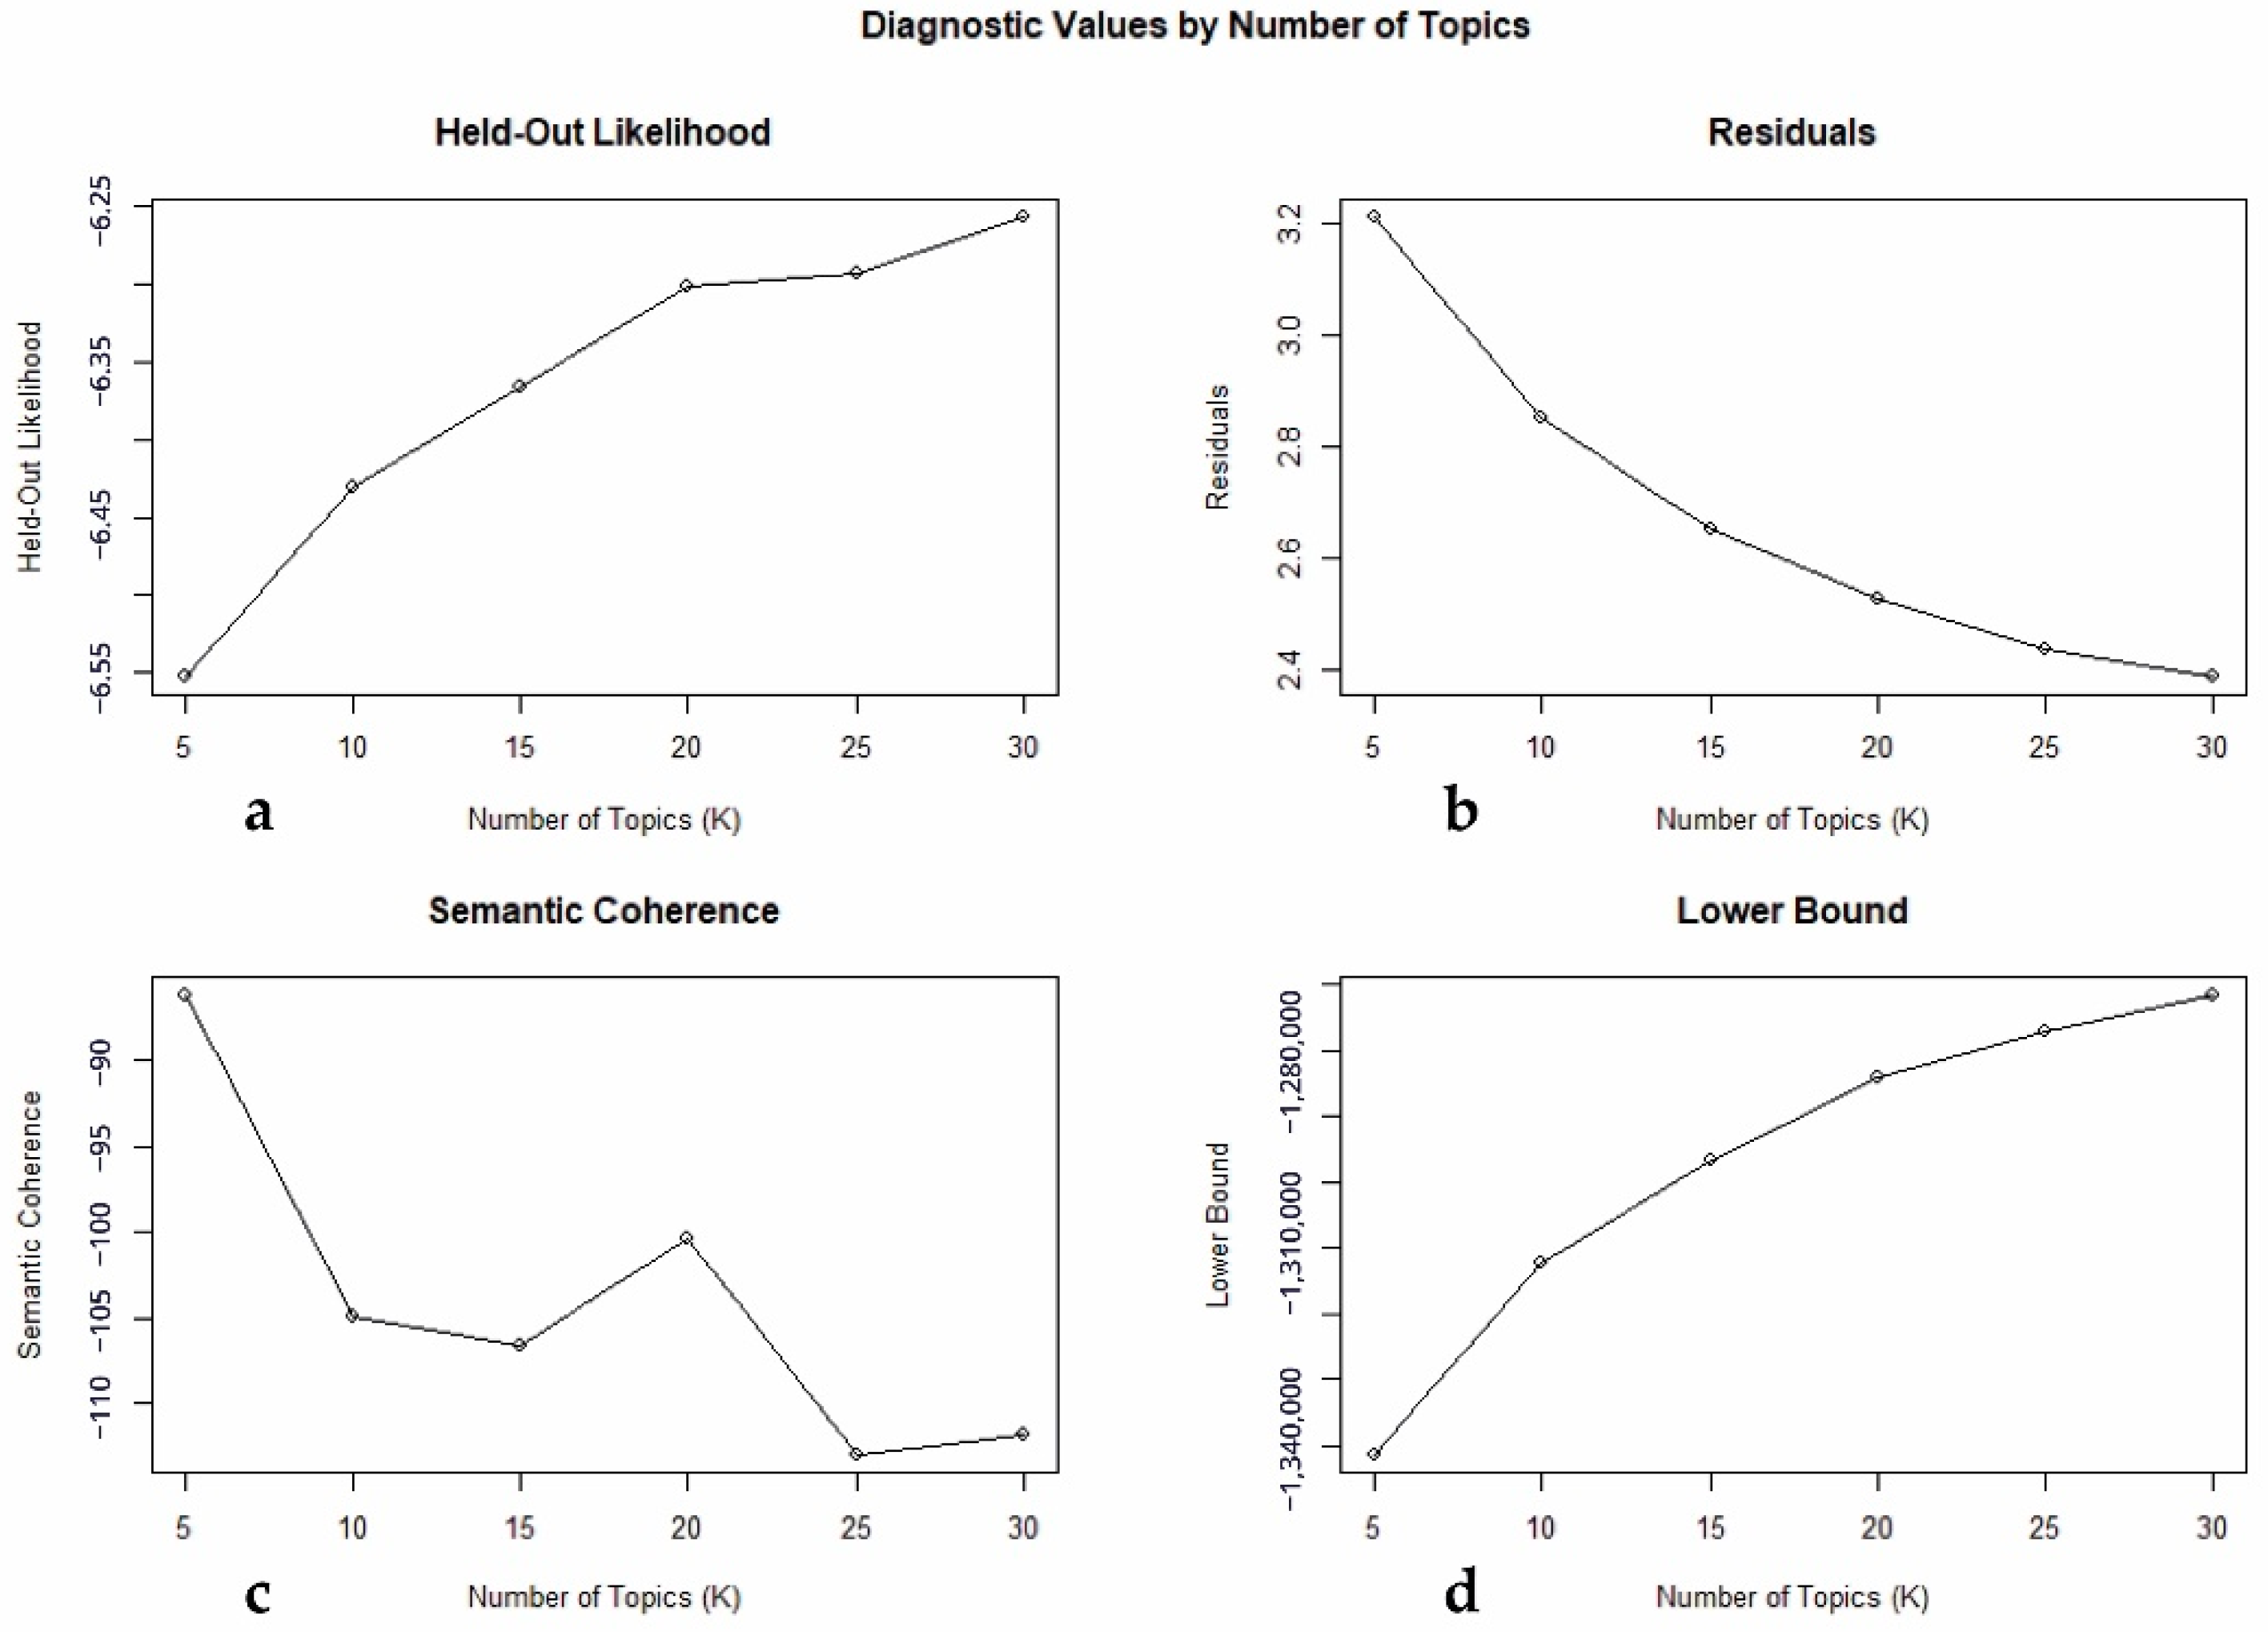
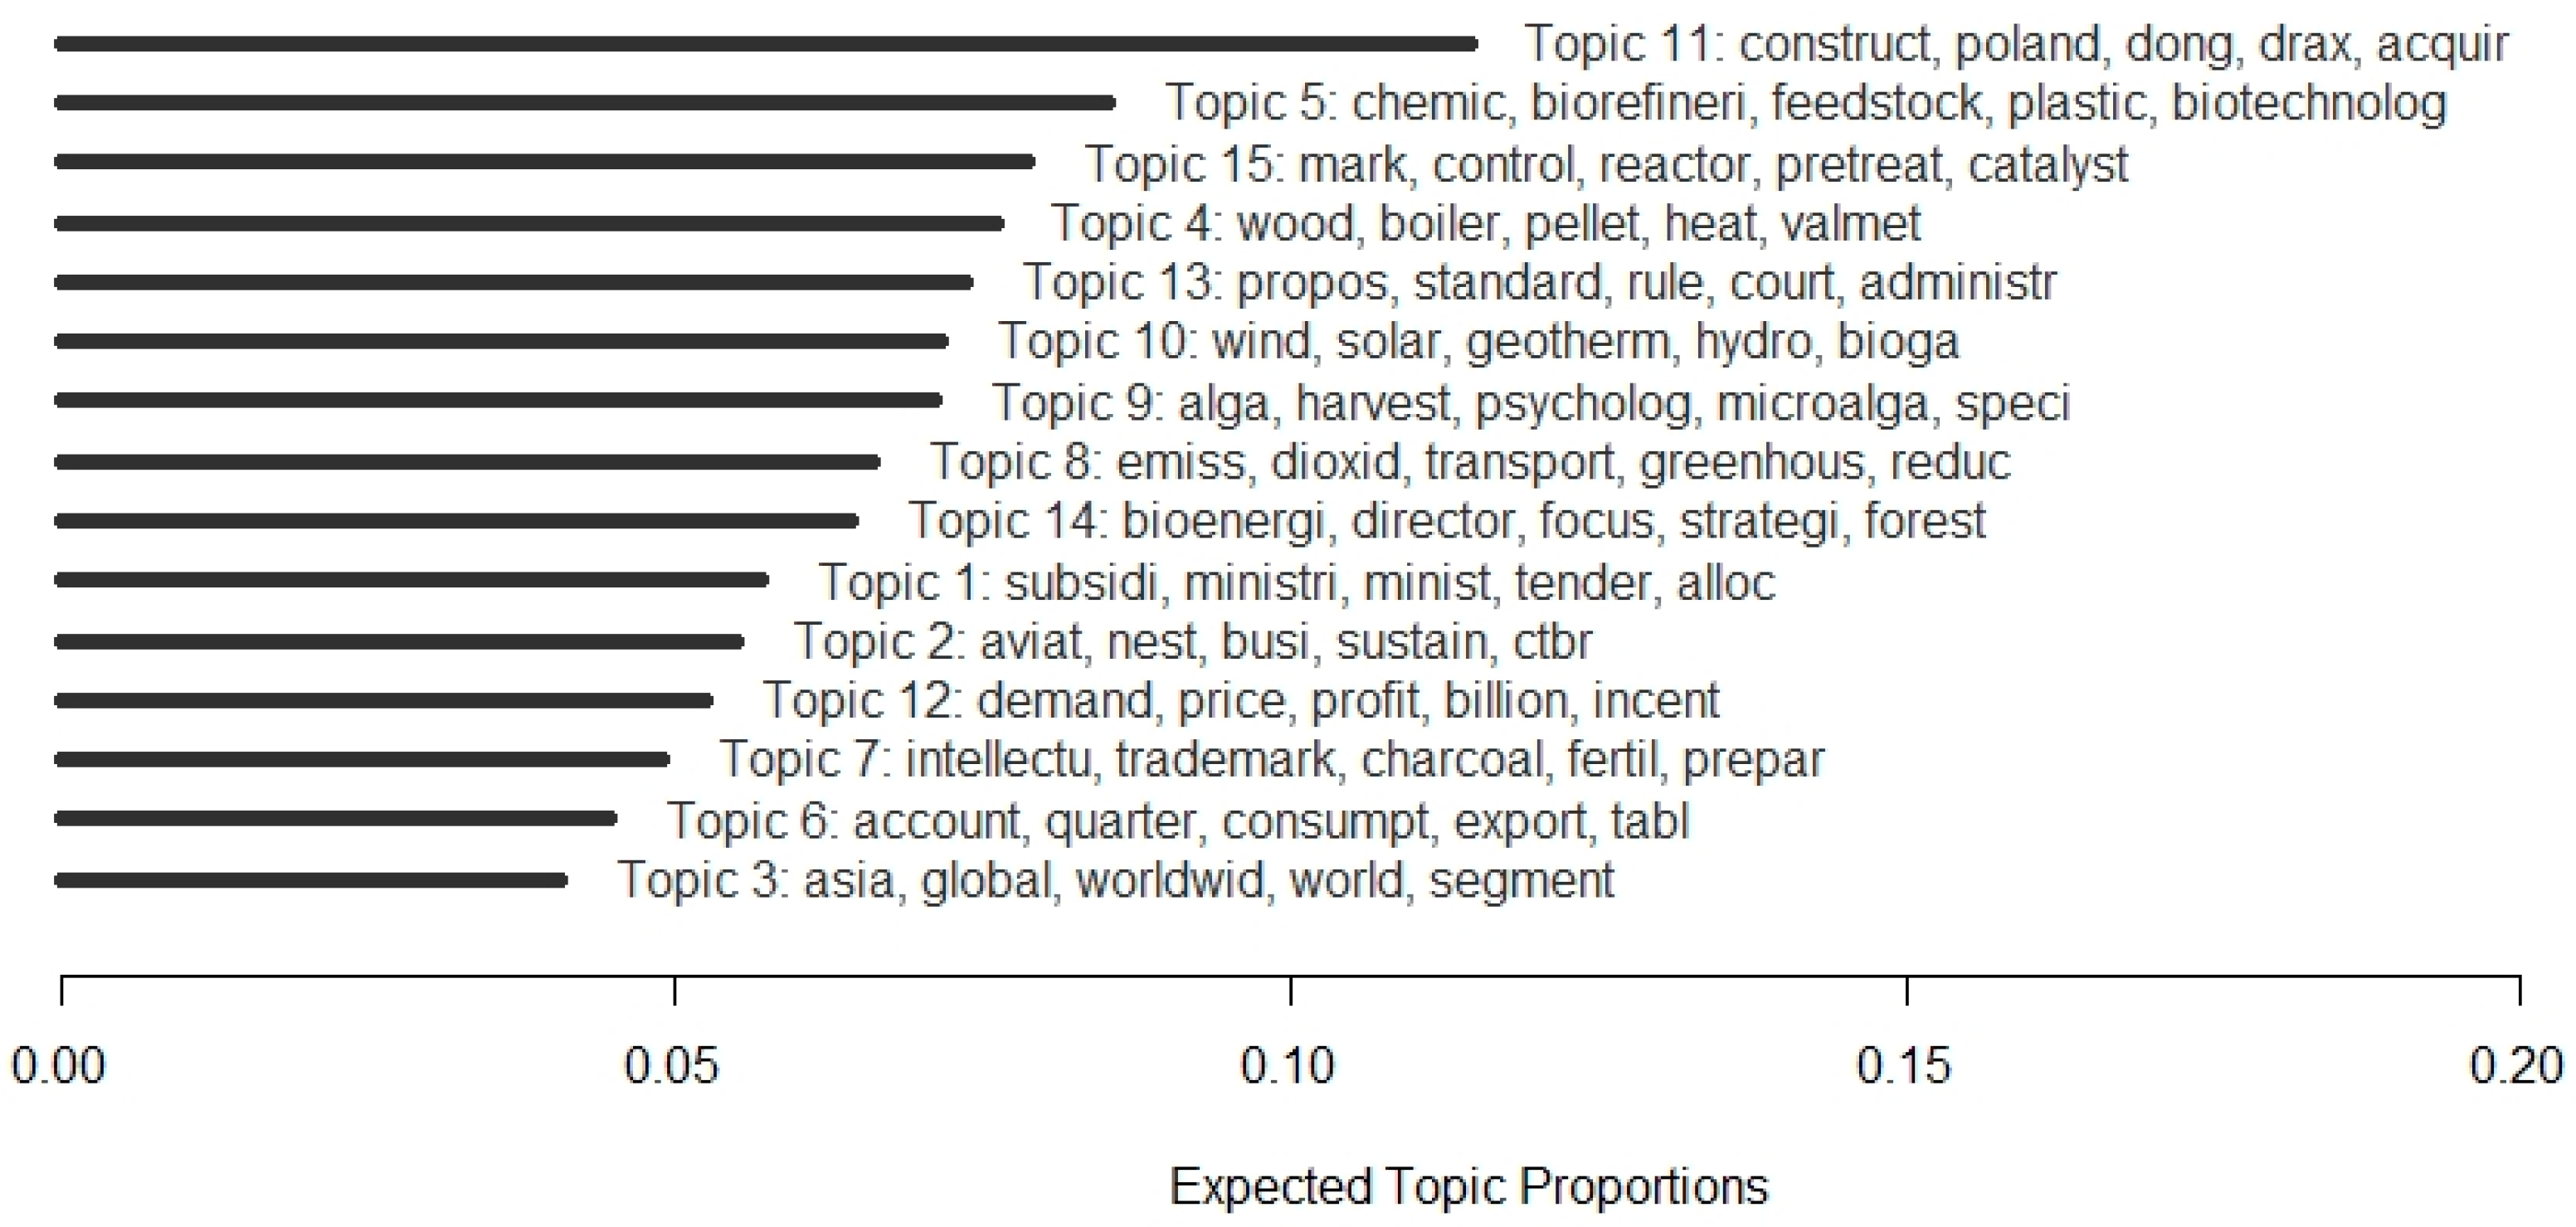
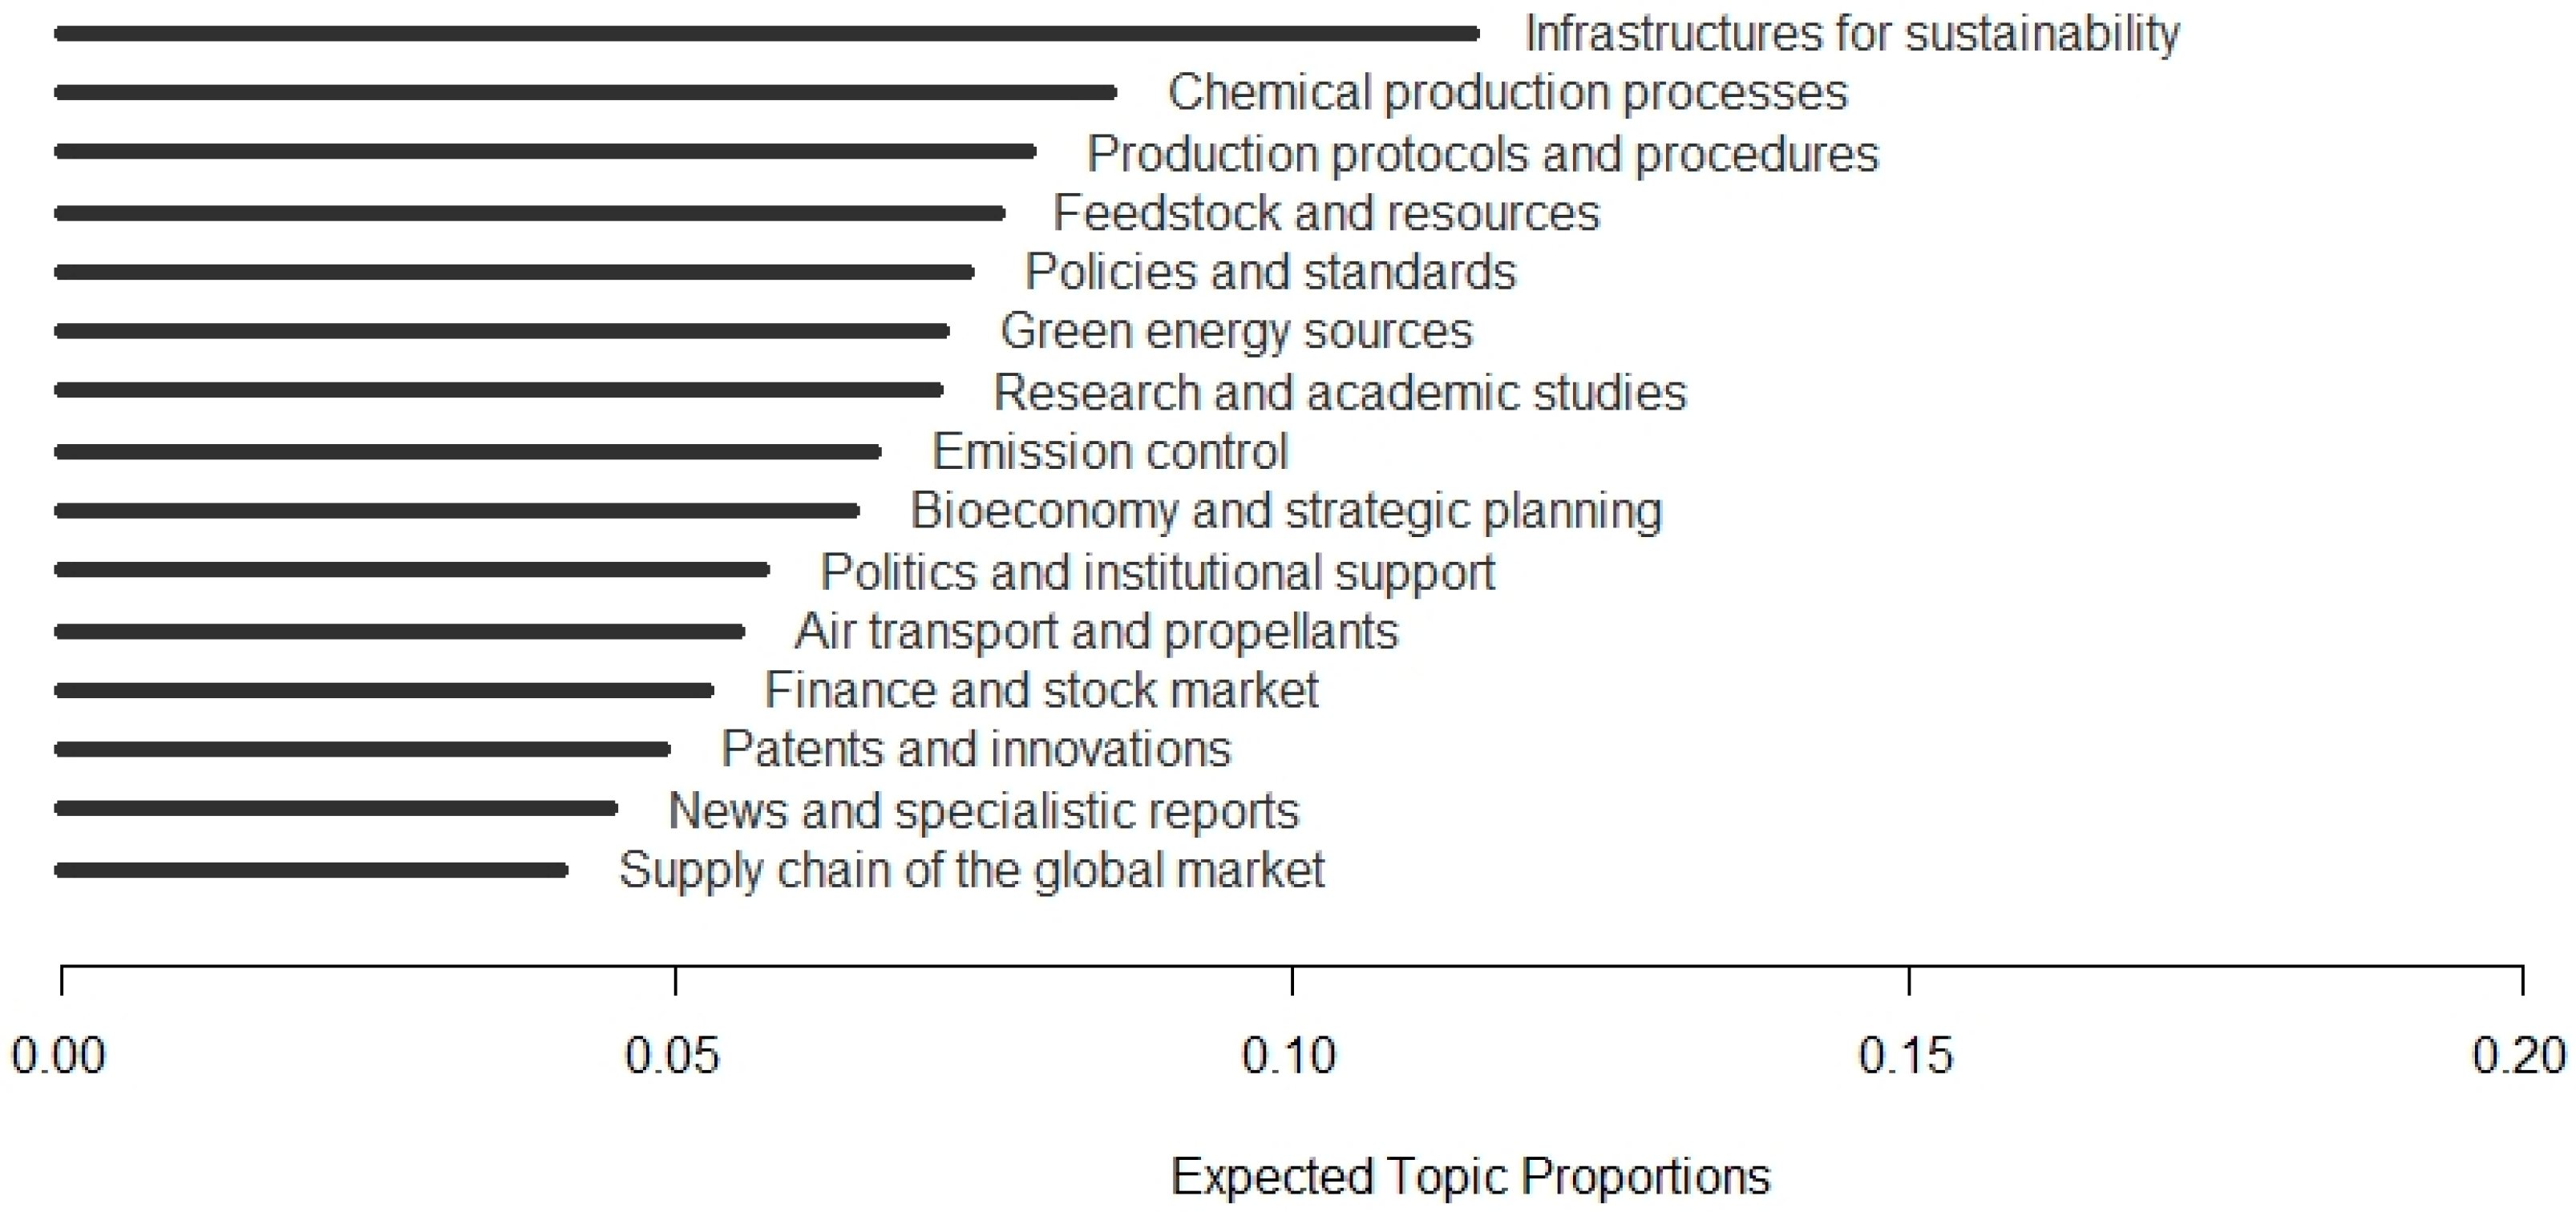
2.1.4. ABC-Salt-Related Topics

The analysis of the latent topics in the ABC-Salt-related corpus requires the pre-processing of the textual data according to the procedure proposed by the STM. First, the documents are tokenized. A stop-word list is prepared to eliminate empty words and, subsequently, terms composed of less than four characters are eliminated. The corpus is then stemmed to eliminate duplication due to conjugation and verbal declination. Finally, due to the extension of the corpus, terms with low frequency of appearance are eliminated in order to reduce the lexical variability. Specifically, terms with f < 10 are excluded, a value that ensures a strong reduction in the vocabulary of the corpus (Figure 3).
The overall vocabulary of the corpus resulted in 2229 terms. The procedure for identifying topics through the STM was then applied. Following the example proposed by Roberts et al. [21], two meta-variables were inserted as covariates, in order to increase the accuracy of the model in the estimation of topics. Given the scope of application, the “location” of the documents (reference to the continent of origin) and a temporal attribute (reference to the date of publication of the document) were used. This information is useful in the definition and understanding of the topics related to the ABC-Salt project given the possible cultural, geographical and temporal variability of the topics. This is also useful in view of the subsequent years’ activities, since a number of stakeholders need to be located within each of the ABC-Salt project partners’ Country. The meta-variables “CONTINENT” and “YEAR” were therefore used as relevant metadata in the identification of topics. The STM, being sensitive to initialization parameters, requires the selection of a number of topics to be extracted from the corpus. To reduce the arbitrariness of the choice, a preliminary data-driven procedure based on the work of Mimno and Lee [29] was used. Given the different solutions to be tested, a comparison between different parameters was made to select the appropriate number of topics:
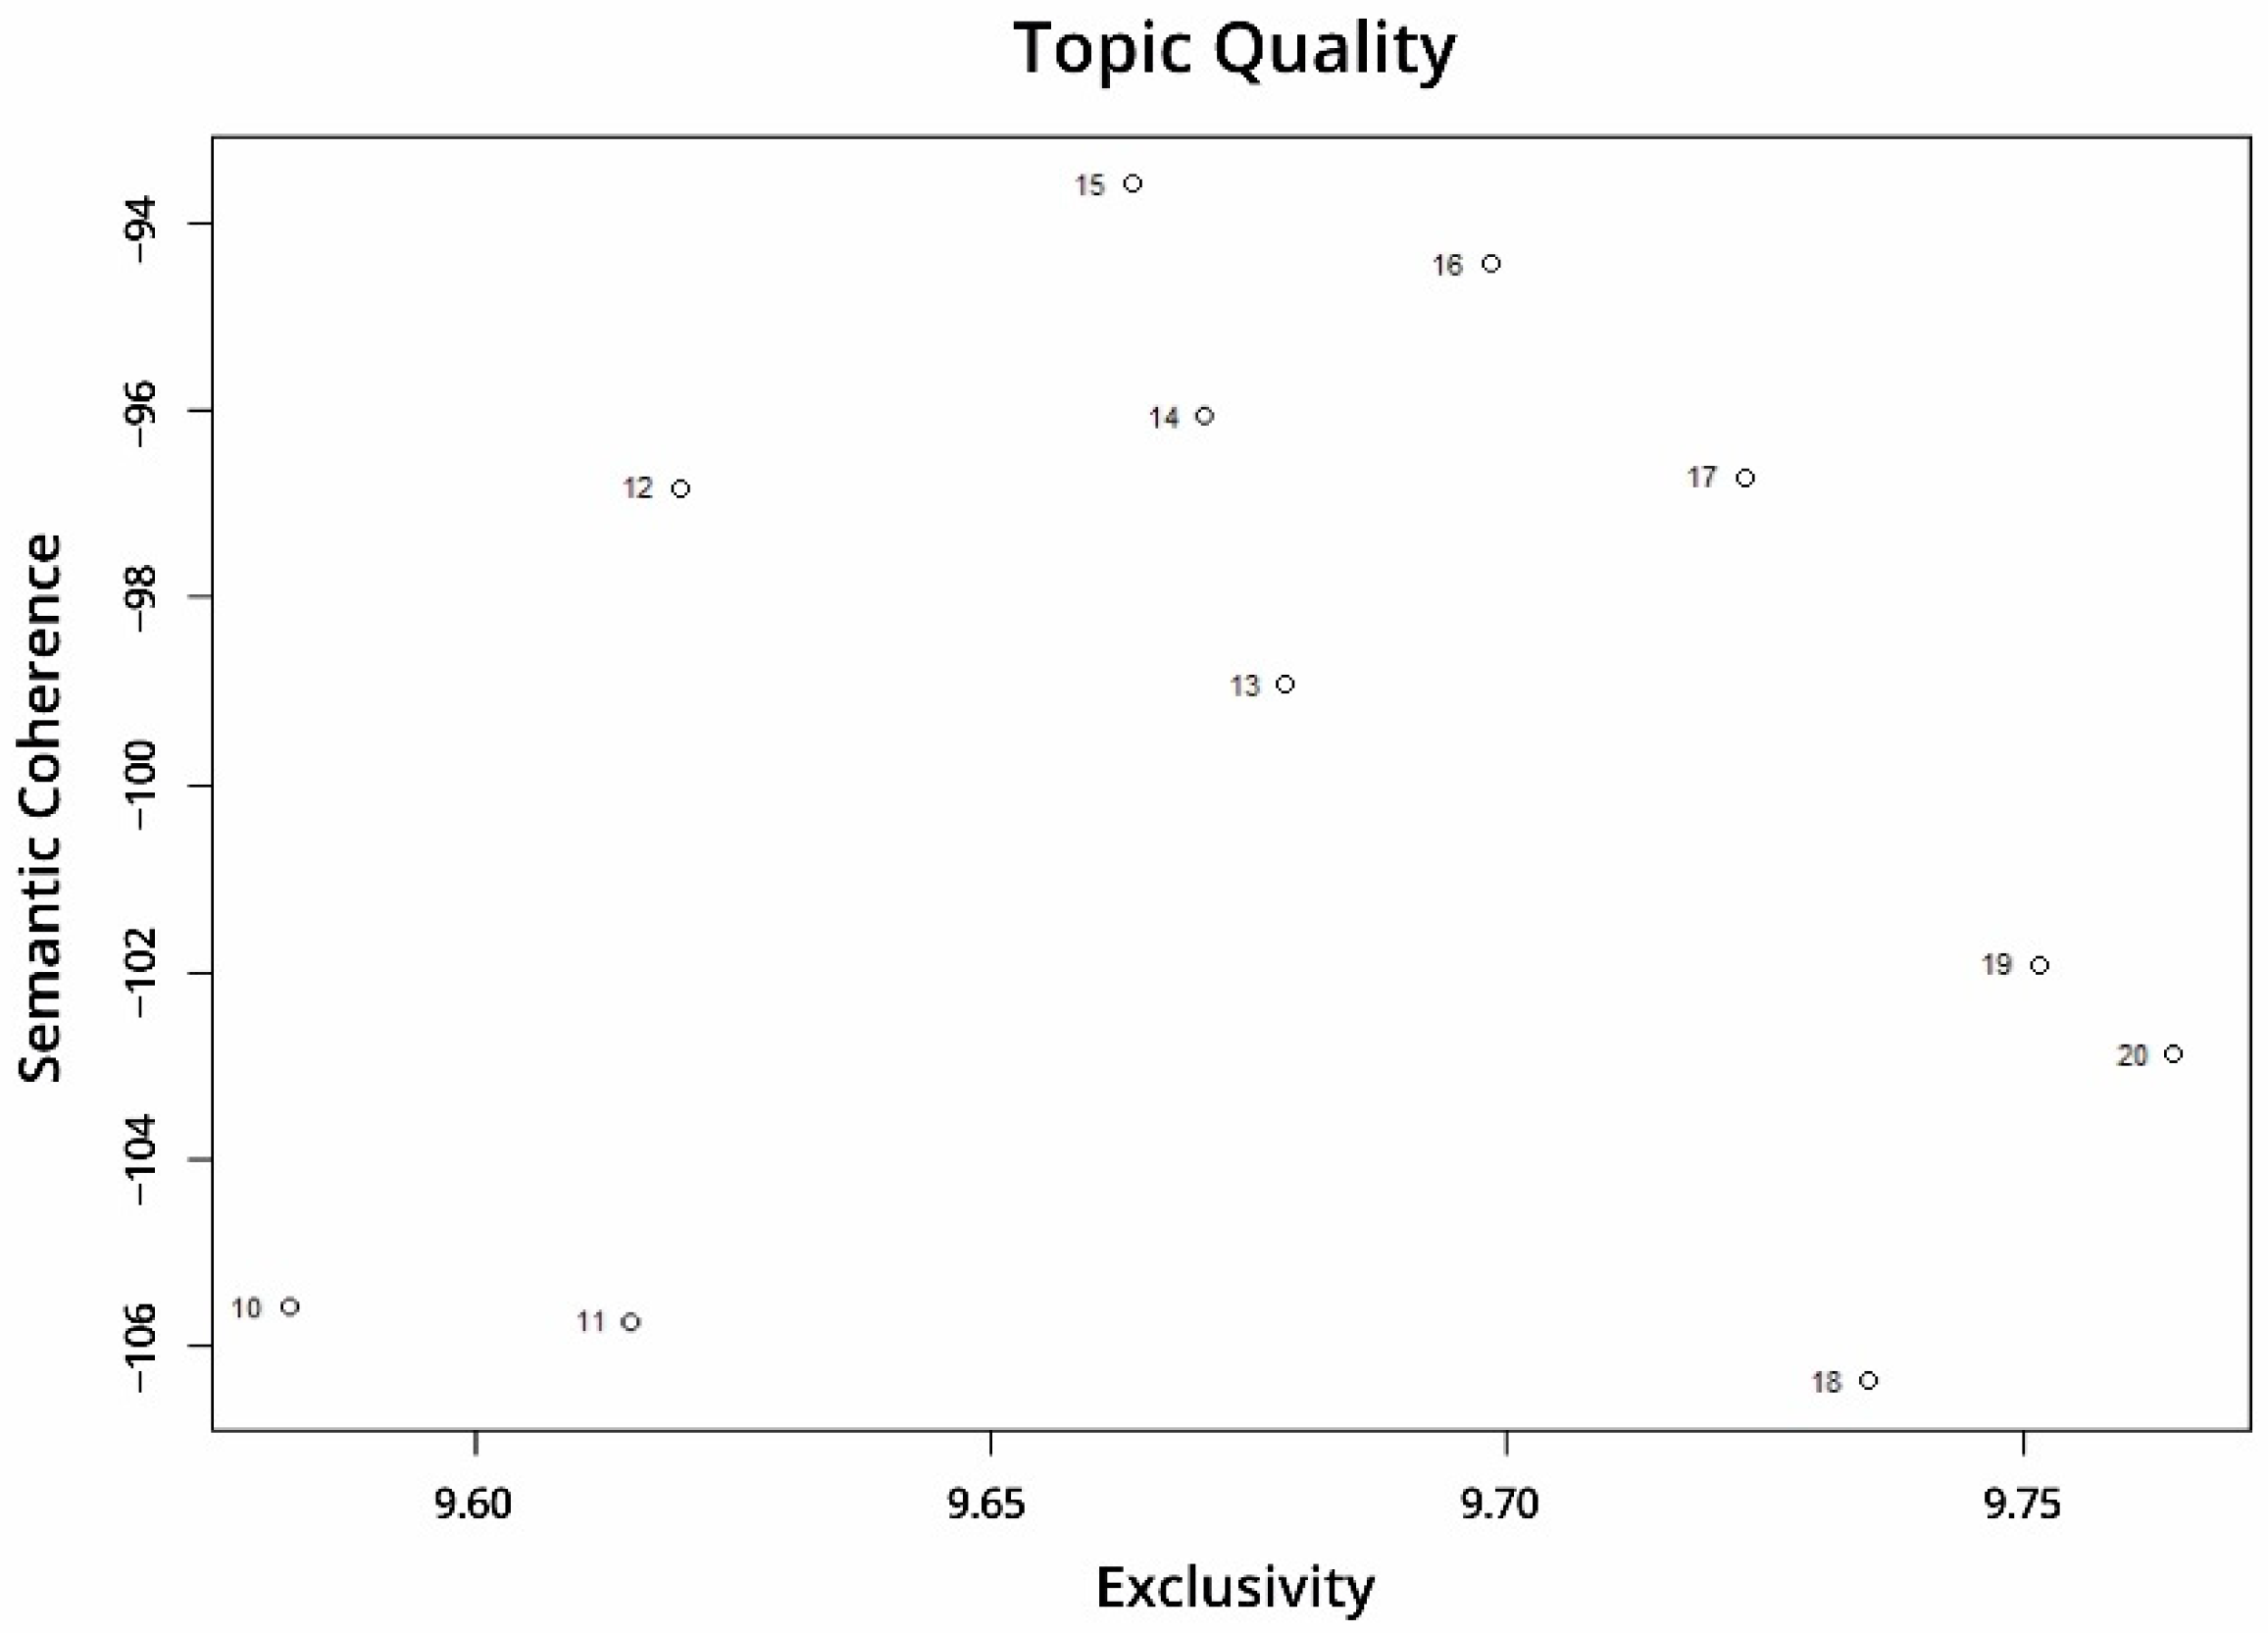
  • Semantic Coherence [30] is part of the broader concept of mutual information and is based on the probability of the terms of a topic to co-occur in documents;
  • Exclusivity, based on the FREX index, refers to the specificity of words ascribed to a topic.
After an exploration of aggregation solutions from 5 to 30 topics (Figure 4), a narrower range was selected for a detailed analysis. Following the suggestions of the diagnostic graphs, the 10–20 interval was selected, according to the criteria of maximization of the Semantic Coherence (Figure 4b). At the same time, the 10–20 interval presents medium high scores of Held-Out Likelihood (Figure 4a) and Lower Bound (Figure 4d) and low residuals (Figure 4c).
Figure 5 shows the graph of the relationship between Semantic Coherence and Exclusivity of the solutions from 10 to 20 Topics.
Looking at the indexes of Exclusivity and Semantic Coherence, three solutions were considered: 15, 16 and 17 topics. Each of the three solutions was compared by three independent coders (i.e., the Authors) in order to evaluate the semantic consistency and exclusivity of the representative terms of each topic. The 15-topic solution has been confirmed as the most coherent and exclusive one from a semantic point of view. The 15 topics, with their respective proportion within the corpus, are synthesized by the most representative terms (higher FREX index) in Figure 6.
Subsequently, observing the main FREX terms and the most representative documents in the corpus, labels reflecting the general meaning of each topic have been identified. Figure 7 shows the topical prevalence graph with label details.
The emerged topics, thematic areas underlying the ABC-Salt-related contents, will be applied, after the stakeholder identification phase, to highlight the degree to which each stakeholder is involved in each topic when describing itself or its activity.

2.2. Stakeholder Identification (SNA Procedure)

To obtain a reliable stakeholder list operating in the bioenergy context, the database of European biofuels and bioenergy stakeholders built by ETIP [1] (which has received funding from the EC Horizon 2020 Research and Innovation Programme, under grant agreement No 825179—European Technology and Innovation Platform) has been adopted [31]. The database of European biofuels and bioenergy stakeholders’ groups together actors such as trade associations, research institutes, NGO’s and universities. From this list, primarily focused on organizations that are active in advanced biofuels in Europe, 664 stakeholders have been extracted. Of these, only stakeholders matching the following criteria were included in the research sample:
  • Existence of an official English language website (subsequently used to extract text content);
  • Existence of a Twitter account (later used to investigate influence in the digital environment);
At the end of the cleaning phase, only 239 stakeholders have been included in the final research sample used for the analysis phase.

2.2.1. Stakeholders’ Data Gathering

For each stakeholder, information on the area of activity was manually collected by extracting the textual content on the stakeholders’ websites. Each document related to the activity of each stakeholder was subsequently included in a corpus for text analysis (see Section 3.1). Moreover, the Twitter IDs of each stakeholder were extracted in order to follow the interactions and relationships among stakeholders in the social network (see Section 2.2.2 and Section 3.2). Finally, thanks to the information provided by the ETIP database, the stakeholders’ Country was tracked.

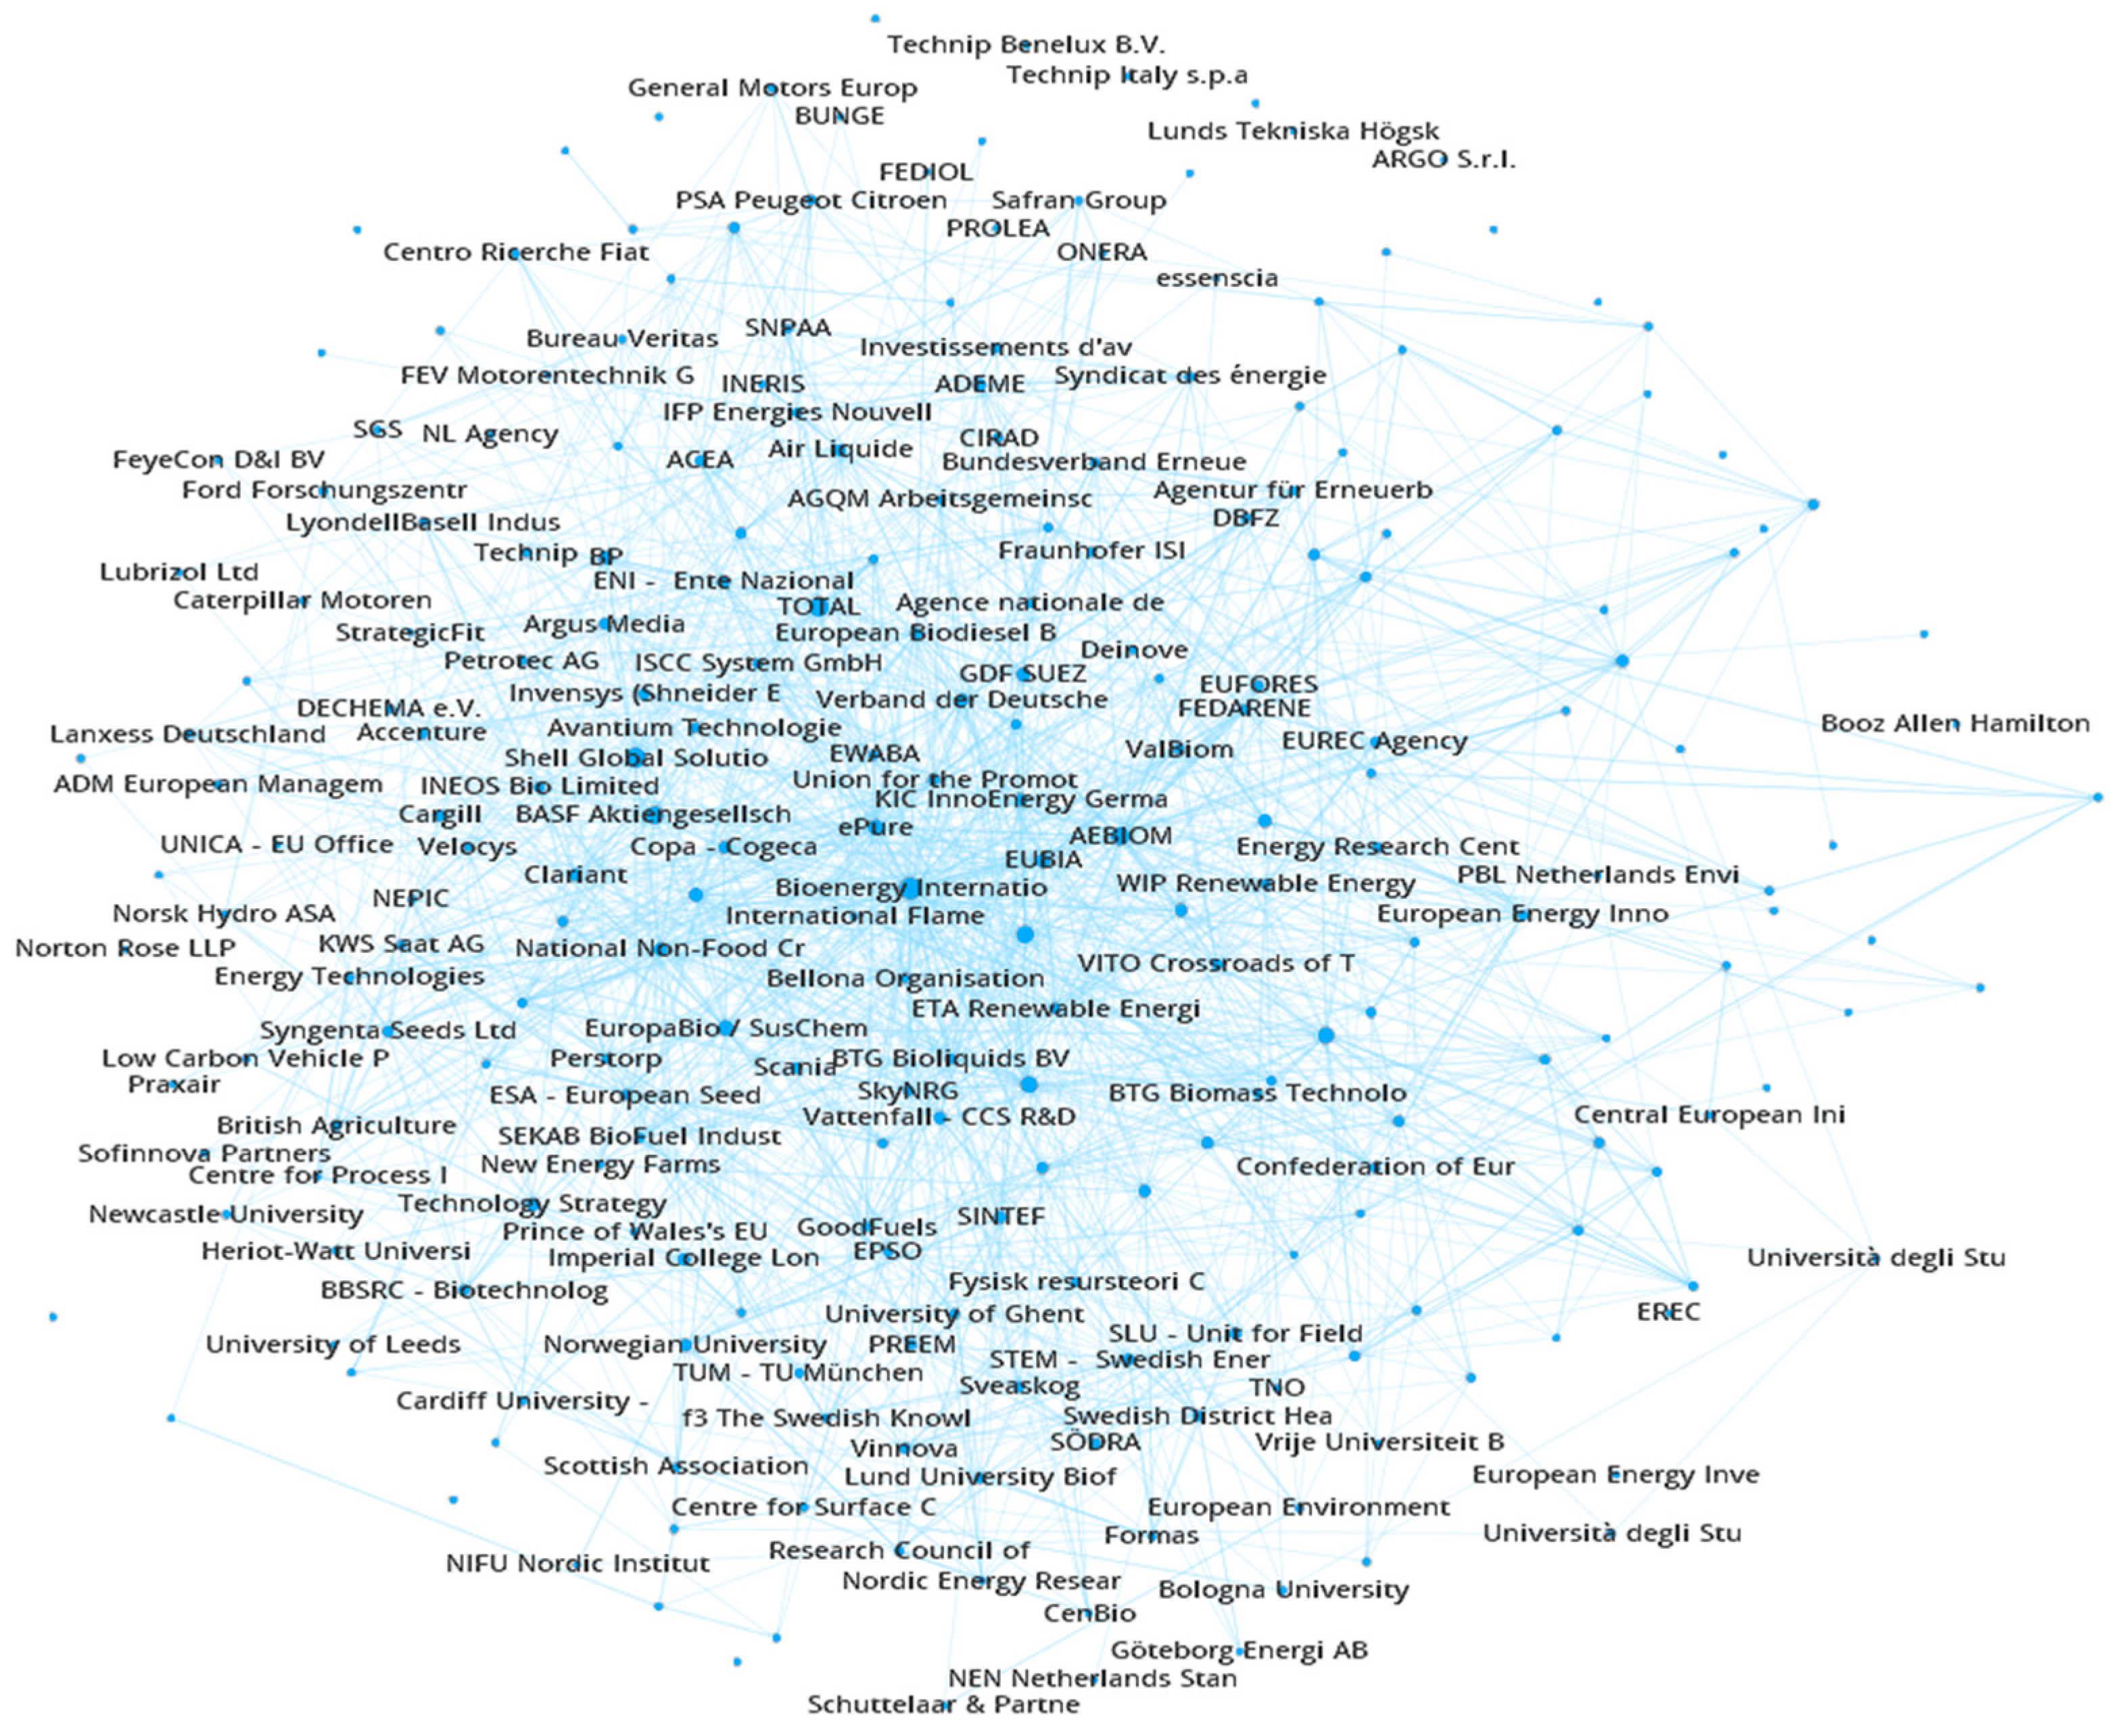
2.2.2. Stakeholders’ Network Drawing

Thanks to the extracted data, it has been possible to extract Twitter relationships regarding the ABC-Salt stakeholders from 23 March 2012 to 23 March 2019 via Twitter’s APIs (Application Programming Interface). Data have been manipulated via “Gephi”—an open source software for the analysis and visualization of social networks [32]—to highlight the relationships among stakeholders. For the purpose of this research, a relationship refers to specific interactions made by stakeholders.
These interactions can be classified as:
  • Following (Stakeholder A follows status and content updates of a stakeholder B);
  • Retweeting (Stakeholder A spread a communication content produced by stakeholder B);
  • Mentioning (Stakeholder A cites stakeholder B in its own communication).
Each of these interactions can be intended as links originating from a source node (Stakeholder A) and directed to a target node (Stakeholder B). Therefore, by drawing all the links occurring between each pair of nodes in a bidimensional space, it is possible to derive the topology of interactions from and to the stakeholders, thus building a directed network (Figure 8).
The influence score is operationalized using the standardized Indegree Centrality measure of each node (stakeholder).

3. Results

The adopted two-phase procedure allowed us to map all ABC-Salt project’s potential stakeholders in terms of each stakeholder’s score in the two selected dimensions: Interest and Influence. Therefore, further analyses will be performed only on the 149 stakeholders belonging to the eight Countries involved in the project (Belgium, France, Germany, Italy, The Netherlands, Norway, Sweden, UK).

3.1. Interest Computation (STM Procedure)

The ELBO (Evidence Lower Bound) score of each stakeholder has been standardized and ranked from the highest score to the lowest (namely, from Università degli Studi di Firenze, in Italy, to Copa—Cogeca, in Belgium). Results show the degree of Interest of each stakeholder in the ABC-Salt project content (Figure 9).
The Interest score can be subsequently disaggregated according to the proportion of the 15 topics in each stakeholder’s content (θ). For each stakeholder, the topic prevalence score for each topic was computed. Topic prevalence score shows how much of a stakeholder (i.e., the textual content produced by a given stakeholder) is associated with a topic in a range from 0 to 1. The sum of all the topic prevalence scores for a given stakeholder is equal to 1. This means that, if a stakeholder shows a topic prevalence score θ = 1 for one topic, the scores for all other topics will be θ = 0. In Figure 10, the differences between the average topic prevalence scores of each stakeholders’ Country is reported.
As shown in Figure 10, the 15 topics basically span across all Countries, with the exception of Belgium, Italy and Norway, where peaks appear (i.e., darker and lighter blue colour across each Country row). Belgian stakeholders present, on average, a higher prevalence index for the “Policies and standards” (θ = 0.104) and “Bioeconomy and strategic planning” (θ = 0.293) topics. Among the Italian stakeholders, the “Research and academic studies” topic (θ = 0.247) is extremely prominent, while the topics concerning “Green energy sources” (θ = 0.001), “News and specialistic reports” (θ = 0.014) and “Chemical production processes” (θ = 0.037) are almost missing.
This latter topic is particularly prominent in Norway (θ = 0.170), together with the “Patents and innovations” topic (θ = 0.054), while the topics related to “Emission control” (θ = 0.050) and “Supply chain of the global market” (θ = 0.026) are scarcely represented compared to other Countries.

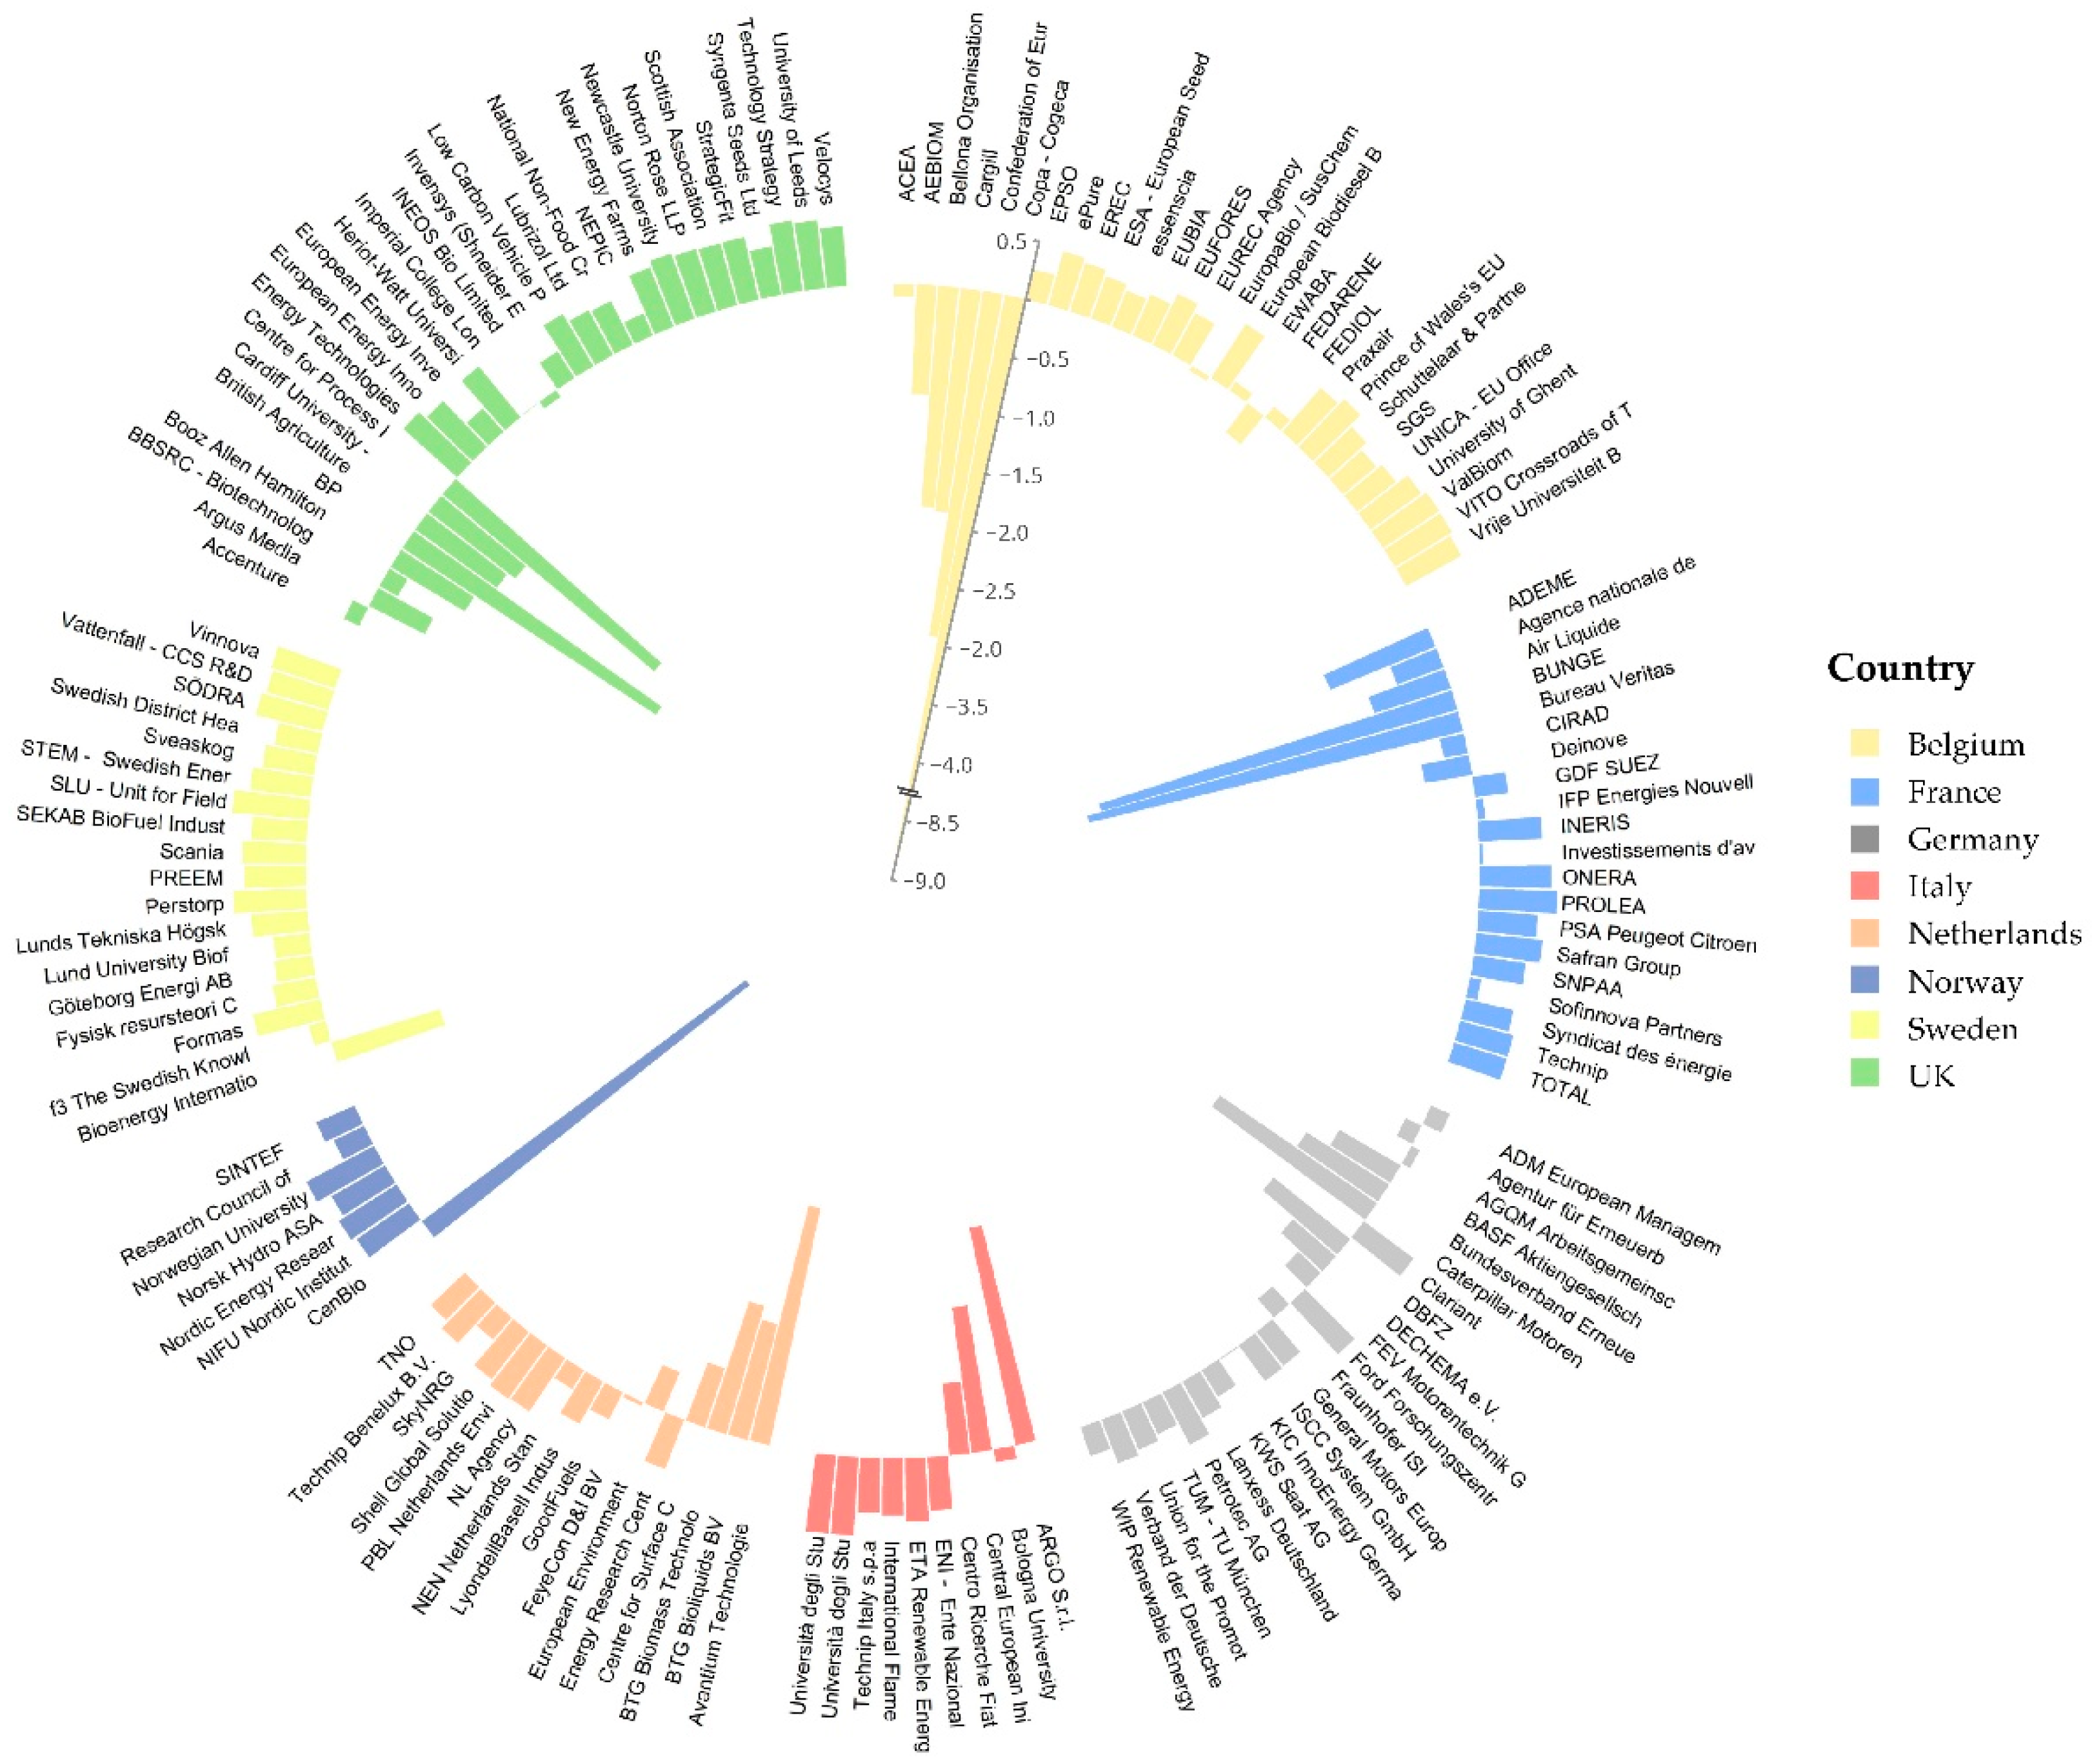
3.2. Influence Computation (SNA Procedure)

All 149 stakeholders have been ranked, from the most to the least influential in each Country (Figure 11), with respect to the ABC-Salt project content. As it often occurs in relational social data, the distribution of the number of connections between nodes follows a Power-Law distribution [33,34], which means that a small number of nodes holds the majority of connections compared to the vast number of nodes that, on the contrary, have few connections.
This implies, as observed also in “offline” contexts, that there are very few highly influential stakeholders (e.g., Bioenergy International, Shell, Basf, Total, Aebiom) and a large majority of actors with little influence.
The Influence score (InDegree Centrality) of each stakeholder has been standardized and ranked from the highest score to the lowest.

3.3. Matrix Population

All stakeholders are finally placed in the corresponding quadrant of the Interest by Influence matrix (Figure 12), thus representing the mapping results for the eight Countries involved in the ABC-Salt project (Belgium, France, Germany, Italy, The Netherlands, Norway, Sweden, UK). For details on Interest (ELBO_STD) and Influence (INF_STD) scores of all the mapped stakeholders, see Appendix A.
Moreover, each quadrant can be described in terms of each topic prevalence. Each heatmap highlights in which quadrant a given thematic area is more represented (or underrepresented). Such a “thematic profiling” could be realized at a fine grain of analysis, e.g., at the level of the single stakeholder, in order to better understand the specific interest of each single stakeholder compared to the target project. However, for ease of representation, data are reported below in aggregated form, by Country. Figure 13 shows the average topic prevalence score for each quadrant, in every project partner Country.
Heatmaps show that topic prevalence is not homogenously distributed in quadrants of each Country. Furthermore, this characteristic can also be observed by comparing the topic prevalence values of each quadrant between Countries.
When comparing these results with the overall findings of topic prevalence by Country (Figure 10), it is evident that the predominance of “Policies and standards” and “Bioeconomy and strategic planning” topics concerns, in particular, stakeholders with high Influence, i.e., those in the first and fourth quadrants (High Interest/High Influence and Low Interest/High Influence, respectively).
The “Research and academic studies” topic, which emerged as a theme mostly related to Italian stakeholders, is mostly addressed by stakeholders with High Interest and Low Influence (Second quadrant). “Chemical production processes” and “Patents and innovations”, two topics overrepresented in Norwegian stakeholders, are associated, respectively, to the first (High Interest and High Influence) and third quadrants (Low Interest and Low Influence)

4. Discussion

The proposed methodology for stakeholder mapping offers undoubted advantages in terms of scalability, since it allows the use of big data as a source for analysis, and in terms of replicability, thanks to the quantitative approach adopted.
Of course, some subjective choices have still been made by the researchers, such as the starting point dataset used for the research (ETIP database of 664 stakeholders); as well as a number of other small choices necessary to run the procedure, such as removing the less relevant information, making decisions regarding thresholds for selecting the most relevant data or deciding about the exact number of topics within the 15–17 range in the STM. Moreover, during the research, some further choices have been necessary, for example in order to steer the execution toward the specific objective requested by the project (e.g., the fact that only eight partner Countries’ stakeholders are targeted); or to take into account some missing data (e.g., stakeholders without some relevant variables within the dataset, such as not having Twitter activity, or using non-English language, etc.). Some of these choices implied a shrinkage of the original data set. The population of the matrix for the eight partner Countries has further restricted the number of stakeholders, due to the irrelevance (within the considered project) of the stakeholders belonging to all other European Countries. From the list of 664 organizations found in the starting ETIP database, only 149 stakeholders have been included in the final dataset, on which both Influence and Interest scores have finally been computed.
Looking at the results, it can be speculated that the presence of empty or under-populated quadrants (see Figure 12d,f,g) can be due, in part, to the peculiarity of the socio-economic fabric within some Countries or, more likely, to an under-representation of relevant stakeholders for certain Countries in the starting sample (namely, in this case, Italy, Norway, Sweden).
The sub-sample of Italian and Norwegian stakeholders are, in fact, the smallest within the entire considered sample.
The results, moreover, show a general tendency of the stakeholders to be at high levels of interest. An explanation for this could lie in the features of the data source used as research sample. The ETIP dataset used for the analysis only includes, as previously outlined, organizations in the biofuel and bioenergy sector, which are therefore necessarily interested in the related topics.
It is also noteworthy that the results show the existence of stakeholders with extreme scores in the dimension of Interest or Influence. These stakeholders have been considered as outliers and excluded from the matrix population phase to avoid a loss of resolution in terms of the stakeholders’ representation in the matrix. However, this phenomenon requires further analysis before deciding either to exclude such subjects (according to thresholds or qualitative criteria) or to capitalize on them in order to stress extreme features along the two dimensions (Interest and Influence).
All the above-mentioned criticalities can be addressed by further exploiting some characteristics of the adopted methodology, and/or by complementing it with different approaches. With specific reference to the population growth in both empty and under-populated quadrants, it is possible to implement different corrective strategies. Some possible hints for future studies could be briefly outlined as follows.
By applying a web-based snowball sampling [35] it would be possible to use the stakeholders network found on Twitter to identify further “actors” (e.g., government bodies, organizations, research centers, etc.) connected to them. This technique, common in network studies within a digital contexts, is legitimized by the existence of homophilious relationships [36,37] in social networks. In summary, it is assumed that interconnected subjects tend to share similar characteristics: actors strongly connected to the network of the stakeholders under investigation have a good chance of being stakeholders in turn.
Another opportunity would be to enrich the research sample by aggregating further datasets from multiple online databases, which means to proceed with a further exploration of databases legitimated by European governmental bodies and thus to repeat the analysis on a larger sample.

5. Conclusions

This study presents an innovative procedure for stakeholder identification and mapping, based on computational text analysis and social network analysis, to measure both stakeholders’ Interest and Influence in relation to the introduction of an innovative sustainable biofuel technology.
In the process leading to the introduction of this technology, stakeholders play a key role in the social acceptance [38,39,40], and therefore on the resulting use, of the technology instead of traditional fuels with a higher level of GHG emissions.
Several contributions on the acceptance of sustainable technologies report that end users, in their adoption decisions, are influenced by the perceived characteristics of the stakeholders that support these technologies [41,42].
In particular, the influence exerted by some stakeholders, i.e., their authority or perceived competence has a positive impact on the acceptance and adoption probability by end users [43,44,45].
At the same time, the degree of interest expressed by the stakeholder in a sustainable technology, by affecting the probability that it will support the introduction of a technology informing other social actors, can increase, in turn, the other social actors’ knowledge on such a topic: this process has a positive effect on the acceptance of the technology [46,47,48].
Moreover, from a practical point of view, these insights can represent a valuable contribution to the stakeholder management strategy, allowing one to focus on the actors that are more sensitive to specific thematic areas and on their preferred topics. On the basis of such stakeholder mapping within an Interest by Influence matrix, and a parallel topic analysis to characterize each quadrant (and potentially each single stakeholder) with respect to the reference sample, it is then possible to plan targeted activities, either in terms of stakeholder communication contacts activities and/or in terms of the contents of such communication activities. For example, a strategy could be to direct the relational activity toward the most influential stakeholders, in order to indirectly reach other relevant actors through the targeted stakeholder, for a wider success of the communication activities. Another example is to adopt a strategy of content design customized on each stakeholder’s content, on the basis of the specific topics that most characterize its interest.
These are some of the reasons why the literature offers, in addition to a wide collection of theoretical models, a wide range of tools and methodologies for stakeholder analysis and mapping. However, the traditional methodological approach to stakeholder mapping remains predominantly qualitative and mainly implies classification techniques based on experts’ opinions and semi-structured interviews [2,3,10]: unfortunately, such a qualitative approach has a strong impact both on the reliability of the results, potentially biased by subjective choices involved in the survey process, and on the replicability of the results.
Due to its characteristics, the proposed stakeholder mapping technique allows us to overcome these criticalities, by offering a method to classify a wide range of stakeholders through a quantitative approach that can be replicated in different cultural and geographical contexts. This is particularly useful for the management of projects aimed at introducing sustainable technologies that, as in the case of the research project to which this contribution belongs, take place in very large geographical scenarios, such as the European one. On the whole, the presented approach therefore helps to operationalize, in a quantitative way, two factors which are crucial for any sustainable technology acceptance (such as, in the considered case, biofuels): namely, considering the degree of interest and the degree of influence that each stakeholder possesses, in order to better understand its positioning with respect to the new sustainable technology (e.g., biofuel), which needs to be supported in its introduction and adoption. Knowing, for all the relevant stakeholders, both their respective degree of interest in the sustainable technology and their respective degree of influence power in such a social network, offers the chance of getting a useful stakeholder mapping for promoting such a sustainable technology via its relevant stakeholders: once such a stakeholder mapping is realized, consequent actions could be planned to achieve an optimal stakeholder management and communication, which targets the maximization of a sustainable technology’s adoption and diffusion. Moreover, a topic description can be derived from the stakeholders’ interest degree operationalization: this information can be used to further characterize each stakeholder, or each stakeholder group (e.g., those within a quadrant in the Interest by Influence matrix), in terms of specific contents represented within its interest area (and contents which are not featured within its specific interest area). This further possibility, offered by the presented analytical approach—namely, a “stakeholder’s interest content profiling”—allows us to target and address a specific stakeholder, or a stakeholder category, by means of those contents matching its preferred (or least preferred, according to the adopted communicative strategy) topics of interest.
In conclusion, the presented approach not only provides a quantitative way of mapping a sustainable project’s or technology’s set of stakeholders according to their degree of Interest in the project or technology and their degree of Influence on the network of stakeholders relevant to that project or technology; it also offers the possibility of profiling the stakeholders’ interest in terms of relevant contents which substantiate that interest, which can then be used to prepare appropriate contents to address those stakeholders by matching the relevant interest content profiled.

Author Contributions

Conceptualization, M.B., N.L. and F.D.; methodology, N.L., F.D. and M.B.; formal analysis, N.L., F.D. and M.B.; investigation, N.L., F.D. and M.B.; data curation, N.L.; writing—original draft preparation, F.D. and N.L.; writing—review and editing, M.B., N.L.; supervision, M.B.; project administration, M.B.; funding acquisition, M.B. All authors have read and agreed to the published version of the manuscript.

Funding

This project has received funding from the European Union’s Horizon 2020 research and innovation programme under grant agreement number 764089 (“ABC-SALT: Advanced Biomass Catalytic conversion to middle distillates in molten SALTs” [26]).

Acknowledgments

The Authors acknowledge the support and feedback from the ABC-Salt consortium (https://www.abc-salt.eu/): Preliminary internal presentations occurred during two ABC-Salt project meetings (particularly in Stockholm on the 8–9 October 2018 and in Oslo on the 4–5 March 2019); full details are included in the project’s Deliverable D2.4. A preliminary public presentation occurred at the XVI national congress of AIP (the Italian Association of Psychology, Social Psychology Section) held in Rome from 12 to 14 of September 2019.

Conflicts of Interest

The authors declare no conflict of interest.

Appendix A

Table A1. Stakeholders’ Interest (ELBO_STD) and Influence (INDEG_STD) for each of the eight ABC-Salt project Countries 1 (COUNTRY).
ORG NAMECOUNTRYELBO_STDINDEG_STD
ACEABelgium−0.1030.450
AEBIOMBelgium−0.9353.561
Bellona OrganisationBelgium−1.885−0.217
CargillBelgium−1.9160.783
Confederation of European Forest OwnersBelgium−2.9730.228
Copa—CogecaBelgium−8.9051.117
EPSOBelgium0.261−0.106
ePureBelgium0.4742.450
ERECBelgium0.434−0.994
ESA—European Seed AssociationBelgium0.3800.228
essensciaBelgium0.329−0.772
EUBIABelgium0.3791.895
EUFORESBelgium0.4840.117
EUREC AgencyBelgium0.4060.228
EuropaBio/SusChemBelgium−0.0452.339
European Biodiesel Board (EBB)Belgium0.5460.672
EWABABelgium0.0890.006
FEDARENEBelgium−0.3090.228
FEDIOLBelgium0.117−0.994
PraxairBelgium0.497−0.772
Prince of Wales’s EU Corporate Leaders Group on Climate Change (CLG)Belgium0.563−0.328
Schuttelaar & PartnersBelgium0.436−0.883
SGSBelgium0.366−0.439
UNICA—EU OfficeBelgium0.415−0.550
University of Ghent—Ghent Bio-economyBelgium0.5300.228
ValBiomBelgium0.5730.117
VITO Crossroads of TechnologyBelgium0.5670.672
Vrije Universiteit Brussel (VUB)Belgium0.536−0.994
ADEMEFrance−0.9661.561
Agence nationale de la rechercheFrance−0.422−0.217
Air LiquideFrance−0.6851.117
BUNGEFrance−3.153−0.883
Bureau VeritasFrance−3.278−0.661
CIRADFrance−0.2080.339
DeinoveFrance−0.407−0.439
GDF SUEZFrance0.2831.895
IFP Energies NouvellesFrance0.0630.228
INERISFrance0.534−0.550
Investissements d’avenir (CGI)France0.0240.339
ONERAFrance0.610−0.550
PROLEAFrance0.666−0.772
PSA Peugeot CitroenFrance0.5080.117
Safran GroupFrance0.564−0.439
SNPAAFrance0.450−0.439
Sofinnova PartnersFrance0.096−0.550
Syndicat des énergies renouvelableFrance0.4180.117
TechnipFrance0.4670.006
TOTALFrance0.4684.117
ADM European Management Holding GmbHGermany0.176−0.328
Agentur für Erneuerbare Energien e.V.Germany−0.150−0.106
AGQM Arbeitsgemeinschaft Qualitätsmanagement Biodiesel e.V.Germany0.078−0.439
BASF AktiengesellschaftGermany−0.6043.450
Bundesverband Erneuerbare Energie (BEE)Germany−0.8330.117
Caterpillar Motoren GmbH & Co. KGGermany−1.621−0.328
ClariantGermany0.5281.228
DBFZGermany−0.8360.228
DECHEMA e.V.Germany−0.481−0.106
FEV Motorentechnik GmbHGermany−0.263−0.883
Ford Forschungszentrum Aachen GmbHGermany0.5970.117
Fraunhofer ISIGermany−0.209−0.217
General Motors EuropeGermany0.368−0.439
ISCC System GmbHGermany0.3780.006
KIC InnoEnergy GermanyGermany0.0100.783
KWS Saat AGGermany0.263−0.328
Lanxess Deutschland GmbHGermany0.355−0.106
Petrotec AGGermany0.5010.117
TUM—TU MünchenGermany0.2990.006
Union for the Promotion of Oil and Protein Plants (UFOP)Germany0.3540.561
Verband der Deutschen Biokraftstoffindustrie e.V. (VDB)Germany0.3951.339
WIP Renewable EnergyGermany0.258−0.106
ARGO S.r.l.Italy−1.889−0.994
Bologna UniversityItaly0.111−0.439
Central European Initiative (CEI)Italy−1.247−0.772
Centro Ricerche Fiat (Fiat Powertrain Technologies)Italy−0.613−0.439
ENI—Ente Nazionale IdrocarburiItaly0.4551.117
ETA Renewable EnergiesItaly0.5410.228
International Flame Research Foundation (IFRF)Italy0.490−0.883
Technip Italy s.p.aItaly0.4670.006
Università degli Studi di FirenzeItaly0.667−0.661
Università degli Studi di UdineItaly0.667−0.772
Avantium Technologies BVThe Netherlands−2.0640.006
BTG Bioliquids BVThe Netherlands−1.0180.117
BTG Biomass Technology GroupThe Netherlands−1.136−0.439
Centre for Surface Chemistry and Catalysis. KU LeuvenThe Netherlands−0.528−0.217
Energy Research Centre of The Netherlands (ECN)The Netherlands0.4490.450
European Environmental BureauThe Netherlands−0.361−0.217
FeyeCon D&I BVThe Netherlands0.033−0.994
GoodFuelsThe Netherlands0.2590.006
LyondellBasell IndustriesThe Netherlands0.413−0.328
NEN The Netherlands Standardization InstituteThe Netherlands0.189−0.883
NL AgencyThe Netherlands0.547−0.883
PBL The Netherlands Environmental Assessment AgencyThe Netherlands0.562−0.661
Shell Global Solutions International BVThe Netherlands0.5164.450
SkyNRGThe Netherlands0.2470.561
Technip Benelux B.V.The Netherlands0.4670.006
TNOThe Netherlands0.396−0.328
CenBioNorway−3.440−0.661
NIFU Nordic Institute for Studies in Innovation. Research and EducationNorway0.540−0.772
Nordic Energy ResearchNorway0.579−0.550
Norsk Hydro ASANorway0.525−0.994
Norwegian University of Science and Technology NTNUNorway0.6531.006
Research Council of Norway—ENERGIXNorway0.2840.117
SINTEFNorway0.3561.006
Bioenergy InternationalSweden−0.9654.673
f3 The Swedish Knowledge Centre for Renewable Transportation FuelsSweden0.145−0.328
FormasSweden0.583−0.217
Fysisk resursteori CTH/GUSweden0.3700.006
Göteborg Energi ABSweden0.323−0.883
Lund University BiofuelsSweden0.3070.450
Lunds Tekniska HögskolaSweden0.4740.450
PerstorpSweden0.620−0.328
PREEMSweden0.5260.228
ScaniaSweden0.5400.783
SEKAB BioFuel IndustriesSweden0.4670.006
SLU—Unit for Field-Based Forest ResearchSweden0.6451.006
STEM—Swedish Energy AgencySweden0.5161.117
SveaskogSweden0.4420.228
Swedish District Heating AssociationSweden0.3750.450
SÖDRASweden0.5810.117
Vattenfall—CCS R&DSweden0.5451.228
VinnovaSweden0.5690.672
AccentureUK0.1420.228
Argus MediaUK−0.5330.672
BBSRC—Biotechnology and Biological Sciences Research CouncilUK−0.1780.672
Booz Allen HamiltonUK−0.738−0.994
BPUK−2.5851.672
British Agriculture BureauUK−0.8560.450
Cardiff University—Institute of EnergyUK−0.936−0.328
Centre for Process InnovationUK−2.350−0.550
Energy Technologies InstituteUK0.618−0.106
European Energy Innovation—Prologue MediaUK0.5390.228
European Energy Investments LimitedUK0.265−0.994
Heriot-Watt UniversityUK0.560−0.550
Imperial College London—ICEPTUK0.0021.339
INEOS Bio LimitedUK−0.0670.450
Invensys (Shneider Electric)UK0.2680.672
Low Carbon Vehicle PartnershipUK0.515−0.439
Lubrizol Ltd.UK0.435−0.661
National Non-Food Crops CentreUK0.4181.672
NEPICUK0.202−0.328
New Energy FarmsUK0.543−0.439
Newcastle UniversityUK0.591−0.328
Norton Rose LLPUK0.560−0.994
Scottish Association for Marine ScienceUK0.546−0.439
StrategicFitUK0.547−0.994
Syngenta Seeds Ltd.UK0.4190.672
Technology Strategy BoardUK0.6061.561
University of LeedsUK0.581−0.994
VelocysUK0.508−0.772
1 Both ELBO and InDregree Centrality scores are standardized.

References

  1. Grimble, R.; Wellard, K. Stakeholder Methodologies in Natural Resource Management: A Review of Principles, Contexts, Experiences and Opportunities. Agric. Syst. 1997, 55, 173–193. [Google Scholar] [CrossRef]
  2. Reed, M.S.; Graves, A.; Dandy, N.; Posthumus, H.; Hubacek, K.; Morris, J.; Prell, C.; Quinn, C.H.; Stringer, L.C. Who’s in and Why? A Typology of Stakeholder Analysis Methods for Natural Resource Management. J. Environ. Manag. 2009, 90, 1933–1949. [Google Scholar] [CrossRef] [PubMed]
  3. Brugha, R.; Varvasovszky, Z. Stakeholder Analysis: A Review. Health Policy Plan. 2000, 15, 239–246. [Google Scholar] [CrossRef] [PubMed] [Green Version]
  4. Savage, G.T.; Nix, T.W.; Whitehead, C.J.; Blair, J.D. Strategies for Assessing and Managing Organizational Stakeholders. Acad. Manag. Perspect. 1991, 5, 61–75. [Google Scholar] [CrossRef]
  5. Bourne, L.; Weaver, P. Mapping Stakeholders. Constr. Stakehold. Manag. 2010, 99–120. [Google Scholar] [CrossRef] [Green Version]
  6. Bonaiuto, M.; Ludovico, N.; Dessi, F.; La Bella, A. Deliverable 2.4. Stakeholders Map for Socio-Economic Evaluation. In EC H2020 ABC-Salt WP2—Techno-Economic Evaluation—Socio-Economic—Environmental Aspects; Grant Agreement N° 764089; European Community: Maastricht, The Netherlands, 2019. [Google Scholar]
  7. Markwick, M.C. Golf Tourism Development, Stakeholders, Differing Discourses and Alternative Agendas: The Case of Malta. Tour. Manag. 2000, 21, 515–524. [Google Scholar] [CrossRef]
  8. Kuzmin, O.; Khilukha, O. Regulation of Stakeholders’ Interests in Corporate Governance through Negotiations. Економічний часопис-ХХІ 2016, 161, 56–60. [Google Scholar] [CrossRef] [Green Version]
  9. Walker, D.H.; Bourne, L.M.; Shelley, A. Influence, Stakeholder Mapping and Visualization. Constr. Manag. Econ. 2008, 26, 645–658. [Google Scholar] [CrossRef]
  10. Reed, M.S.; Curzon, R. Stakeholder Mapping for the Governance of Biosecurity: A Literature Review. J. Integr. Environ. Sci. 2015, 12, 15–38. [Google Scholar] [CrossRef]
  11. Sullivan, K.; Thomas, S.; Rosano, M. Using Industrial Ecology and Strategic Management Concepts to Pursue the Sustainable Development Goals. J. Clean. Prod. 2018, 174, 237–246. [Google Scholar] [CrossRef]
  12. Johal, R. Factiva: Gateway to Business Information. J. Bus. Financ. Librariansh. 2009, 15, 60–64. [Google Scholar] [CrossRef]
  13. Scales, B.J.; Gilles, M.M. Lexis-Nexis in an Academic Reference Environment: User Policies and Instruction Methods. Ref. Serv. Rev. 1995, 23, 85–96. [Google Scholar] [CrossRef]
  14. Roberts, M.E.; Stewart, B.M.; Airoldi, E.M. A Model of Text for Experimentation in the Social Sciences. J. Am. Stat. Assoc. 2016, 111, 988–1003. [Google Scholar] [CrossRef]
  15. Bi, Y.; Bhatia, R.; Kapoor, S. Intelligent Systems and Applications: Proceedings of the 2019 Intelligent Systems Conference (IntelliSys); Springer Nature: Cham, Switzerland, 2019; Volume 1. [Google Scholar]
  16. Xu, W.; Tan, Y. Semisupervised Text Classification by Variational Autoencoder. IEEE Trans. Neural Networks Learn. Syst. 2019, 31, 295–308. [Google Scholar] [CrossRef] [PubMed]
  17. Mohr, J.W.; Bogdanov, P. Introduction—Topic Models: What They Are and Why They Matter; Elsevier: New York, NY, USA, 2013. [Google Scholar]
  18. Bholat, D.; Hansen, S.; Santos, P.; Schonhardt-Bailey, C. Text Mining for Central Banks. 2015. Available online: https://papers.ssrn.com/sol3/papers.cfm?abstract_id=2624811 (accessed on 1 October 2020). [CrossRef] [Green Version]
  19. Roberts, M.E.; Stewart, B.M.; Tingley, D.; Airoldi, E.M. The Structural Topic Model and Applied Social Science. In Advances in Neural Information Processing Systems Workshop on Topic Models: Computation, Application and Evaluation; Harrahs and Harveys: Lake Tahoe, NV, USA, 2013; Volume 4. [Google Scholar]
  20. Roberts, M.E.; Stewart, B.M.; Tingley, D.; Lucas, C.; Leder-Luis, J.; Gadarian, S.K.; Albertson, B.; Rand, D.G. Structural Topic Models for Open-Ended Survey Responses. Am. J. Polit. Sci. 2014, 58, 1064–1082. [Google Scholar] [CrossRef] [Green Version]
  21. Roberts, M.E.; Stewart, B.M.; Tingley, D. Stm: R Package for Structural Topic Models. J. Stat. Softw. 2014, 10, 1–40. [Google Scholar] [CrossRef] [Green Version]
  22. Berge, C. La Theorie Des Graphes. In Development of Mathematics; Birkhauser: Basel, Switzerland, 2001; Volume 1. [Google Scholar]
  23. Wasserman, S.; Faust, K. Social Network Analysis: Methods and Applications; Cambridge University Press: Cambridge, UK, 1994; Volume 8. [Google Scholar]
  24. Freeman, L.C.; Roeder, D.; Mulholland, R.R. Centrality in Social Networks: II. Experimental Results. Soc. Networks 1979, 2, 119–141. [Google Scholar] [CrossRef] [Green Version]
  25. Prell, C.; Hubacek, K.; Reed, M. Stakeholder Analysis and Social Network Analysis in Natural Resource Management. Soc. Nat. Resour. 2009, 22, 501–518. [Google Scholar] [CrossRef]
  26. Bodin, Ö.; Crona, B.; Ernstson, H. Social Networks in Natural Resource Management: What Is There to Learn from a Structural Perspective? Ecol. Soc. 2006, 11, r2. [Google Scholar] [CrossRef]
  27. Marsden, P.V.; Friedkin, N.E. Network Studies of Social Influence. In Advances in Social Network Analysis: Research in the Social and Behavioral Sciences; Sage Focus Editions: Thousand Oaks, CA, USA, 1994; Volume 171, pp. 3–25. [Google Scholar]
  28. ABC Salt. Available online: https://www.abc-salt.eu/ (accessed on 14 July 2020).
  29. Mimno, D.; Lee, M. Low-Dimensional Embeddings for Interpretable Anchor-Based Topic Inference. In Proceedings of the 2014 Conference on Empirical Methods in Natural Language Processing (EMNLP), Doha, Qatar, 25–29 October 2014; Association for Computational Linguistics: Doha, Qatar, 2014; pp. 1319–1328. [Google Scholar] [CrossRef]
  30. Mimno, D.; Wallach, H.; Talley, E.; Leenders, M.; McCallum, A. Optimizing Semantic Coherence in Topic Models. In Proceedings of the 2011 Conference on Empirical Methods in Natural Language Processing, Edinburgh, Scotland, 27–31 July 2011; Association for Computational Linguistics: Edinburgh, UK, 2011; pp. 262–272. [Google Scholar]
  31. Stakeholders—ETIP-B-SABS 2. Available online: https://www.etipbioenergy.eu/databases/stakeholders-db (accessed on 21 July 2020).
  32. Bastian, M.; Heymann, S.; Jacomy, M. Gephi: An Open Source Software for Exploring and Manipulating Networks. In Third International AAAI Conference on Weblogs and Social Media; ICWSM 2009: San Jose, CA, USA, 2009; pp. 361–362. [Google Scholar]
  33. Huberman, B.A.; Adamic, L.A. Growth Dynamics of the World-Wide Web. Nature 1999, 401, 131. [Google Scholar] [CrossRef]
  34. Adamic, L.A.; Huberman, B.A.; Barabási, A.L.; Albert, R.; Jeong, H.; Bianconi, G. Power-Law Distribution of the World Wide Web. Science 2000, 287, 2115. [Google Scholar] [CrossRef] [Green Version]
  35. Baltar, F.; Brunet, I. Social Research 2.0: Virtual Snowball Sampling Method Using Facebook. Internet Res. 2012. [Google Scholar] [CrossRef]
  36. Zamal, F.A.; Liu, W.; Ruths, D. Homophily and Latent Attribute Inference: Inferring Latent Attributes of Twitter Users from Neighbors. ICWSM 2012, 270, 387–390. [Google Scholar]
  37. McPherson, M.; Smith-Lovin, L.; Cook, J.M. Birds of a Feather: Homophily in Social Networks. Ann. Rev. Soc. 2001, 27, 415–444. [Google Scholar] [CrossRef] [Green Version]
  38. Morone, P.; Imbert, E. Food Waste and Social Acceptance of a Circular Bioeconomy: The Role of Stakeholders. Curr. Opin. Green Sustain. Chem. 2020. [Google Scholar] [CrossRef]
  39. Upham, P.; Oltra, C.; Boso, À. Towards a Cross-Paradigmatic Framework of the Social Acceptance of Energy Systems. Energy Res. Soc. Sci. 2015, 8, 100–112. [Google Scholar] [CrossRef]
  40. Wüstenhagen, R.; Wolsink, M.; Bürer, M.J. Social Acceptance of Renewable Energy Innovation: An Introduction to the Concept. Energy Policy 2007, 35, 2683–2691. [Google Scholar] [CrossRef] [Green Version]
  41. Enevoldsen, P.; Sovacool, B.K. Examining the Social Acceptance of Wind Energy: Practical Guidelines for Onshore Wind Project Development in France. Renew. Sustain. Energy Rev. 2016, 53, 178–184. [Google Scholar] [CrossRef]
  42. Balzarova, M.A.; Castka, P. Stakeholders’ Influence and Contribution to Social Standards Development: The Case of Multiple Stakeholder Approach to ISO 26000 Development. J. Bus. Ethics 2012, 111, 265–279. [Google Scholar] [CrossRef]
  43. Terwel, B.W.; Harinck, F.; Ellemers, N.; Daamen, D.D. Going beyond the Properties of CO2 Capture and Storage (CCS) Technology: How Trust in Stakeholders Affects Public Acceptance of CCS. Int. J. Greenh Gas. Control. 2011, 5, 181–188. [Google Scholar] [CrossRef]
  44. Terwel, B.W.; Harinck, F.; Ellemers, N.; Daamen, D.D. Competence-Based and Integrity-Based Trust as Predictors of Acceptance of Carbon Dioxide Capture and Storage (CCS). Risk Anal. Int. J. 2009, 29, 1129–1140. [Google Scholar] [CrossRef] [PubMed]
  45. Huijts, N.M.; Midden, C.J.; Meijnders, A.L. Social Acceptance of Carbon Dioxide Storage. Energy Policy 2007, 35, 2780–2789. [Google Scholar] [CrossRef]
  46. Wang, S.; Wang, J.; Lin, S.; Li, J. Public Perceptions and Acceptance of Nuclear Energy in China: The Role of Public Knowledge, Perceived Benefit, Perceived Risk and Public Engagement. Energy Policy 2019, 126, 352–360. [Google Scholar] [CrossRef]
  47. Assefa, G.; Frostell, B. Social Sustainability and Social Acceptance in Technology Assessment: A Case Study of Energy Technologies. Technol. Soc. 2007, 29, 63–78. [Google Scholar] [CrossRef]
  48. Barr, S. Strategies for Sustainability: Citizens and Responsible Environmental Behaviour. Area 2003, 35, 227–240. [Google Scholar] [CrossRef]
Figure 1. (a) Keyword network; (b) Degree distribution of nodes in the keyword network.
Sustainability 12 10317 g001
Figure 2. Keyword network resulting from the competing extraction strategy.
Sustainability 12 10317 g002
Figure 3. Documents (a), Words (b) and Token (c) removed by term frequency threshold.
Sustainability 12 10317 g003
Figure 4. Diagnostic values by number of topics: exploration of model solutions from 5 to 30 topics: detail about held-out likelihood (a), semantic coherence (b), residuals (c) and lower bound (d).
Sustainability 12 10317 g004
Figure 5. Topic Quality: ratio of semantic coherence and exclusivity for 10 topic model solutions (from 10 to 20 topics).
Sustainability 12 10317 g005
Figure 6. Topic Proportion and main FREX terms: 15 topics ranked by prevalence in the corpus. For each topic, the most relevant FREX terms are presented.
Sustainability 12 10317 g006
Figure 7. Topic Proportion with label details.
Sustainability 12 10317 g007
Figure 8. ABC-Salt stakeholders network based on Twitter APIs (period 23 March 2012 to 23 March 2019). Node labels refer to stakeholders’ names belonging to the eight Countries involved in the project (Belgium, France, Germany, Italy, the Netherlands, Norway, Sweden, UK). The labels have been truncated to 20 characters for visualization purposes.
Sustainability 12 10317 g008
Figure 9. Degree of Interest of stakeholders from the eight Countries of the ABC-Salt project. The Copa—Cogeca bar has been truncated for visualization purposes (ELBO_STD = −8.905). The labels, which show the names of the stakeholders, have been truncated to 20 characters.
Sustainability 12 10317 g009
Figure 10. Heatmap of Topic Prevalence in each stakeholder’s Country. Each cell refers to the average topic prevalence scores for each stakeholders’ Country (from 0 to 1). The cell color emphasizes the differences among the scores of each Country for a given topic. The lighter colors refer to the Countries that have a lower topic prevalence score in a given topic compared to other Countries. Conversely, darker colors refer to Countries that show the highest scores in a topic.
Sustainability 12 10317 g010
Figure 11. ABC-Salt stakeholders network displayed in a circular layout. The nodes are grouped by Country (node color) and ranked from the largest (maximum InDegree Centrality) to the smallest (minimum InDegree Centrality) node, counterclockwise. The labels, which show the names of the stakeholders, have been truncated to 20 characters.
Sustainability 12 10317 g011
Figure 12. ABC-Salt stakeholders mapped based on the Interest/Influence matrix, by Country. Stakeholders are coloured based on their correspondent quadrant: High Interest/High Influence in dark blue, High Interest/Low Influence in orange, Low Interest/Low Influence in red, Low Interest/High Influence in light blue. Four stakeholders have been reported in a white box at the margin of their correspondent quadrant due to extreme values in the Interest and/or Influence score: Copa—Cogeca (ELBO_STD = −8.905, INF_STD = 1.217; Belgium, Low Interest/High Influence), Bioenergy International (ELBO_STD = −0.965, INF_STD = 4.673; Sweden, Low Interest/High Influence), Shell Global Solutions (ELBO_STD = 0.516, INF_STD = 4.450; The Netherlands, High Interest/High Influence), TOTAL (ELBO_STD = 0.468, INF_STD = 4.117; France, High Interest/High Influence). Each map refers to a specific Country: (a) Belgium, (b) France, (c) Germany, (d) Italy, (e) The Netherlands, (f) Norway, (g) Sweden, (h) UK.
Sustainability 12 10317 g012
Figure 13. Heatmaps of Topic Prevalence by quadrant (Q1, Q2, Q3, Q4), for each stakeholder’s Country. (a) Belgium, (b) France, (c) Germany, (d) Italy, (e) The Netherlands, (f) Norway, (g) Sweden, (h) United Kingdom. Each cell refers to the average topic prevalence scores (from 0 to 1) for each quadrant, in each Country. The cell colour emphasizes the differences among the scores of each quadrant for a given topic. The lighter colours refer to the quadrants that have a lower topic prevalence score for a topic (compared to other quadrants). Conversely, darker colours refer to quadrants that show the highest scores for a given topic.
Sustainability 12 10317 g013
Table 1. List of keywords extracted from the ABC-Salt documents ranked by frequency of occurrence.
Term Frequency
TermFreq.TermFreq.TermFreq.
Biofuel20Industry5Innovation3
Biomass16Catalytic4Integration3
Research11Integrate4Liquefaction3
Molten salt10Liquid4Low carbon3
Energy9System4Suitable3
Fuel9Transport4Supply3
Sustainable9Activity3Technical3
Middle distillates8Advance3Techno-economic3
Technology7Chain3Transnational3
Bioenergy6Circular economy3User3
Hydro-pyrolysis6Feedstock3
Sustainability6Flexibility3
Publisher’s Note: MDPI stays neutral with regard to jurisdictional claims in published maps and institutional affiliations.

