Article

Regional Security Assessment of Integrated Energy Systems with Renewables in China: A Grid-Connected Perspective

1
School of Economics and Management, North China Electric Power University, Beijing 102206, China
2
Beijing Key Laboratory of New Energy and Low-Carbon Development, Beijing 102206, China
*
Author to whom correspondence should be addressed.
Sustainability 2020, 12(24), 10299; https://doi.org/10.3390/su122410299
Submission received: 4 November 2020 / Revised: 2 December 2020 / Accepted: 3 December 2020 / Published: 9 December 2020

Abstract

:
Stable and reliable integrated energy systems are one of the major issues related to sustainable regional and national energy development. Because most existing studies are conducted on whole countries, few address the effects of regional interaction and renewable energy. Therefore, a natural disaster risk assessment model (NDRAM) combined with spatial models is used as a general systematic tool to assess and resolve regional energy security, based on a framework of resources, generation, transmission, marketing and consumption, with 17 metrics. In particular, energy systems were treated as organic connected-units and their security status was regarded as a combined result of potential hazard and system vulnerability. The proposed method was applied to evaluate and classify the security situation of 31 Chinese provinces in 2016. The results showed that transmission had the most significant impact among five major risk sources. The closer grid connections have a stronger ability to deal with risks among regions, where renewables consumption could be better stimulated cross-regionally. In terms of a regional perspective, there is still a gap among different regions, and eastern China presented higher energy risk status. The most energy-hazard provinces are mainly in the east provinces with well-developed levels in Beijing, Tianjin and Shanghai. The least energy-vulnerable provinces are mainly in the abundant natural resources regions such as Inner Mongolia, Sichuan and Xinjiang. The NDRAM-based general model provides a systematic tool for quantitative assessment of regional energy security with a full accounting of regional interaction and renewable energy issues, which may help to develop clean energy, optimize system infrastructure and improve scientific management.

1. Introduction

Energy security has always been a high priority in stable and sustainable energy management for national and regional development. Especially in the era of global climate change and environmental concerns, security issues with renewable energy have been increasingly outlined from both a scientific and political perspective. In the last decade, renewable energy has rapidly increased and provided an effective clean guarantee for energy security. A total of 181 GW of renewable power was added, a consistent pace compared to 2017, and the number of countries integrating high shares of variable renewable energy keeps rising. (REN21, 2019). On the other hand, their rapid expansion poses new challenges for energy systems, such as cross-region scheduling, low reliability, occurring overproduction, etc., which remind us that sufficient security attention needs to be paid to energy systems with renewable energy. To further confirm the energy security situation of different countries, regional integrated power systems have been seen as vital units to provide operational flexibility on national security management. In particular, because the availability of renewable energy generally reflects large differences in resources and demand based on geography, the role of cross-regional grids in energy security should not be ignored. Therefore, systematic studies of the security situations of integrated energy systems with large renewable penetration and grid connections should be conducted, in order to form a greater synergic advantage in the process of energy transition and clean development.
Despite its importance, limited attention has been paid to the perspective of different regions within the country based on cross-regional grids. Fortunately, the studies conducted on energy security generally include definitions and assessments on global, national and regional scales which can provide helpful references.
The definitions of energy system security are varied as provided by different researchers in academic papers, governmental and industrial publications [1,2,3]. According to the objectives and emphasis of specific studies, energy systems can be illustrated as objects exposed to security threats, or referred to as security of demand and supply or a subject generating or enhancing insecurity caused by economic, political, technology and environmental risk factors [4,5]. The indicators generally concern two inter-related dimensions: a physical dimension, referring to available, reliable and/or assessable energy supply [6,7], and an economic dimension that incorporates aspects such as price volatility and affordability [8,9]. Concerning the security studies focused on renewable energy participation, the availability and affordability of energy security are still most impactful, and the promotion of renewable energy is compelling for national energy security strategies, which could bring environmental benefits and sustainable security [10]. Although the specific descriptions vary, the main consensus is that any jurisdiction that has an integrated indispensable energy system is responsible for meeting its end-use energy demands, safely and reliably, regardless of its level of development or size [11].
In terms of security assessment and evaluation, they have been quantitatively measured by a number of scientific assessment methods from various angles based on an adequate energy security framework [12]. Indicator approaches commonly focus on empirical calculations of indicators [13] or simulation tools to analyze interdependence among various energy sources [14]. Moreover, the indexes widely used in the disciplines of ecology, cybernetics and genetics have been cross-applied in energy security, such as the Shannon-Wiener index in ecology [15] and the Herfindahl–Hirschman index in competition economics [16]. Although various indicators and methods have been developed, certain issues still need to be addressed. Specifically, since energy systems with the characteristics of geographical dependency change dynamically, there are some studies conducted from spatial and/or temporal perspectives [17], focusing on specific areas at the national [18], regional [19], or interstate [20] levels. With the prevailing scientific attitude on the global economic and geopolitical scene, a spatial geo-economic perspective has been proposed gradually in energy security research [21]. The effectiveness of existing research is somewhat limited since interactions among grid-connected regional energy systems were not systematically considered, which may consequently be considered an important factor in energy security evaluation [3].
China is facing pressure on energy security [22] and is home to nearly 30% of the world’s renewable power capacity, totaling approximately 647 GW and achieving 26.4% of the renewable share of total energy generation of China in 2017 [23]. Meanwhile, China has a great spatial disparity of energy endowment, economic development and industrial structure, and even of social and cultural customs at the provincial level [24,25]. Therefore, limited research on regional energy security issues in China has been carried out in recent years. The results show that all provinces confronted threats related to energy availability and diversity, and also identified the most energy-secure regions. From a grid-connected perspective, China has a complete and efficient regional transmission and distribution network and plans to build 16 new ultra-high voltage direct current lines, in order to connect wind and solar power regions to demand centers. Therefore, China is a most suitable sample for a case study of regional energy system security with rapid renewable energy expansion and developed power grid dispatch. Moreover, grid interconnection among provinces from a new spatial perspective for determining the power security performance of Chinese provincial energy systems would be novel and meaningful [26].
In summary, existing studies on energy security have the limitation of paying little grid-systematic attention to regions’ interaction within the country accompanied by a high proportion of renewable penetration. Therefore, this paper aims to develop a comprehensive energy security assessment criteria framework for the 31 Chinese provinces that consists of 17 indicators from 5 dimensions, thereby highlighting spatial disparities and interaction issues and providing a new insight to consider the energy systems as interconnected and recoverable systems in security issues. In an effort to achieve this goal, a natural disaster risk assessment model is used in this paper as a fundamental system-oriented framework, in order to establish a comprehensive framework matched with the definition of resilient energy systems. Moreover, a systematical assessment framework with spatial grid transmission dimension and high renewable energy penetration factor is likely to be more reliable, and would enrich the research interests and understanding of regional security issues in China.
The remainder of the paper is organized as follows: The next section introduces the assessment framework and methodology that have been used to measure energy security. This includes the methods selected and how the main methods are aggregated to form system comprehensive risk index (SCRI) sub-indexes. Section 3 presents the security assessment framework and processing procedure of the integrated energy system. Section 4 discusses the main results concerning the Chinese empirical research of the proposed framework. Finally, conclusions and suggested policy and research are presented in Section 5.

2. Methodology

The security assessment framework and methodology are presented briefly in this section, as shown in Figure 1. This study constructed the assessment framework and empirical study in four steps. First, a 17-metric framework was established based on the literature review from 5 risk sources: resources, generation, marketing, consumption and transmission. The transmission indexes were modeled and described by a spatial weight matrix and Moran’s I test models, which are expounded in Section 2.1. Next, the paper is designed to provide a system comprehensive risk index (SCRI) and two sub-indexes, a hazard index (HI) and vulnerability index (VI), based on a natural disaster risk assessment method for traceable analysis, which would better break down regional risk situations as illustrated in Section 2.2. Then, the selected indicators are normalized. The normalized indicators are objectively weighted through an entropy method. Finally, empirical studies and classification results for the 31 Chinese provinces were carried out.

2.1. Moran’s I Test Models

Moran’s I test models are commonly used to study spatial autocorrelation, and are used to describe and test the grid connection among regions in this paper. Global Moran’s I is the earliest method applied to global clustering tests [27], which can judge whether the distribution features of the adjacent regions’ attributes are random, clustered or dispersed. Global Moran’s I is expressed as
I = n i = 1 n j = 1 n w i j ( x i x ¯ ) i = 1 n j = 1 n w i j ( x i x ¯ ) 2 = i = 1 n j 1 n w i j ( x i x ¯ ) ( x j x ) ¯ S 2 i = 1 n j = 1 n w i j
w i j = [ w 11 w 12 w 1 n w 21 w 22 w 2 n w m 1 w m 2 w m n ]
where, n is total number of study areas; x i and x j represent the variable at location i and j ; x ¯ = 1 n i = 1 n x i is the mean value of the variable with the sample number; S 2 = 1 n i ( x i x ¯ ) 2 is the variance of the variable; and w i j is the spatial weight, which can be represented based on inverse distance, fixed distance, K nearest neighbors, contiguity edges only/corners and customize.
Local Moran’s I index is used to test whether there are similar or different observed values in local areas. The local Moran’s I index of the region i measures the relevance degree of a region with its connected regions. It is defined as
I i = ( x i x ) ¯ S 2 j i w i j ( x j x ¯ )
A positive local Moran’s I value refers to a study region that has high or low values similar to its neighbors, which means spatial cluster. On the other hand, a negative local Moran’s I value indicates a potential spatial outlier that is different from the values of its surrounding locations [28].
A custom grid interconnected spatial weight matrix was established based on the situation of Chinese grid subdivision and UNV transmission lines, in order to accurately reflect the system connectivity in various provinces. The result of the local Moran’s I index was selected as an important index to measure the tightness of transmission of each province after it was pre-checked by the global Moran’s I index.

2.2. Natural Disaster Risk Assessment Method

Risk assessment of natural disasters is defined as an assessment of both the occurrence probability and damage degree of natural disasters. With the continuous expansion of research, this method has been widely used in global climate change, human health, energy systems and other research fields [28,29,30,31,32]. Combining different research objects and perspectives, the concept of risk gradually evolved into multiple conceptual sets of concepts such as inclusion, sensitivity, adaptability and resilience. The common concept was proposed by the United Nations Development Programme [33] as Function (4). Hazard is the dangerousness of disaster-causing factors. Vulnerability can be understood as the vulnerability of the hazard-affected body or the vulnerability of the disaster system according to the user’s requirements.
Risk = Hazard × Vulnerability
Considering the applicability of the natural disaster method to an energy system security field, the hazard of energy systems refers to the possibility that the system cannot guarantee operation with the existing conditions. The hazard is various among regions with different basic conditions. As for the same degree of hazard in different regions, the degree of damage caused by risk is also different; namely, the vulnerability varies. Vulnerability is used to represent a region’s susceptibility to risks and the ability to respond. A greater hazard index and lower vulnerability index would reflect a poorer energy security situation. System comprehensive risk index (SCRI) is expressed as
R S = H × V
H = h = 1 n ( x h × w h ) ,   V = v = 1 n ( x v × w v )
where R s is the system comprehensive risk index (SCRI); H is the hazard index (HI); V is the vulnerability index (VI); R s , H , V [ 0 , 1 ] ; x h , y n are the standardized values of the system hazard and vulnerability index; w h , w v are the weight of the two indexes. The metrics from the 5 risk dimensions would be divided into the hazard index (HI) and vulnerability index (VI) to carry out the assessment and empirical analyses of the integrated energy systems.

3. Security Assessment Dimensions and Metrics of Integrated Energy Systems

3.1. Integrated Energy System Security Assessment Framework

To provide a comprehensive and systematic security assessment of an integrated energy system at a provincial level, this study synthesized various dimensions and metrics from the literature and official publications. The paper presents the risk sources of interprovincial integrated energy systems as resources, generation, transmission, marketing and consumption, which take the classification example of the study of traditional energy system security risk appraisal [34]. The framework is a synthesis of the existing indexes, taking full account of the electricity grid and renewable energy. As Table 1 presents, these 5 risk sources can be effectively broken down into 17 components, and thereby measured with 17 metrics. The selection of components for each dimension is based on an adequate literature review, with detailed discussion of each dimension in Section 3.1.1, Section 3.1.2, Section 3.1.3, Section 3.1.4, Section 3.1.5.

3.1.1. Resources

Energy availability is the top consideration in energy security definitions over time. The self-sufficiency and developed degree of exploitability can reflect the capacity of available resources in a certain area. Since there is a growing need of awareness to utilize energy resources in an environmentally-friendly way, environmental and sustainability indicators have increasingly become part of energy security considerations. A diversity factor is the key issue to determine the availability of energy resources [47]. The source of diversity is significantly dependent on the degree of the technical exploitation of the renewable energy.

3.1.2. Generation

Generation risks can be caused by the capacity or the pollution in a power generation process. The generation capacity can reflect the annual output and the utilization characteristics of generation equipment. Renewable sources can significantly enhance the sustainability situation, and their generation amount represents the cleanliness level of regional generation. In particular, utilization and cleanliness metrics should be of reasonable scope; though there has much room to improve in Chinese actual operating situations, the metrics were set as greater preferred indexes.

3.1.3. Transmission

The infrastructure of transmission is integral in providing stable and uninterrupted energy supply. Transmission risk is more common because the grid covers a wide and complex area with multiple nodes and electricity losses. To reflect the trans-regional, multi-channel and large-scale transmission and deployment of power, validated spatial correlation analysis [40] was applied in the transmission dimension. In depicting the transmission risks, this paper considered adequate investments in infrastructure to be proof and guarantee of energy security, while the connected situation and the convergence degree among adjacent areas would reflect resistance [48].

3.1.4. Marketing

Economic development is dependent on the energy system; in turn, improvement of the energy system is dependent on economic and electricity marketing factors. Basically, energy price determines the affordability of energy supplies [1]. The more electricity required per GDP means a stronger capacity to absorb, and an integrated system has less risk when there is strong energy demand. The elasticity coefficient of energy production and consumption expresses the advanced or backward conditions between the power industry and regional economic development. Generally, the development of electric power should be faster than that of the regional economy. If this is backward, the risk to the energy system will be greatly increased.

3.1.5. Consumption

Consumption risk can result from a rapid expansion of the amount of consumption and the pollution created in this process. Consumption expansion can be measured by annual electricity consumption and the difference between supply and demand, while the consumption situation for renewable energy can reflect the potential environmental pollution caused by consumption.

3.2. Data Collection and Processing

Considering the incomplete statistics of Hong Kong, Macao and Taiwan, the basic data of the 31 Chinese provinces in 2016 were collected from the 2016 China Statistics Yearbook [49]. Table 2 presents the characteristics of the provincial energy security original data, the standardized mean and the weight of each metric.
The weights of the indicators can be assigned based on expert opinions or other subjective procedures. The study selected the entropy evaluation method, a more objective approach, to give weight to the metrics, and aggregated the weighted indicators into a composite index. Since the selected metrics are in different units of measurement, three steps are needed to aggregate them to form a composite index. They are (a) normalizing the indicators, (b) weighting the normalized indicators, and (c) aggregating the normalized indicators. The common practice in normalization is using one of the following methods: min-max, distance to reference and standardization. The metrics data are normalized on a min-max approach by the following equations:
Greater preferred metrics
x i b = ( x i b min x b ) / ( max x b min x b )
Smaller preferred metrics
x i b = ( max x b x i b ) / ( max x b min x b )
where x i b is the normalized value of the province i with respect to the metric b , x i b represents the original value and max x b , min x b are the maximum and minimum value of the 31 provinces with respect to the metric b .
Based on the normalized original data, the weight of the metrics was estimated with Equations (9) and (10)
w b = ( 1 H b ) / b = 1 n ( 1 H b )
H b = 1 ln m f b ln f b
where w b is the weight of metric b , w b [ 0 , 1 ] ; H b is the information entropy; and f b is a metric’s weight. The comprehensive index of a given province is calculated in Equation (6).

4. Results and Discussion

4.1. Convergence Characteristics of Interprovincial Grid Connection

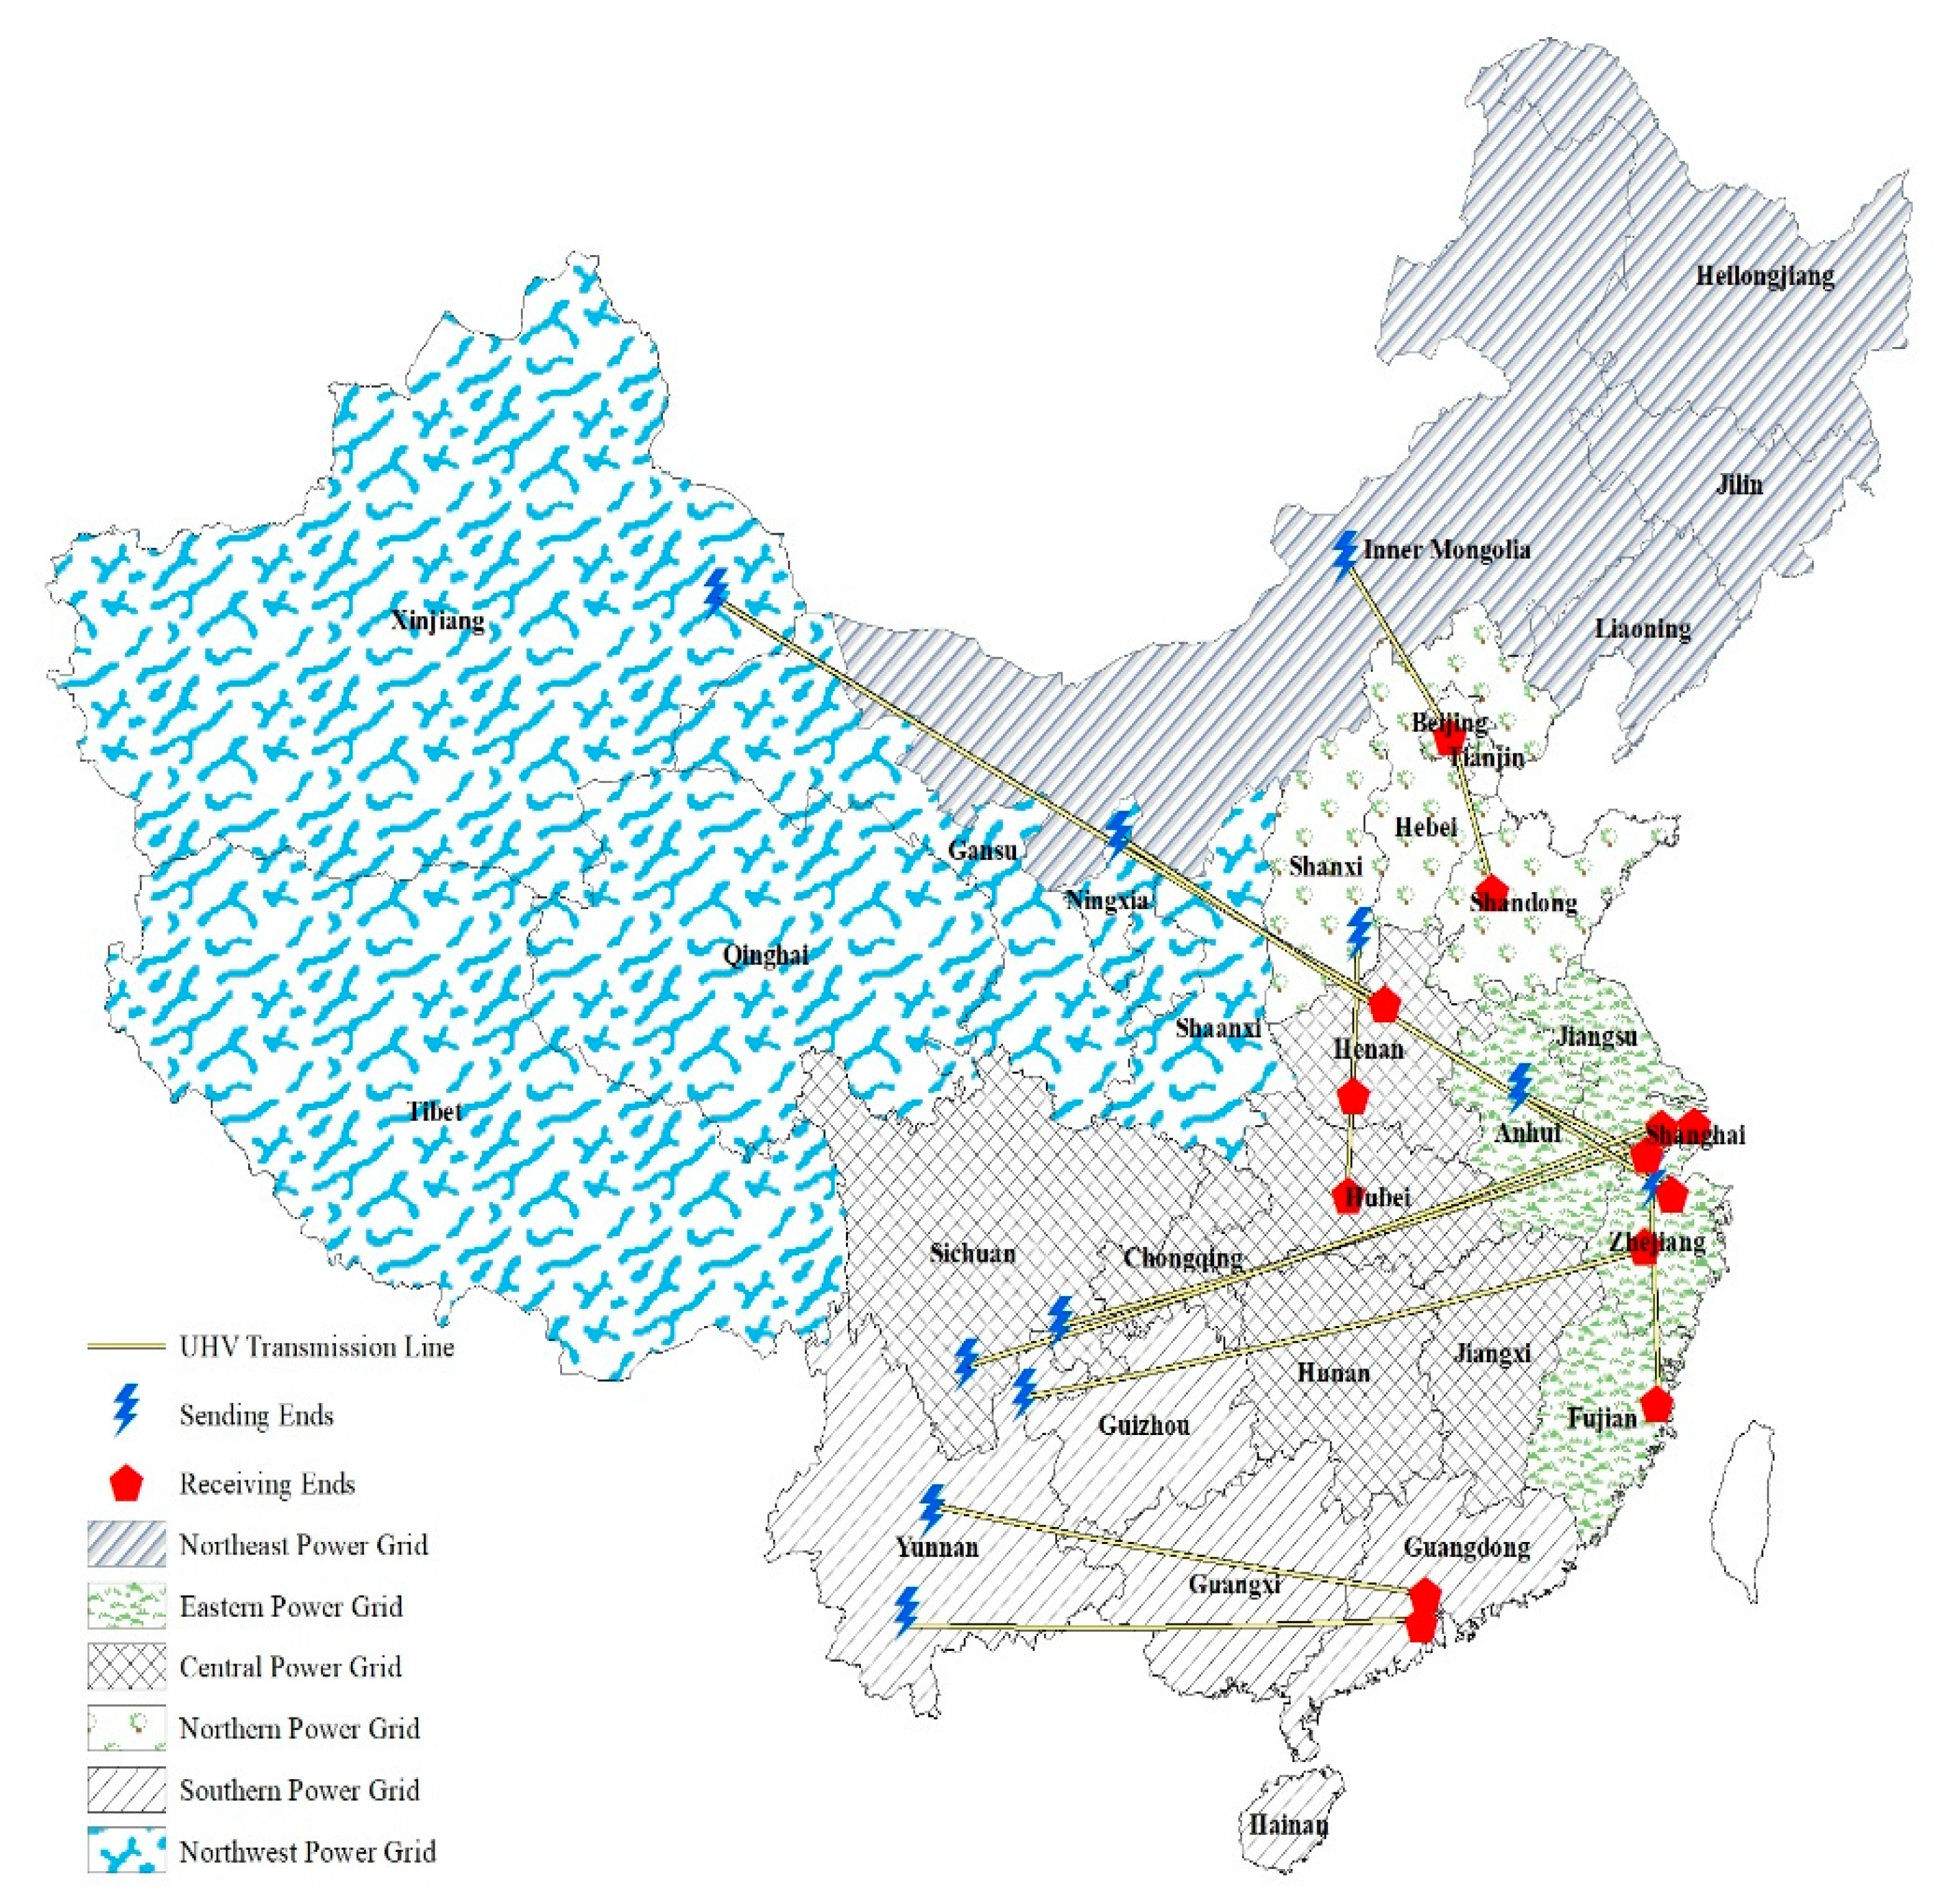
In order to analyze the components of connectivity (A31) and convergence (A32), the situation of the grid network in the 31 Chinese provinces is collected and scientifically simplified into regional power grids and cross-regional ultra-high voltage (UHV) transmission lines.
As for the regional power grids, they are composed of adjacent provincial power grids with a dispatch and management center. As a consequence, the provinces in the interprovincial grid are strongly connected and can act as reliable security providers reciprocally. Table 3 lists six Chinese regional power grids and their comprised provinces.
In terms of cross-regional UHV lines, China had 11 operated UHV lines until 2016 as shown in Table 4. These UHV lines delivered 172.4 billion kilowatt-hours of renewable energy accounting for 74% of total transmission capacity. Among them, lines 1–4 are AC-UHV lines with substations. They can make up the national UHV backbone network according to the actual needs of power distribution, load distribution, transmission power and power exchange. The lines 5–11 are DC-UHV transmissions without intermediate point, namely, the power can be transferred directly to the load center by point-to-point, high power and long distance.
Based on the situations of Chinese grid subdivisions and UHV transmission lines as drawn in Figure 2, a custom grid interconnected spatial weight matrix was established. In the matrix, the connected relations of every province assume that one province is closely associated with other provinces in the regional grid and through UHV transmission lines. Using the weight matrix to carry out the Moran tests, the pretest results of global Moran’s I model for various attributes are shown in Table 5.
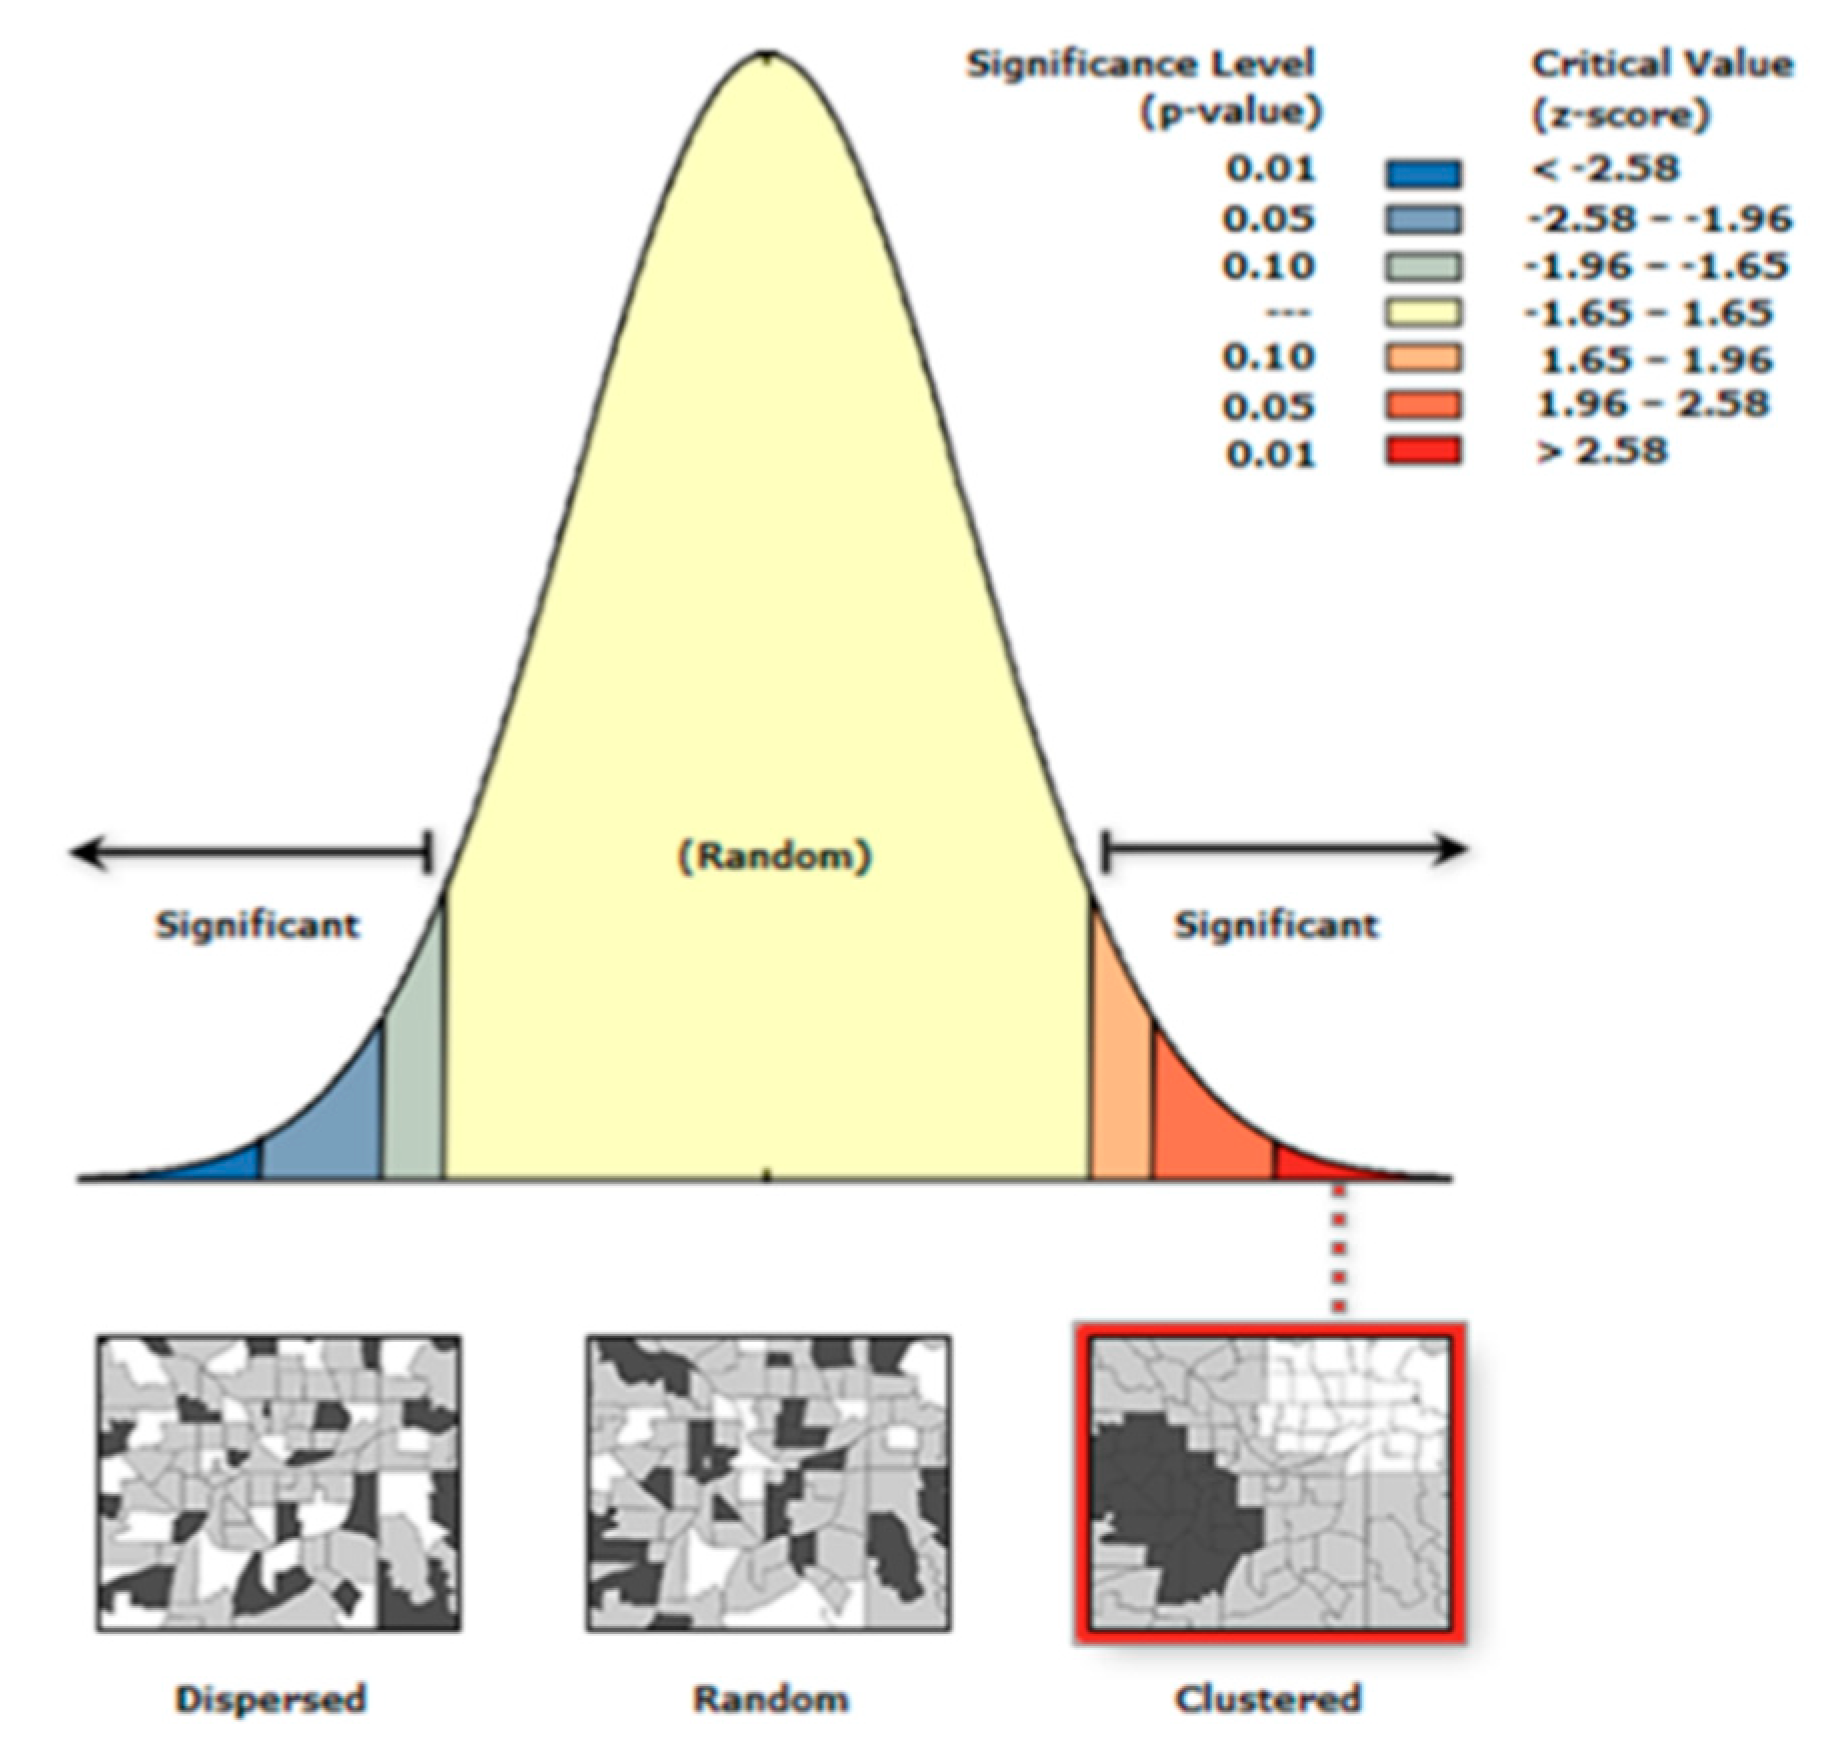
Significant weight was given to the P value obtained by the statistical significance test method; p < 0.05 means statistic difference, and p < 0.01 means statistically significant. According to the spatial autocorrelation report, renewable electricity consumption amount and non-hydro renewable electricity consumption amount are clustered and distributed at a significant level of 0.05; the ratio of non-hydro renewable energy consumption is clustered at a significant level of 0.01, as shown in Figure 3, with the most significant level.
The test result is consistent with the current situation of renewable energy, especially illustrating that wind and photovoltaic power can be exploited and utilized by the electricity grid. Further, the links among provinces through transmission infrastructure are better reflected by a non-hydro renewable electricity consumption ratio. Therefore, the local Moran’s I model is performed as a resulting code of the metric B32-Local spatial autocorrelation, as shown in Figure 4.
According to the results of the local Moran’s I index of the 31 provinces, the northeastern region is a typical high-value cluster, which is closely related through grid connection and generally at a high ratio of non-hydro renewable energy consumption. Central China and East China are typical low-value clusters. The intra- and inter-regional grid connections are closely related, and there is generally a low ratio of non-hydro renewable energy consumption. The level of the Beijing-Tianjin-Hebei in North China is quite different from that in Shandong and Shaanxi. In the southern regions with low general prevalence, Hainan and Yunnan are regional outliers with high value based on their consumption. The northwest region is at a higher level except in Shaanxi. In conclusion, the UHV grid has a significant effect on regional linkages, and the regional outliers have weaker connections and capabilities in responding to regional energy system risks.

4.2. Weight of Grid-Connected Integrated Energy System Security Metrics

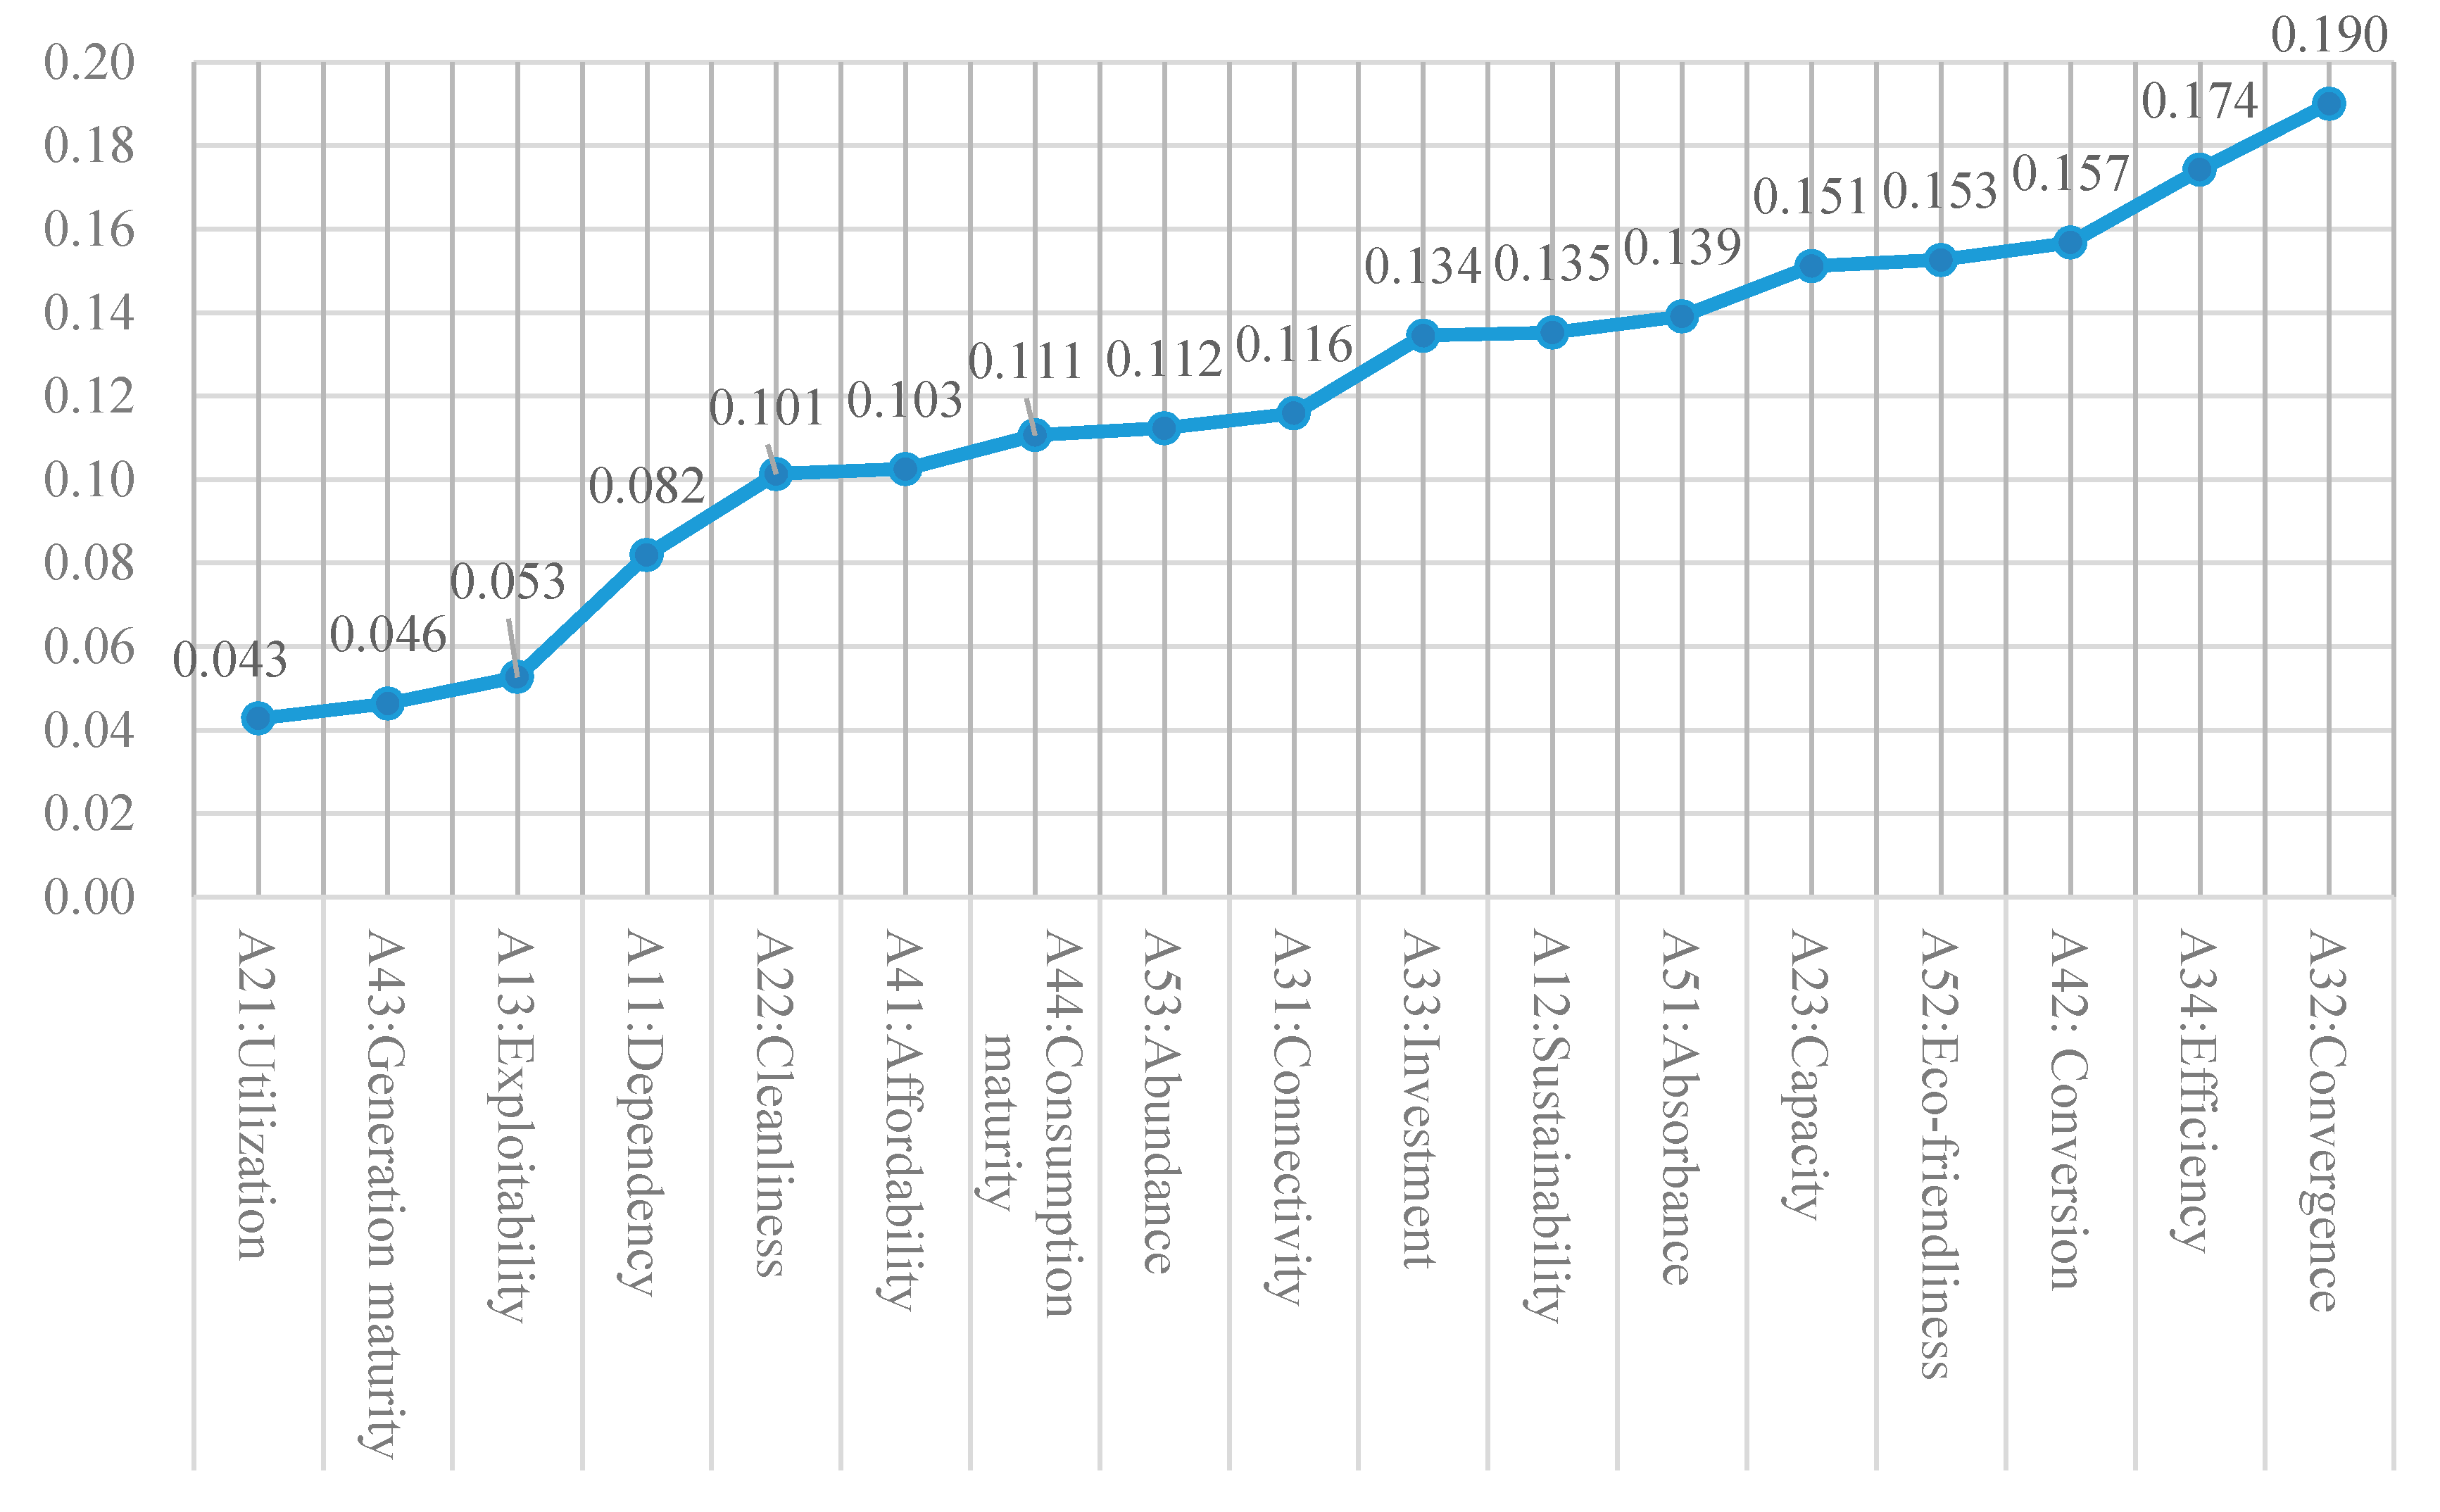
Considering the objectivity and reliability of the metrics, the weight of the 17 metrics was determined by the standardized processing and entropy method. The weights of the 17 metrics are shown in Figure 5, and the weights of the 5 dimensions (resources, generation, transmission, marketing and consumption) were presented as follows:
W = ( 0.270 , 0.295 , 0.615 , 0.416 , 0.404 )
According to the data and weights analysis results, the metrics were sorted at small intervals. Among nine hazard indexes, B42-Electricity consumption per unit GDP (0.157) and B52-Consumption cleanliness (0.153) had a greater influence on the risks of the system, with electric power consumption and production given as the risk source, while the impact result from B11-Self-sufficiency (0.082) and B21-Utilization hours of installed capacity (0.043) were on a small scale. This can be interpreted as showing that the supply and development of energy resources are relatively safe in China. Among eight vulnerability indexes, B32-Local spatial autocorrelation (0.190) and B34-Electricity transmission losses (0.174) have the greatest impact on system vulnerability, showing that the enhancement of power grid connection and transmission efficiency can improve the resistance ability of energy systems to face random risk. B43-Generation maturity is the least influential factor, which indicates that the current generation level can better withstand risk.
From the perspective of risk source analysis, transmission (0.615) had the most significant impact. After this, the marketing dimension (0.416) and consumption dimension (0.404) also had larger impacts on grid-connected integrated energy security performance. It can be seen that marketing has a great influence on the risk of the integrated energy system in terms of price affordability, consumption capacity, consumption structure, demand difference and economic and social development. In the future, rational consumption structure adjustment and electric energy substitution can be used to reduce the risk to the system.

4.3. Energy Security Performance of Integrated Energy System

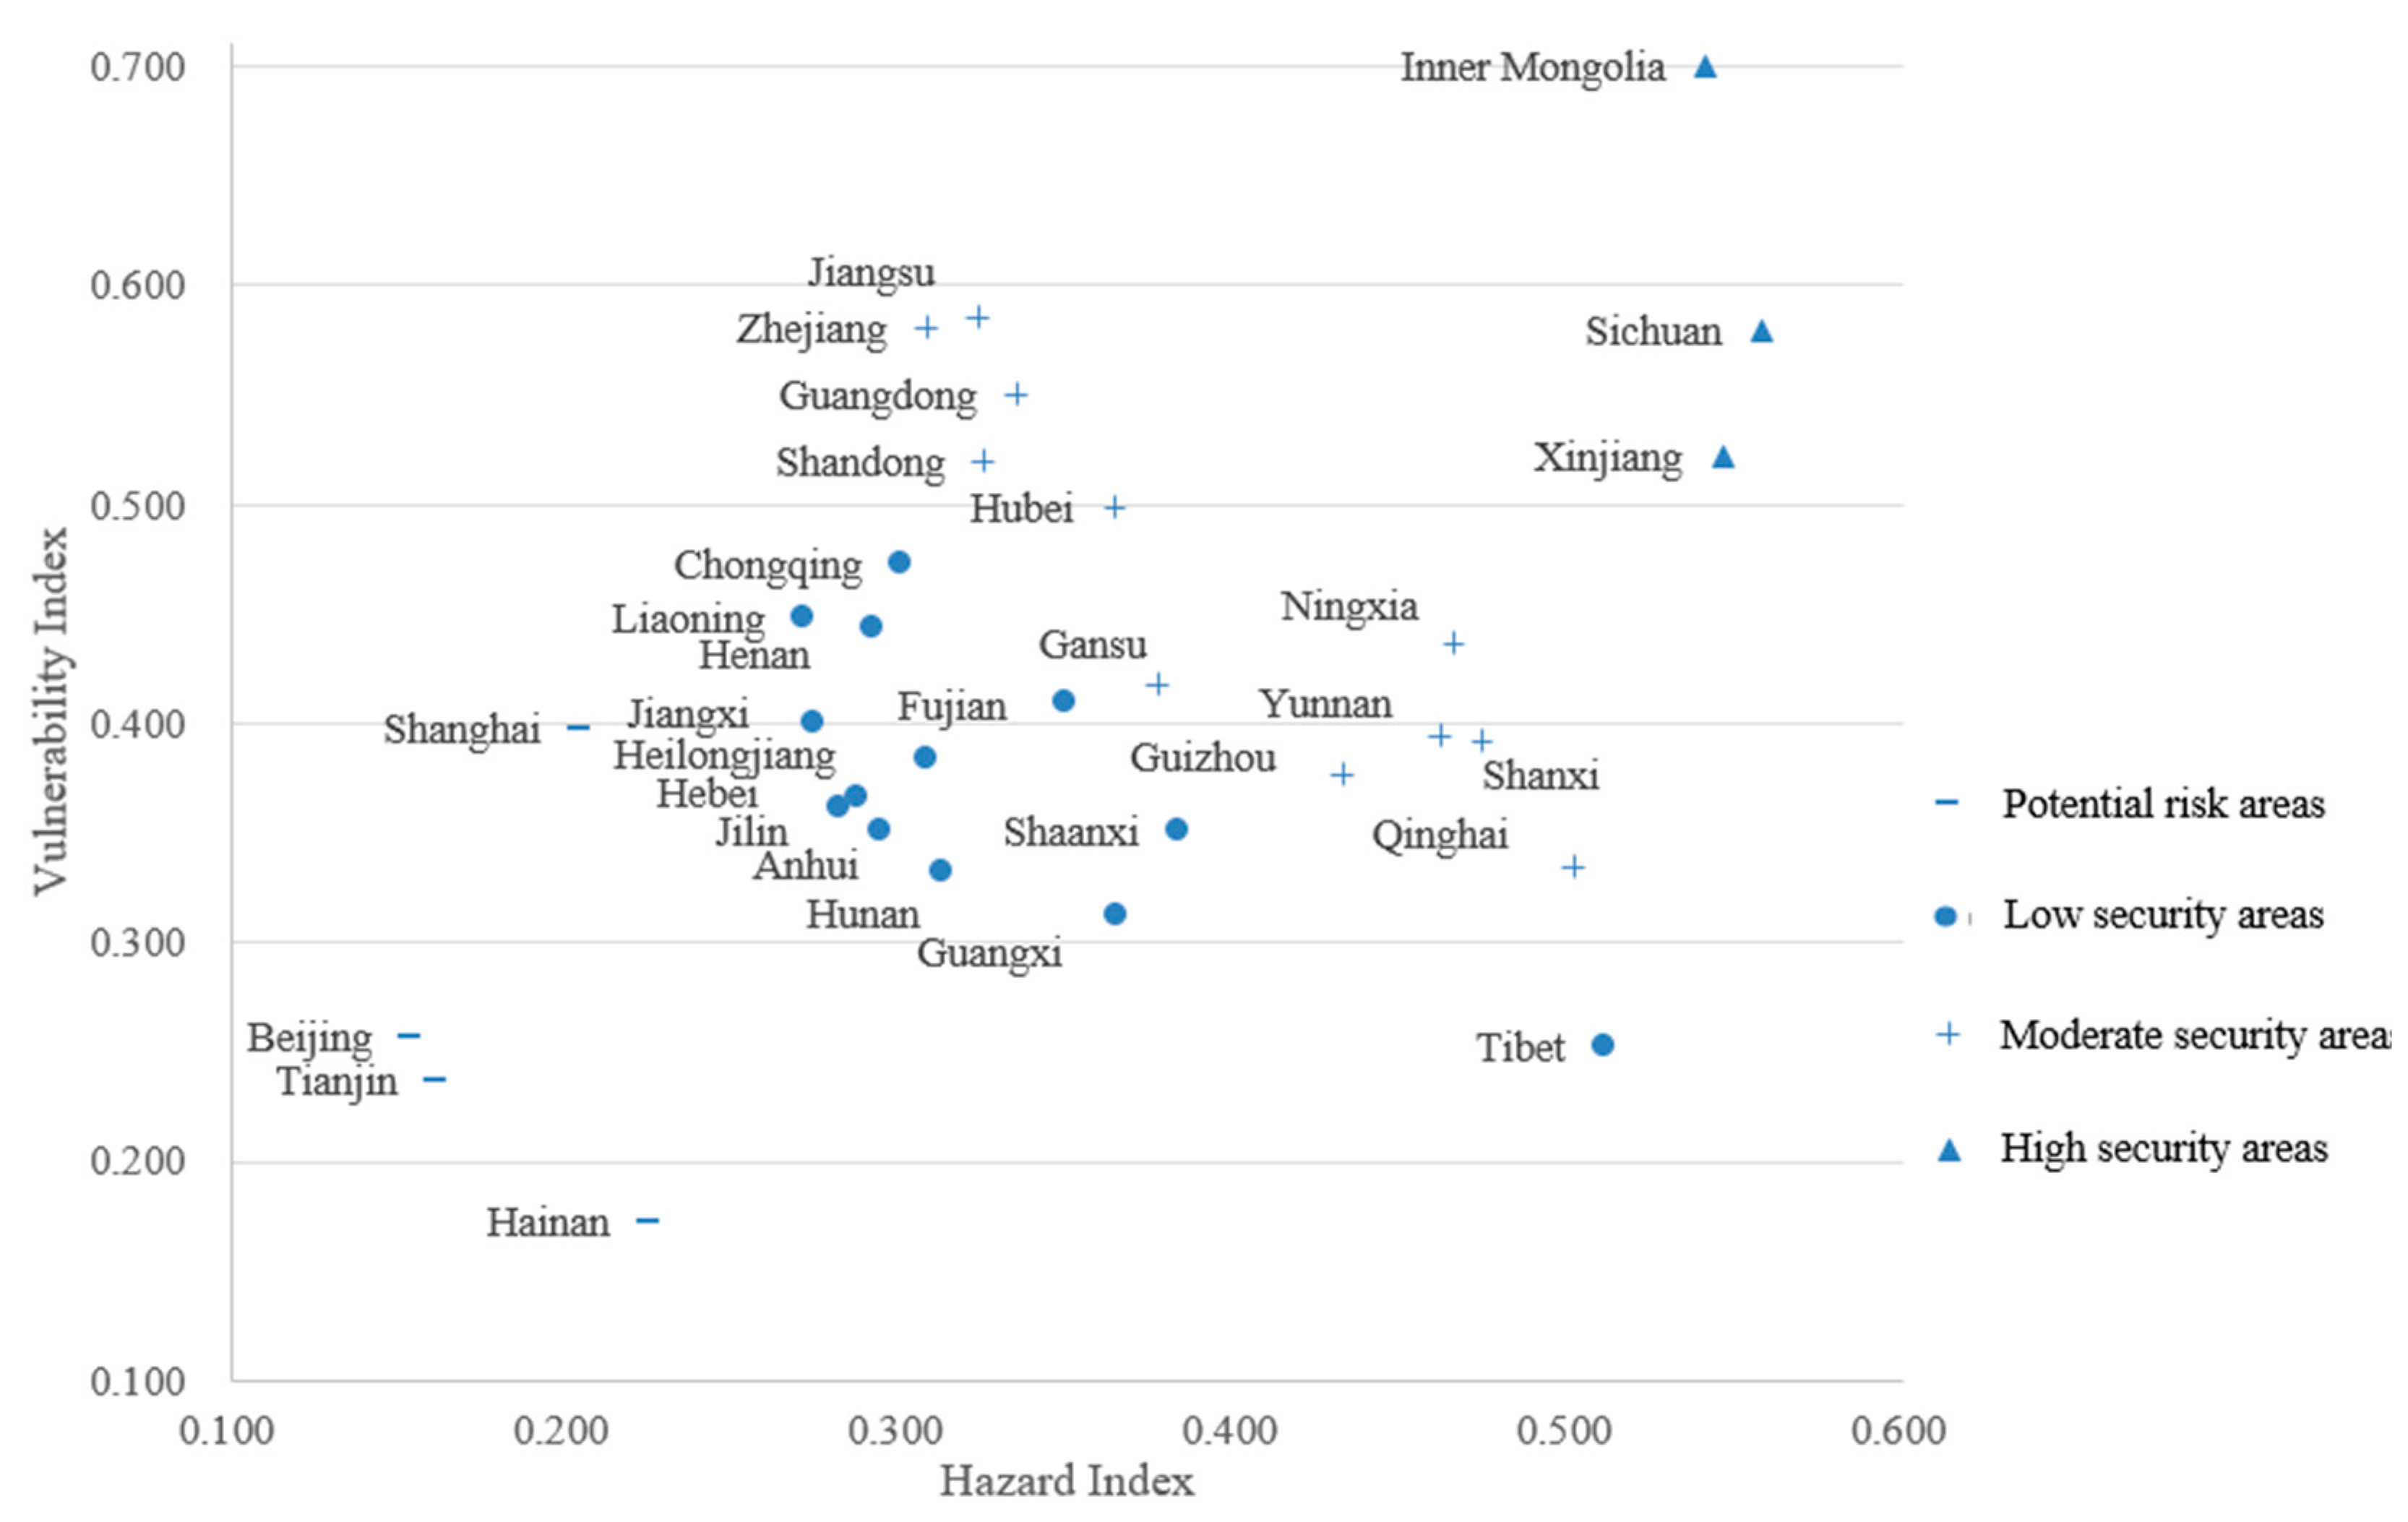
According to the results of the data and weight processing, the hazard index (HI), vulnerability index (VI) and system comprehensive risk index (SCRI) of the 31 Chinese provinces were evaluated. The 31 provinces are divided into potential risk areas, low security areas, moderate security areas and high security areas by using the natural breakpoint method for the SCRI. The HI/VI index score of the 31 provinces in each subdivision are presented in Figure 6.
From the origin of the risks, the results show that the security areas of the 31 Chinese provinces are consistent with the regional economic and energy construction development levels. For example, Beijing is classified into potential risk areas with a lower energy self-sufficiency rate and proportion of renewable energy generation and consumption, and the development of its electricity market consumption lags behind the level of its economic and social development, resulting in higher system risk. Meanwhile, its potential development of renewable energy is lower, and the amounts of installed capacity and energy generation are small. Namely, the ability to resist risks is low and the integrated energy system is relatively fragile. Under the effects of systemic risk and resistance, the integrated energy system is relatively fragile. In the high security area, Inner Mongolia is fully self-sufficient and the technical amount of renewable energy ranks first among provinces. Further, its production of renewable energy is well-consumed, so the system risk is low. According to the hazard and vulnerability situation of the integrated energy system, the risk situation and causes of each province could be traced.
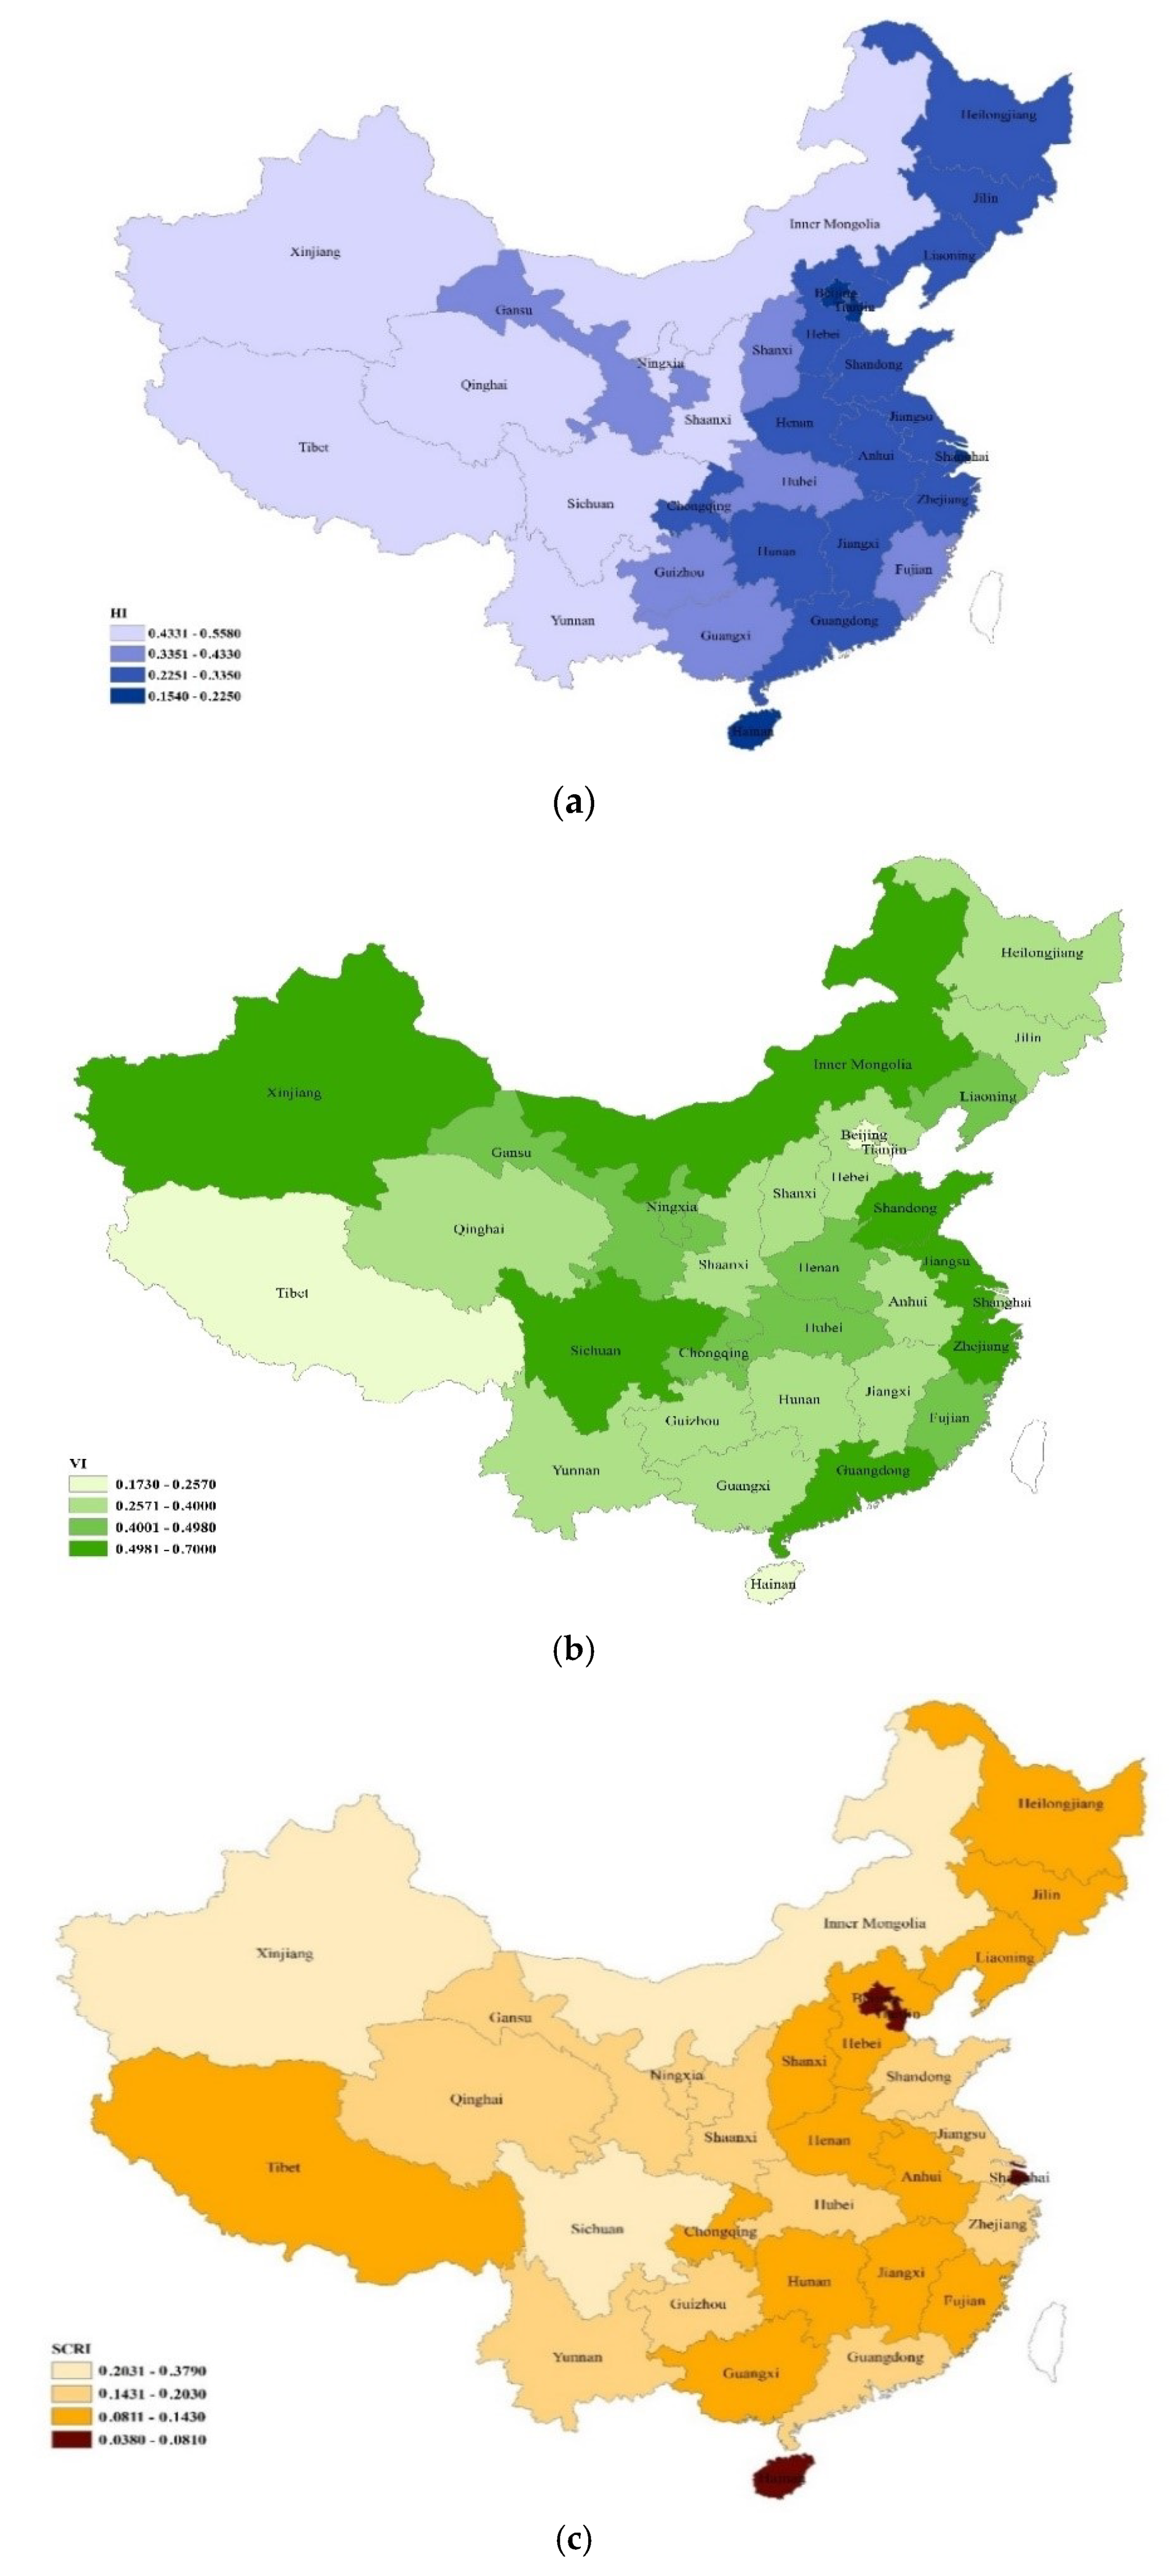
From the perspective of geographical distribution, the study combined ArcGIS and the provincial energy system risk results to obtain a corresponding spatial distribution profile as shown in Figure 7. In terms of hazard, the eastern region is more dangerous than the central and western regions, and the overall decline is from the east to the west. In terms of vulnerability, the central region is more vulnerable because of the close grid-connection. Figure 7c visually presents the results of the risk assessment of the 31 Chinese provinces under the combined effects of hazard and vulnerability.

5. Conclusions

The security of regional integrated energy systems has great significance for improving energy utilization efficiency and promoting large-scale development of renewable energy. This paper comprehensively addressed energy security issues at the regional level, which is vital for systematic and large-scale energy development and was not sufficiently addressed previously. Because of the lack of a systematic approach for regional energy security, natural disaster risk assessment was introduced to establish a comprehensive assessment framework of regional energy systems. The empirical study of Chinese provinces quantitatively measured the hazards and vulnerability with 5 dimensions and 17 metrics. The regional inter-relationship and interactions were highlighted and fully considered through a spatial method. The proposed method can solve the problem of energy security with renewable energy and grid connection, and help evaluate energy security for different regions or countries.
First, a spatial weight matrix enabled us to portray the connection aggregation relationship among regions. The results of the Chinese provinces showed that renewable energy consumption shows a significant aggregation, that is, the grid connection among each province has a positive effect on renewable energy development. From the perspective of each region, the Northeast, Central China and East China regions are typical clustering regions. There intra- and inter-regional grids are closely connected, and the grid connection has a strong ability to cope with risks. Therefore, the spatial weight matrix is worthy of further discussion on grid connectivity to realize integrated development.
Second, the security assessment framework takes full account of the renewables and grid connection, and regards the regional energy systems as organic units. The natural disaster risk assessment method demonstrated its applicability to break down energy system risks into hazard and vulnerability aspects, which helped to analyze and explain systemic risks in a traceable way. In the objective weighting process, transmission had the most significant impact, which should be paid more attention in further energy research.
Third, a subdivisions study was conducted with a hazard index and vulnerability index, based on which suggestions could develop and a more targeted analysis of risk in various areas can be carried out. Further, the causes of risks can be circumvented and weakened, and the ability of the system to resist risks can be improved. The 31 Chinese provinces were divided into four subdivisions based on the results of risk measurement. In terms of hazards, the eastern region exhibits more than the central and western regions, and the overall decline is from the east to the west. The analysis results are in good agreement with practical experience, and would help with systematic evaluation and make up for relative research from the perspective of resources and transmission.
Overall, the assessment framework proposed in this paper provides a general tool for the systematic evaluation of regional energy security issues. In this paper, the model was specifically applied to 31 Chinese provinces. It should be noted that China has some typical features, such as its energy security has relatively stronger support, and the grid connection and operations are tightly associated among provinces. Nevertheless, the research framework could also be applied to other regions or nations around the world. Based on the different features in other regions, different results may be produced and compared. The assessment method could be regarded as a start for using a spatial method in systematic energy security evaluation and a comprehensive framework for various energy resources, in order to support optimal and intelligent national or regional energy management.

Author Contributions

Conceptualization, Z.Z. and H.Y.; methodology, Z.Z. and H.Y.; software, H.Y.; validation, Z.Z. and H.Y.; formal analysis, H.Y. and Z.Z.; investigation, H.Y.; resources, H.Y.; data curation, H.Y.; writing—original draft preparation, H.Y.; writing—review and editing, Z.Z. and H.Y.; visualization, H.Y. and Z.Z.; supervision, Z.Z.; project administration, Z.Z. and H.Y.; funding acquisition, Z.Z. and H.Y. All authors have read and agreed to the published version of the manuscript.

Funding

This research was funded by Beijing Municipal Natural Science Foundation, grant number 8192043, and China Scholarship Fund, grant number 201806730032.

Conflicts of Interest

The authors declare no conflict of interest.

References

  1. Ang, B.W.; Choong, W.L.; Ng, T.S. Energy security: Definitions, dimensions and indexes. Renew. Sustain. Energy Rev. 2015, 42, 1077–1093. [Google Scholar] [CrossRef]
  2. Ang, B.W.; Choong, W.L.; Ng, T.S. A framework for evaluating Singapore’s energy security. Appl. Energy 2015, 148, 314–325. [Google Scholar] [CrossRef]
  3. Winzer, C. Conceptualizing energy security. Energy Policy 2012, 46, 36–48. [Google Scholar] [CrossRef] [Green Version]
  4. Johansson, B. A broadened typology on energy and security. Energy 2013, 53, 199–205. [Google Scholar] [CrossRef] [Green Version]
  5. Von Hippel, D.; Suzuki, T.; Williams, J.H.; Savage, T.; Hayes, P. Energy security and sustainability in Northeast Asia. Energy Policy 2011, 39, 6719–6730. [Google Scholar] [CrossRef]
  6. Below, A. Obstacles in energy security: An analysis of congressional and presidential framing in the United States. Energy Policy 2013, 62, 860–868. [Google Scholar] [CrossRef]
  7. Yao, L.; Chang, Y. Energy security in China: A quantitative analysis and policy implications. Energy Policy 2014, 67, 595–604. [Google Scholar] [CrossRef]
  8. Ren, J.; Sovacool, B.K. Quantifying, measuring, and strategizing energy security: Determining the most meaningful dimensions and metrics. Energy 2014, 76, 838–849. [Google Scholar] [CrossRef]
  9. Zeng, S.; Streimikiene, D.; Baležentis, T. Review of and comparative assessment of energy security in Baltic States. Renew. Sustain. Energy Rev. 2017, 76, 185–192. [Google Scholar] [CrossRef]
  10. García-Gusano, D.; Iribarren, D.; Garraín, D. Prospective analysis of energy security: A practical life-cycle approach focused on renewable power generation and oriented towards policy-makers. Appl. Energy 2017, 190, 891–901. [Google Scholar] [CrossRef]
  11. Hughes, L. A generic framework for the description and analysis of energy security in an energy system. Energy Policy 2012, 42, 221–231. [Google Scholar] [CrossRef]
  12. Augutis, J.; Krikštolaitis, R.; Martišauskas, L.; Pečiulytė, S.; Žutautaitė, I. Integrated energy security assessment. Energy 2017, 138, 890–901. [Google Scholar] [CrossRef]
  13. Chung, W.; Kim, S.; Moon, K.; Lim, C.; Yun, S. A conceptual framework for energy security evaluation of power sources in South Korea. Energy 2017, 137, 1066–1074. [Google Scholar] [CrossRef]
  14. Pambour, K.A.; Cakir Erdener, B.; Bolado-Lavin, R.; Dijkema, G.P.J. SAInt—A novel quasi-dynamic model for assessing security of supply in coupled gas and electricity transmission networks. Appl. Energy 2017, 203, 829–857. [Google Scholar] [CrossRef]
  15. Ranjan, A.; Hughes, L. Energy security and the diversity of energy flows in an energy system. Energy 2014, 73, 137–144. [Google Scholar] [CrossRef]
  16. Chalvatzis, K.J.; Ioannidis, A. Energy supply security in the EU: Benchmarking diversity and dependence of primary energy. Appl. Energy 2017, 207, 465–476. [Google Scholar] [CrossRef]
  17. Balta-Ozkan, N.; le Gallo, J. Spatial variation in energy attitudes and perceptions: Evidence from Europe. Renew. Sustain. Energy Rev. 2018, 81, 2160–2180. [Google Scholar] [CrossRef] [Green Version]
  18. Sovacool, B.K.; Mukherjee, I.; Drupady, I.M.; D’Agostino, A.L. Evaluating energy security performance from 1990 to 2010 for eighteen countries. Energy 2011, 36, 5846–5853. [Google Scholar] [CrossRef]
  19. Viholainen, J.; Luoranen, M.; Väisänen, S.; Niskanen, A.; Horttanainen, M.; Soukka, R. Regional level approach for increasing energy efficiency. Appl. Energy 2016, 163, 295–303. [Google Scholar] [CrossRef]
  20. Zhang, L.; Yu, J.; Sovacool, B.K.; Ren, J. Measuring energy security performance within China: Toward an inter-provincial prospective. Energy 2017, 125, 825–836. [Google Scholar] [CrossRef]
  21. Radovanović, M.; Filipović, S.; Golušin, V. Geo-economic approach to energy security measurement—Principal component analysis. Renew. Sustain. Energy Rev. 2018, 82, 1691–1700. [Google Scholar] [CrossRef]
  22. Li, J.; Wang, L.; Lin, X.; Qu, S. Analysis of China’s energy security evaluation system: Based on the energy security data from 30 provinces from 2010 to 2016. Energy 2020, 198, 117346. [Google Scholar] [CrossRef]
  23. Agency, I.E. World Energy Outlook. Available online: https://www.iea.org/reports/world-energy-outlook-2019 (accessed on 28 November 2019).
  24. Zhang, Y.; Zhang, J.; Yang, Z.; Li, J. Analysis of the distribution and evolution of energy supply and demand centers of gravity in China. Energy Policy 2012, 49, 695–706. [Google Scholar] [CrossRef]
  25. Bao, C.; Fang, C. Geographical and environmental perspectives for the sustainable development of renewable energy in urbanizing China. Renew. Sustain. Energy Rev. 2013, 27, 464–474. [Google Scholar] [CrossRef]
  26. Global Energy Interconnection Development and Cooperation Organization (GEIDCO). Global Energy Interconnection Development Report; Global Energy Interconnection Development and Cooperation Organization (GEIDCO): Beijing, China, 2016. [Google Scholar]
  27. Cliff, A.D.; Ord, J.K. Spatial autocorrelation. Biom. Soc. 1974, 30, 729. [Google Scholar]
  28. Anselin, L. Local Indicators of Spatial Association—LISA. Geogr. Anal. 1995, 27, 93–115. [Google Scholar] [CrossRef]
  29. Onencan, A.V.D.W. WeShareIt Game: Strategic foresight for climate-change induced disaster risk reduction. Procedia Eng. 2016, 159, 307–315. [Google Scholar] [CrossRef] [Green Version]
  30. Nakawiro, T.; Bhattacharyya, S.C. High gas dependence for power generation in Thailand: The vulnerability analysis. Energy Policy 2007, 35, 3335–3346. [Google Scholar] [CrossRef]
  31. Erker, S.; Stangl, R.; Stoeglehner, G. Resilience in the light of energy crises—Part I: A framework to conceptualise regional energy resilience. J. Clean. Prod. 2017, 164, 420–433. [Google Scholar] [CrossRef]
  32. Erker, S.; Stangl, R.; Stoeglehner, G. Resilience in the light of energy crises—Part II: Application of the regional energy resilience assessment. J. Clean. Prod. 2017, 164, 495–507. [Google Scholar] [CrossRef]
  33. United Nations Development Programme Bureau for Crisis Prevention and Recovery. Reducing Disaster Risk: A Challenge for Development; A Global Report; Ringgold, Inc.: Portland, OR, USA, 2004; Volume 19, p. 160. [Google Scholar]
  34. Zhao, J.A.; Li, H.; Lang, Y.; Zheng, J. Study on the comprehensive appraisal index system for energy security risk: A case of coal and oil. Geo Inf. Sci. 2011, 12, 761–766. [Google Scholar] [CrossRef]
  35. Tangerås, T.P. Equilibrium supply security in a multinational electricity market with renewable production. Energy Econ. 2018, 72, 416–435. [Google Scholar] [CrossRef] [Green Version]
  36. Narula, K.; Reddy, B.S.; Pachauri, S. Sustainable energy security for India: An assessment of energy demand sub-system. Appl. Energy 2017, 186, 126–139. [Google Scholar] [CrossRef]
  37. Wang, Q.; Zhou, K. A framework for evaluating global national energy security. Appl. Energy 2017, 188, 19–31. [Google Scholar] [CrossRef]
  38. Bambawale, M.J.; Sovacool, B.K. China’s energy security: The perspective of energy users. Appl. Energy 2011, 88, 1949–1956. [Google Scholar] [CrossRef]
  39. Geng, J.; Ji, Q. Multi-perspective analysis of China’s energy supply security. Energy 2014, 64, 541–550. [Google Scholar] [CrossRef]
  40. Zaman, R.; Brudermann, T. Energy governance in the context of energy service security: A qualitative assessment of the electricity system in Bangladesh. Appl. Energy 2018, 223, 443–456. [Google Scholar] [CrossRef]
  41. Coester, A.; Hofkes, M.W.; Papyrakis, E. Economics of renewable energy expansion and security of supply: A dynamic simulation of the German electricity market. Appl. Energy 2018, 231, 1268–1284. [Google Scholar] [CrossRef]
  42. Martchamadol, J.; Kumar, S. An aggregated energy security performance indicator. Appl. Energy 2013, 103, 653–670. [Google Scholar] [CrossRef]
  43. Portugal-Pereira, J.; Esteban, M. Implications of paradigm shift in Japan’s electricity security of supply: A multi-dimensional indicator assessment. Appl. Energy 2014, 123, 424–434. [Google Scholar] [CrossRef]
  44. Matsumoto, K.; Doumpos, M.; Andriosopoulos, K. Historical energy security performance in EU countries. Renew. Sustain. Energy Rev. 2018, 82, 1737–1748. [Google Scholar] [CrossRef]
  45. Venier, F.; Yabar, H. Renewable energy recovery potential towards sustainable cattle manure management in Buenos Aires Province: Site selection based on GIS spatial analysis and statistics. J. Clean. Prod. 2017, 162, 1317–1333. [Google Scholar] [CrossRef] [Green Version]
  46. Cevallos-Sierra, J.; Ramos-Martin, J. Spatial assessment of the potential of renewable energy: The case of Ecuador. Renew. Sustain. Energy Rev. 2018, 81, 1154–1165. [Google Scholar] [CrossRef]
  47. Cebulla, F.; Naegler, T.; Pohl, M. Electrical energy storage in highly renewable European energy systems: Capacity requirements, spatial distribution, and storage dispatch. J. Energy Storage 2017, 14, 211–223. [Google Scholar] [CrossRef] [Green Version]
  48. Guler, B.; Çelebi, E.; Nathwani, J. A ‘Regional Energy Hub’ for achieving a low-carbon energy transition. Energy Policy 2018, 113, 376–385. [Google Scholar] [CrossRef]
  49. National Bureau of Statistics of China (NBSC). China Statistical Yearbook; China Statistics Press: Beijing, China, 2017. [Google Scholar]
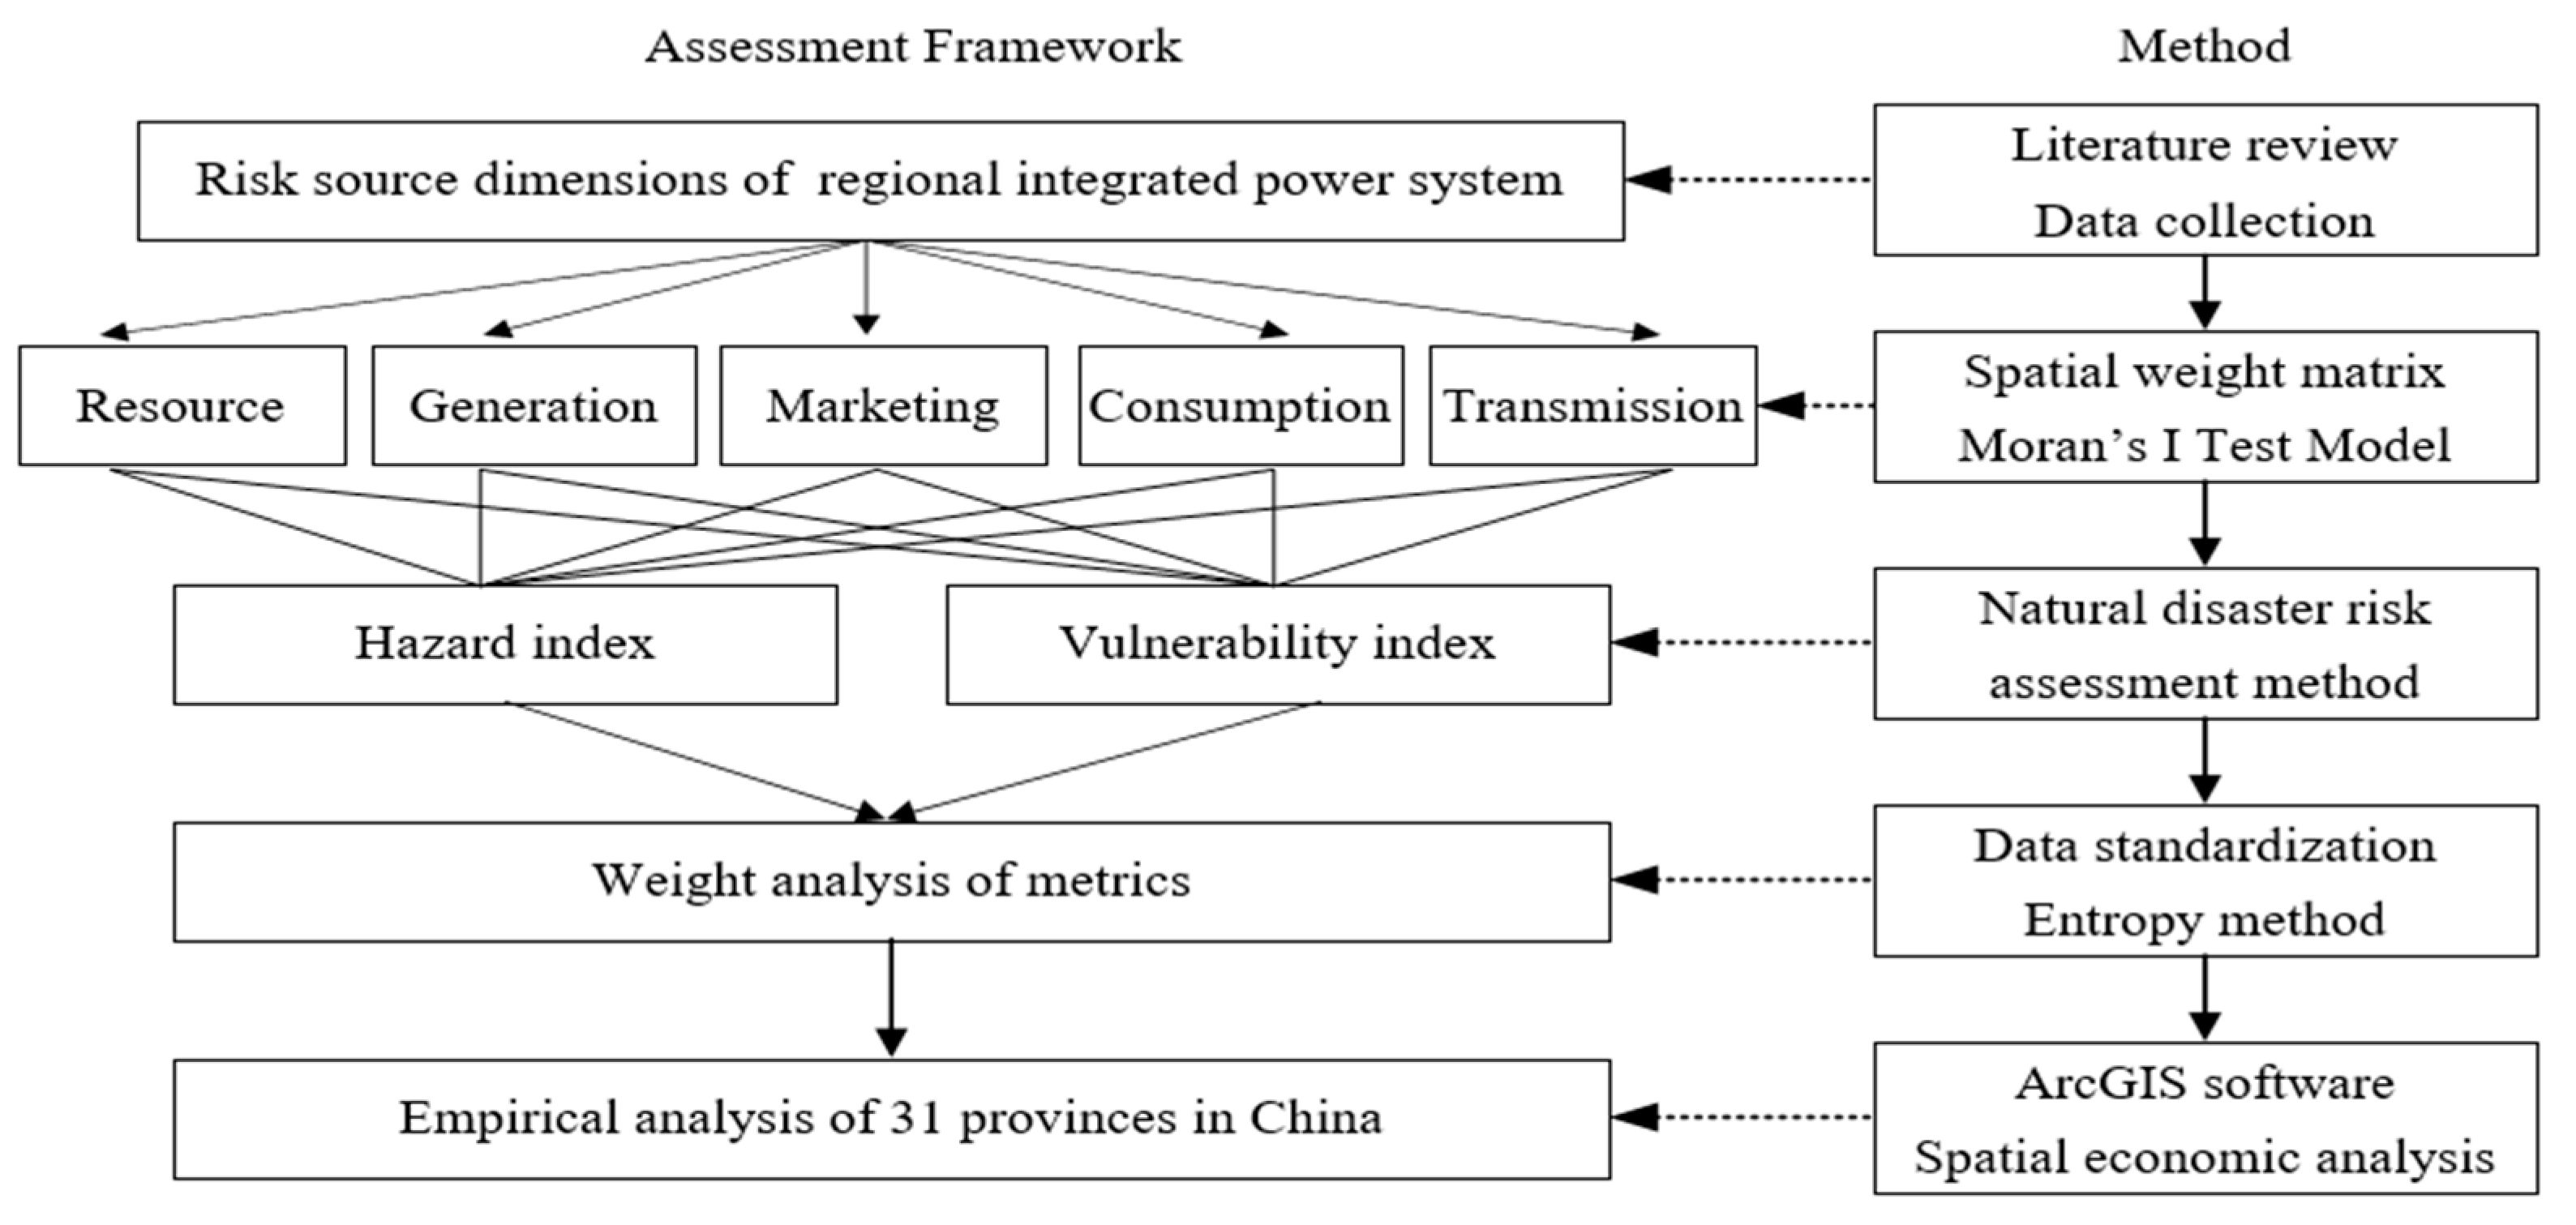
Figure 1. Research Methodology.
Sustainability 12 10299 g001
Figure 2. Custom spatial weight matrix schematic diagram of Chinese regional power grids and UHV lines.
Sustainability 12 10299 g002
Figure 3. Spatial autocorrelation report of the non-hydro renewable electricity consumption ratio.
Sustainability 12 10299 g003
Figure 4. Local spatial autocorrelation results of the 31 Chinese provinces.
Sustainability 12 10299 g004
Figure 5. The weights of grid-connected integrated energy system security assessment metrics.
Sustainability 12 10299 g005
Figure 6. Security index scores of the 31 Chinese provinces and their classifications.
Sustainability 12 10299 g006
Figure 7. Security assessment distribution map of the 31 Chinese provinces. (a). Hazard index; (b). Vulnerability index; (c). System comprehensive risk index.
Sustainability 12 10299 g007
Table 1. Security assessment dimensions, components and metrics of grid-connected integrated energy systems.
DimensionsComponentsMetricsUnitDefinitionPreferenceReferences
A1:
Resource
A11:
Dependency
B11: Self sufficiency%=(Total primary energy production/total primary energy consumption)*100%Greater preferred[2,35,36,37,38]
A12:
Sustainability
B12: Renewables technical exploitation amount107 WEconomic potentiality of hydroelectric, land 70m high wind resources and solar radiationGreater preferred[35,36,37,39,40]
A13:
Exploitability
B13: Installed capacity107 WTotal installed capacity of hydropower, thermal power, nuclear, wind, solar power, etc.Greater preferred[35,38,41]
A2:
Generation
A21:
Utilization
B21: Utilization hours of installed capacityHoursAverage utilization hours of all types of power generation equipmentGreater preferred[2,35,39,40]
A22:
Cleanliness
B22: Generation cleanliness%=(Non-thermal power generation/total generation)*100%Greater preferred[2,37,40,41,42]
A23:
Capacity
B23: Annual power generation108 kWhAnnual power generation, include hydropower, thermal power, nuclear, wind, solar power, etc.Greater preferred[36,41,43]
A3:
Transmission
A31:
Connectivity
B31: Interprovincial line connections-The number of connections with other provinces in regional grid and through UHV transmission linesGreater preferred[35,37,38,39,41,42]
A32:
Convergence
B32: Local spatial autocorrelation-Use local Moran’s I index to measure the degree of provincial association among associated areaGreater preferred[35,42,44,45]
A33:
Investment
B33: Grid construction investment108 YuanCumulative investment on grid constructionGreater preferred[38,39,41,46]
A34:
Efficiency
B34: Electricity transmission losses%Between sources of supply and points of distribution and in the distribution to consumersSmaller preferred[35,36,39,40,43]
A4:
Marketing
A41:
Affordability
B41: Power priceYuan/MWh=Total electricity sales revenue/total electricity consumptionSmaller preferred[35,36,37,39,41,42]
A42:
Conversion
B42: Electricity consumption per unit GDPkWh/Yuan=Annual electricity consumption/local gross domestic productGreater preferred[2,37,38,43]
A43: Generation maturityB43: Generation elasticity coefficient-=Annual growth rate of power generation/annual growth rate of local gross domestic productGreater preferred[35,43]
A44: Consumption maturityB44: Consumption elasticity coefficient-=Annual growth rate of power consumption/annual growth rate of local gross domestic productGreater preferred[35,43]
A5:
Consumption
A51:
Absorbance
B51: Annual power consumption108 kWhComprises the consumption of hydropower, thermal power, nuclear, wind, solar power, etc.Greater preferred[2,36,37,41]
A52:
Eco-friendliness
B52: Consumption cleanliness%=(Total renewable consumption/total electricity consumption)*100%Greater preferred[2,35,37,39,40,41]
A53:
Abundance
B53: Difference between supply and demand108 kWhProvincial electricity generation minus electricity consumptionGreater preferred[36,39,41]
Table 2. The characteristics and processing results of the security assessment metrics.
MetricsMAXProvinceMINProvinceMeanStandard Mean
Hazard Index (HI)
B11: Self sufficiency5.41Shanxi0.08Zhejiang1.050.18
B21: Utilization hours of installed capacity4806Jiangsu2378Tibet3669.970.53
B22: Generation cleanliness1.00Tibet0.02Tianjin0.290.28
B41: Power price777.33Beijing360.54Jilin589.340.45
B42: Electricity consumption per unit GDP0.28Ningxia0.04Beijing0.930.22
B44: Consumption elasticity coefficient2.07Xinjiang−0.51Gansu0.630.44
B51: Annual power consumption5610Guangdong49Tibet1927.390.34
B52: Consumption cleanliness0.85Tibet0.06Shandong0.310.31
B53: Difference between supply and demand1345Inner Mongolia−1574Guangdong15.540.55
Vulnerability index (VI)
B12: Renewable technical exploitation amount146,713Inner Mongolia74Shanghai9683.260.07
B13: Installed capacity11,044Inner Mongolia233Tibet5308.810.47
B23: Annual power generation4863Shandong51Tibet1942.930.39
B31: Interprovincial line connections7Henan3Hei/Ji/Liao4.770.44
B32: Local spatial autocorrelation1.78Hei/Ji/Liao−0.25Hainan0.710.31
B33: Grid construction investment838.43Zhejiang38.55Hainan283.230.31
B34: Electricity transmission losses13.83Qinghai3.35Tibet6.480.70
B43: Generation elasticity coefficient2.81Tibet−0.54Qinghai0.660.36
Table 3. Chinese six regional power grids and their comprised provinces.
Regional Power GridProvincesNumber
Northeast power gridHeilongjiang, Jilin, Liaoning, Inner Mongolia4
Eastern power gridJiangsu, Anhui, Shanghai, Zhejiang, Fujian5
Central power gridHenan, Hubei, Sichuan, Chongqing, Hunan, Jiangxi6
Northern power gridBeijing, Hebei, Tianjin, Shanxi, Shandong5
Southern power gridYunnan, Guizhou, Guangxi, Guangdong, Hainan5
Northwest power gridXinjiang, Tibet, Qinghai, Gansu, Ningxia, Shaanxi6
Table 4. Chinese operated ultra-high voltage (UHV) lines in 2016 and their routes.
TypeNO.Line RouteAnnual Capacity (TWh)
AC-UHV1Shanxi-Henan-Hubei82.5
2Inner Mongolia-Beijing-Shandong32.8
3Anhui-Zhejiang-Jiangsu-Shanghai202.9
4Zhejiang-Fujian17.1
DC-UHV5Sichuan-Shanghai326.1
6Sichuan-Jiangsu383.3
7Yunnan-Zhejiang367.5
8Xinjiang-Henan322.6
9Ningxia-Zhejiang72.8
10Yunnan Chuxiong-Guangdong Guangzhou261.8
11Yunnan Puer-Guangdong Jiangmen264.5
Total2333.9
Table 5. Global Moran’s I index test results of renewable attributes.
AttributeMoran’s IZ Scorep Value
Renewable electricity consumption amount0.1659721.9878720.046826 *
Non-hydro renewable electricity consumption amount0.1866802.0880840.036790 *
Non-hydro renewable electricity consumption ratio0.4551894.5080090.000007 **
* significant level of 0.05; ** significant level of 0.01.
Publisher’s Note: MDPI stays neutral with regard to jurisdictional claims in published maps and institutional affiliations.