Valuation of the Environmental Effects of Socially Responsible Investments in Europe

Abstract
1. Introduction
- To reorient capital flows towards sustainable investment in order to achieve sustainable and inclusive growth;
- To manage the financial risk stemming from climate change, environmental degradation, and social issues;
- To foster transparency and long-termism in financial and economic activity.
- Decentralized instruments;
- Direct management and control instruments;
- Economic instruments.
2. Literature Review
3. Hypothesis, Materials, and Methods
- V(t0), V(tn)—the initial/the end value;
- t0, tn—the initial/the end period.
4. Results
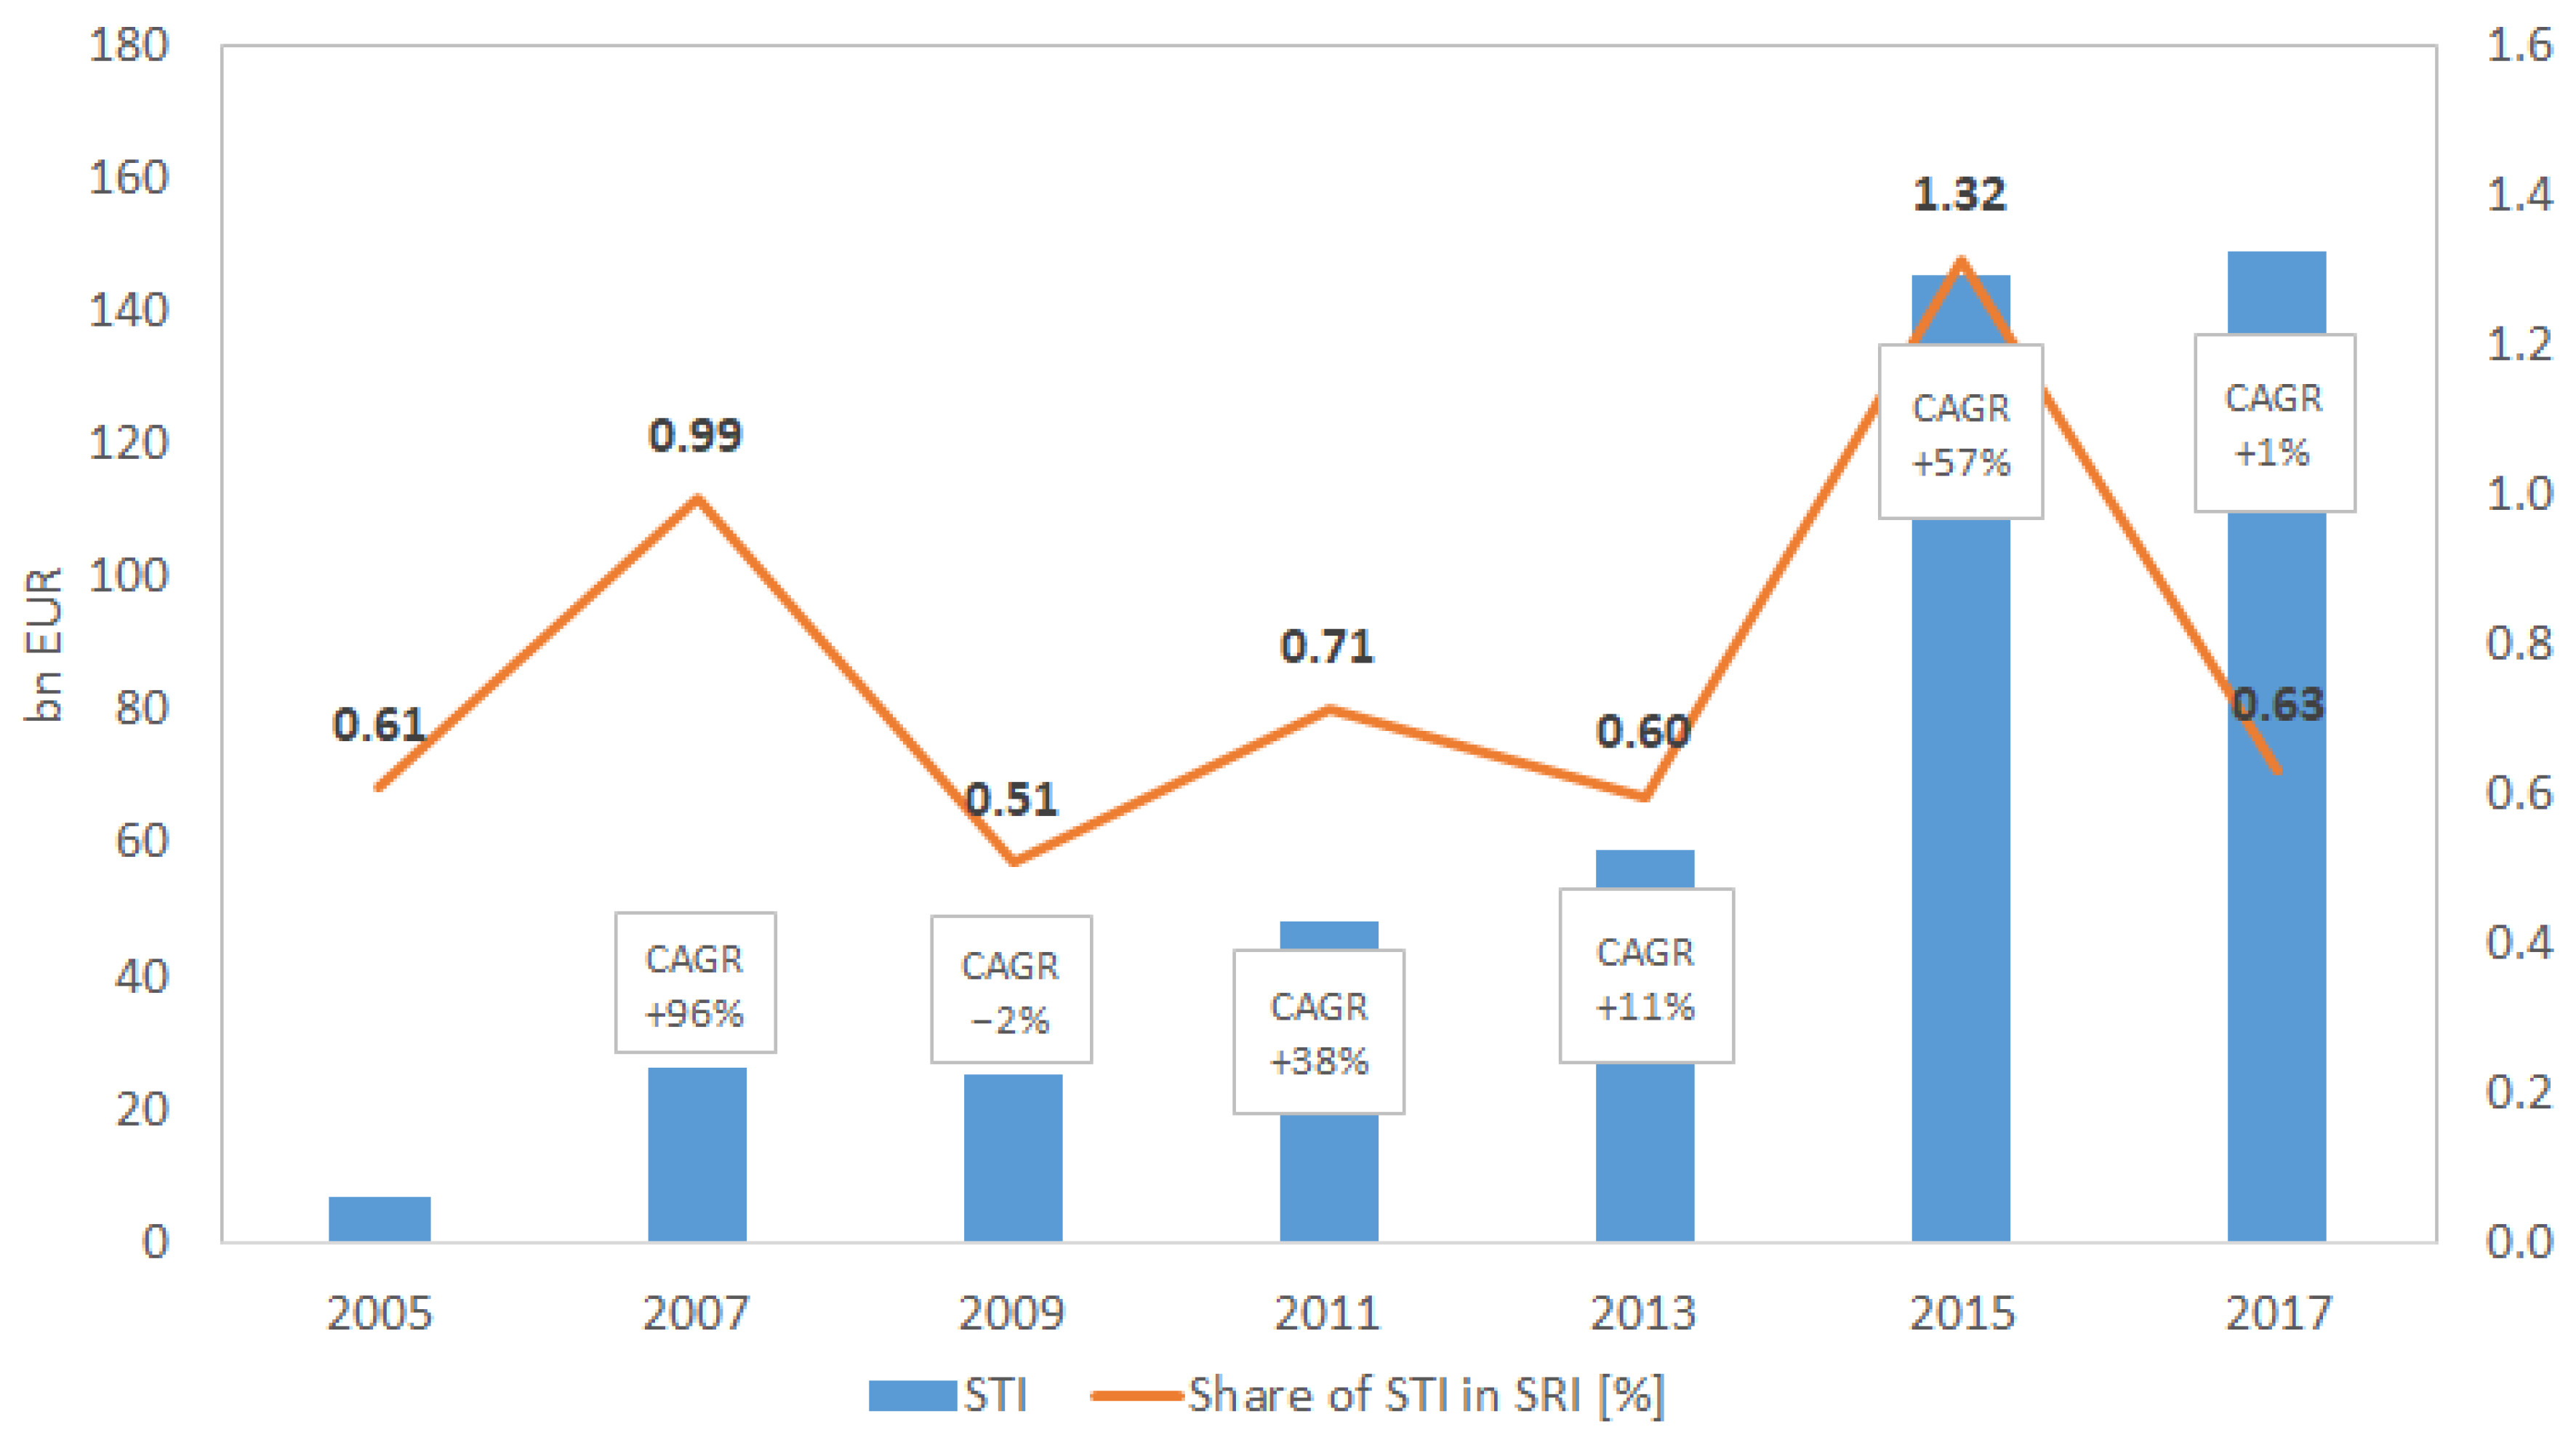
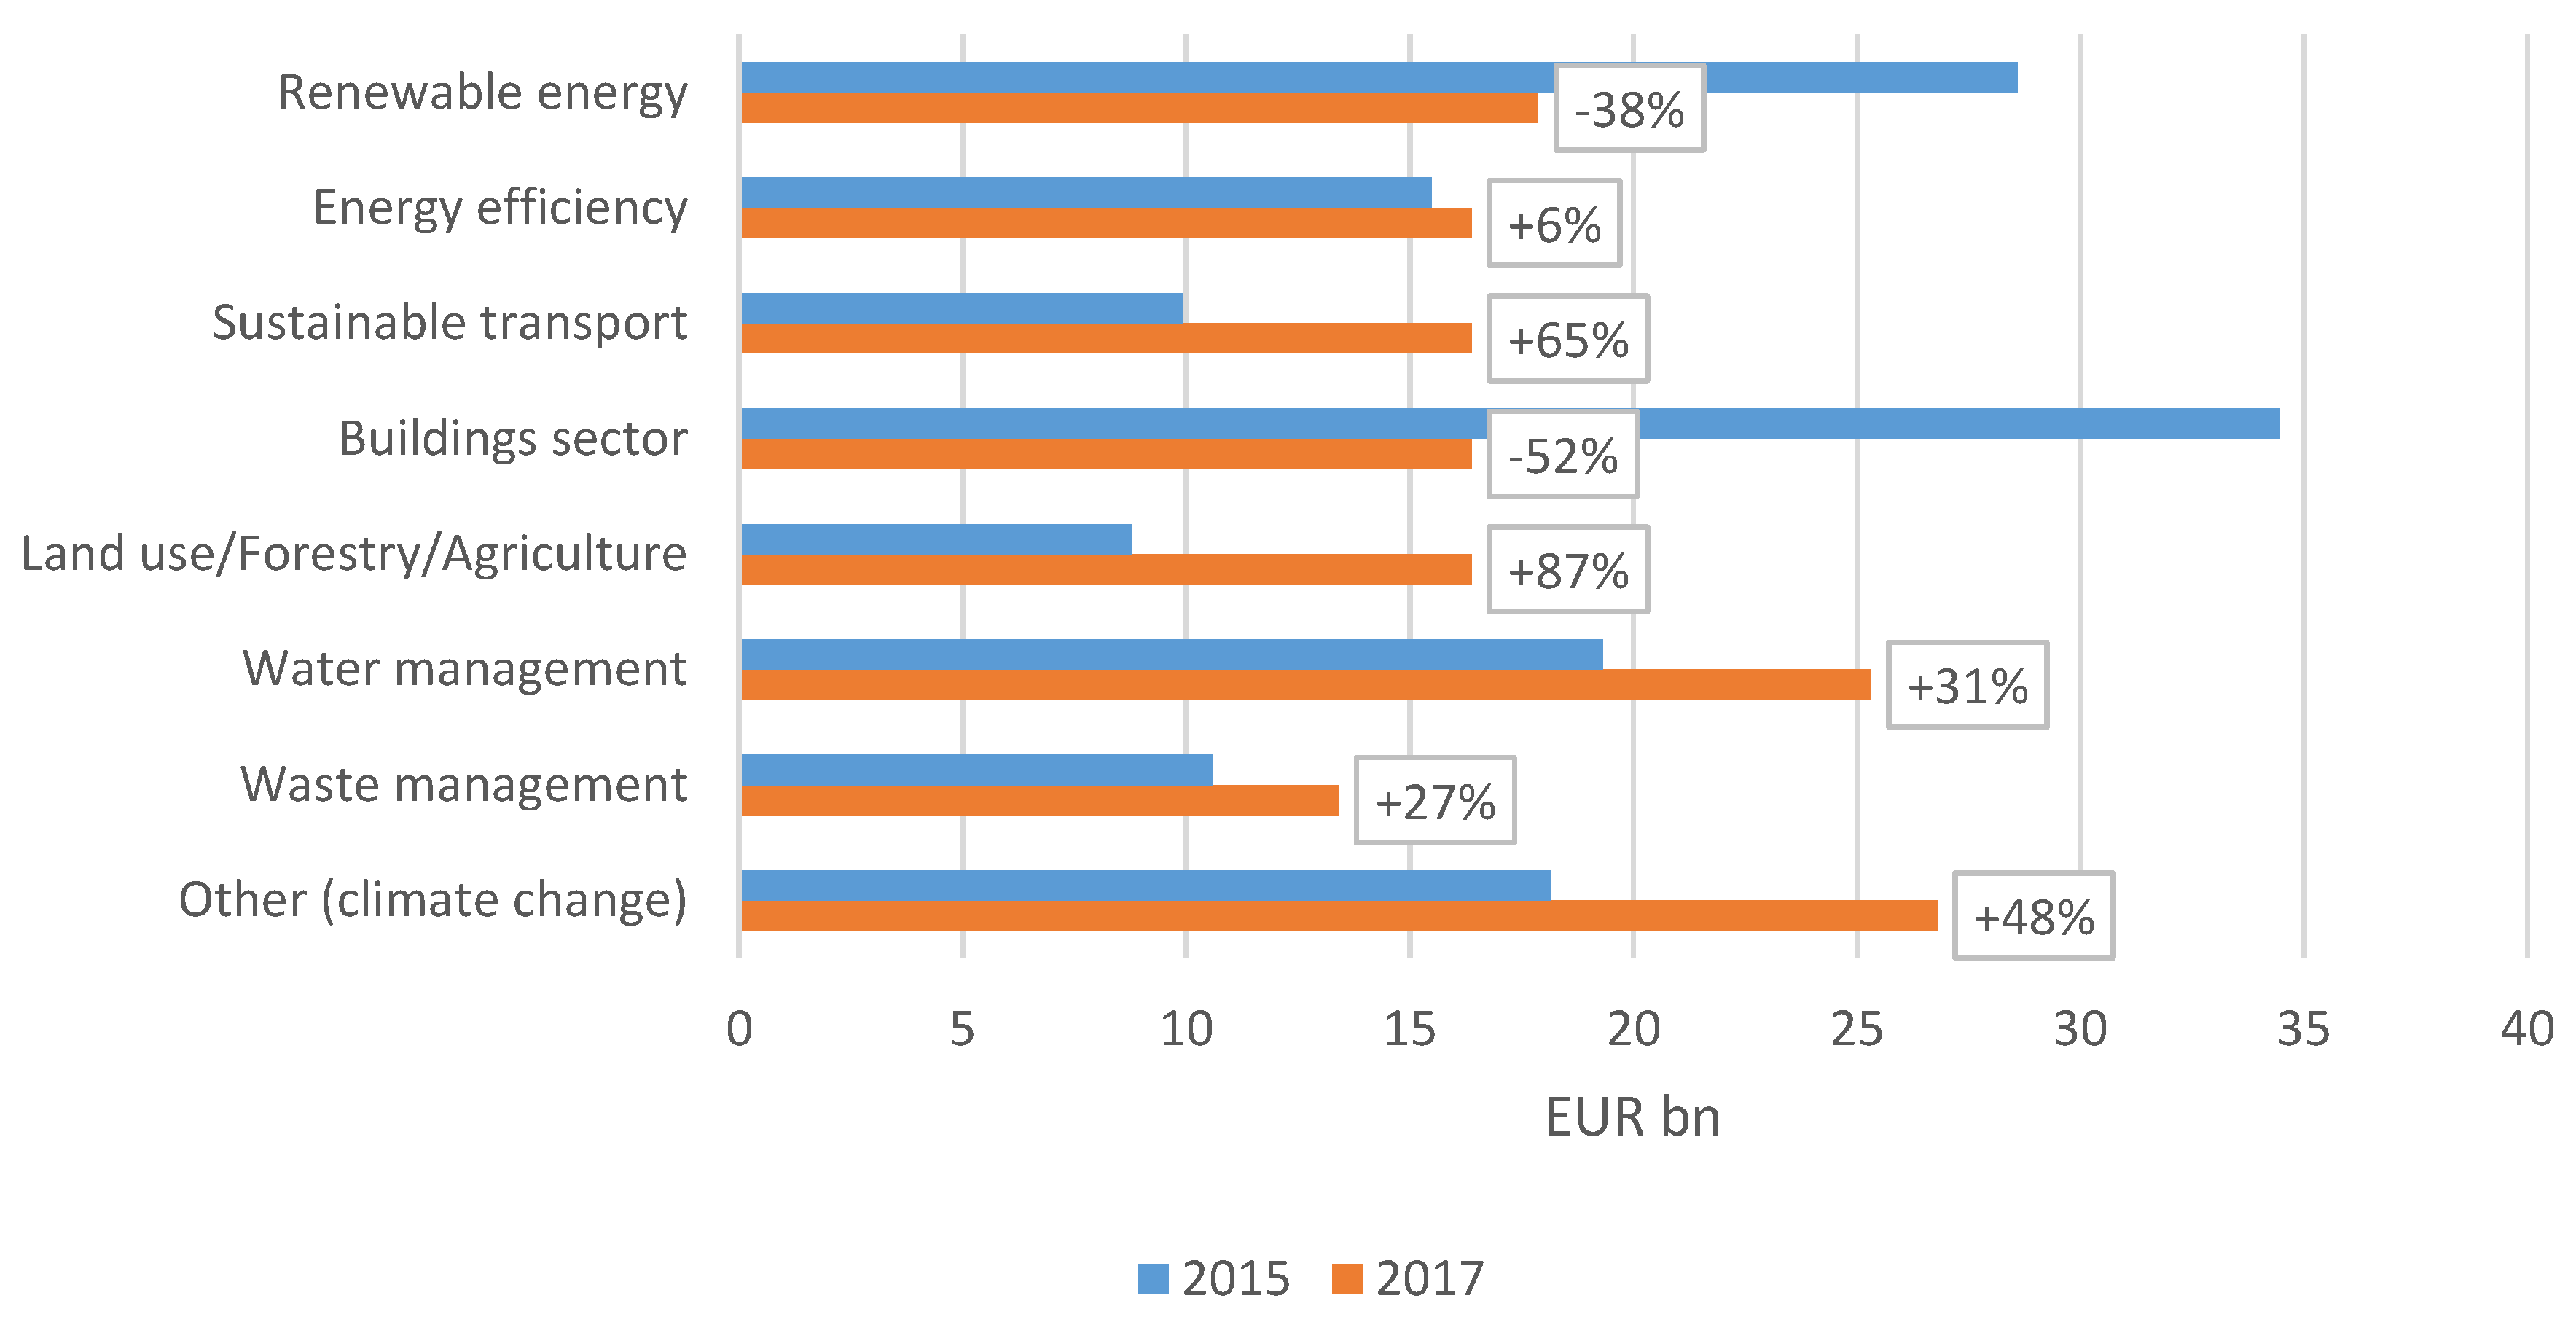
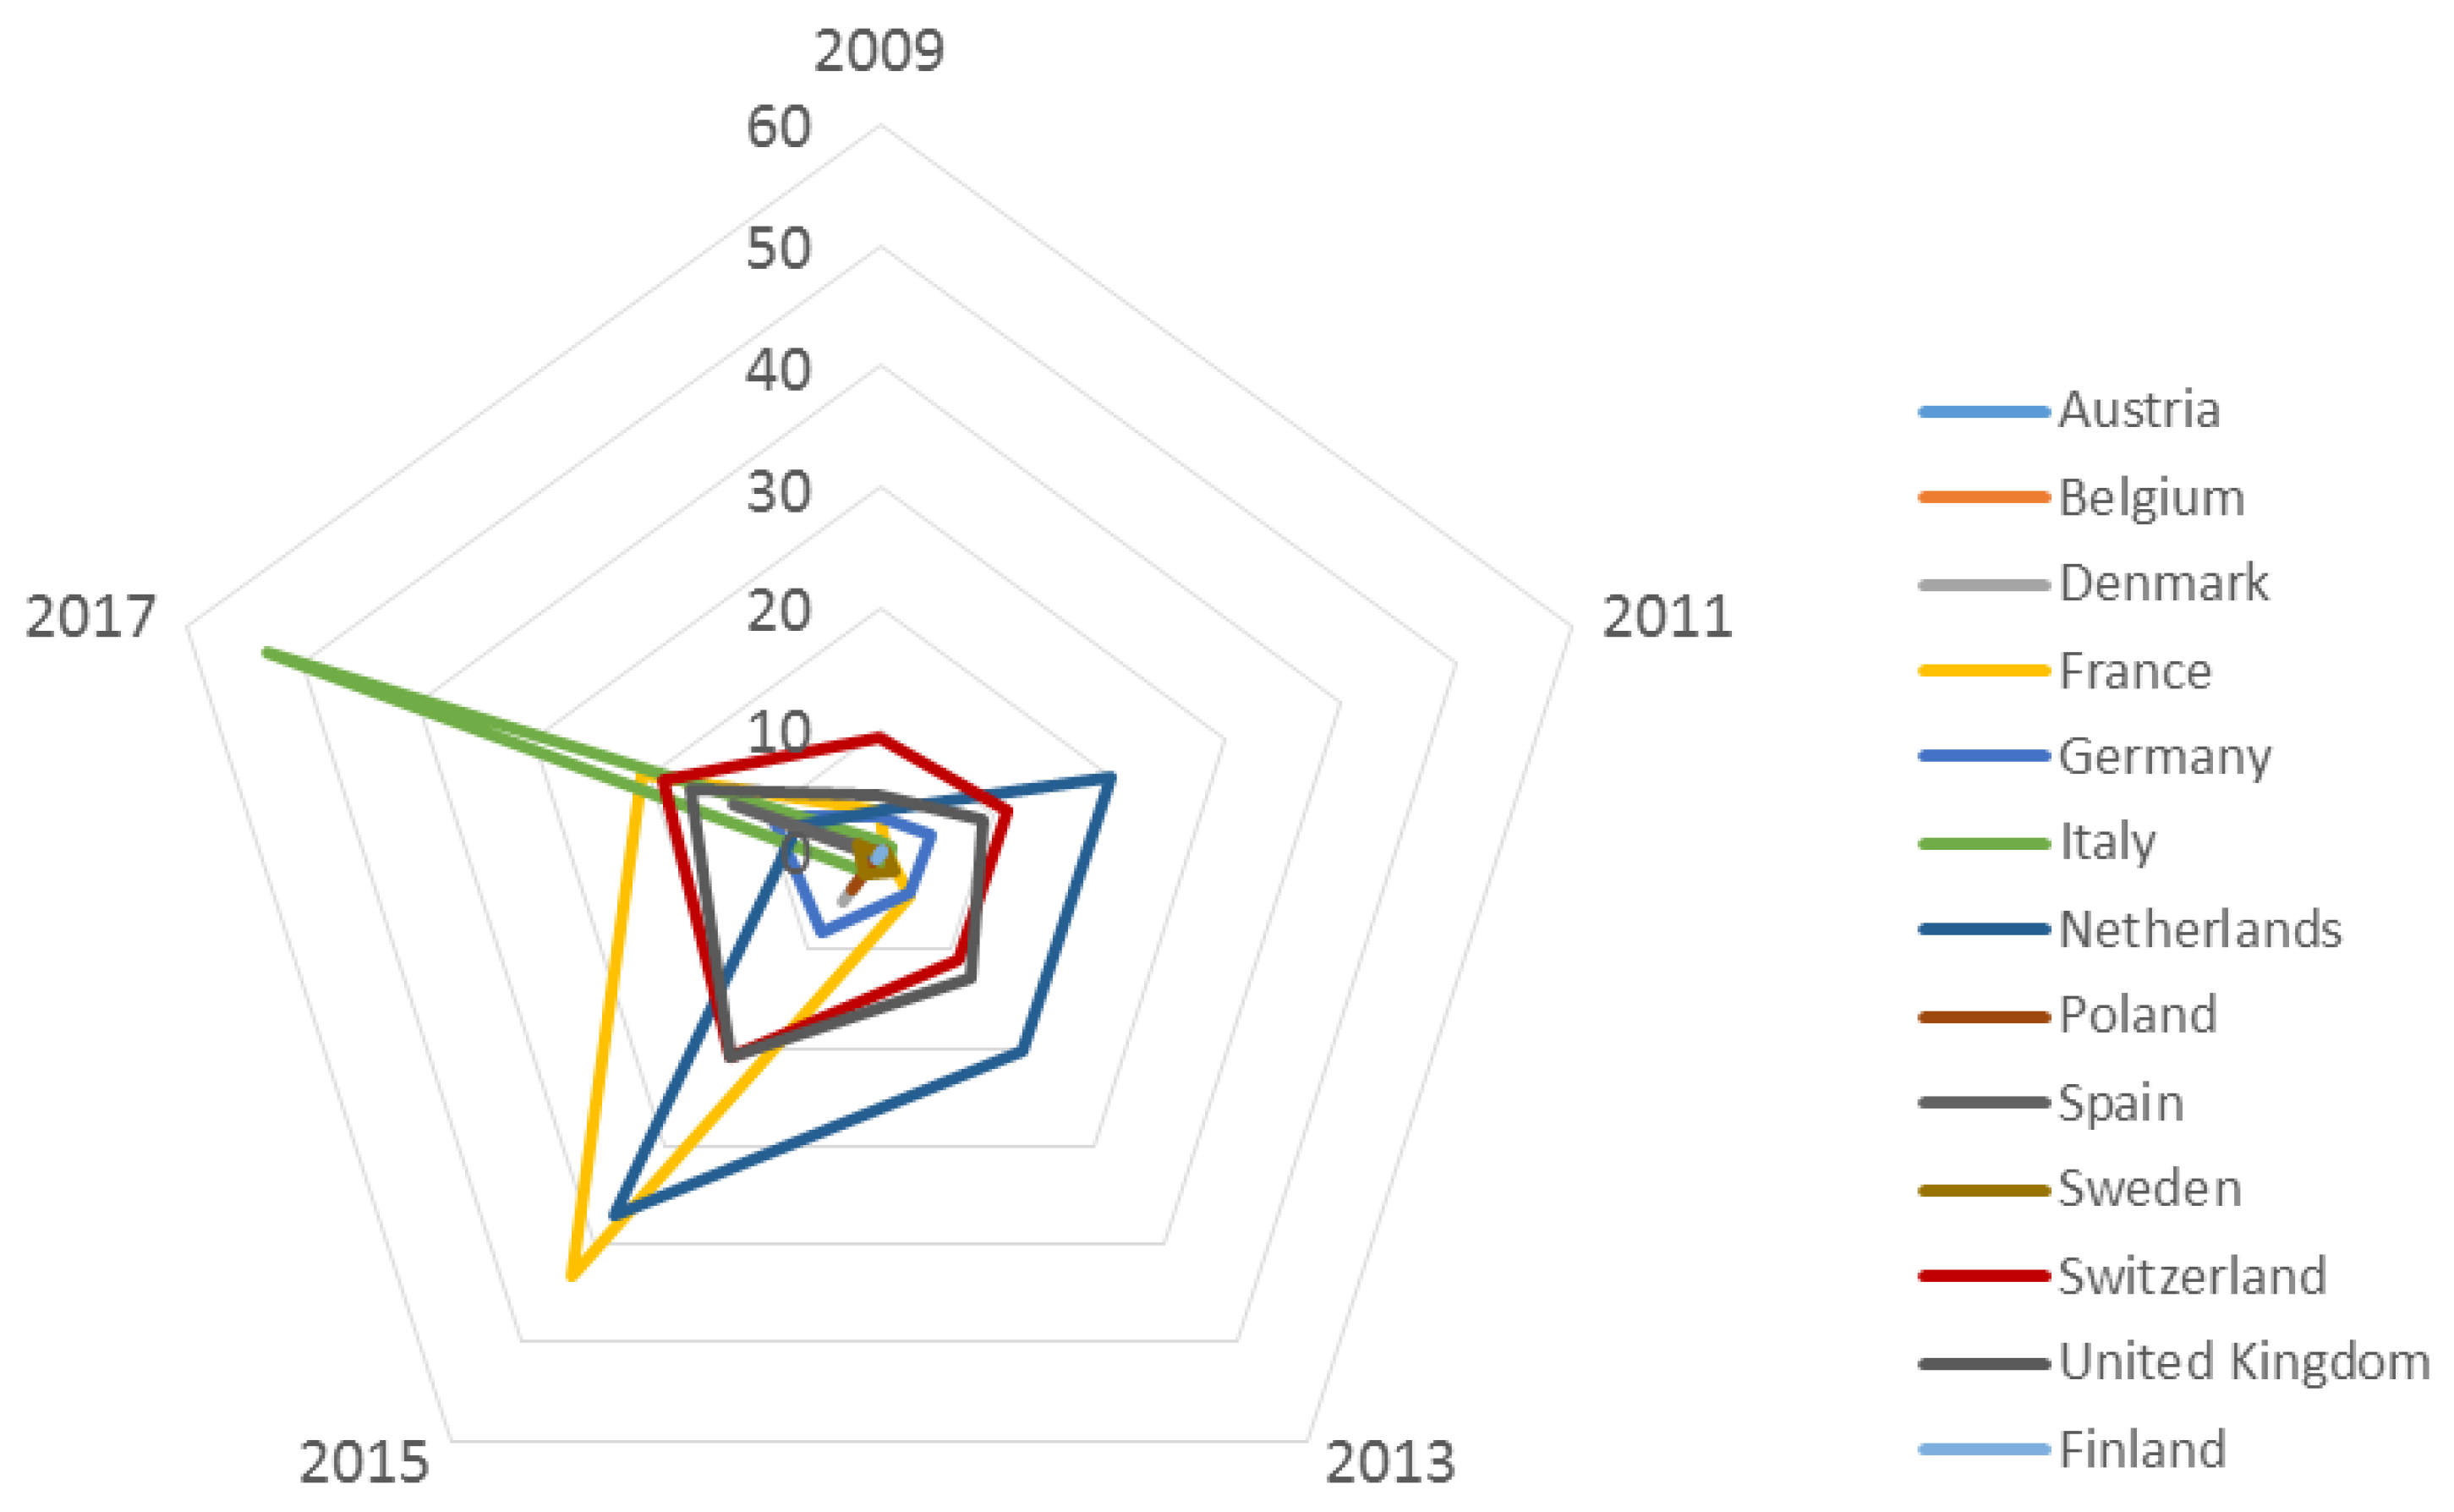
4.1. Dynamics of STI
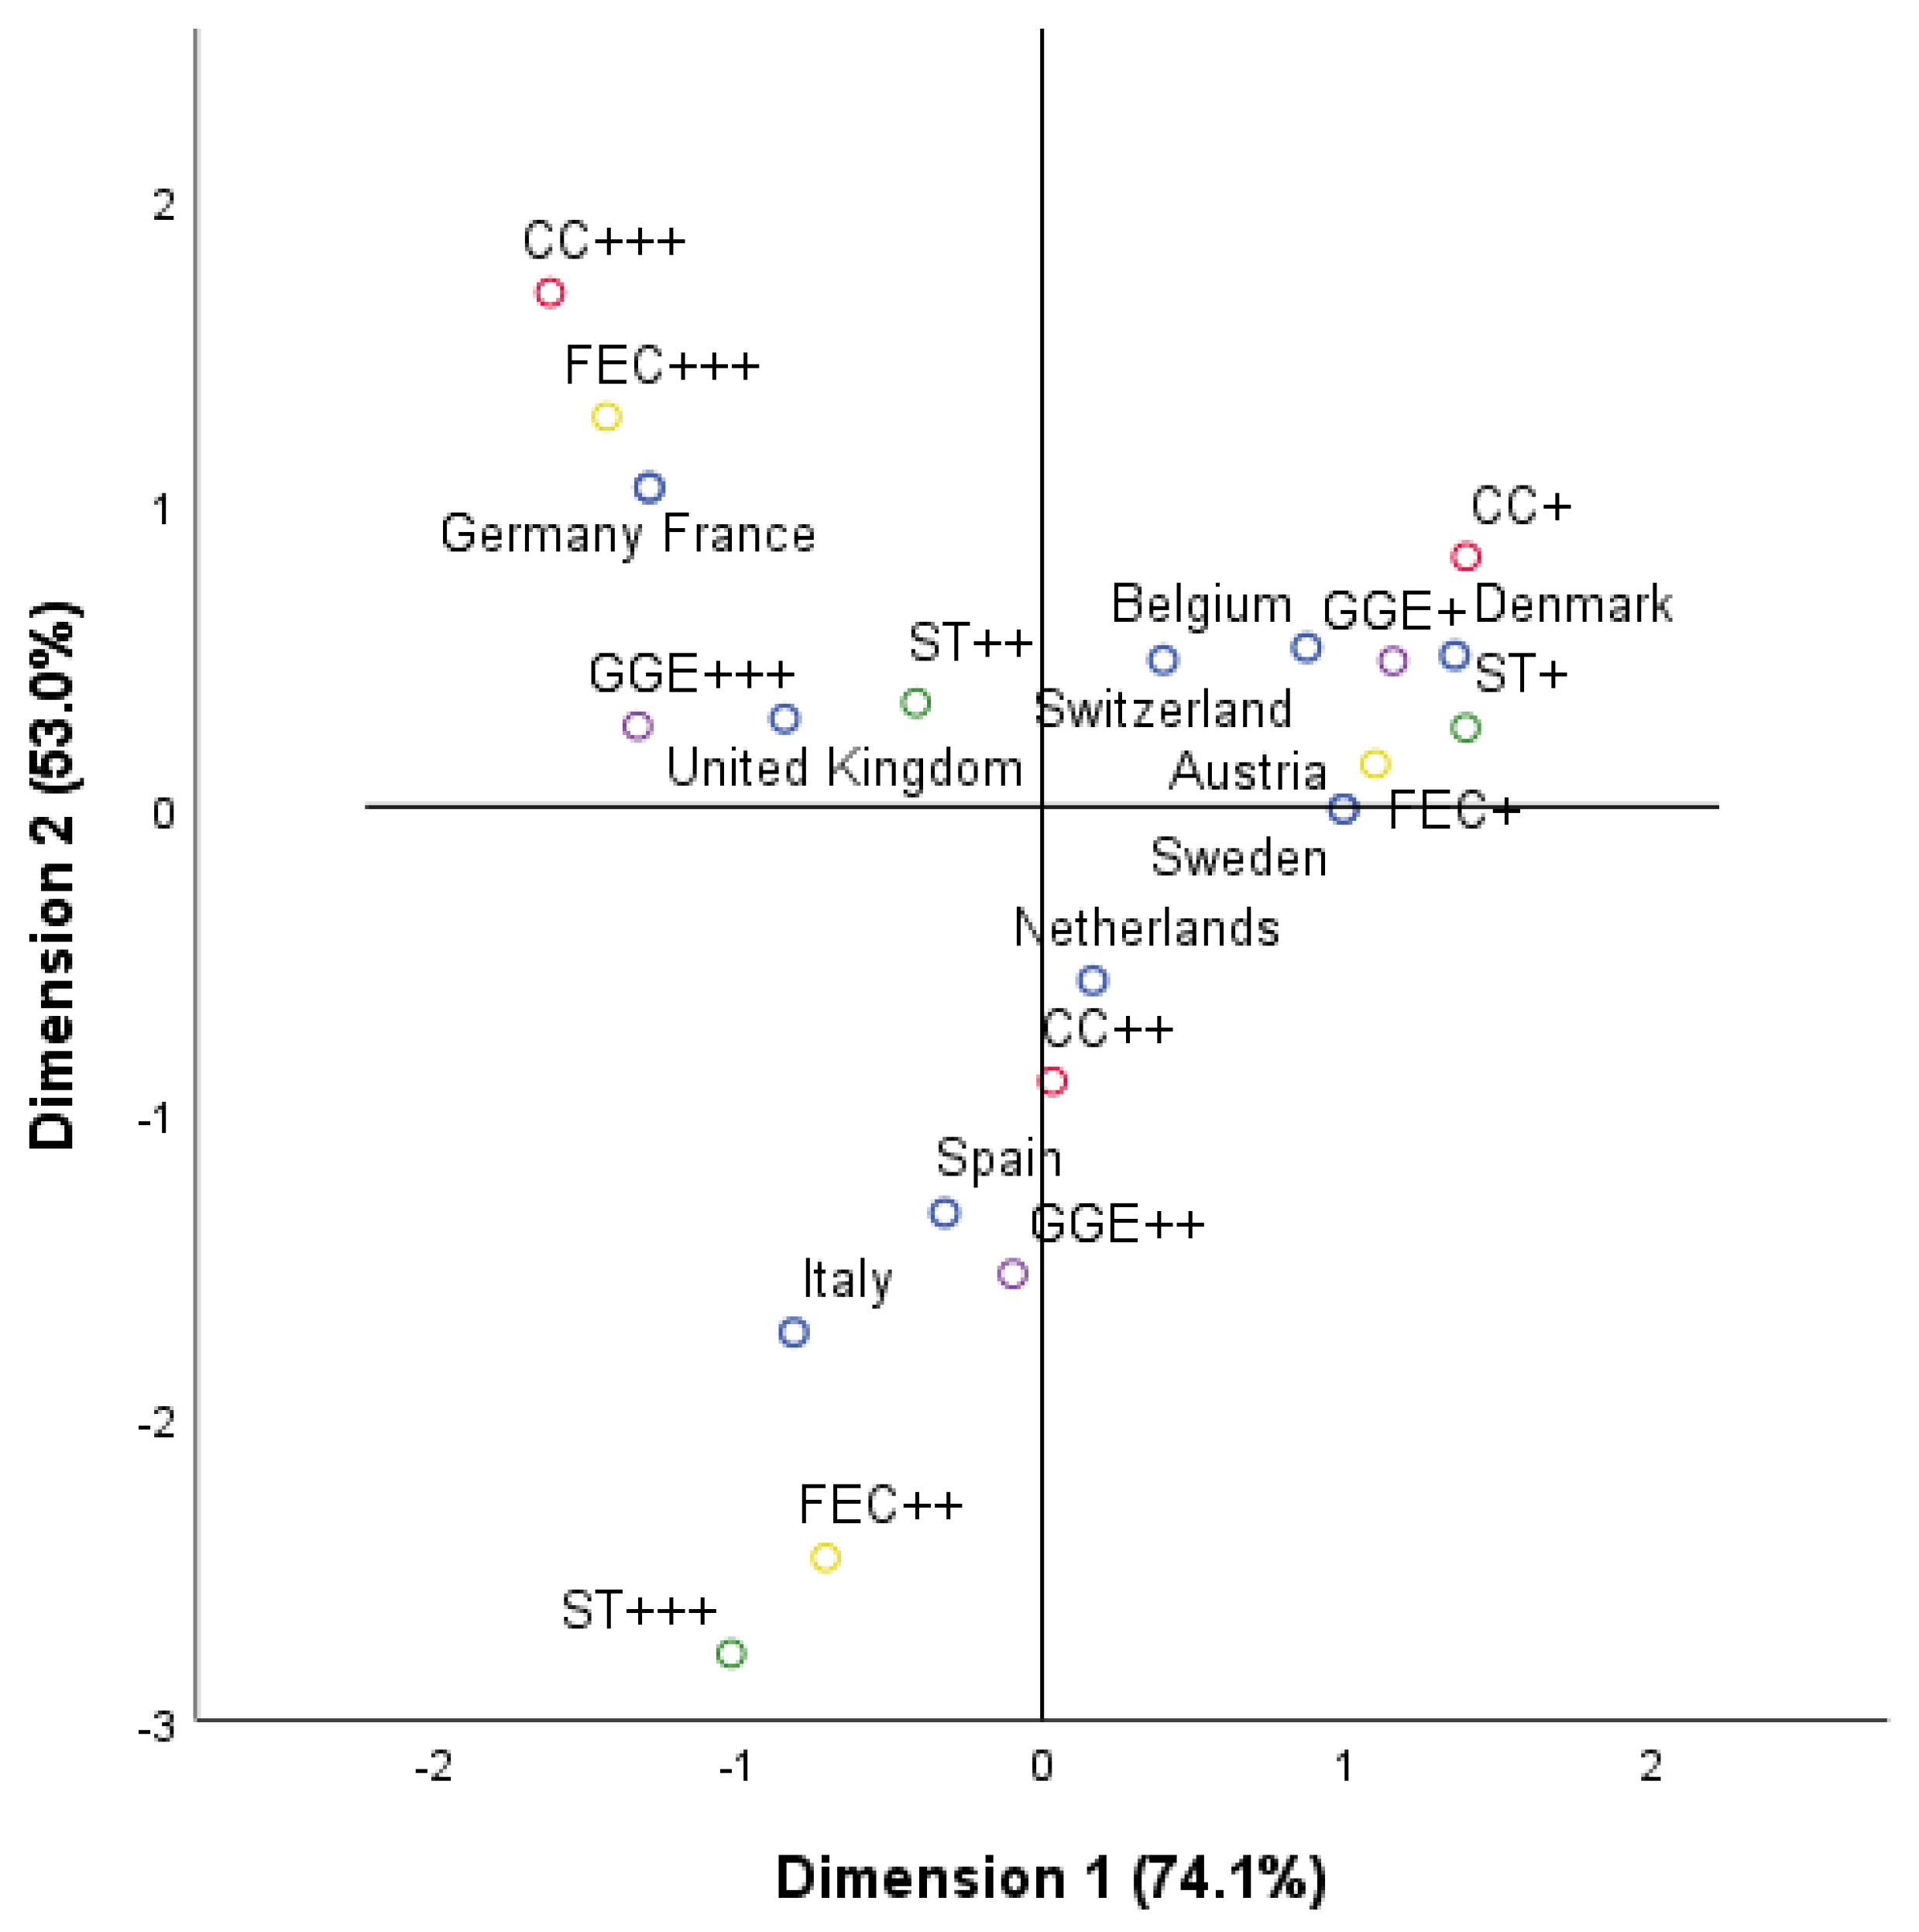
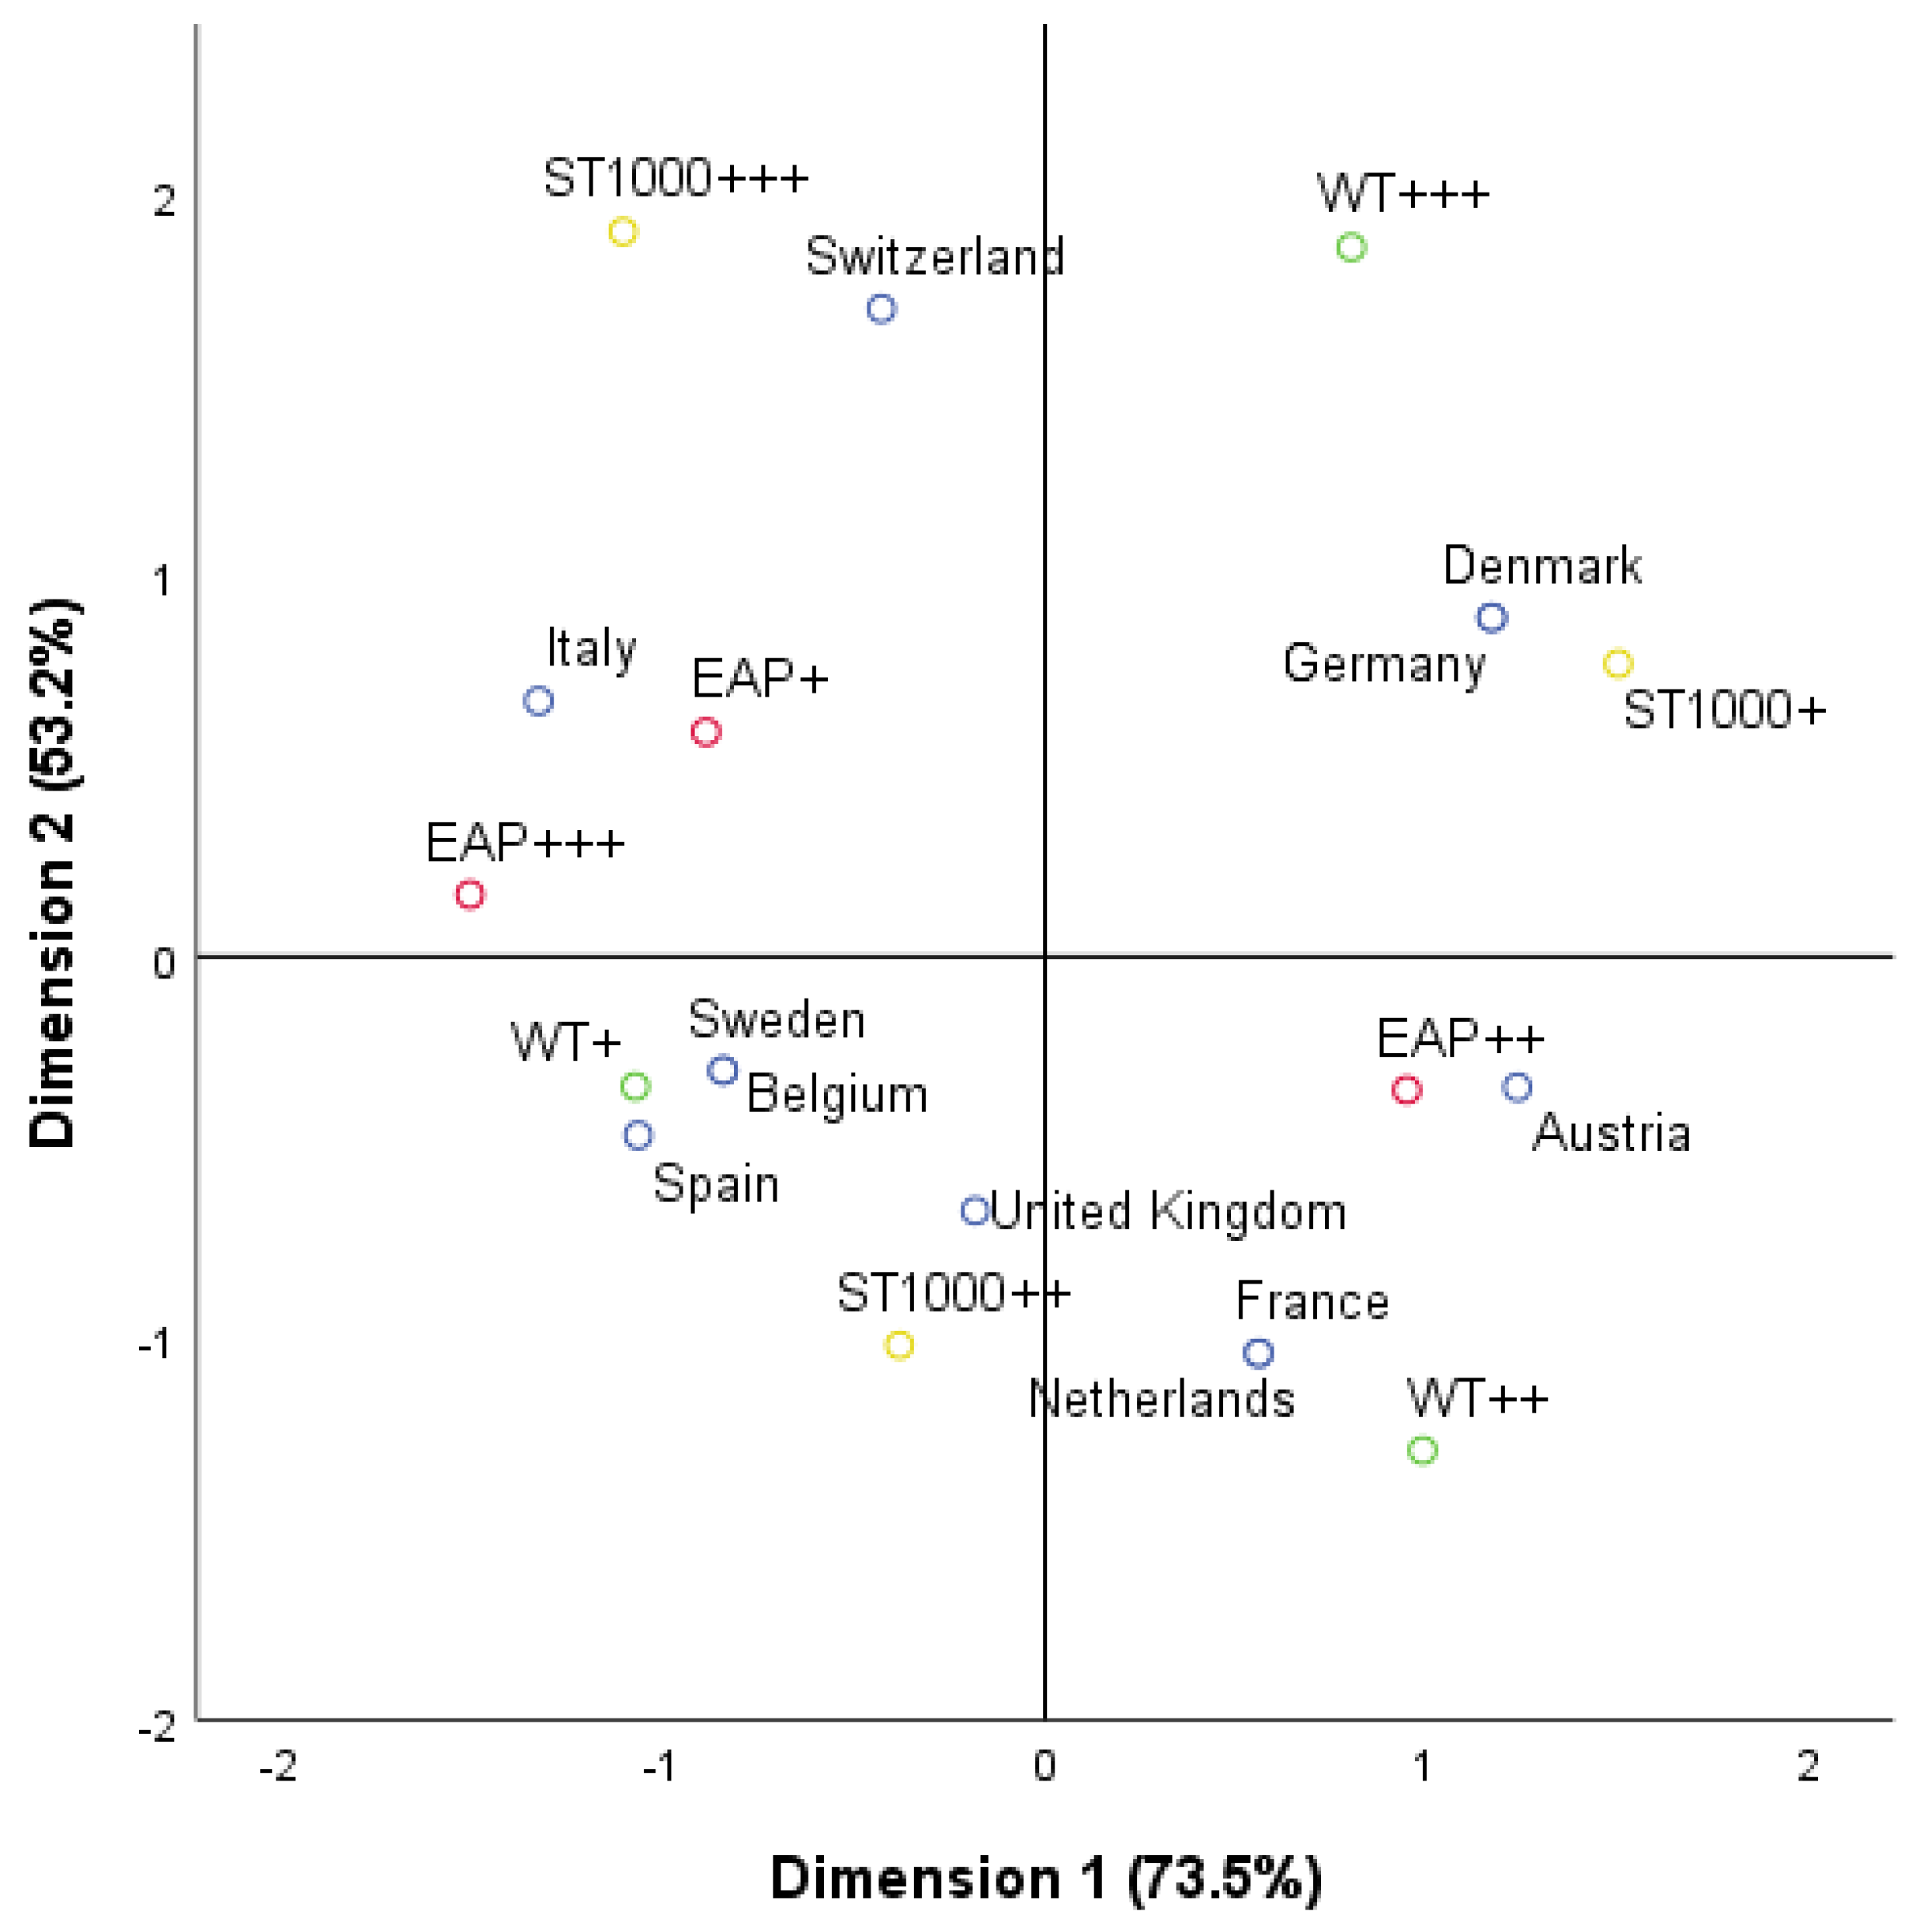
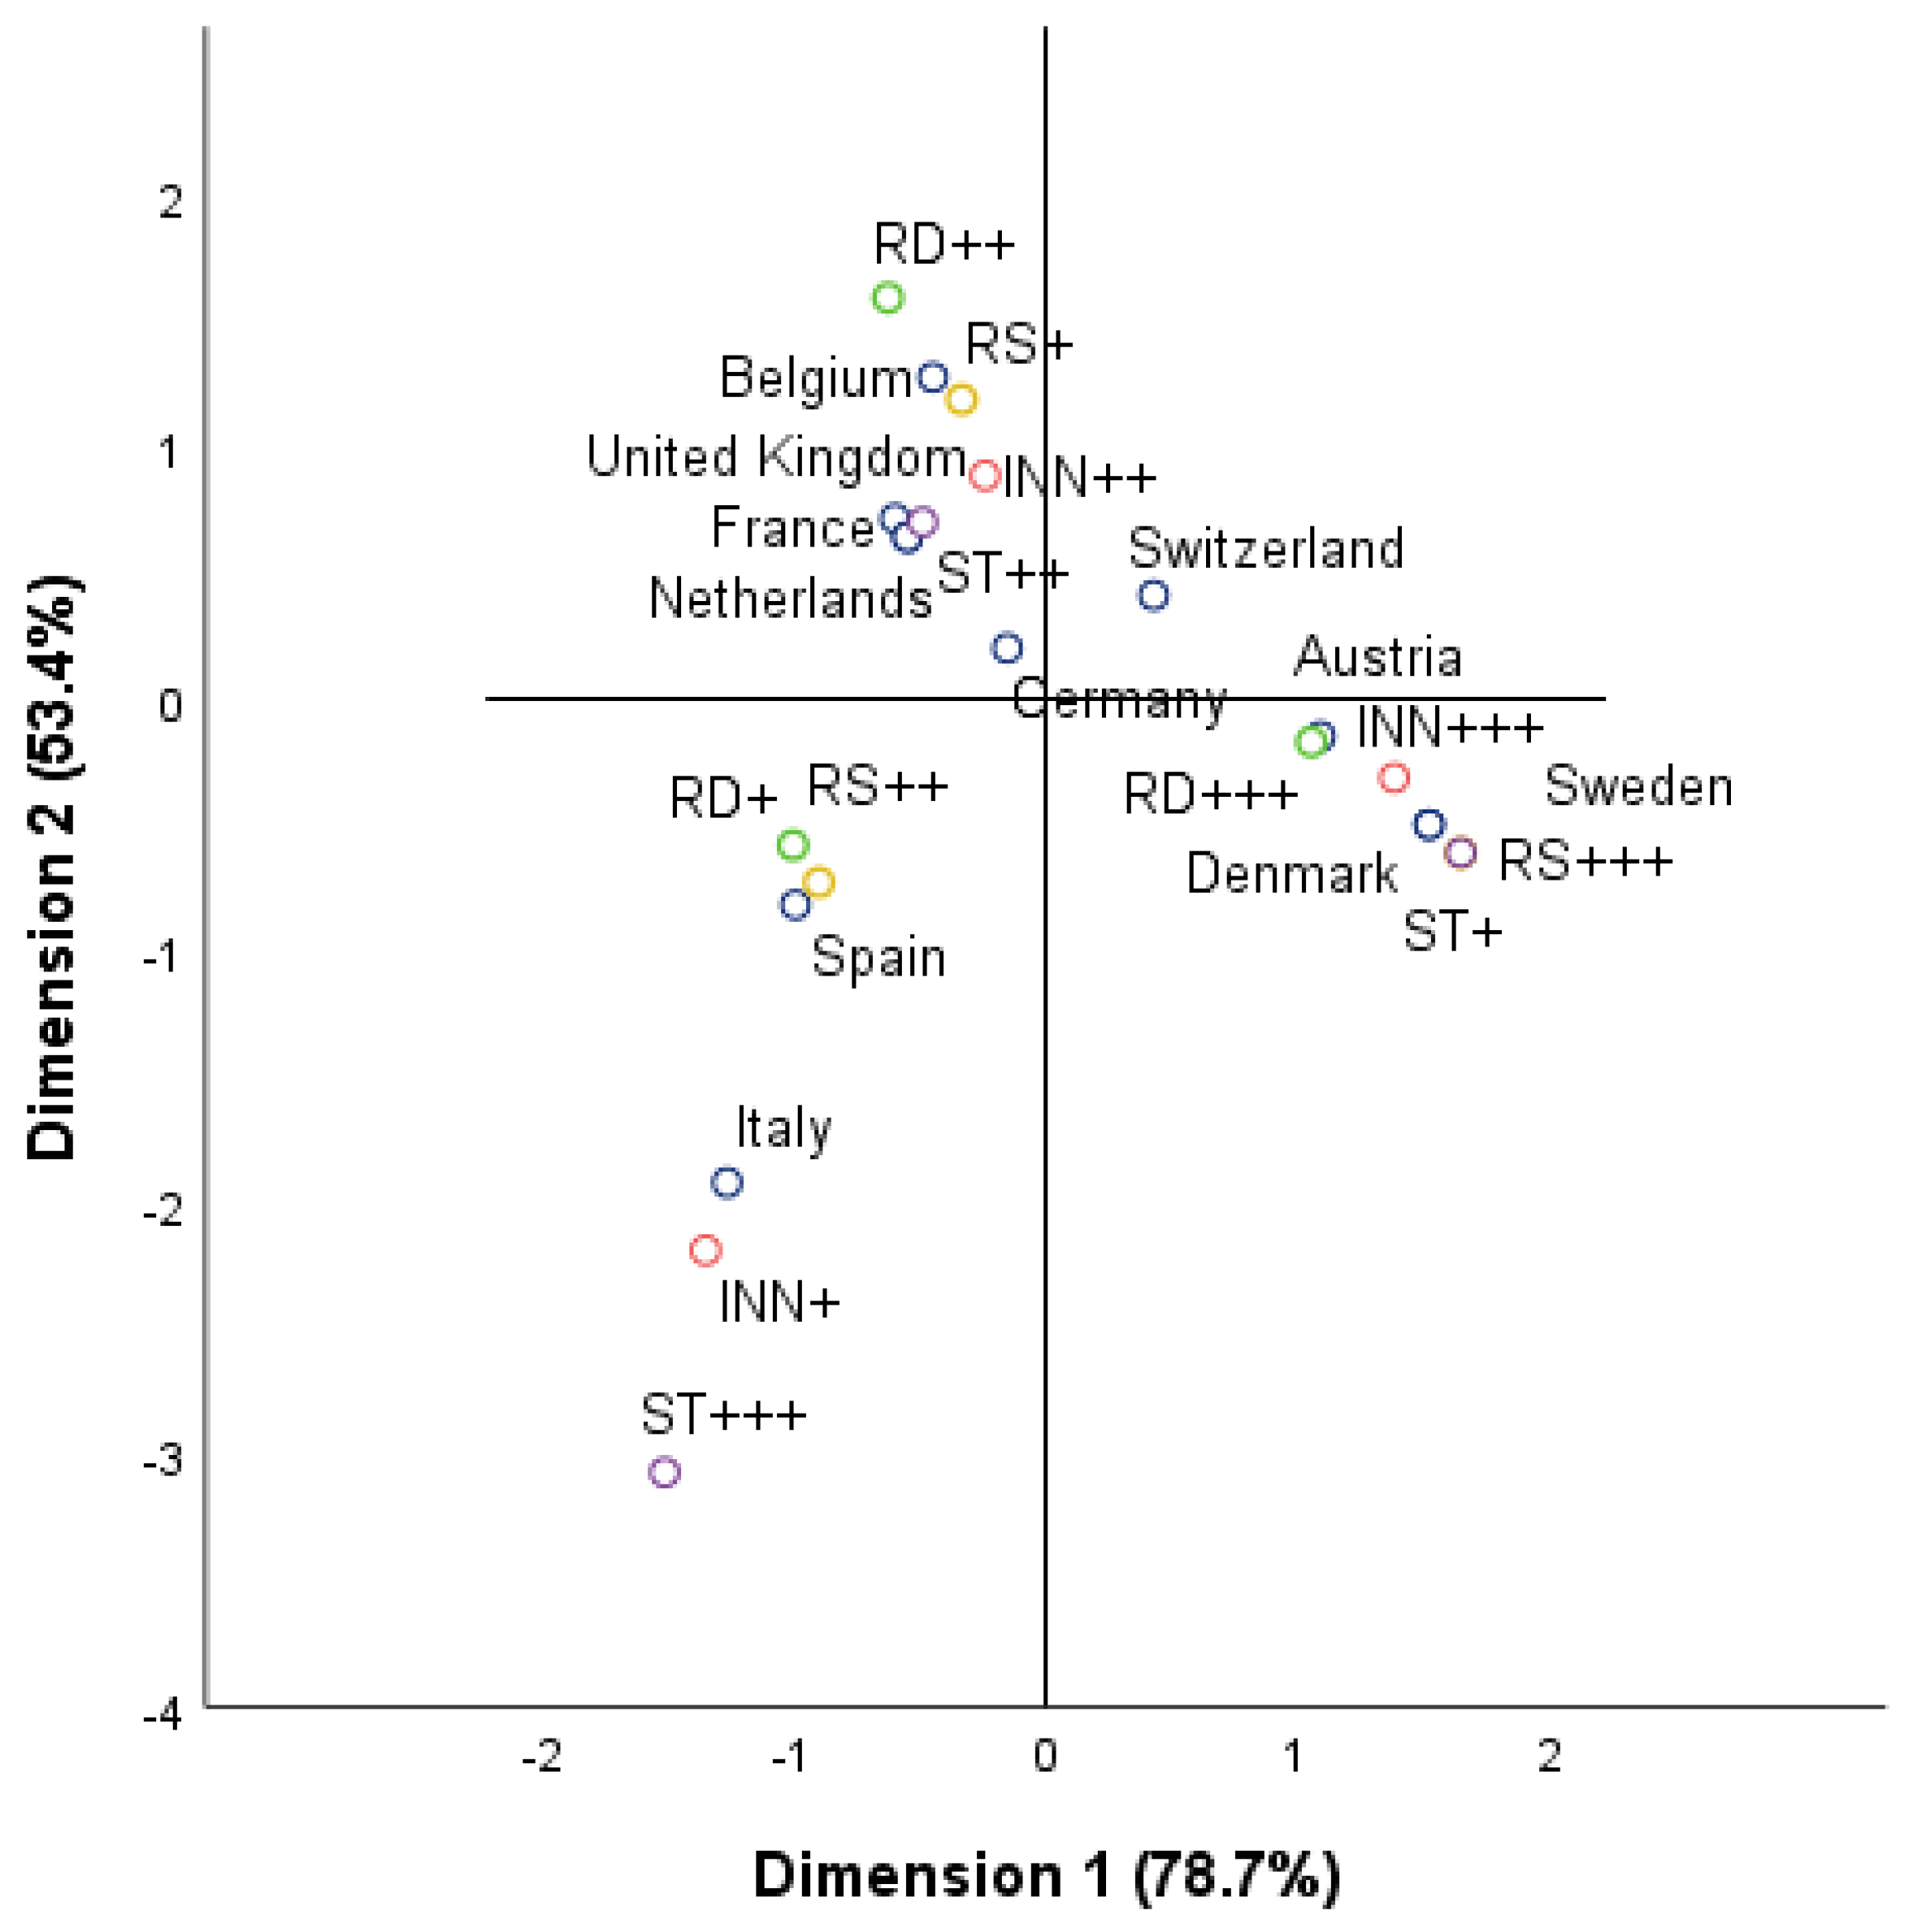
4.2. European Countries from a Multidimensional Perspective
5. Discussion
6. Conclusions
Author Contributions
Funding
Conflicts of Interest
References
- European Commission. Action Plan: Financing Sustainable Growth. 8 March 2018. Available online: https://ec.europa.eu/info/publications/180308-action-plan-sustainable-growth_en (accessed on 30 June 2020).
- Hood, C.; Rothstein, H.; Baldwin, R. The Government of Risk: Understanding Risk Regulation Regimes; Oxford University Press: Oxford, UK, 2001. [Google Scholar]
- Esty, D.C.; Porter, M.E. National Environmental Performance: An Empirical Analysis of Policy Results and Determinants. Environ. Dev. Econ. 2005. [Google Scholar] [CrossRef][Green Version]
- Gunningham, N.; Grabosky, P.; Sinclair, D. (Eds.) Designing Smart Regulation; Oxford University Press: Oxford, UK, 1998. [Google Scholar]
- Gunningham, N.; Sinclair, D. Integrative regulation: A principle-based approach to environmental policy. Law Soc. Inq. 1999, 24, 853–896. [Google Scholar] [CrossRef]
- Gunningham, N. Environment law, regulation and governance: Shifting architectures. J. Environ. Law 2009, 21, 179–212. [Google Scholar] [CrossRef]
- Gunningham, N. Enforcing environmental regulation. J. Environ. Law 2011, 23, 169–201. [Google Scholar] [CrossRef]
- Field, B. Environmental Economy. An Introduction; McGraw Hill: New York, NY, USA, 1994. [Google Scholar]
- Verbruggen, H. The Trade Effects of Economic Instruments. In Environmental Policies and Industrial Competitiveness; OECD: Paris, France, 1994. [Google Scholar]
- Śleszyński, J. Ekonomiczne Problemy Ochrony Środowiska; ARIES: Warszawa, Poland, 2000. [Google Scholar]
- OECD. Policy Instruments for the Environment. Available online: http://www.oecd.org/environment/tools-evaluation/PINE_Metadata_Definitions_2016.pdf (accessed on 25 June 2020).
- Eurosif. European SRI Study 2018. Brussels, 2018. Available online: http://www.eurosif.org/eurosif-2018-sri-study-launch-event (accessed on 30 June 2020).
- BloombergNEF. Available online: https://about.bnef.com/new-energy-outlook/ (accessed on 30 June 2020).
- White, W.; Lunnan, A.; Nybakk, E.; Kulisic, B. The role of governments in renewable energy: The importance of policy consistency. Biomass Bioenergy 2013, 57, 97–105. [Google Scholar] [CrossRef]
- Nybakk, E.; Niskanen, A.; Bajric, F.; Duduman, G.; Feliciano, D.; Jablonski, K.; Lunnan, A.; Sadauskiene, L.; Slee, B.; Teder, M. Innovation in the wood bio-energy sector in Europe. In Innovation in Forestry: Territorial and Value Chain Approaches; Weiss, G., Petenella, D., Ollonqvist, P., Slee, B., Eds.; CABI International: Wallingford, CT, USA, 2011; pp. 254–275. [Google Scholar] [CrossRef]
- Wüstenhagen, R.; Wolsink, M.; Bürer, M.J. Social acceptance of renewable energy innovation: An introduction to the concept. Energy Policy 2007, 35, 2683–2691. [Google Scholar] [CrossRef]
- Lund, H. Renewable energy strategies for sustainable development. Energy 2007, 32, 912–919. [Google Scholar] [CrossRef]
- Lund, H.; Mathiesen, B.V. Energy system analysis of 100% renewable energy systems—The case of Denmark in years 2030 and 2050. Energy 2009, 34, 524–531. [Google Scholar] [CrossRef]
- Talan, G.; Sharma, G.D. Doing Well by Doing Good: A Systematic Review and Research Agenda for Sustainable Investment. Sustainability 2019, 11, 353. [Google Scholar] [CrossRef]
- Chen, K.H.; Metcalf, R.W. The relationship between pollution control record and financial indicators revisited. Account. Rev. 1980, 55, 168–177. [Google Scholar]
- Jaggi, B.; Freedman, M.B. An Examination of the Impact of Pollution Performance on Economic and Market Performance: Pulp and Paper Firms. J. Bus. Financ. Account. 1992, 19, 697–713. [Google Scholar] [CrossRef]
- Wagner, M.; Van Phu, N.; Azomahou, T.; Wehrmeyer, W. The relationship between the environmental and economic performance of firms: An empirical analysis of the European paper industry. Corp. Soc. Responsib. Environ. Manag. 2002, 9, 133–146. [Google Scholar] [CrossRef]
- Klassen, R.D.; McLaughalin, C.P. The impact of environmental management on firm performance. Manag. Sci. 1996, 42, 1199–1214. [Google Scholar] [CrossRef]
- Dowell, G.; Hart, S.; Yeung, B. Do corporate global environmental standards create or destroy market value? Manag. Sci. 2002, 46, 1059–1074. [Google Scholar] [CrossRef]
- Schueth, S. Socially Responsible Investing in the United States. J. Bus. Ethics 2003, 43, 189–194. [Google Scholar] [CrossRef]
- Derwall, J.; Gunster, N.; Bauer, R.; Koedijk, K. The eco-efficiency premium puzzle. Financ. Anal. J. 2005, 61, 61–63. [Google Scholar] [CrossRef]
- Fama, E.F.; French, K.R. The Cross-Section of Expected Stock Returns. J. Financ. 1992, 47, 427–465. [Google Scholar] [CrossRef]
- Fama, E.F.; French, K.R. Common risk factors in the returns on stocks and bonds. J. Financ. Econ. 1993, 33. [Google Scholar] [CrossRef]
- Fama, E.F.; French, K.R. Multifactor Explanations of Asset Pricing Anomalies. J. Financ. 1996, 51, 55–84. [Google Scholar] [CrossRef]
- Carhart, M. On persistence in mutual fund performance. J. Financ. 1997, 52, 57–58. [Google Scholar] [CrossRef]
- Mallett, J.E.; Michelson, S. Green investing: Is it different from socially responsible investing? Int. J. Bus. 2010, 15, 395–410. [Google Scholar]
- Climent, F.; Soriano, P. Green and Good? The Investment Performance of US Environmental Mutual Funds. J. Bus. Ethics 2011, 103, 275–287. [Google Scholar] [CrossRef]
- Keefe, J.F. From SRI to sustainable investing. Greenmoney J. 2007, 66. Available online: http://www.ens-newswire.com/ens/aug2007/2007-08-06-03.asp (accessed on 23 July 2020).
- Keefe, J.F. Sustainable investing as an emergent investment discipline. In Proceedings of the Sustainable Investing 2008 Conference, New York, NY, USA, 23 September 2008; Available online: https://community-wealth.org/sites/clone.community-wealth.org/files/downloads/article-keefe.pdf (accessed on 12 July 2020).
- Ielasi, F.; Rossolini, M.; Limberti, S. Sustainability-themed mutual funds: An empirical examination of risk and performance. J. Risk Financ. 2018, 19, 247–261. [Google Scholar] [CrossRef]
- Ielasi, F.; Rossolini, M. Responsible or thematic? The true nature of sustainability-themed mutual funds. Sustainability 2019, 11, 3304. [Google Scholar] [CrossRef]
- Chang, C.E.; Nelson, W.A.; Witte, H.D. Do green mutual funds perform well? Manag. Res. Rev. 2012, 35, 693–708. [Google Scholar] [CrossRef]
- Gelissen, J. Explaining Popular Support for Environmental Protection: A Multilevel Analysis of 50 Nations. Environ. Behav. 2007. [Google Scholar] [CrossRef]
- Torgler, B.; García-Valiñas, M.A. The determinants of individuals’ attitudes towards preventing environmental damage. Ecol. Econ. 2007, 63, 536–552. [Google Scholar] [CrossRef]
- Jones, N.; Malesios, C.; Botetzagias, I. The influence of social capital on willingness to pay for the environment among European citizens. Eur. Soc. 2009, 11, 511–530. [Google Scholar] [CrossRef]
- Jones, N.; Evangelinos, K.; Halvadakis, C.P.; Iosifides, T.; Sophoulis, C.M. Social factors influencing perceptions and willingness to pay for a market-based policy aiming on solid waste management. Resour. Conserv. Recycl. 2010, 54, 533–540. [Google Scholar] [CrossRef]
- Marbuah, G. Is willingness to contribute for environmental protection in Sweden affected by social capital? In Environmental Economics and Policy Studies; Society for Environmental Economics and Policy Studies—SEEPS; Springer: Berlin/Heidelberg, Germany, 2019; Volume 21, pp. 451–475. [Google Scholar]
- Haseeb, M.; Abidin, I.S.Z.; Hye, Q.M.A.; Hartani, N.H. The Impact of Renewable Energy on Economic Well-Being of Malaysia: Fresh Evidence from Auto Regressive Distributed Lag Bound Testing Approach. Int. J. Energy Econ. Policy 2019, 9, 269–275. [Google Scholar]
- Eurosif. European SRI Study 2010. 2010. Available online: http://www.eurosif.org/sri-study-2010/ (accessed on 15 July 2020).
- Eurosif. European SRI Study 2012. 2012. Available online: http://www.eurosif.org/sri-study-2012/ (accessed on 15 July 2020).
- Eurosif. European SRI Study 2014. 2014. Available online: http://www.eurosif.org/sri-study-2014/ (accessed on 15 July 2020).
- Eurosif. European SRI Study 2016. 2016. Available online: http://www.eurosif.org/sri-study-2016/ (accessed on 15 July 2020).
- Eurostat Database/Sustainable Development Indicators/Climate Action. Available online: https://ec.europa.eu/eurostat/web/sdi/climate-action (accessed on 30 June 2020).
- Eurostat Database/Sustainable Development Indicators/Affordable and Clean Energy. Available online: https://ec.europa.eu/eurostat/web/sdi/affordable-and-clean-energy (accessed on 30 June 2020).
- Eurostat Database/Sustainable Development Indicators, Sustainable Cities and Communities. Available online: https://ec.europa.eu/eurostat/web/sdi/sustainable-cities-and-communities (accessed on 15 June 2020).
- Eurostat Database/Sustainable Development Indicators/Good Health and Well-Being. Available online: https://ec.europa.eu/eurostat/web/sdi/good-health-and-well-being (accessed on 15 June 2020).
- Eurostat Database. Available online: https://ec.europa.eu/eurostat/data/database (accessed on 15 June 2020).
- United Nations. 2030 Agenda for Sustainable Development. Available online: https://www.light-for-the-world.org/un-2030-agenda-sustainable-development (accessed on 20 July 2020).
- Greenacre, M.J. Theory and Applications of Correspondence Analysis; Academic Press: New York, NY, USA, 1984. [Google Scholar]
- Greenacre, M.J. Correspondence Analysis in Practice, 2nd ed.; Chapman and Hall/CRC: New York, NY, USA, 2007. [Google Scholar]
- IBM SPSS Categories 25; IBM Corporation: New York, NY, USA, 2018; Available online: ftp://public.dhe.ibm.com/software/analytics/spss/documentation/statistics/25.0/en/client/Manuals/IBM_SPSS_Categories.pdf (accessed on 15 July 2020).
- OECD. Policy Instruments for the Environment. Available online: https://www.oecd.org/environment/tools-evaluation/PINE_database_brochure.pdf (accessed on 15 September 2020).
- IRENA Remap 2030. A Renewable Energy Roadmap. 2014. Available online: https://www.irena.org/publications/2014/Jun/REmap-2030-Full-Report (accessed on 15 July 2020).
- World Nuclear Association. Available online: https://www.world-nuclear.org/ (accessed on 20 September 2020).


| STI 2009 | 2007–2009 | STI 2011 | 2009–2011 | STI 2013 | 2011–2013 | STI 2015 | 2013–2015 | STI 2017 | 2015–2017 | |
|---|---|---|---|---|---|---|---|---|---|---|
| Austria | 129 | nc | 56 | −56.6% | 82 | 46.4% | 271 | 230.5% | 992 | 266.1% |
| Belgium | 595 | nc | 367 | −38.3% | 816 | 122.3% | 275 | −66.3% | 8101 | 2845.8% |
| Denmark | 0 | nc | 43 | nc | nm | nc | 5232 | nc | 65 | −98.8% |
| Finland | 0 | nc | 322 | nc | 220 | −31.7% | 656 | 198.2% | nm | nc |
| France | 3279 | nc | 623 | −81.0% | 4392 | 605.0% | 43,065 | 880.5% | 20,620 | −52.1% |
| Germany | 2995 | nc | 4523 | 51.0% | 4127 | −8.8% | 8157 | 97.6% | 9184 | 12.6% |
| Italy | 987 | nc | 1051 | 6.5% | 1094 | 4.1% | 2064 | 88.7% | 52,861 | 2461.1% |
| Netherlands | 3324 | nc | 19,914 | 499.1% | 20,163 | 1.3% | 37,114 | 84.1% | 7125 | −80.8% |
| Norway | 0 | nc | 676 | nc | 2078 | 207.4% | nm | nc | nm | nc |
| Poland | 0 | nc | 0 | nc | 0 | nc | 3762 | nc | 0 | −100.0% |
| Spain | 0 | nc | 107 | nc | 82 | −23.4% | 300 | 265.9% | 12,665 | 4121.7% |
| Sweden | 0 | nc | 396 | nc | 1985 | 401.3% | 2315 | 16.6% | 1966 | −15.1% |
| Switzerland | 9508 | nc | 11,079 | 16.5% | 11,061 | −0.2% | 21,017 | 90.0% | 18,775 | −10.7% |
| United Kingdom | 4544 | nc | 8932 | 96.6% | 12,860 | 44.0% | 21,022 | 63.5% | 16,463 | −21.7% |
| Europe | 25,361 | nc | 48,090 | 89.6% | 58,961 | 22.6% | 145,249 | 146.3% | 148,840 | 2.5% |
| MEAN | 3381.5 | . | 6411.9 | . | 8422.9 | . | 20,749.9 | . | 22,896.7 | . |
| SD | 6627.0 | . | 12,867.1 | . | 15,747.9 | . | 38,534.2 | . | 40,359.8 | . |
| CV | 200% | . | 200% | . | 190% | . | 190% | . | 180% | . |
| Group of Indicators/Variables | Indicators/Variables | Correlation Coefficient (STI/1000) (p-Value) | Correlation Coefficient (STI) (p-Value) |
|---|---|---|---|
| Eurostat database/sustainable development indicators/climate action | Primary energy consumption, Goals 7 and 13 | 0.218 (0.519) | 0.218 (0.519) |
| Final energy consumption, Goals 7 and 13 | 0.218 (0.519) | 0.218 (0.519) | |
| Share of renewable energy in gross final energy consumption (%) [in electricity], Goals 7 and 13 | −0.273 (0.417) | −0.273 (0.417) | |
| Share of renewable energy in gross final energy consumption (%) [in heating and cooling], Goals 7 and13 | −0.308 (0.355) | −0.308 (0.355) | |
| Share of renewable energy in gross final energy consumption (%) [in transport], Goals 7 and 13 | 0.065 (0.853) | 0.065 (0.853) | |
| Average CO2 emissions per km by new passenger cars (source: EEA, DG CLIMA) | −0.464 (0.151) | −0.464 (0.151) | |
| Greenhouse gas emissions (source: EEA) | −0.301 (0.342) | −0.301 (0.342) | |
| Greenhouse gas emissions—intensity of energy consumption (source: EEA and Eurostat) | 0.091 (0.790) | 0.091 (0.790) | |
| Climate-related economic losses by type of event (source: EEA) | 0.091 (0.779) | 0.091 (0.779) | |
| Contribution to the international 100bn USD commitment to climate-related expenditure (source: DG CLIMA, EIONET) | 0.164 (0.631) | 0.164 (0.631) | |
| Population covered by the Covenant of Mayors for Climate & Energy signatories (source: Covenant of Mayors) | 0.252 (0.430) | 0.252 (0.430) | |
| Eurostat database/sustainable development indicators/affordable and clean energy | Energy productivity, Goals 7 and 13 | 0.509 (0.110) | 0.455 (0.160) |
| Eurostat database/sustainable development indicators/sustainable cities and communities | Recycling rate of municipal waste (% of total waste generated) | −0.434 (0.159) | −0.678 * (0.015) |
| Recycling rate of packaging waste by type of packaging | 0.236 (0.484) | −0.118 (0.729) | |
| Eurostat database/sustainable development indicators/good health and well-being | Exposure to air pollution by particulate matter (source: EEA) | −0.252 (0.430) | 0,000 (1.000) |
| Eurostat database/environment and energy | Total greenhouse gas emission in its carbon dioxide equivalent | 0.136 (0.689) | 0.655 (0.029) |
| Municipal waste generated (thousands of tons) | 0.077 (0.812) | 0.608 (0.036) | |
| Municipal waste collected (thousands of tons) | 0.155 (0.650) | 0.700 (0.016) | |
| Waste generated (kilograms per capita) | 0.018 (0.957) | 0.126 (0.696) | |
| Waste treatment (kilograms per capita) | −0.088 (0.787) | 0.021 (0.948) | |
| Recovery—energy recovery (R1) (kilograms per capita) | 0.039 (0.905) | −0.235 (0.463) | |
| Recycling—material (kilograms per capita) | −0.014 (0.966) | −0.088 (0.787) | |
| Europe 2020 indicator/climate change and energy | Share of energy from renewable sources in gross final energy consumption | −0.291 (0.385) | −0.155 (0.650) |
| Greenhouse gas emissions tons per capita (source: EEA) | −0.301 (0.342) | −0.448 (0.145) | |
| Greenhouse gas emissions (1990 = 100) | 0.336 (0.386) | 0.098 (0.762) | |
| Europe 2020 indicators/Nature and Ecosystems | Urban population exposed to PM10 concentrations exceeding the daily limit value (50 µg/m3 on more than 35 days in a year) | −0.268 (0.399) | −0.051 (0.876) |
Publisher’s Note: MDPI stays neutral with regard to jurisdictional claims in published maps and institutional affiliations. |
© 2020 by the authors. Licensee MDPI, Basel, Switzerland. This article is an open access article distributed under the terms and conditions of the Creative Commons Attribution (CC BY) license (http://creativecommons.org/licenses/by/4.0/).
Share and Cite
Janik, B.; Maruszewska, K. Valuation of the Environmental Effects of Socially Responsible Investments in Europe. Sustainability 2020, 12, 9855. https://doi.org/10.3390/su12239855
Janik B, Maruszewska K. Valuation of the Environmental Effects of Socially Responsible Investments in Europe. Sustainability. 2020; 12(23):9855. https://doi.org/10.3390/su12239855
Chicago/Turabian StyleJanik, Bogna, and Katarzyna Maruszewska. 2020. "Valuation of the Environmental Effects of Socially Responsible Investments in Europe" Sustainability 12, no. 23: 9855. https://doi.org/10.3390/su12239855
APA StyleJanik, B., & Maruszewska, K. (2020). Valuation of the Environmental Effects of Socially Responsible Investments in Europe. Sustainability, 12(23), 9855. https://doi.org/10.3390/su12239855