Article

Modelling Faba Bean (Vicia faba L.) Biomass Production for Sustainability of Agricultural Systems of Pampas

by
Yolanda Villacampa
1,*,
Francisco José Navarro-González
1,
Gabriela Hernández
2,
Juan Laddaga
2 and
Adriana Confalone
2
1
Department of Applied Mathematics, University of Alicante, Apartado 99, E-03080 Alicante, Spain
2
Núcleo de Investigación NAACCE, Facultad de Agronomía-Universidad Nacional del Centro de la Provincia de Buenos Aires, Azul 7300, BA, Argentina
*
Author to whom correspondence should be addressed.
Sustainability 2020, 12(23), 9829; https://doi.org/10.3390/su12239829
Submission received: 19 October 2020 / Revised: 19 November 2020 / Accepted: 21 November 2020 / Published: 24 November 2020
(This article belongs to the Special Issue Complex System Modeling Methods Applied to Sustainable Development)

Abstract

:
The Pampas region is characterized by a high complexity in its productive system planning and faces the challenge of satisfying future food demands, as well as reducing the environmental impact of the activity. Climate change affects crops and farmers should use species capable of adapting to the changed climate. Among these species, faba bean (Vicia faba L.) cv. ‘Alameda’ has shown good adaptation to weather variability and, as a winter legume, it can help maintain the sustainability of agricultural systems in the area. The main purpose of this research was to select the models which describe the production characteristics of the ‘Alameda’ bean by using the least number of variables. Experimental and agrometeorological data from the cultivation of the ‘Alameda’ in Azul, Buenos Aires province, Argentina were used to generate mathematical models. Several modelling methodologies have been applied to study the production characteristics of the faba bean. The prediction of the models generated was analyzed by randomly disturbing the experimental data and analyzing the magnitude of the errors produced. The models obtained will be useful for predicting the biomass production of the faba bean cv. ‘Alameda’ grown in the agroclimatic conditions of Azul, Buenos Aires province, Argentina.

1. Introduction

Faba bean (Vicia faba L.) is an important crop that can help maintain the sustainability of agricultural systems. It is expected that the world population will increase by 2050 (FAO, www.fao.org) [1], and consequently, the demand for food with an increase of the concern on environment and food security. Under this pressing scenario for agriculture, the widely acknowledged beneficial role of legumes in cropping systems, increasing biological nitrogen fixation, reducing energy costs, improving soil physical conditions and biodiversity, is more needed than ever. In addition, legumes are important feed crops with a relevant role as forage producing high-quality meat and milk [2].
The availability of various forage species is essential for sustainability in agricultural-livestock systems based on cultivated species. An issue of essential importance for countries such as Argentina, which have a large area of their territory dedicated to agricultural activity. Currently, the role of legumes is being revalued throughout the world since they constitute the botanical family, which has maintained the production and fertility of agrarian systems from ancient times producing biologically fixed nitrogen [3].
Faba bean (Vicia faba L.) is the third most important crop within the cold season legumes. It is cultivated in more than 55 countries. It grows under different farming systems and it has different uses such as dry grains, green pods, animal feed, and green fertilizer. The cultivated area in the world is about 2.4 million hectares, with 4.4 million tons produced. The nitrogen supplied by symbiotic fixation in legumes nodules is considered essential for economically and environmentally sustainable production [4].
It is a crop that can be attractive for farmers in Argentina since it achieves high yields in rainfed conditions [5]. This is a characteristic that should be taken into account, since with the concern of climate change, it is necessary to produce adaptive species to new climate scenarios. In addition, a rotation which includes the bean in cereal crops, improves the physicochemical and biological state of the soil [6].
The ’Alameda’ faba bean has a base temperature, which allows it to grow in periods when the vapour pressure deficit is low, giving it high efficiency in the use of water during these periods. It has a good capacity for fixing atmospheric nitrogen, estimated at 100–120 kg N ha−1. Currently, it is only cultivated in the northern hemisphere where it is sown during the spring in cold climates and in autumn/winter in temperate and subtropical climates, either in irrigated areas or in fresh dry land in pure cultivation and also mixed with a grass (oats, triticale). The dry matter production of the faba bean is related to its ability to intercept the incident photosynthetically active radiation (PAR) [7]. In legumes, phenology is mainly regulated by the genetic response to temperature and photoperiod, and the bean is considered a quantitative long day plant, as defined in [8], since it is a species whose flowering begins more quickly in long days, but is not inhibited (qualitative) in short days, only delayed [4].
The importance of the cultivation activity makes an advance in understanding the process, which improves the profitability and availability of the crops of great interest. Mathematical models can play an important role here by studying the relative importance of different factors that can affect the quantity and quality of the bean harvest. The benefit obtained by the results of these types of studies goes further if we take into account the fact that the improvement in the cultivation process entails a greater use of the available resources. Therefore, increasing the sustainability of the economic activity by reducing its environmental impact.
The rest of the paper is organized as follows. Section 2 presents the justification for the selection of variables used in the study. Likewise, the mathematical models to be used are introduced. In Section 3, these models are used to study the data obtained in Paris. In addition, a study of the stability of the different models is carried out. Section 4 presents a discussion of the results, while Section 5 constitutes the conclusions of the study.

2. Materials and Methods

2.1. Previous Models

Models are powerful tools to test hypotheses, synthesize knowledge, describe and understand complex systems, and compare different scenarios. Models may be used in decision support systems, greenhouse climate control, and prediction and planning of production. Consequently, the interest in modelling of biomass production and yield of crops is still increasing as indicated by the increasing proportion of publications—listed in the CAB Abstract Database—dealing with the models [9].
Some descriptive models have been developed for Vicia faba, for example, the emergency response to temperature [10] and the dynamics of crop growth and nutrient uptake, as well as their correlation with the grain yield [11]. Mechanistic models that understand the growth and development of the broad bean include the FAGS model [12], CROPGRO-fababean model [13] included in the software as DSSAT [14], and structural models such as the Alameda model [15]. Explanatory models such as radiation interception are a simple way to approach the biomass production of a crop and is used for the radiation method [16], in which the growth of a crop depends on its ability to capture light and its conversion efficiency of light intercepted in the biomass. In this method, the dry matter production of a crop can be expressed as the product of three terms: The incident photosynthetically active radiation (PAR) per unit surface area (MJ m−2), the proportion of photosynthetically active radiation intercepted by the culture (PAR interception efficiency), and the production of dry matter per unit of PAR intercepted (PAR use efficiency, RUE, g MJ−1) [16]. While the PAR interception efficiency is a function of the leaf area index (LAI) and canopy extinction coefficient [17] for a particular cultivar, RUE may vary with temperature, as well as nutrient and water availability [18]. It can also vary with different planting dates due to exposure to different temperatures and photoperiods [7].
Although mechanistic models are robust, they present the difficulty in which they must be calibrated locally. Other widely used models, such as radiation interception, have the difficulty of obtaining parameters such as K and IAF of the crop. The radiation method, despite being a simple model, has difficult-to-obtain parameters such as RUE, LAI, or k [19].
The aim of the present study was to generate predictive models of biomass (dry matter) production of the Vicia faba Alameda based on readily available agrometeorological variables and at the meteorological stations in the center of the Buenos Aires province. Predictive models will be very useful for the agronomic sector, in order to know the potential productivity of the Alameda bean grown in the agroclimatic environment of the center of Buenos Aires province.
Therefore, it would be beneficial to have a model which relates biomass production with easily available agrometeorological variables in any meteorological station, such as radiation and temperature (thermal sum or degrees day), in addition to the photoperiod.

2.2. Mathematical Modelling

Mathematical models allow us to study and predict the behaviour of systems and, in general, the processes of the world around us. In the study and modelling of systems, it is common to find relationships between variables whose behaviour is important for the study of a given phenomenon. Therefore, determining the relationship or Equation (1) from the set of experimental data given by Equation (2):
z = u ( x 1 , x 2 , . , x n ) ,
{ z i , x i 1 , x i 2 , x i 3 . , x i n } i = 1 , 2 , . , p ,
Modelling a relationship from the experimental data can be done in several ways. On the one hand, you can generate either linear or non-linear mathematical equations. On the other hand, the application of methods that allow us to analyze and predict the relationship without obtaining a mathematical equation, which we usually call numerical methodologies.
One possibility when modelling a system is to use linear regression [20], in which the relationship between the variables is given by a multilinear expression as follows:
z = α   + β x 1 + γ x 2   + μ x 3 + . + σ x n ,
Multilinear regression models allow a simple interpretation of Equation (1), although they may not be the most suitable for modelling complex phenomena as those involved in agriculture [21] by its simplicity. While linear models may be useful in a sub-region of the system variable definition domain. In addition, assuming that such a relationship is valid for the entire domain is often a too strong condition. However, despite these limitations, the use of these types of models is very frequent and they are particularly useful as a minimum reference model.
A generalization of the approach shown above is constituted by non-linear regression models where the expression given by Equation (3) includes non-linear terms. These models are frequently used in research fields such as biology, social sciences, medicine, ecology, engineering sciences, finance, etc. The main problem with non-linear regression models is that it is necessary to assume an analytical expression for the relationship between the variables, and in a large number of cases this information cannot be obtained.
The regression models introduced above have a common basis. By defining an error function calculated from the experimental data and the corresponding estimates, which is generally the least-squares criterion [22], an expression that depends on the parameters defined in the models is formed. Considering the optimization problem with respect to these parameters, the model that minimizes the error is obtained. The parameters are calculated by means of algorithms, which fulfil convergence properties and can obtain in a reasonable time the parameters of the model: Quasi-Newton method, Levenberg-Marquardt, and improvement methods, etc. [23,24,25,26].
Numerical methodologies are important due to their application in science and engineering processes where it is not possible to represent relationships by mathematical equations. Some numerical methodologies developed by the authors have been successfully applied in the modelling of different problems [27,28,29,30]. These methodologies are based on the generation of a geometrical model of finite elements. In the same way, the methodology developed in [31] is based on Galerkin’s formulation of the finite element method, to obtain representations of the relationship shown in Equation (1). Recently, a numerical methodology called the octahedric regression has been developed [32]. The octahedric regression can be considered as a hybrid method, which includes characteristics from the finite element method, radial basis function, and nearest neighbours. This is the methodology applied in the numerical methods.
The basis is the generation of geometric models of finite elements in a hyperoctahedra, and from which the relationship (1) between the dependent variable and the independent or explanatory variables is calculated. Each geometric model of finite elements, is defined by a number called complexity (C) and that coincides with the number of hyperoctahedra that fit on one edge of the hypercubic domain [ 0 , 1 ] n . In this methodology, the model is obtained at the nodes, and the value of the model can be estimated at any point from interpolation functions, using the following equation:
z ^ ( x o ) = 1 2 n · i = 1 n λ = ± 1 k = 1 P y k S ·   Φ ( x k x o + λ h 2 e i , h ) Φ ( x k x o + λ h 2 e i , h )   ,
where h is related to the complexity as h = 1 C and Φ ( r , ω ) = e r ω is the radial basis.
Following Equation (4), the proposed algorithm (Algorithm 1) can be condensed in the next schema:
Algorithm 1. Algorithm for the octahedric regression model.
1:  for i in Integers{1 .. P}
2.     Real estimation[i] = 0
3.     for k in Integers{1 .. n}
4.         Real estim_plus = 0, estim_minus = 0
5.         Real dist_plus = 0, dist_minus = 0
6.       for j in Integers{1 .. P}
7.         dist_plus = dist_plus + Φ ( x j x i + h 2 e k , h )
8.         dist_minus = dist_minplus + Φ ( x j x i h 2 e k , h )
9.         estim_plus = estim_plus + y[j] × Φ ( x j x i + h 2 e k , h )
10.       estim_minus = estim_min + y[j] × Φ ( x j x i h 2 e k , h )
11.     estim_plus = estim_plus/dist_plus
12.     estim_minus = estim_minus/dist_minus
13.     estimation[i] = estimation[i] + (estim_plus + estim_minus)/(2 × n);

3. Results

3.1. Experimental Data

The study was carried out over a period of four agricultural seasons (2009-2012) in the experimental field of the Faculty of Agronomy at the National University of the center of Buenos Aires province, in Azul, Argentina (36°45′ S; 59°50′ W, altitude: 132 m) (Figure 1).
The soil, classified as Typical Argiudol [33], was fertilized with P and K before sowing to avoid any limitation of these nutrients.
Soil-water availability was maintained close to the field capacity for all treatments using drip irrigation when required. The water to be applied in each irrigation was calculated as the product of reference evapotranspiration (estimated with the Penman-Monteith equation) and the corresponding crop coefficient for the faba bean [34], less the amount of precipitation in the period considered.
Crops were maintained free of pests, diseases, and weeds. Agrometeorological information was recorded daily by an automatic weather station located close to the experimental field (CRAGM, 2020). The photoperiod was calculated as the sum of day length and civil twilight, those periods when the sun is between 0 and 6° below the horizon, to account for the photoperiod response during twilight [35]. Computations were made according to [34].
The faba bean cultivar used was Alameda. The treatments consisted of different sowing dates from mid-July to mid-November. Twelve sowing dates were obtained in the four growing seasons: Five sowing dates in 2009 and 2010 and one sowing date in 2011 and 2012. The treatments were assigned to the experimental plots in a randomized complete-block design, with three replications, and 45 m2 per experimental unit. The plant population density was 35 plants m2 in rows 0.35 m apart and oriented North-South.
The 12 sowing dates provided a wide range of agrometeorological conditions to examine the dry matter production of the Alameda bean.
In this research, linear, numerical, and non-linear models have been analyzed in order to generate models that relate dry matter to the agrometeorological variables thermal sum, photosynthetically active radiation (PAR), and photoperiod, as seen in Table 1:
The daily incident PAR was estimated as 50% of the measured daily global radiation [36]. Each plot was sampled every 15 days by harvesting plants from 0.5 m2. The harvested material was dried to a constant weight at 65 °C to determine the above ground dry matter.
The thermal sum or degree days were obtained considering a base temperature of 0 °C [10], according to Equation (5):
T T = i = 1 n ( T T b ) ,
where TT is the thermal time (or thermal sum or degrees-day) accumulated in the n days (°Cd), T is the average daily temperature (°C), and Tb is the base temperature (°C).
The experimental data consists of 86 values for each variable and its statistical summary can be seen in the Table 2 below:
The validity of the prediction has been studied by analyzing the errors produced in each model and by analyzing the variability in the prediction of the model when the experimental data are randomly disturbed. Defining the error e i = ( z i z ^ i ) , with { z i } i being the experimental data and { z ^ i } i the values obtained in the model prediction, the following measures were used to analyze the error:
(a) Mean absolute error (MAE):
In statistics, this is a measure of errors between paired observations expressing the same phenomenon:
M A E = i | e i | n ,
(b) Mean absolute percentage error:
The mean absolute percentage error, (MAPE), is also known as the mean absolute percentage deviation (MAPD):
M A P E = i | z i z ^ i z i | n ,
Multiplying by 100% makes it a percentage error.
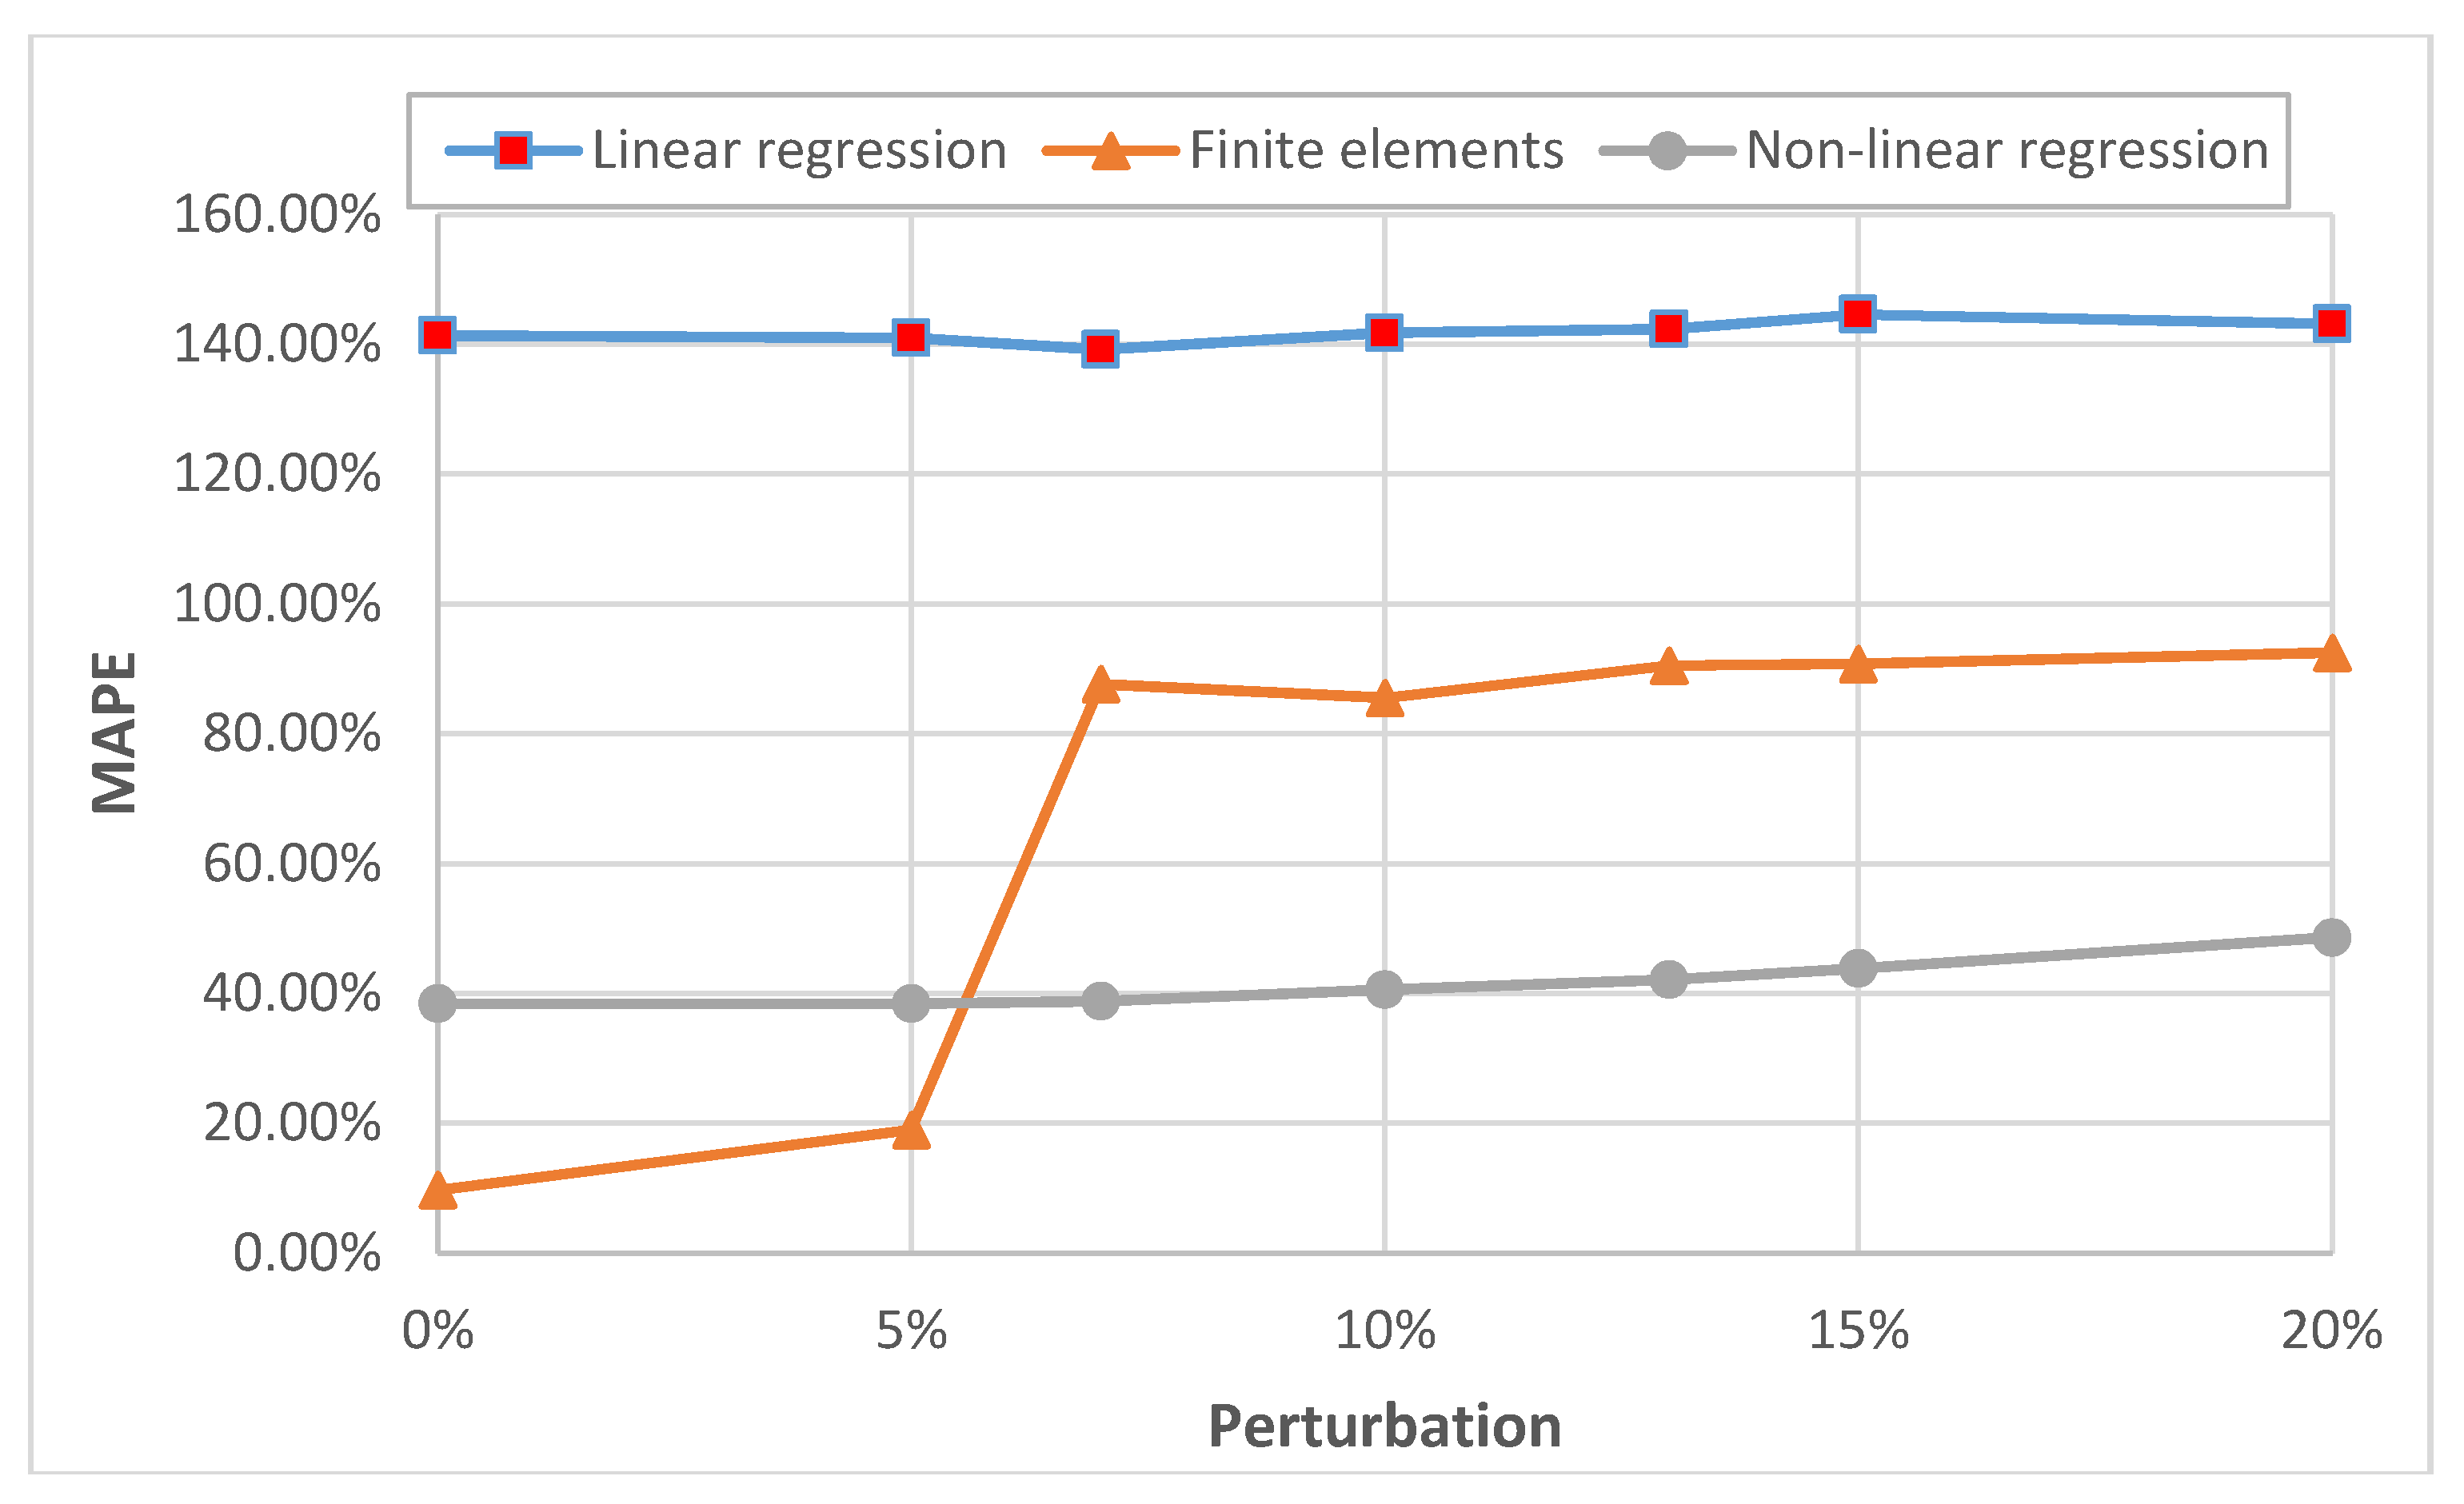
Finally, in all the methodologies, the predictive stability of the models has been analyzed. To do this, the experimental data of the explanatory or independent variables have been randomly disturbed ten times at 5%, 7%, 10%, 13%, 15%, and 20%, the values predicted by the model are obtained, calculating the errors and comparing their means. The 0% perturbation indicates the errors, which are generated in the model with the undisturbed experimental data.
The results obtained for the different models are discussed below.

3.2. Linear Models

To select the linear models, in this research, the backward stepwise method has been used. The backward stepwise regression is a stepwise regression approach, which begins with a full (saturated) model and at each step gradually eliminates one variable from the regression model to find a reduced model that best explains the data. The method is known as the backward elimination regression and is applied by the example in [37,38].
The dry matter of the Alameda bean is considered as a dependent variable depending on the explanatory variables: Thermal sum, photosynthetic active radiation (PAR), and the photoperiod. In addition, whether there is collinearity between the explanatory variables has been analyzed. Using the SPSS program, [39], calculating the statistic FIV, a large FIV indicates collinearity. In addition, the condition index has been calculated. A value greater than 20 confirms problems of collinearity. The results obtained for the models indicate a collinearity problem. The linear regression model is the following:
z = 4023.549 + 4.308 · x 1 + 6.299 · x 2 + 26.649 · x 3 ,
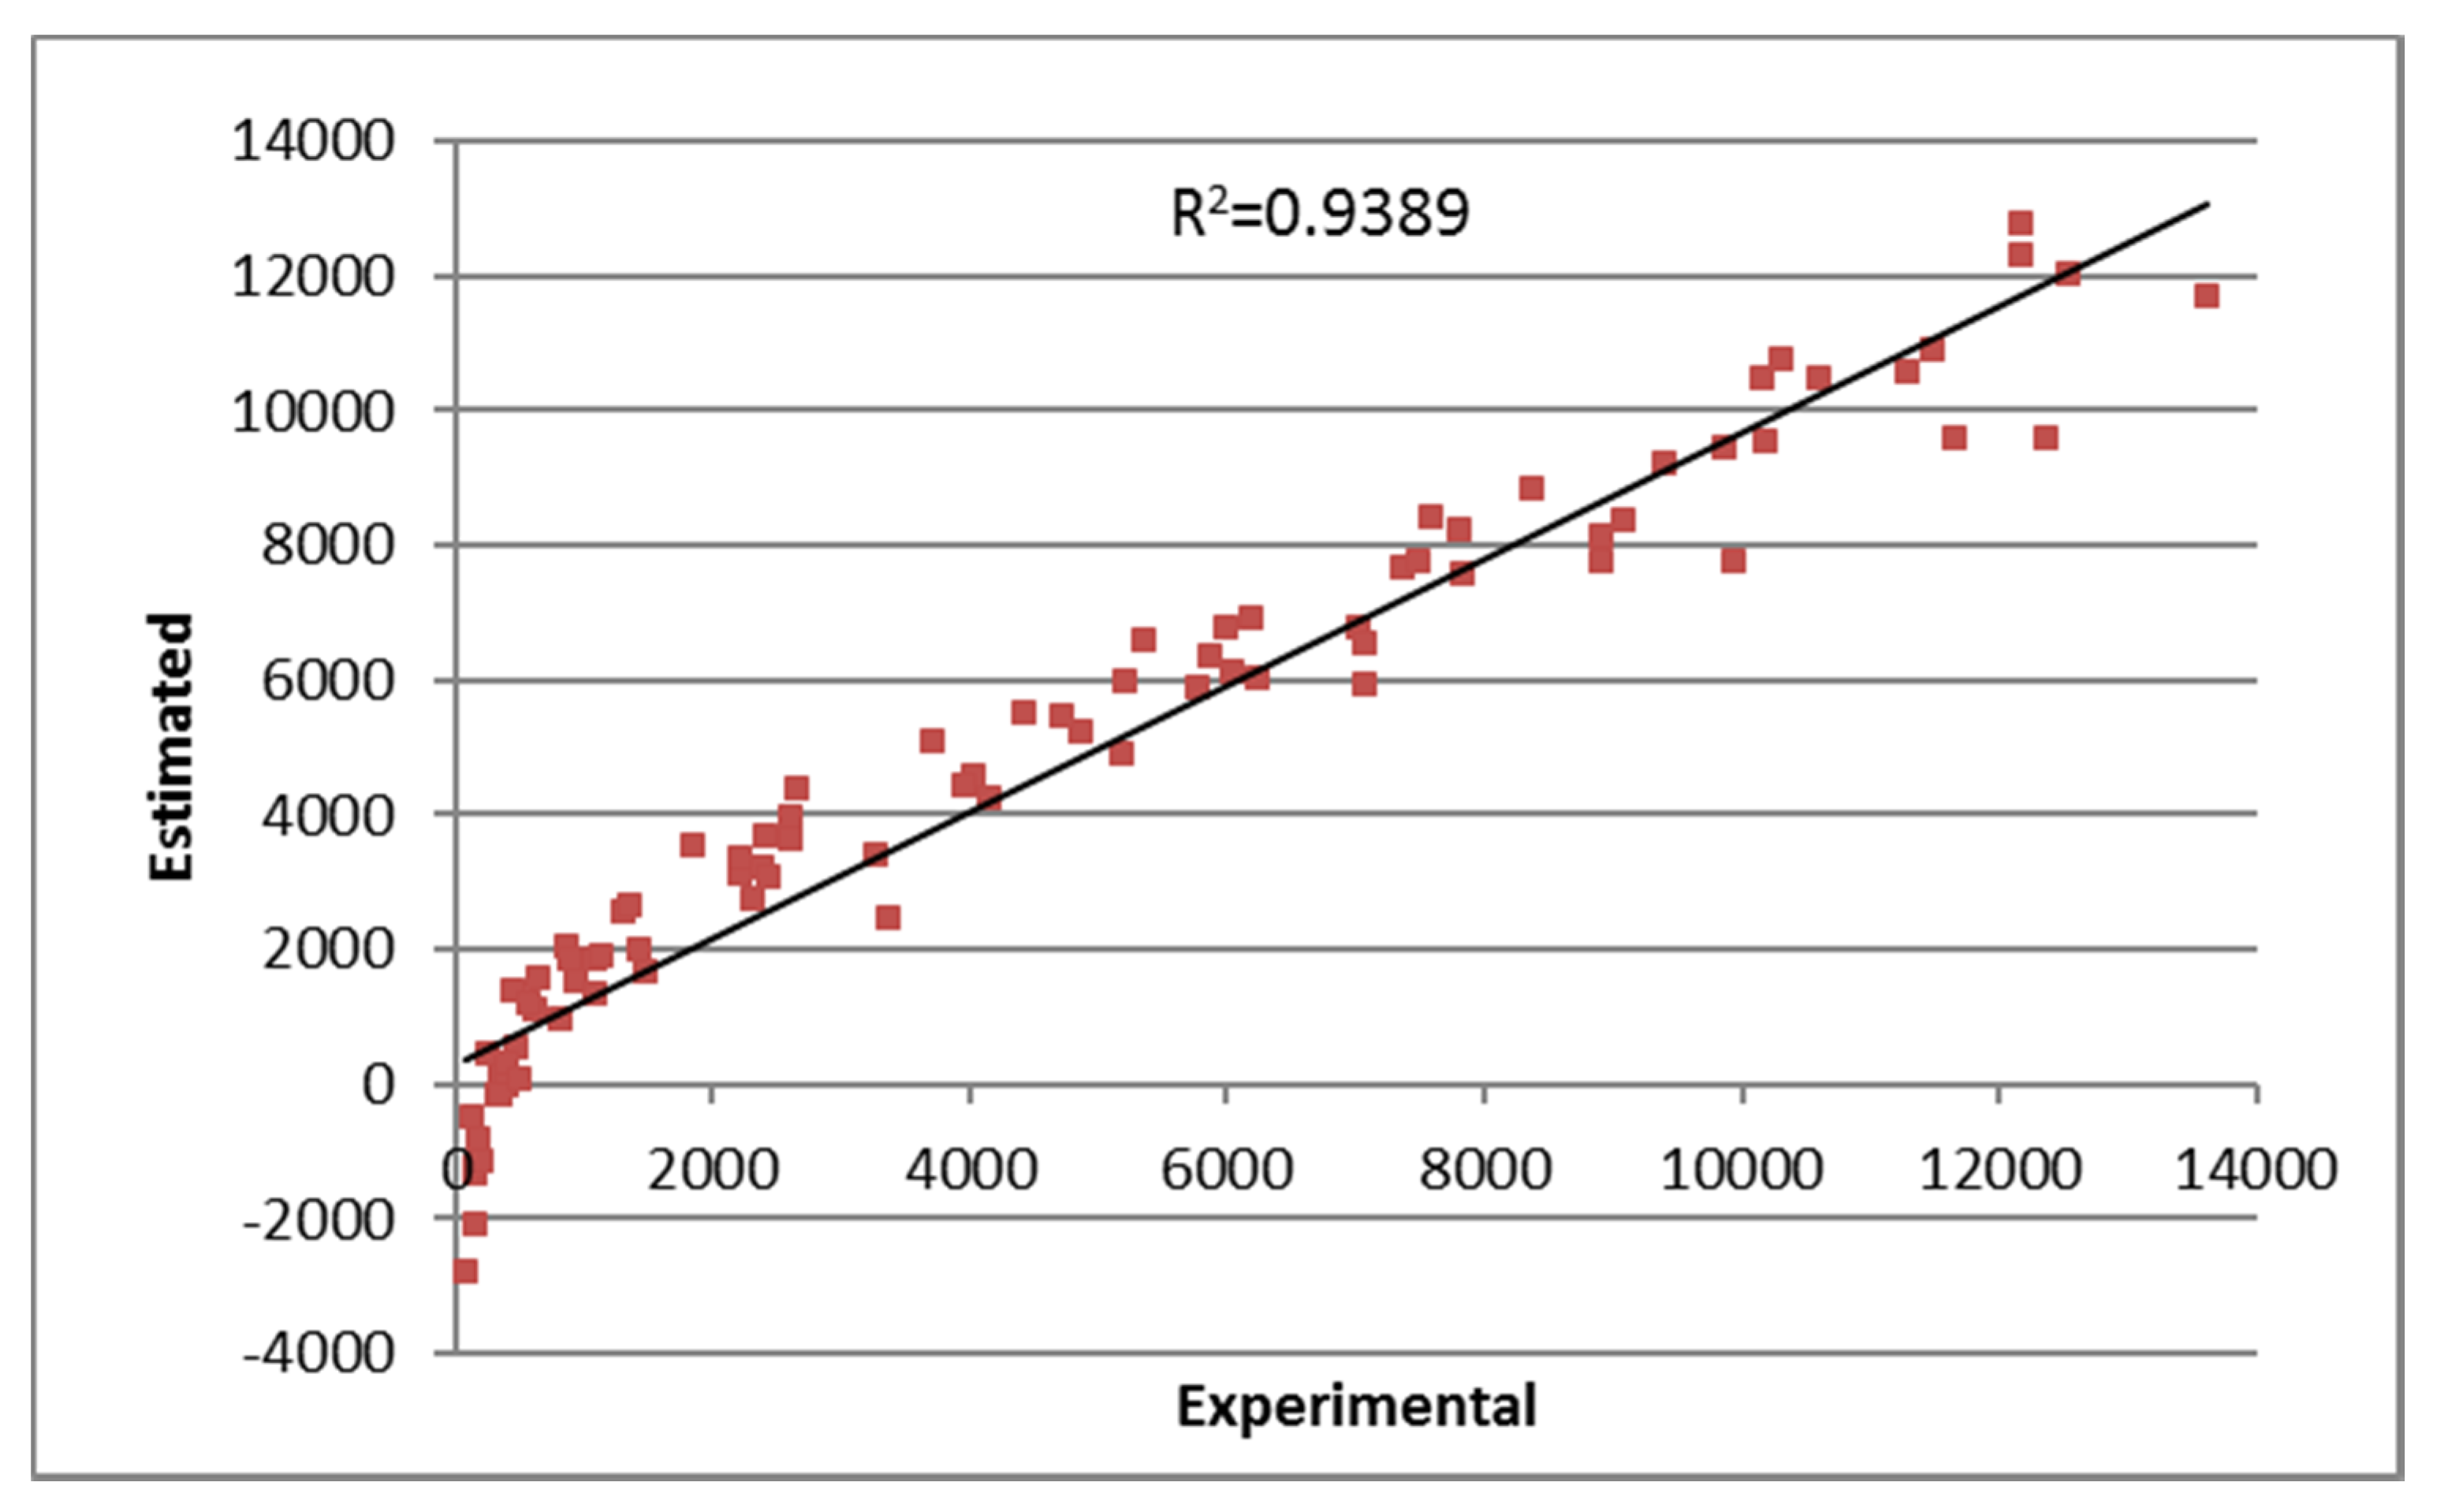
The adjustment is good, with a determination coefficient of R 2 = 0.9389 , large FIV values, and condition number greater than 20 (33,293). Figure 2 shows the results of the regression model, defined in Equation (8), versus the dry matter model.
On the other side, the analyzed errors are high, for example, in the first linear model, MAE = 782.744 and MAPE = 141.34%.

3.3. Numerical Models

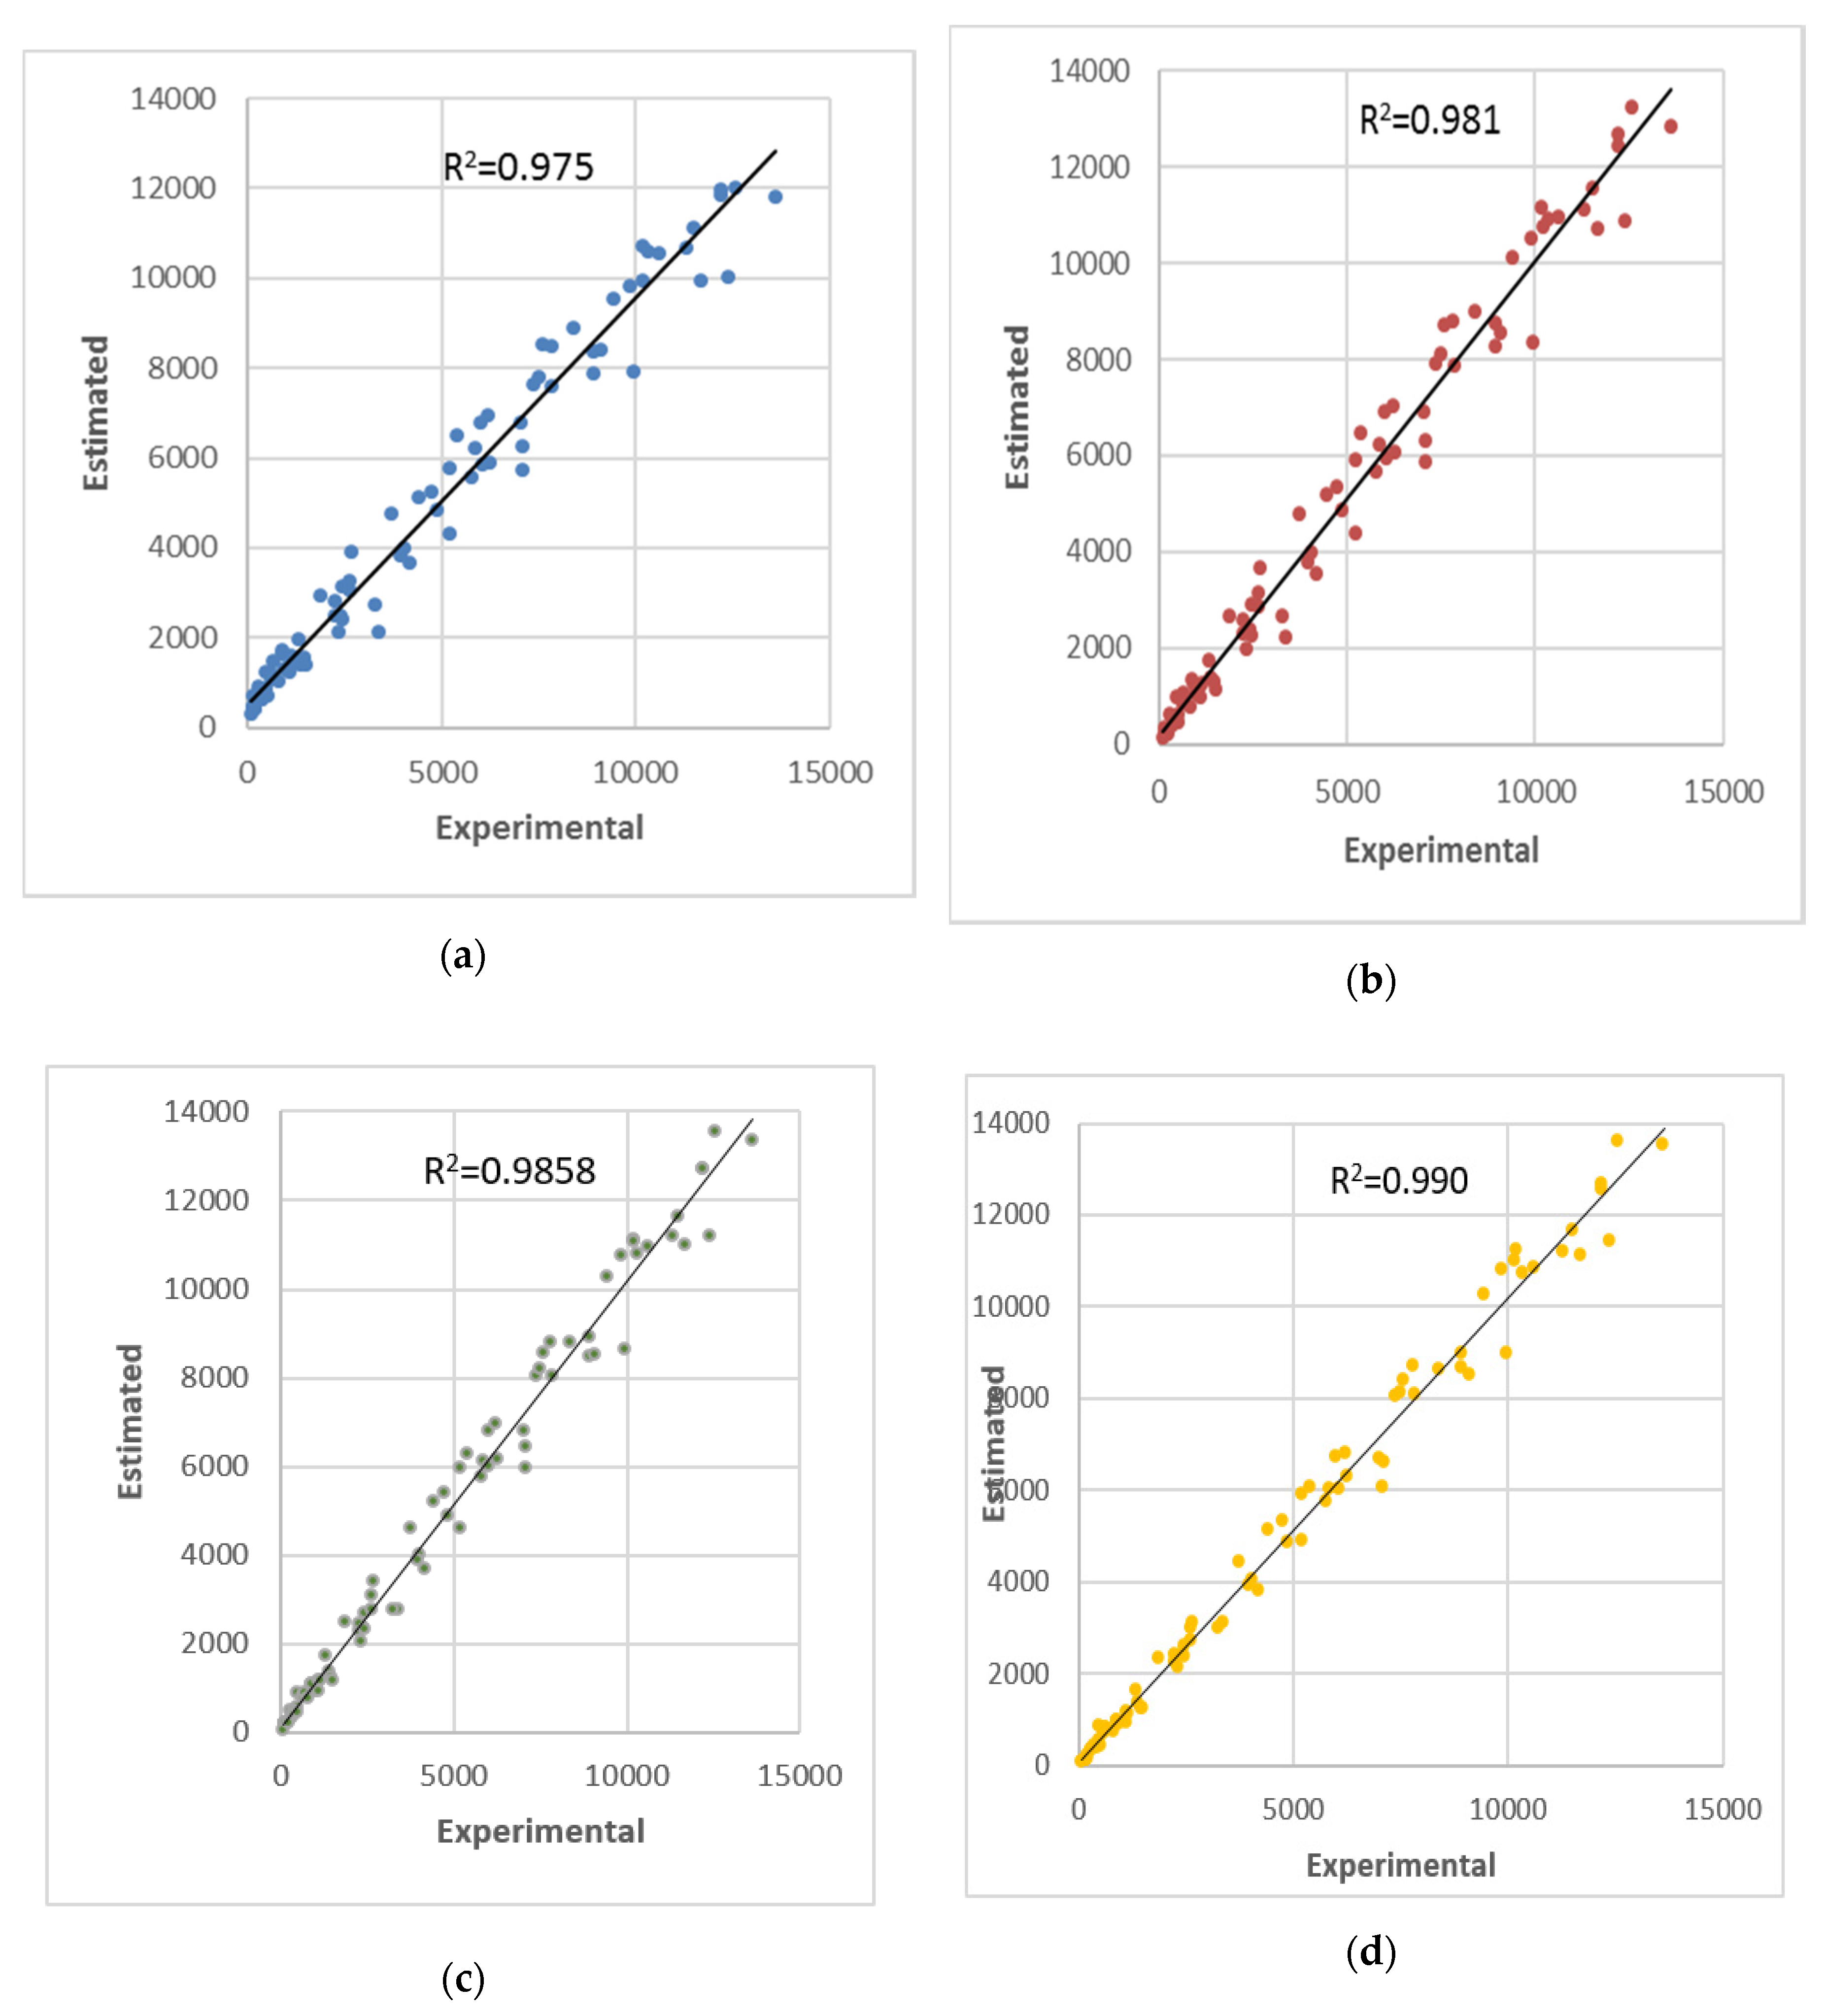
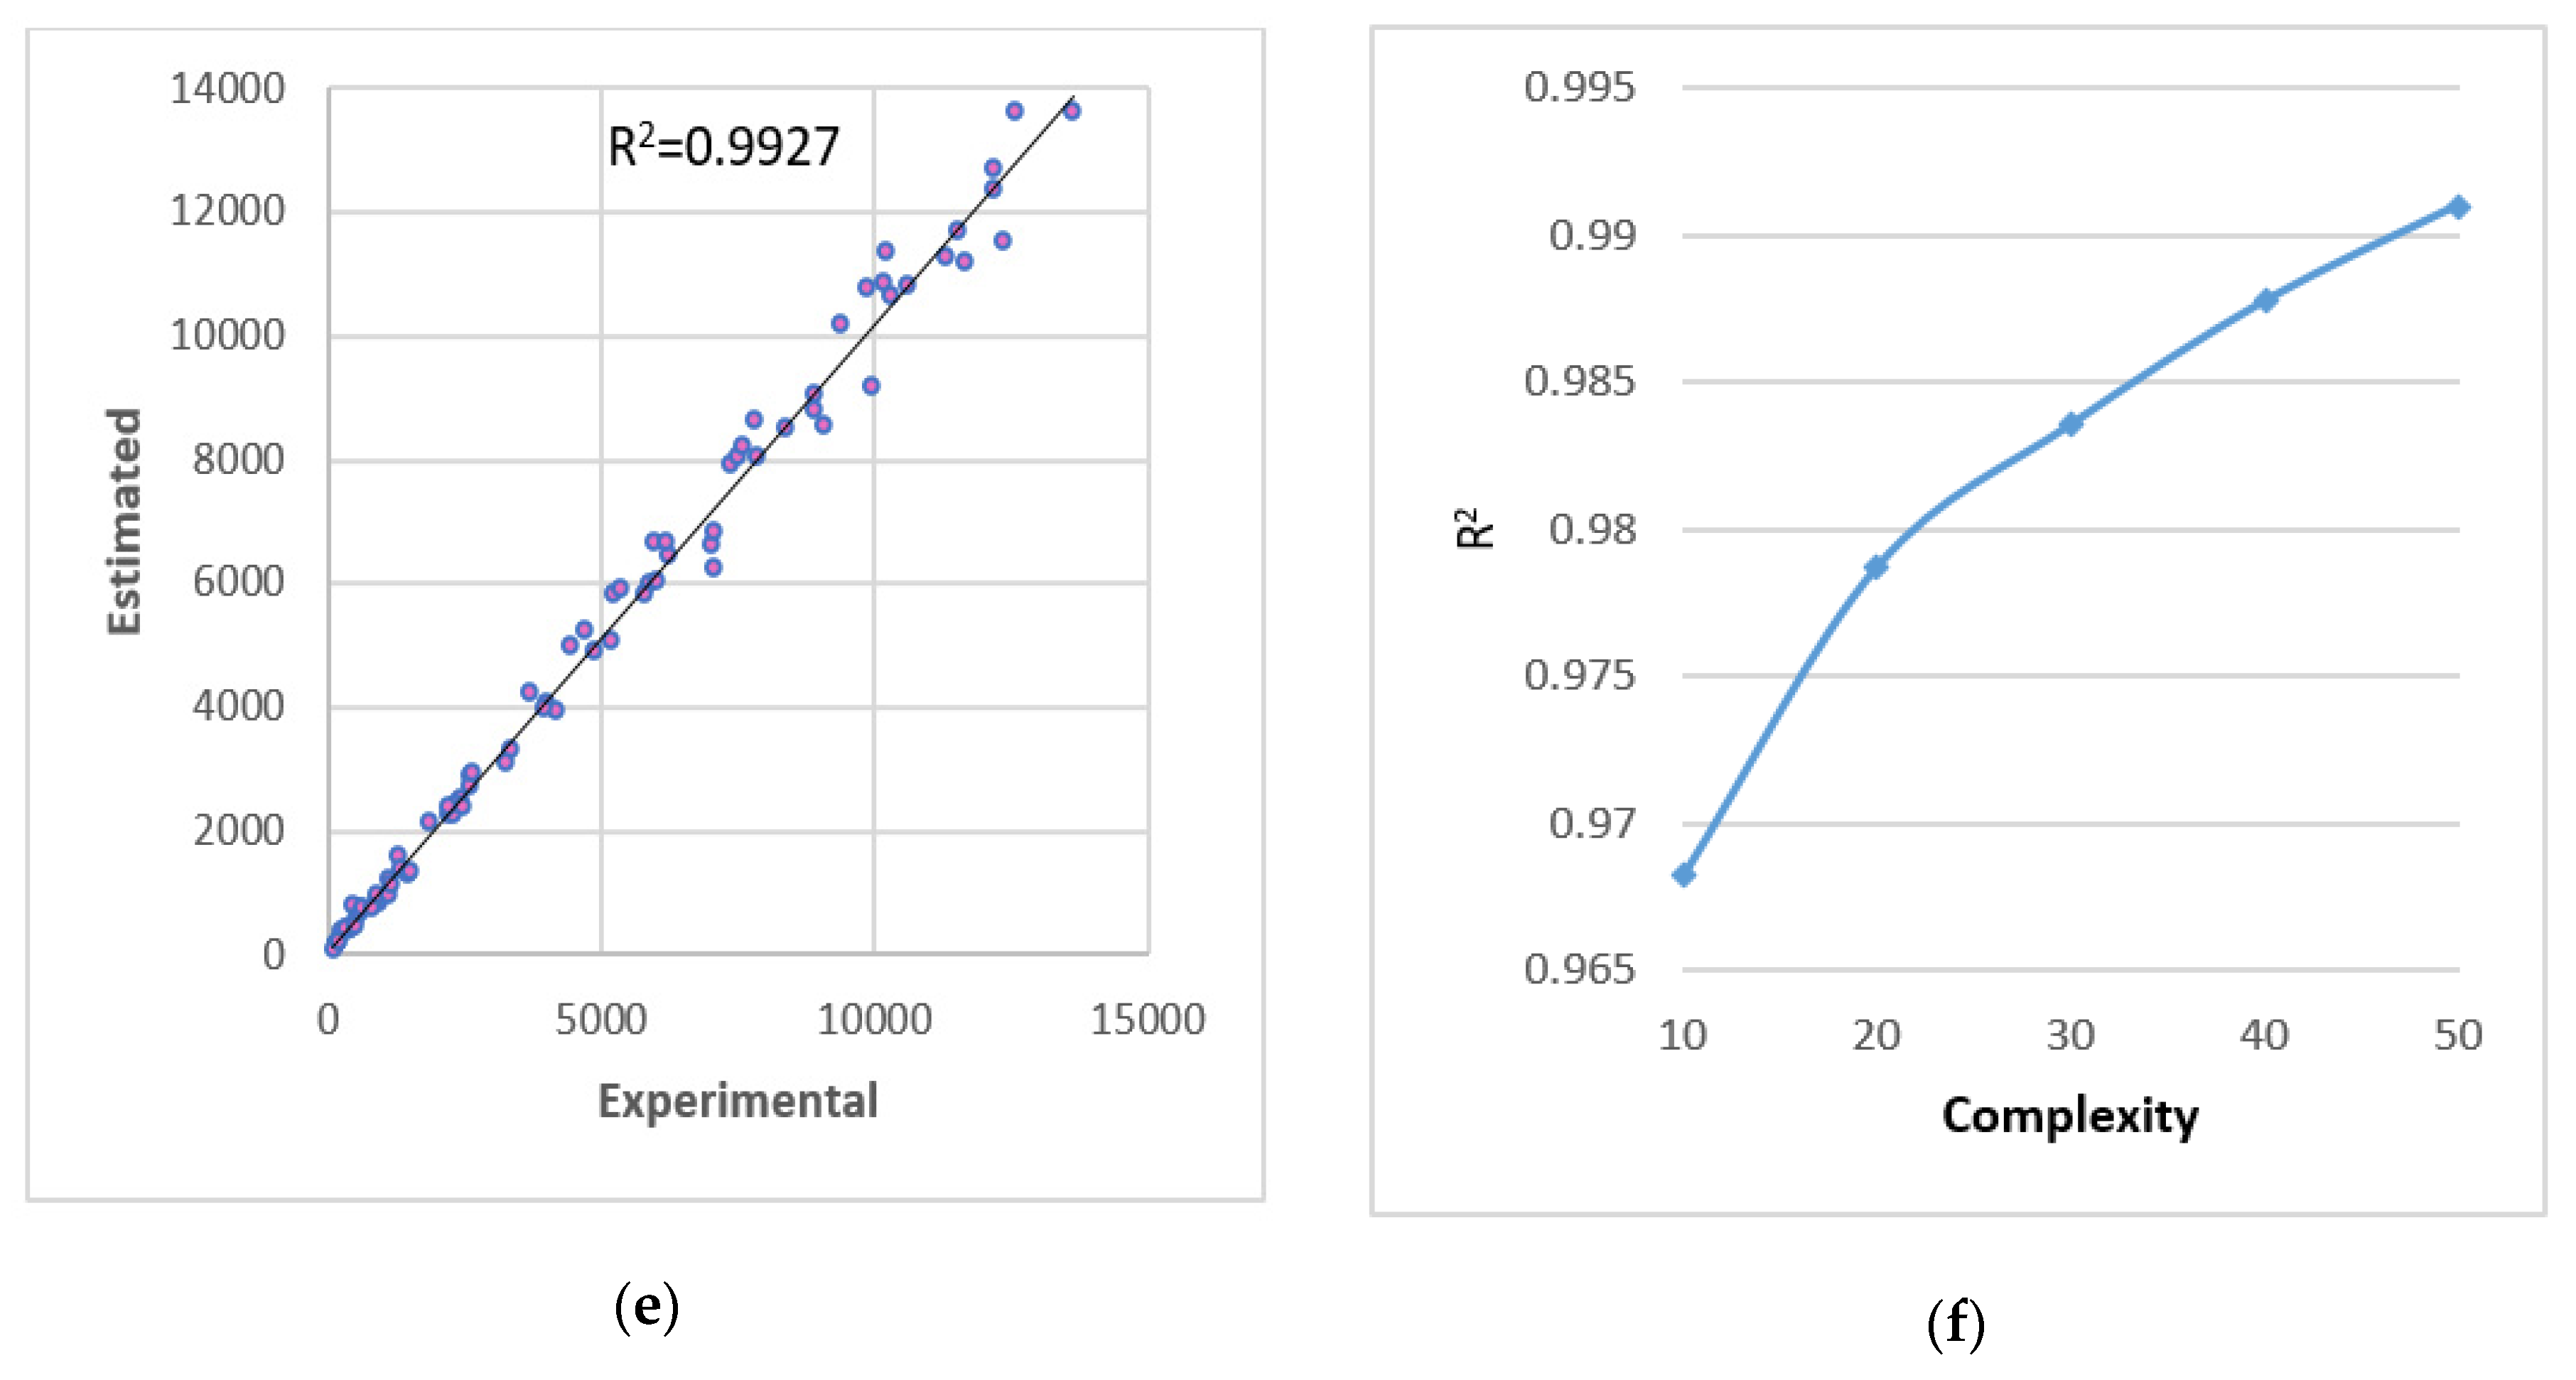
Numerical models have been generated from the methodology developed in [23], which allows obtaining models of representation in Equation (1). The models generated for complexities 10, 20, 30, 40, and 50 present a good fit since they all explain more than 96% of the experimental data (Figure 3). To select the best predictive model, the values of R2 are analyzed and represented in Figure 3.
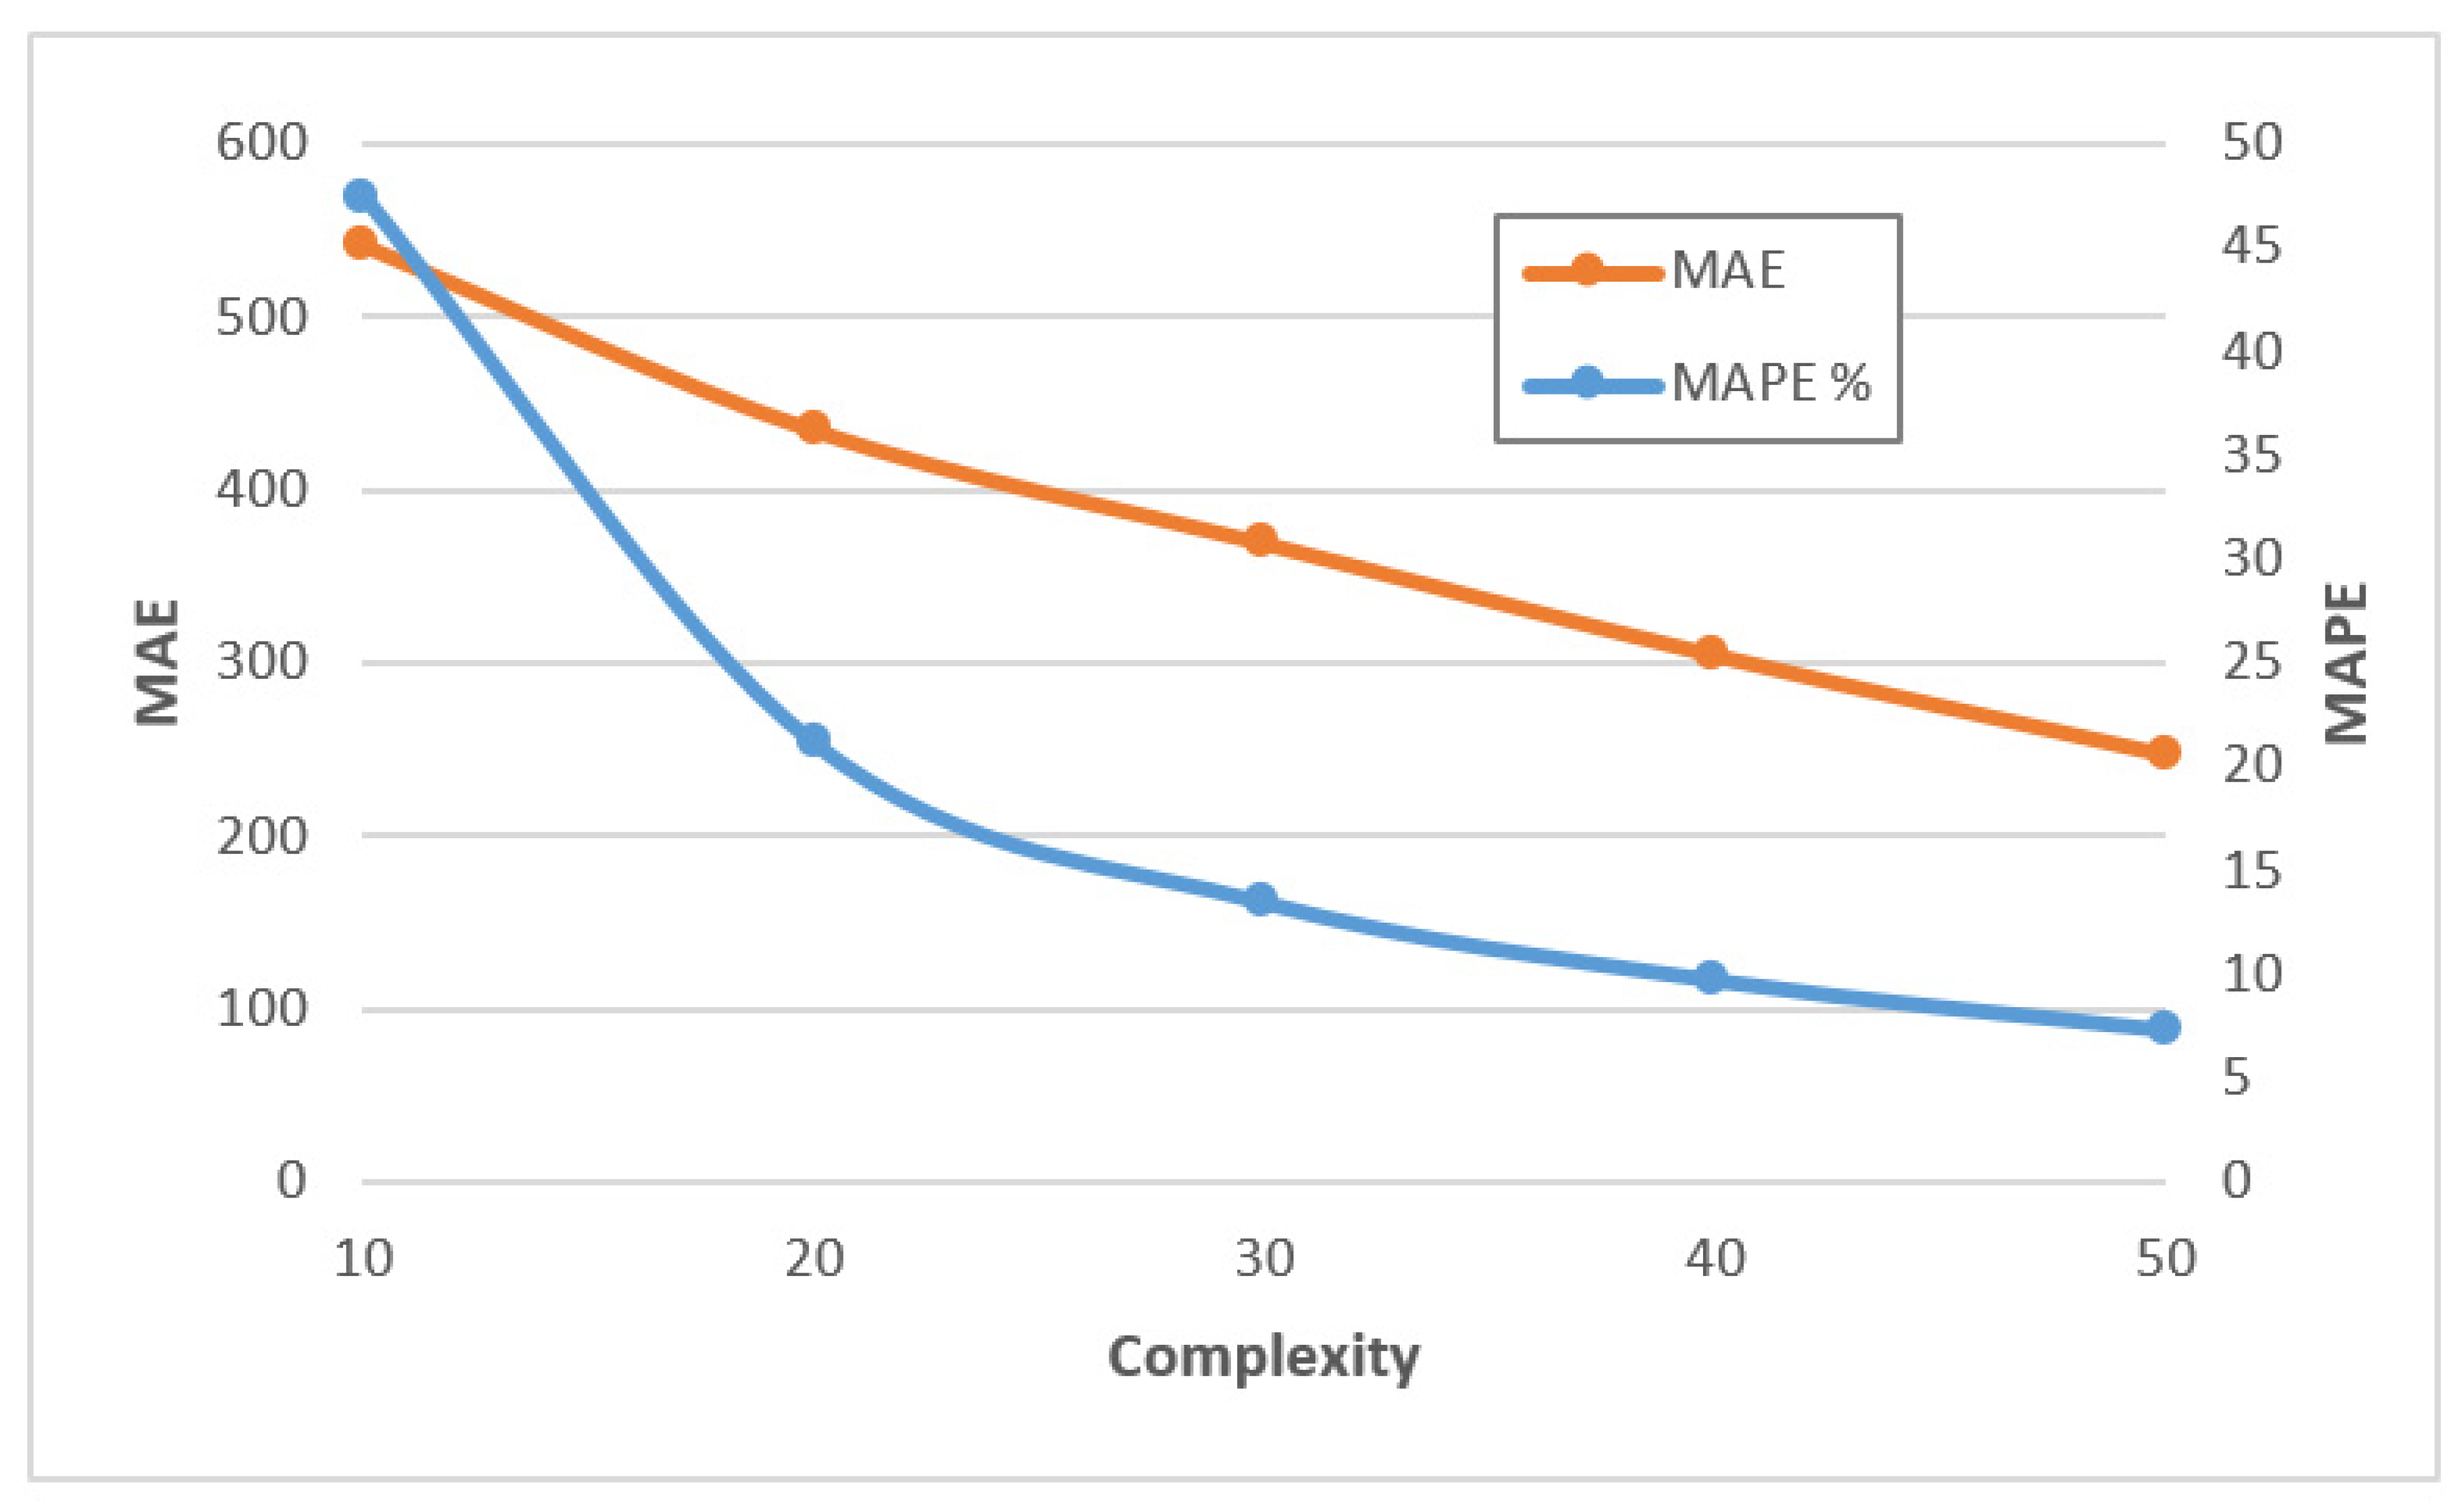
To select a good model, the fit must be considered, as well as the errors. According to the results in Figure 3, the best models in relation to fit are the complexity models 30 or 40. Therefore, the MAE (orange color) and MAPE (blue color) errors for each of the generated models are shown in Figure 4. If we analyze the errors (Figure 4), MAE takes the value 369.078 and 304.383, respectively and the relative errors (MAPE) are of the order 13% and 9.65%.

3.4. Non-Linear Model

The generation of non-linear models is a methodology implemented computationally in software, which is usually included in statistics such as SPSS. In this research, the authors have used the software Gretl [40] to obtain a non-linear model adjusted by least squares. The authors have calculated the parameters of the non-linear model by means of a variant of the Levenberg-Marquardt algorithm, which is carried out by fitting the least squares and using analytical derivatives.
It has been possible to generate a non-linear model that relates dry matter to photosynthetic radiation (PAR). This model has the importance of considering only one explanatory variable. Therefore, it considers a simpler model requiring only one element of weather and climate as a variable: Solar or global radiation that can be easily transformed into DRR, not being necessary to use other agrometeorological elements, which are sometimes not available. The mathematical equation obtained is:
z = 11,600.1 · e 237,465 x 2 + 18.2509 · x 2 ,
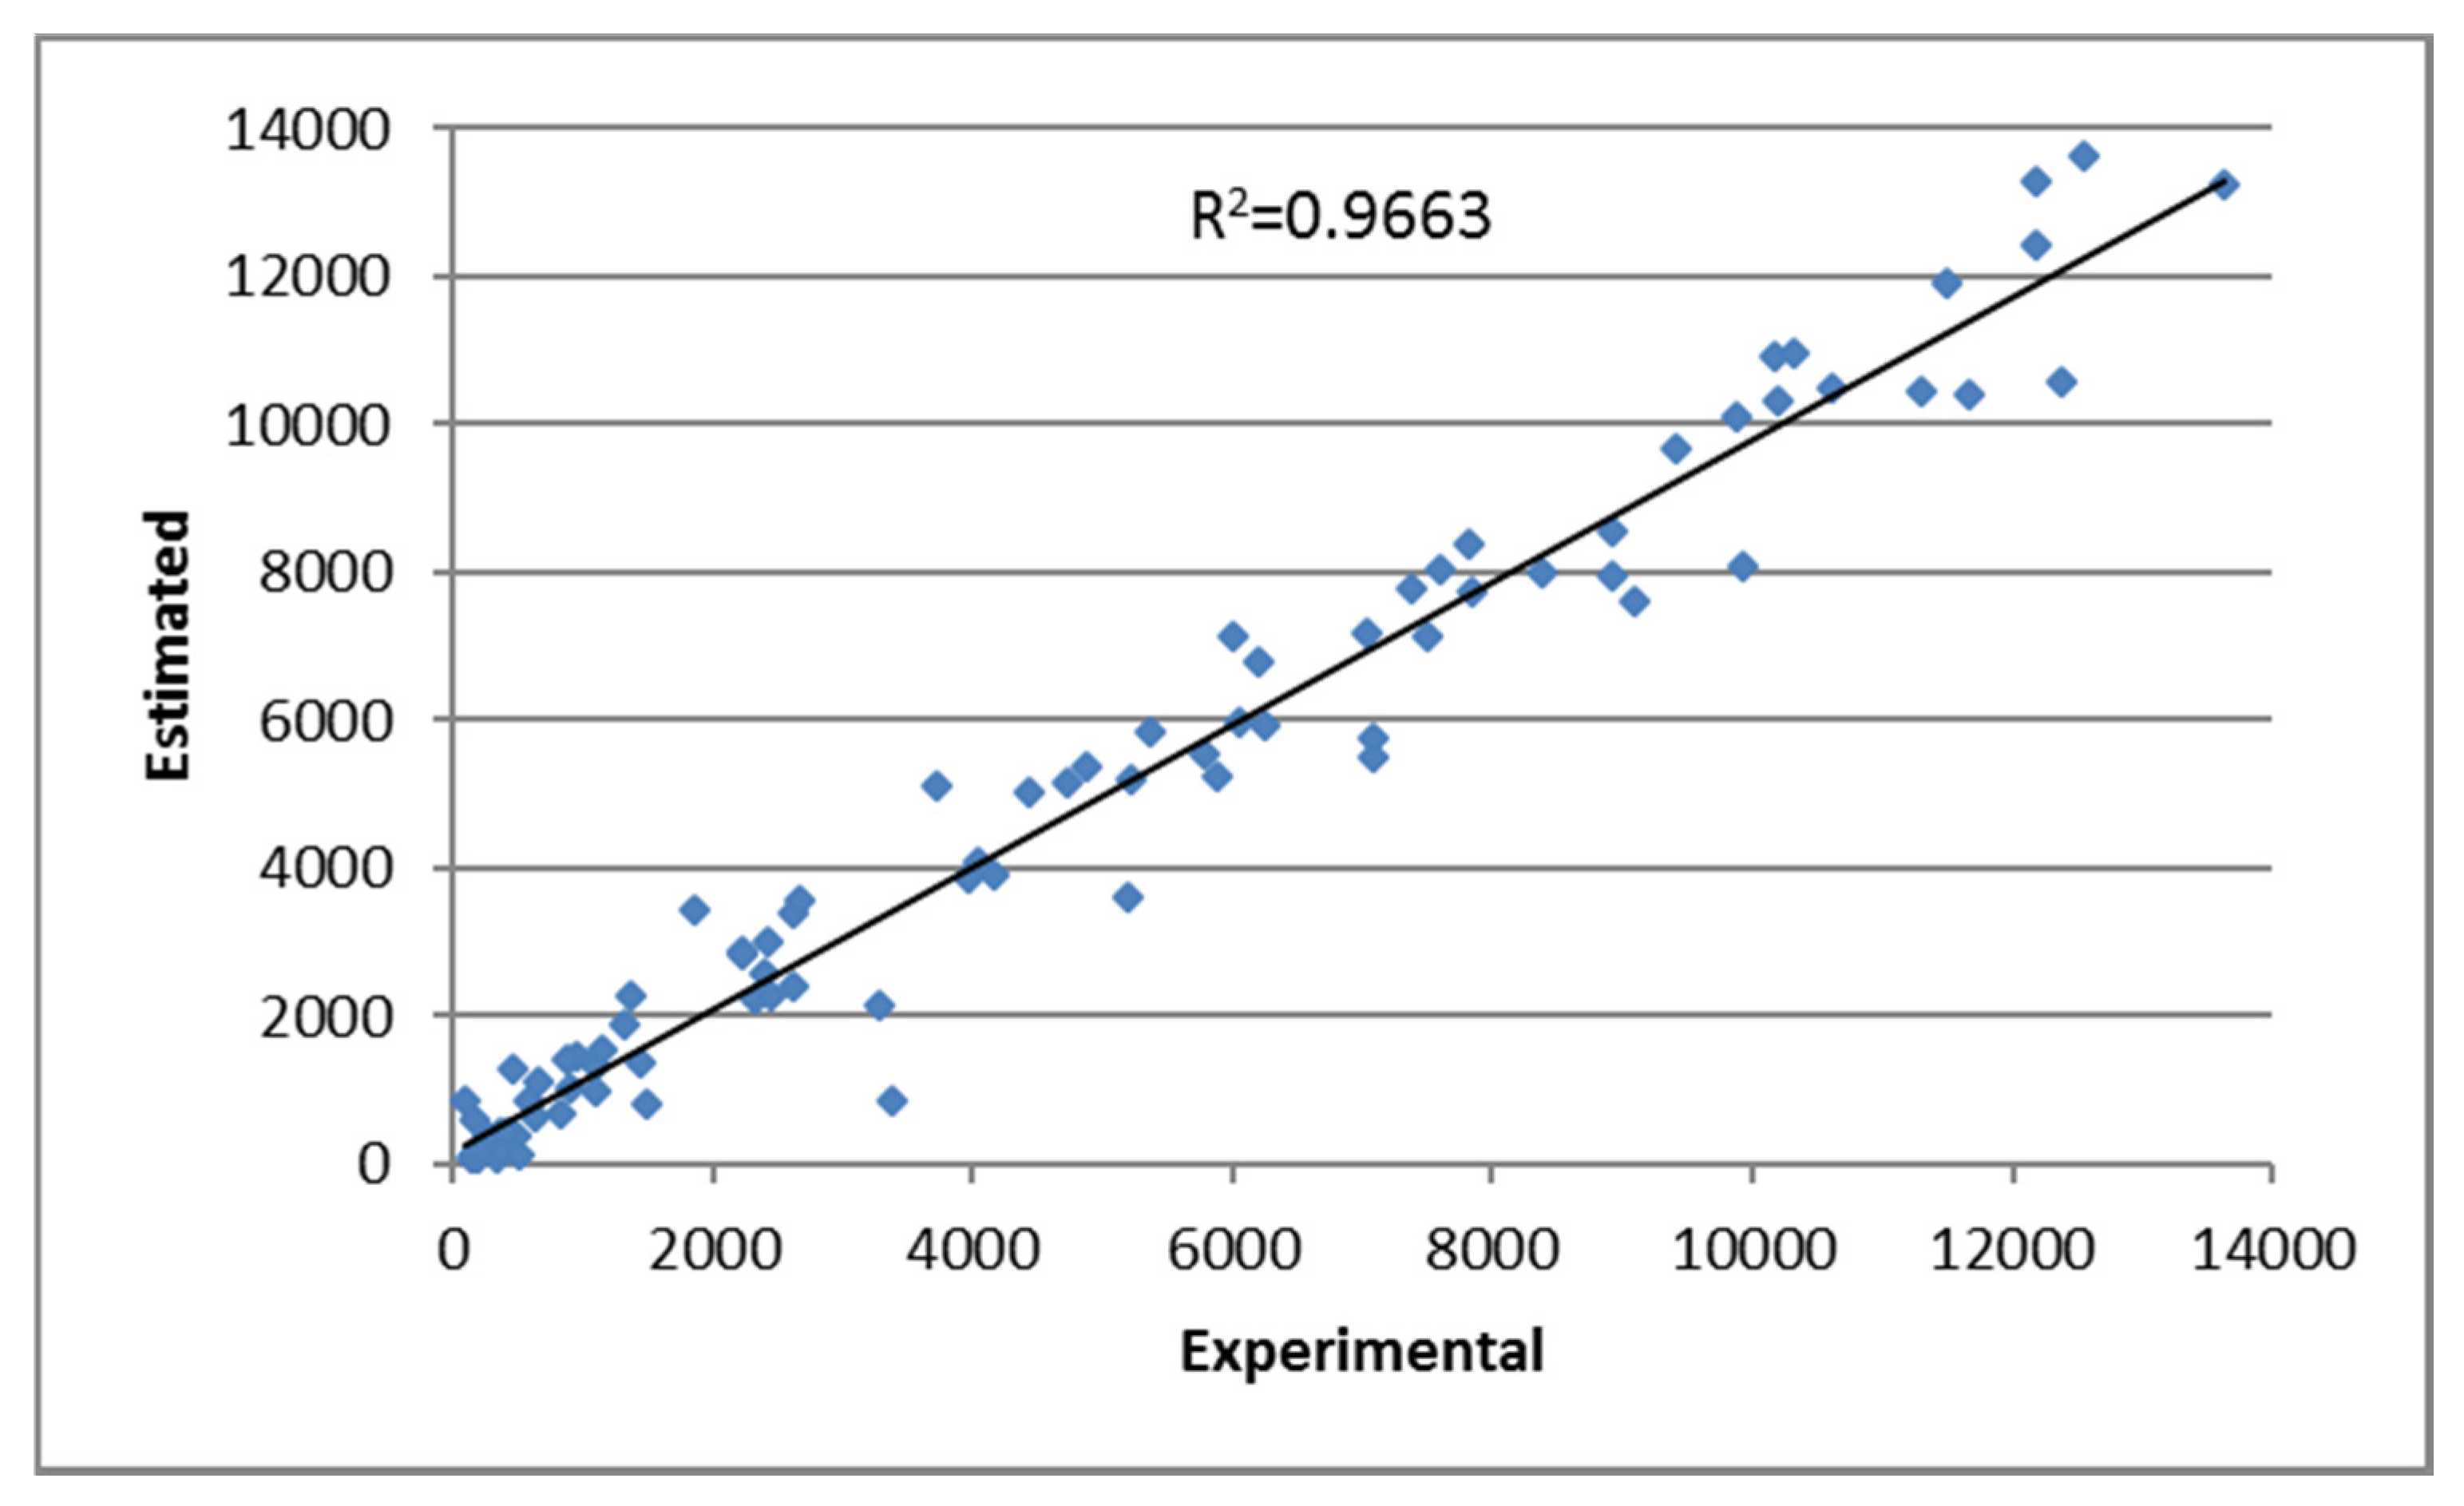
where z represents the total dry matter. This non-linear model has an adjustment of R 2 = 0.9662 . Figure 5 shows the estimated vs. experimental data for the non-linear regression model.
The properties of the parameters defining the model are shown in Table 3, where *** corresponds to a significance for the parameter greater than 0.01.
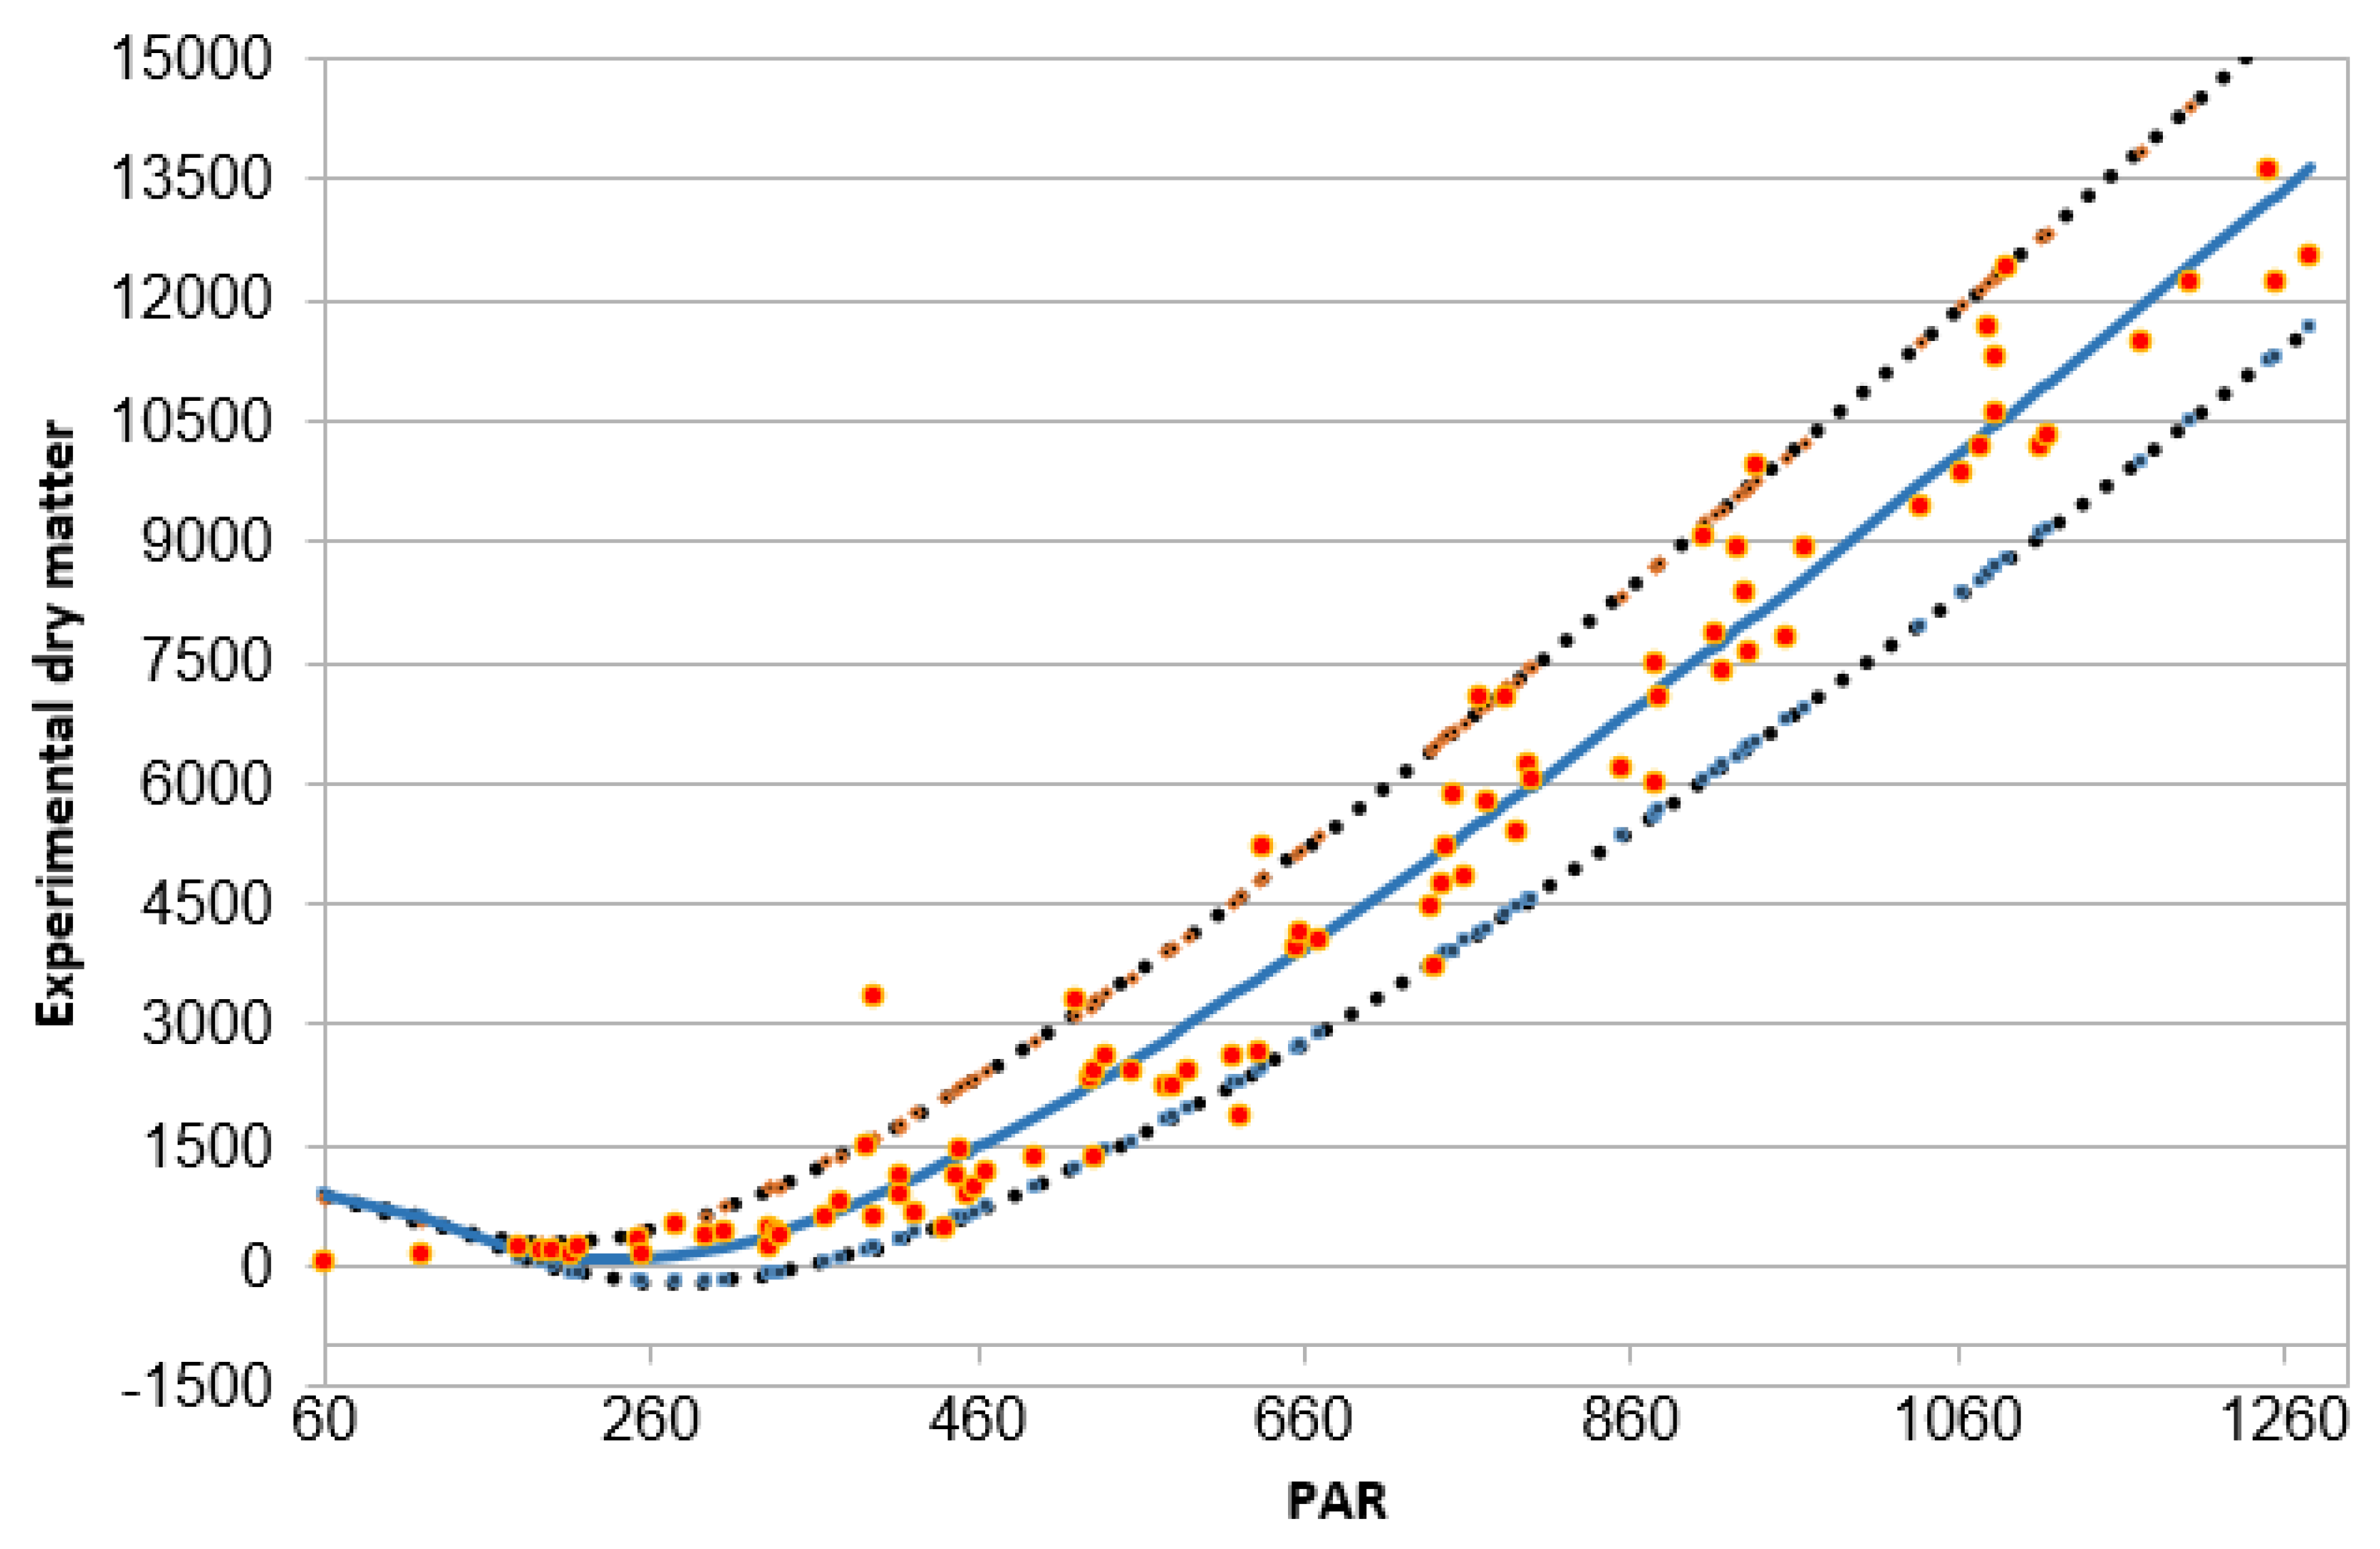
Considering the intervals given by the standard deviations for the different parameters, it is possible to generate two new models, acting as lower and upper models, which are represented in Figure 6.
The quality parameters for the non-linear regression model are: MAE equals 531.58, MAPE is 37.26%, and R2 is 0.9663.

3.5. Stability of the Models

MAE and MAPE values are not the only indicators to select a model. Usually, it is even more important to consider the behaviour of the models with respect to small variations in the independent variables, which is called stability. In this section, a comparative study of the stability of each generated model is presented.
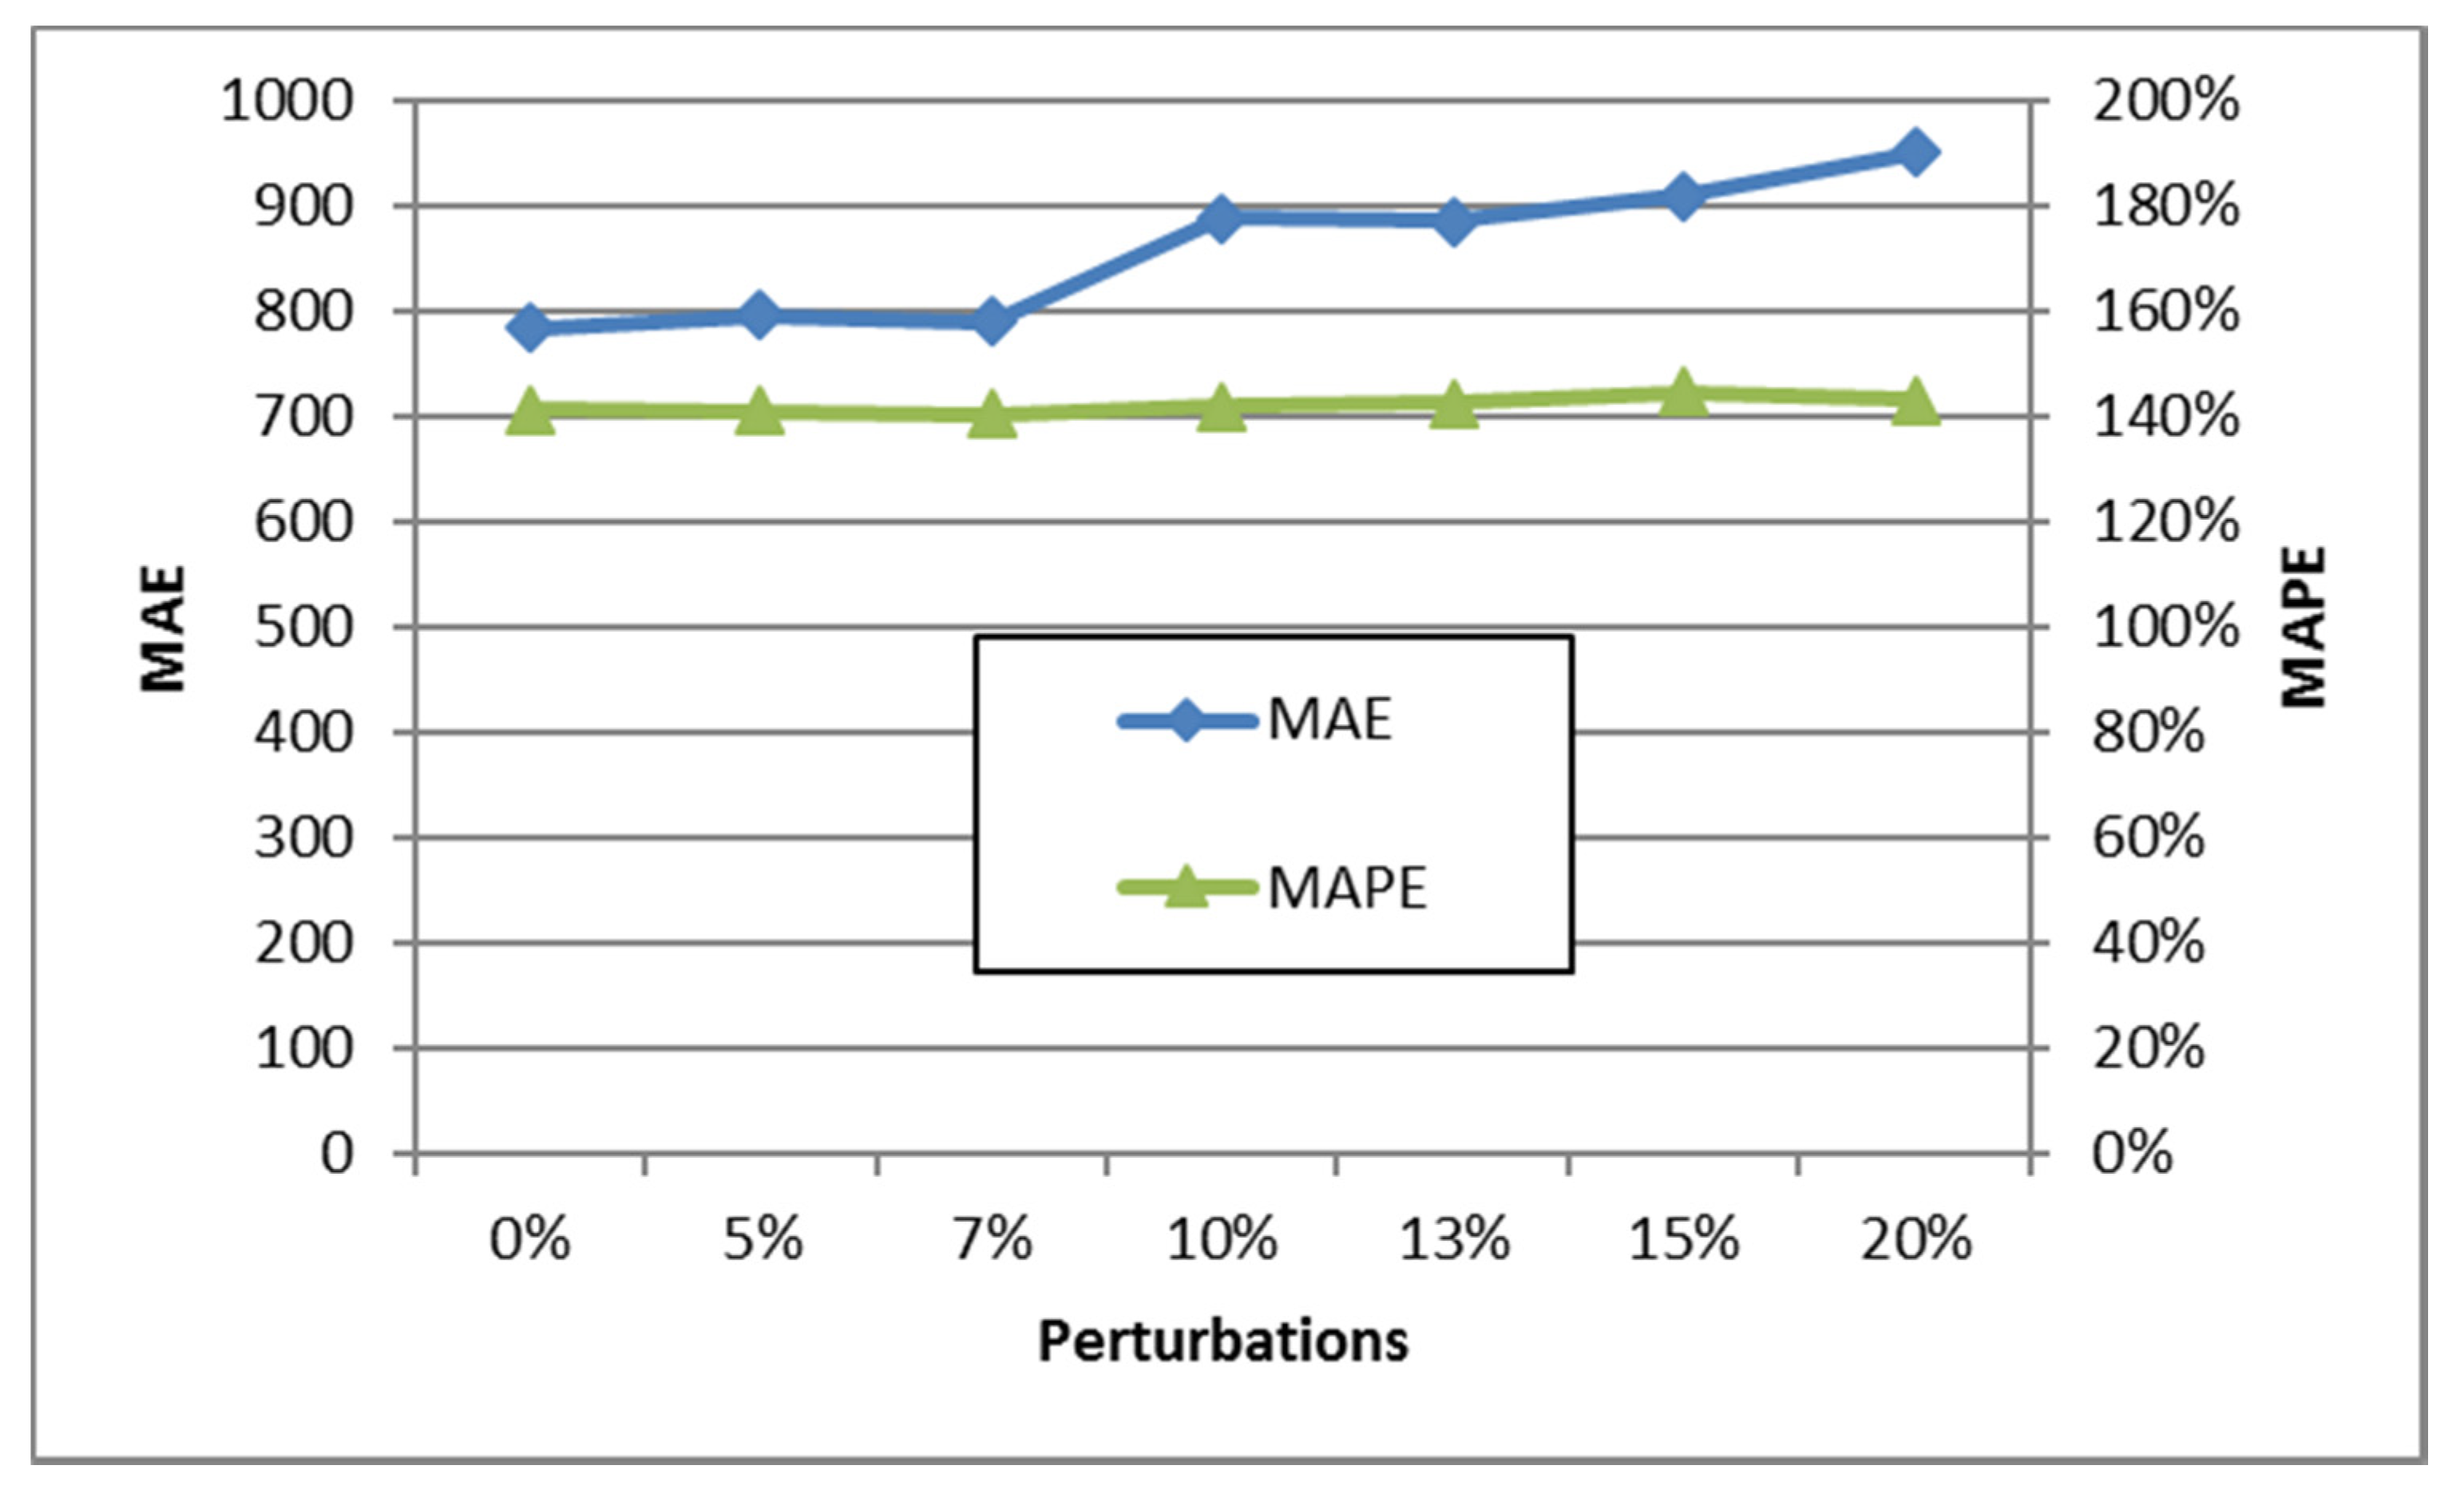
Figure 7 shows the results of the linear regression model when randomly disturbing the experimental data of the explanatory or independent variables. According to these results, we can affirm that this is not a good predictive model since the errors generated when disturbing the explanatory variables are large. Therefore, although it provides a good fit, it is not stable. On the one hand, the model itself generates a very high MAE, as in the case of disturbances, reaching variations in dry matter of more than 800. The relative error, MAPE, is over 139%. Therefore, although linear adjustment is good, it is not a good model since the errors when disturbing the data are very large.
In the case of FEM-based models, to analyze the predictive stability of the two selected models, random perturbations such as those carried out in the linear model are performed. These results are shown for complexities 30 and 40 in Figure 8. From the results presented in Figure 8, it can be deduced that although both models are good predictive models, complexity model 30 is a more stable model in its prediction for perturbations in the experimental data of up to 13%.
Figure 9 shows the corresponding results for the non-linear regression model. According to the results presented, we can affirm that the non-linear model is a model which presents a good predictive stability when performing perturbations up to 20%. In addition, it is a model including only one explanatory variable, which reduces the collection of necessary agrometeorological data not usually available.

3.6. Model Validation

When generating models, their usefulness is of vital importance beyond the correct prediction of the values used to generate the model itself. Models in which there is good behaviour for the data where the model itself is calculated, but the same is not true for other points, are called overfitted models. Overfitting is one of the main problems, which can arise when using modelling or machine learning techniques. This is the reason it is crucial to identify it, in order to rule out models that may present it.
One way of checking the existence of overfitting is the validation of the model, in which estimates are calculated on experimental points different from those included in the model and from which the experimental value of the variable determined is known.
In this case, the number of points available to build the model is less than in other examples. However, one should not give up trying to study a system of interest since the quality and significance of the model does not depend only on the number of data, but also on its quality and the characteristics of the model used.
To assess the behaviour of the models used, a data set of a size equivalent to 10% of those available for generating the model and corresponding to 2019 will be used. As an additional feature, the validation data are distributed over the entire domain of the dependent variable “dry matter”.
The results for the different models can be seen in Figure 10, which shows the estimated vs. the experimental values for the multilinear regression, the complexity finite element models 30 and 40, and the non-linear regression model.
The behaviour of the best models are shown in Figure 11, representing the absolute and relative errors as a function of the experimental values.

4. Discussion

The value for the quality parameters for the different models are shown in Table 4:
Of the predictive models which analyze dry matter, it should be noted that all show a good fit, calculated from the R2. However, finite element models and non-linear regression have the best values when MAE and MAPE are also considered. It should also be noted that most of the contribution to the MAE and MAPE values, in the case of the non-linear regression, is given by the lower values of the dependent variable.
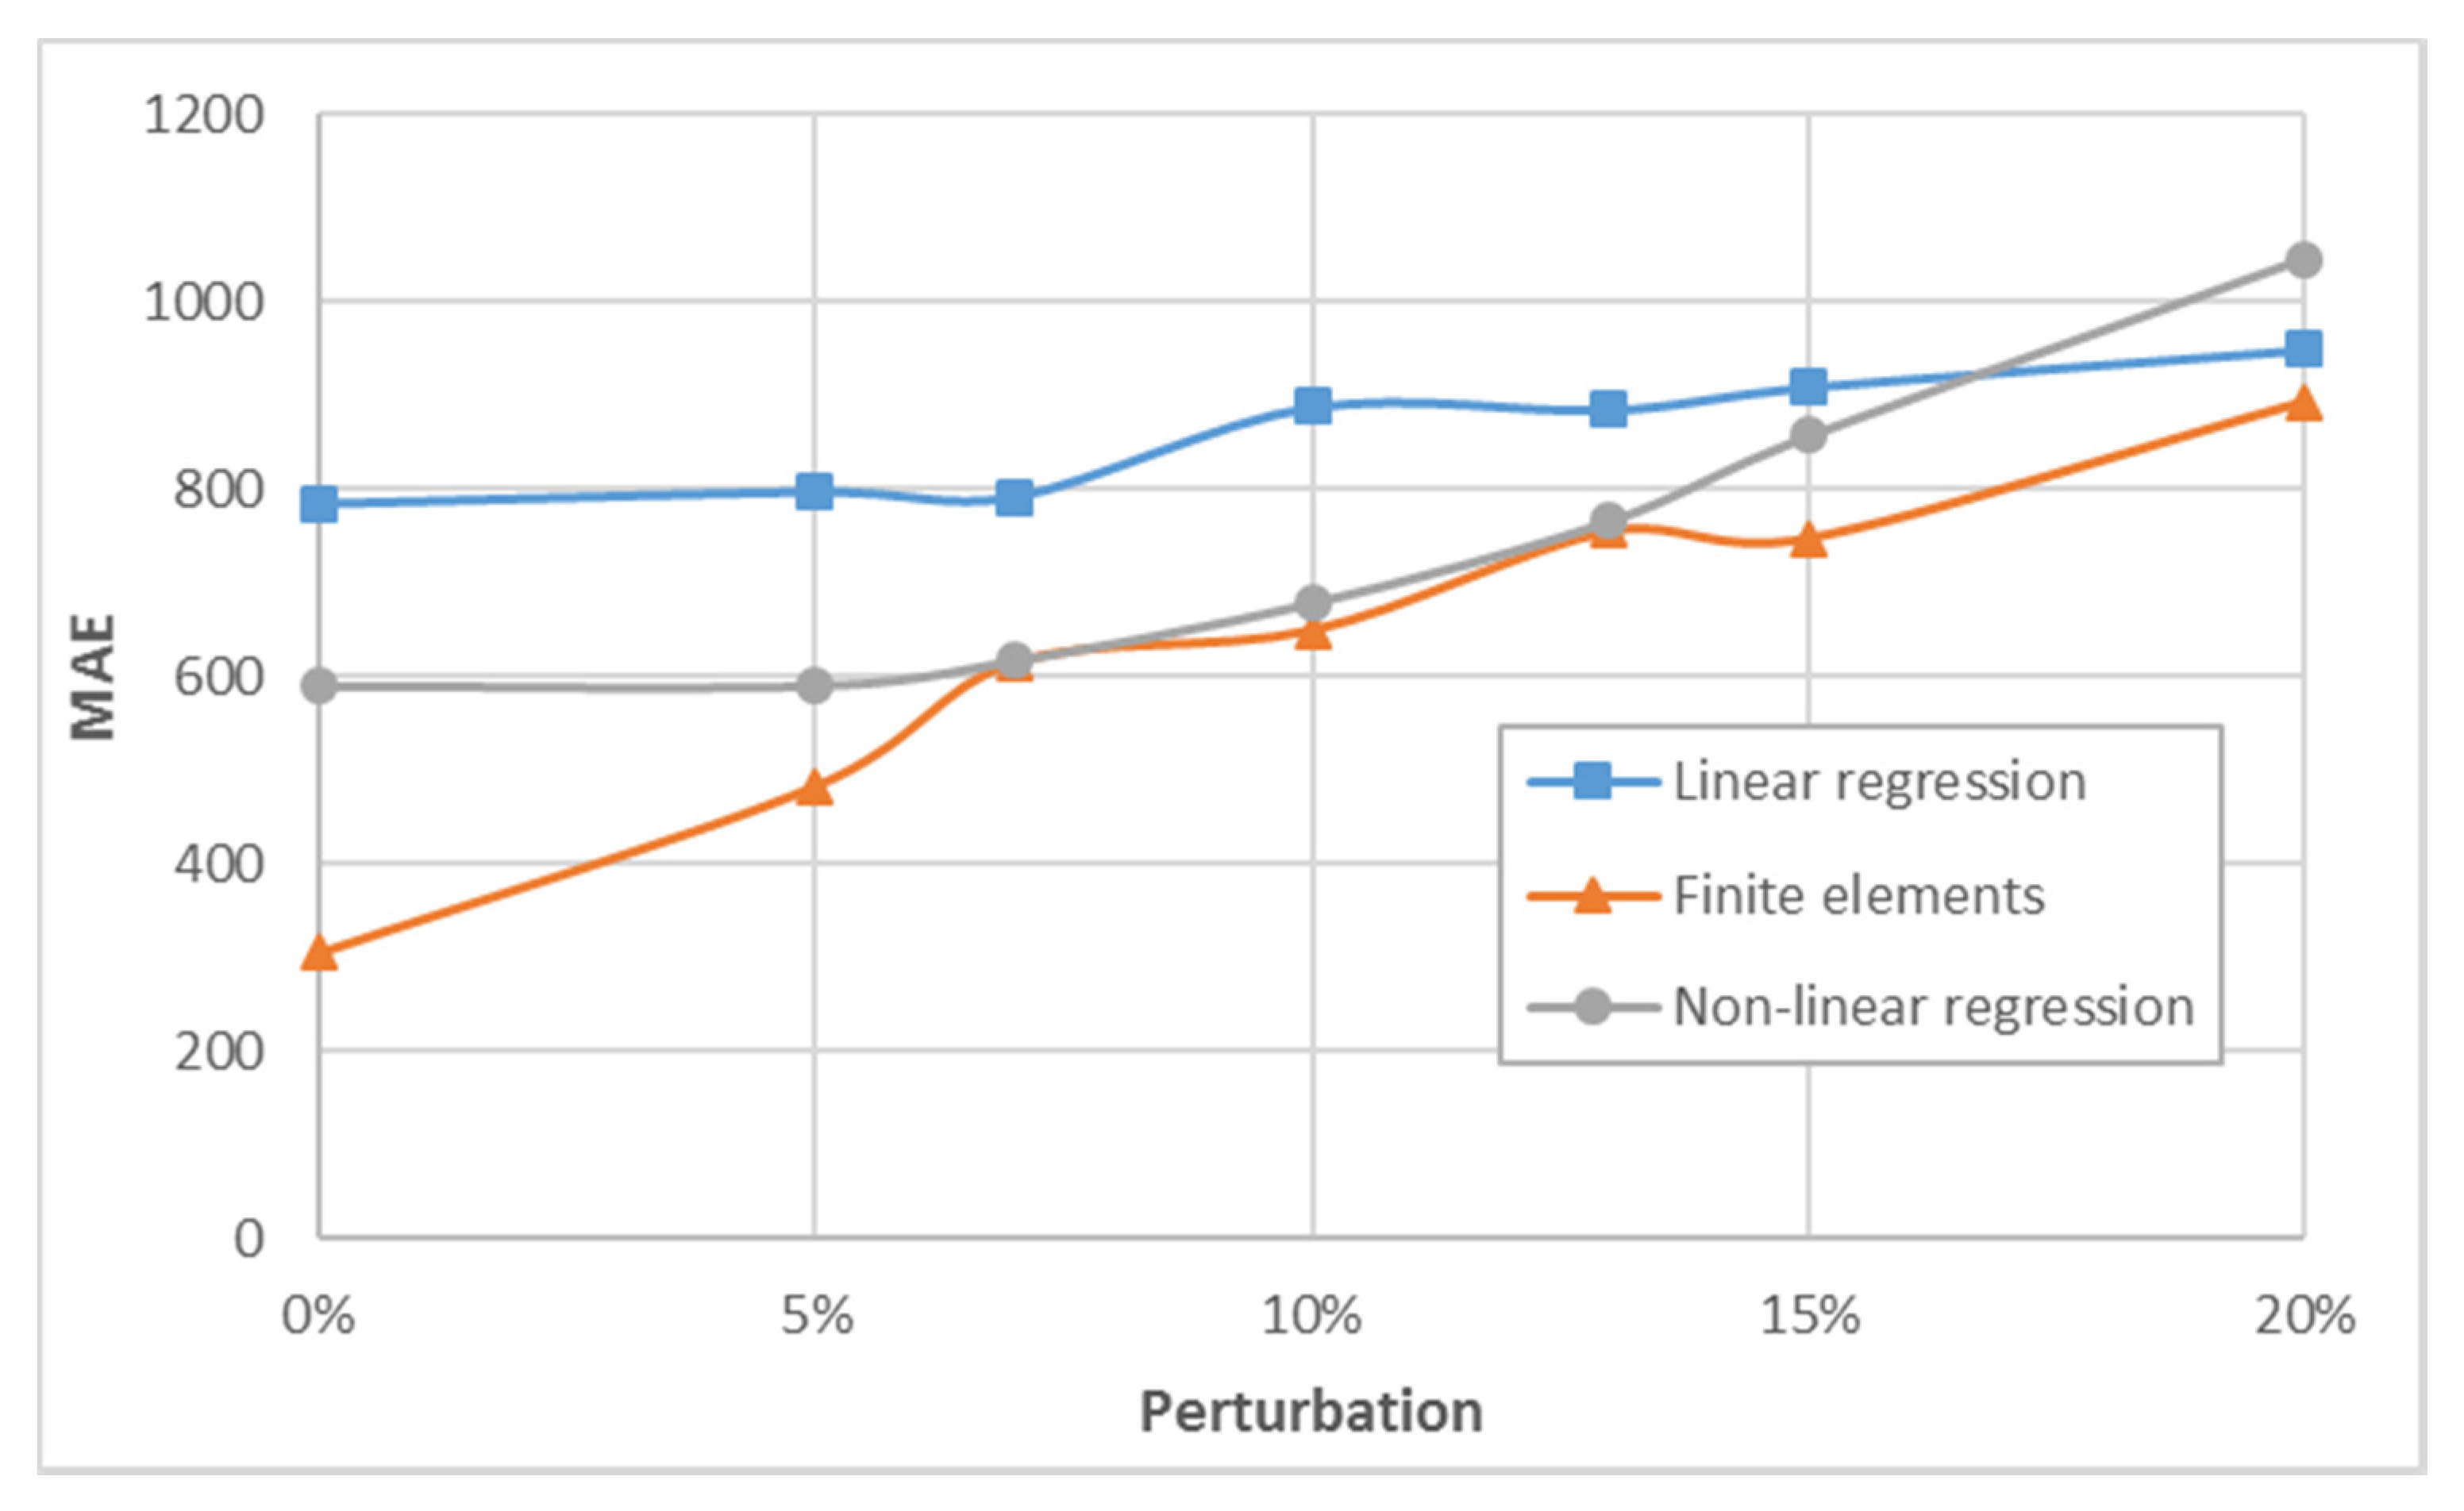
When analyzing the stability of the models against random disturbances in the experimental data, there are important differences between the linear model, the numerical finite element model, and the non-linear model. Figure 12 shows the errors in absolute value for the numerical finite element and the non-linear models if we disturb up to 20% of the data, which have a very similar behaviour.
The mean of the relative errors, MAPE, is shown in Figure 13, where the non-linear model, against random disturbances of up to 20%, is the one with the least variation.
The last criterion when selecting a model is the result of the validation process. In general, the finite element models present a better behaviour, although in general, the result of the non-linear regression is only slightly lower, especially for the higher values of the dependent variable.
As in other investigations in faba bean [5,6,7], it is shown that the production of dry matter is regulated by its ability to capture solar radiation, as well as the effect that temperature (thermal sums) and the photoperiod have on the development of this legume.
Although other mechanistic models obtain good results of biomass production [13], the finite element model constitutes a valuable tool to predict the biomass for the agroclimatic conditions of Azul, center of Buenos Aires province, Argentina, without the need for calibration nor obtaining ecophysiological parameters [7] for the northern hemisphere.

5. Conclusions

The level of potential productivity of the haba cv. Alameda is determined by its genetic characteristics and adaptation to the environment. It depends on the energy available in the environment (solar), associated with other climate variables such as temperatures and photoperiods. From the three types of models generated, the linear model is not a good model, since it is not a good predictive model when carrying out perturbations in the explanatory variables. It also has higher MAE and MAPE values. The numerical model is a model which has a good fit and the variations produced in the errors when disturbing the data are not large. It could be used to analyze the biomass production in case of having agrometeorological stations that record radiation and temperature data. If we want to determine the evolution of dry matter with the least number of explanatory variables, the non-linear model would be the most convenient. The equation proposed explains the experimental data well and is a very stable model against disturbances in the explanatory variables. The production of biomass begins with the photosynthetic process or bioconversion of energy from the sun. Therefore, this model would be very useful to predict the potential productivity of the Alameda bean grown in the agroclimatic environment of the center of Buenos Aires province.

Author Contributions

Conceptualization, Y.V.; F.J.N.-G.; G.H.; J.L. and A.C.; methodology, Y.V.; F.J.N.-G.; and A.C.; software, F.J.N.-G.; validation, Y.V. and F.J.N.-G.; formal analysis, F.J.N.-G., G.H.; J.L. and A.C.; investigation, F.J.N.-G., Y.V., G.H.; J.L. and A.C.; data curation, G.H.; J.L. and A.C.; writing—original draft preparation, F.J.N.-G., Y.V. and A.C.; writing—review and editing, Y.V.; F.J.N.-G. and A.C.; supervision, Y.V.; project administration, Y.V. All authors have read and agreed to the published version of the manuscript.

Funding

This research received no external funding.

Conflicts of Interest

The authors declare no conflict of interest.

References

  1. Food and Agriculture Organization of the United Nations (FAO). Available online: http://www.fao.org (accessed on 1 April 2020).
  2. Rubiales, D.; Mikić, A. Introduction: Legumes in Sustainable Agriculture. Crit. Rev. Plant Sci. 2015, 34, 2–3. [Google Scholar] [CrossRef] [Green Version]
  3. Confalone, A.; Navarro, M.; Vilatte, C.; Barufaldi, M.; Aguas, L.; Ponce, G. Crecimiento, captura de luz y componentes del rendimiento del haba cv. Alameda creciendo en Azul, provincia de Buenos Aires. Rev. Fca Uncuyo 2013, 45, 105–116, ISSN 0370-4661. [Google Scholar]
  4. Redden, R.; Zong, X.; Norton, R.M.; Stoddard, F.L.; Maalouf, F.; Ahmed, S.; Ling, L. Efficient and sustainable production of faba bean. In Achieving Sustainable Cultivation of Grain Legumes: Vol. 2: Improving Cultivation of Particular Grain Legumes; Burleigh and Dodds Science Publishing: Cambridge, UK, 2018; pp. 269–296. [Google Scholar]
  5. Sau, F.; Mínguez, M.I. Adaptation of indeterminate faba beans to weather and management under a Mediterranean climate. Field Crop Res. 2000, 66, 81–99. [Google Scholar] [CrossRef]
  6. Aschi, A.; Aubert, M.; Riah-Anglet, W.; Nélieu, S.; Dubois, C.; Akpa-Vinceslas, M.; Trinsoutrot-Gattin, I. Introduction of Faba bean in crop rotation: Impacts on soil chemical and biological characteristics. Appl. Soil Ecol. 2017, 120, 219–228. [Google Scholar] [CrossRef]
  7. Confalone, A.; Lizaso, J.; Ruíz-Nogueira, B.; López-Cedrón, F.; Sau, F. Growth, PAR use efficiency, and yield components of field grown Vicia faba L. under various temperature and photoperiod regimes. Field Crop Res. Elsevier 2010, 115, 140–148. [Google Scholar] [CrossRef]
  8. Summerfield, R.J.; Roberts, E.H.; Ellis, R.H.; Lawn, R.J. Towards the reliable prediction of time to flowering in six annual crops. I. The development of simple models for fluctuating field environments. Exp. Agric. Camb. 1991, 27, 11–31. [Google Scholar] [CrossRef]
  9. Marcelis, L.F.; Heuvelink, E.; Goudriaan, J. Modelling biomass production and yield of horticultural crops: A review. Sci. Hortic. 1998, 74, 83–111. [Google Scholar] [CrossRef]
  10. Ajam, N.H.; Soltani, A.; Majidi, H.E.; Homaei, M. Modelling Response of Emergence to Temperature in Faba Bean under Field Condition. 2007. Available online: https://www.sid.ir/en/Journal/ViewPaper.aspx?ID=103632 (accessed on 1 April 2020).
  11. Daur, I.; Sepetoğlu, H.; Sindel, B. Dynamics of faba bean growth and nutrient uptake and their correlation with grain yield. J. Plant Nutr. 2011, 34, 1360–1371. [Google Scholar] [CrossRef]
  12. Manschadi, A.M.; Sauerborn, J.; Stutzel, H.; Gobel, W.; Saxena, M.C. Simulation of faba bean (Vicia faba L.) growth and development under Mediterranean conditions: Model adaptation and evaluation. Eur. J. Agron. 1998, 9, 273–293. [Google Scholar] [CrossRef]
  13. Boote, K.; Mínguez, I.; Sau, F. Adapting the CROPGRO legume model to simulate growth of faba vean. Agron. J. 2002, 94, 743–756. [Google Scholar] [CrossRef]
  14. Hoogenboom, G.; Porter, C.H.; Shelia, V.; Boote, K.J.; Singh, U.; White, J.W.; Hunt, L.A.; Ogoshi, R.; Lizaso, J.I.; Koo, J.; et al. Decision Support System for Agrotechnology Transfer (DSSAT); Version 4.7.5; DSSAT Foundation: Gainesville, FL, USA, 2019. [Google Scholar]
  15. Ruiz-Ramos, M.; Mínguez, I. ALAMEDA, a structural–Functional model for Faba Bean Crops: Morphological parameterization and verification. Ann. Bot. 2006, 97, 377–388. [Google Scholar] [CrossRef] [Green Version]
  16. Monteith, J.L. Principles of resource capture by crop stands. In Resource Capture by Crops; Monteith, J.L., Scott, R.K., Unsworth, M.H., Eds.; Nottingham University Press: Nottingham, UK, 1994; pp. 1–15. [Google Scholar]
  17. Monsi, M.; Saeki, T. The light factor in plant communities and its significance for dry matter production. Jpn. J. Bot. 1953, 14, 22–52. [Google Scholar]
  18. Sinclair, R.T.; Muchow, R.C. Radiation Use Efficiency. Advances in Agronomic 65; Academic Press: Cambridge, MA, USA, 1999. [Google Scholar]
  19. Confalone, A.; Boote, J.; Lizaso Sau, F. Temperature and Photoperiod Effects on Vicia faba Phenology Simulated by CROPGRO-Fababean. Agron. J. Elsevier 2011, 103, 1036–1050, ISSN 0002-1962. [Google Scholar] [CrossRef]
  20. Johnson, R.A.; Wichern, D.W. Applied multivariate statistical analysis. Statistics 2015, 6215, 10. [Google Scholar]
  21. Archontoulis, S.V.; Miguez, F.E. Nonlinear regression models and applications in agricultural research. Agron. J. 2015, 107, 786–798. [Google Scholar] [CrossRef] [Green Version]
  22. Markovsky, I.; Van Huffel, S. Overview of total least-squares methods. Signal Process. 2007, 87, 2283–2302. [Google Scholar] [CrossRef] [Green Version]
  23. Lourakis, M.I. A brief description of the Levenberg-Marquardt algorithm implemented by levmar. Found. Res. Technol. 2005, 4, 1–6. [Google Scholar]
  24. Cornejo Zúñiga, O.; Rebolledo Vega, R. Estimación de parámetros en modelos no lineales: Algoritmos y aplicaciones. Rev. EIA 2016, 25, 81–98. [Google Scholar] [CrossRef]
  25. Ranganathan, A. The levenberg-marquardt algorithm. Tutoral Lm Algorithm 2004, 11, 101–110. [Google Scholar]
  26. Transtrum, M.K.; Sethna, J.P. Improvements to the Levenberg-Marquardt algorithm for nonlinear least-squares minimization. arXiv 2012, arXiv:1201.5885. [Google Scholar]
  27. Aragonés, L.; Pagán, J.I.; López, I.; Navarro-González, F.J.; Villacampa, Y. Galerkin’s formulation of the finite elements method to obtain the depth of closure. Sci. Total Environ. 2019, 660, 1256–1263. [Google Scholar] [CrossRef] [PubMed]
  28. Palazón, A.; López, I.; Aragonés, L.; Villacampa, Y.; Navarro-González, F.J. Modelling of Escherichia coli concentrations in bathing water at microtidal coasts. Sci. Total Environ. 2017, 593, 173–181. [Google Scholar] [CrossRef] [PubMed] [Green Version]
  29. Aragonés, L.; López, I.; Villacampa, Y.; Navarro-González, F.J. Using the presence of seagrass Posidonia oceanica to model the equilibrium profile parameter A of sandy beaches in Spain. J. Coast. Res. 2017, 33, 1074–1085. [Google Scholar] [CrossRef]
  30. Aragonés, L.; Villacampa, Y.; Navarro-González, F.J.; López, I. Numerical modelling of the equilibrium profile in Valencia (Spain). Ocean Eng. 2016, 123, 164–173. [Google Scholar] [CrossRef]
  31. Navarro-González, F.J.; Villacampa, Y. A finite element numerical algorithm for modelling and data fitting in complex systems. Int. J. Comput. Methods Exp. Meas. 2016, 4, 100–113. [Google Scholar] [CrossRef] [Green Version]
  32. Navarro-Gonzalez, F.J.; Villacampa, Y. An Octahedric Regression Model of EnergyEfficiency on Residential Buildings. Appl. Sci. 2019, 9, 4978. [Google Scholar] [CrossRef] [Green Version]
  33. SSS-USDA 2014 Soil Survey Staff. Keys to Soil Taxonomy, 12th ed.; USDA-Natural Resources Conservation Service: Washington, DC, USA, 2014. [Google Scholar]
  34. Allen, R.G.; Pereira, L.S.; Raes, D.; Smith, M. Crop Evapotranspiration-Guidelines for Computing Crop Water Requirements—FAO Irrigation and Drainage Paper 56; FAO: Rome, Italy, 1998; Volume 300, p. D05109. [Google Scholar]
  35. List, R.J. Smithsonian Meteorological Tables; Smithsonian Institution: Washington, DC, USA, 1971. [Google Scholar]
  36. Szeicz, G. Solar radiation for plant growth. J. Appl. Ecol. 1974, 2, 617–636. [Google Scholar] [CrossRef]
  37. Fahrmeir, L.; Kneib, T.; Lang, S.; Marx, B. Regression models. In Regression; Springer: Berlin/Heidelberg, Germany, 2013; pp. 21–72. [Google Scholar]
  38. Tranmer, M.; Elliot, M. Multiple linear regression. Cathie Marsh Cent. Census Surv. Res. CCSR 2008, 5, 30–35. [Google Scholar]
  39. Spss12.0. Guide to Statistics; Mathsoft, Inc.: Cambridge, MA, USA, 2003. [Google Scholar]
  40. Mixon, J. GRETL: An econometrics package for teaching and research. Manag. Financ. 2010, 36, 71–81. [Google Scholar] [CrossRef]
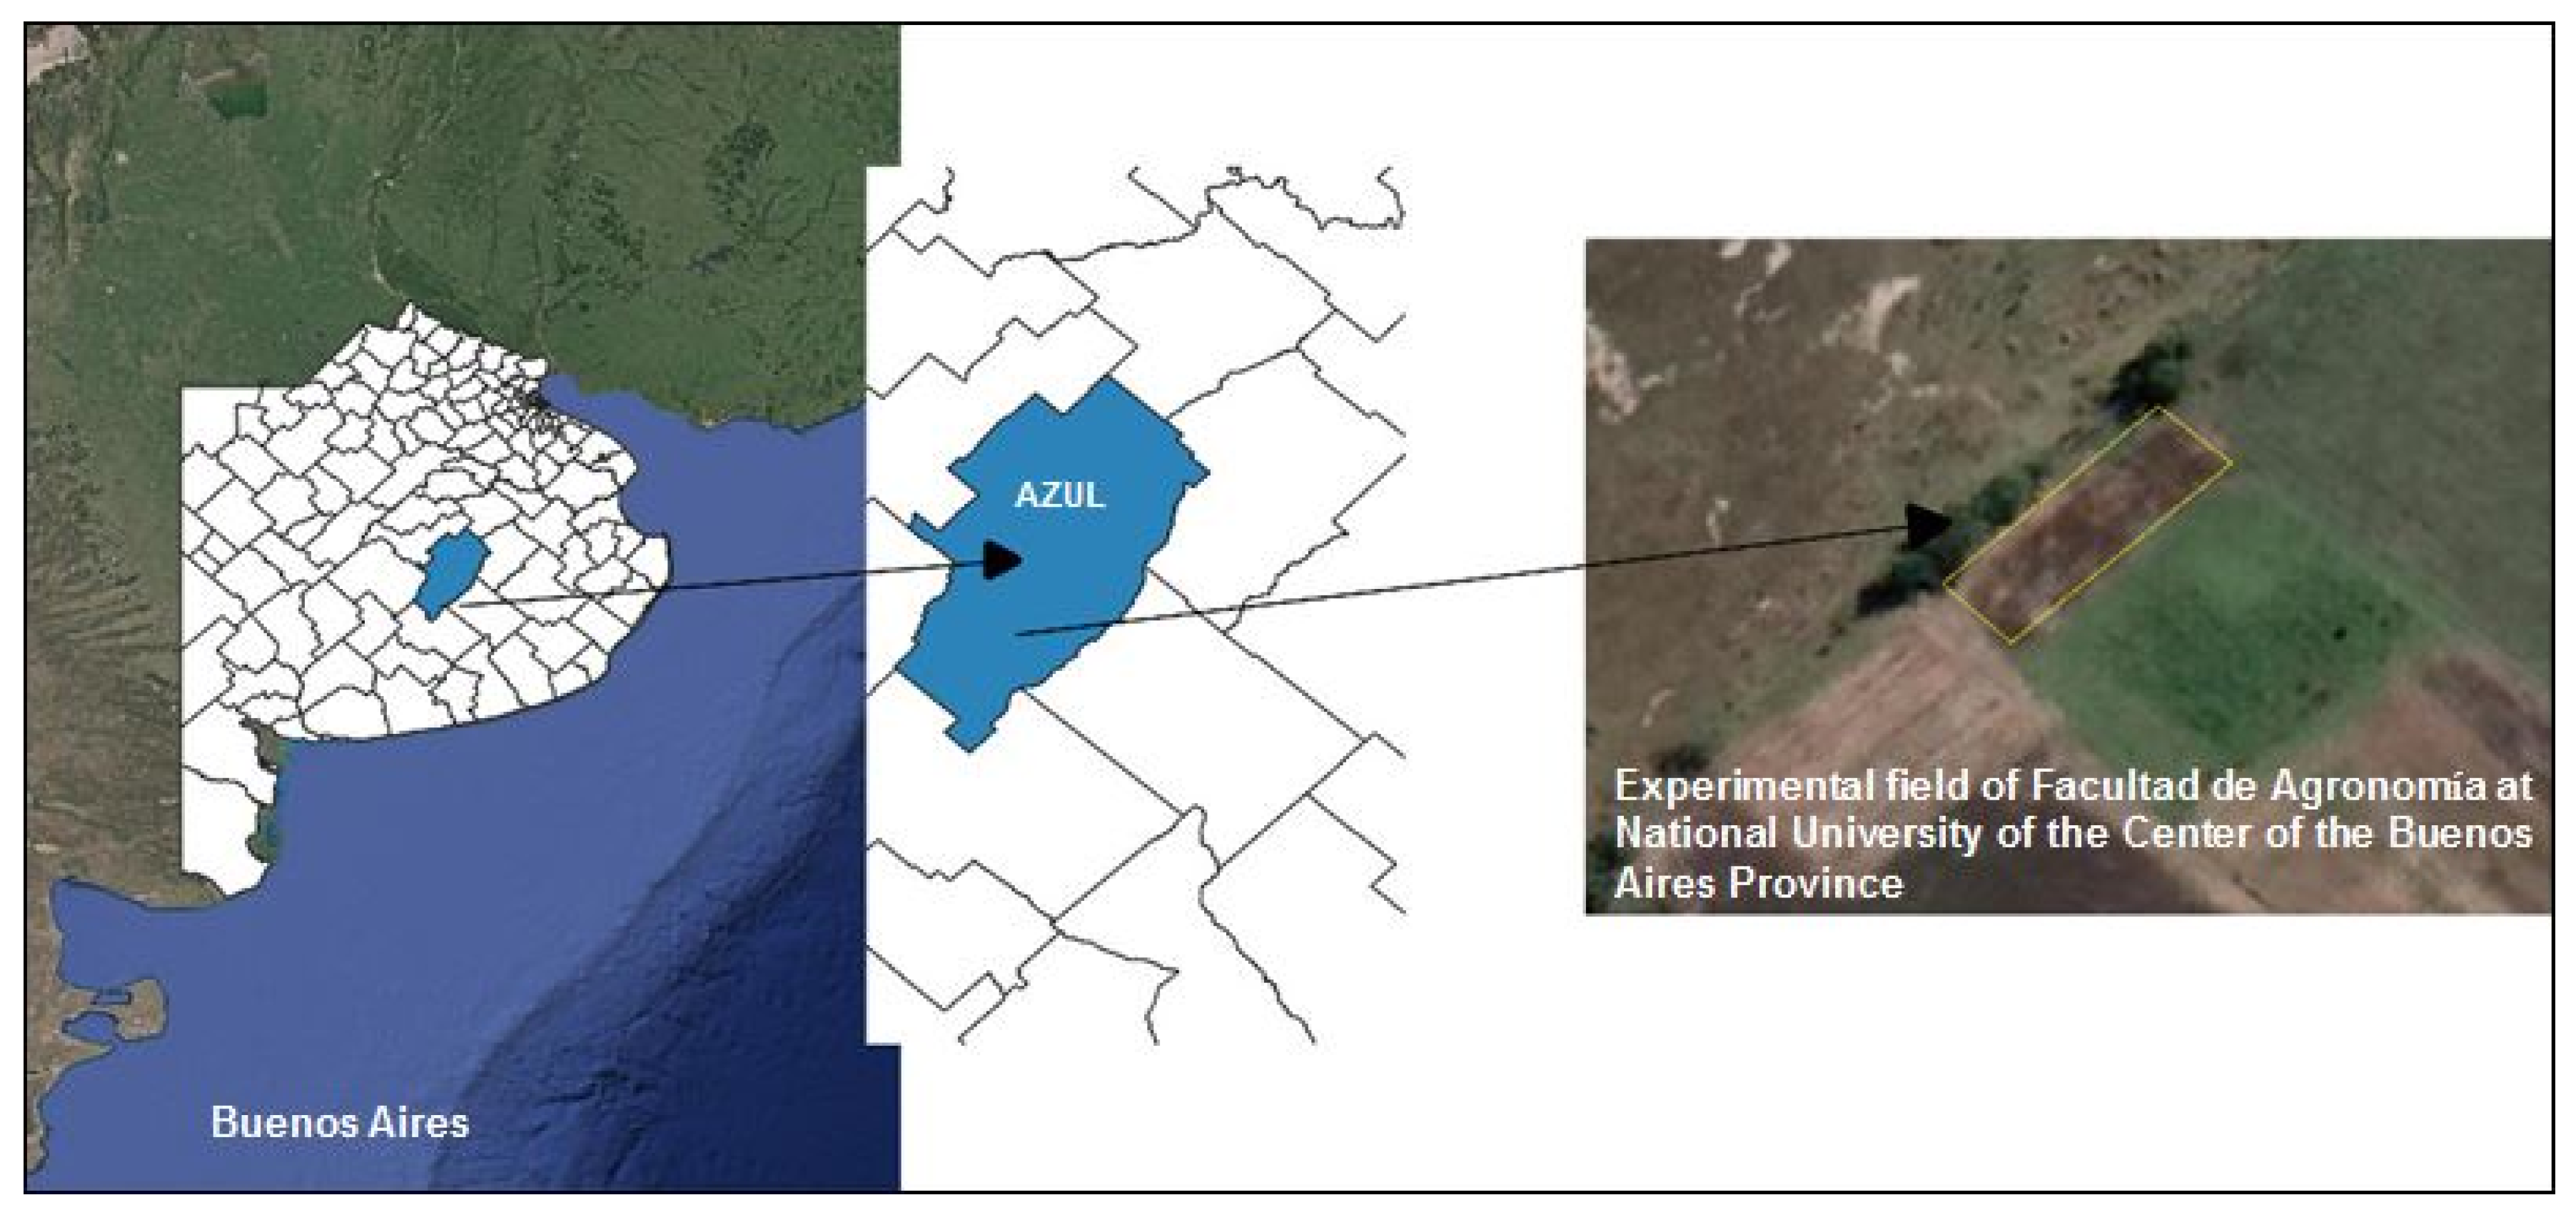
Figure 1. Location of the study area.
Sustainability 12 09829 g001
Figure 2. Estimated vs. experimental data for the linear regression model.
Sustainability 12 09829 g002
Figure 3. Resume of models based on radial basis functions: (a) Estimated vs. experimental data for complexity 10; (b) estimated vs. experimental data for complexity 20; (c) estimated vs. experimental data for complexity 30; (d) estimated vs. experimental data for complexity 40; (e) estimated vs. experimental data for complexity 50; (f) comparison of determination coefficient (R2).
Sustainability 12 09829 g003aSustainability 12 09829 g003b
Figure 4. Mean absolute error (MAE) and mean absolute percentage error (MAPE) comparison for FEM-based models (Finite Element Methods) with complexities from 10 to 50.
Sustainability 12 09829 g004
Figure 5. Estimated vs. experimental data for the non-linear regression model.
Sustainability 12 09829 g005
Figure 6. Experimental dry matter vs. photosynthetically active radiation (PAR) and non-linear regression models with lower and upper models obtained combining the coefficients and their standard deviations.
Sustainability 12 09829 g006
Figure 7. MAE and MAPE values for the perturbed linear regression model.
Sustainability 12 09829 g007
Figure 8. MAE and MAPE values for the FEM-based model: (a) Complexity 30; (b) complexity 40.
Sustainability 12 09829 g008
Figure 9. MAE and MAPE values for the perturbed non-linear regression model.
Sustainability 12 09829 g009
Figure 10. Estimated data vs. experimental validation data: (a) Multilinear regression; (b) finite elements (complexities 30 and 40); (c) non-linear regression.
Sustainability 12 09829 g010
Figure 11. Errors on validation data for non-linear regression and finite elements models (complexities 30 and 40): (a) Absolute error; (b) relative error.
Sustainability 12 09829 g011
Figure 12. Model comparison of MAE vs. perturbation.
Sustainability 12 09829 g012
Figure 13. Model comparison of MAPE vs. perturbation.
Sustainability 12 09829 g013
Table 1. Model variables.
VariableDescription
zDry matter
x1Thermal sum
x2PAR
x3Photoperiod
Table 2. Statistical summary of experimental data.
Dry Matter Thermal Sum PARPhotoperiod
Minimum79.0129.3560.4510.849
Maximum13,624.02049.71275.314.498
Average4582.1952.22659.2813.511
Median3543.0908.20633.9213.796
Table 3. Parameters of α · e β x 2 + γ · x 2 .
αβγ
Estimation−11,600.118.2509237.465
Std. Deviation1330.750.880824.7655
T Statistic−8.71720.729.589
p-Value2.41 × 10−13 (***)1.50 × 10⁻³⁴ (***)4.25 × 10⁻¹⁵ (***)
Table 4. Parameters of α · e β x 2 + γ · x 2 .
Model R2MAEMAPE (%)
Linear regression0.9389782.74141.34
Finite element (complexities 30)0.9858369.0813
Finite element (complexities 40)0.990304.389.65
Non-linear regression0.9663531.5837.26
Publisher’s Note: MDPI stays neutral with regard to jurisdictional claims in published maps and institutional affiliations.