Article

Fatigue and Thermal Cracking of Hot and Warm Bituminous Mixtures with Different RAP Contents

by
Nguyen Hoang Pham
1,2,
Cédric Sauzéat
1,*,
Hervé Di Benedetto
1,
Juan A. González-León
3,
Gilles Barreto
3 and
Aurélia Nicolaï
4
1
Laboratoire de Tribologie et Dynamique des Systèmes (UMR CNRS 5513), University of Lyon, ENTPE, Rue Maurice Audin, CEDEX 69518 Vaulx-en-Velin, France
2
Department of Civil, Water Resources University, 175, Son Tay street, Dong Da district, Hanoi 11515, Vietnam
3
Centre de Recherche Rhône-Alpes, Arkema Road Science, Rue Henri Moissan, CS42063, 69491 Pierre-Bénite, France
4
Pôle Développement—Direction Technique, Spie Batignolles Malet, 22 Avenue de Palarin, 31120 Portet-sur-Garonne, France
*
Author to whom correspondence should be addressed.
Sustainability 2020, 12(23), 9812; https://doi.org/10.3390/su12239812
Submission received: 20 September 2020 / Revised: 10 November 2020 / Accepted: 11 November 2020 / Published: 24 November 2020
(This article belongs to the Special Issue Towards Sustainable Pavement Materials and Structures)

Abstract

:
This paper presents results of laboratory tests on hot and warm bituminous mixtures produced with Reclaimed Asphalt Pavement (RAP). Additives were used to produce warm bituminous mixtures. Fatigue behaviour and thermomechanical behaviour at low temperature were investigated. Fatigue was studied by analysing the tension/compression fatigue test results. Four different failure criteria were used in order to evaluate fatigue life. The low temperature behaviour of the materials was characterized using the Thermal Stress Restrained Specimen Test (TSRST). For each material, three replicates were performed. The experimental device was improved so that radial strains in two directions could be measured during the tests. Tri-dimensional behaviour could thus be investigated. The results of both tests were analysed and the influence of the void content, RAP content, type of additives and manufacturing process was evaluated. The results show that RAP addition and warm bituminous mixtures could be combined to obtain mixtures with performances comparable to classical hot mixtures.

1. Introduction

The development of several innovations for the construction and rehabilitation of infrastructures is boosted by societal concerns about sustainable development and preservation of the environment. Among these innovative techniques, without being exhaustive, it is worth mentioning:
  • the recycling or re-use of different products such as shingles [1], rubber tyres [2,3] and obviously Reclaimed Asphalt Pavement (RAP) [4,5];
  • the warm bituminous mixtures or half-warm bituminous mixtures that are produced with different processes at a reduced temperature compared with classical hot mixtures [6];
  • new types of binders, sometimes called bio-asphalt, which are not produced from oil, but from agricultural product or algae, for example [7,8].
Recycling of asphalt pavement and the reduction of bituminous mixtures’ production temperatures are two solutions that can be interesting to combine, for economic and environmental reasons [9]. Nevertheless, the mechanical properties of the materials produced with these techniques should be carefully controlled [10,11,12,13]. Some blending problems may occur between aged RAP bitumen and a fresh added one [14,15,16,17]. Great research effort is currently made to study some rejuvenator products and their effects to solve such problems [18,19,20].
Several authors ([17,21,22,23,24,25,26,27,28,29,30,31,32,33] among others) have studied the use of RAP materials in road construction. They show that this is a valuable technique, especially for viscoelastic properties and rutting resistance. Meanwhile, further research is still needed to optimize the mix design, especially when using a high RAP content, and to investigate fatigue resistance and low-temperature cracking.
To reduce the mixtures’ production temperature, the two main techniques that exist are based on the use of chemical additives or bitumen foam. The objective of both techniques is to improve the aggregates’ coating by bitumen at a reduced temperature. Within the framework of a partnership between the LTDS laboratory of the University of Lyon/ENTPE, the ARKEMA ROAD SCIENCE company, the Malet company and ADEME (French Agency for the Environment and Energy Management), a large experimental campaign was initiated on the characterization of bituminous materials, produced at lowered temperatures using additives and including RAP.
An investigation into the fatigue resistance and the thermal cracking of different bituminous materials is presented in this paper. The fatigue properties of the materials were measured by means of fatigue tests in tension-compression at 10 °C and 10 Hz. Several authors ([34,35,36,37,38,39,40,41] among others) have studied the fatigue properties of bituminous materials.
The Thermal Stress Restrained Specimen Test (TSRST) allows a characterization of thermal cracking by coupling the thermal and mechanical effects. Different research works were conducted using this test and have confirmed its good potential to assess the thermal cracking resistance of bituminous mixtures ([6,8,42,43,44] among others)
This article is focused on the evaluation and comparison of bituminous mixtures produced at a reduced temperature using additives and with a different RAP content (0, 30% and 50% of the total weight). Section 2 presents testing procedures for both types of tests: fatigue and TSRST. Section 3 and Section 4 present, respectively, the experimental results, evaluation and comparison of the fatigue tests and TSRSTs for the nine different tested mixtures. Such a high RAP content combined with warm bituminous mixtures, as well as the fatigue and low temperature behaviours that are rarely studied for such materials, makes this study original.

2. Experimental Procedures and Materials
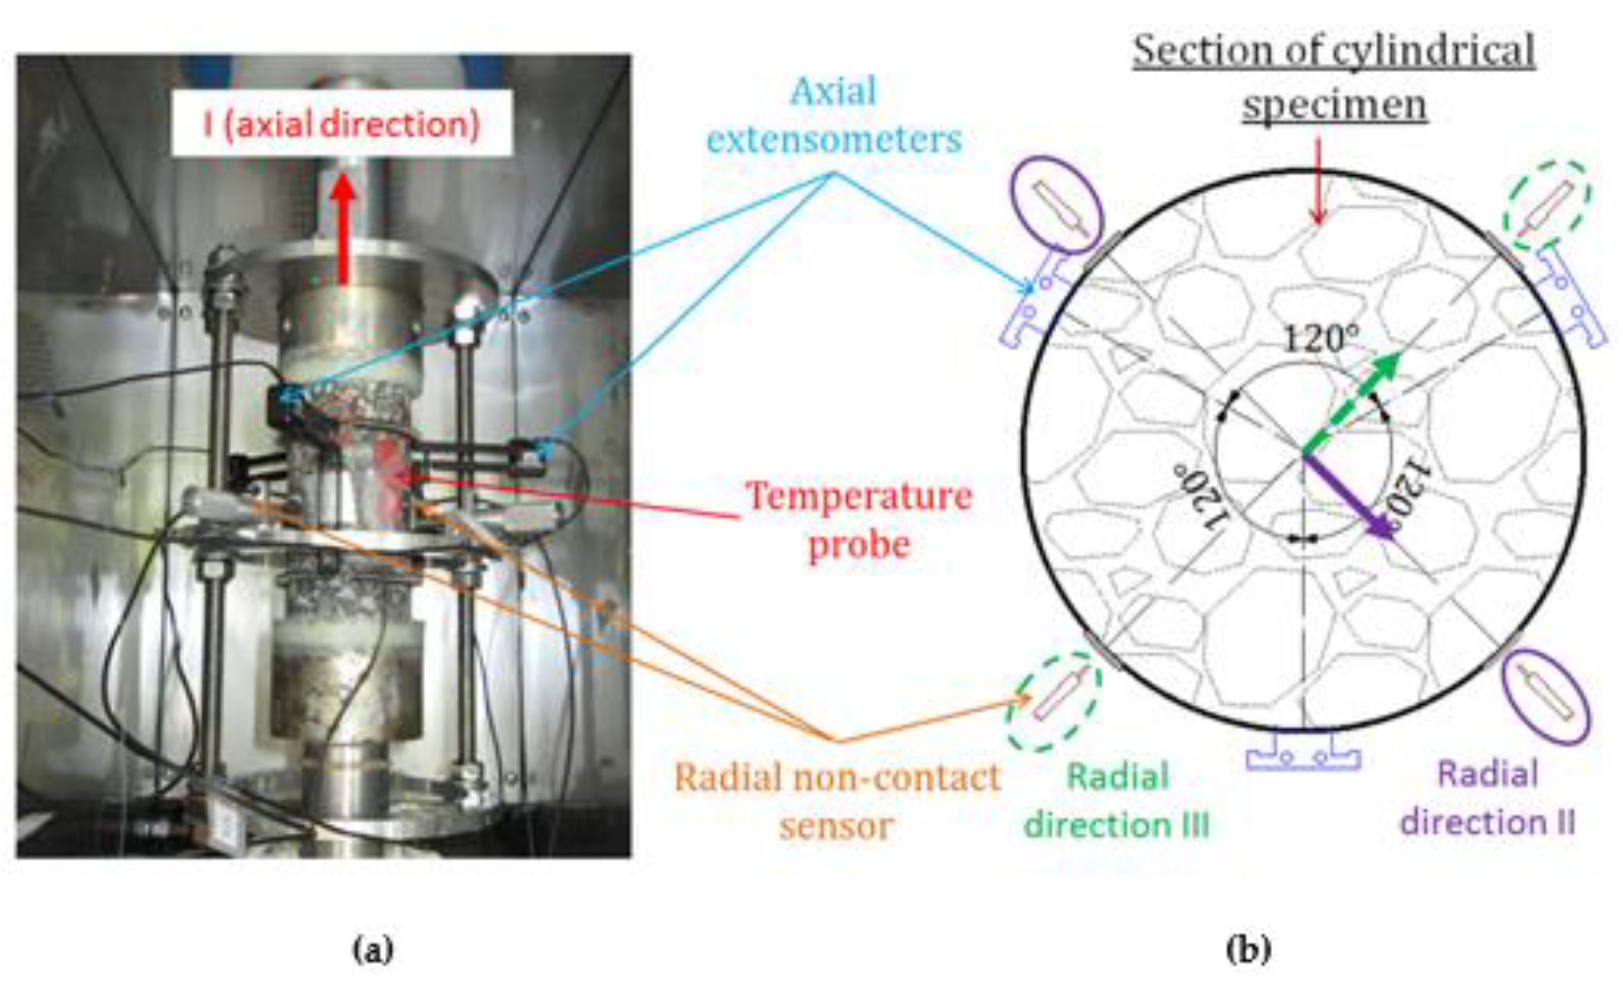
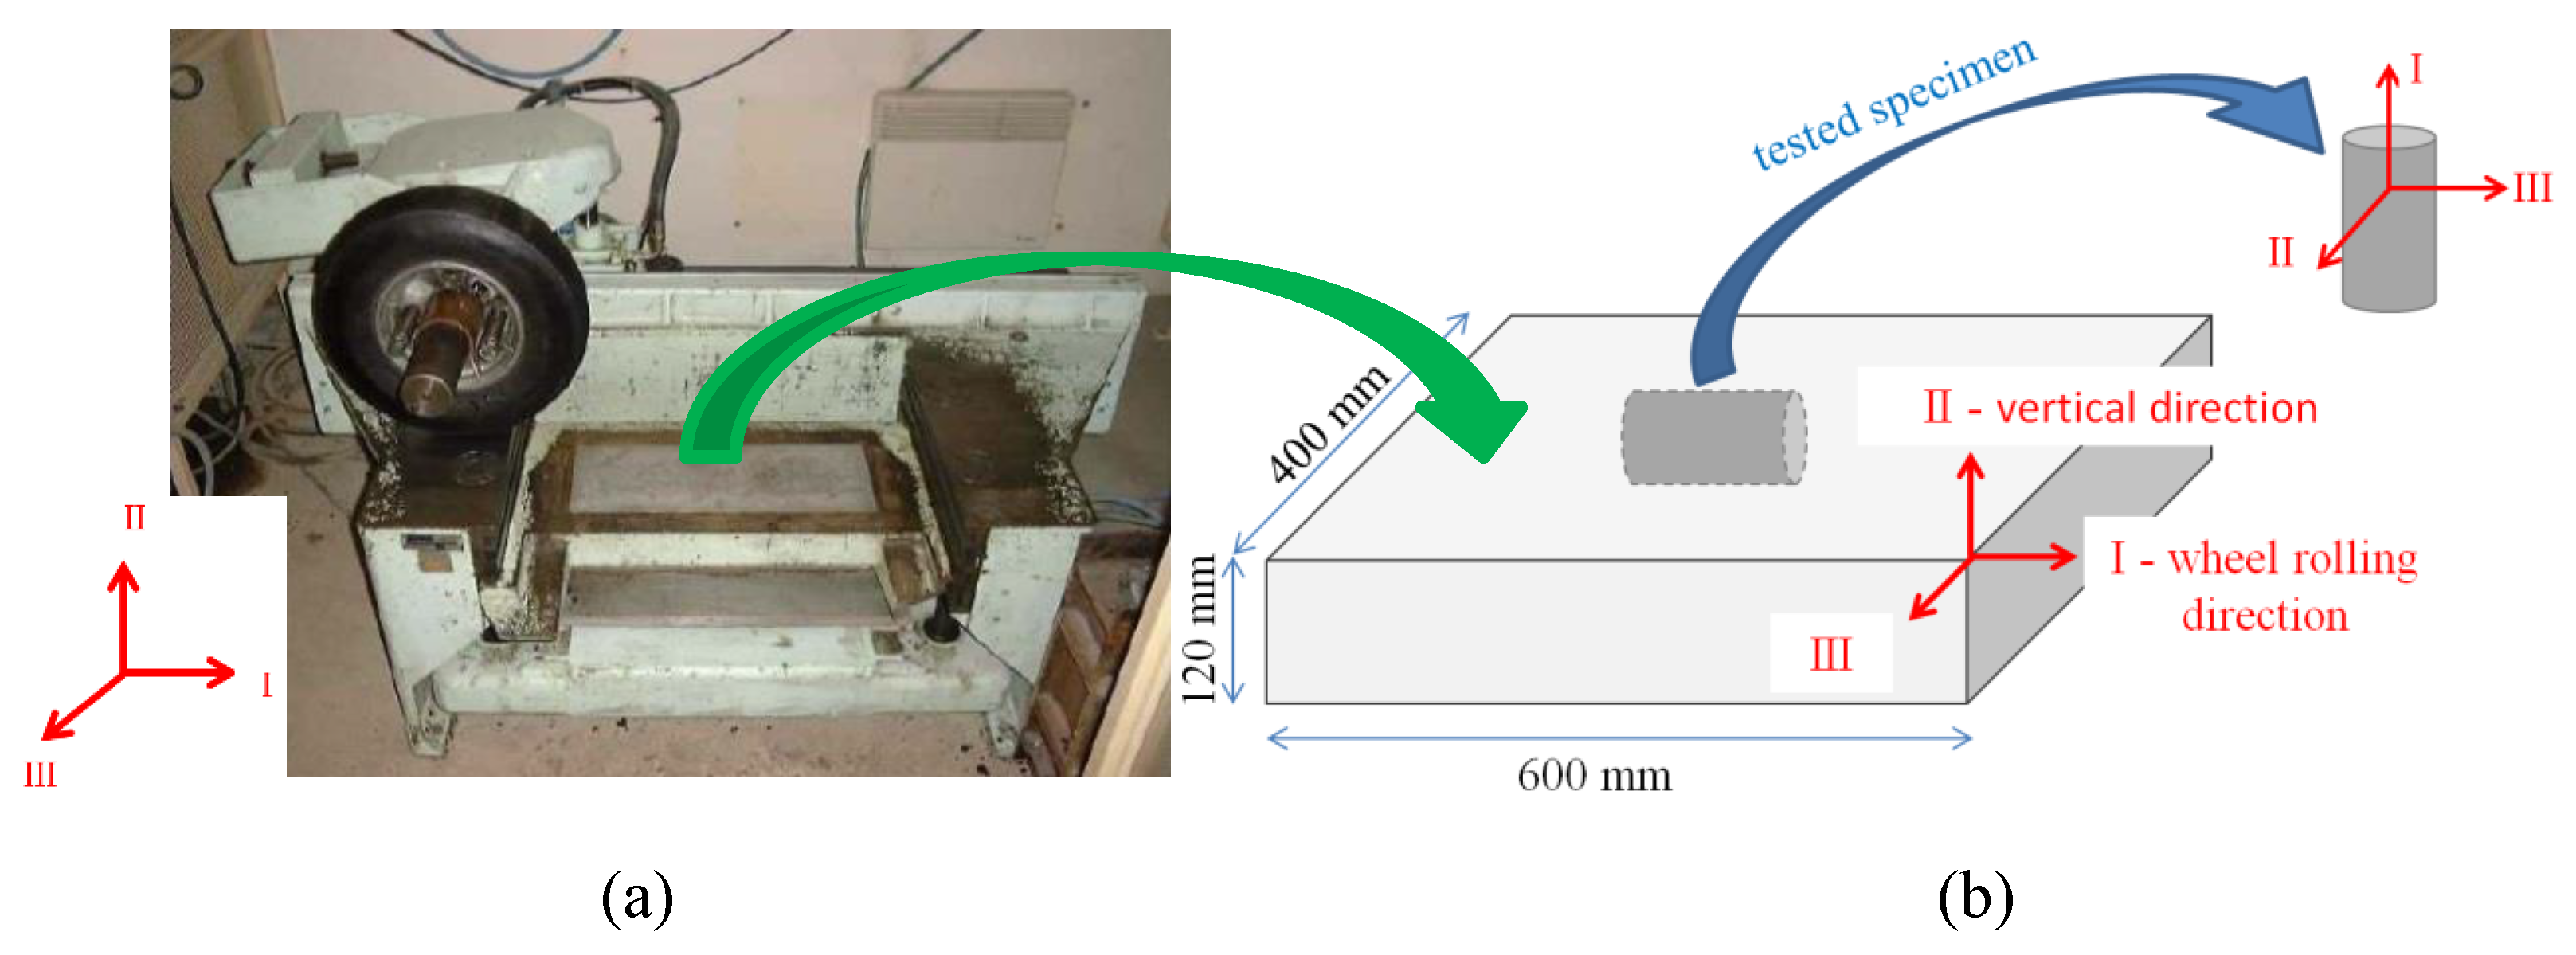
2.1. Test Equipment

Both the TSRST and fatigue tests used the same equipment. Tests were performed on cylindrical specimens using a hydraulic press equipped with a thermal chamber to control the temperature. A thermal gauge (PT100 temperature probe) fixed on the surface of the specimen measured its temperature. Axial strain, used for the test control, was obtained from the average of three axial extensometer measurements. Their setup (120° around the specimen) is indicated in Figure 1. In addition, two pairs of non-contact displacement transducers (range 500 μm) were used. They measured the diameter changes, at mid-height of the specimen, in order to obtain two radial strains in two perpendicular radial material directions.
A general view of the specimen setup and the strain measurement devices developed at the University of Lyon/ENTPE are shown in Figure 1.

2.2. Test Procedures

2.2.1. Fatigue Test

Fatigue tests were carried out in tension-compression on the cylindrical specimens. A sinusoidal axial strain (εax) (average of the three axial extensometers), with a constant amplitude during the test, was applied on the specimen. The sinusoidal axial stress (σax) was obtained using load cell measurements. The sinusoidal radial strain εrad II in direction II and εrad III in direction III were obtained from the two pairs of non-contact sensors (Figure 1). The following equations were used to fit the obtained signals:
ε a x ( t ) = ε A a x s i n ( ω t )
σ a x ( t ) = σ A a x s i n ( ω t + φ E )
ε r a d   I I ( t ) = ε A r a d   I I s i n ( ω t + φ ν   I I )
ε r a d   I I I ( t ) = ε A r a d   I I I s i n ( ω t + φ ν   I I I )
where the amplitude of the axial strain, radial strains in directions II and III, and axial stress are, respectively, noted εAax, εArad II, εArad III and σAax; φE is the phase angle between the axial strain and axial stress; and φνII and φνIII are the phase angles between the axial strain and the radial strains in directions II and III.
The axial strain amplitude is kept constant during each fatigue test (strain control mode). The temperature was set at 10 °C and the frequency at 10 Hz. At least four different levels of axial strain amplitude were applied for each tested material. The axial load, axial strain, and radial strain data were recorded at a frequency of 2500 Hz, resulting in 250 data points per cycle. Because of the great number of performed cycles, and the “slow” evolution of the parameters, only the cycles indicated in Table 1 were recorded.
During the fatigue test, the complex modulus and the complex Poisson’s ratios were calculated (Equations (5)–(7)) for all recorded cycles.
From the parameters defined in Equations (1)–(4), the complex modulus (E*) and the complex Poisson’s ratios in directions II and III (ν*II-I and ν*III-I) were calculated as follows:
E = σ A a x ε A a x e j φ E = | E | e j φ E
ν II I = ε A r a d   I I ε A a x e j φ ν I I = | ν II - I | e j φ ν I I
ν III - I = ε A r a d   I I I ε A a x e j φ ν I I I = | ν III - I | e j φ ν I I I
The dissipated energy per cycle (WN) was also calculated. It is the area within the axial stress–axial strain hysteresis loop, given by Equation (8).
W N = π ε A a x σ A a x s i n φ E

2.2.2. TSRST

The principle of the TSRST is to keep the length of the tested specimen constant (the axial strain is maintained null) while decreasing the temperature inside the thermal chamber at a constant cooling rate of −10 °C/h, starting at 5 °C. Cooling incites the specimen to contract, but the servo-hydraulic press, which imposes a nil axial strain, prevents it. The thermal stress induced inside the specimen increases until the specimen breaks. The TSRST intends to reproduce the thermo-mechanical coupling occurring in a pavement during a cooling period.
To take into account the thermal contraction/dilation of the measurement system due to the temperature change, the device was previously carefully calibrated using a sample of Zerodur®, whose thermal coefficient is nearly zero (about 0.05 × 10⁻⁶ K−1). This calibration process allowed being quite confident in respecting the condition of no change in the height of the sample.

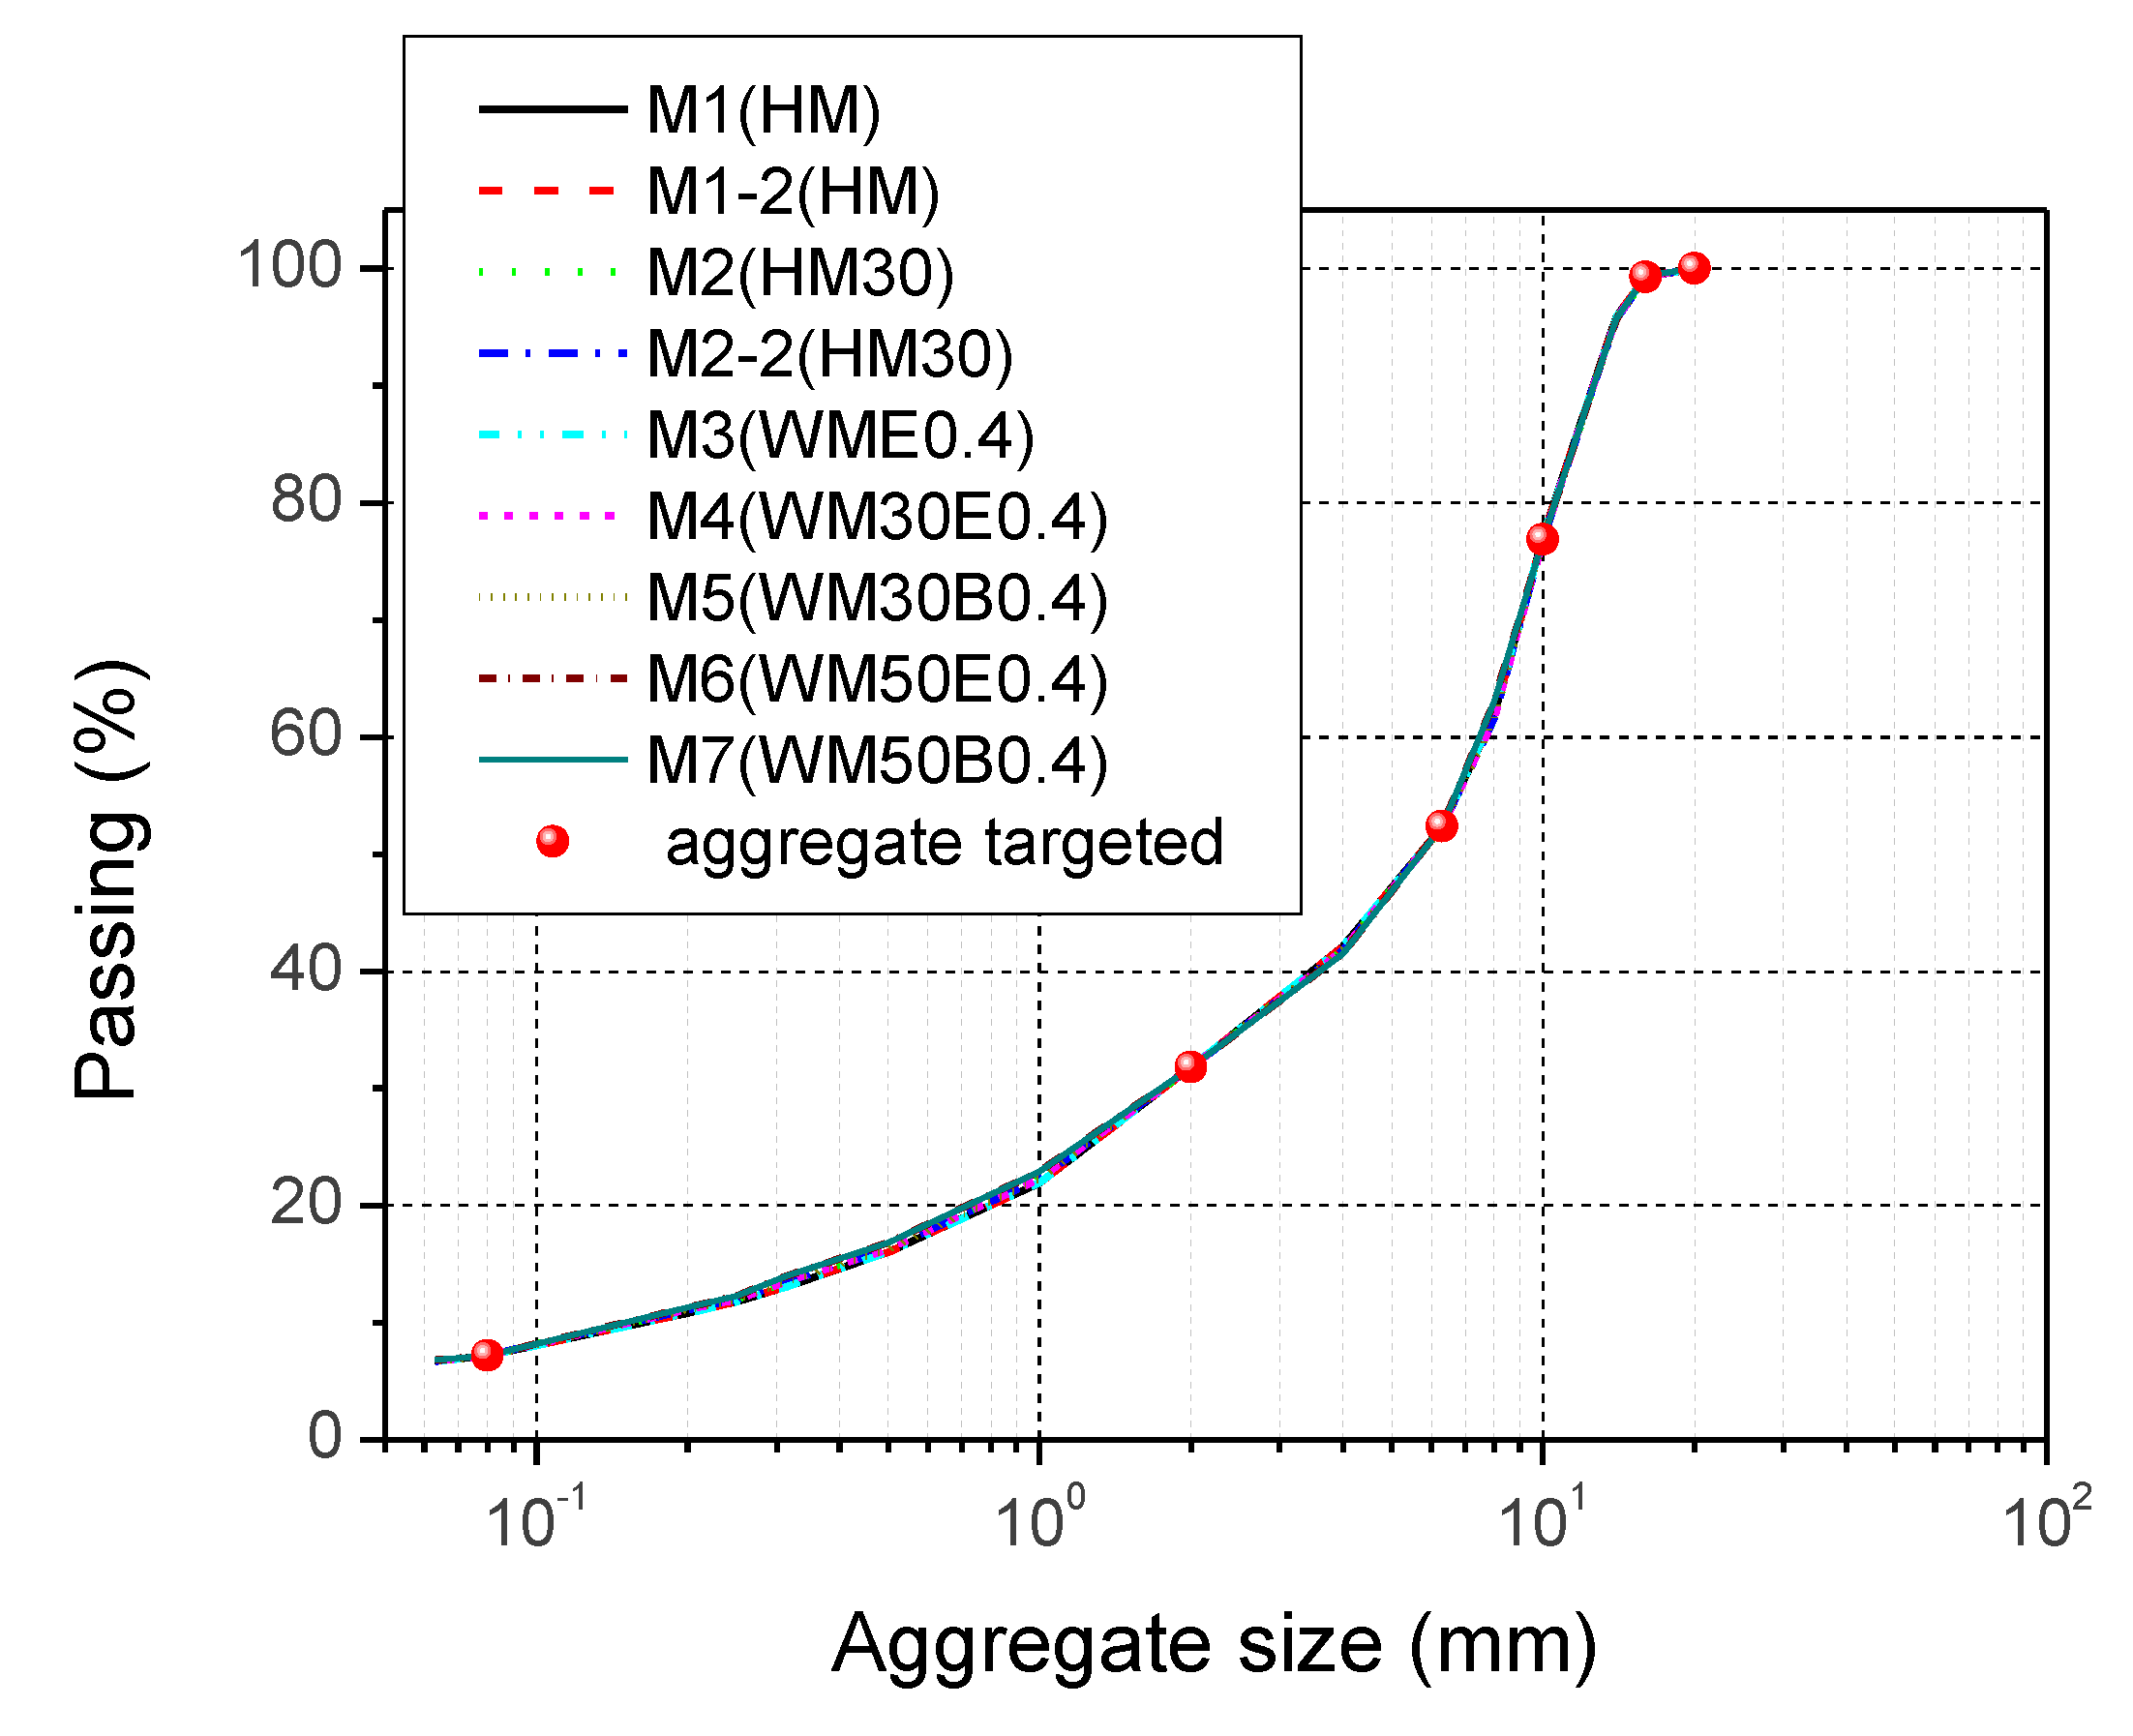
2.3. Tested Materials

Nine bituminous mixtures were tested. They differ in production temperature, Reclaimed Asphalt Pavement (RAP) content and the presence or not of an additive (Table 2). Two types of production processes were considered: a hot bituminous mixture (HM), which serves as a reference material (mixing at 160 °C), and a warm bituminous mixture (WM), mixing at 120 °C. Three RAP contents were used: 0%, 30% and 50%. The RAP content is calculated as the ratio between the weight of the RAP and the total weight of the mixture. Two types of surfactant-based additives, provided by the ARKEMA ROAD SCIENCE company—additive E (E) and additive B (B)—were used to produce the warm bituminous mixtures. No further details could be given on these additives because of industrial patents and no names are given in order to avoid commercialism. The percentage of additive (the ratio between the weight of the additive and the total weight of bitumen, including RAP bitumen) was fixed at 0.4%. The RAP and fresh bitumens have the same crude origin. Penetration of the fresh bitumen used for the bituminous mixtures without RAP was 38 (0.1 mm units). The bitumen recovered from the RAP was found to have a penetration of 11 (0.1 mm units). For bituminous mixtures with RAP, the penetrability of the added fresh bitumen was determined to obtain a final binder penetration of 38 (0.1 mm units), whatever the RAP content, when using the log–log mixing rule between the RAP and fresh bitumen [44]. For a 30% RAP content, the fresh bitumen was obtained by blending 50/70 and 70/100 bitumens, and for a 50% RAP content, by blending 50/70 and 160/220 bitumens. The obtained fresh bitumens exhibited, respectively, a penetration of 66 and 148 (0.1 mm units).
The materials’ name and their fabrication characteristics are listed in Table 2. For example, WM50B0.4 indicates the warm bituminous mixture (WM) made with 50% RAP and 0.4% of B additive.
Malet company was in charge of producing slabs (600 × 400 × 120 mm) with a French type Rolling Wheel Compactor (Figure 2a) [45]. Axes I, II and III used during the tests in order to identify the specimens’ directions were related to the material directions. They were determined during the compaction process and correspond to the rolling wheel direction (I), the vertical direction during compaction (II) and the horizontal direction, transverse to the rolling wheel direction (III). The cylindrical specimens used for the fatigue tests and TSRSTs were cored and sawn from each slab (Figure 2b); their diameters and heights were 75 mm × 140 mm for the fatigue tests and 60 mm × 225 mm for the TSRSTs. After coring the slab horizontally, the vertical axis of the cylindrical specimen corresponded to material direction I (Figure 2b) [46].
Apart from the three variable parameters, all bituminous mixtures have the same formulation. All mixtures are within the French classification GB3 0/14 (“Grave Bitume” of Type 3, with a maximal aggregate size of 14 mm) [47], which corresponds to the classical mixture used in base layers in France. The aggregate grading curves for the nine materials are presented in Figure 3. They superimpose nearly perfectly.
The air void content of each specimen was determined by geometry and weight measurements, and pycnometer measurements. The characteristics of the tested specimens are listed in Table A1 (Appendix A). For replicated tests, specimens having a close void ratio were chosen.
The linear properties of these materials are described in detail in Pham et al. [47,48].

3. Fatigue Test Results and Analysis

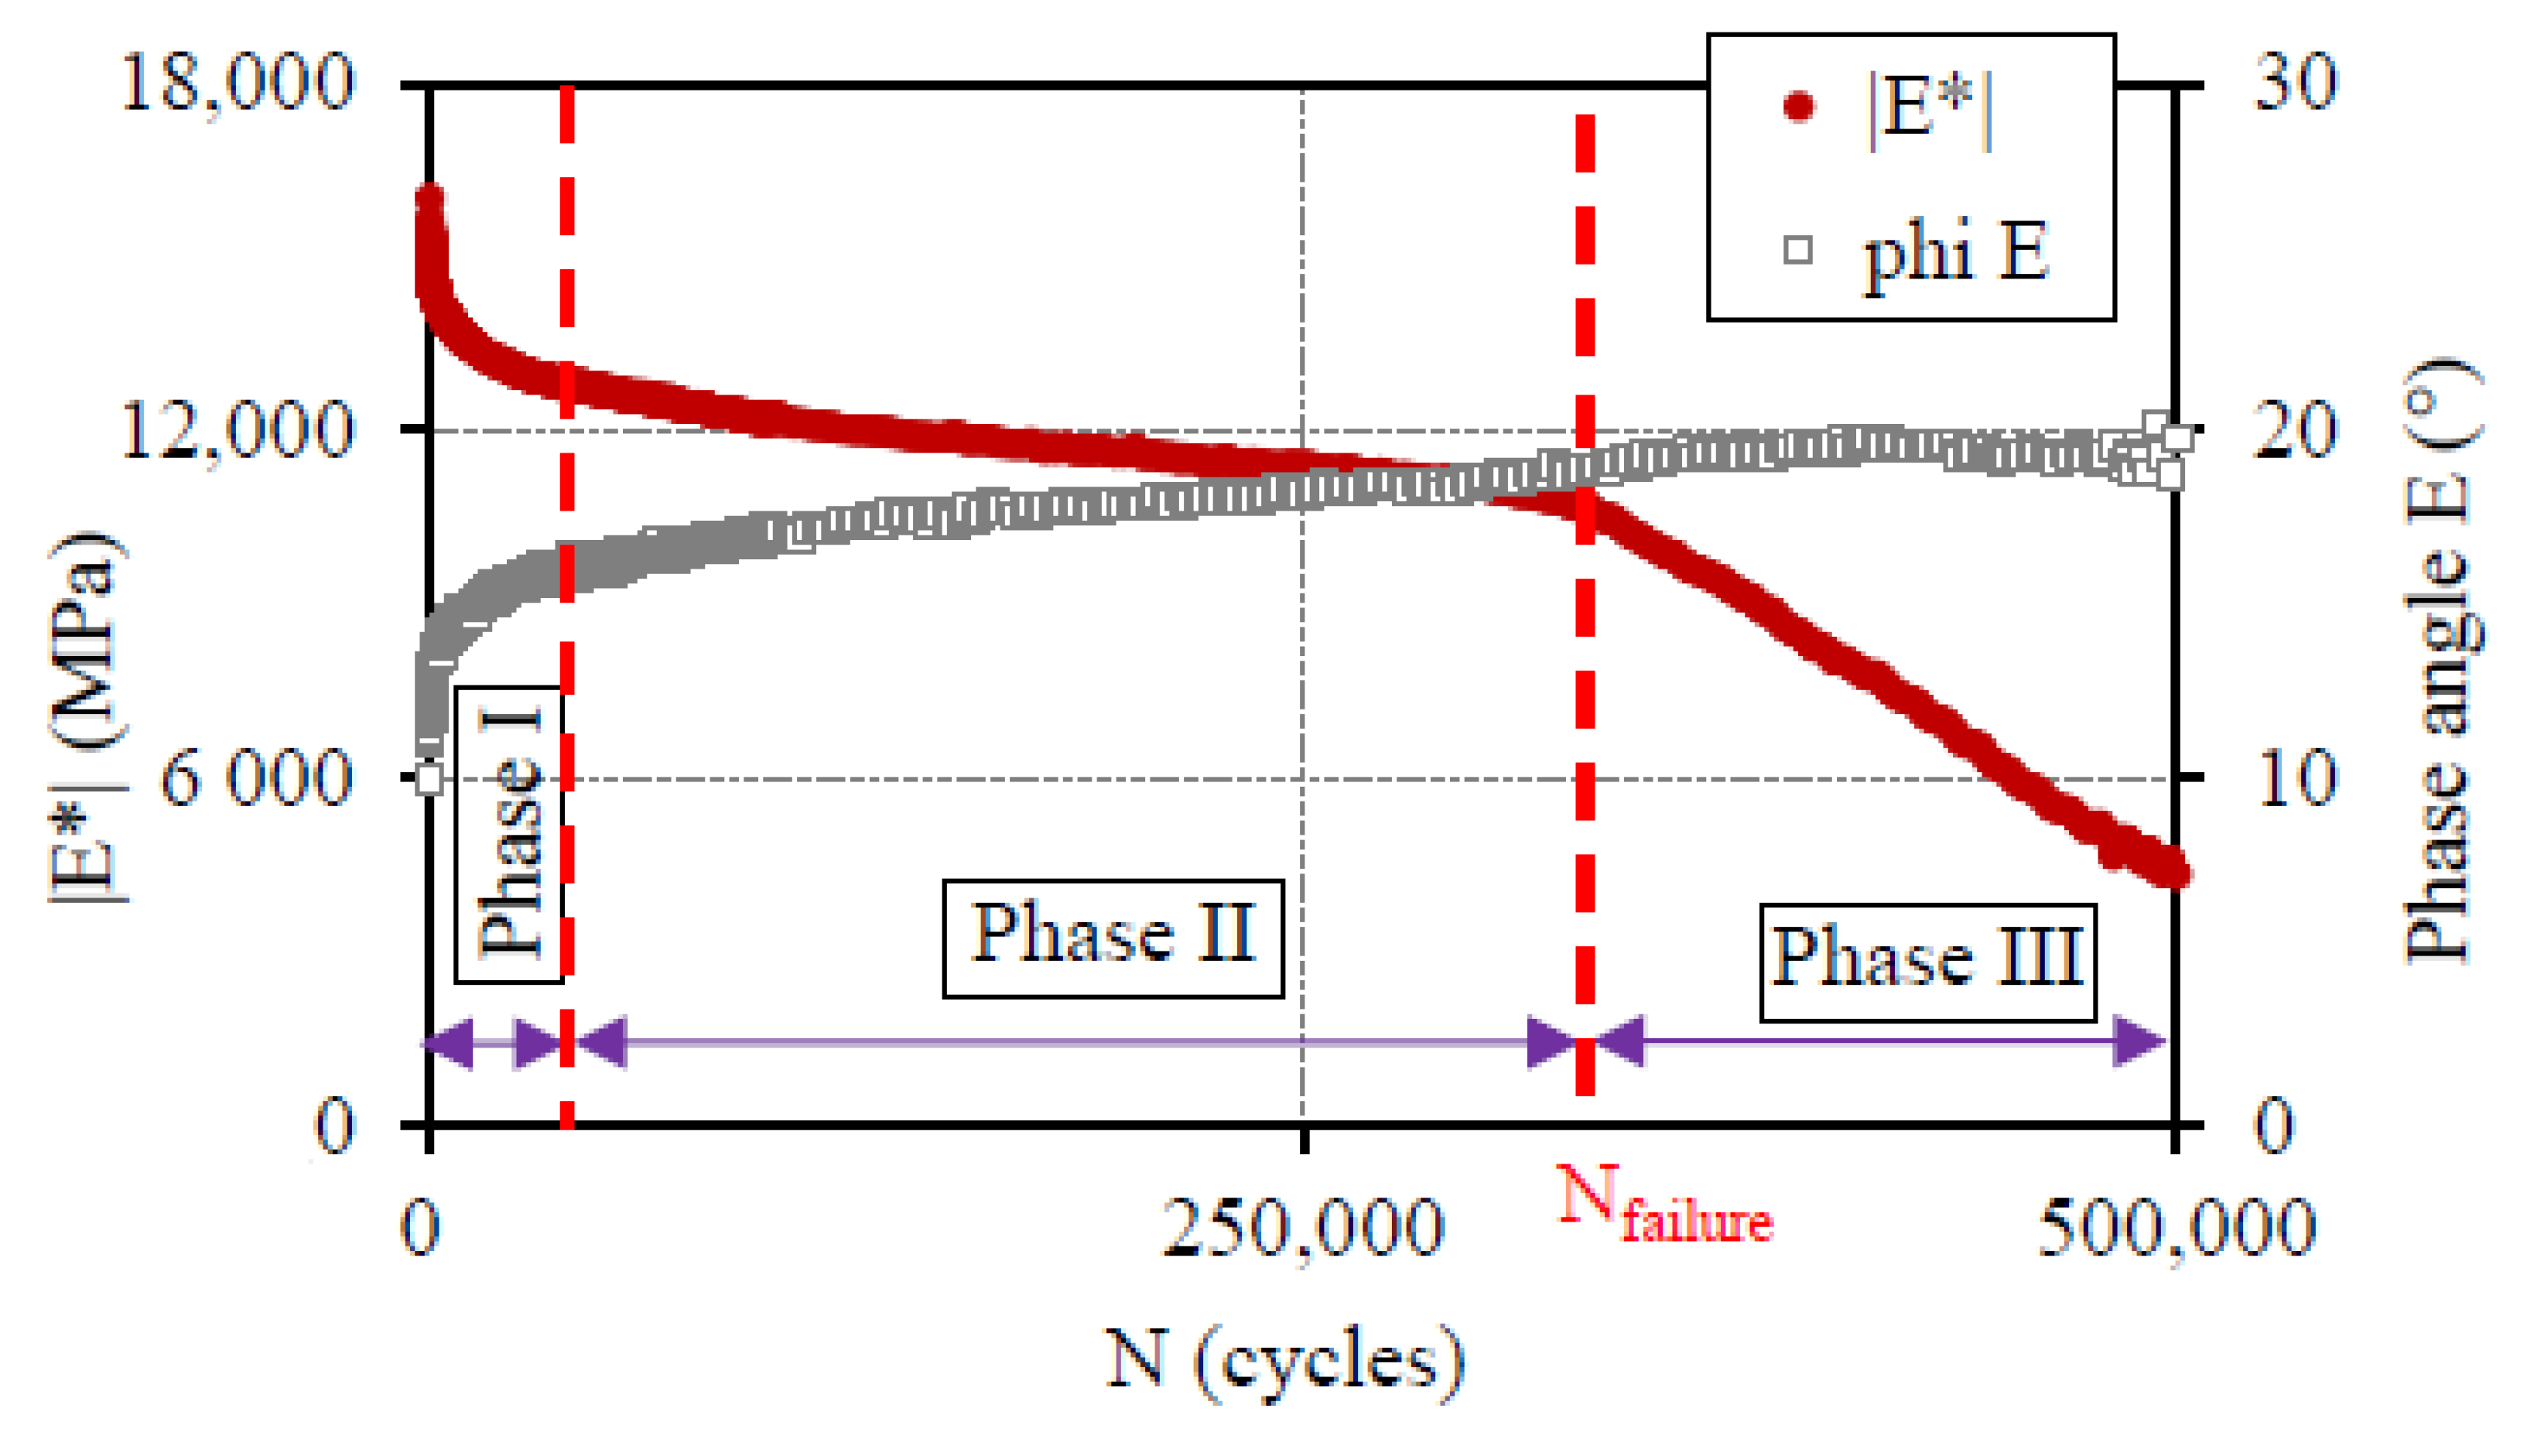
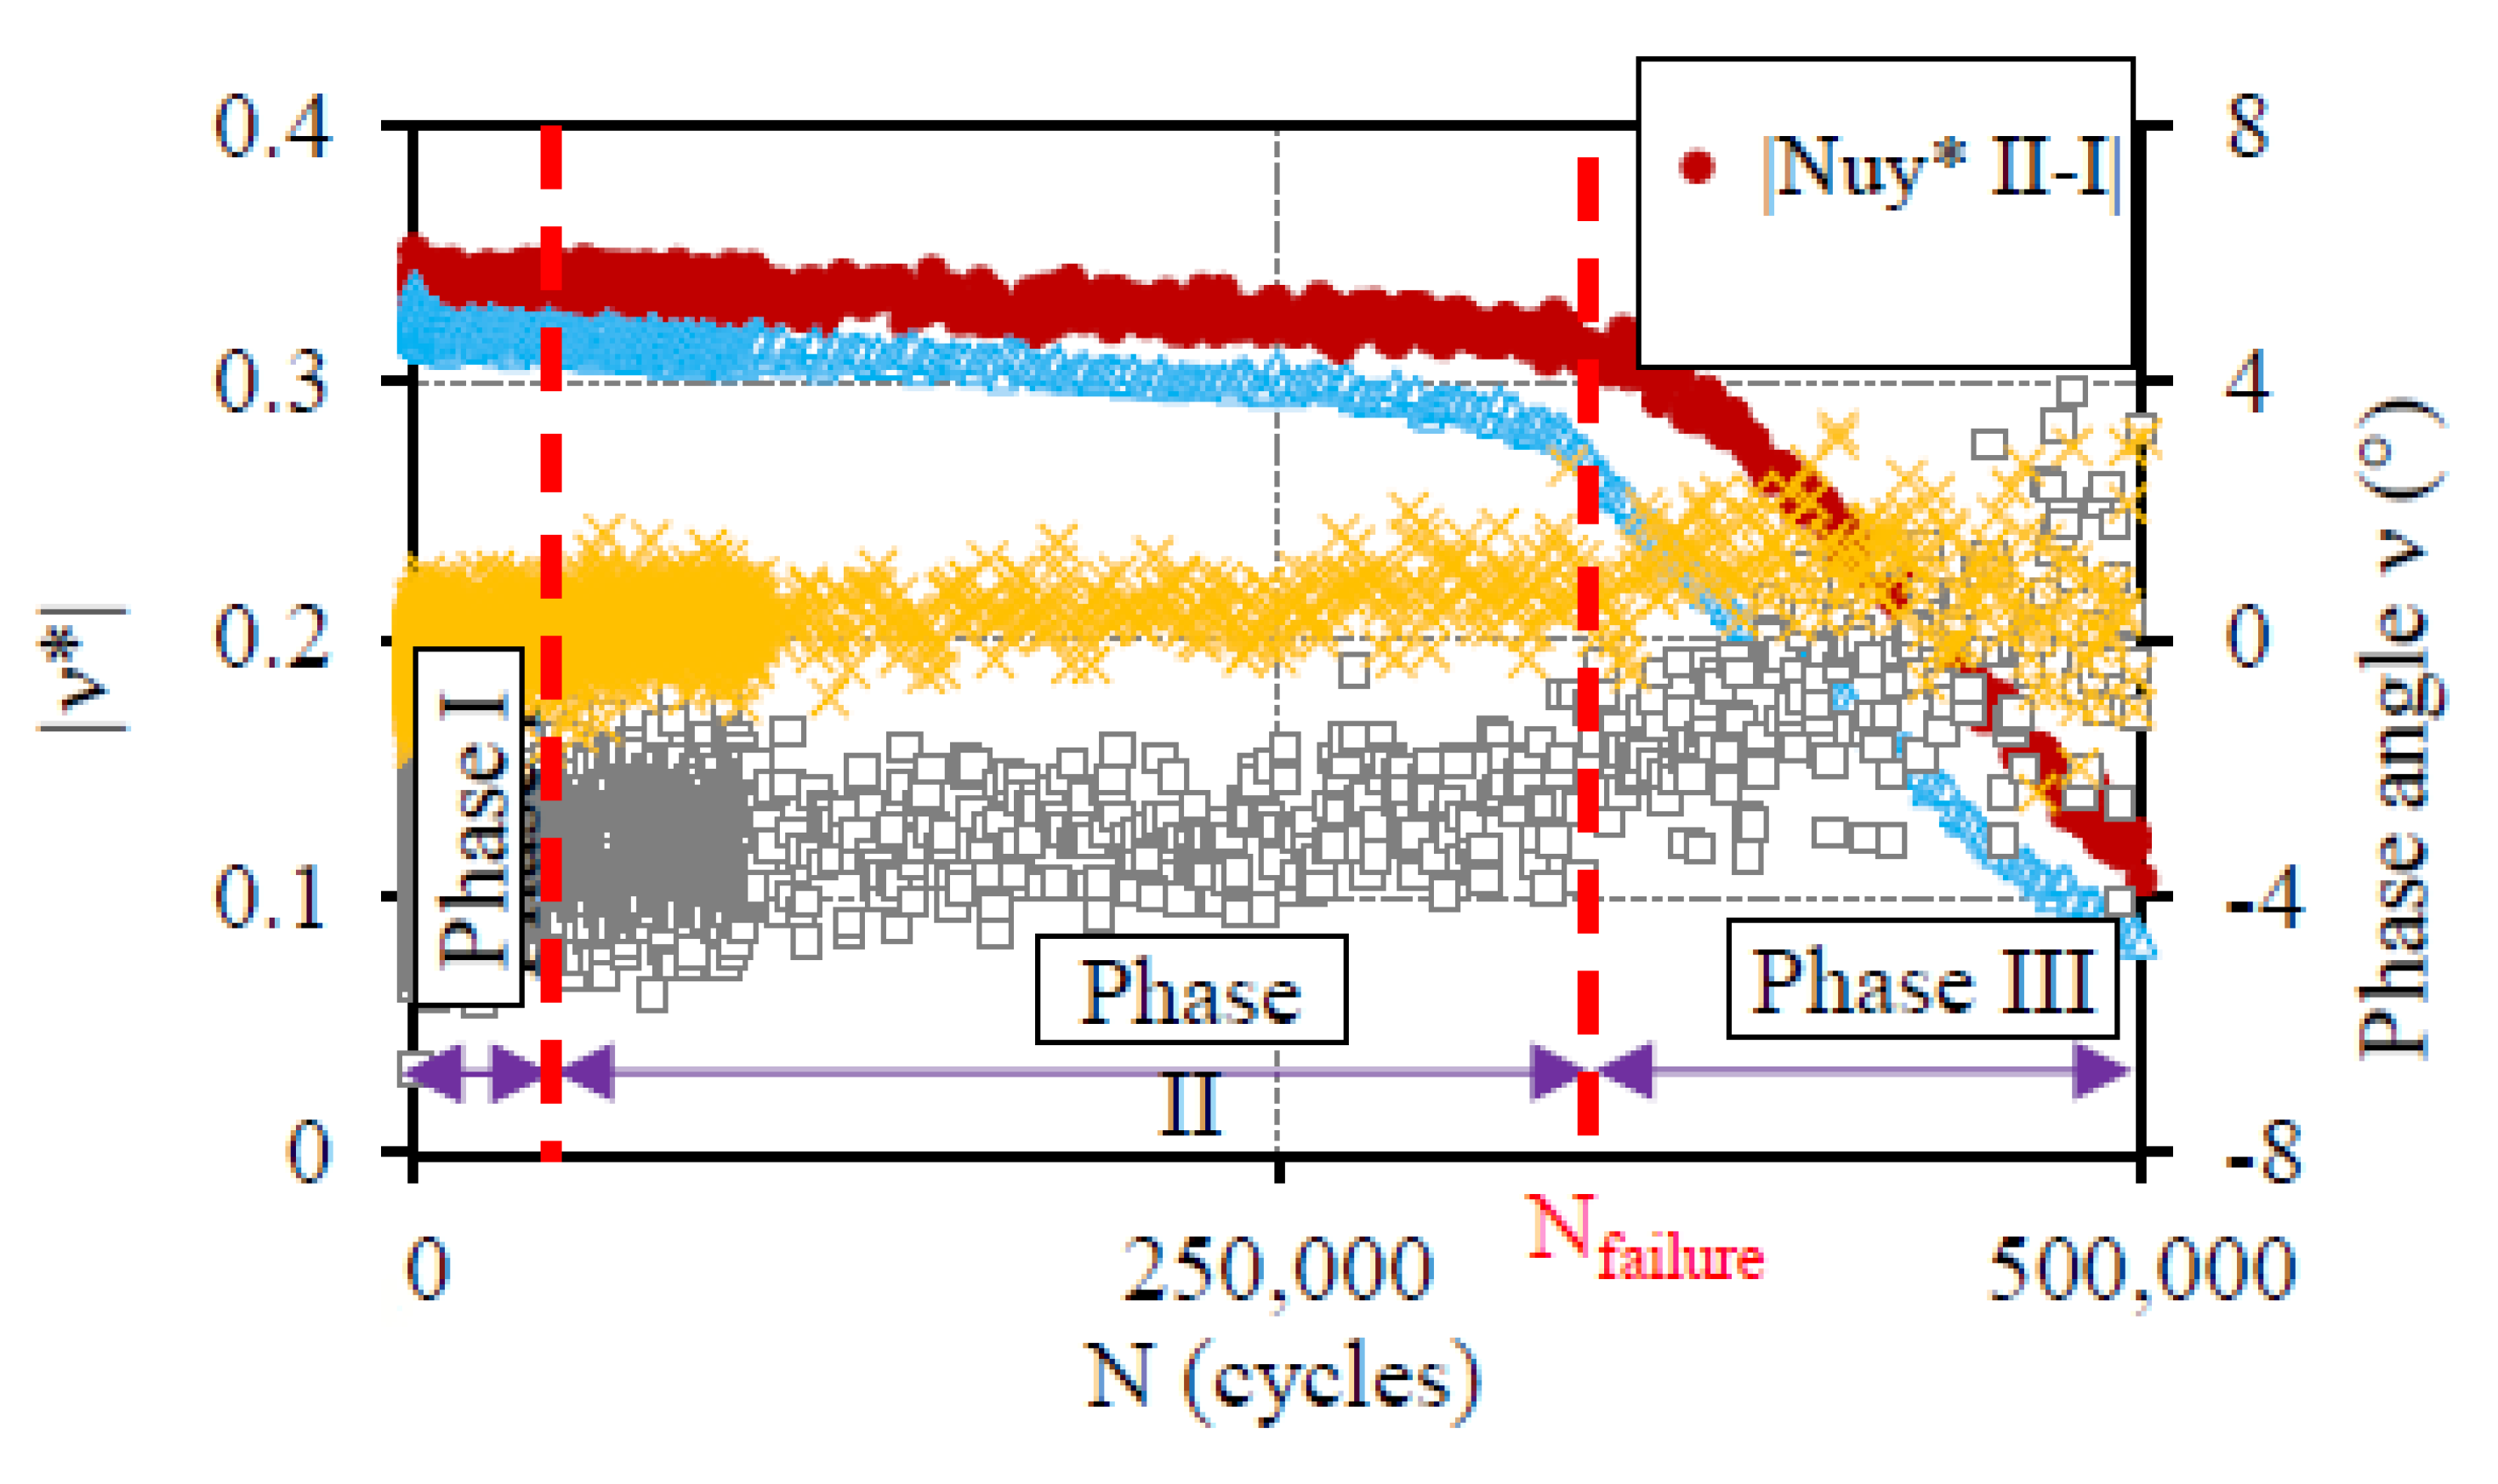
3.1. Example of Fatigue Test Results

The results of the C7P2M5 fatigue test (material M5, specimen C7P2M5, see Table A1 in Appendix A) are presented in Figure 4. The norm |E*| and phase angle φE of the complex modulus, measured for the applied strain amplitude (84 μm/m), are plotted as a function of the number of cycles (N) in Figure 4. As previously highlighted by some authors [33,36,39], three phases (the adaptation phase (Phase I), quasi-stationary phase (Phase II) and failure phase (Phase III)) can be observed during the fatigue tests. The end of Phase II or beginning of Phase III, corresponding to the beginning of the macro-crack propagation, is then the failure of the materials. Different criteria are introduced in the literature to obtain this fatigue life boundary.
Plots similar to Figure 4 are proposed in Figure 5 for the two complex Poisson’s ratios ν* in radial directions II and III. This type of curve, which gives multidirectional information for the fatigue tests, is not proposed in the literature and was introduced by University of Lyon/ENTPE team [1,39,49]. It reveals that (i) the Poisson’s ratios in directions II and III (norm and phase angle values) are “close”, and then that the anisotropy is not visible on this parameter; and (ii) the norm of the Poisson’s ratio slightly decreases during the fatigue test, while the phase angle, which remains close to zero, slightly increases. It seems also possible to determine the failure from these curves.

3.2. Fatigue Criteria

Four fatigue criteria were considered to determine the fatigue life Nfailure of the tested mixtures:
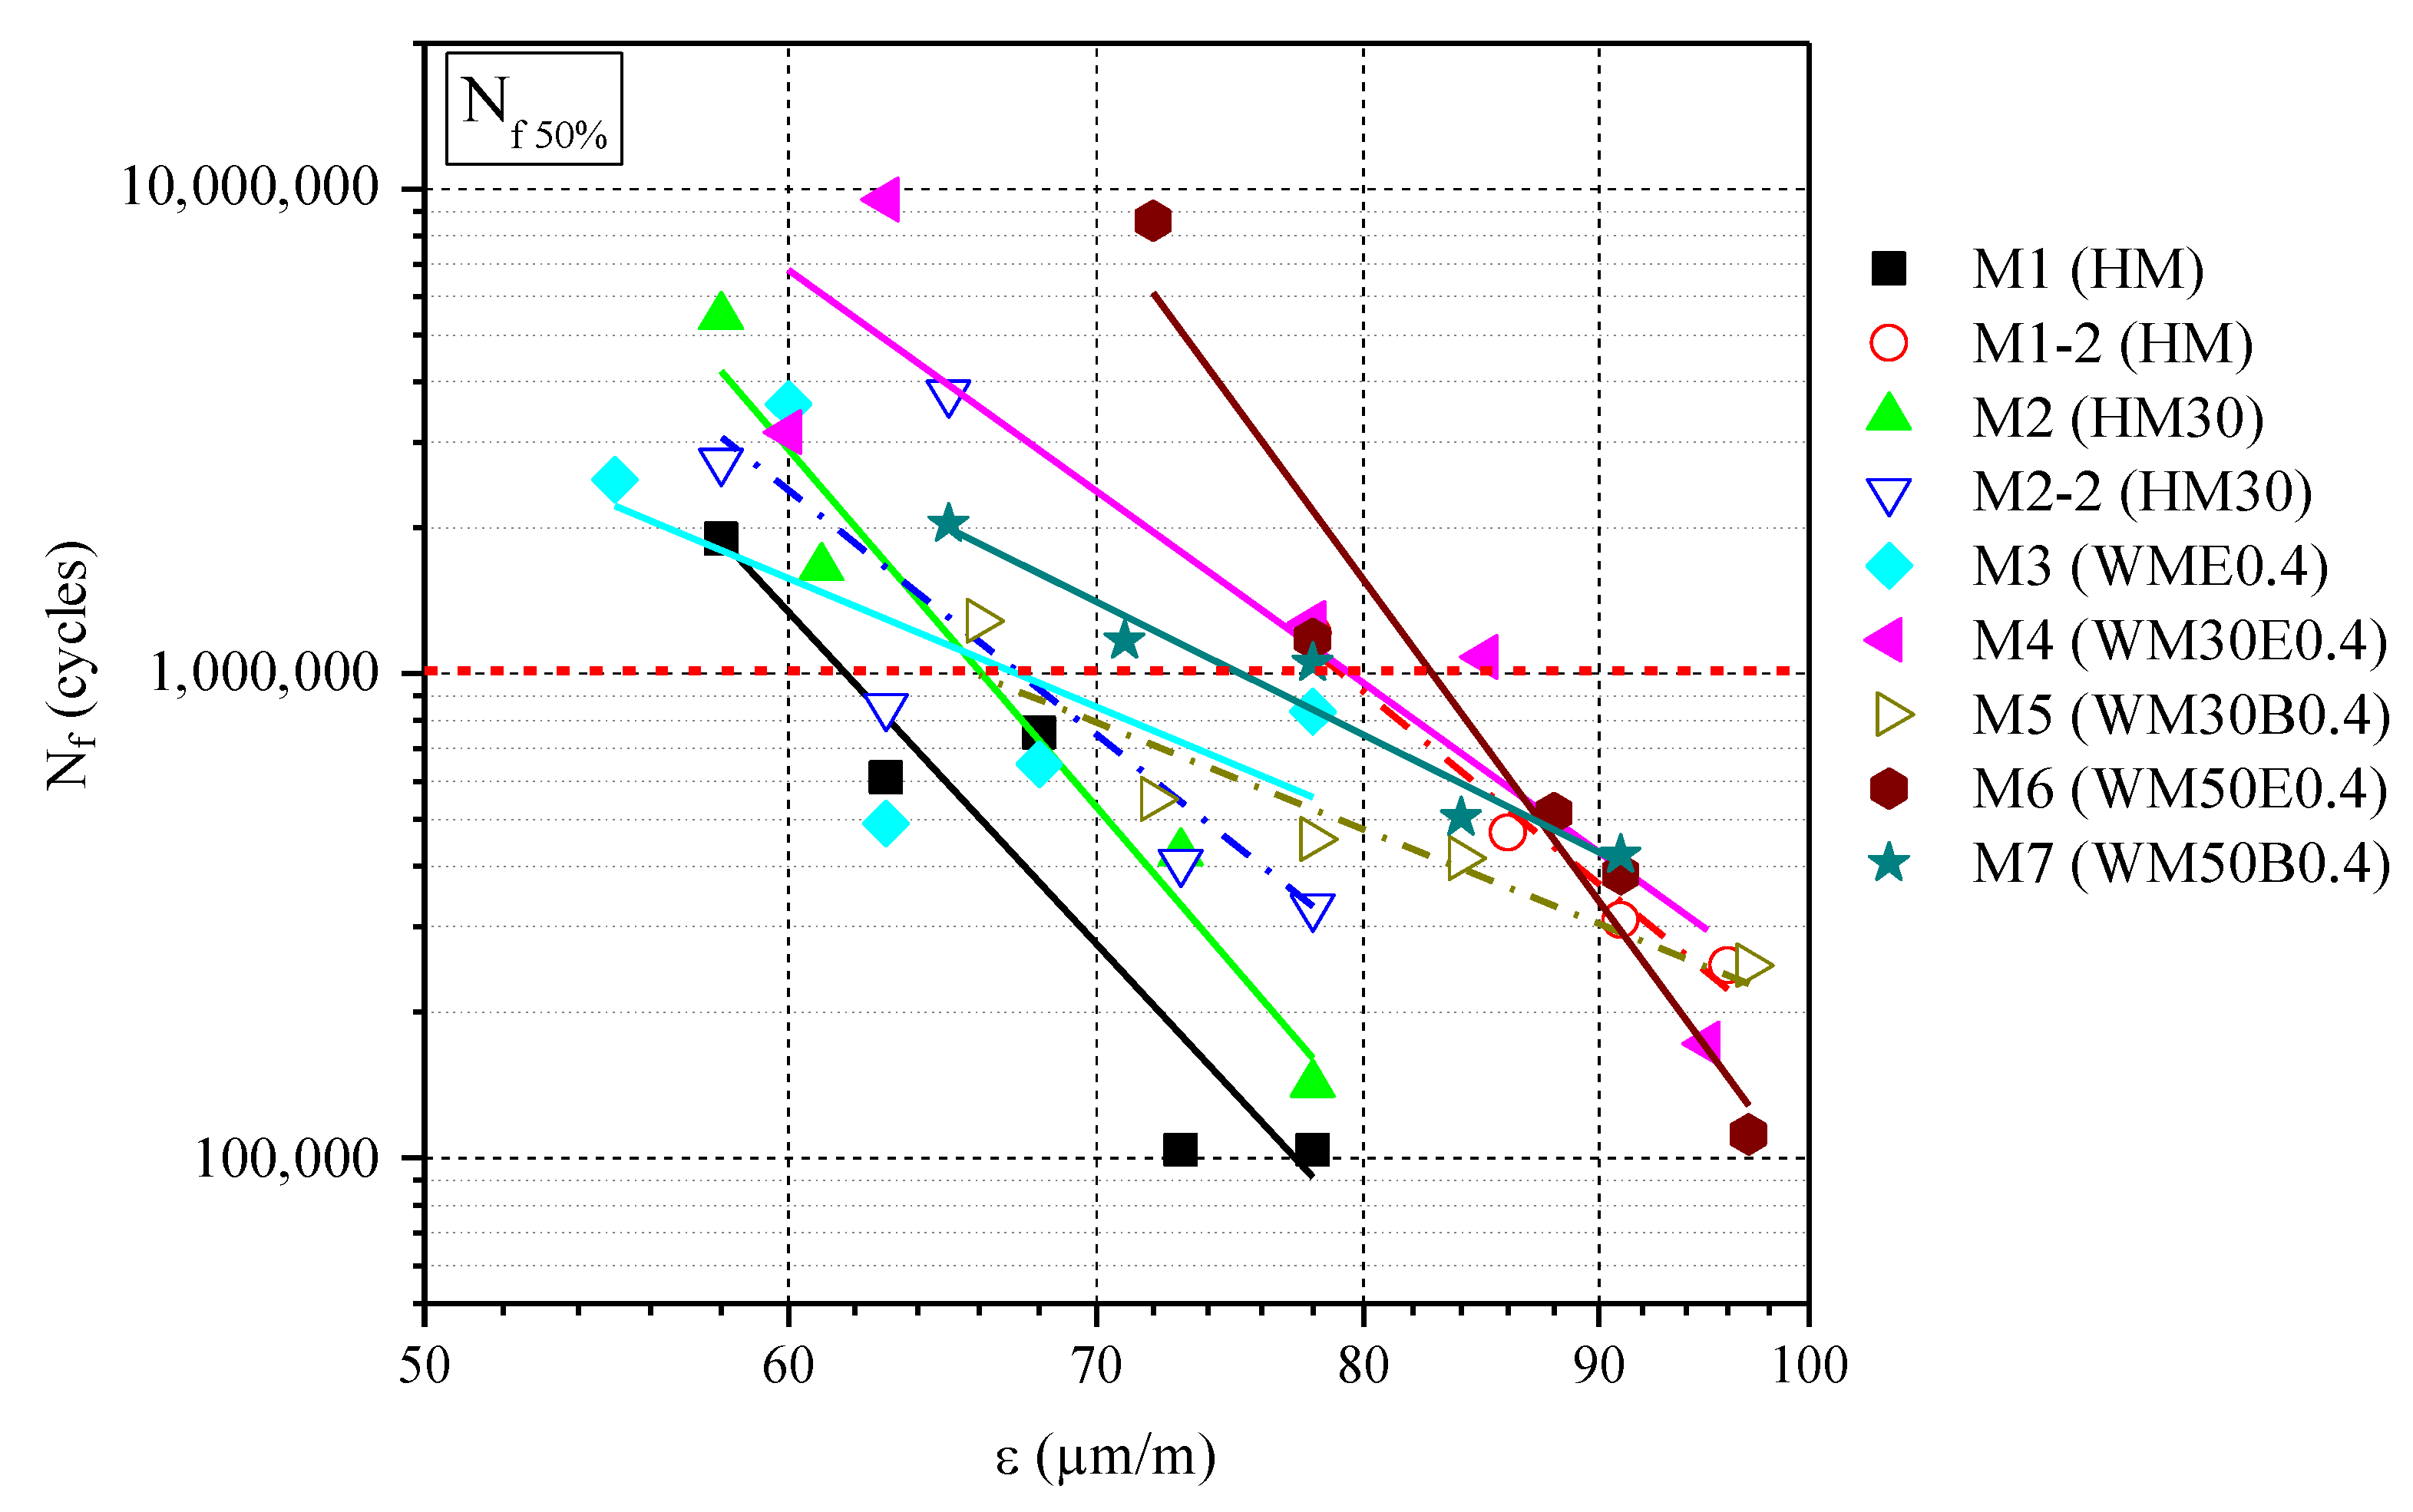
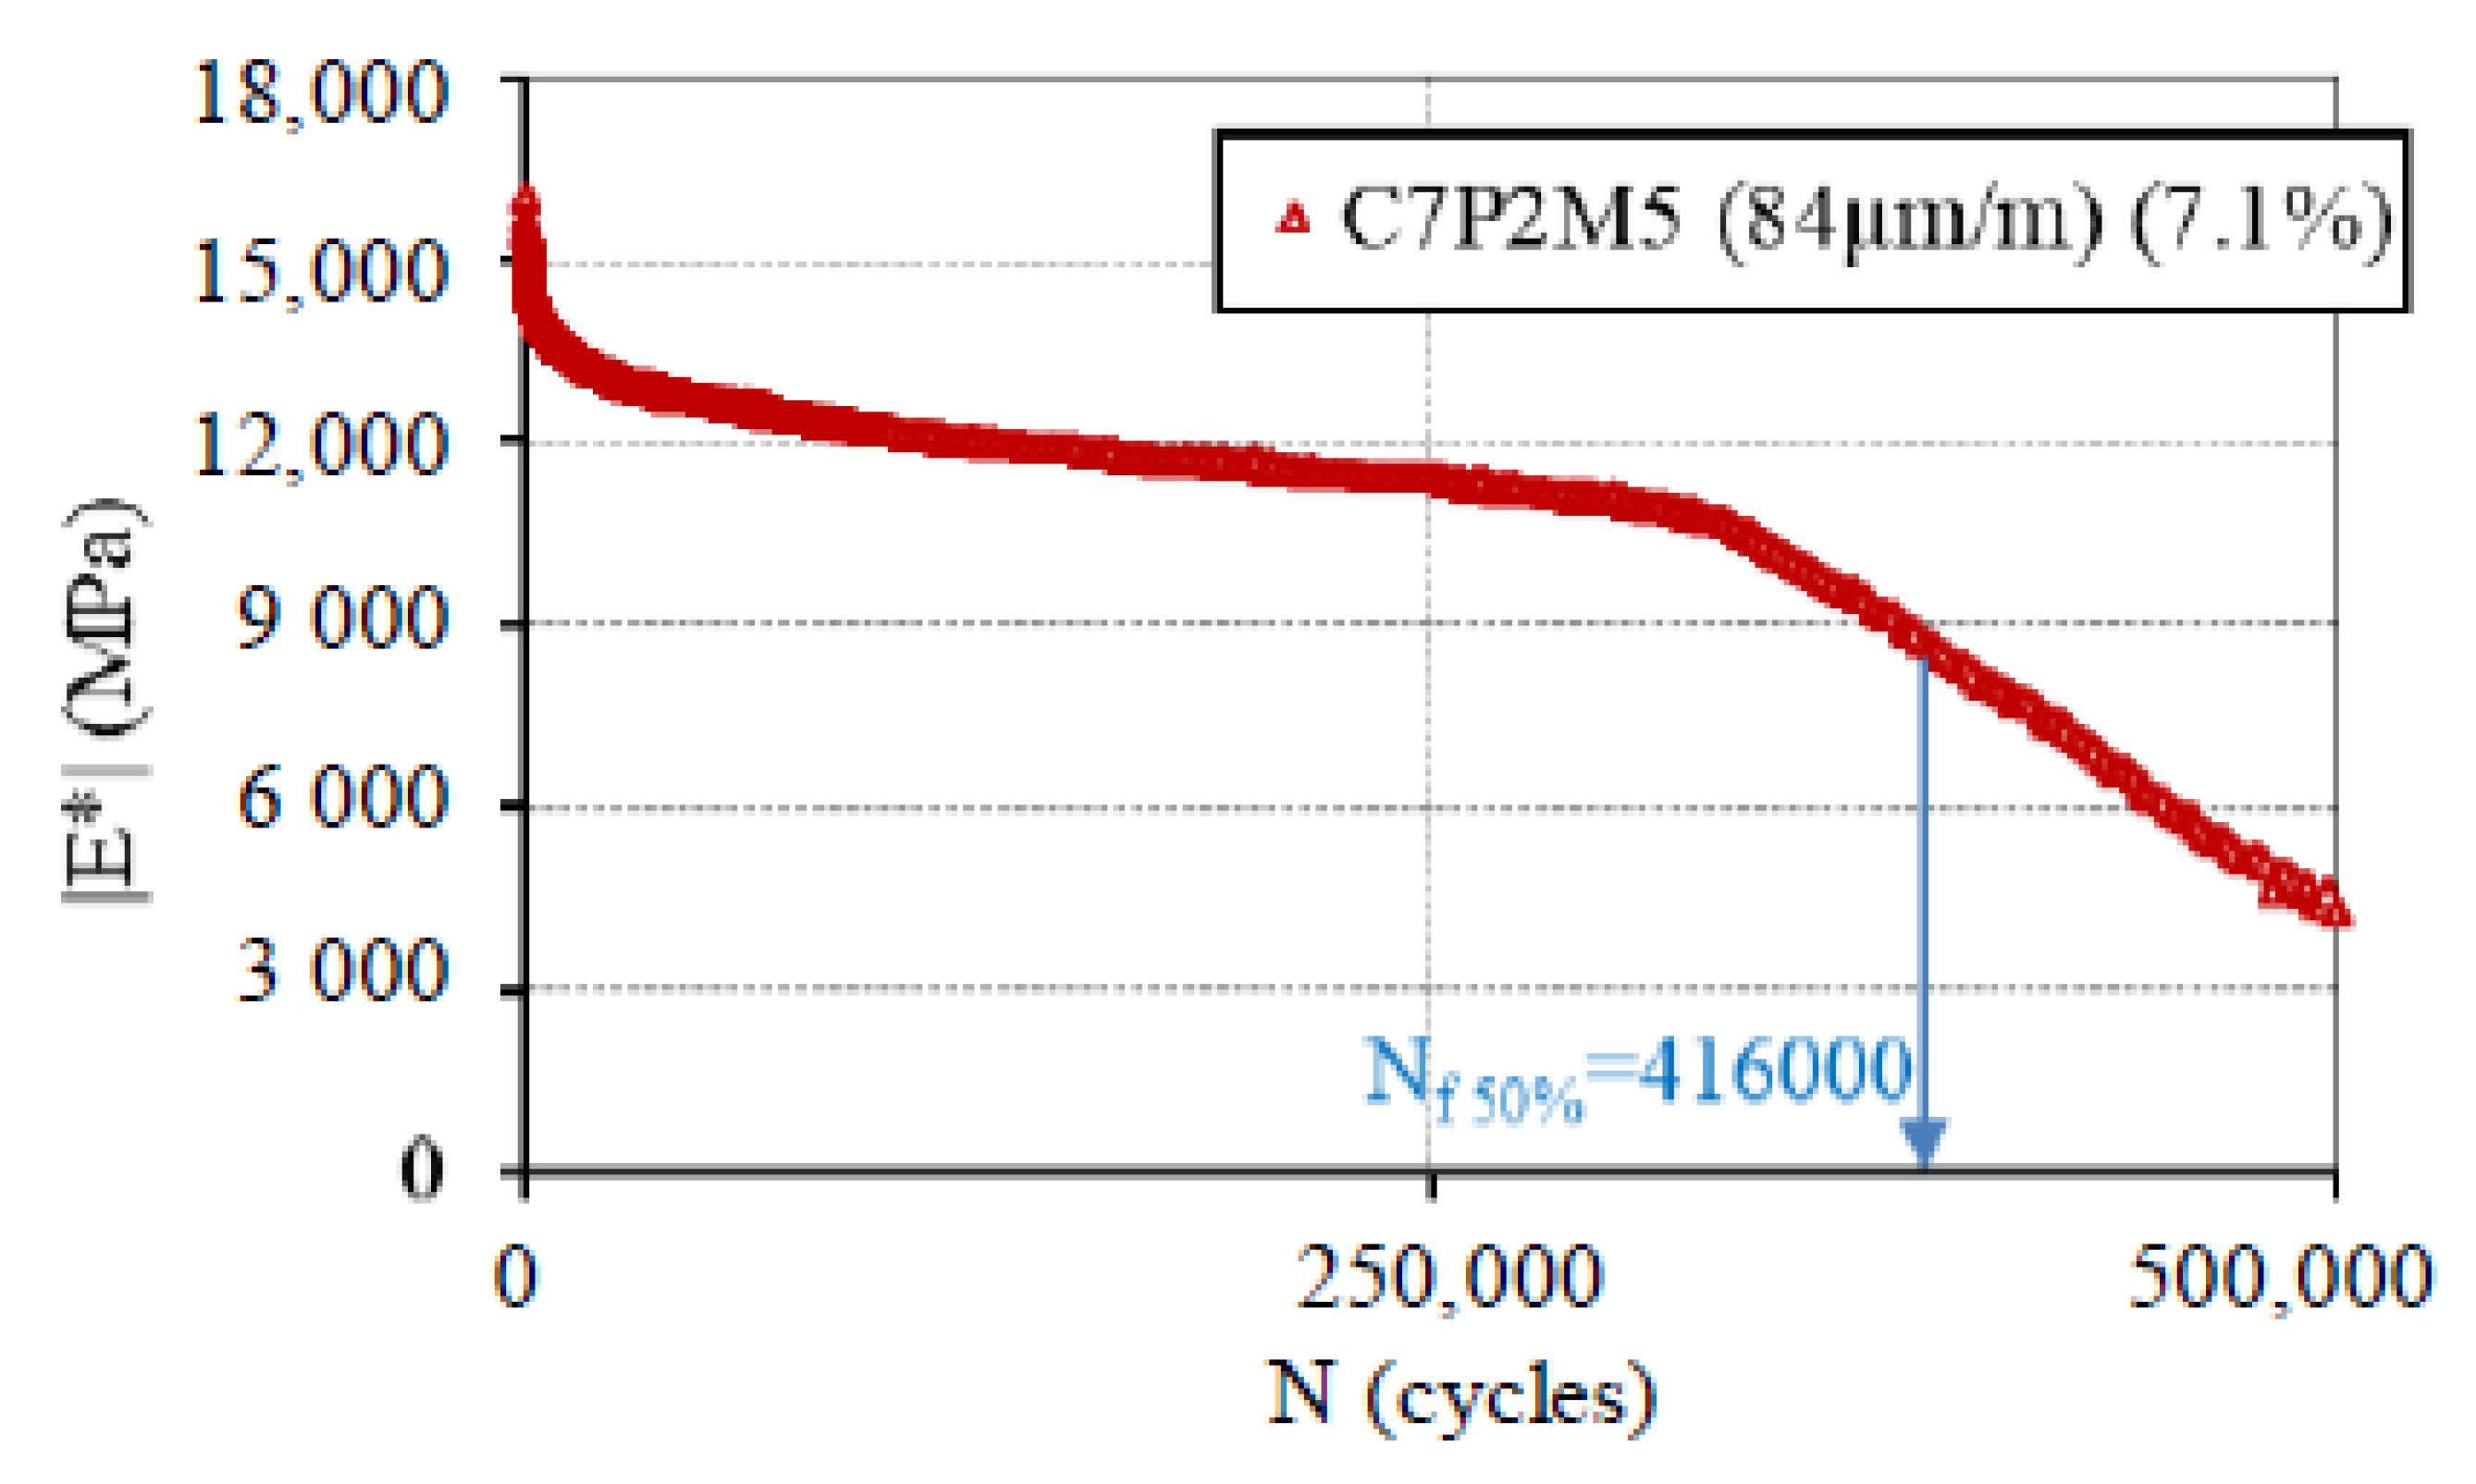
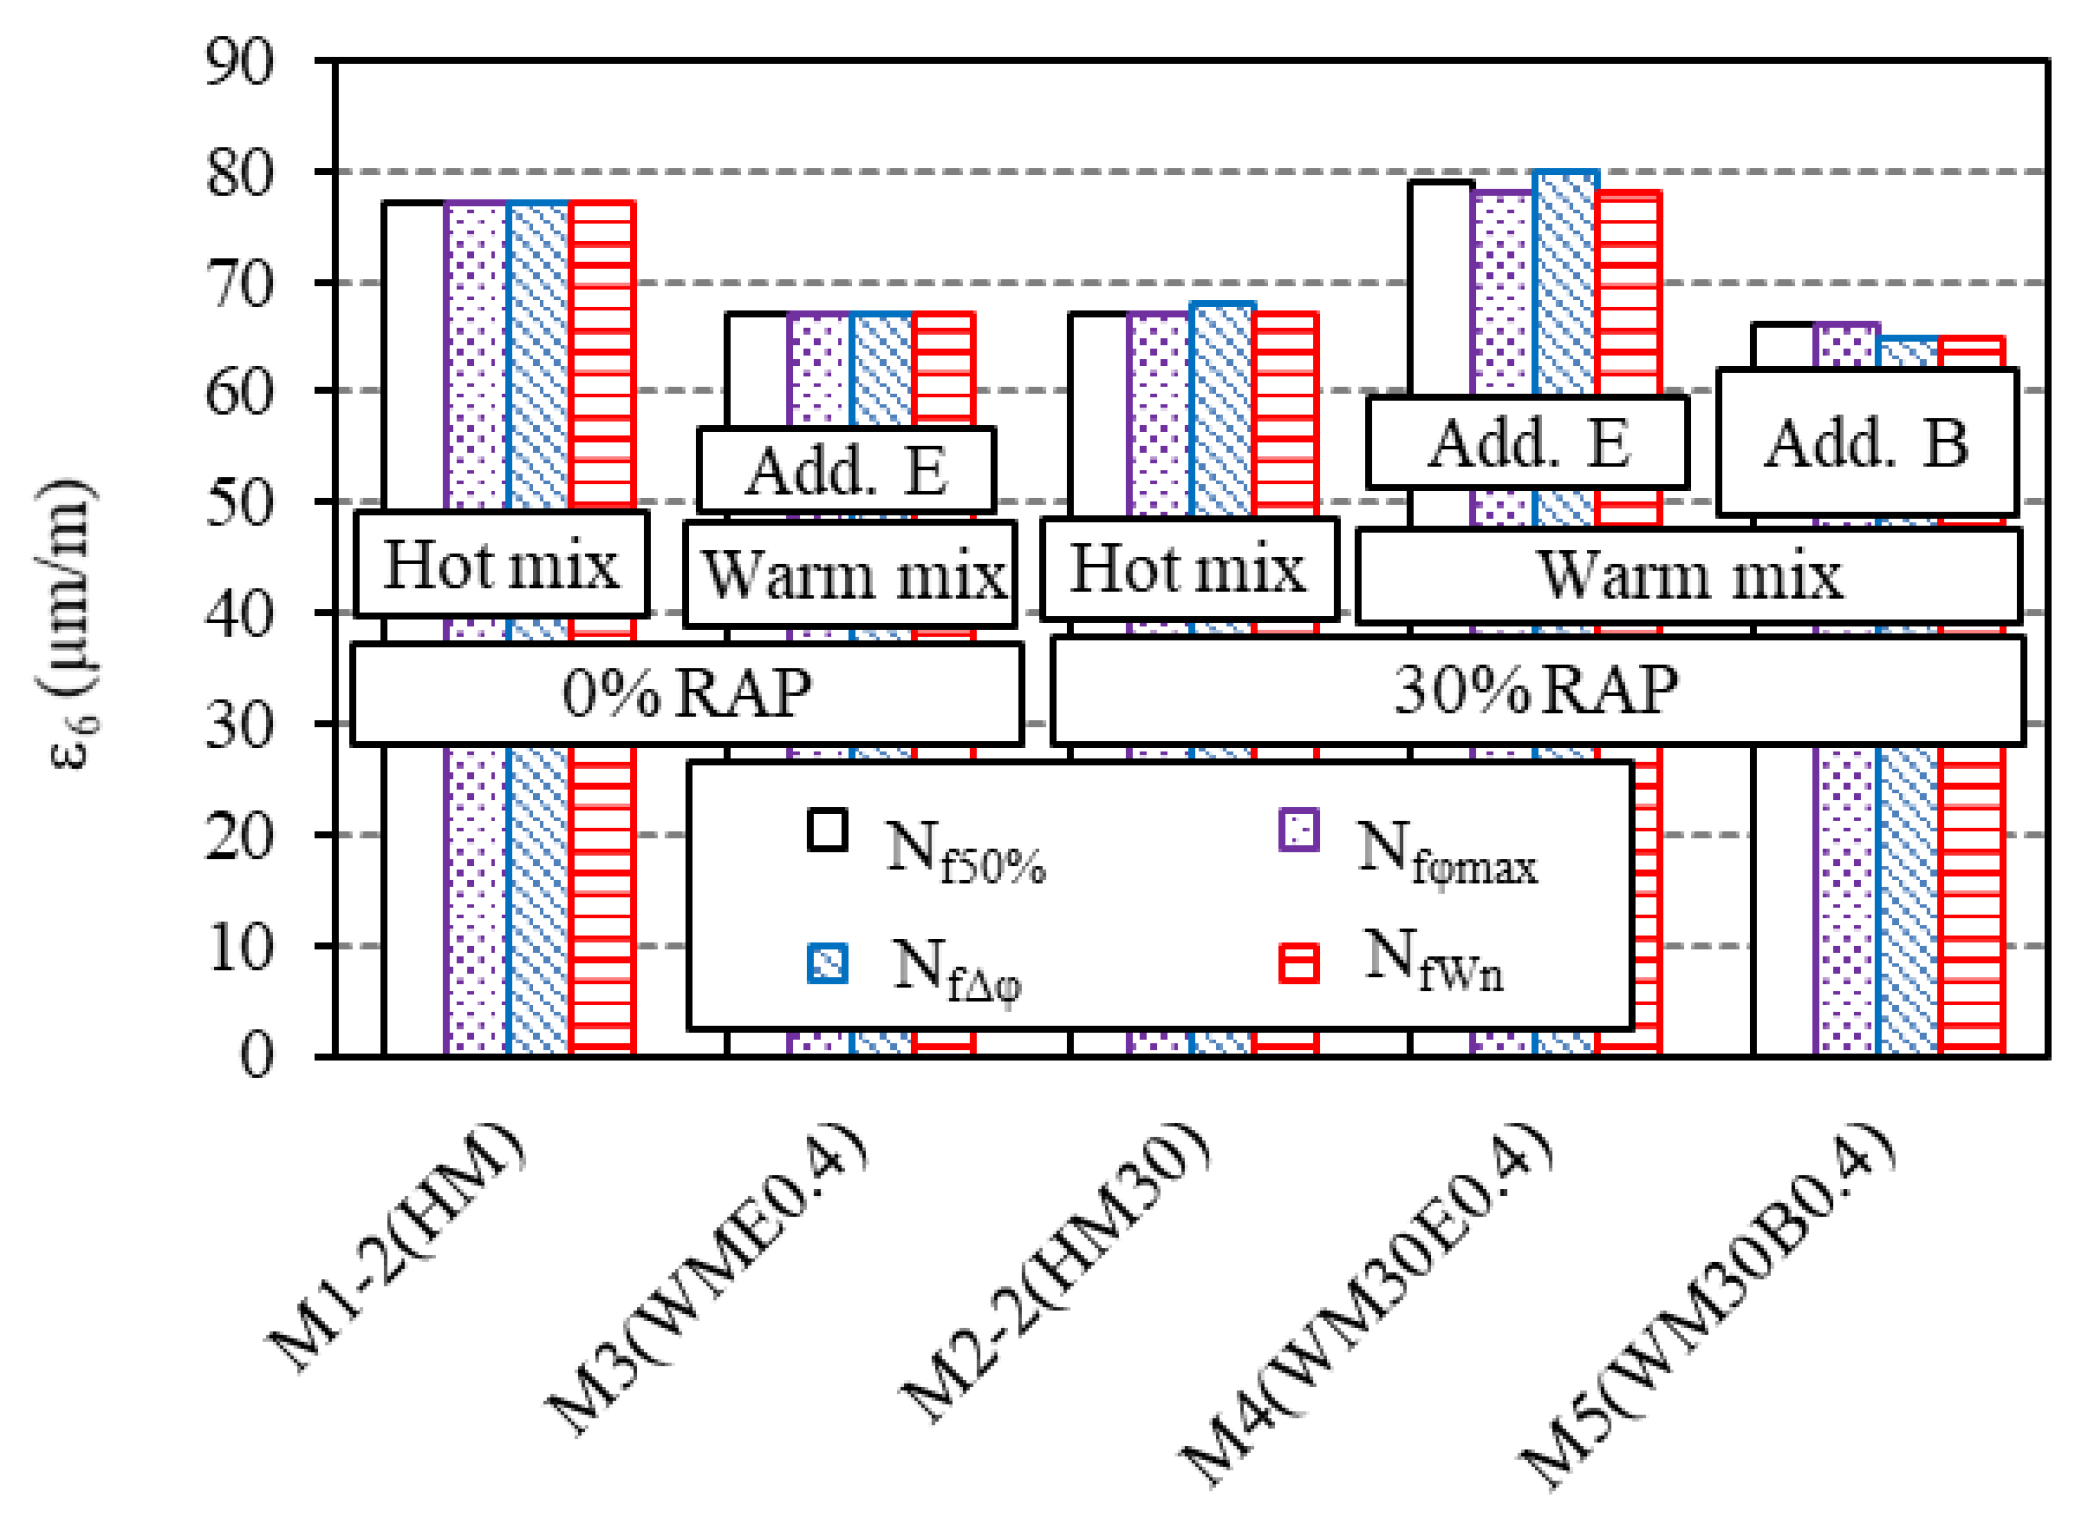
  • Criterion based on modulus decrease: The classical fatigue criterion, used in the French pavement design method, is based on an arbitrary relative decrease in the complex modulus of 50%. The fatigue life (Nf50%) is then defined as the number of cycles when the modulus reaches 50% of its initial value (Figure 6).
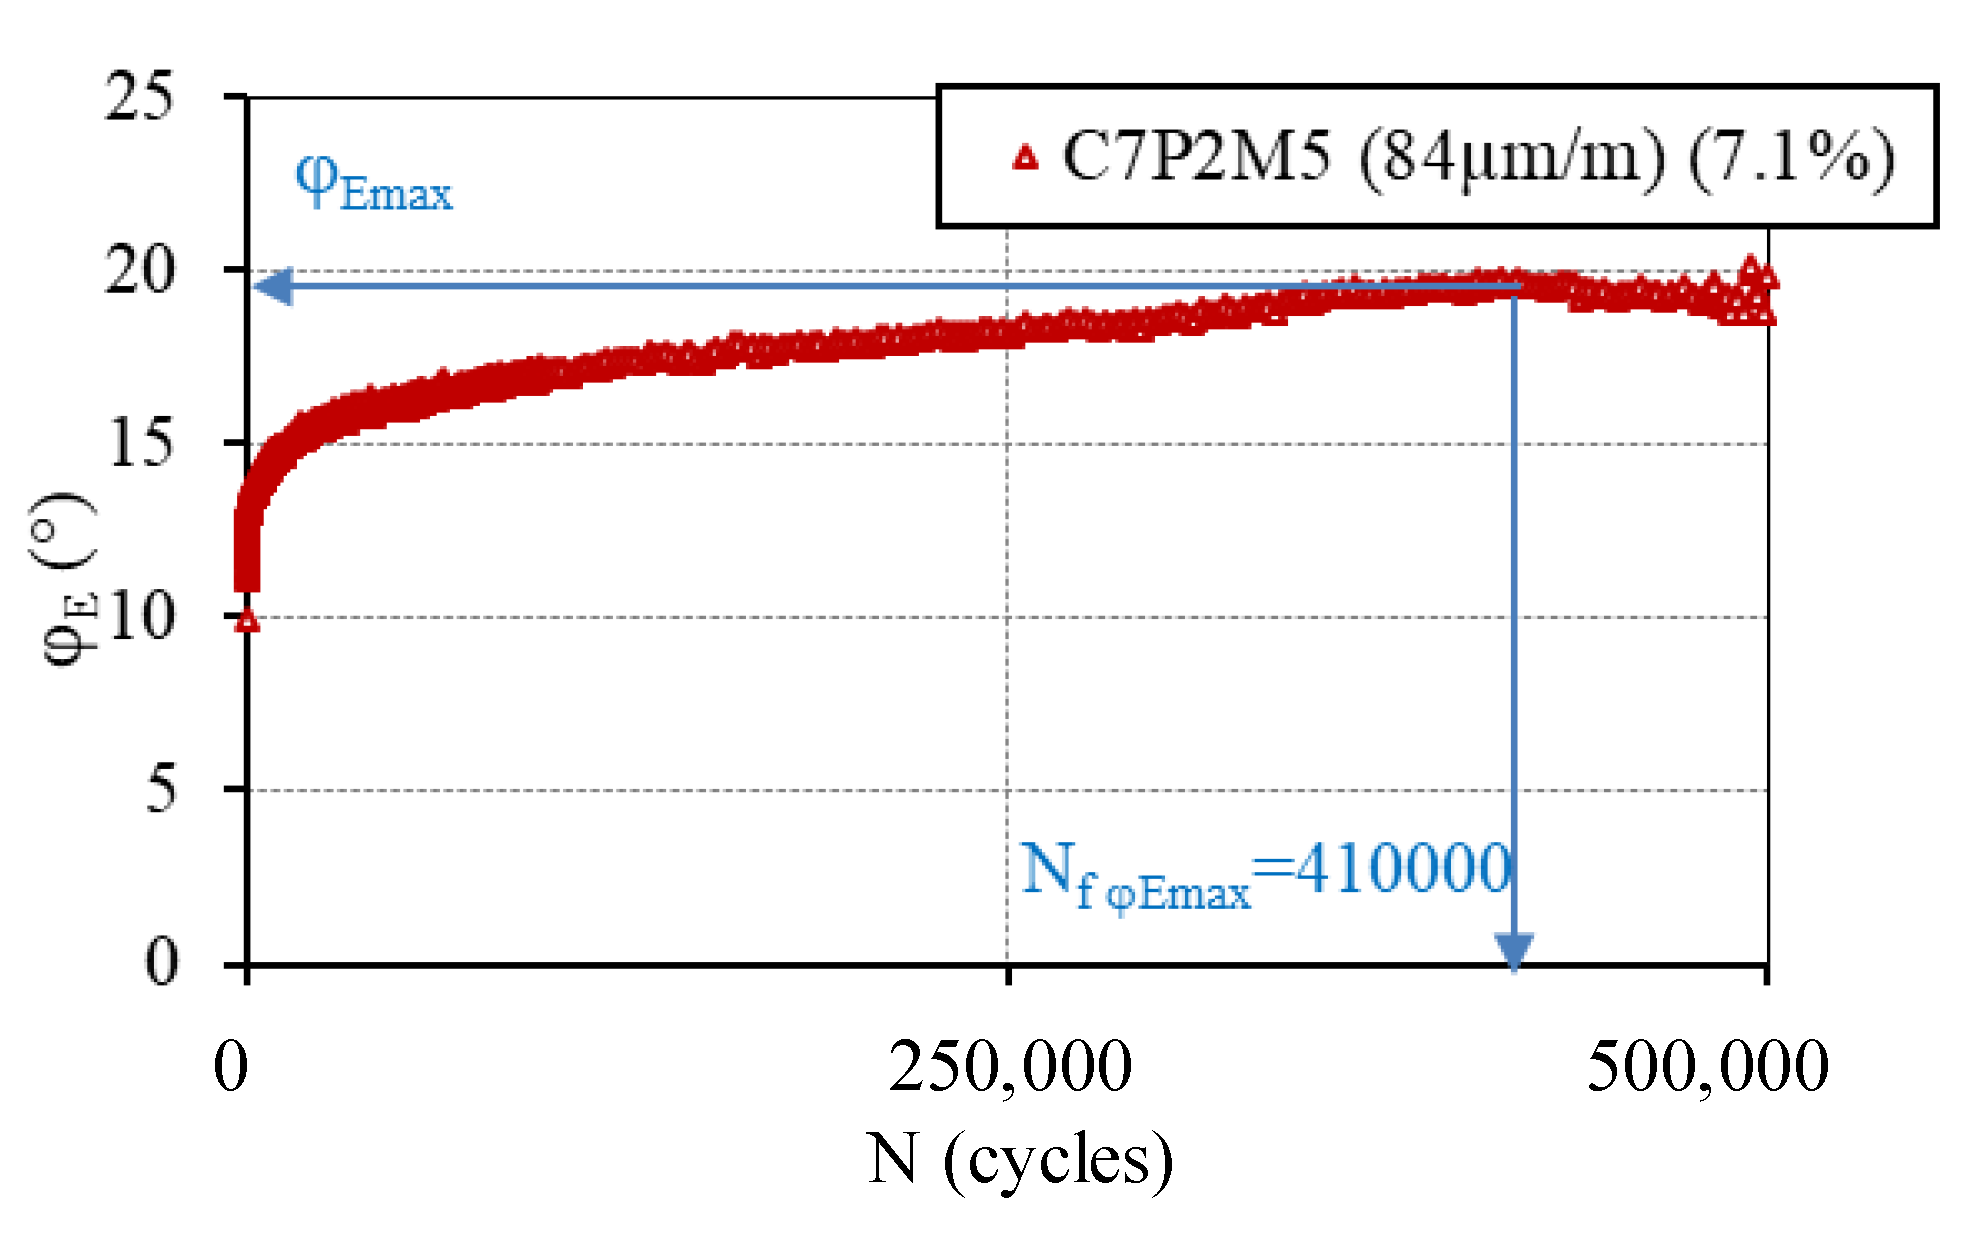
  • Criterion based on the phase angle of the complex modulus evolution: the fatigue life (Nfmaxφ) is defined as the number of cycles corresponding to the highest value of the phase angle (Figure 7).
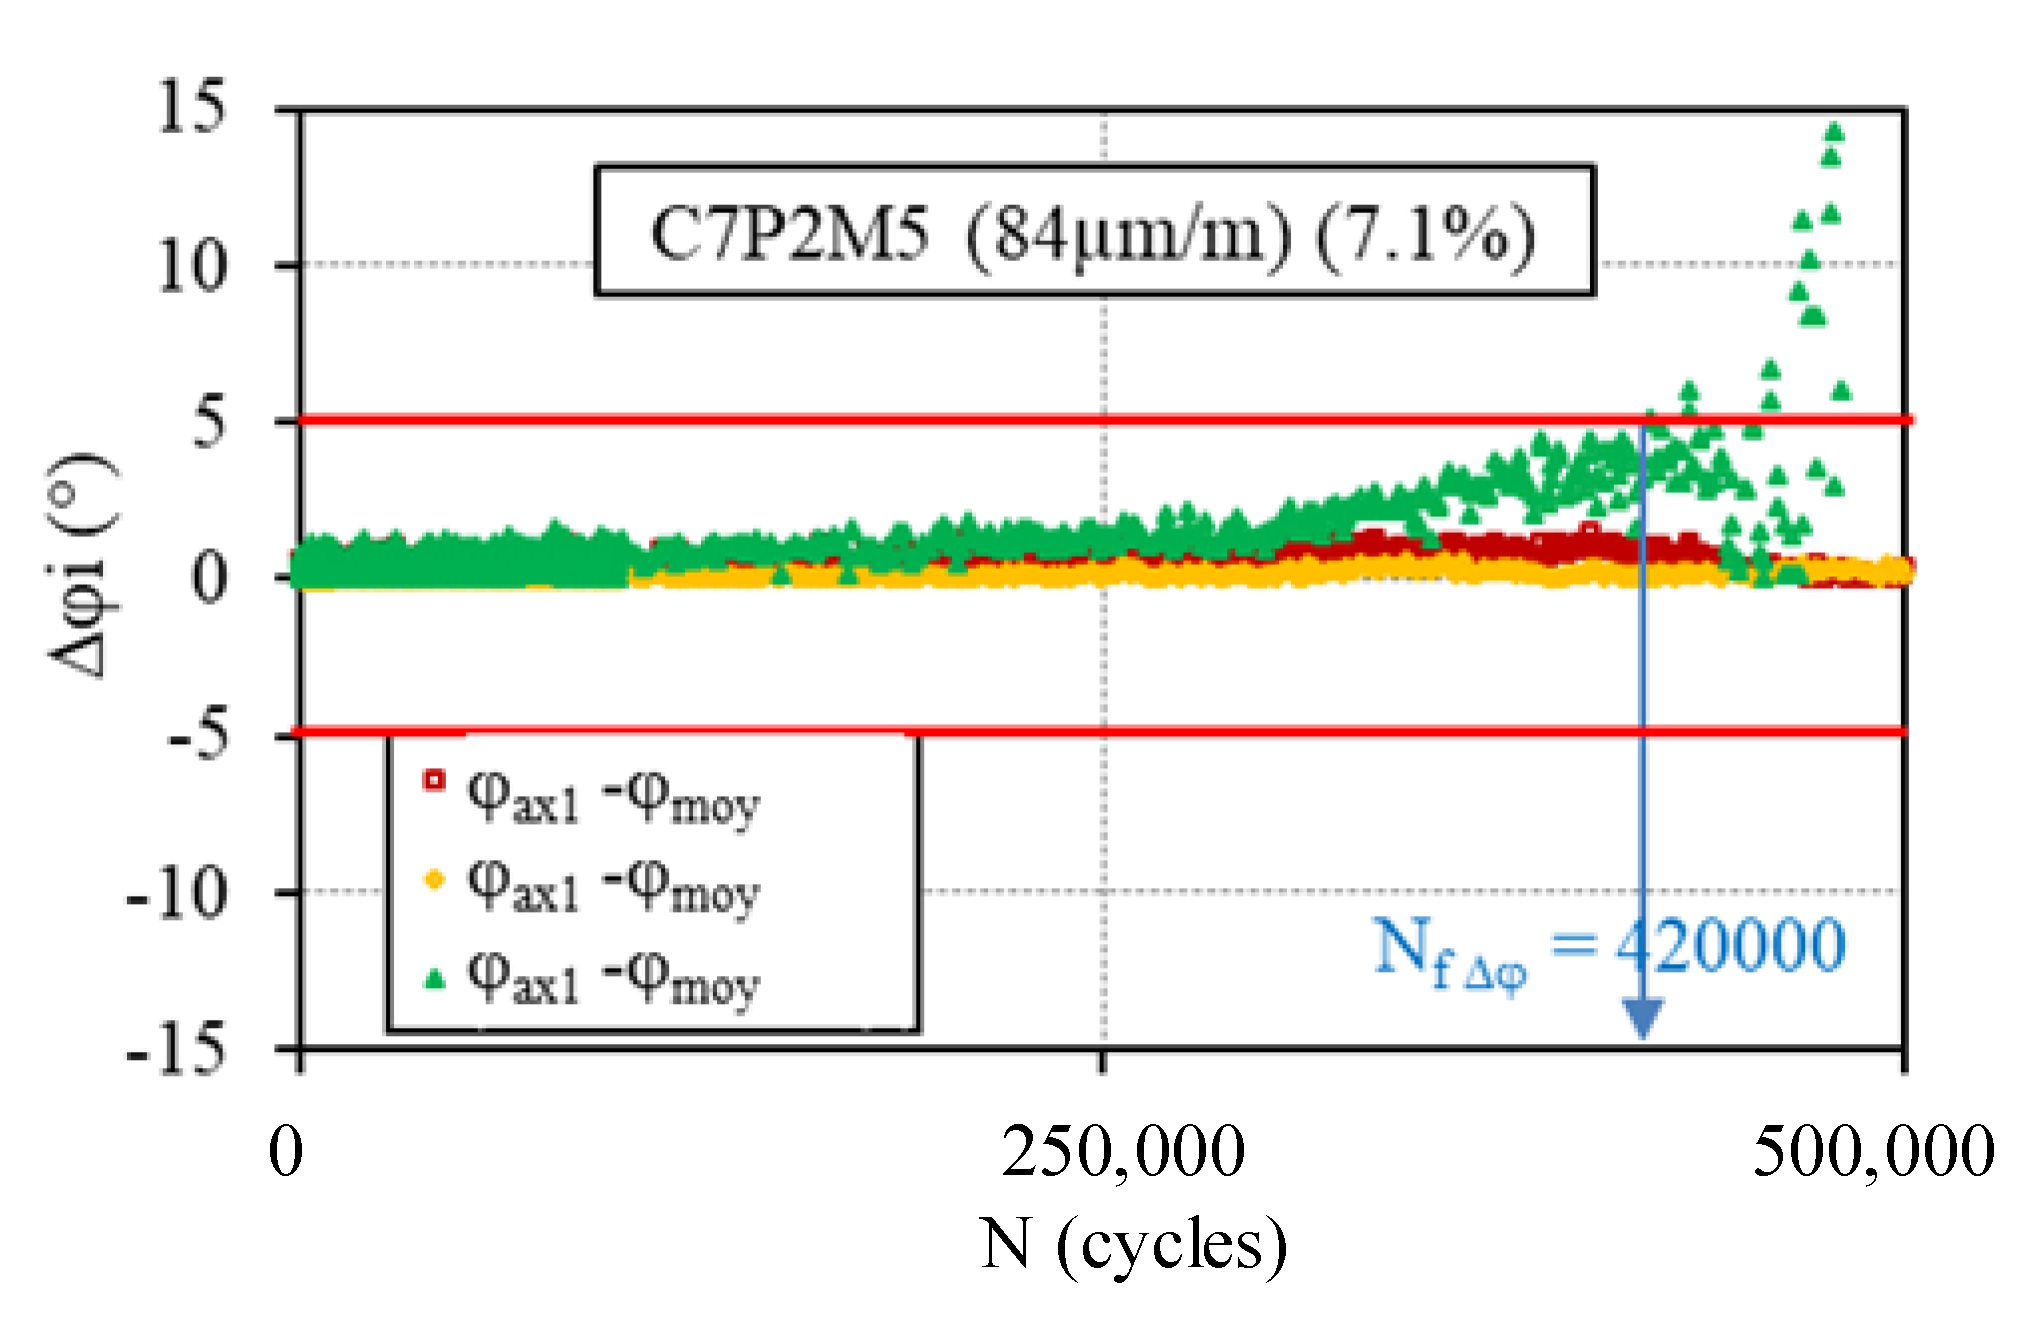
  • Criterion obtained from the analysis of the specimen homogeneity from the phase angles values provided by each of the three axial extensometers φεiax: NfΔφ is defined as the number of cycles at which the value Δφi = φεiax − φE reaches 5° for one of the extensometers (where φεiax is the phase angle between the signal from extensometer i and the axial stress, with i = 1, 2 or 3) (Figure 8).
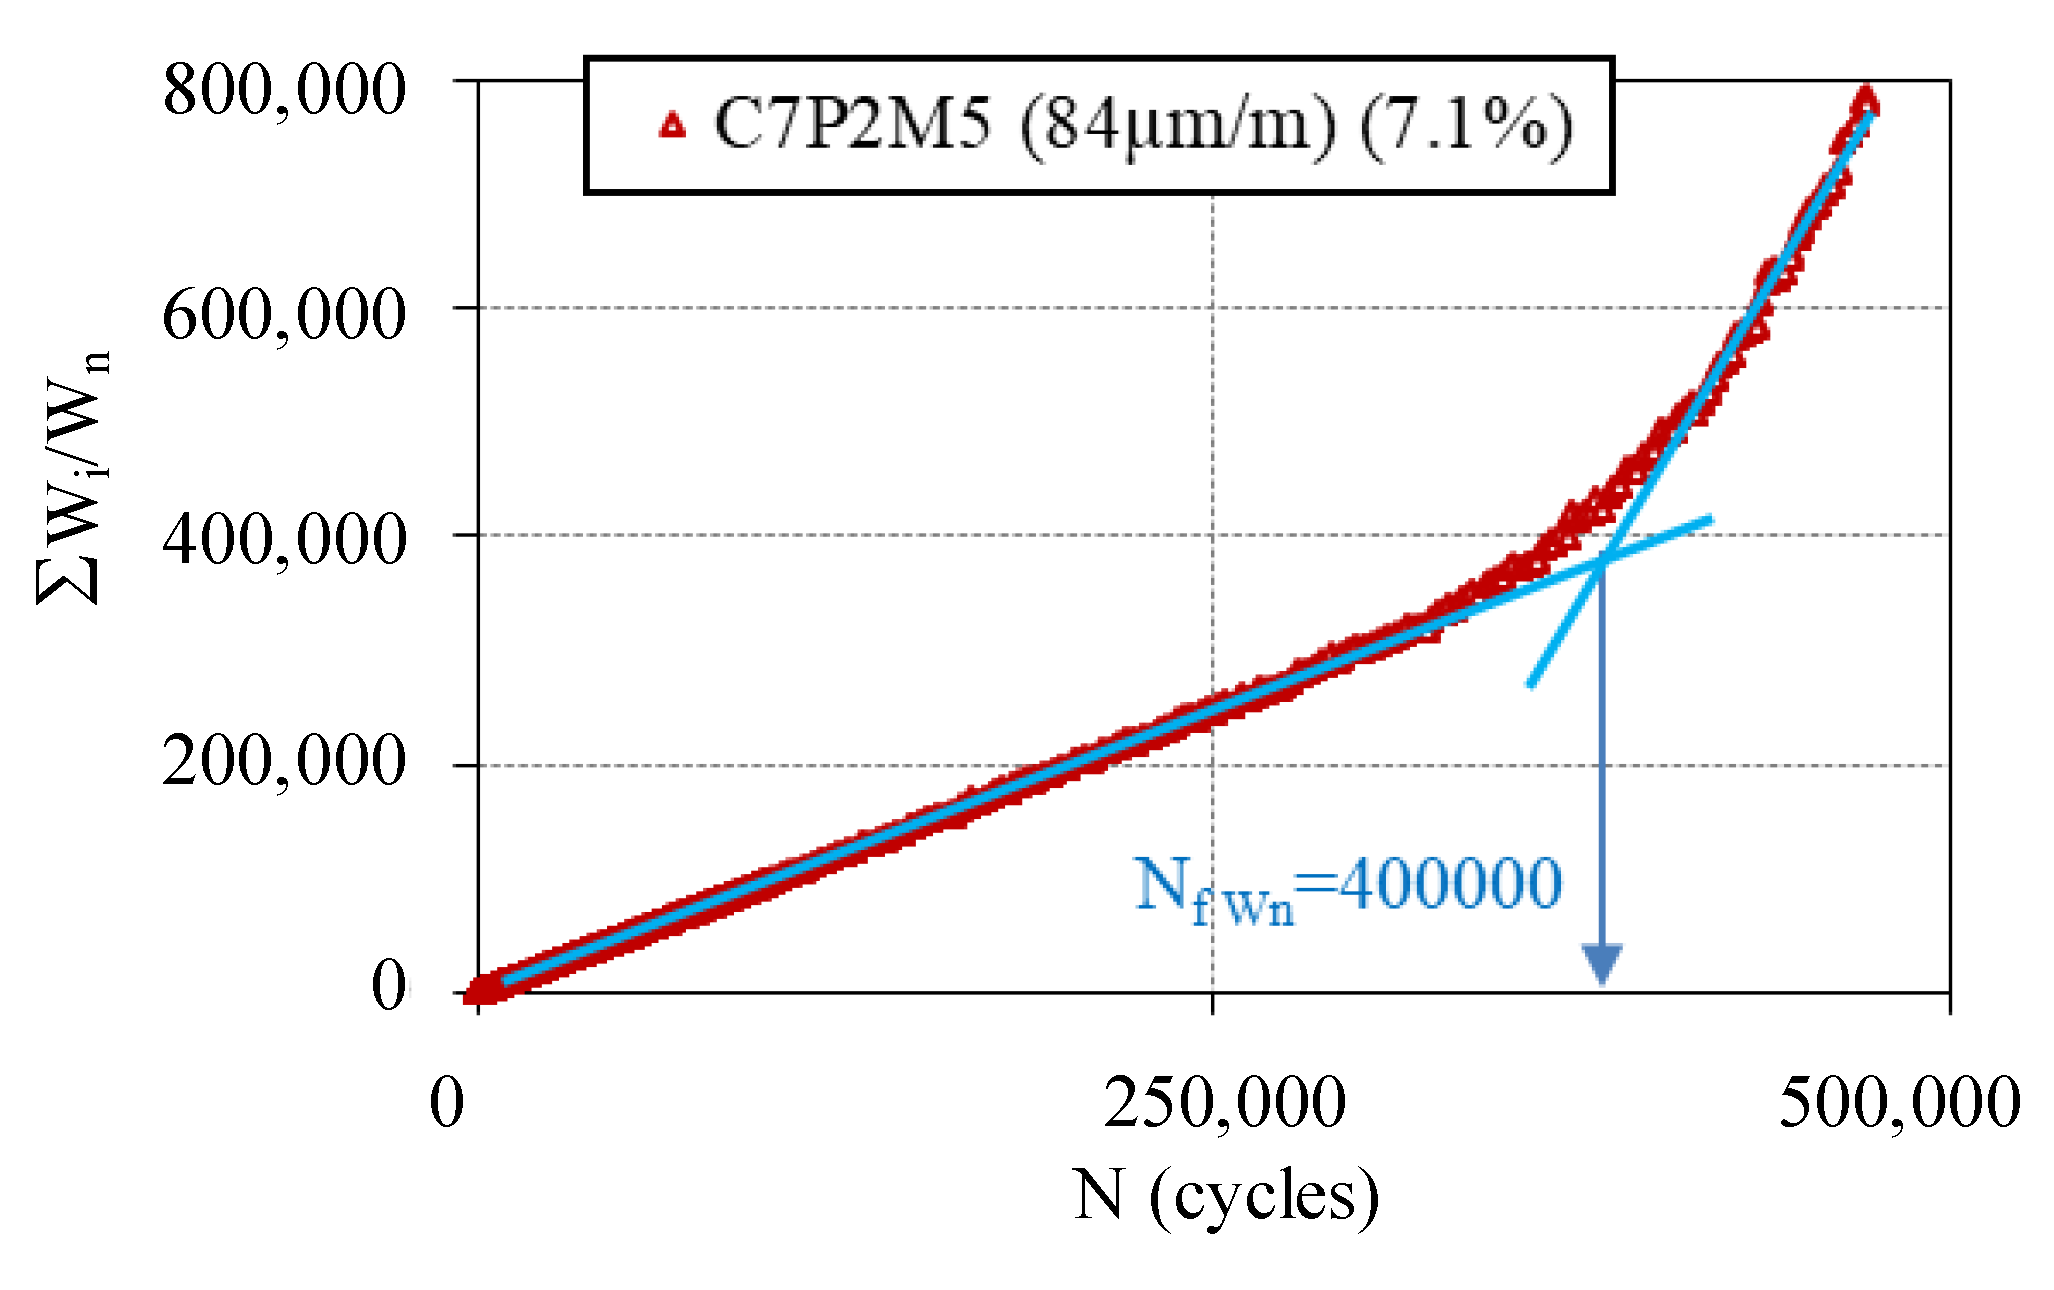
  • Viscous dissipated energy criterion: the fatigue life (NfWN) is obtained from the analyses of the evolution of the dissipated energy ratio, DER, given by Equation (9).
D E R = i = 1 N W i   / W N
where i = 1 N W i is the cumulated dissipated energy up to cycle N and WN is the dissipated energy at cycle N. There are two periods in the evolution of DER (Equation (9)). The evolution appears to be linear in both of the periods, but the slope is higher in the second period. Two straight lines could then be drawn to linearize the evolution of each period. The number of cycles NfWN is obtained at the intersection of the two straight lines (Figure 9).
For the C7P2M5 test, the four criteria give very close results for the fatigue life.

3.3. Wöhler Curves for Tested Materials

The classical Wöhler representation was used: the number of cycles at failure (Nfailure) versus the strain amplitude in logarithmic axes. The Wöhler curves for the bituminous mixtures are classically straight lines. They are defined by Equation (10).
N f 10 6   =   ( ε ε 6 )     1 b
where Nf is the number of cycles at failure; ε is the applied strain amplitude; 1/b is a constant that represents the slope of straight line; and ε6 represents the axial strain amplitude level for which the failure is obtained after one million cycles.
The values of 1/b, ε6 and the determination coefficient R2 for each criterion and for the nine bituminous mixtures are given in Table A2 (Appendix A). A comparison of the Wölher curves for the nine tested bituminous mixtures, determined with the criterion Nf50%, is presented in Figure 10. The parameter ε6, determined with the four considered criteria, was used to analyse the influence of the bituminous mixtures’ characteristics. It should be mentioned that no significant difference appeared between the considered criteria, as shown in the following.

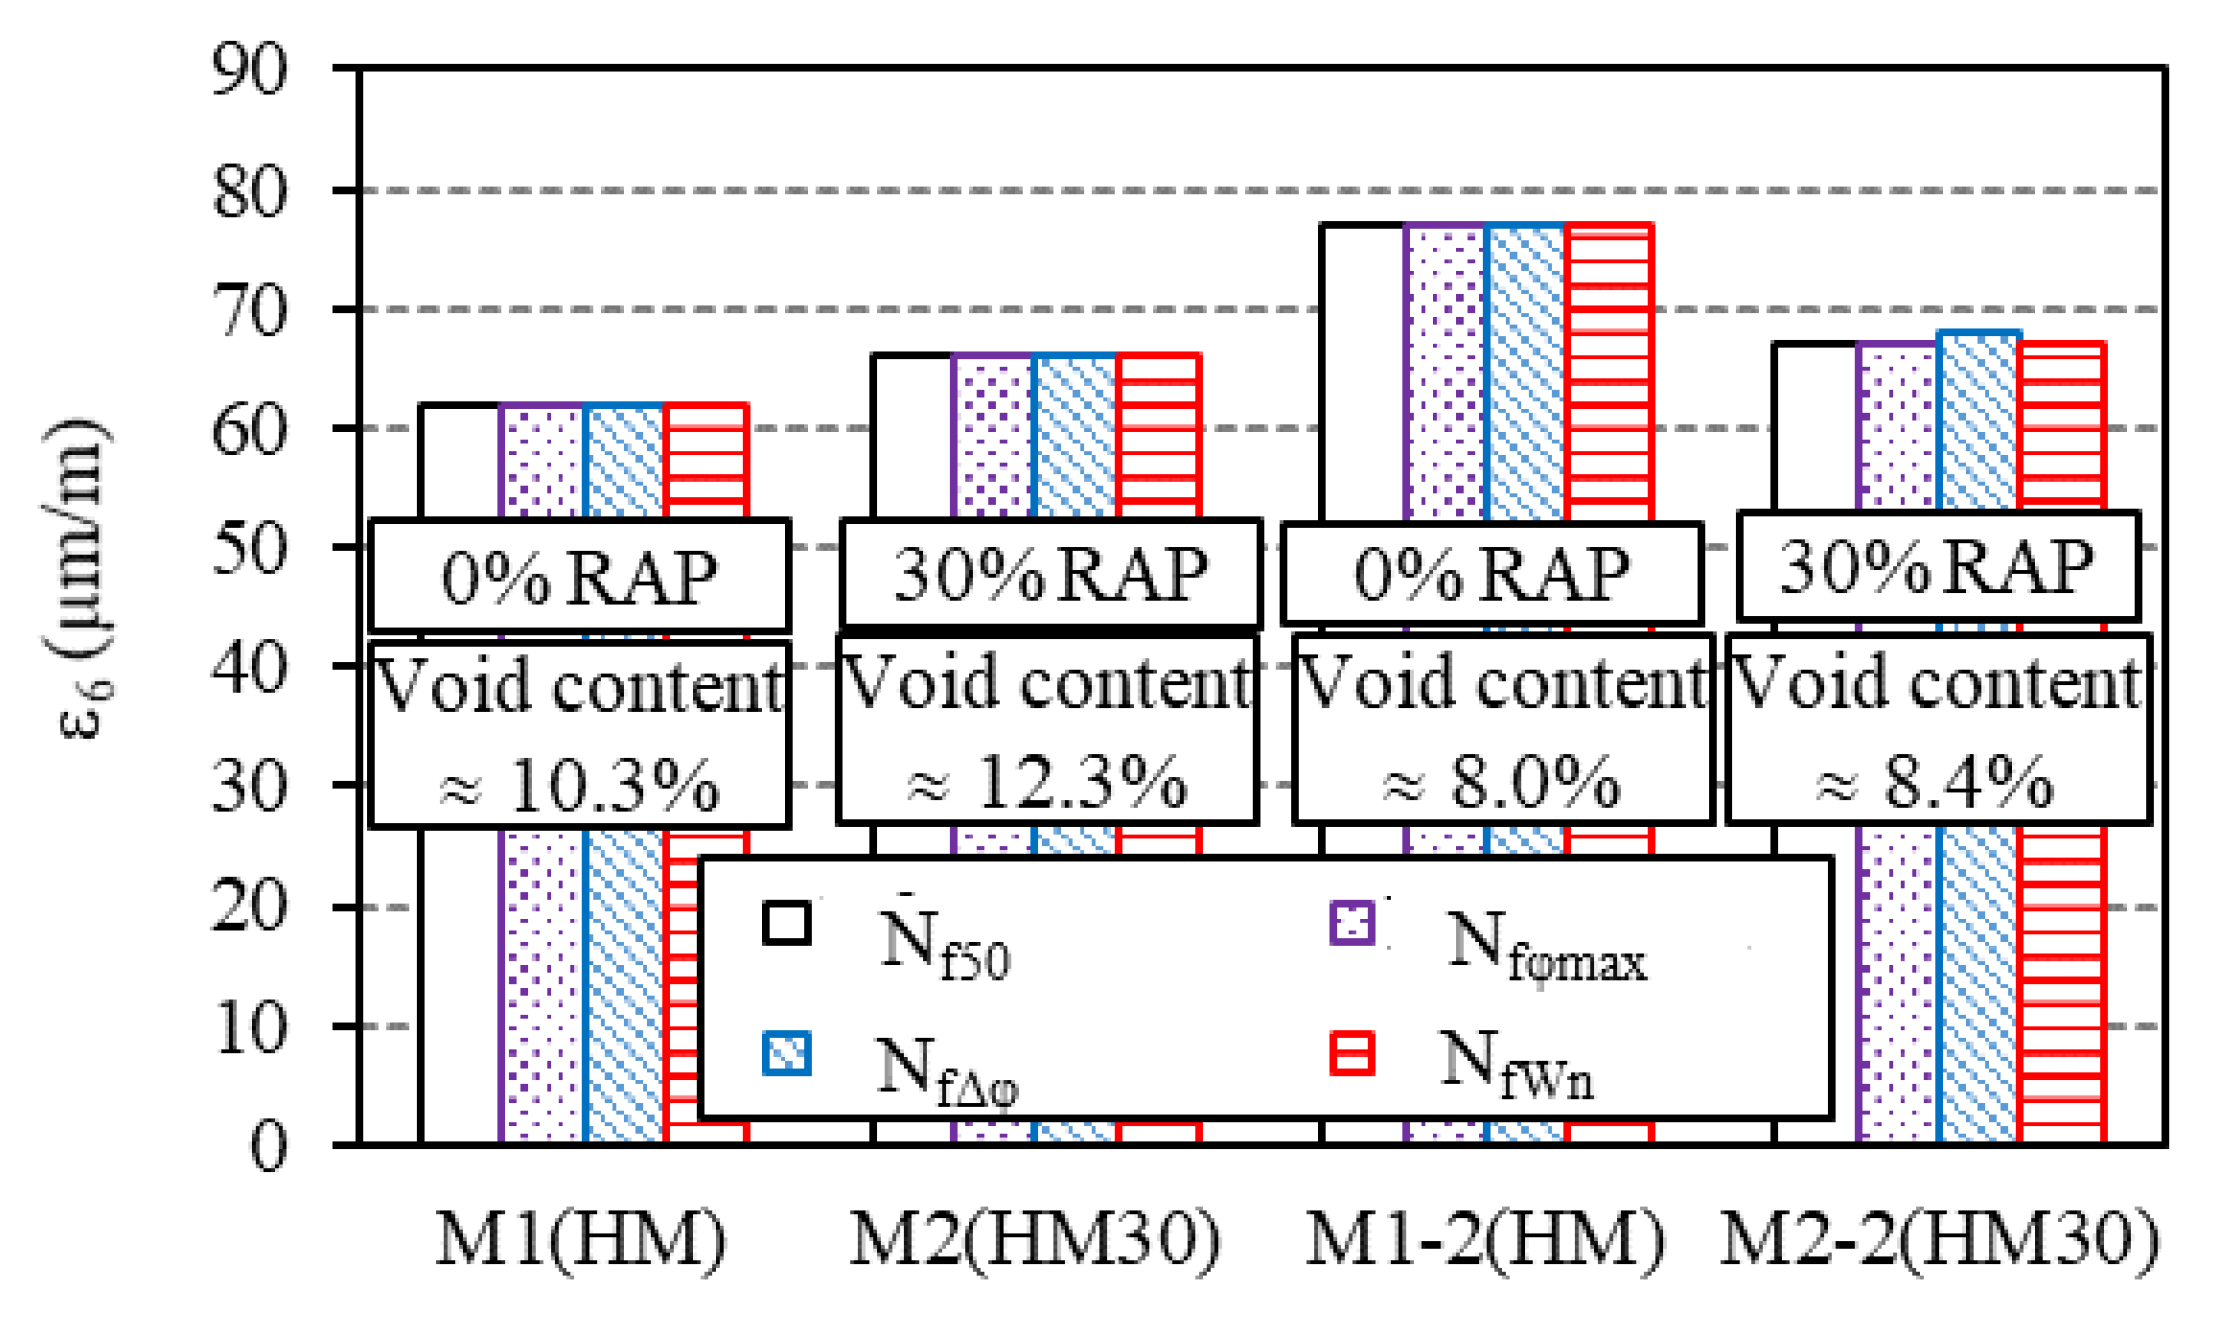
3.4. Influence of Mix Design and Void Content on ε6

3.4.1. Influence of Voids Content

Hot bituminous mixtures HM and HM30 were produced with two different air void contents (resulting in M1 and M1-2, and in M2 and M2-2 materials). M1 and M2 are the materials with a higher air void content. The ε6 value is higher for material M1-2 (M2-2, respectively) than for material M1 (M2, respectively): 77 µm/m against 62 µm/m (67 µm/m against 66 µm/m, respectively) (Figure 11). It may therefore be concluded that an increase of the void content resulted in a decrease of ε6. This result is not new, but it is confirmed from our experimental campaign.

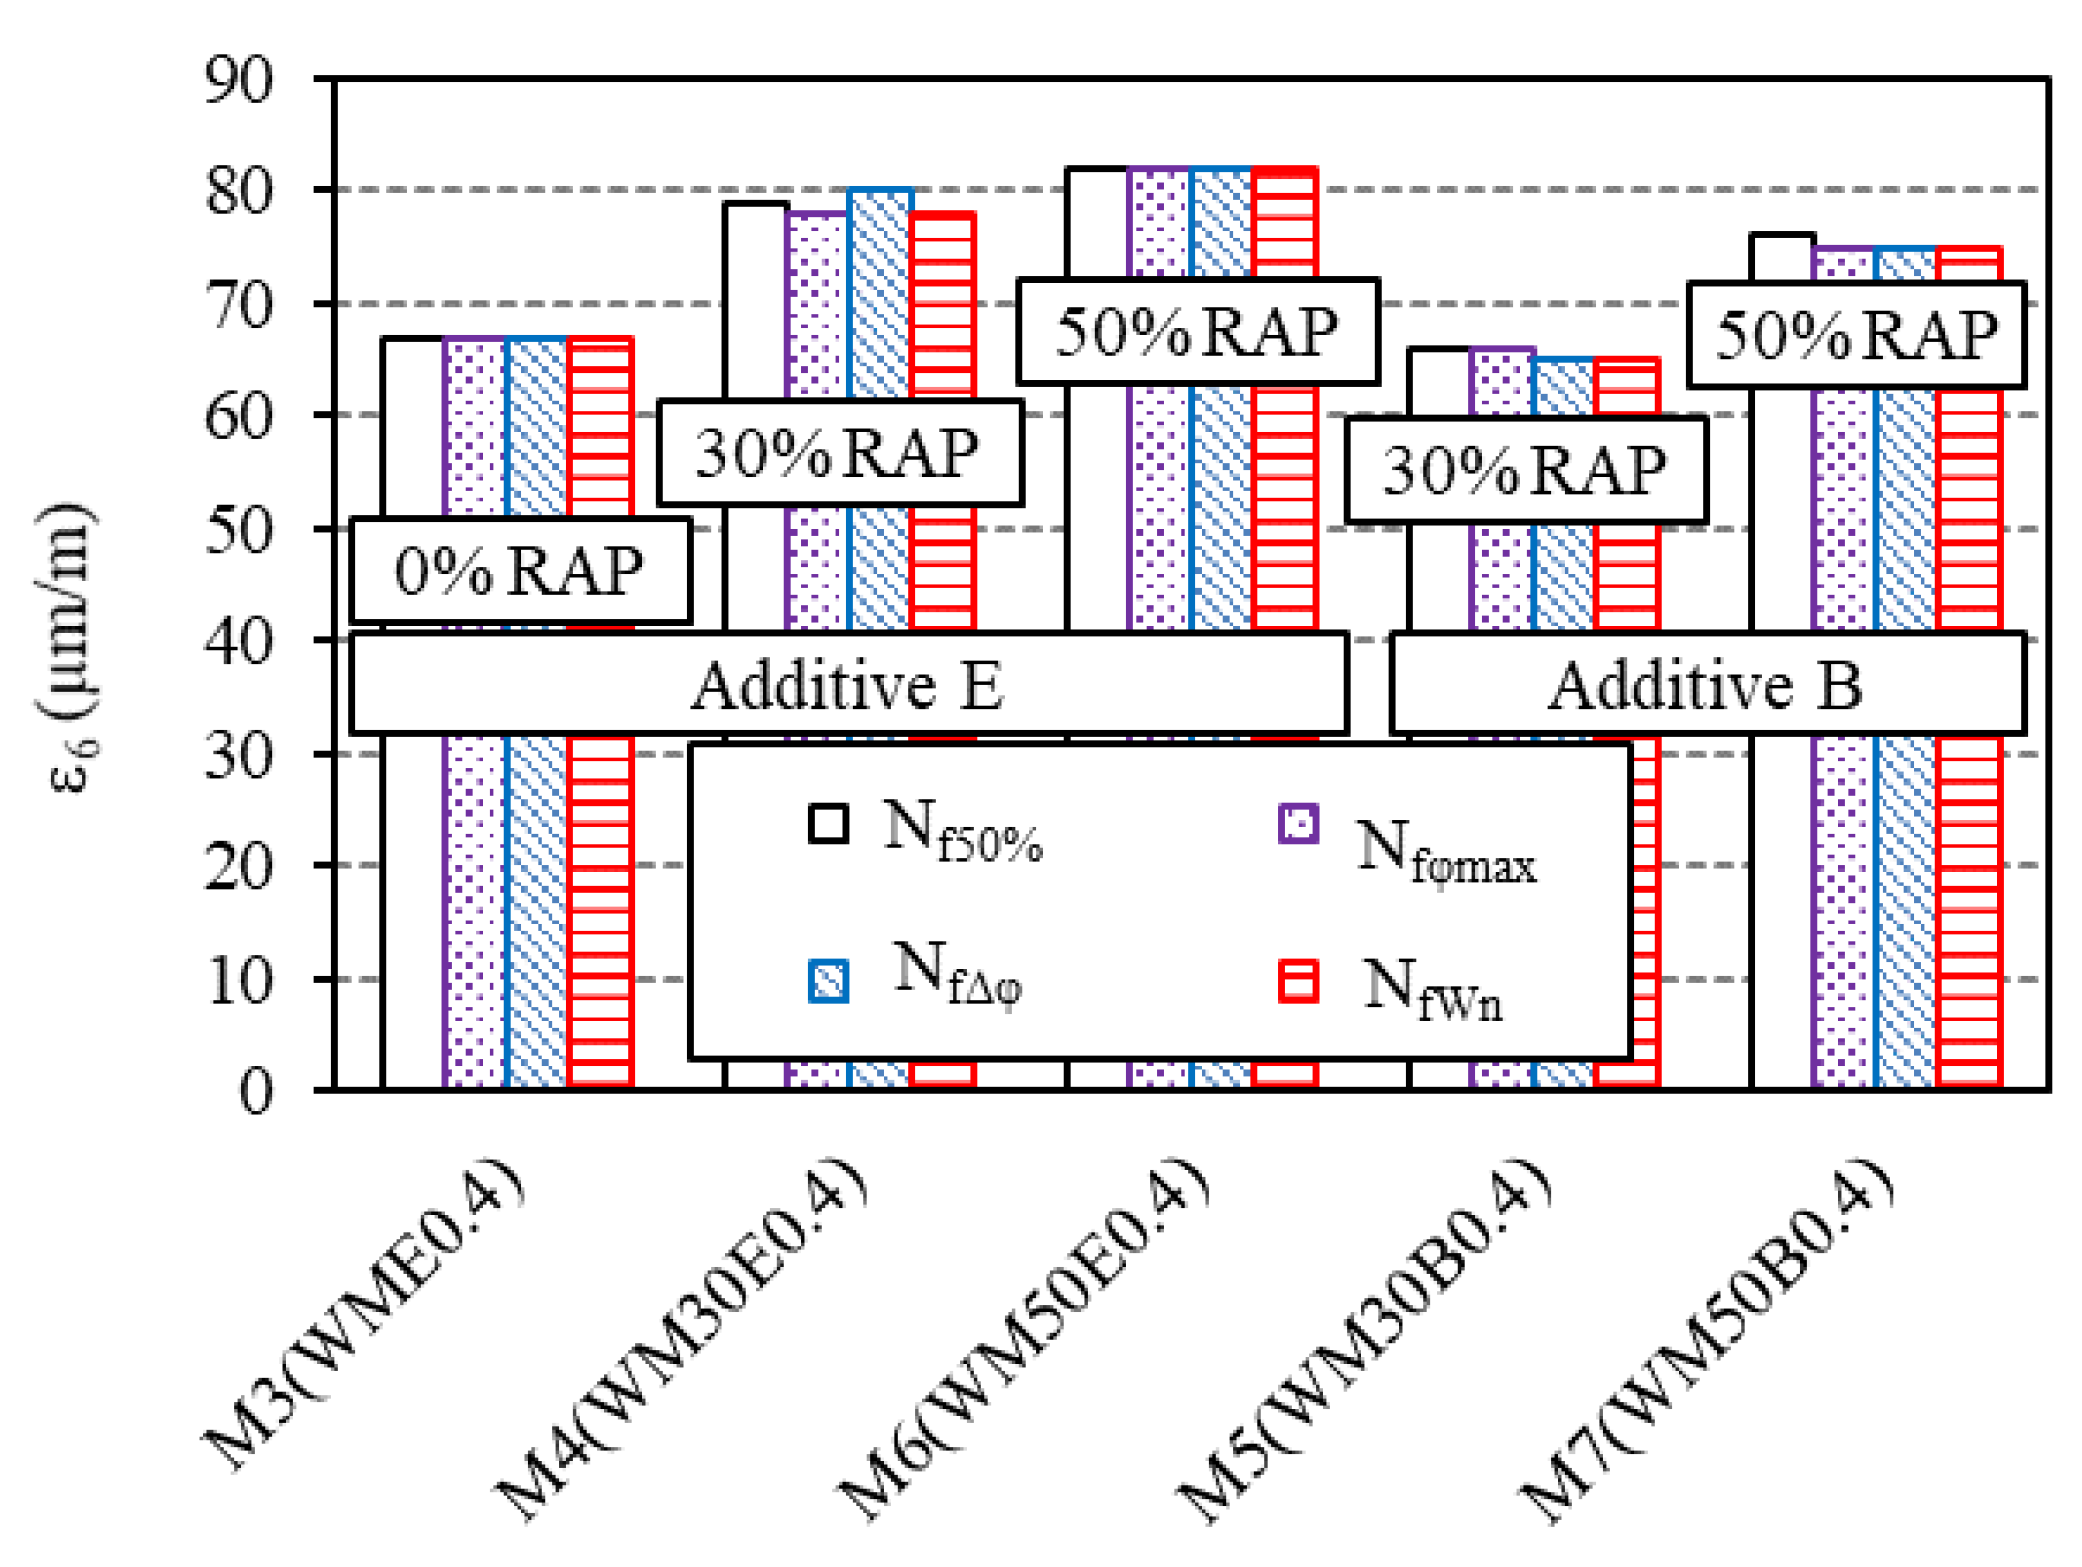
3.4.2. Influence of RAP Content

Material M1-2 (HM) without RAP has a higher ε6 value than material M2-2 (HM30) with 30% RAP (Figure 11). The fatigue performance of the hot mix therefore decreases when adding RAP. For warm bituminous mixtures, taking into account the type of additive used, it appears that for the materials produced with additive E (M3, M4 and M6), the ε6 value increases when adding RAP. The conclusion is the same with materials using additive B (M5 and M7) (Figure 12).

3.4.3. Influence of the Type of Additive

Results of the bituminous mixtures produced with the two different additives, respectively, with 30% RAP (M4 (WM30E0.4) and M5 (WM30B0.4)) and with 50% RAP (M6 (WM50E0.4) and M7 (WM50B0.4)), could also be compared with Figure 12. A rather noticeable difference appears between the two additives. More specifically, for bituminous mixtures with 30% RAP, material M4 (using additive E) gives an ε6 value of about 80 μm/m, against 65 μm/m for material M5 (using additive B). For bituminous mixtures with 50% RAP, material M6 (using additive E) gives an ε6 value of about 82 μm/m, against 75 μm/m for material M7 (using additive B). It can be concluded that the use of additive E provides higher values of ε6 than additive B, for warm bituminous mixtures with RAP.

3.4.4. Influence of Manufacturing Process

For bituminous mixtures without RAP (M1-2 (HM) and M3 (WME0.4)), hot bituminous mixture (M1-2) has higher ε6 value than warm bituminous mixture (M3) (Figure 13). Then, for the bituminous mixtures without RAP, the fatigue performance of hot bituminous mixture is better than that of the warm bituminous mixture. For bituminous mixtures with 30% RAP (M2-2 (HM30), M4 (WM30E0.4) and M5 (WM30B0.4)), the results are presented in Figure 13. No clear trend emerges. The ε6 value of the hot bituminous mixture M2-2 is smaller than that of the bituminous mixture M4 (warm mix using additive E) and is equal to that of the bituminous mixture M5 (warm mix using additive B).

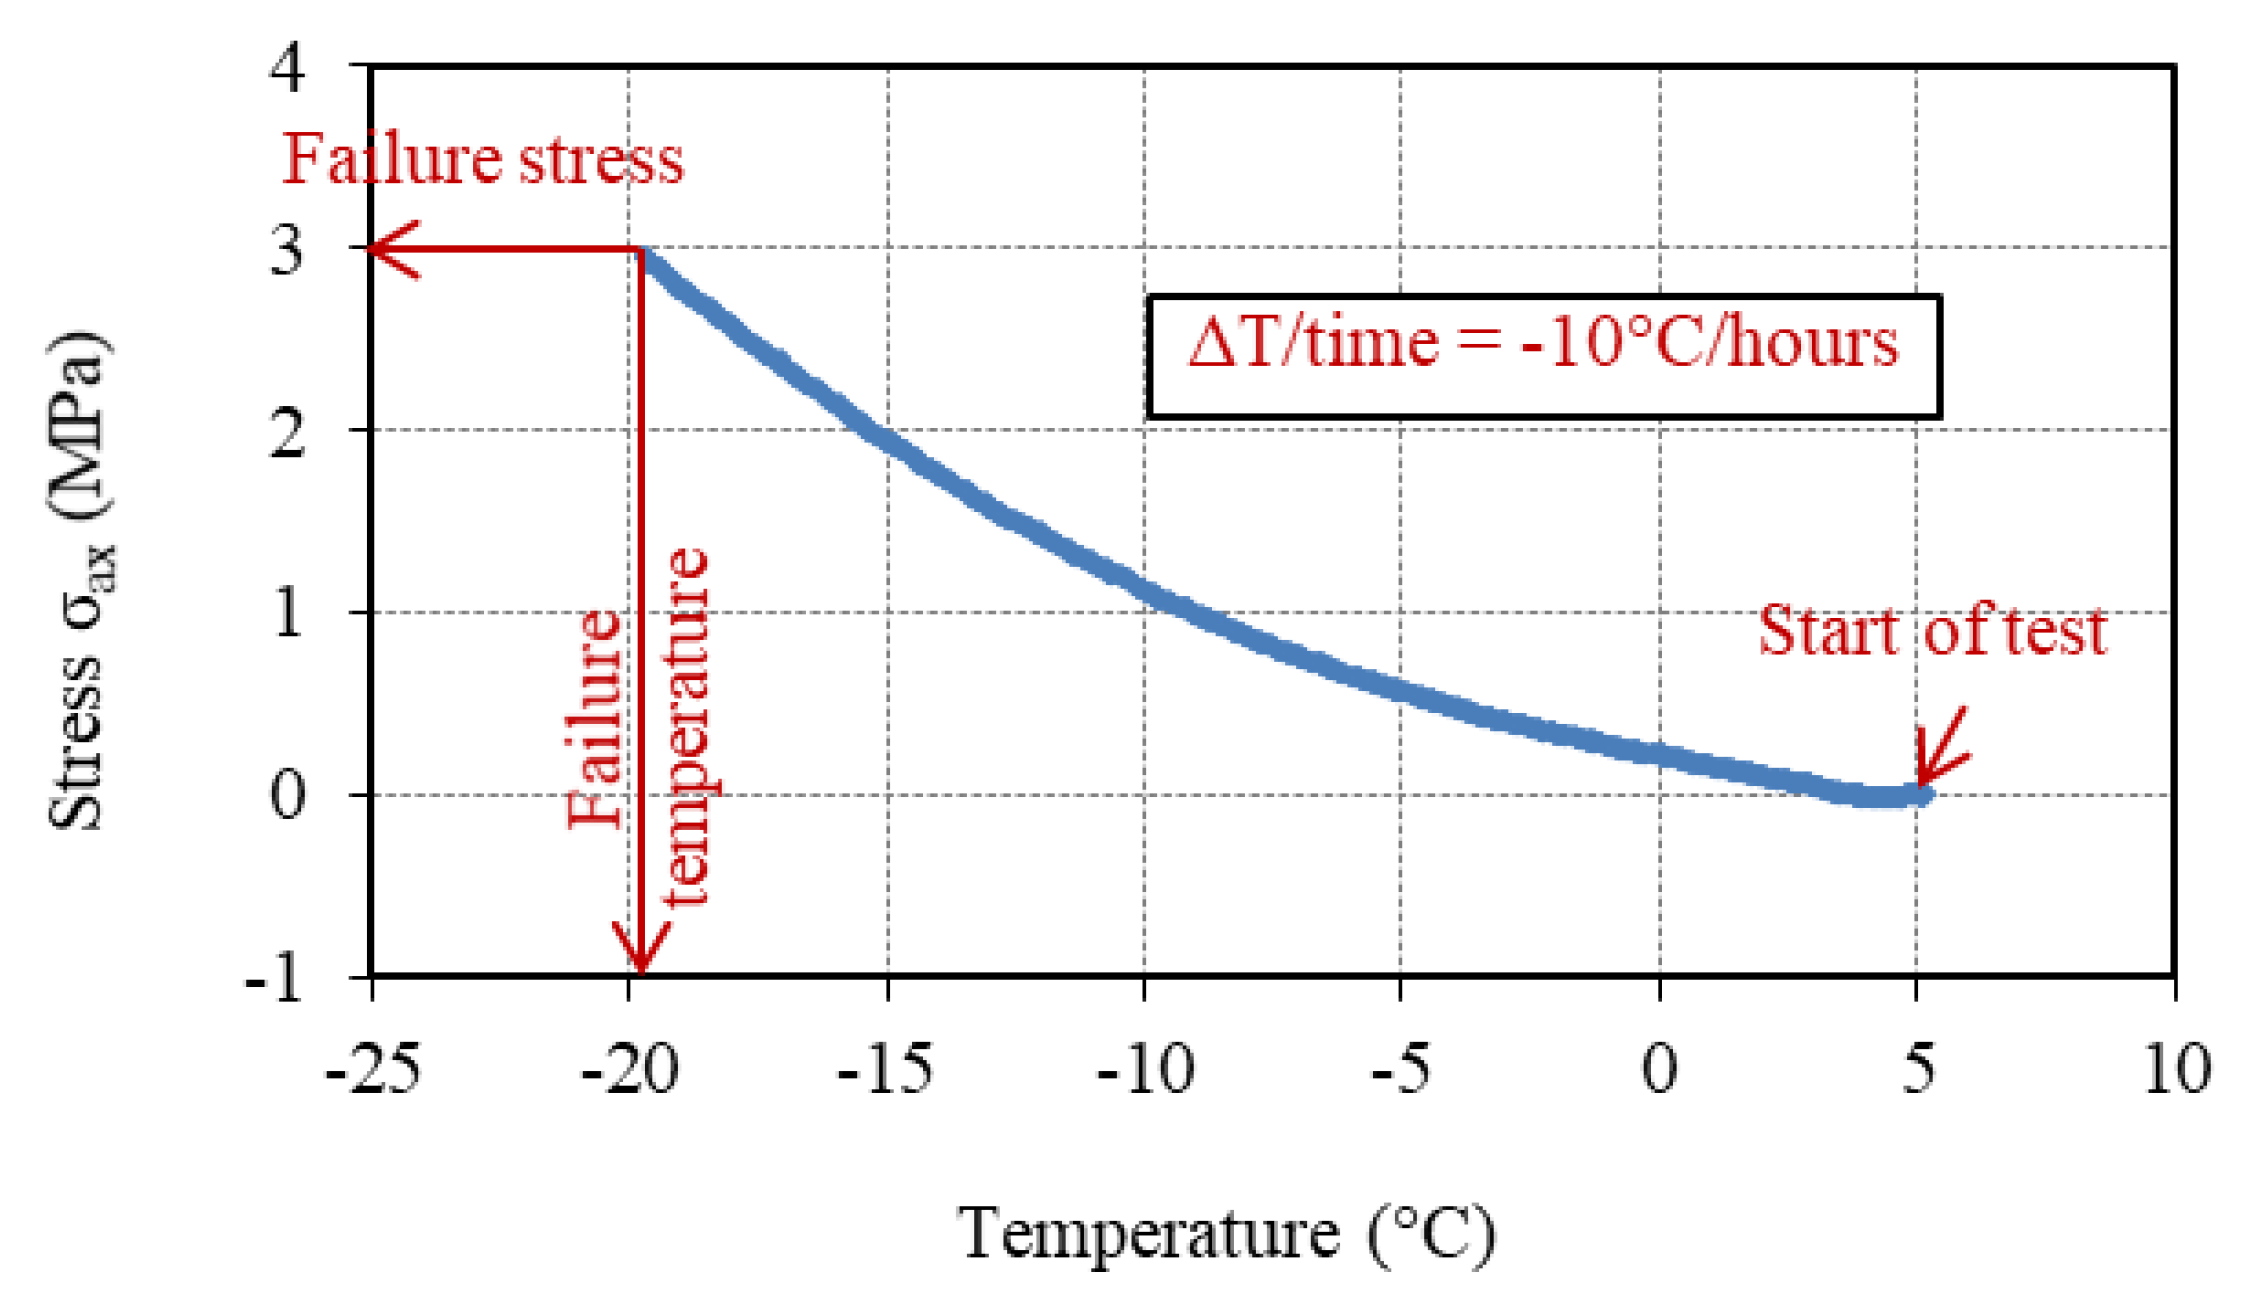
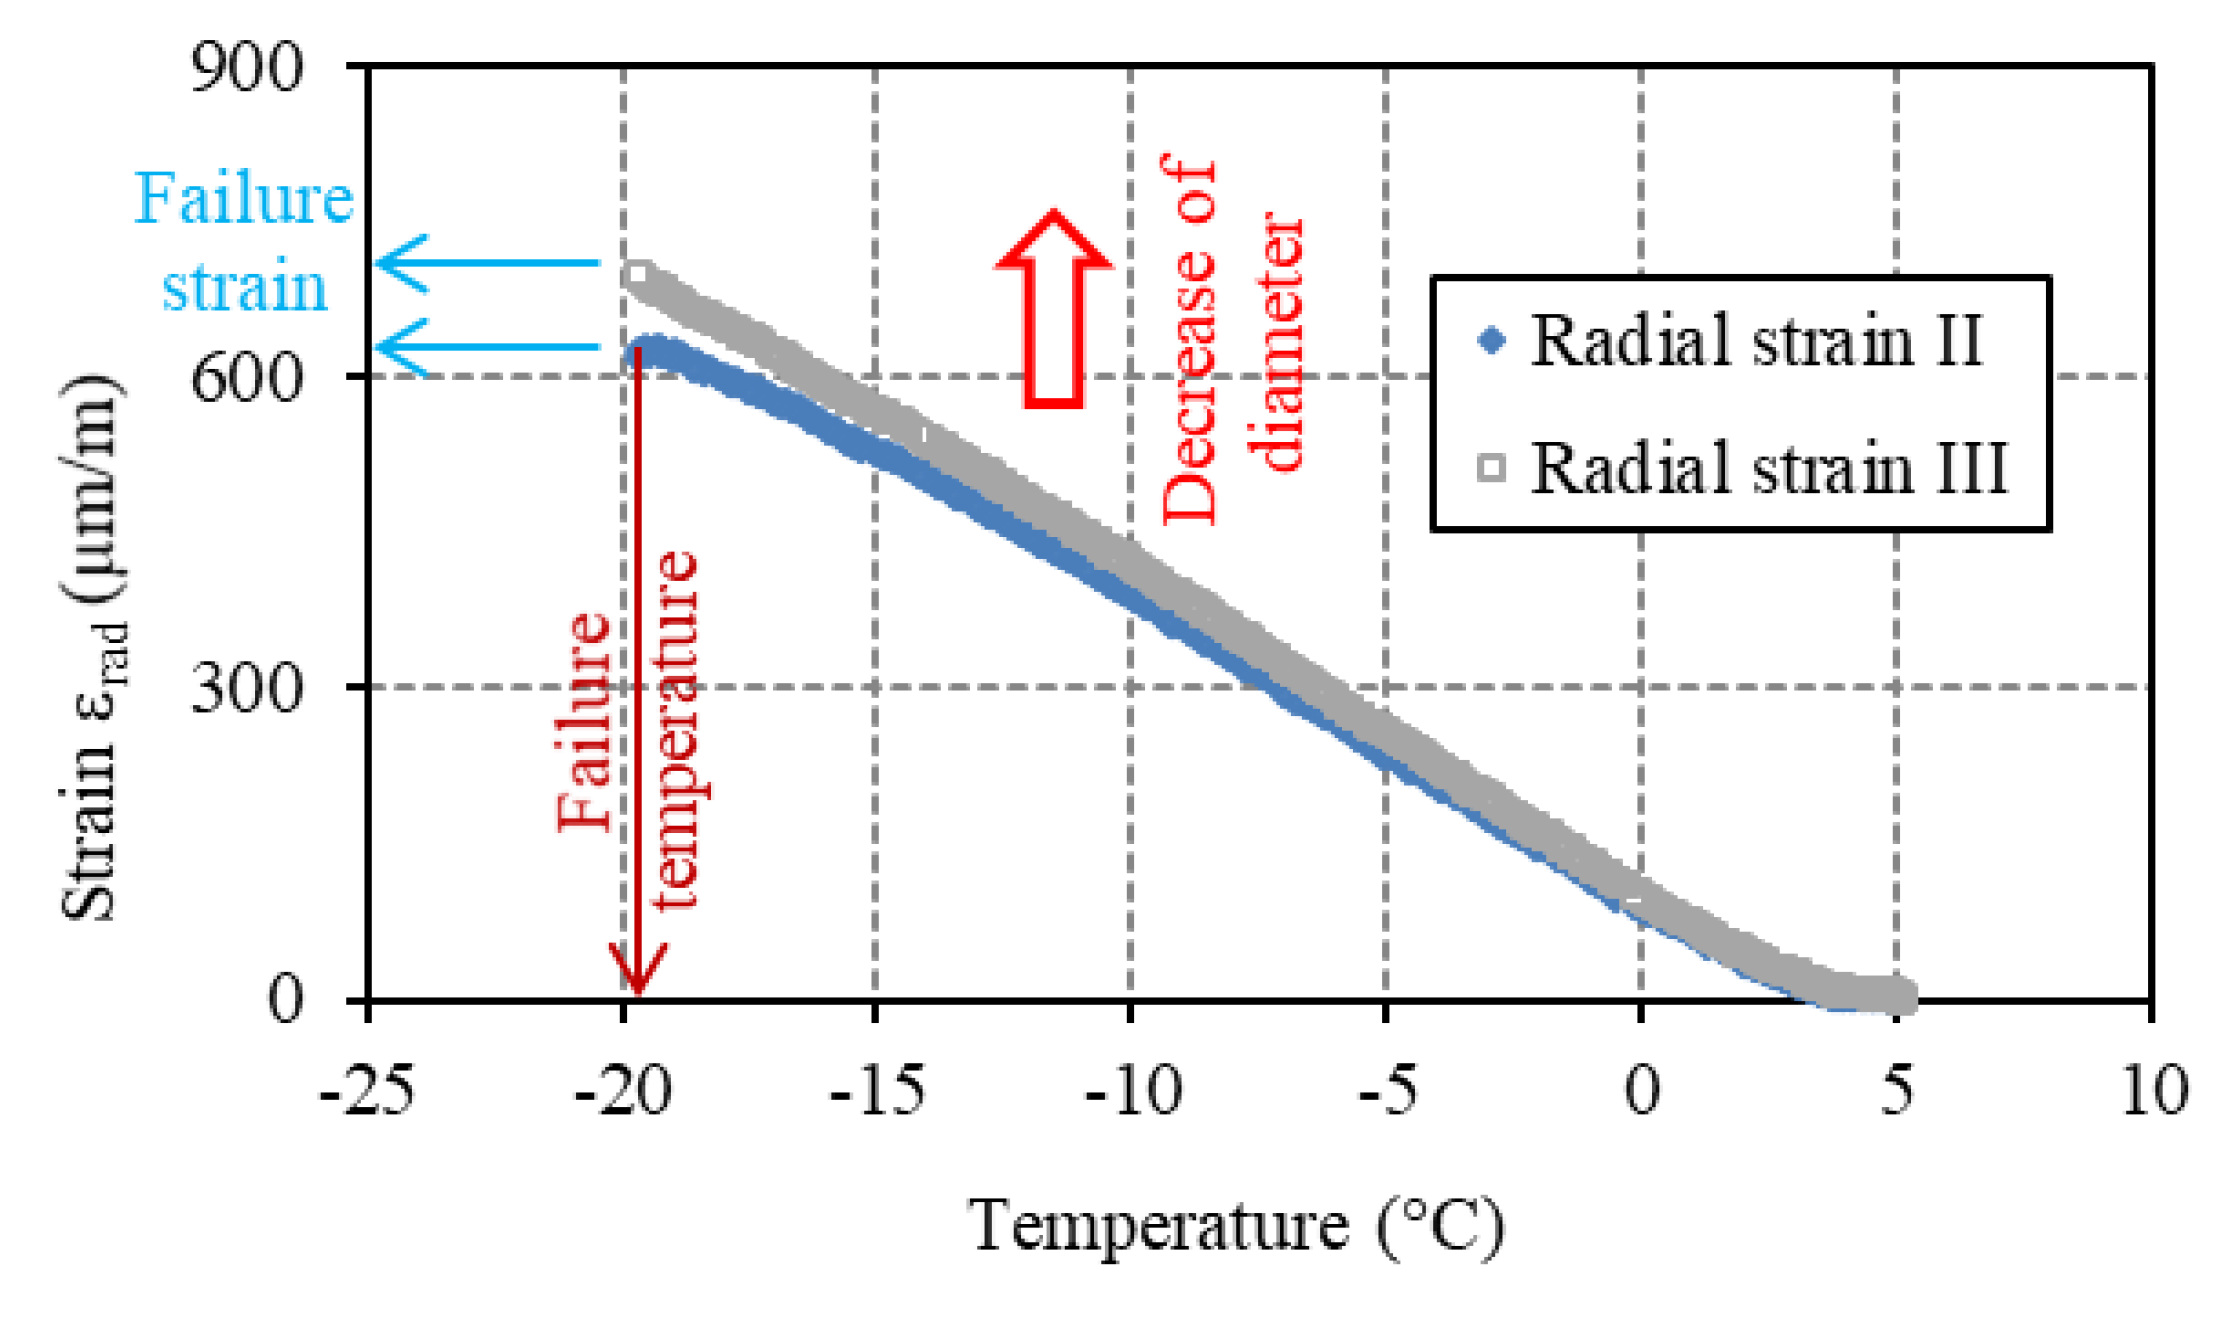
4. Thermal Stress Restrained Specimen Test (TSRST)

4.1. Example of TSRST Results

As an example, the results of test B2P2M5 are presented in Figure 14 and Figure 15. The main outputs of the TSRST are the variation of the thermally induced stress as a function of the temperature. The values of temperature and stress at failure (Tf and σf) are obtained from this variation (Figure 14). In our tests, radial strains were also measured thanks to an improved strain measurement device (Figure 1). Variation in radial strain with the temperature is plotted in Figure 15. This variation combines thermal radial contraction (due to temperature decrease) and Poisson effect, creating radial contraction during tension tests. Further investigation about radial strains is necessary but out of the scope of this paper.
As already stated for the fatigue tests, these types of curves bring information on multidirectional behaviour. It is not proposed in the literature and was introduced by the ENTPE team [50]. It reveals that radial strains in directions II and III increase (corresponding to a contraction of the sample) and remain close all over the test. Then the anisotropy is not visible on this parameter. Failure values of radial strain in directions II and III could also be obtained (Figure 15). In order to keep positive values, tension (stress) and contraction (strain) are considered as positive in the presented results.

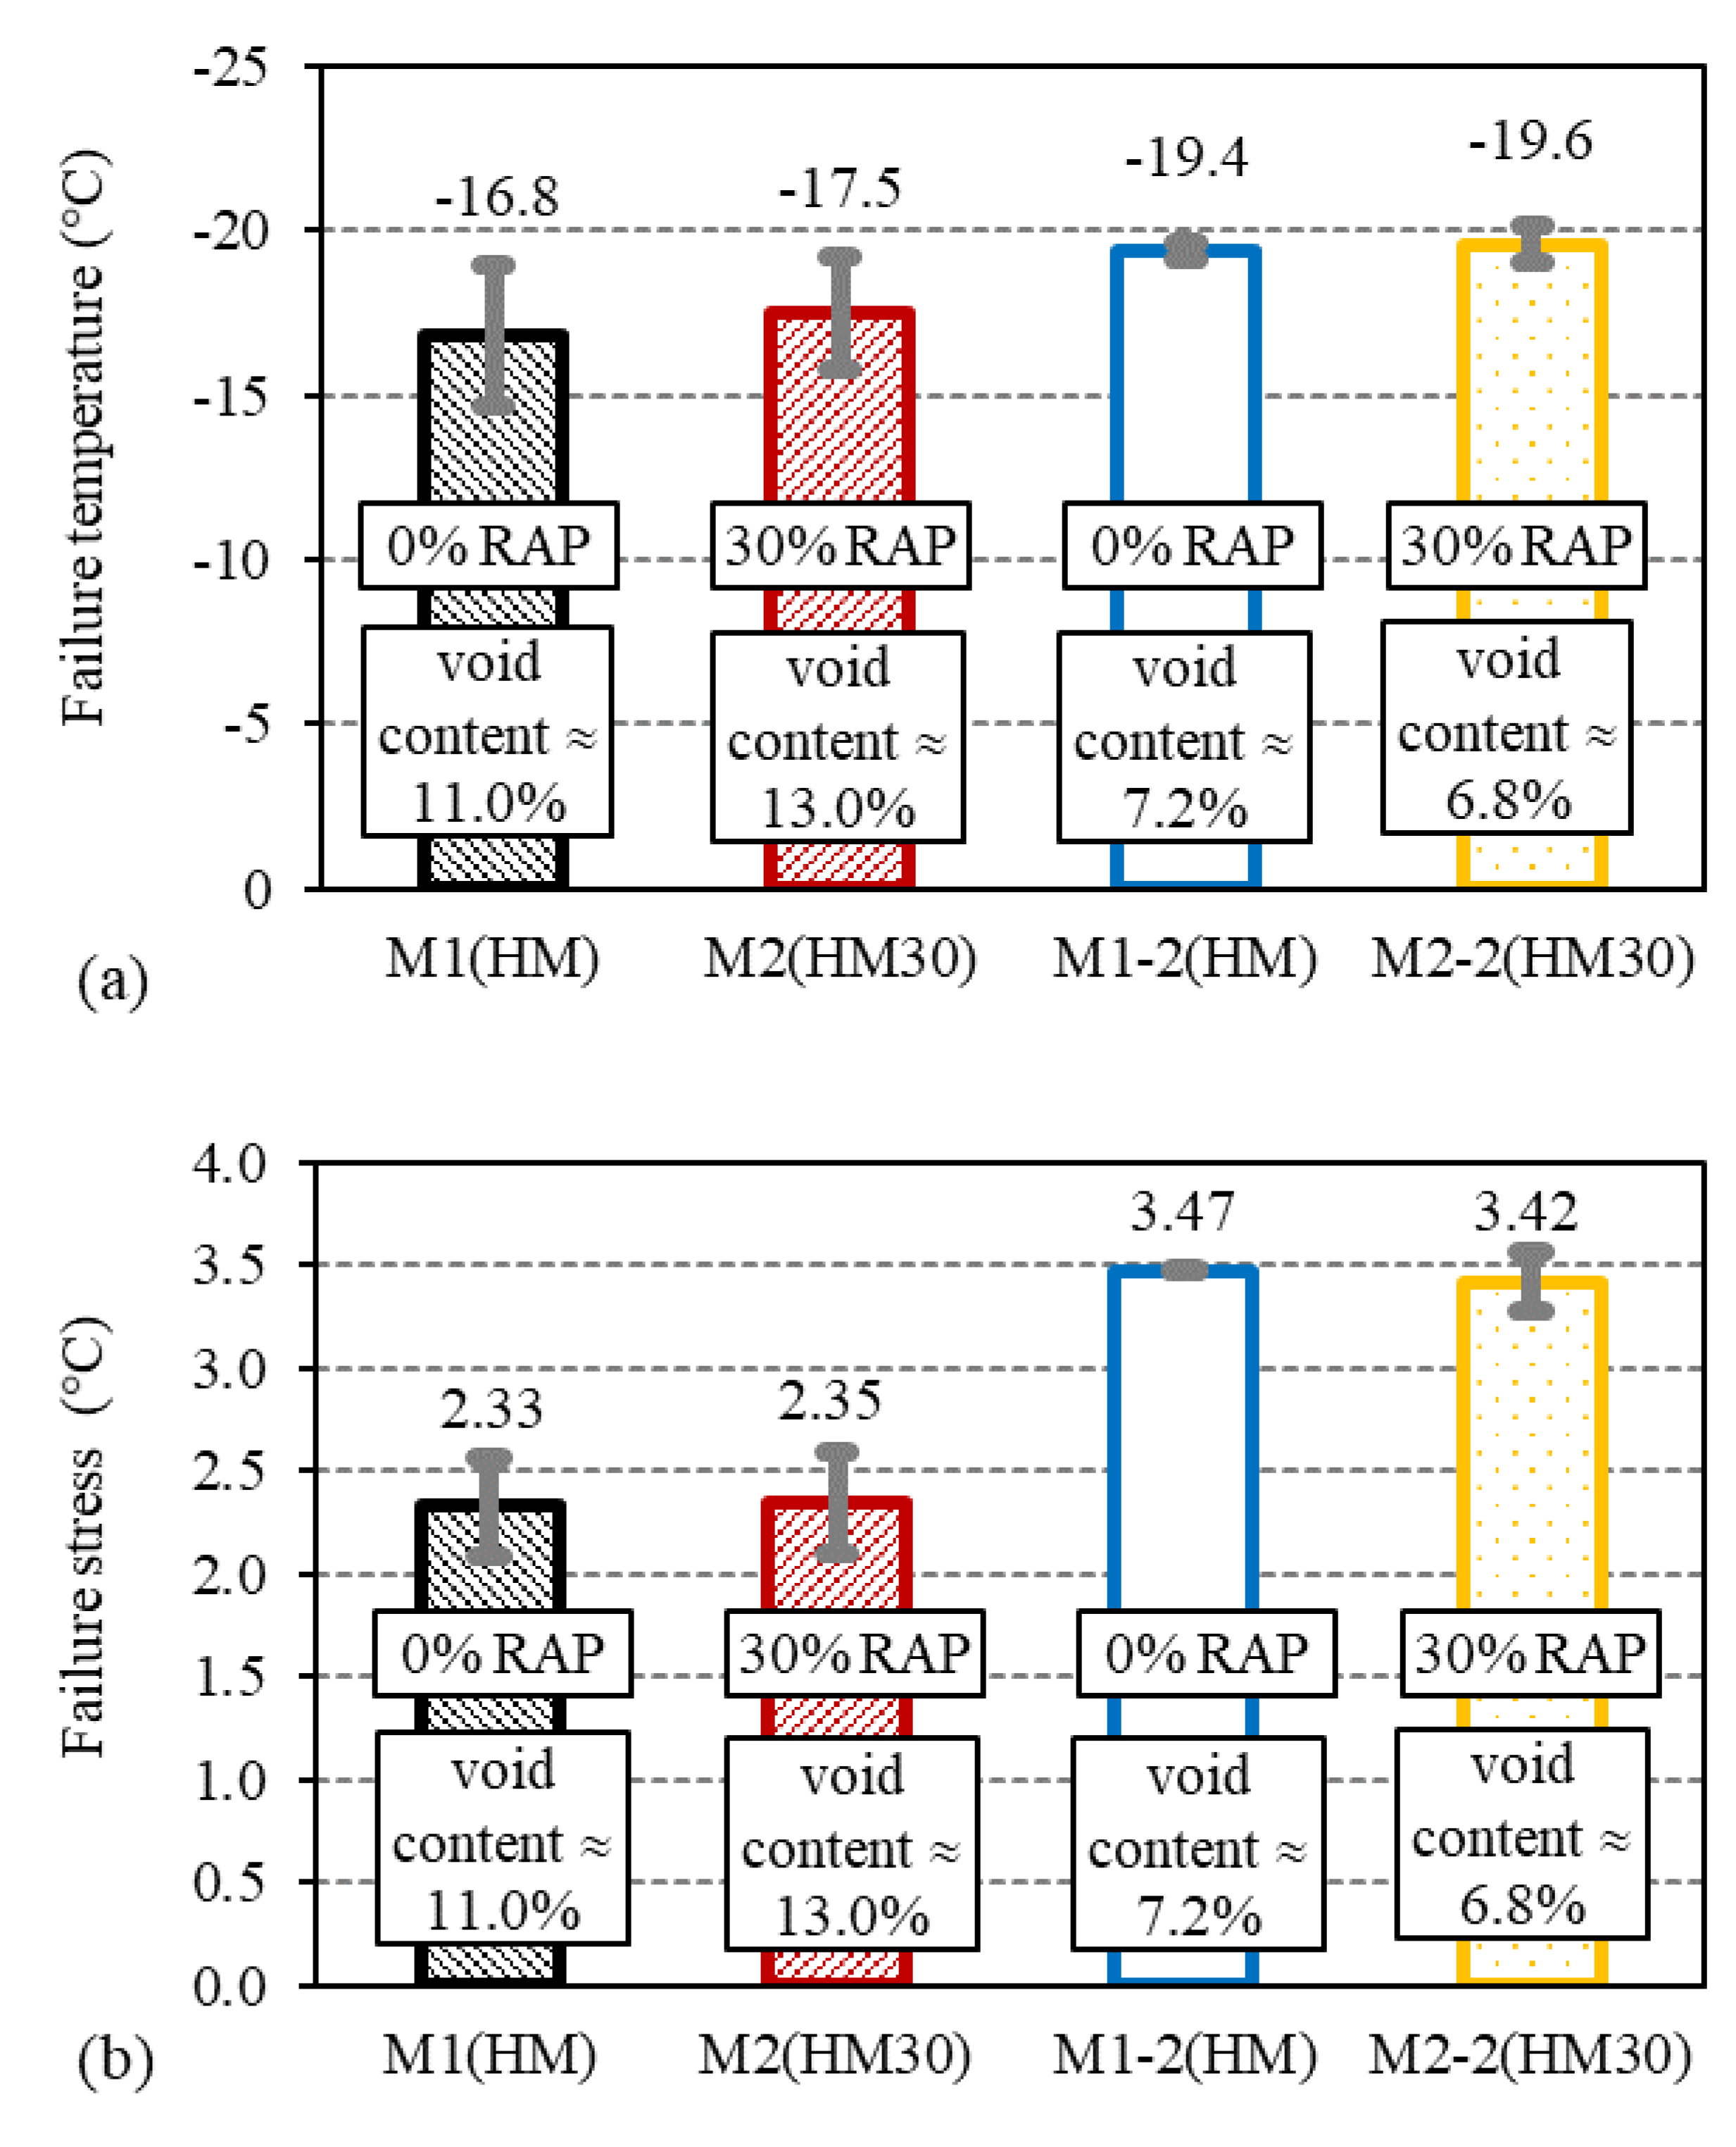
4.2. Results of the Tested Materials

The temperature and stress values at failure are presented in Table 3 for all the tested specimens. The standard deviations for the failure temperature are lower than 2.1 °C and those for the failure stress are lower than 10.6%. In view of these results, it may be concluded that the performed TSRS test is well repeatable.
The results of the failure radial deformations are shown in Table A3 (Appendix A). Standard deviation values are below 10%. The repeatability of the TSRST regarding these parameters is also well verified.

4.3. Analysis of Stress and Temperature Results at Failure

4.3.1. Influence of Void Content

The bituminous mixtures with a higher void content (materials M1 and M2) have a lower failure temperature than the denser bituminous mixtures (materials M1-2 and M2-2) (Figure 16a). The difference is higher than 2.5 °C. A noticeable difference is also observed for these two groups of materials for failure stress values, as plotted in Figure 16b. Both indicators are improved for denser materials, which have then better performance.

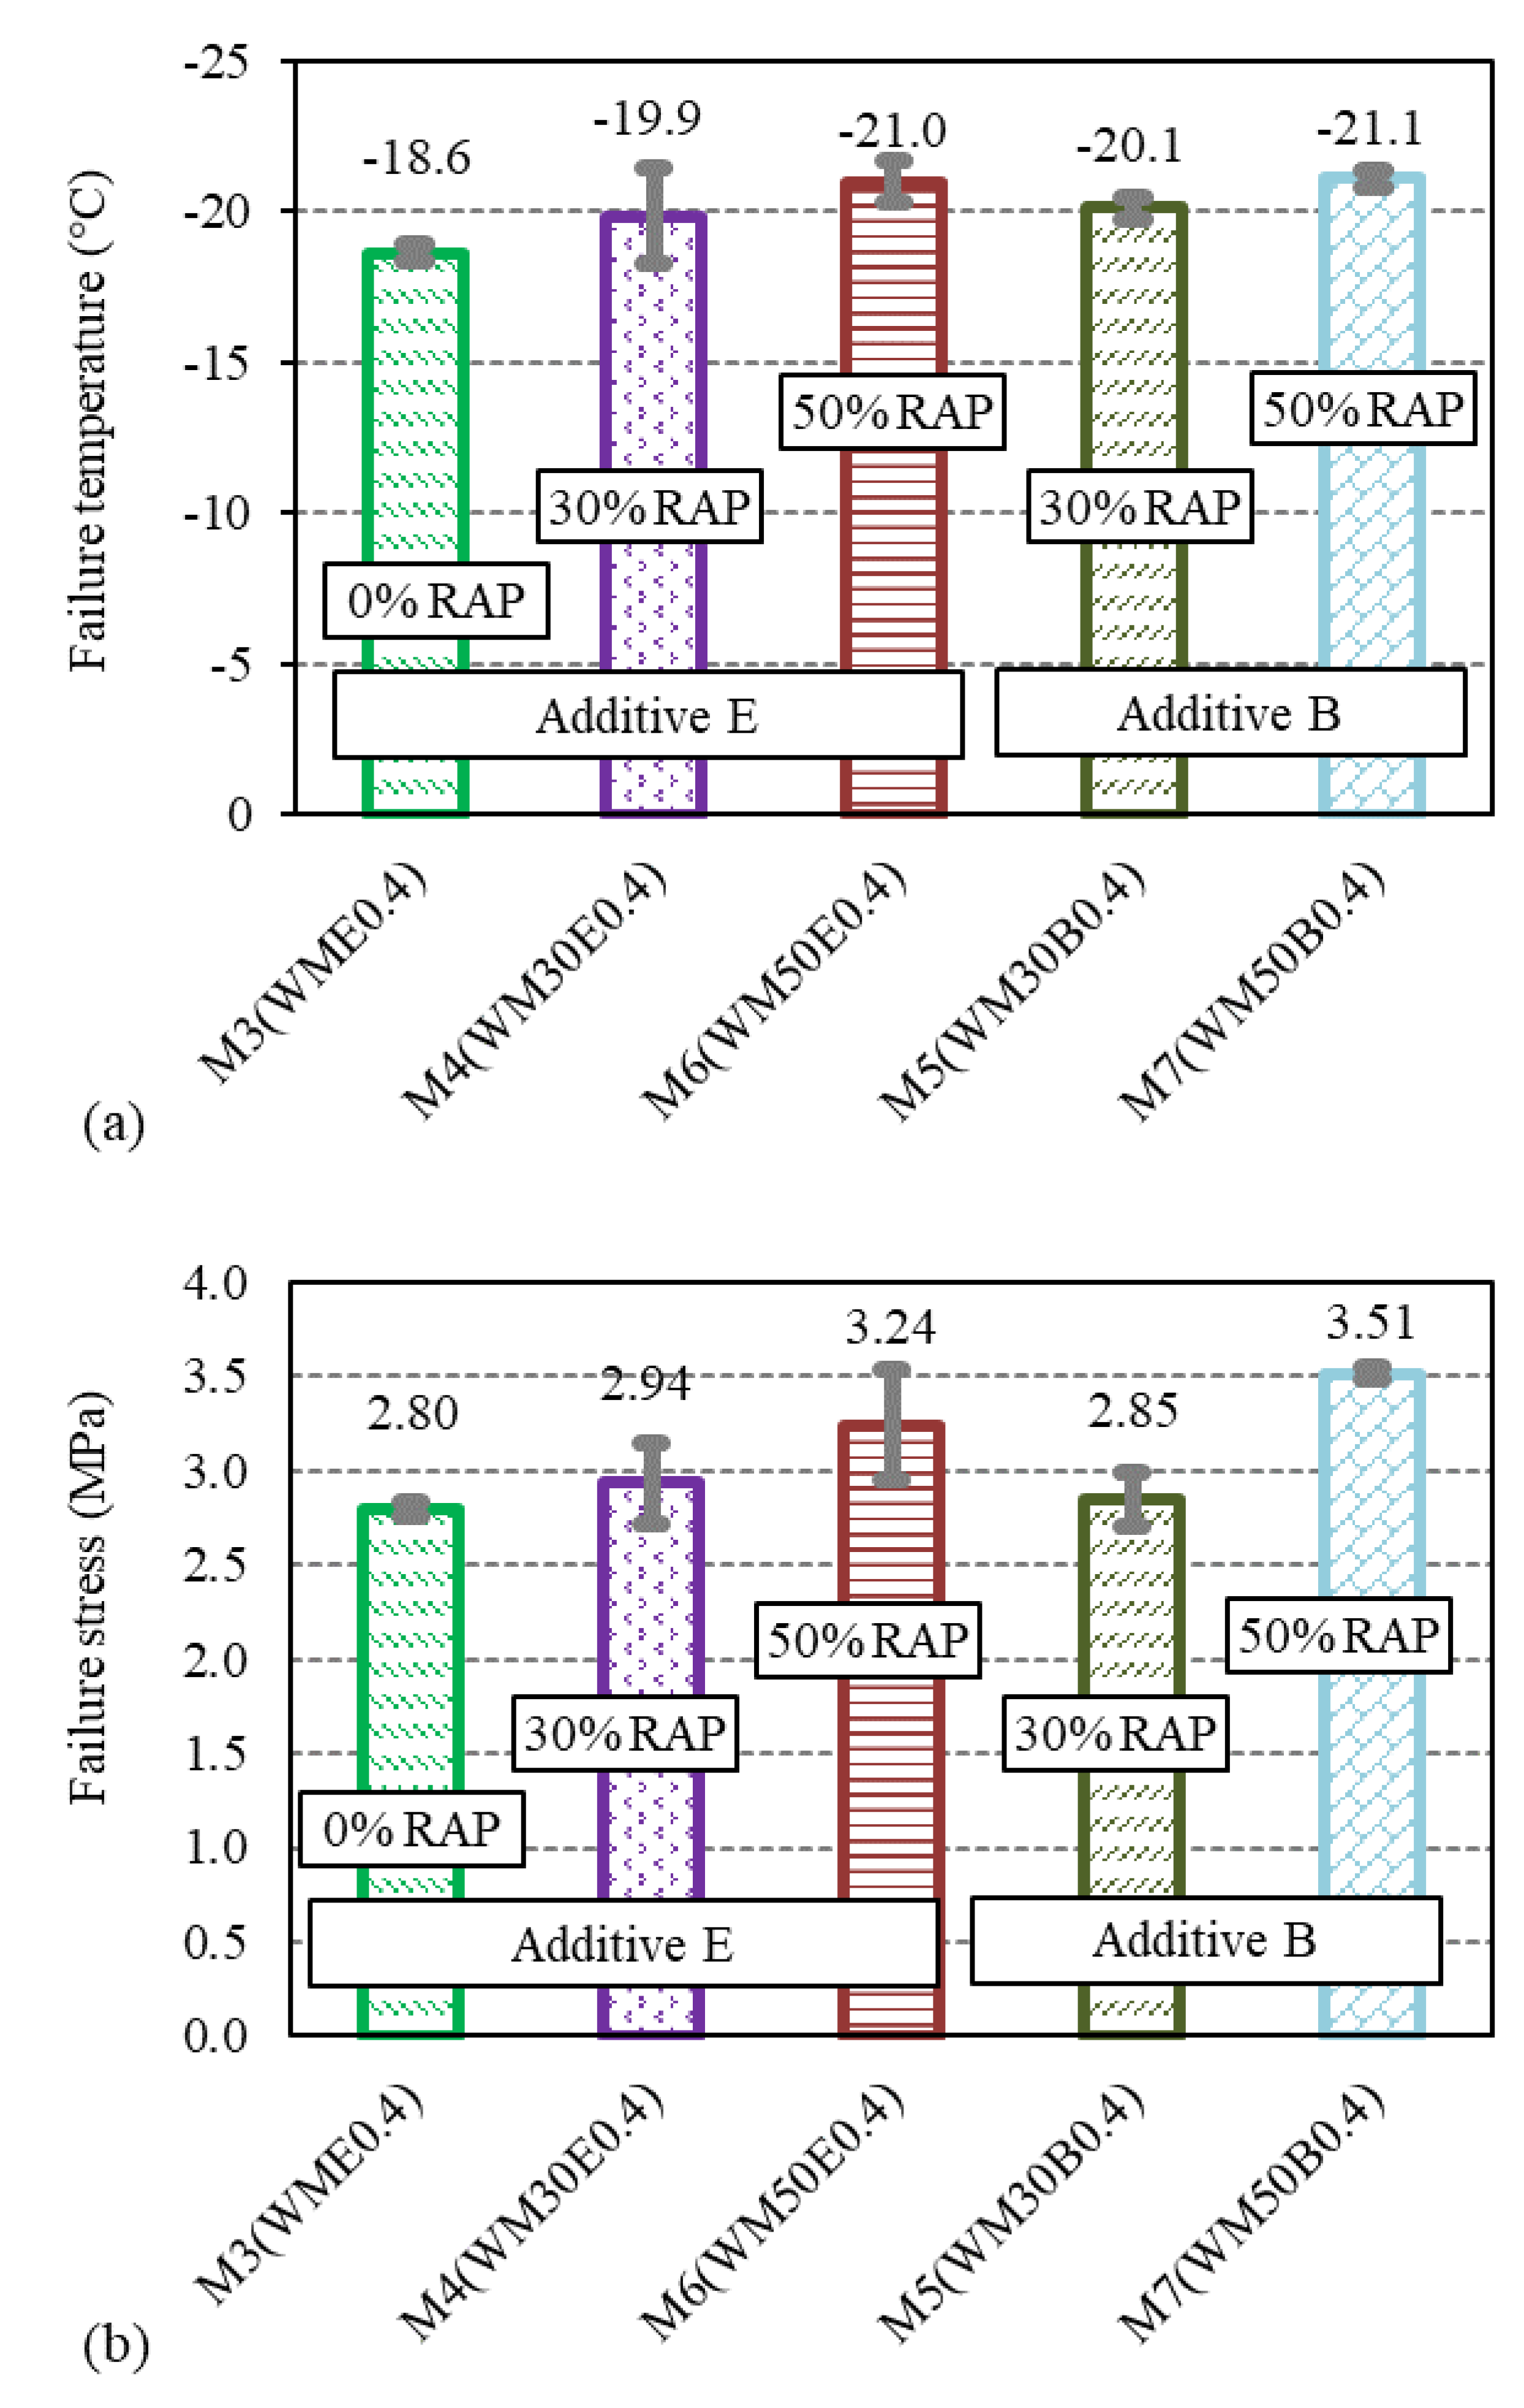
4.3.2. Influence of RAP Content

RAP content seems to have little influence on the hot mixtures, as shown in Figure 16. For warm bituminous mixtures, Figure 17 reveals clear trends. The failure temperature values decrease and failure stress values increase when the RAP content increases. RAP addition improves the performance of the tested warm bituminous mixtures.

4.3.3. Influence of Type of Additive

For the warm bituminous mixtures with 30% RAP but with different types of additive, the failure temperature values are close (−19.9 °C when using the additive E and −20.1 °C when using the additive B). The results are shown in Figure 17a. For the warm bituminous mixtures with 50% RAP, the failure temperature values are −21.0 °C and −21.1 °C, respectively, for additive E and additive B. This shows that the effect of the two types of additives (E and B) on the failure temperature of the warm bituminous mixtures is quasi identical.
Figure 17b shows the failure stress values. No clear conclusion appears. Additive B gives better results for warm bituminous mixtures with 50% RAP, but a little worse for warm bituminous mixtures with 30% RAP. The discrepancy between the tests results is higher for this parameter and does not allow concluding definitely.

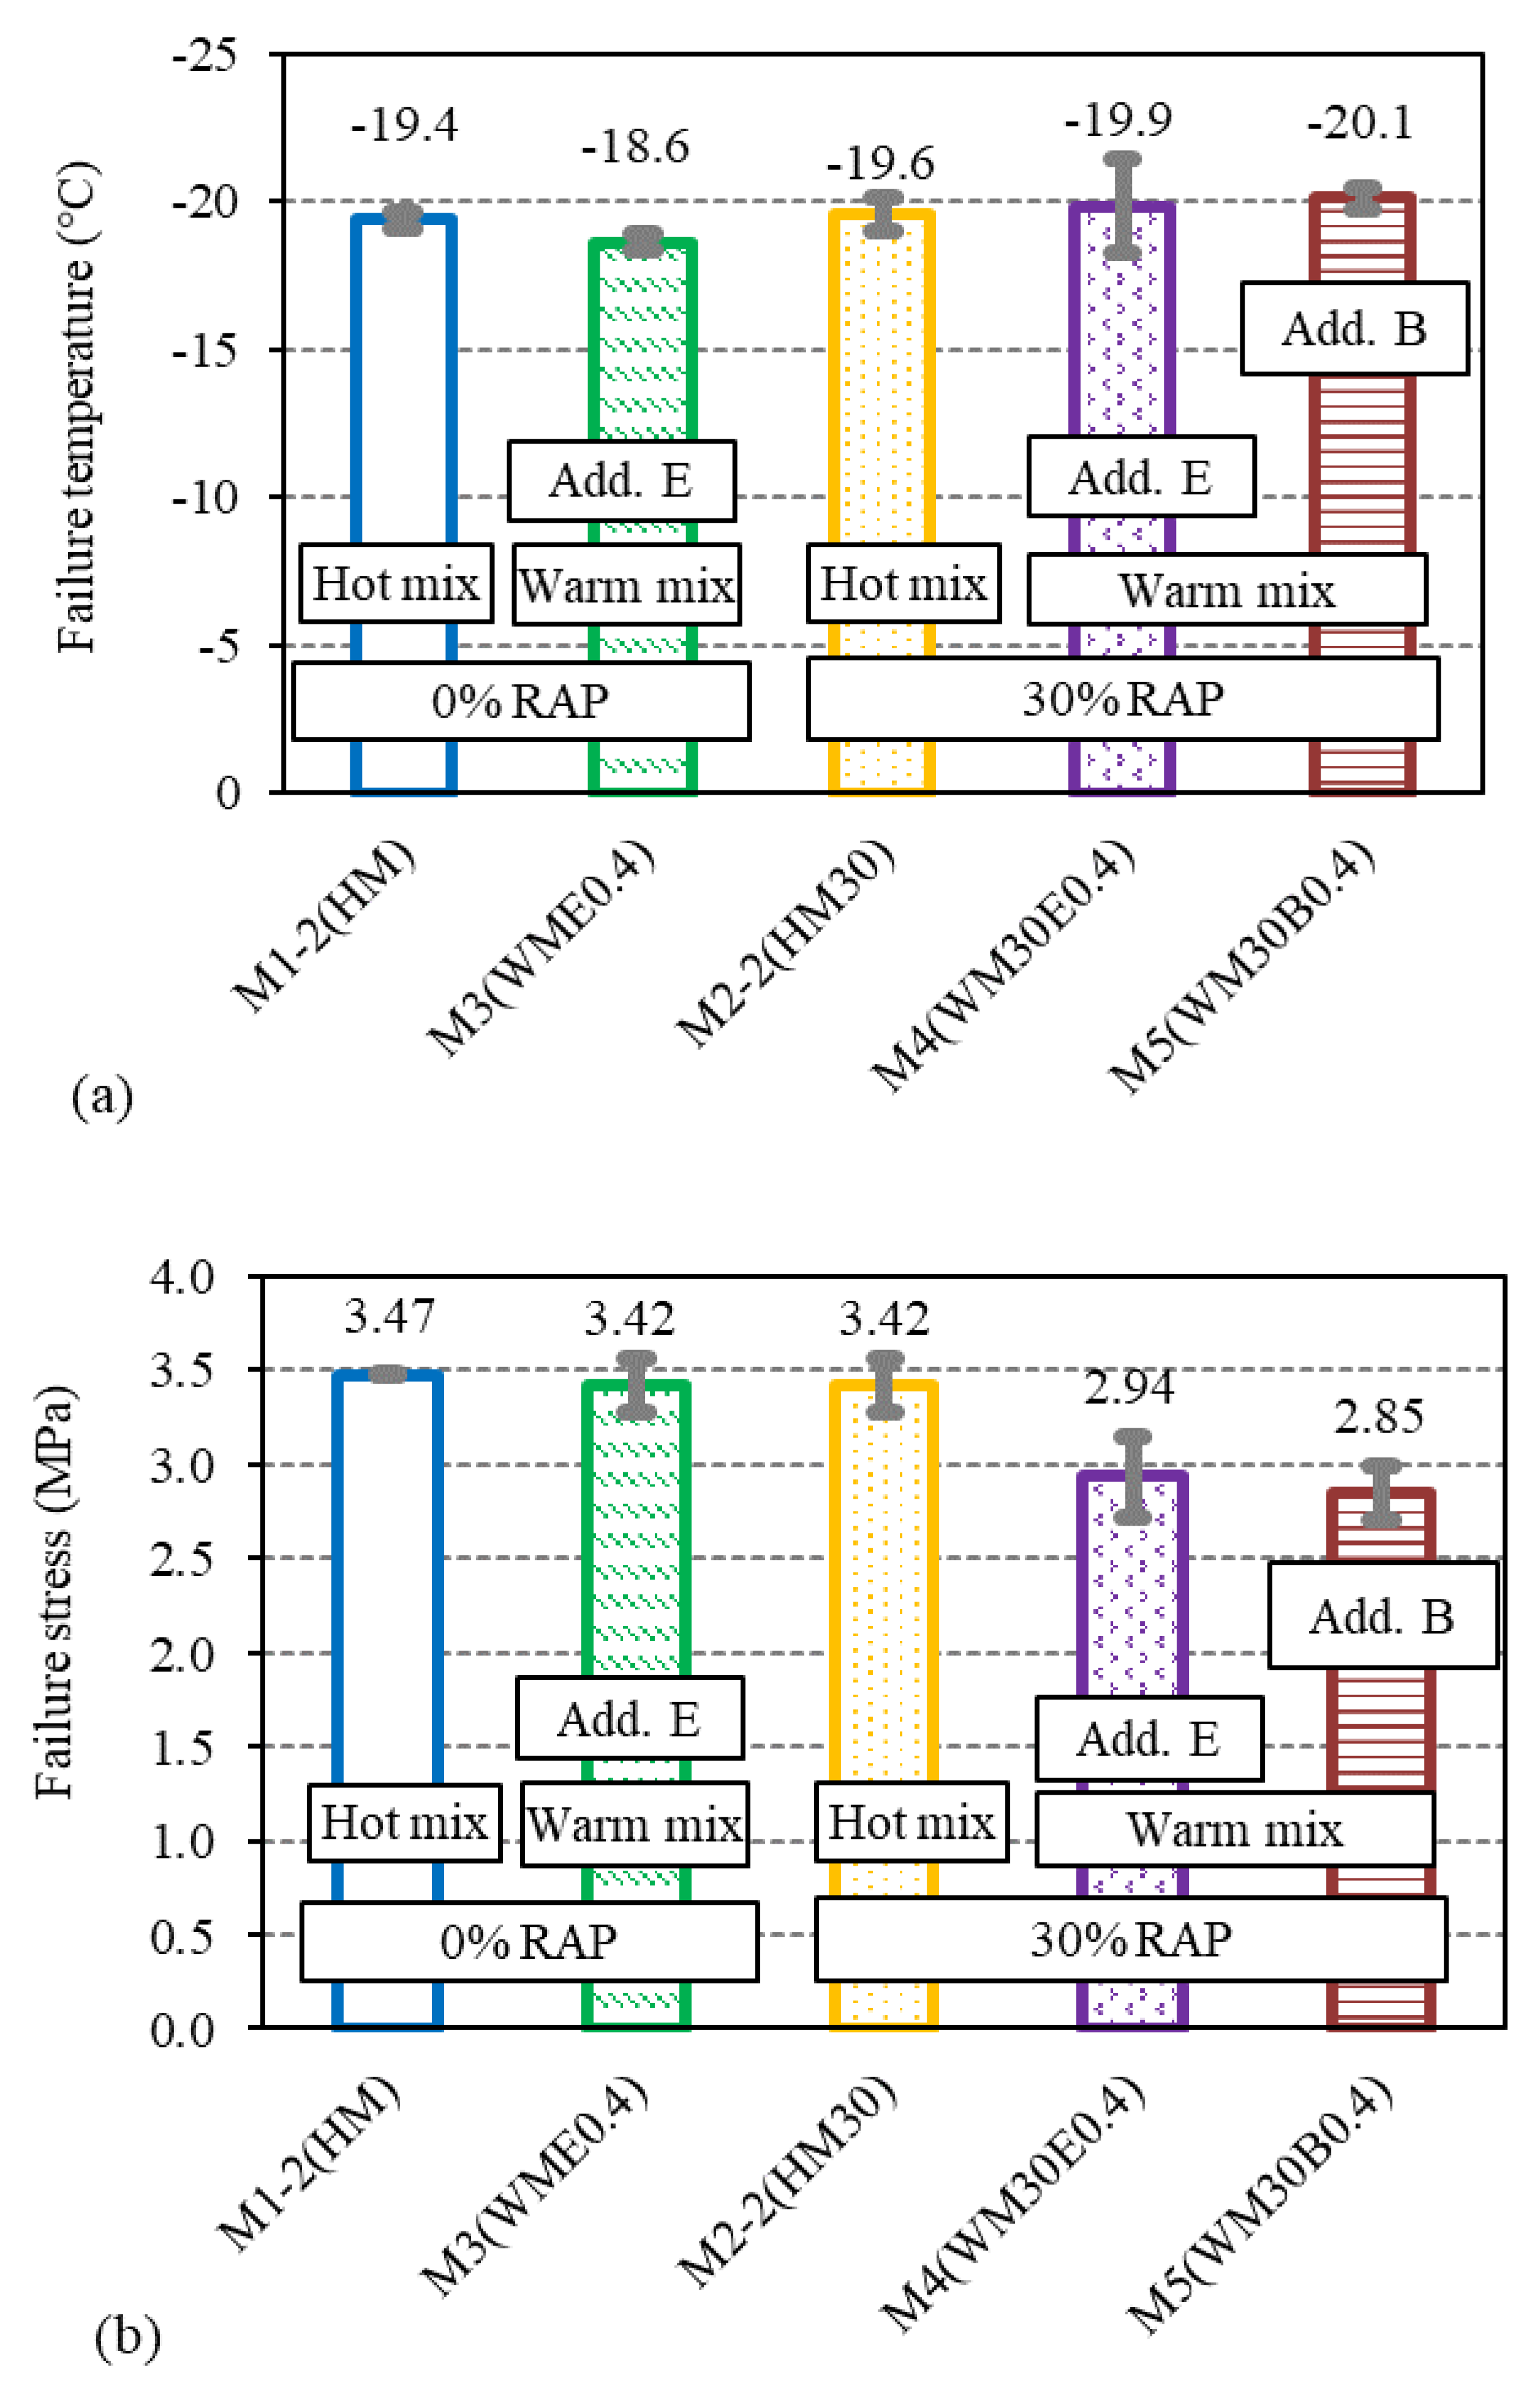
4.3.4. Influence of Manufacturing Process

Whatever the RAP content (0% or 30%), the process (hot or warm) seems to have few effects on the failure temperature values, as can be seen in Figure 18a.
For 0% RAP, the failure stress values are identical for hot and warm processes. This result is not valid for mixtures with 30% RAP, since the hot bituminous mixture has higher failure stress values than the warm bituminous mixture with both additives (Figure 18b).

5. Conclusions

This paper presents the results of a study on the fatigue behaviour and the thermo-mechanical behaviour at low temperature of hot and warm bituminous mixtures produced with additives, with or without RAP. These two behaviours are not so often investigated for such materials. These main conclusions can be drawn from the obtained results:
  • The performed tests were improved thanks to measurement of the radial strain in two directions. It gives information on the multi-axial behaviour of the materials, which needs to be further investigated to better understand the bituminous mixtures’ behaviour This is absolutely essential to improve the modelling and design of road structures.
  • Four criteria were applied to determine the fatigue life of the tested materials and gave similar results.
  • The repeatability of the TSRST was good, based on the temperature failure, stress failure and radial strain failure values.
  • A decrease in the voids content improves the fatigue and TSRS tests’ performance.
  • The influence of the manufacturing process (hot or warm), RAP content and type of used additive for the warm process have been evaluated for both types of test. Overall, warm bituminous mixtures with RAP exhibit comparable performances with hot bituminous mixtures and even better performances, in some cases.
This study shows that it is possible to combine the use of a high RAP content and a warm mixing process, without deteriorating the performance in fatigue and at a low temperature, as determined in the laboratory. These observations must be confirmed by in situ performance evaluations; nonetheless, developing such innovative techniques should be encouraged, which are too rarely combined.

Author Contributions

Investigation, N.H.P., C.S., H.D.B.; resources, N.H.P., C.S., H.D.B., J.A.G.-L., G.B. and A.N.; data curation, N.H.P., C.S., H.D.B.; writing—original draft preparation, N.H.P.; writing—review and editing, C.S., H.D.B., J.A.G.-L., G.B. and A.N.; supervision, C.S., H.D.B.; project administration, C.S., H.D.B., J.A.G.-L., G.B. and A.N.; funding acquisition, C.S., H.D.B., J.A.G.-L., G.B. and A.N. All authors have read and agreed to the published version of the manuscript.

Funding

We would like to thank ADEME (French Agency for the Environment and Energy Management) for its financial support to the work presented in this paper.

Acknowledgments

We also would like to thank ARKEMA ROAD SCIENCE for providing the chemical additives used in this study.

Conflicts of Interest

The authors declare no conflict of interest.

Appendix A

Table A1. Name and air void content of each tested specimen and each performed test.
Fatigue TestTSRST
MaterialSpecimenStrain Amplitude (Average) µm/m%VoidsSpecimen%Voids
M1
(HM)
C8P1M1789.9B1P1M111.7
C1P1M17311.2B2P1M111.2
C6P1M16810B5P1M111.3
C5P1M16310.8
C7P1M1589.7
M1-2
(HM)
C1P2M1-2967.2B1P2M1-27.2
C4P2M1-2918.3B4P2M1-27
C2P2M1-2867.7B5P2M1-27.3
C5P1M1-2787.5
M2
(HM30)
C3P1M27812.4B1P2M212.9
C5P1M27311.8B2P2M213
C6P2M26112.4B5P2M213
C7P2M25812.6
M2-2
(HM30)
C4P2M2-2788.4B2P2M2-26.4
C5P1M2-2738.4B3P2M2-26.9
C1P1M2-2658.4B4P2M2-27.2
C1P2M2-2638.3
C8P2M2-2588.3
M3
(WME0.4)
C3P2M3787.8B2P2M37.2
C5P2M3687.9B3P2M37.1
C1P2M3638.3B4P2M37.6
C6P2M3606.7
C6P1M3557.8
M4
(WM30E0.4)
C4P1M4957.9B2P2M47.5
C5P2M4857.2B3P2M47.3
C8P2M4787.5B4P2M47.6
C7P2M4637.1
C6P2M4607.1
M5 (WM30B0.4)C6P1M5977.2B2P2M57.1
C7P2M5847.1B3P3M57.5
C8P2M5787.6B4P3M57.7
C1P2M5728.3
C6P2M5667
M6
(WM50E0.4)
C3P2M6977.1B3P2M66.9
C5P1M6917B4P2M67
C8P2M6886.8B5P2M67.2
C3P1M6786.7
C6P2M6726.7
M7 (WM50B0.4)C8P1M7917.1B1P2M77.4
C3P2M7847.2B3P2M77
C8P2M7786.8B4P2M77.3
C5P2M7717.1
C6P2M7656.7
Table A2. ε6, 1/b and R2 values of the fatigue Wölher curves for the nine tested materials.
MaterialNf 50%Nf φ maxNf ΔφNf Wn
ε6 (µm/m)1/bR2ε6 (µm/m)1/bR2ε6 (µm/m)1/bR2ε61/bR2
M1(HM)6210.20.866210.20.866210.10.87629.90.85
M1-2(HM)777.80.97776.90.97777.30.89777.50.98
M2(HM30)6611.00.966611.00.966611.00.966610.40.97
M2-2(HM30)677.50.66677.70.66687.50.47677.70.65
M3(WME0.4)674.00.36673.00.15674.00.35674.00.35
M4(WM30E0.4)796.80.81787.40.82806.60.80787.10.80
M5(WM30B0.4)663.80.88663.80.86653.50.86653.70.89
M6(WM50E0.4)8213.00.948213.00.948212.90.938212.80.94
M7(WM50B0.4)764.70.95754.70.95754.50.98754.90.92
Table A3. Radial deformation in directions II and III at failure for the TSRST.
MaterialSpecimenVoids (%)Failure Radial Strain in Direction II (µm/m)Failure Radial Strain in Direction III (µm/m)
AverageStandard Deviation AverageStandard Deviation
M1
(HM)
B1P1M111.760063735
(5.5%)
---
B2P1M111.2670-
B5P1M110.1640-
M1-2
(HM)
5705976
(1.0%)
70070010
(1.4%)
B1P2M1-27.2600690
B4P2M1-27.0640710
M2
(HM30)
B5P2M1-27.359060335
(5.8%)
---
600-
B1P2M212.9600-
M2-2
(HM30)
B2P2M213.07107036
(0.8%)
-7957
(0.9%)
B5P2M213.0700790
B2P2M2-26.4700800
M3
(WME0.4)
B3P2M2-26.958060321
(3.5%)
66073066
(9.0%)
B4P2M2-27.2620740
B2P2M37.2610790
M4
(WM30E0.4)
B3P2M37.173069335
(5.1%)
70066332
(4.8%)
B4P2M37.6660650
B2P2M47.3690640
M5
(WM30B0.4)
B3P2M47.563066329
(4.4%)
70071017
(2.4%)
B4P2M47.6680700
B2P2M57.1680730
M6
(WM50E0.4)
B3P3M57.56606576
(0.9%)
70071323
(3.2%)
B4P3M57.7660740
B3P2M66.9650700
M7
(WM50B0.4)
B4P2M67.076074035
(4.7%)
85076085
(10.4%)
B5P2M67.2760730
B1P2M77.4700700
All tests 65553
(8.1%)
72153
(7.3%)

References

  1. Tapsoba, N.; Sauzéat, C.; Di Benedetto, H.; Baaj, H.; Ech, M. Behaviour of asphalt mixtures containing reclaimed asphalt pavement and asphalt shingle. Road Mater. Pavement Des. 2014, 15, 330–347. [Google Scholar] [CrossRef]
  2. Lo Presti, D. Recycled Tyre Rubber Modified Bitumens for road asphalt mixtures: A literature review. Constr. Build. Mater. 2013, 49, 863–881. [Google Scholar] [CrossRef]
  3. Xie, Z.; Shen, J. Performance properties of rubberized stone matrix asphalt mixtures produced through different processes. Constr. Build. Mater. 2016, 104, 230–234. [Google Scholar] [CrossRef]
  4. Al-Qadi, I.; Elseifi, M.; Carpenter, S.H. Reclaimed Asphalt Pavement—A Literature Review (Research Report FHWA-ICT-07-001); Illinois Center for Transportation: Urbana, IL, USA, 2007. [Google Scholar]
  5. McDaniel, R.S.; Shah, A.; Huber, G.A.; Copeland, A. Effects of reclaimed asphalt pavement content and virgin binder grade on properties of plant produced mixtures. Road Mater. Pavement Des. 2012, 13, 161–282. [Google Scholar] [CrossRef]
  6. You, Z.; Mills-Beale, J.; Fini, E.; Goh, S.W.; Colbert, B. Evaluation of low-temperature binder properties of warm-mix asphalt, extracted and recovered RAP and RAS, and bioasphalt. J. Mater. Civ. Eng. 2011, 23, 1569–1574. [Google Scholar] [CrossRef]
  7. Hajj, E.; Souliman, M.; Alavi, M.; Salazar, L.G.L. Influence of hydrogreen bioasphalt on viscoelastic properties of reclaimed asphalt mixtures. Transp. Res. Rec. 2013, 2371, 13–22. [Google Scholar] [CrossRef]
  8. Pouget, S.; Loup, F. Thermo-mechanical behaviour of mixtures containing bio-binders. Road Mater. Pavement Des. 2013, 14 (Suppl. 1), 212–226. [Google Scholar] [CrossRef]
  9. Hong, F.; Prozzi, J.A. Evaluation of recycled asphalt pavement using economic, environmental, and energy metrics based on long-term pavement performance sections. Road Mater. Pavement Des. 2018, 19, 1816–1831. [Google Scholar] [CrossRef]
  10. Braham, A.; Lynn, T.; Steger, R.; Pyle, R. Characterizing Compactability of High RAP and Warm Mix Asphalt Mixtures in the Superpave Gyratory Compactor. J. Test. Eval. 2015, 43, 535–543. [Google Scholar] [CrossRef]
  11. Doyle, J.D.; Howard, I.L. Thermal Cracking Potential of High RAP-WMA Evaluated with Bending Beam Rheometer Mixture Beam Test. J. Test. Eval. 2013, 41, 236–246. [Google Scholar] [CrossRef]
  12. Olard, F.; Le Noan, C.; Bonneau, D.; Dupriet, S.; Alvarez, C. Very high recycling rate (>50%) in hot mix and warm mix asphalts for sustainable road construction. In Proceedings of the 4th Eurasphalt Eurobitume Congress, Copenhagen, Denmark, 21–23 May 2008. [Google Scholar]
  13. Sun, Y.; Wang, W.; Chen, J. Investigating impacts of warm-mix asphalt technologies and high reclaimed asphalt pavement binder content on rutting and fatigue performance of asphalt binder through MSCR and LAS tests. J. Clean. Prod. 2019, 219, 879–893. [Google Scholar] [CrossRef]
  14. Eddhahak-Ouni, A.; Dony, A.; Colin, J.; Mendez, S.; Navaro, J.; Drouadaine, I.; Bruneau, D. Experimental investigation of the homogeneity of the blended binder of a high rate recycled asphalt. Road Mater. Pavement Des. 2012, 13, 566–575. [Google Scholar] [CrossRef]
  15. Mangiafico, S.; Di Benedetto, H.; Sauzeat, C.; Olard, F.; Pouget, S.; Dupriet, S.; Planque, L.; Van Rooijen, R. Statistical analysis of the influence of RAP and Mix Composition on Viscoelastic and Fatigue Properties of Asphalt Mixes. Mater. Struct. 2015, 48, 1187–1205. [Google Scholar] [CrossRef]
  16. Mangiafico, S.; Sauzéat, C.; Di Benedetto, H. Comparison of different blending combinations of virgin and RAP-extracted binder: Rheological simulations and statistical analysis. Constr. Build. Mater. 2019, 197, 454–463. [Google Scholar] [CrossRef]
  17. Noferini, L.; Simone, A.; Sangiorgi, C.; Mazzotta, F. Investigation on performances of asphalt mixtures made with Reclaimed Asphalt Pavement: Effects of interaction between virgin and RAP bitumen. Int. J. Pavement Res. Technol. 2017, 10, 322–332. [Google Scholar] [CrossRef]
  18. Behnood, A. Application of rejuvenators to improve the rheological and mechanical properties of asphalt binders and mixtures: A review. J. Clean. Prod. 2019, 231, 171–182. [Google Scholar] [CrossRef]
  19. Forton, A.; Mangiafico, S.; Sauzéat, C.; Di Benedetto, H.; Marc, P. Properties of blends of fresh and RAP binders with rejuvenator: Experimental and estimated results. Constr. Build. Mater. 2020, 236, 117555. [Google Scholar] [CrossRef]
  20. Podolsky, J.H.; Saw, B.; Elkashef, M.; Williams, C.; Cochran, E.W. Rheology and mix performance of rejuvenated high RAP field produced hot mix asphalt with a soybean derived rejuvenator. Road Mater. Pavement Des. 2020. [Google Scholar] [CrossRef]
  21. Baaj, H.; Ech, M.; Tapsoba, N.; Sauzeat, C.; Di Benedetto, H. Thermomechanical characterization of asphalt mixtures modified with high contents of asphalt shingle modifier (ASM®) and reclaimed asphalt pavement (RAP). Mater. Struct. 2013, 46, 1747–1763. [Google Scholar] [CrossRef]
  22. Hajj, E.; Sebaaly, P.E.; Shrestha, R. Laboratory evaluation of mixes containing recycled asphalt pavement (RAP). Road Mater. Pavement Des. 2009, 10, 495–517. [Google Scholar] [CrossRef]
  23. Hong, F.; Chen, D.; Mikhail, M. Long-term performance evaluation of recycled asphalt pavement results from Texas: Pavement studies category 5 sections from the long-term pavement performance program. Transp. Res. Rec. 2010, 2180, 58–66. [Google Scholar] [CrossRef]
  24. Hong, F.; Guo, R.; Zhou, F. Impact of recycled asphalt pavement material variability on pavement performance. Road Mater. Pavement Des. 2014, 15, 841–855. [Google Scholar] [CrossRef]
  25. Huang, S.C.; Pauli, A.T.; Grimes, R.W.; Turner, F. Ageing characteristics of RAP binder blends—What types of RAP binders are suitable for multiple recycling? Road Mater. Pavement Des. 2014, 15, 113–145. [Google Scholar] [CrossRef]
  26. Lakshmi Roja, K.; Masad, E.; Mogawer, W. Performance and blending evaluation of asphalt mixtures containing reclaimed asphalt pavement. Road Mater. Pavement Des. 2020. [Google Scholar] [CrossRef]
  27. Mangiafico, S.; Di Benedetto, H.; Sauzéat, C.; Olard, F.; Pouget, S.; Planque, L. New method to obtain viscoelastic properties of bitumen blends from pure and reclaimed asphalt pavement binder constituents. Road Mater. Pavement Des. 2014, 15, 312–329. [Google Scholar] [CrossRef]
  28. Mangiafico, S.; Sauzéat, C.; Di Benedetto, H.; Pouget, S.; Olard, F.; Planque, L. Quantification of biasing effects during fatigue tests on asphalt mixes: Non-linearity, self-heating and thixotropy. Road Mater. Pavement Des. 2015, 16, 73–99. [Google Scholar] [CrossRef]
  29. Mensching, D.J.; Sias Daniel, J.; Bennert, T.; Medeiros, M.S., Jr.; Elwardany, M.D.; Mogawer, W.; Hajj, E.Y.; Alavi, M.Z. Low temperature properties of plant-produced RAP mixtures in the Northeast. Road Mater. Pavement Des. 2014, 15, 1–27. [Google Scholar] [CrossRef]
  30. Mogawer, W.; Bennert, T.; Daniel, J.S.; Bonaquist, R.; Austerman, A.; Booshehrian, A. Performance characteristics of plant produced high RAP mixtures. Road Mater. Pavement Des. 2012, 13, 183–208. [Google Scholar] [CrossRef]
  31. Pedraza, A.; Di Benedetto, H.; Sauzéat, C.; Pouget, S. 3D Linear viscoelastic behaviour of bituminous mixtures containing high content of multi-recycled RAP. Road Mater. Pavement Des. 2019. [Google Scholar] [CrossRef]
  32. Sias Daniel, J.; Gibson, N.; Tarbox, S.; Copeland, A.; Andriescu, A. Effect of long-term ageing on RAP mixtures: Laboratory evaluation of plant-produced mixtures. Road Mater. Pavement Des. 2013, 14 (Suppl. 2), 173–192. [Google Scholar] [CrossRef]
  33. Zhou, F.; Hu, S.; Das, G.; Scullion, T. High RAP Mixes Design Methodology with Balanced Performance (Report No. FHWA/TX-11/0-6092-2). Available online: https://static.tti.tamu.edu/tti.tamu.edu/documents/0-6092-2.pdf (accessed on 11 November 2020).
  34. Baaj, H.; Di Benedetto, H.; Chaverot, P. Effect of binder characteristics on fatigue of asphalt pavement using an intrinsic damage approach. Road Mater. Pavement Des. 2005, 6, 147–174. [Google Scholar] [CrossRef]
  35. Di Benedetto, H.; De La Roche, C.; Baaj, H.; Pronk, A.; Lundström, R. Fatigue of Bituminous Mixtures. Mater. Struct. 2004, 15, 202–216. [Google Scholar] [CrossRef]
  36. Di Benedetto, H.; Nguyen, Q.T.; Sauzeat, C. Nonlinearity, Heating, Fatigue and Thioxotropy during cyclic loading of Asphalt Mixtures. Road Mater. Pavement Des. 2011, 12, 129–158. [Google Scholar] [CrossRef]
  37. Lundström, R.; Di Benedetto, H.; Isacsson, U. Influence of asphalt mixture stiffness on fatigue failure. J. Mater. Civ. Eng. 2004, 16, 516–525. [Google Scholar] [CrossRef]
  38. Nguyen, Q.T.; Di Benedetto, H.; Sauzéat, C. Determination of thermal properties of asphalt mixtures as another output from cyclic tension-compression test. Road Mater. Pavement Des. 2012, 13, 85–103. [Google Scholar] [CrossRef]
  39. Shen, S.; Sutharsan, T. Quantification of Cohesive Healing of Asphalt Binder and its Impact Factors Based on Dissipated Energy Analysis. Road Mater. Pavement Des. 2011, 12, 525–546. [Google Scholar] [CrossRef]
  40. Tapsoba, N.; Sauzeat, C.; Di Benedetto, H. Analysis of fatigue test for bituminous mixtures. J. Mater Civ. Eng. 2013, 25, 701–710. [Google Scholar] [CrossRef]
  41. Zhang, J.; Sabouri, M.; Guddati, M.N.; Kim, Y.R. Development of a failure criterion for asphalt mixtures under fatigue loading. Road Mater. Pavement Des. 2013, 14 (Suppl. 2), 1–15. [Google Scholar] [CrossRef]
  42. Kandhal, P.S.; Koehler, W.C. Effect of rheological properties of asphalts on pavement cracking. Asph. Theol. Relatsh. ASTM STP 1987, 941, 99–117. [Google Scholar]
  43. Sauzéat, C.; Di Benedetto, H.; Chaverot, P.; Gauthier, G. Low temperature behaviour of bituminous mixes: TSRS tests and acoustic emission. In Characterization of Pavement and Soil Engineering Materials; Loizos, S., Scarpas, A., Al-Qadi, I., Eds.; Taylor Francis Group: London, UK, 2007. [Google Scholar]
  44. Moon, K.H.; Falchetto, A.C.; Marasteanu, M.O. Rheological modelling of asphalt materials properties at low temperatures: From time domain to frequency domain. Road Mater. Pavement Des. 2013, 14, 810–830. [Google Scholar] [CrossRef]
  45. EN 13108-8:2016 Standard. Bituminous Mixtures—Part 8: Reclaimed Asphalt; AFNOR: La Plaine Saint-Denis, France, 2016. [Google Scholar]
  46. NF EN 12697-33+A1. Mélange Bitumineux—Méthodes d’essai pour Mélange Hydrocarboné à Chaud—Partie 33: Confection d’éprouvettes au Compacteur de Plaque; Norme Européenne—Norme Française AFNOR: La Plaine Saint-Denis, France, 2007. [Google Scholar]
  47. NF P 98-086. Chaussées—Terrassements—Dimensionnement des Chaussées Routières—Détermination des Trafics Routiers pour le Dimensionnement des Structures de Chaussée; French Standard AFNOR: La Plaine Saint-Denis, France, 2019. [Google Scholar]
  48. Pham, N.H.; Sauzéat, C.; Di Benedetto, H.; Gonzalez-Leon, J.A.; Barreto, G.; Nicolai, A.; Jakubowski, M. Reclaimed asphalt pavement and additives’ influence on 3D linear behaviour of warm mix asphalts. Road Mater. Pavement Des. 2015, 16, 569–591. [Google Scholar] [CrossRef]
  49. Pham, N.H.; Sauzéat, C.; Di Benedetto, H.; Gonzalez-Leon, J.A.; Barreto, G.; Nicolai, A.; Jakubowski, M. Analysis and modeling of 3D complex modulus tests on hot and warm bituminous mixtures. Mech. Time Depend. Mater. 2015, 19, 167–186. [Google Scholar] [CrossRef]
  50. Tapsoba, N.; Sauzéat, C.; Di Benedetto, H.; Baaj, H.; Ech, M. Three dimensional analysis of fatigue tests on bituminous mixtures. Fatigue Fract. Eng. Mater. Struct. 2015, 38, 730741. [Google Scholar] [CrossRef]
Figure 1. (a) General view of the cylindrical specimen inside the thermal chamber, equipped with axial strain (extensometers) and radial strain (non-contact sensors) measurement devices. (b) Cross section indicating the position of the 3 extensometers and 4 non-contact sensors around the specimen.
Sustainability 12 09812 g001
Figure 2. (a) The French rolling wheel compactor and (b) the slab from the French rolling wheel compactor and specimen material directions.
Sustainability 12 09812 g002
Figure 3. The aggregate grading curves of the nine tested bituminous mixtures.
Sustainability 12 09812 g003
Figure 4. Evolution of the norm and the phase angle of E* during the C7P2M5 fatigue test (strain amplitude 84 µm/m) versus the number of cycles.
Sustainability 12 09812 g004
Figure 5. Evolution of the norm and the phase angle of ν* in two radial directions II and III during the C7P2M5 fatigue test (strain amplitude 84 µm/m) versus the number of cycles.
Sustainability 12 09812 g005
Figure 6. Norm of the complex modulus versus the number of cycles and criterion Nf50% for Nfailure.
Sustainability 12 09812 g006
Figure 7. Norm of complex modulus versus the number of cycles and criterion Nfφmax for Nfailure.
Sustainability 12 09812 g007
Figure 8. Differences in phases angles versus the number of cycles and criterion NfΔφ for Nfailure.
Sustainability 12 09812 g008
Figure 9. Dissipated energy ratio evolution versus the number of cycles and criterion NfWN for Nfailure.
Sustainability 12 09812 g009
Figure 10. Wöhler curves with the criterion Nf50% for the nine tested materials.
Sustainability 12 09812 g010
Figure 11. The ε6 values obtained from the four considered criteria, for materials M1 (HM), M2 (HM30), M1-2 (HM) and M2-2 (HM30).
Sustainability 12 09812 g011
Figure 12. The ε6 values obtained from the four considered criteria, for the materials M3 (WME0.4), M4 (WM30E0.4), M5 (WM30B0.4), M6 (WM50E0.4) and M7 (WM50B0.4).
Sustainability 12 09812 g012
Figure 13. The ε6 values obtained from the four considered criteria, for the materials M1-2 (HM), M2-2 (HM30), M3 (WME0.4), M4 (WM30E0.4) and M5 (WM30B0.4).
Sustainability 12 09812 g013
Figure 14. Axial stress–temperature curves for the B2P2M5 TSRS test.
Sustainability 12 09812 g014
Figure 15. Radial strains in directions II and III versus temperature curves for the B2P2M5 TSRS test.
Sustainability 12 09812 g015
Figure 16. Failure temperature (a) and failure stress (b) values of materials M1 (HM), M2 (HM30), M1-2 (HM) and M2-2 (HM30).
Sustainability 12 09812 g016
Figure 17. The failure temperature (a) and failure stress (b) values of materials M1-2 (HM), M2-2 (HM30), M3 (WME0.4), M4 (WM30E0.4), M5 (WM30B0.4), M6 (WM50E0.4) and M7 (WM50B0.4).
Sustainability 12 09812 g017
Figure 18. Failure temperature (a) and failure stress (b) values of materials M1-2 (HM), M2-2 (HM30), M3 (WME0.4), M4 (WM30E0.4) and M5 (WM30B0.4).
Sustainability 12 09812 g018
Table 1. Recorded cycles during the fatigue test.
Number of Cycles (N)Recording PeriodNumber of Recorded Cycles
Cycle 1 to 1000All cycles1000
Cycle 1000 to 10,0002 cycles every 20 cycles900
Cycle 10,000 to 100,0002 cycles every 200 cycles900
Cycle 100,000 to 1,000,0002 cycles every 2000 cycles900
After one million2 cycles every 5000 cycles---
Table 2. The tested materials.
Material numberM1/M1-2M2/M2-2M3M4M5M6M7
Material nameHMHM30WME0.4WM30E0.4WM30B0.4WM50E0.4WM50B0.4
Production processHotHotWarmWarmWarmWarmWarm
%RAP-30-30305050
Type of additive--add. Eadd. Eadd. Badd. Eadd. B
%Additive--0.40.40.40.40.4
Table 3. Failure temperature and failure stress values.
MaterialSpecimenVoids (%)Failure Temperature (°C)Failure Stress (MPa)
AverageStandard Deviation AverageStandard Deviation
M1 (HM)B1P1M111.7−18.4−16.82.12.432.330.24
(10.1%)
B2P1M111.2−14.42.06
B5P1M110.1−17.62.50
M1−2 (HM)B1P2M1−27.2−19.6−19.40.33.483.470.01
(0.2%)
B4P2M1−27.0−19.53.47
B5P2M1−27.3−19.13.47
M2 (HM30)B1P2M212.9−15.7−17.51.82.072.350.25
(10.6%)
B2P2M213.0−17.62.43
B5P2M213.0−19.22.55
M2−2 (HM30)B2P2M2−26.4−19.6−19.60.63.583.420.14
(4.2%)
B3P2M2−26.9−19.03.30
B4P2M2−27.2−20.13.38
M3 (WME0.4)B2P2M37.2−18.7−18.60.32.782.800.04
(1.4%)
B3P2M37.1−18.92.84
B4P2M37.6−18.32.77
M4 (WM30E0.4)B2P2M47.3−21.7−19.91.63.142.940.22
(7.4%)
B3P2M47.5−19.12.96
B4P2M47.6−18.82.71
M5 (WM30B0.4)B2P2M57.1−19.7−20.10.42.952.850.14
(4.9%)
B3P3M57.5−20.32.91
B4P3M57.7−20.42.69
M6 (WM50E0.4)B3P2M66.9−21.5−21.00.72.923.240.29
(9.0%)
B4P2M67.0−21.33.49
B5P2M67.2−20.23.32
M7 (WM50B0.4)B1P2M77.4−20.9−21.10.33.543.510.03
(0.9%)
B3P2M77.0−21.43.52
B4P2M77.3−21.03.48
Publisher’s Note: MDPI stays neutral with regard to jurisdictional claims in published maps and institutional affiliations.

