1. Introduction
On 1 April 2016, 174 countries signed the Paris Climate Agreement. These countries agreed to reduce CO2 emissions to limit global temperature rise in this century well below 2 degrees Celsius above pre-industrial levels. The majority of countries, however, are likely to miss their goals in 2020 already, with inconclusive strategies to reach goals in subsequent years. To actually reduce global temperature rise effectively, Greenhouse Gas (GHG) emissions need to be reduced by larger degrees than accomplished in the recent past years.
With an increasing urbanization, most resources are consumed in cities. Accordingly, cities will carry a major responsibility in reducing emissions. Density, mixed use and innovation networks in cities provide an opportunity to establish more environmentally sustainable forms of living. Nevertheless, environmental emission thresholds are exceeded in cities frequently, urban sprawl consumes greenfield sites and high costs of living often make housing unaffordable, at least for low-income households.
In an effort to balance environmental, social and economic demands of resilient development, the United Nations have developed 17 Sustainable Development Goals (SDG) [
1]:
No poverty
Zero hunger
Good health and well-being
Quality education
Gender equality
Clean water and sanitation
Affordable and clean energy
Decent work and economic growth
Industry, innovation and infrastructure
Reduced inequalities
Sustainable cities and communities
Responsible consumption and production
Climate action
Life below water
Life on land
Peace, justice and strong institutions
Partnerships for the goals
These 17 goals cover a wide range of environment, social and economic issues that should be accomplished at the same time, along with the expectation that the targets of the Paris Climate Agreement are also met. Beyond the GHG emission reductions targets, the SDG provide a guideline to develop scenarios of sustainable future development, offering the opportunity to consider the potential efficacy of different policy choices based on their impact on the specific SDG targets. Some policies may have trade-offs or possible conflicts among these goals and the effect of the policies may be different due to local conditions. Therefore, a systematic analytical approach is needed to assess the wide range of impacts of policies with the aim of achieving SDG.
In this research, we used an integrated land use/transport model to assess some radical scenarios. Using indicators, we measure whether we move closer towards SDG, focusing on goals that relate to urban and transport policies. The integrated land use/transport model in this study can output various environmental, economic and social indicators. As moderate scenarios showed limited impact, we also tested more radical scenarios.
We apply this modeling suite to two different regions, namely the Munich Metropolitan area in Germany and the Kagawa prefecture in Japan. Both Germany and Japan are developed countries, but the situation of these two cities is quite different. While the Munich Metropolitan area with a population of 4.5 million continues to grow, the Kagawa prefecture is forecasted to decline from 930,000 by 30% over 40 years. We applied the same policy scenarios to both regions.
The next section provides a brief literature overview of land use/transport research with respect to the SDG. In
Section 3, we describe the structure of the model and introduce the study area. In
Section 4, we discuss the scenarios and indices for the assessment of the SDG.
Section 5 provides the results, before
Section 6 finishes with some concluding remarks.
2. Literature Review
To operationalize the SDGs, the United Nations established both numeric and descriptive targets and indicators as a framework for measuring achievement toward each goal. After the SDGs and its guiding framework were launched, several researchers started to define and measure indicators for their field of study and study area. Stafford-Smith et al. [
2] recommended that a concise set of fully integrated indicators must be developed to monitor and quantify to which degree SDG are met in a certain area. However, extensive metadata are required to support this assessment [
3].
The selection of goals, targets and indicators varied greatly in the field of transportation and land use, with a focus SDG Goal 3 for Good Health and Well-Being and Goal 11 for Sustainable Cities and Communities. Most of the efforts covered Target 3.6 for Goal 3, related to road safety [
4] and transport emissions [
5,
6,
7]; Target 11.2 for Goal 11, related to urban access and transport [
8,
9,
10,
11,
12,
13,
14] and Target 11.3, for Goal 11 related to land use [
15]. A few authors proposed indicators for all fields [
3,
16,
17]. Regarding urban access and transport, authors have focused their analysis on barriers to access public transport for persons with disabilities [
11,
14], quantifying city-wide accessibility [
9] or city-wide mobility inequality [
12], evaluating national accessibility to services [
13] or estimating national sustainability indexes [
10].
Brussel et al. [
9] focused their analysis on equitable accessibility to public transport in Bogota, Colombia. They calculated three indicators: number of public transport stops per km
2, potential accessibility to jobs by zone and proportion of trips shorter than 45 min by zone. However, the number of public transport stops was inadequate to capture inequalities, as there was full supply coverage. Potential accessibility to jobs showed that areas where most of low-income households lived can reach less than 20% of all jobs in 45 min, compared to wealthier areas that had potential accessibilities of more than 60%. When walking and cycling were also included, spatial inequality was reduced, as the differences between central locations and peripheral areas were reduced. Further, the authors expressed the challenge to implement this indicator in the Global South, where most of the public transport is informal and operates without fixed routes, stops and schedules.
Hidayati et al. [
12] studied the evolution of mobility inequality for Jakarta using data from 1940, 1959 and 2018 and linked their results with transport and land use policies implemented in the city. Two measures were used: normalized angular integration (NAIN) and normalized angular choice (NACH), which indicate where potential destinations are located and which potential route choices could be used. The results indicate that transport and land use policies shifted potential destinations from two major streets to highways, encouraging high dependence on private vehicles.
On the other hand, Kompil et al. [
13] mapped accessibility to generic services across Europe using a population grid of 1 × 1 km for 2011. Specifically, they used the average road distance per person to the nearest local facility for each NUTS3 region. Main differences between rural and urban areas and across countries were found. The model could be potentially used to analyze the impact of transport scenarios (such as improving the road network) and land use scenarios (such as including more facilities) on accessibilities.
There is a variety of accessibility measurements proposed in the literature: number of public transport stops per km
2 [
9], the percentage of persons living within 0.5 km of public transport stops [
17] or the percentage of residents living in a 400 m buffer of a local bus stop or 800 m of a train station [
8]; average road distance to the nearest local facility [
13]; potential accessibility to jobs [
9] or proportion of trips shorter than 45 min [
9]. To measure transport sustainability, Mehmann and Teuteberg [
18] studied how fourth-party logistics service providers could reduce transport costs and emissions for agricultural bulk logistics in Germany. De las Heras-Rosas and Herrera [
10] calculated the percentage of respondents that used their car or motorcycle at least once a week in twelve EU countries. The results indicated that the countries using more sustainable modes were not necessarily the ones with greater environmental awareness.
However, all previous studies were focused on current and/or past situation. Only three studies assessed the likely impacts of policies in CO
2 emissions by 2050 [
5,
6,
7]. Specifically, Shukla et al. [
5] delineated one low carbon transport policy scenario and forecast carbon emissions in India in 2050. The scenario included reducing trip length and passenger traffic demand growth rate, a modal shift to mass transit and less energy intensive modes and the decarbonization of the overall energy system. The results showed that the policy reduced by 66% the CO
2 emissions in 2050, compared to the business as usual scenario. Nevertheless, the CO
2 emissions in 2050 were still higher than in 2010. The authors concluded that supply side interventions and greater diffusion of biofuels were also required for the de-carbonization of the transport sector.
In other research, Kii [
7] estimated the reductions in CO
2 emissions from passenger cars in Japan by 2050 for different demographic and technological scenarios. The policies included a compact scenario for the future urban structure, an increase in the share of green vehicles and a decrease of emission factors by automobile technologies. The results indicate that the policies will produce a reduction of CO
2 by 64–70% in 2050 compared to the base year (2010). The impact of urban structure was marginal at the national level. Nevertheless, this substantial reduction is also a consequence of depopulation in Japan, which reduces transport sector activities and its emissions.
Finally, Wegener et al. [
6] assessed how radical policies could reduce the greenhouse emissions of mobility and transport for the 2050 Ruhr Area (Germany). Using an integrated land use/transport model, the authors tested 52 different scenarios that included policies in land use, housing, energy efficiency, car usage reduction, public transport, cycling and walking improvement, and the integration of several of those policies. Specifically, land use policies included compact cities and densification policies at subway or train stations or at main cities. On the other hand, car push measures included reduction of lanes of main roads and area-wide speed limits. All scenarios were combined with two different assumptions on fuel price increase. Land use policies reduced CO
2 building and transport emissions by 30% when combined with high fuel prices, while reducing speed limits reduced CO
2 building and transport emissions by 35% even with low fuel prices and by 50% with high fuel prices. The results show that radical policies are needed to achieve greenhouse gas emission targets.
3. Model Description
A modeling suite of land use, transport and environmental-impact models was used to quantify to what degree selected policies may help to reach SDG.
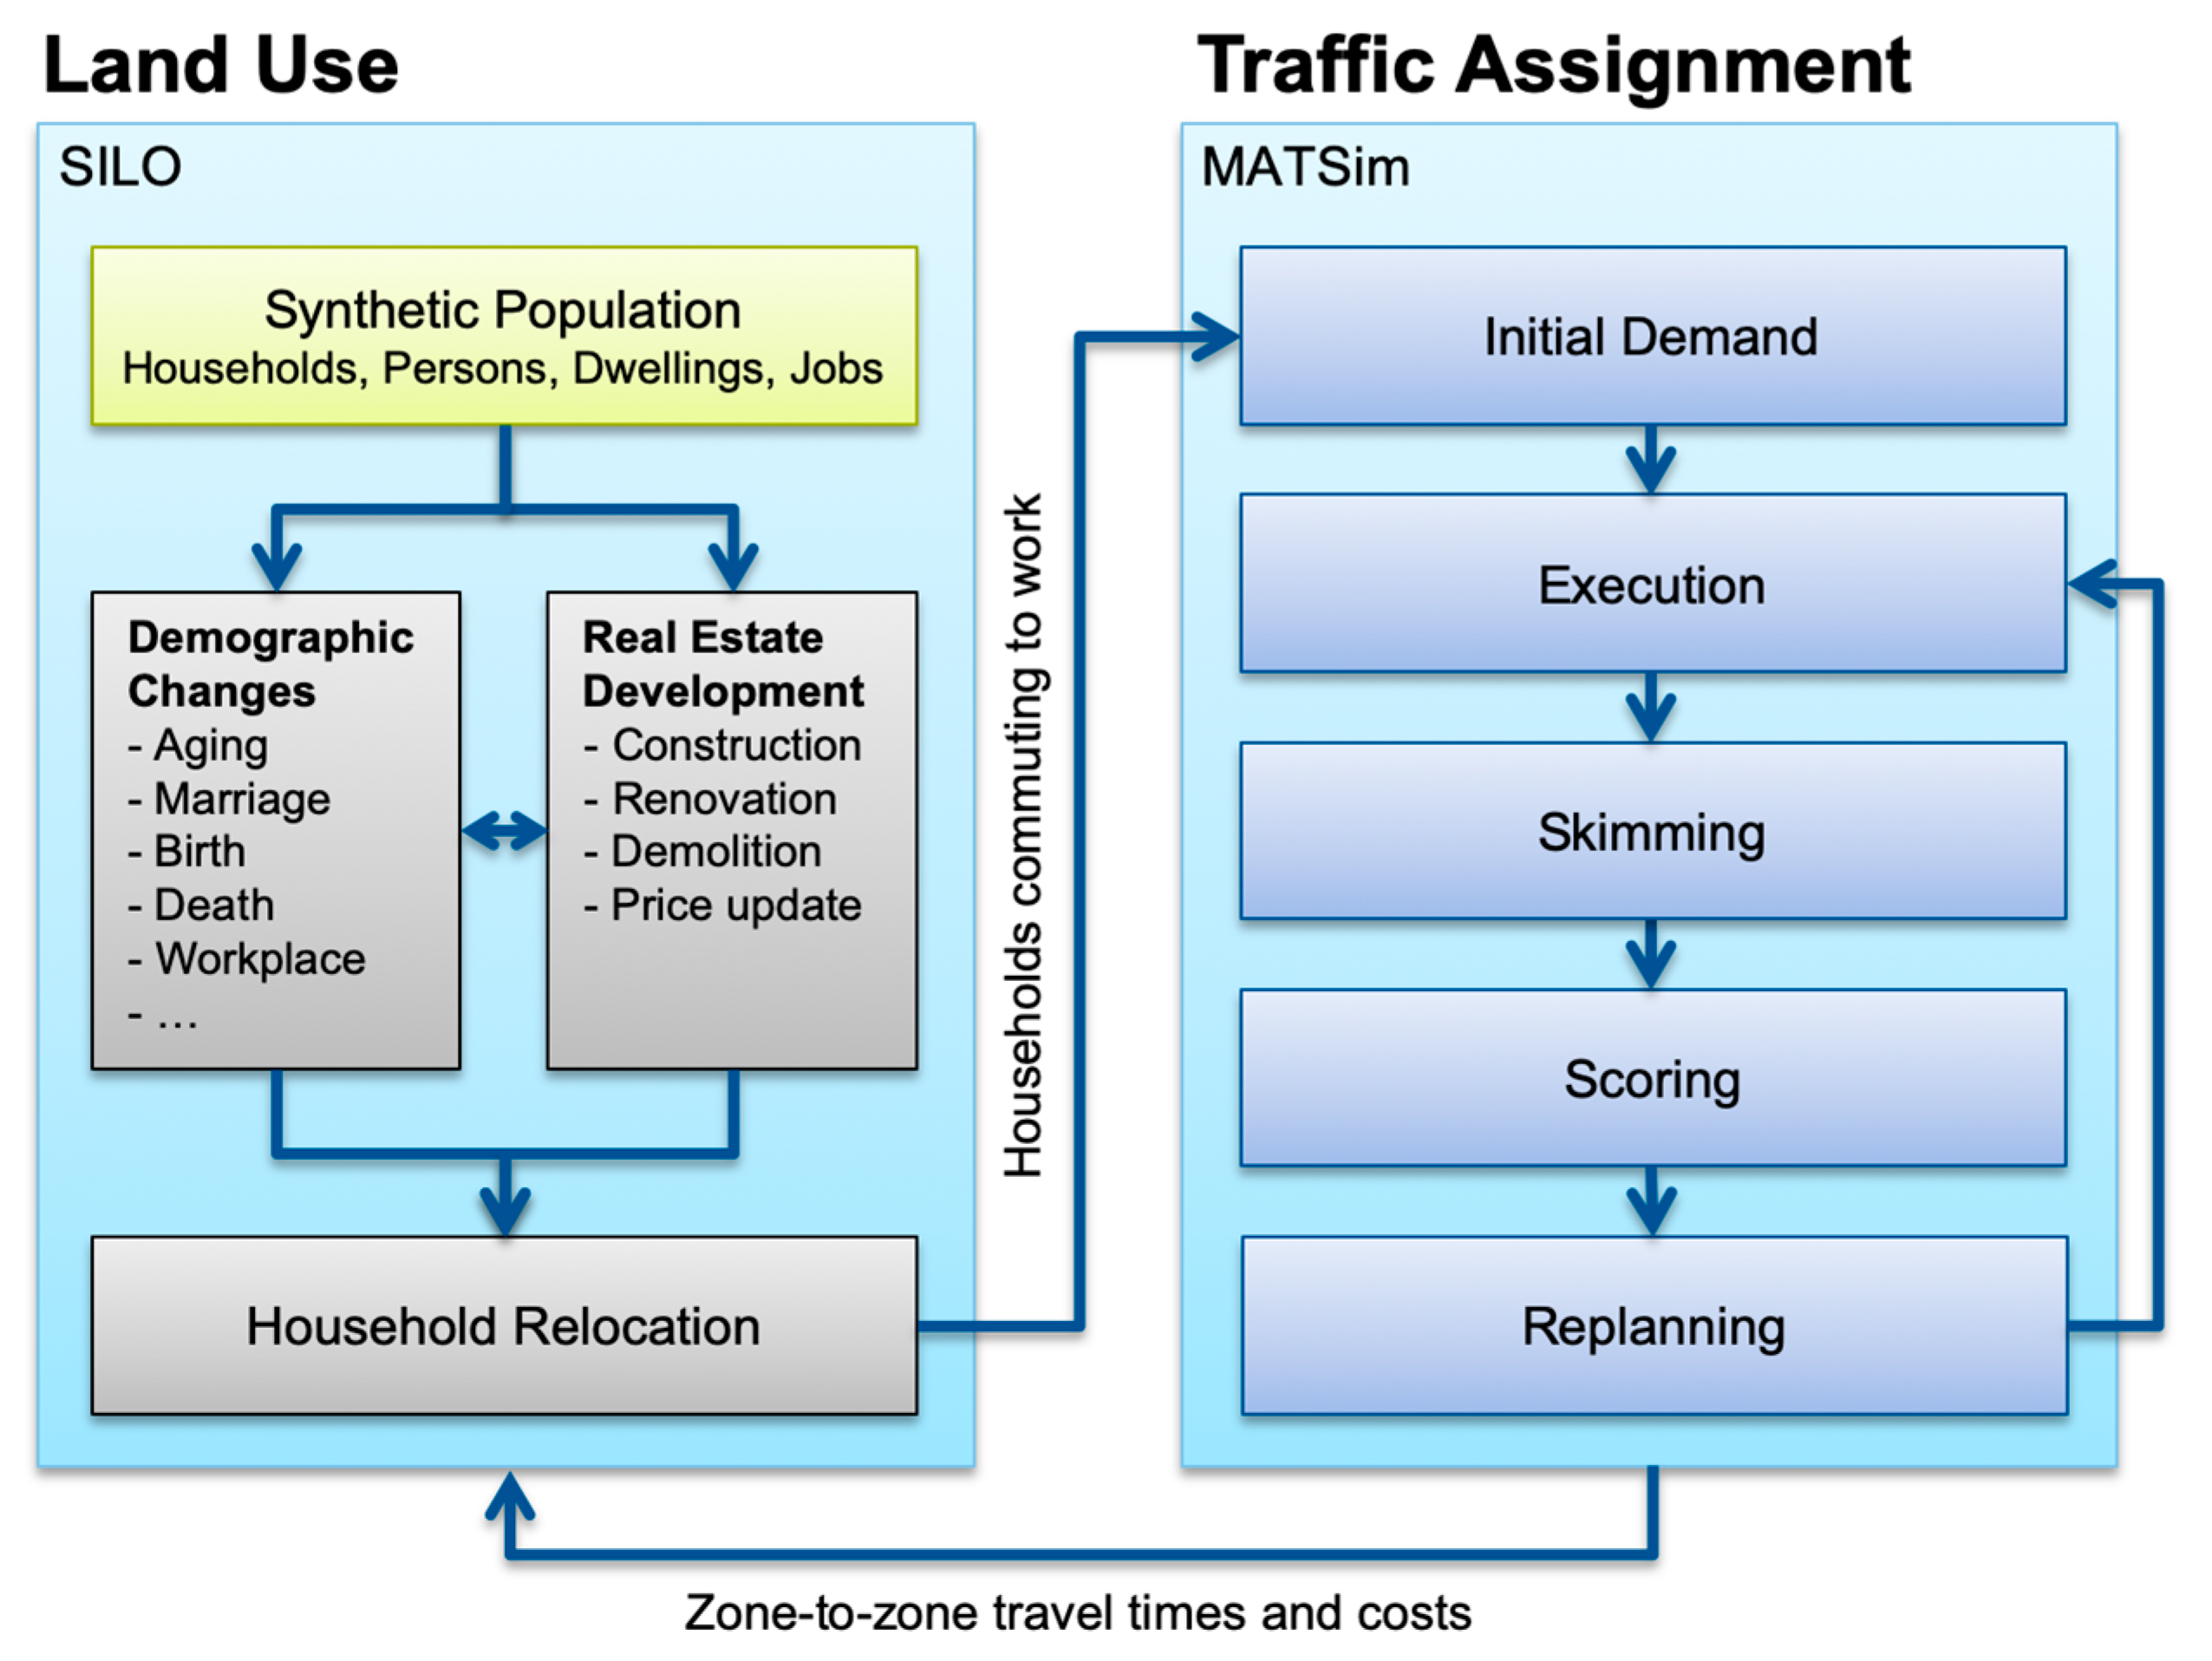
Figure 1 shows an overview of the applied models. The land use model SILO (Simple Integrated Land Use Orchestrator) [
19] simulates demographic transitions, household relocation and changes to the real estate market. SILO was integrated with MATSim (Multi-Agent Transport Simulation) [
20], which is a transport simulation framework that can be used as a Dynamic Traffic Assignment (DTA) model that simulates individual vehicles on the road network. Both models used in this research are open source and written in Java, which facilitates a tight integration [
21].
Both models are agent-based models. In other words, single households and their household members are simulated individually. This allows to add more socio-demographic attributes to each agent, which helps to model demographics, household relocations and travel behavior more realistically.
SILO updates the population on a year-by-year basis from the base year 2011 to the future year 2050. Demographic events, such as giving birth, marriage, leaving parental household, death, and household relocation are executed in a random order to avoid path dependency. Dwelling prices are updated annually, with a steep increase of price when demand is high and a slow reaction of decreasing prices when demand is low. New dwellings are built by developers who attempt to mimic the location preferences of households. Relocation decisions are affected by dwelling attributes and travel time to work.
The land use model selects the predominant commute mode for every worker in a given household. For every worker, the utility to commute by car is and the utility to commute by transit/non-motorized transport are calculated based on travel times by different modes. For transit/non-motorized, the mode with the faster travel time is chosen. Using a binomial logit model, the workers with the highest utility for auto may select the main commute mode first. Workers without a driver’s license have to choose transit/non-motorized. A worker who selects auto as the main commute mode gets assigned a car that cannot be used by other household members. In policy scenarios that reduce the number of cars, fewer workers get the option to choose auto as the main commute mode.
To couple SILO with MATSim, every worker is sent from home to work in the morning hours. Origin and destination are provided in the synthetic population. MATSim tests various routes and departure times in multiple iterations, before an equilibrium has been found. MATSim is computationally more demanding and cannot be run every model year within reasonable model run times. Therefore, MATSim runs are performed for the base year, for three intermediate years and for the final year. Between MATSim runs, travel times are assumed to remain unchanged. Travel times and costs are fed back to SILO and affect household relocation and location selection by developers for new dwellings. Emissions are calculated by MATSim’s emissions extension in which we assume fleet averages of emission factors that additionally depend on vehicle speeds and road types.
Study Areas
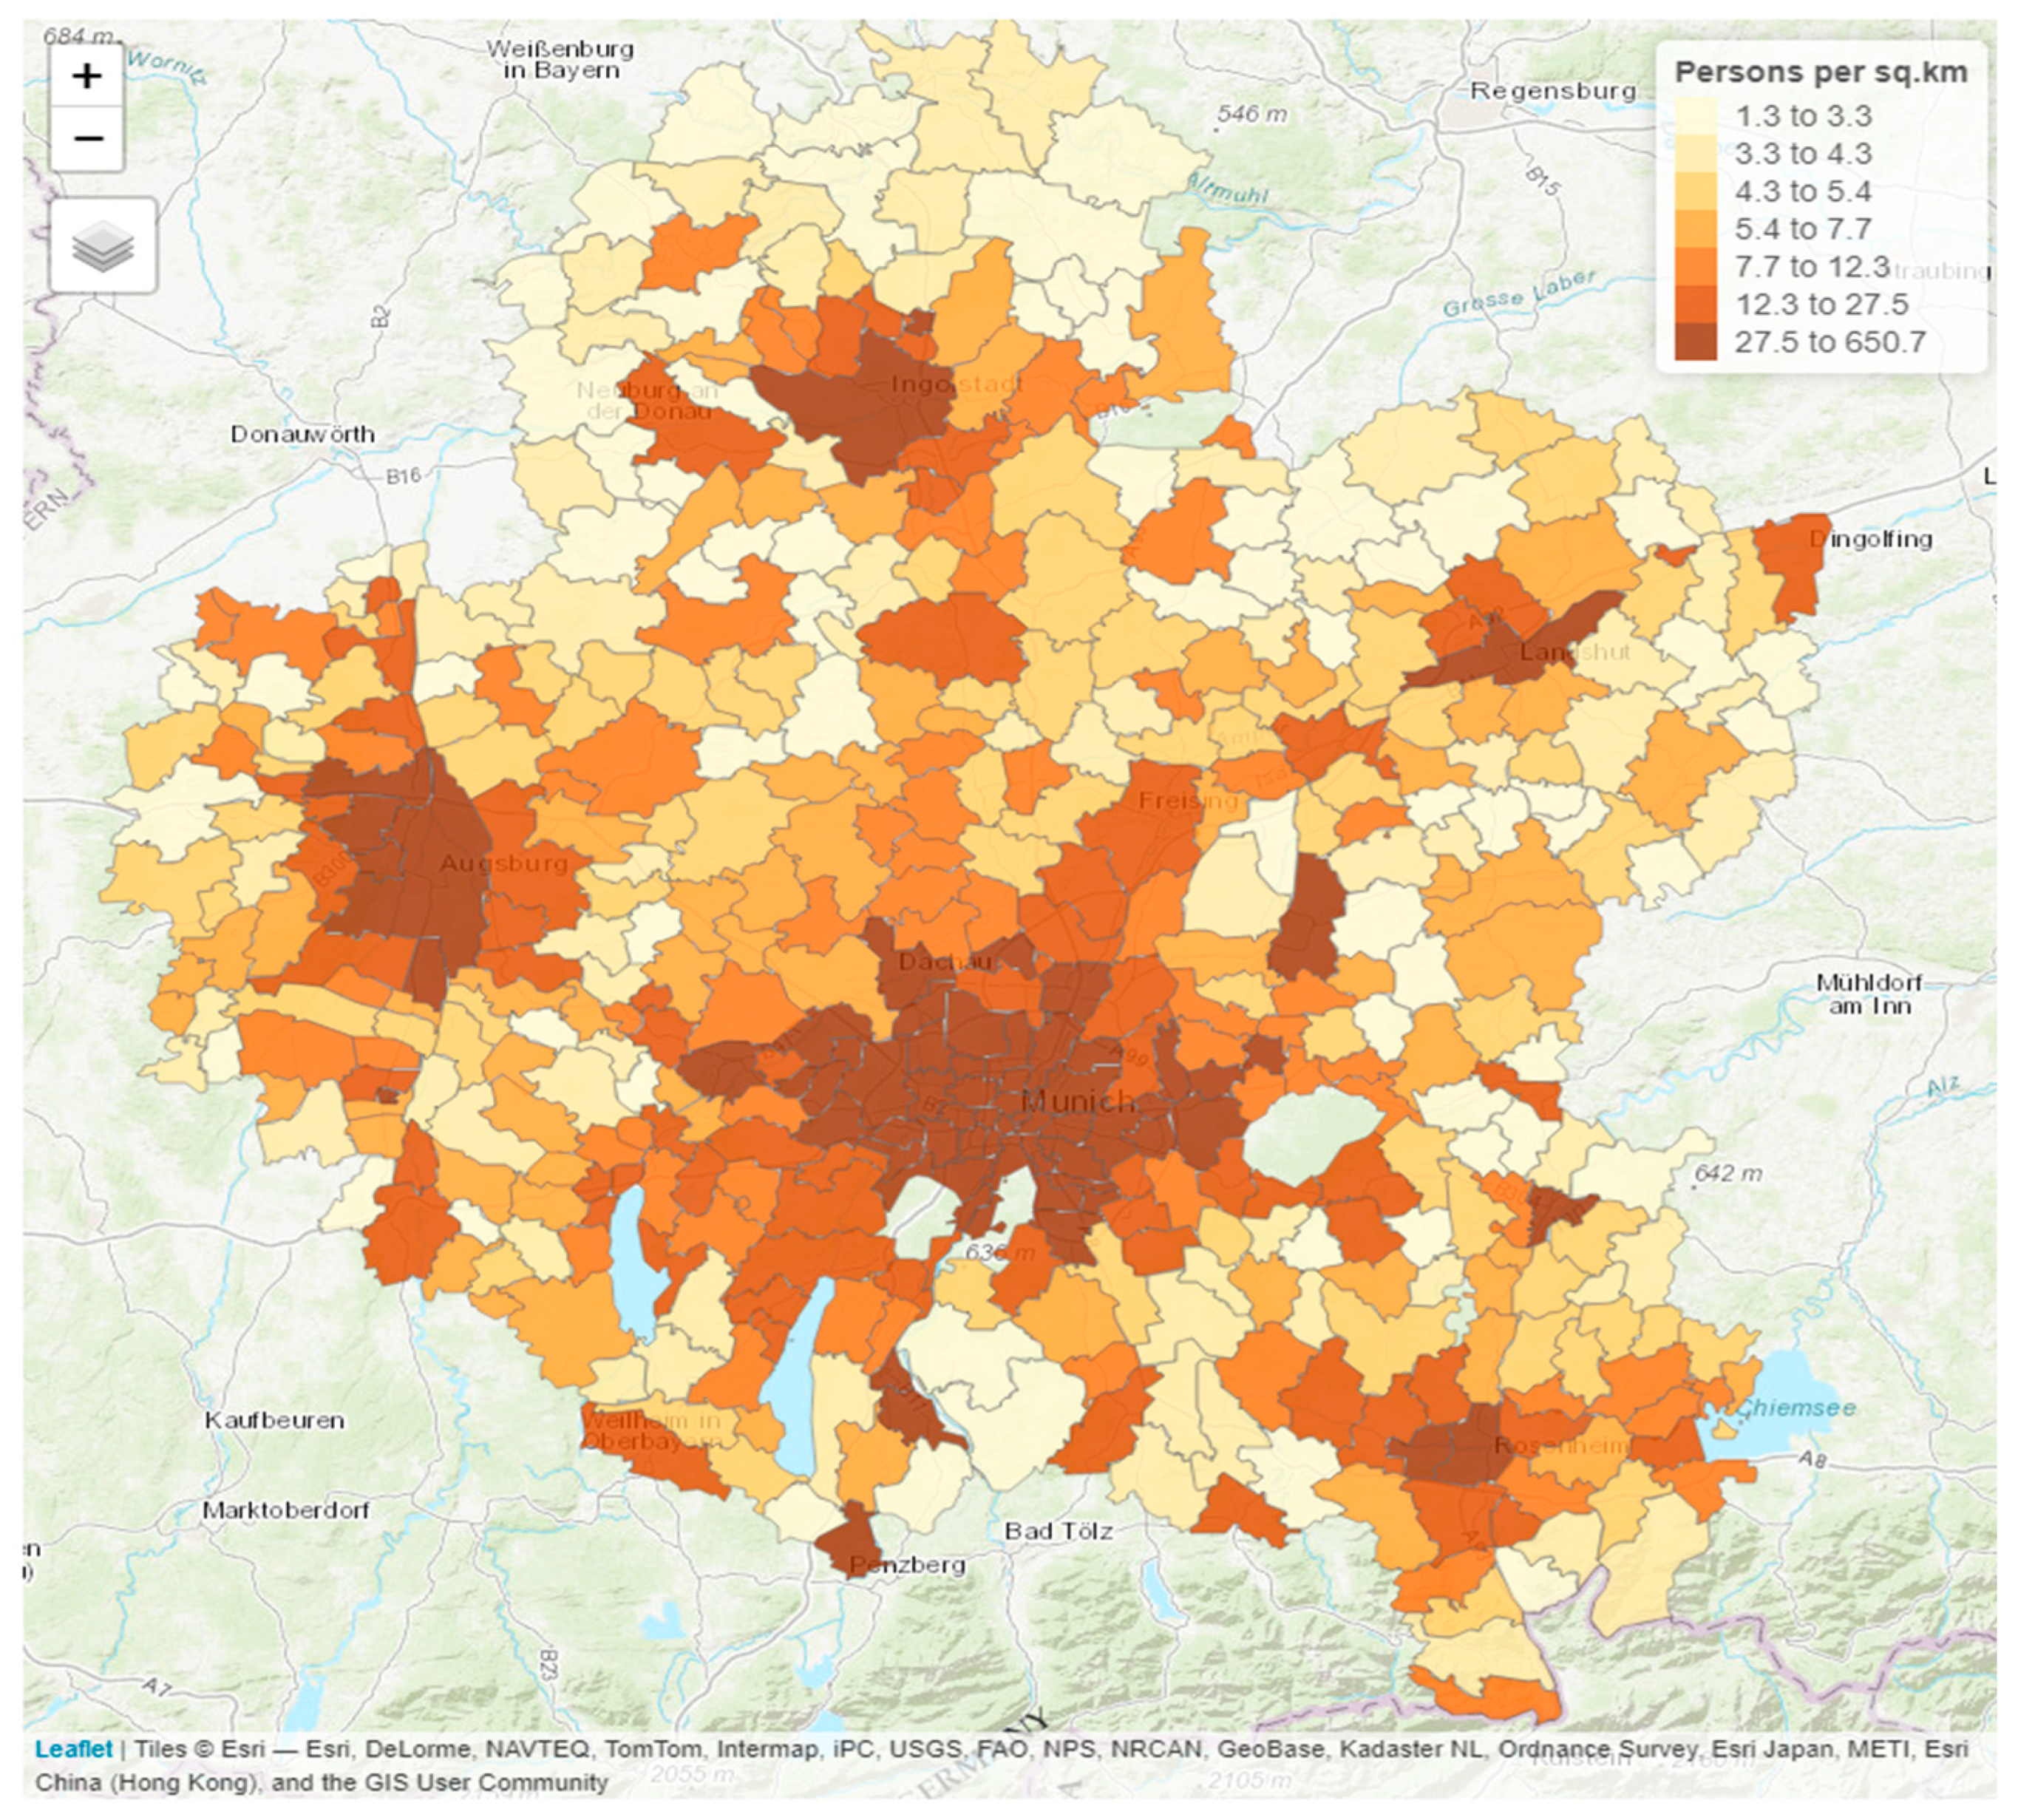
To stress-test the modeling suite in two very different environments, the modeling suite was implemented for the Munich and Kagawa metropolitan areas. The study areas included the municipalities that have strong commuter links to these core cities to better reflect the flows across the region. Munich is the core city of a polycentric region in Upper Bavaria. The commuter flow between the satellite cities of Augsburg, Ingolstadt, Landshut and Rosenheim and Munich is strong and should not be neglected. Therefore, the boundary of the study area differs from jurisdictional boundaries. It includes municipalities which have more than 25% of commuters to any of the five main cities. The study area is covered by 4924 traffic analysis zones that vary in size by population density [
22]. The total population in the study area was 4.5 million in 2011. The population was synthesized to match the control totals of the last German census in 2011 [
23].
Figure 2 shows the population density by traffic analysis zone in the Munich metropolitan area in 2011. This area is forecast to continue to grow by 1% annually to 6.5 Million by 2050.
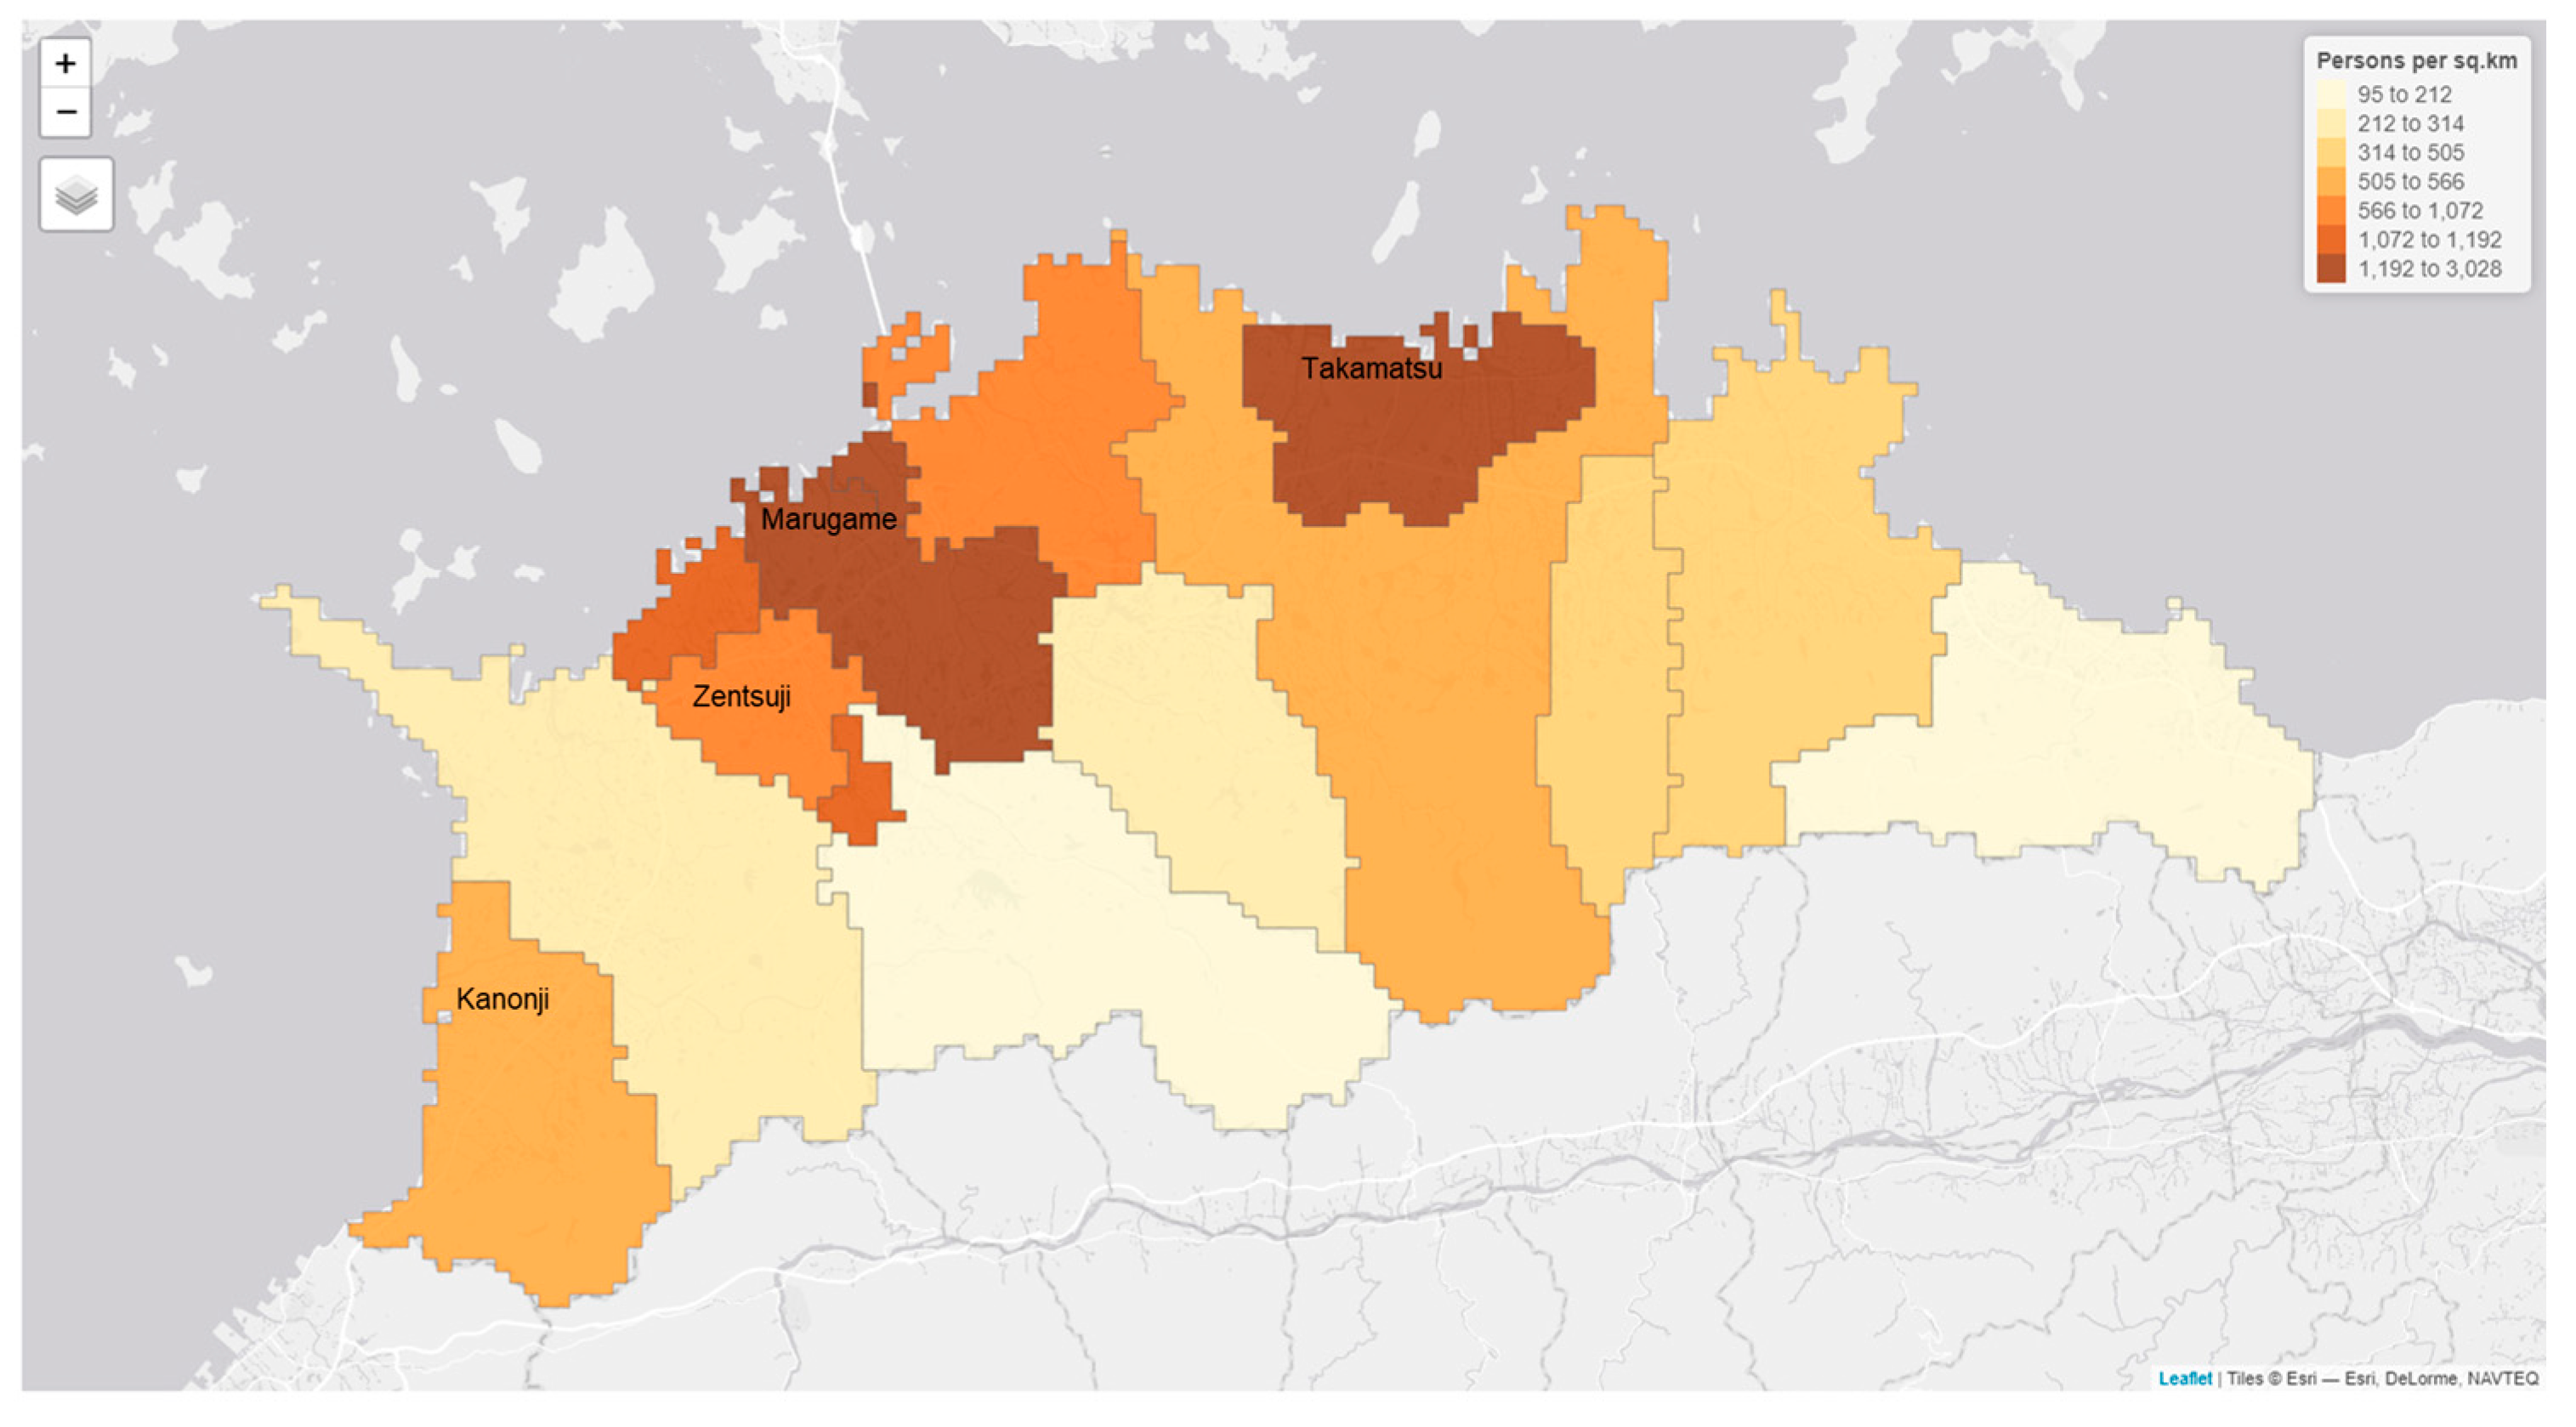
The Kagawa metropolitan area had a population of 930,000 in 2010 and is forecast to continue to shrink to a population of 640,000 by 2050. The census population of the entire Kagawa prefecture already shows a decrease in the census population from 995,842 persons in 2010 to 976,263 persons in 2015. The study area was divided in 6195 equal size traffic analysis zones. We applied the same methodology [
23] to synthesize the population to match the 2010 census.
Figure 3 shows the population density by traffic analysis zone in the Kagawa metropolitan area in 2010.
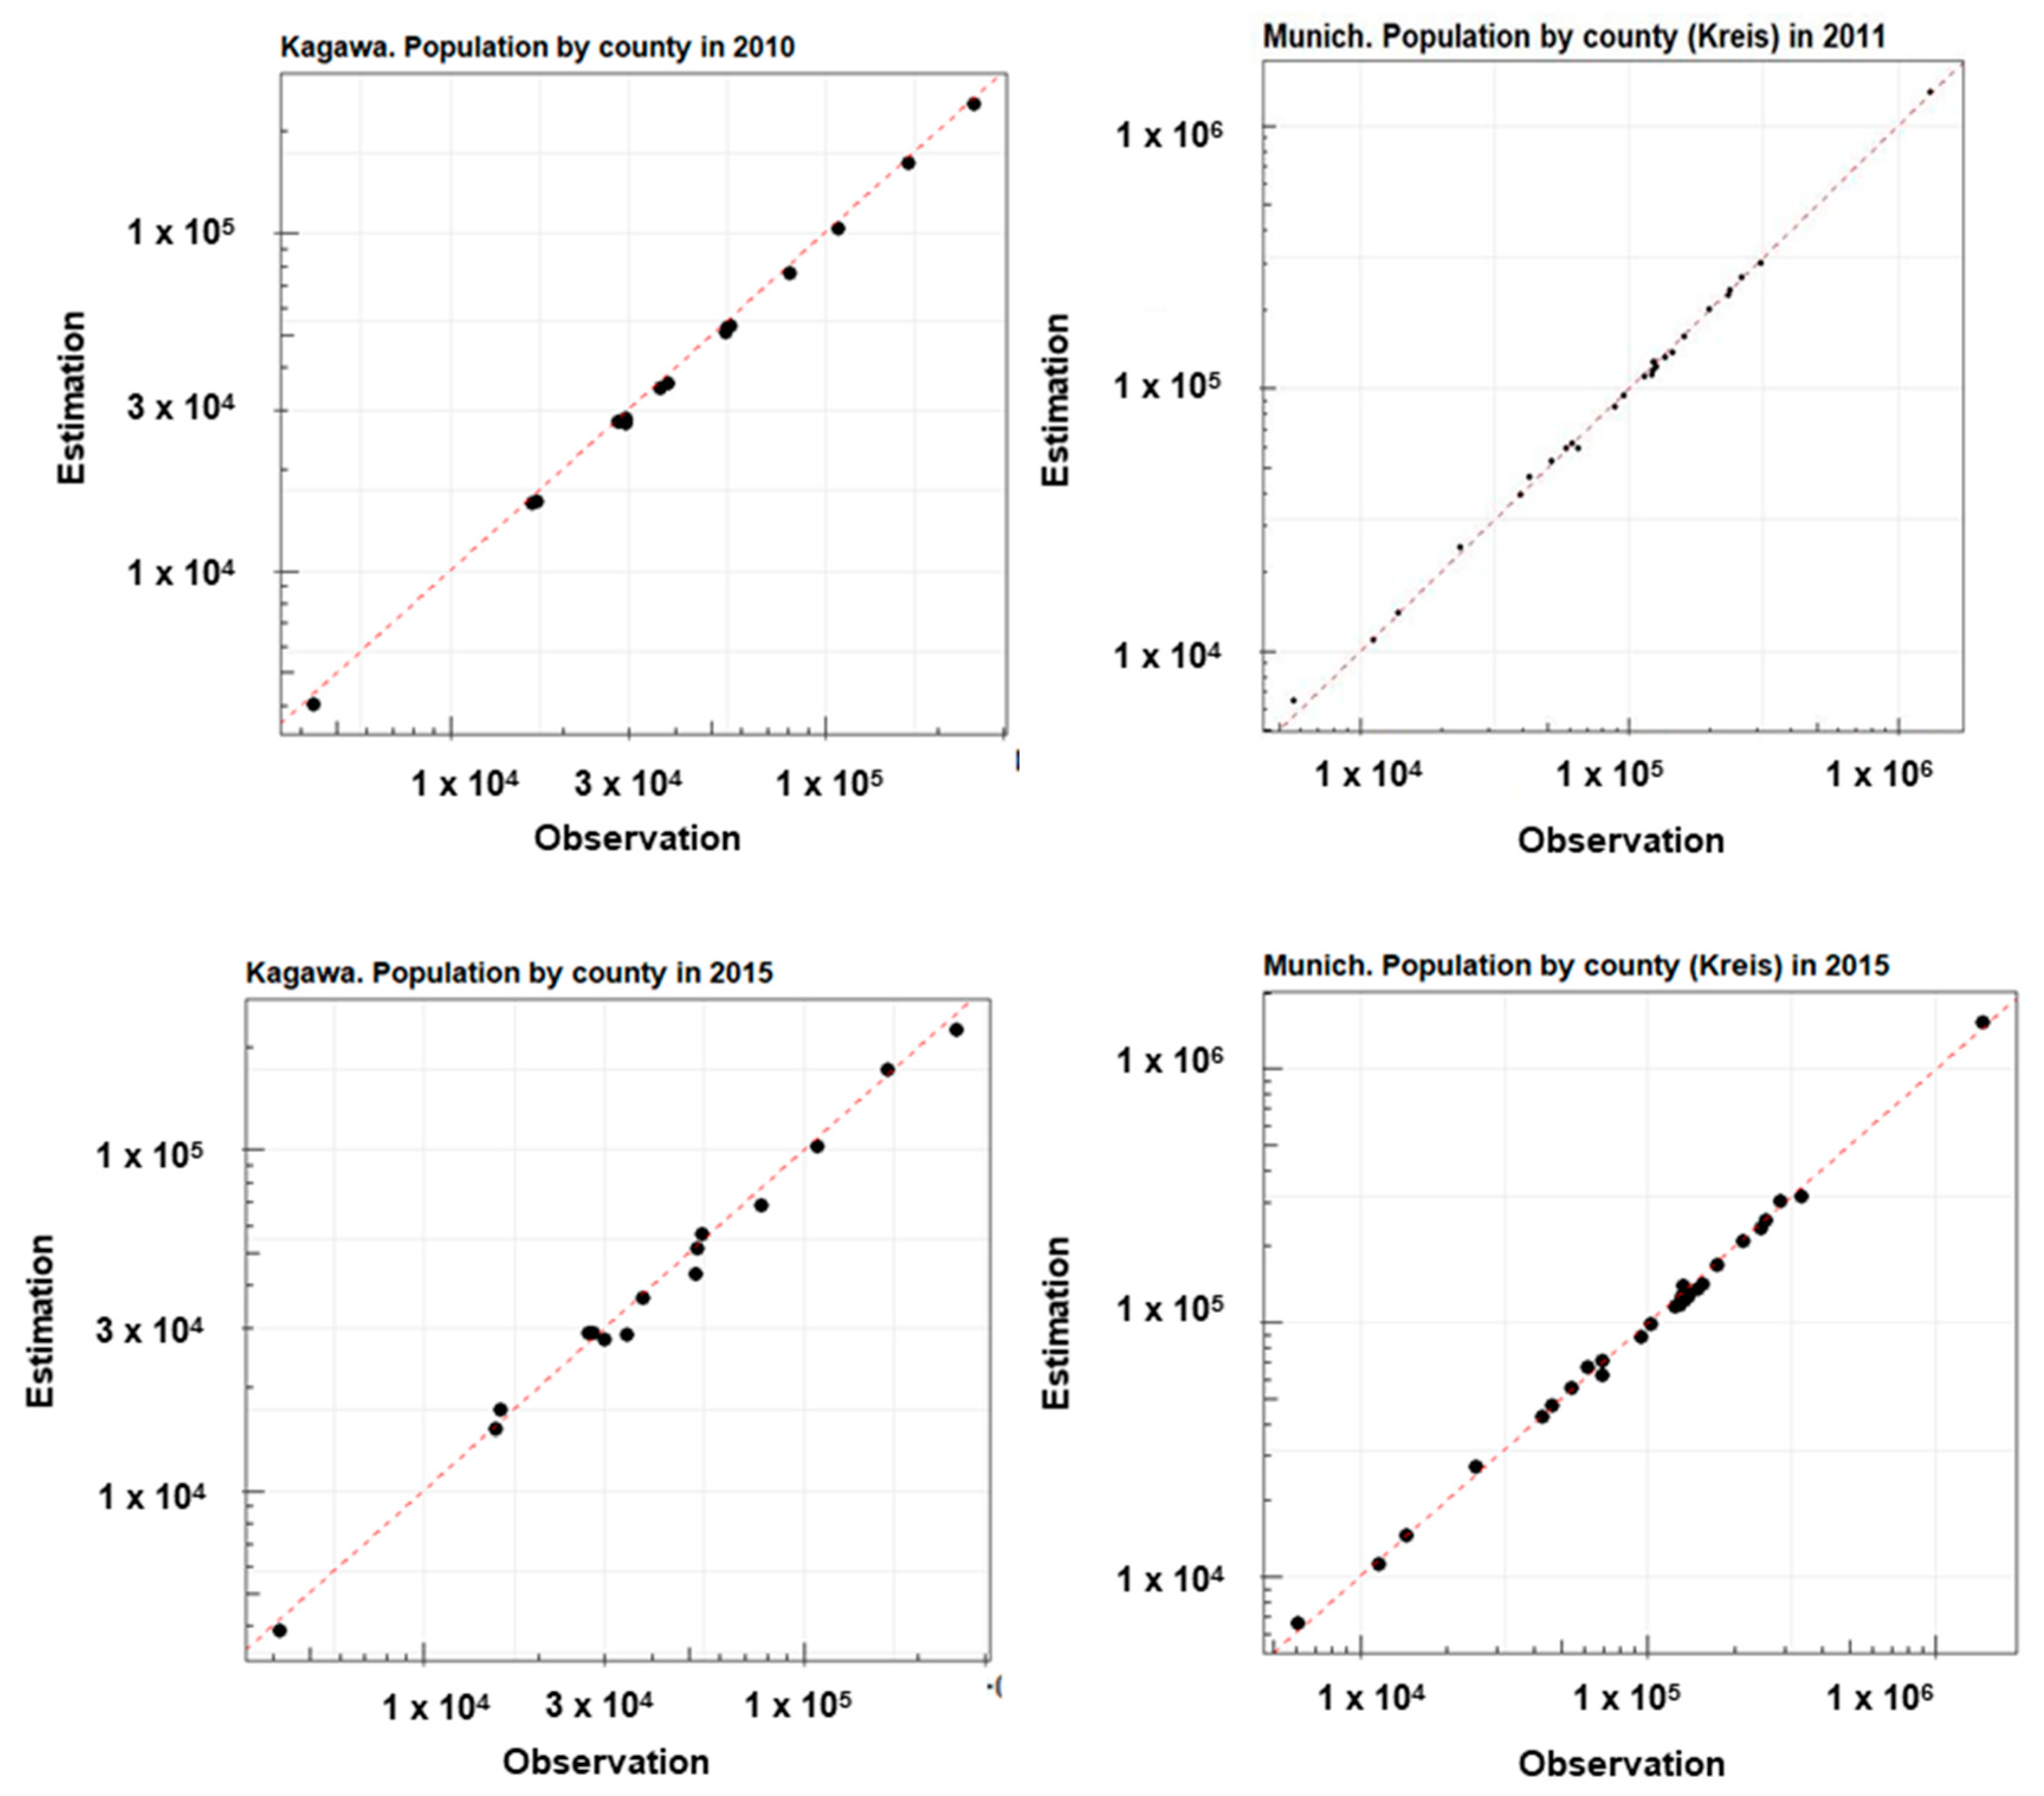
The modeling suite was validated for both study areas by comparing the census population and the estimated population of the model. We used root mean square error (RMSE) and percent RMSE between observed and estimated population by county after the base year (2011 for Munich and 2010 for Kagawa) and 2015.
Table 1 and
Figure 4 summarize the results. As expected, %RMSE increased the longer the simulation period was: from 3.7% after the first simulation year to 14.9% in 2019 in Munich and from 5.2% to 12.7% in Kagawa.
4. Scenarios and Indicators
4.1. Scenarios
Seven scenarios were developed to evaluate the impact of radical transportation and land use strategies on modeled behavior and progress toward the SDG. The scenarios include the base case as well as six policy scenarios intending to discourage personal vehicle trips, encourage people to live closer to work, or stop the continuation of suburbanization. It is expected that the policies will help to achieve SDG reducing CO2 emissions from driving, increasing population density in urban areas, and improving the quality of housing.
4.1.1. Scenario A: Base Scenario
No changes are made to the trends in the base year and the status quo is maintained in future years. With no policy intervention, a continuation of the population decline in the Kagawa region and population increase in Munich region is expected, as well as an increase in CO2 emissions and the continuation of suburbanization in both study areas.
4.1.2. Scenario B: Limit Future Development to Urban Cores
No new development is permitted outside of the urban core. This policy will require all new housing and employment to be located in the urban cores. Additionally, all newly constructed housing must be multi-family dwellings. This scenario does not limit the number of jobs outside the urban cores. Members of households that move from rural areas to the core cities will not immediately change their job. This process is delayed and workers will eventually look for a new job after some time. The intent of this policy is to prevent the continuation of suburbanization and is expected to reduce travel times and CO2 emissions.
4.1.3. Scenario C: One Car Per Household
No households may have more than one vehicle registered to them. After the base year, all households with more than one car must reduce their number of registered vehicles to one. A household may only acquire a new vehicle if they do not already have a vehicle. This strategy is expected to reduce the overall number of vehicle trips and reduce CO2 emissions from motor vehicles.
4.1.4. Scenario D: Reduce Urban Speed Limit to 20 km/h
The speed limit is reduced to 20 km/h on streets in urban areas, except on urban motorways, which currently have a speed limit over 50 km/h. It is assumed that this speed limit reduction will deter local vehicular trips by lowering the attractiveness of driving and reduce CO2 emissions. Additionally, reducing the speed differential between automotive drivers and non-motorized transportation mode users will create safer streets for people to walk and bike. The urban speeds limit in Kagawa and Munich reduce from 50 to 30 km/h in the base case.
4.1.5. Scenario E: Reduce Motorway Speed Limit to 70 km/h
The speed limit is reduced to 70 km/h in rural areas. This policy is expected to reduce CO2 emissions by reducing the attractiveness of driving and it is hypothesized that households will relocate closer to their place of employment to reduce the length of their interurban driving trips. In Kagawa, motorway speeds are typically reduced from 100 km/h. In Munich, the model assumes a speed of 120 km/h for motorways, for motorways with and without speed limit.
4.1.6. Scenario F: Penalty for a Car Commute Greater than 20 min
Every person with a commute time over 20 min is subject to a 200 Euro penalty, imposed on their rental price. The intent is to increase the relevance of the factor commuting time in household location choice. This financial penalty is assumed to encourage people to live closer to where they work by making long commutes less desirable, reduce CO2 emissions from all modes of transportation and encourage population growth near job centers.
4.1.7. Scenario G: Draconian Urban Resettlement
No new development is permitted outside of core and medium-sized cities and resettlement from rural areas to urban cores is required. Every year, each job in the rural area has a 10% probability of being moved to core or medium-sized cities and 10% of all rural housing stock is demolished. All newly constructed housing must be multifamily dwellings located in the urban core. After 15 years, most jobs will be located in the urban cores and most rural housing has been demolished, replaced by new multifamily housing in the urban cores. This relocation policy intends to densify the area, stop and dial back suburbanization, and is expected to decrease travel time and CO2 emissions from driving.
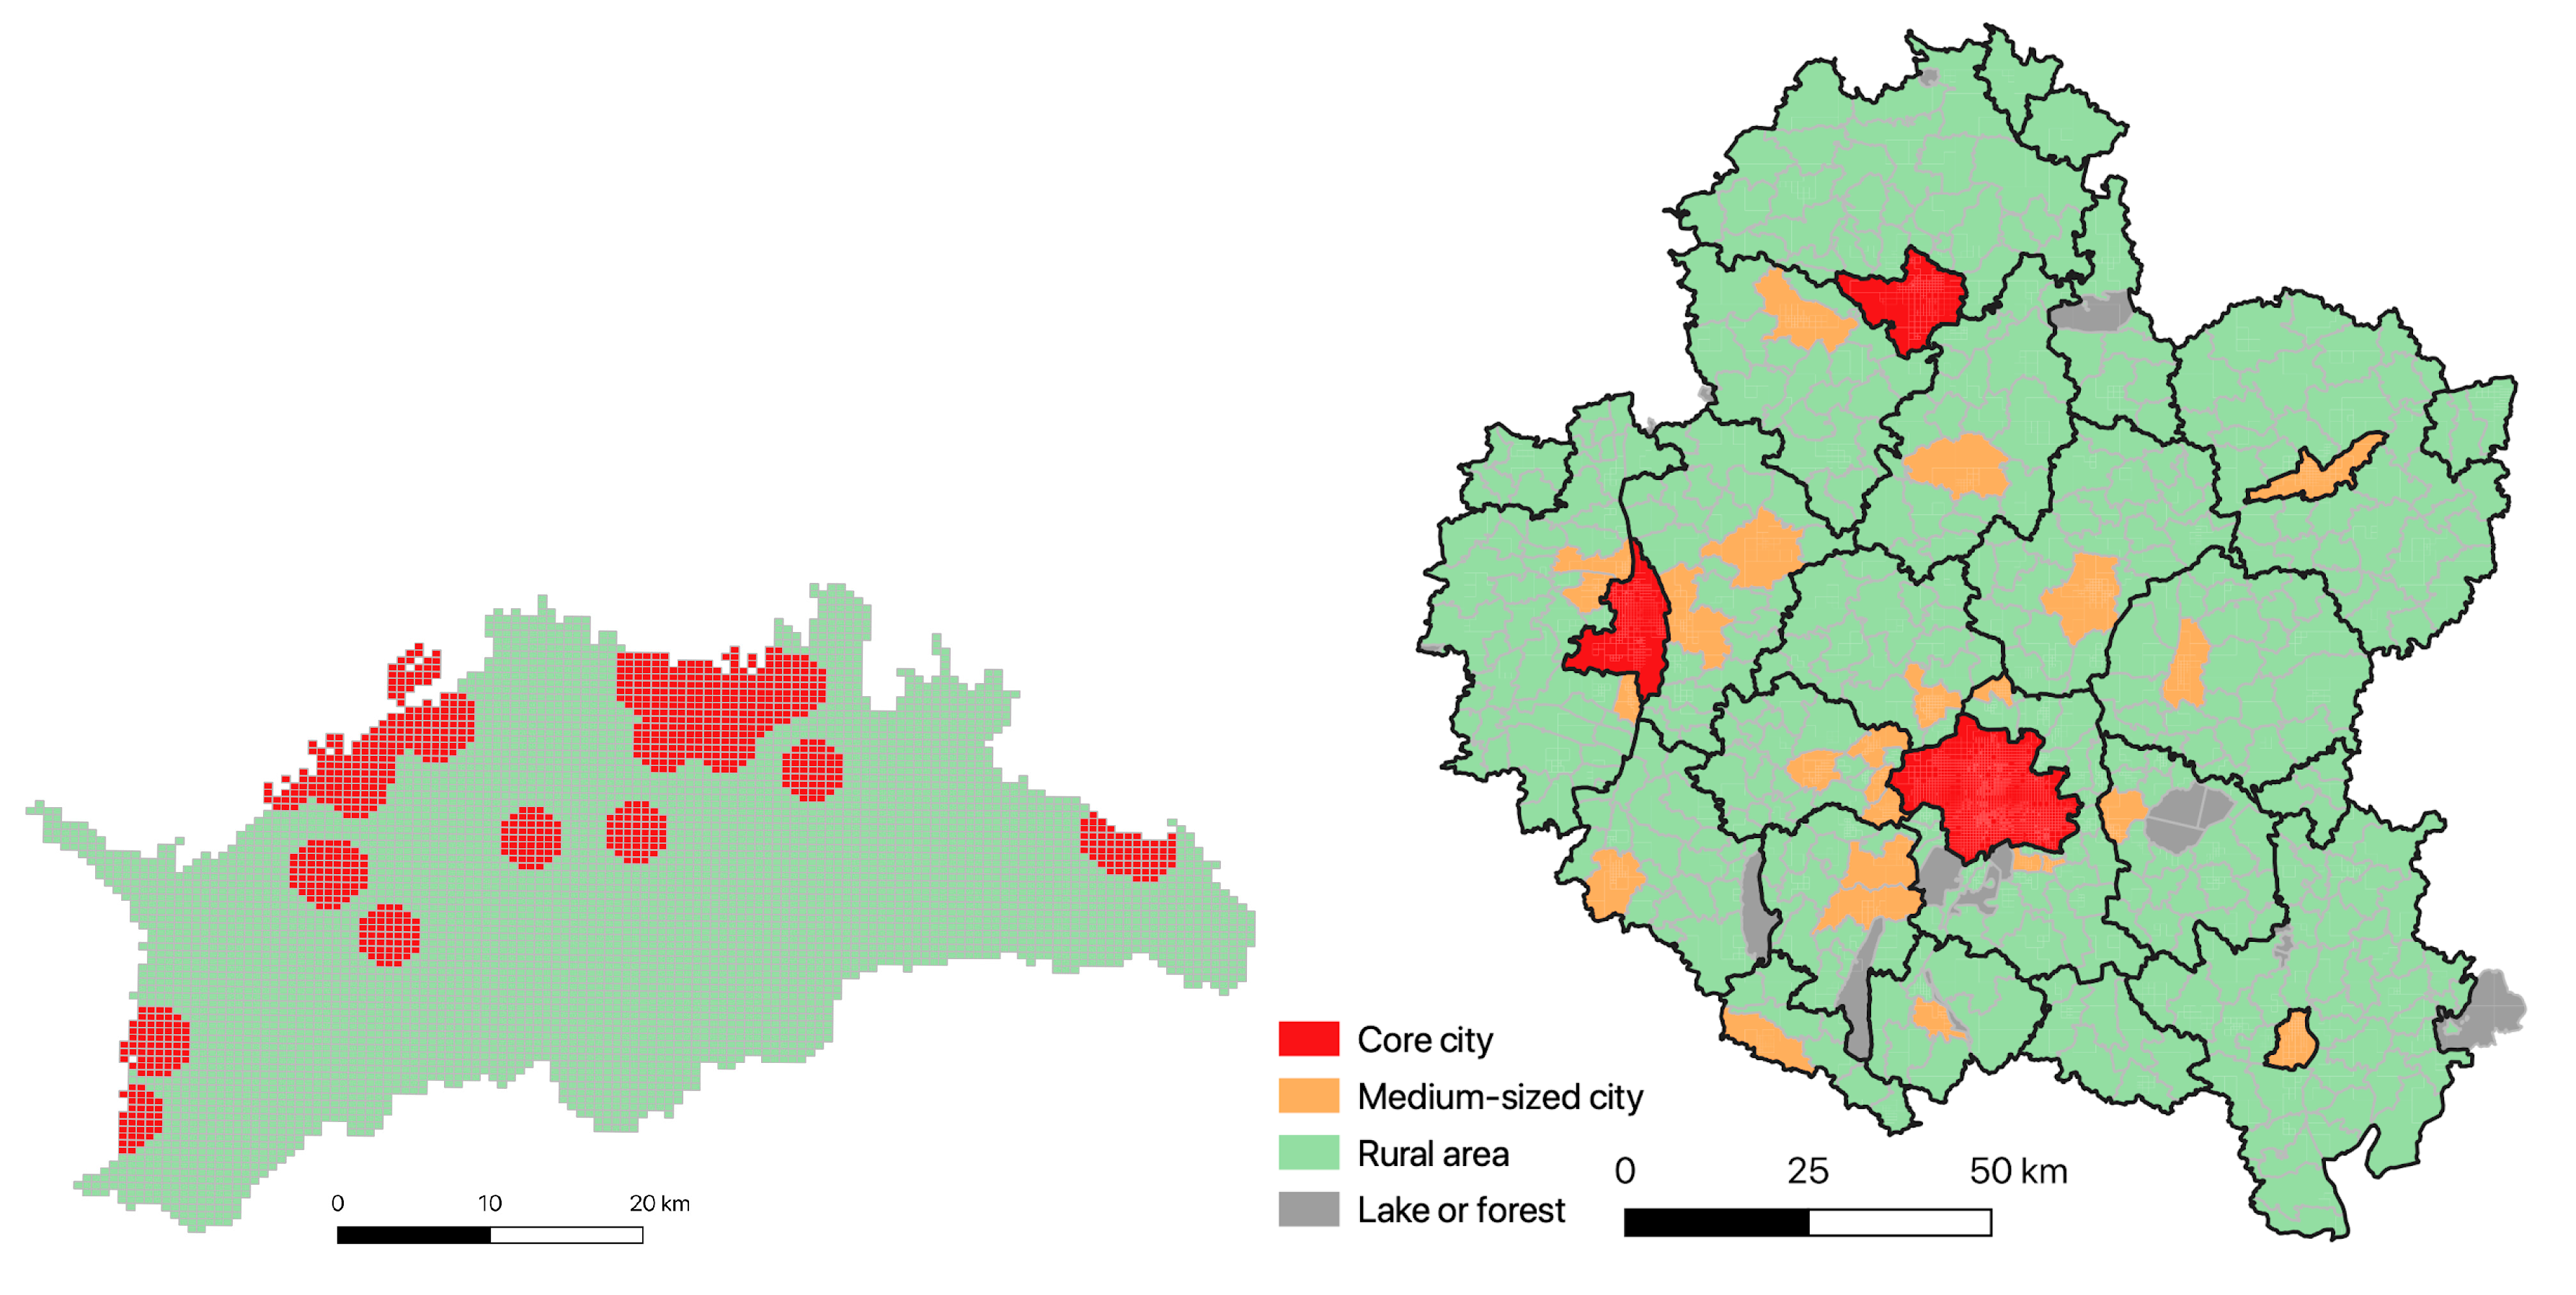
To implement scenarios B and G, as well as to inform an understanding of the different impacts of the scenarios for urban and rural areas, land areas in the study area are designated as core city, medium-sized cities, and rural areas. As Kagawa has a lower population and fewer dense urban areas, no classification of medium-sized cities is defined in this study area. All land outside of the core and medium-sized cities is defined as rural land.
Figure 5 shows the core and medium-sized cities designated in the two study areas.
4.2. Indicators
The impact that each policy scenario has on the SDG is evaluated by indicators and targets defined for each goal. Based on a review of the indicators and targets established for each SDG, two SDGs were identified which are suitable to be evaluated using SILO and MATSim. The two selected SDGs include the goals for Good Health and Well-being, and Sustainable Cities and Communities. In total, under the two SDGs selected for evaluation, the analysis specifically measures progress toward 4 SDG targets.
Table 2 and
Table 3 below provide an overview of the stated SDG targets and indicators as well as the indicators used in SILO for the evaluation.
SDG indicators are then measured by individual or aggregates of the 10 SILO-MATSim indicators. Some of the indicators directly measure the SDG indicator. The model, for example, calculates the ratio of land consumption rate to population growth rate, which is a stated SDG indicator for Sustainable Cities and Communities. To make a more nuanced analysis of land consumption, SILO also includes indicators for population density and the vacant dwelling ratio. When the model is unable to directly measure an SDG indicator, other individual or aggregations of indicators are used as a proxy to describe an SDG indicator. For example, to evaluate indicator 11.1.1 regarding the proportion of people living in slums, settlements and other substandard conditions, the model uses the following indicators: dwelling rent to income ratio, and the share of low-quality dwellings. This group of indicators were selected to assess SDG indicator 11.1.1, as they each provide a signal to help picture access to adequate, quality housing in the study areas.
It is readily acknowledged that the modeling suite is not able to cover all dimensions of the SDG. For example, goal 3.9 refers to “number of deaths and illnesses from hazardous chemicals and air, water and soil pollution and contamination,” while the modeling suite only provides the indicator of total amount of CO2 emission and NOx emission from road traffic. While the amount of these pollutants is an important aspect of air pollution, it is understood that pollution and contamination include important dimensions that are not represented, such as their specific impact on humans’ health and death probability. The indicators chosen merely provide an index point whether a policy is moving towards an SDG or not.
5. Scenario Discussion
The integrated land use/transport model produces a large amount of output data and indicators, of which only some can be presented in this paper. First, impacts on land use and transport are presented. Following, an evaluation of these scenarios is done by selected indicators.
5.1. Impacts on Land Use
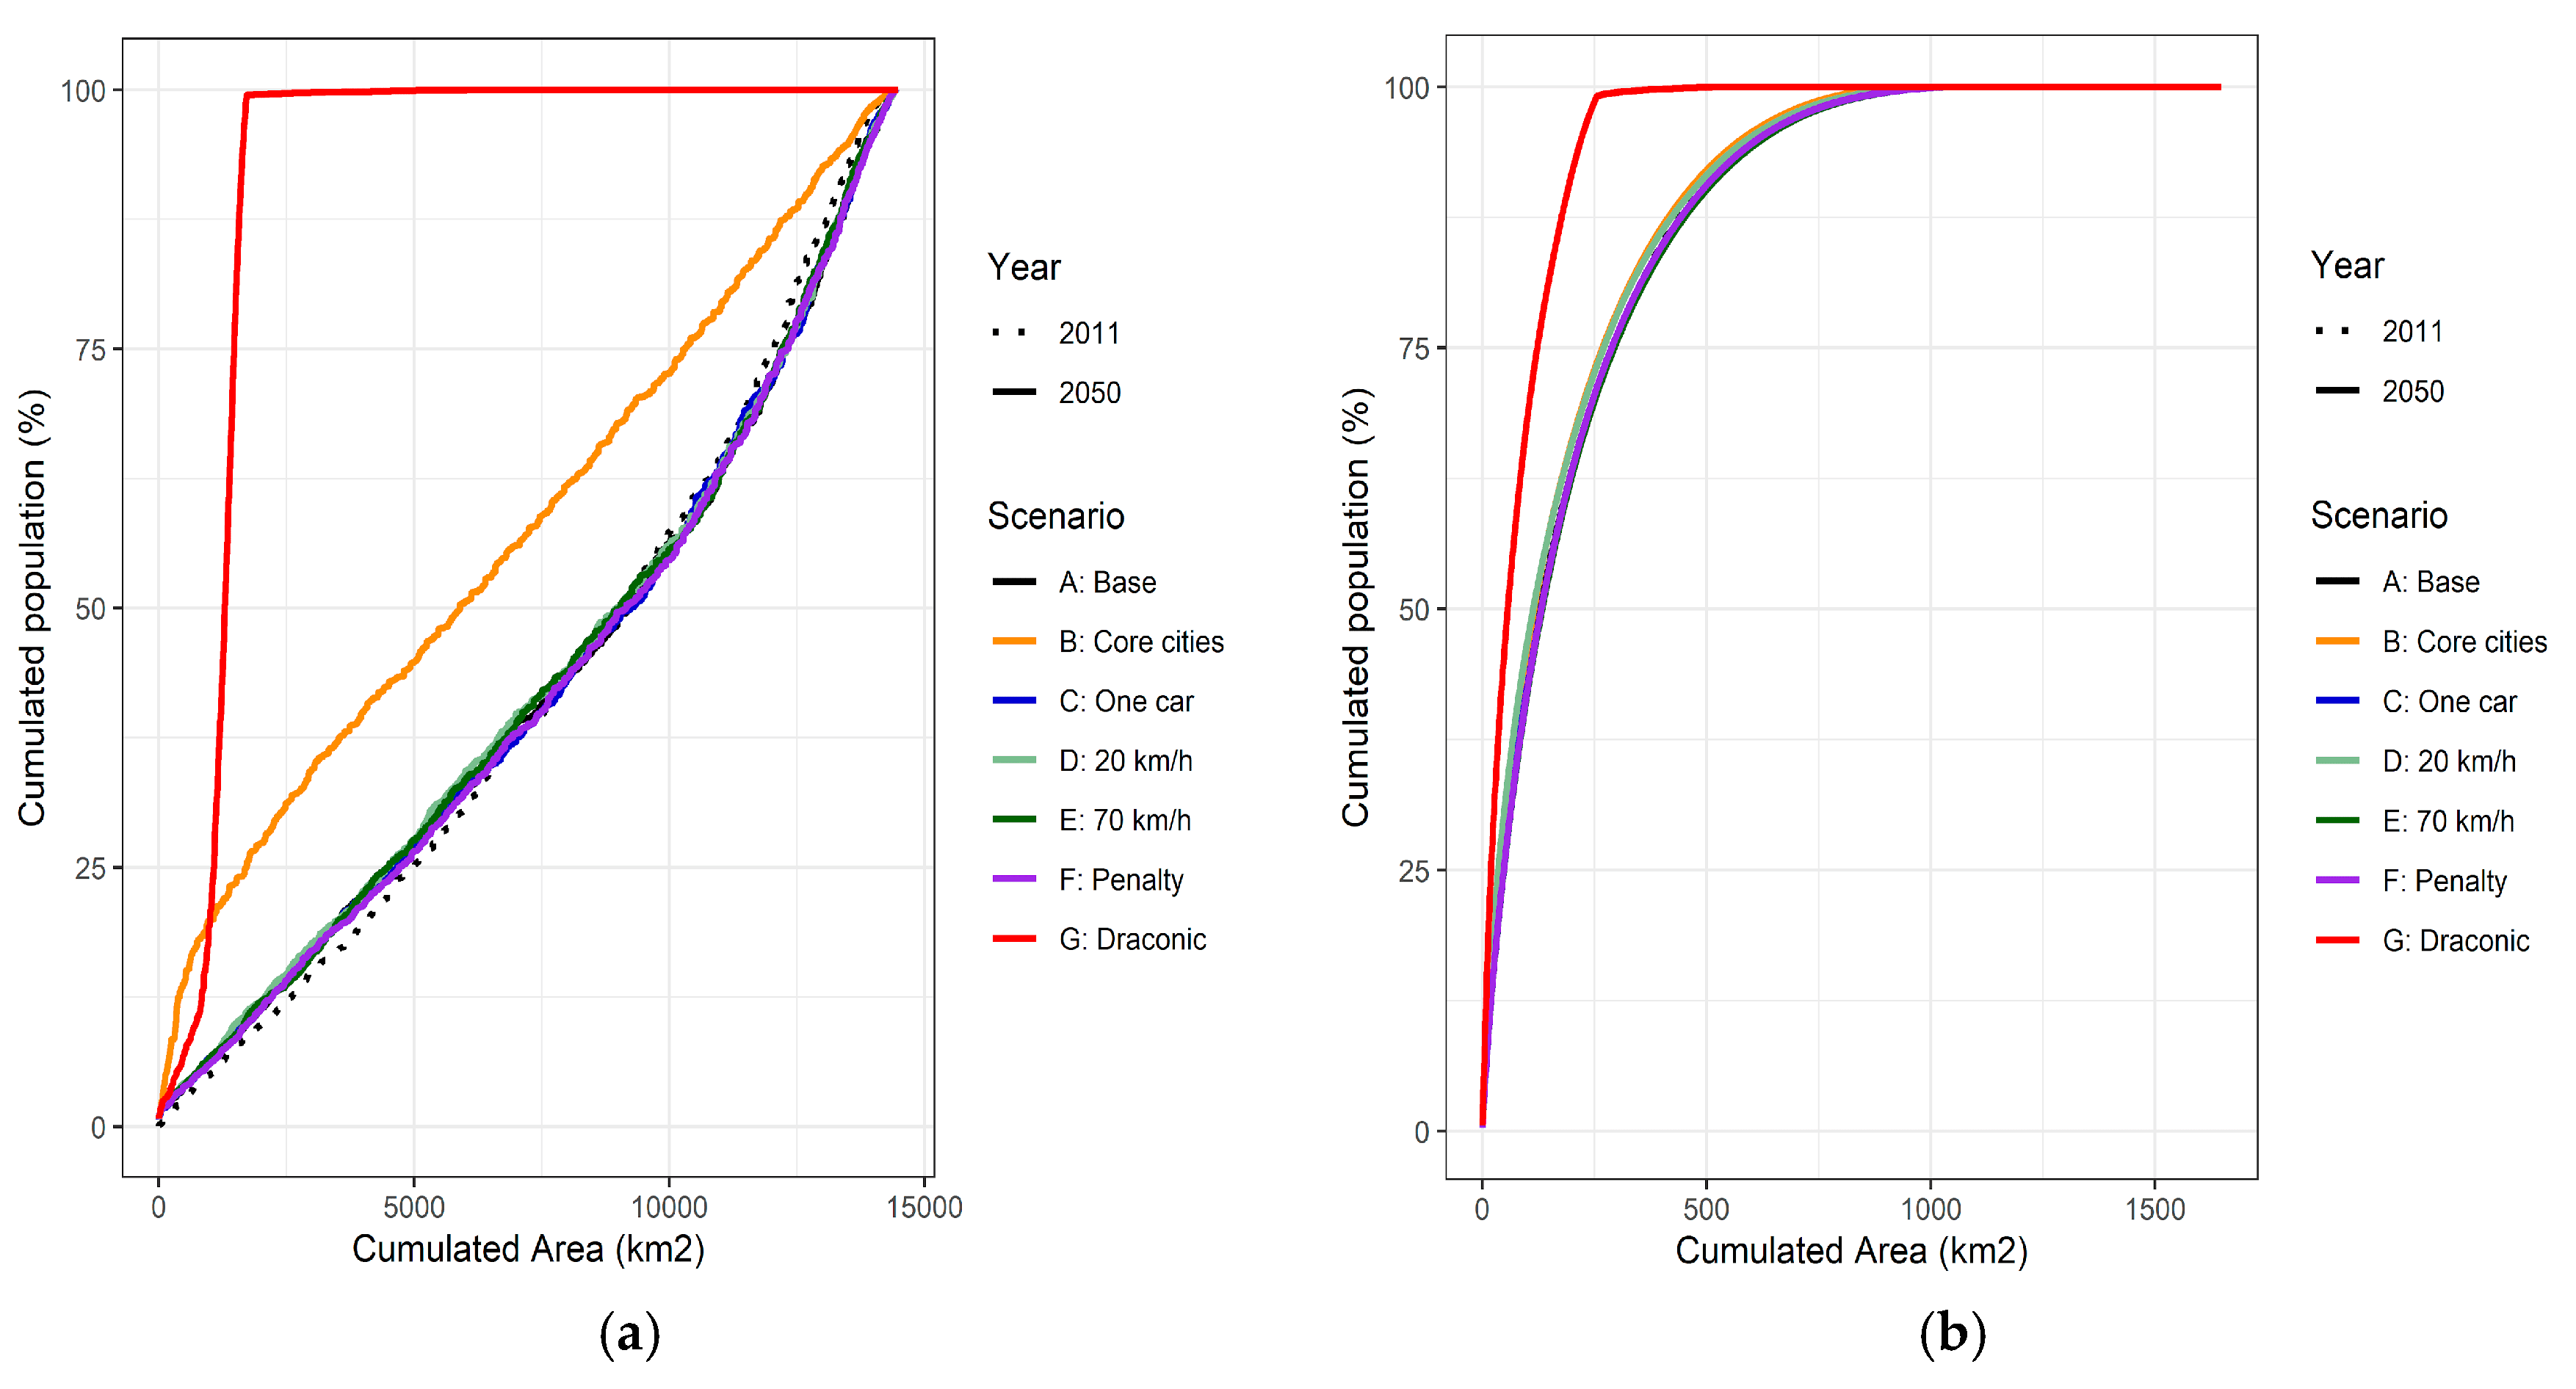
Most of the transportation-related policy measures had little to no impact on household relocation and the spatial distribution of the population. The more dramatic measures, such as requiring draconian resettlement to urban areas or restricting developments in rural areas, directly affected where people live. However, development to reduce urban sprawl and stimulate household relocation to urban areas appears to only be effective when the area is experiencing population growth. In Kagawa, where the population is declining and population density is high in comparison to Munich (
Figure 6), these strategies do not appear to impact household relocation as much and stimulate less substantial household movement toward urban areas.
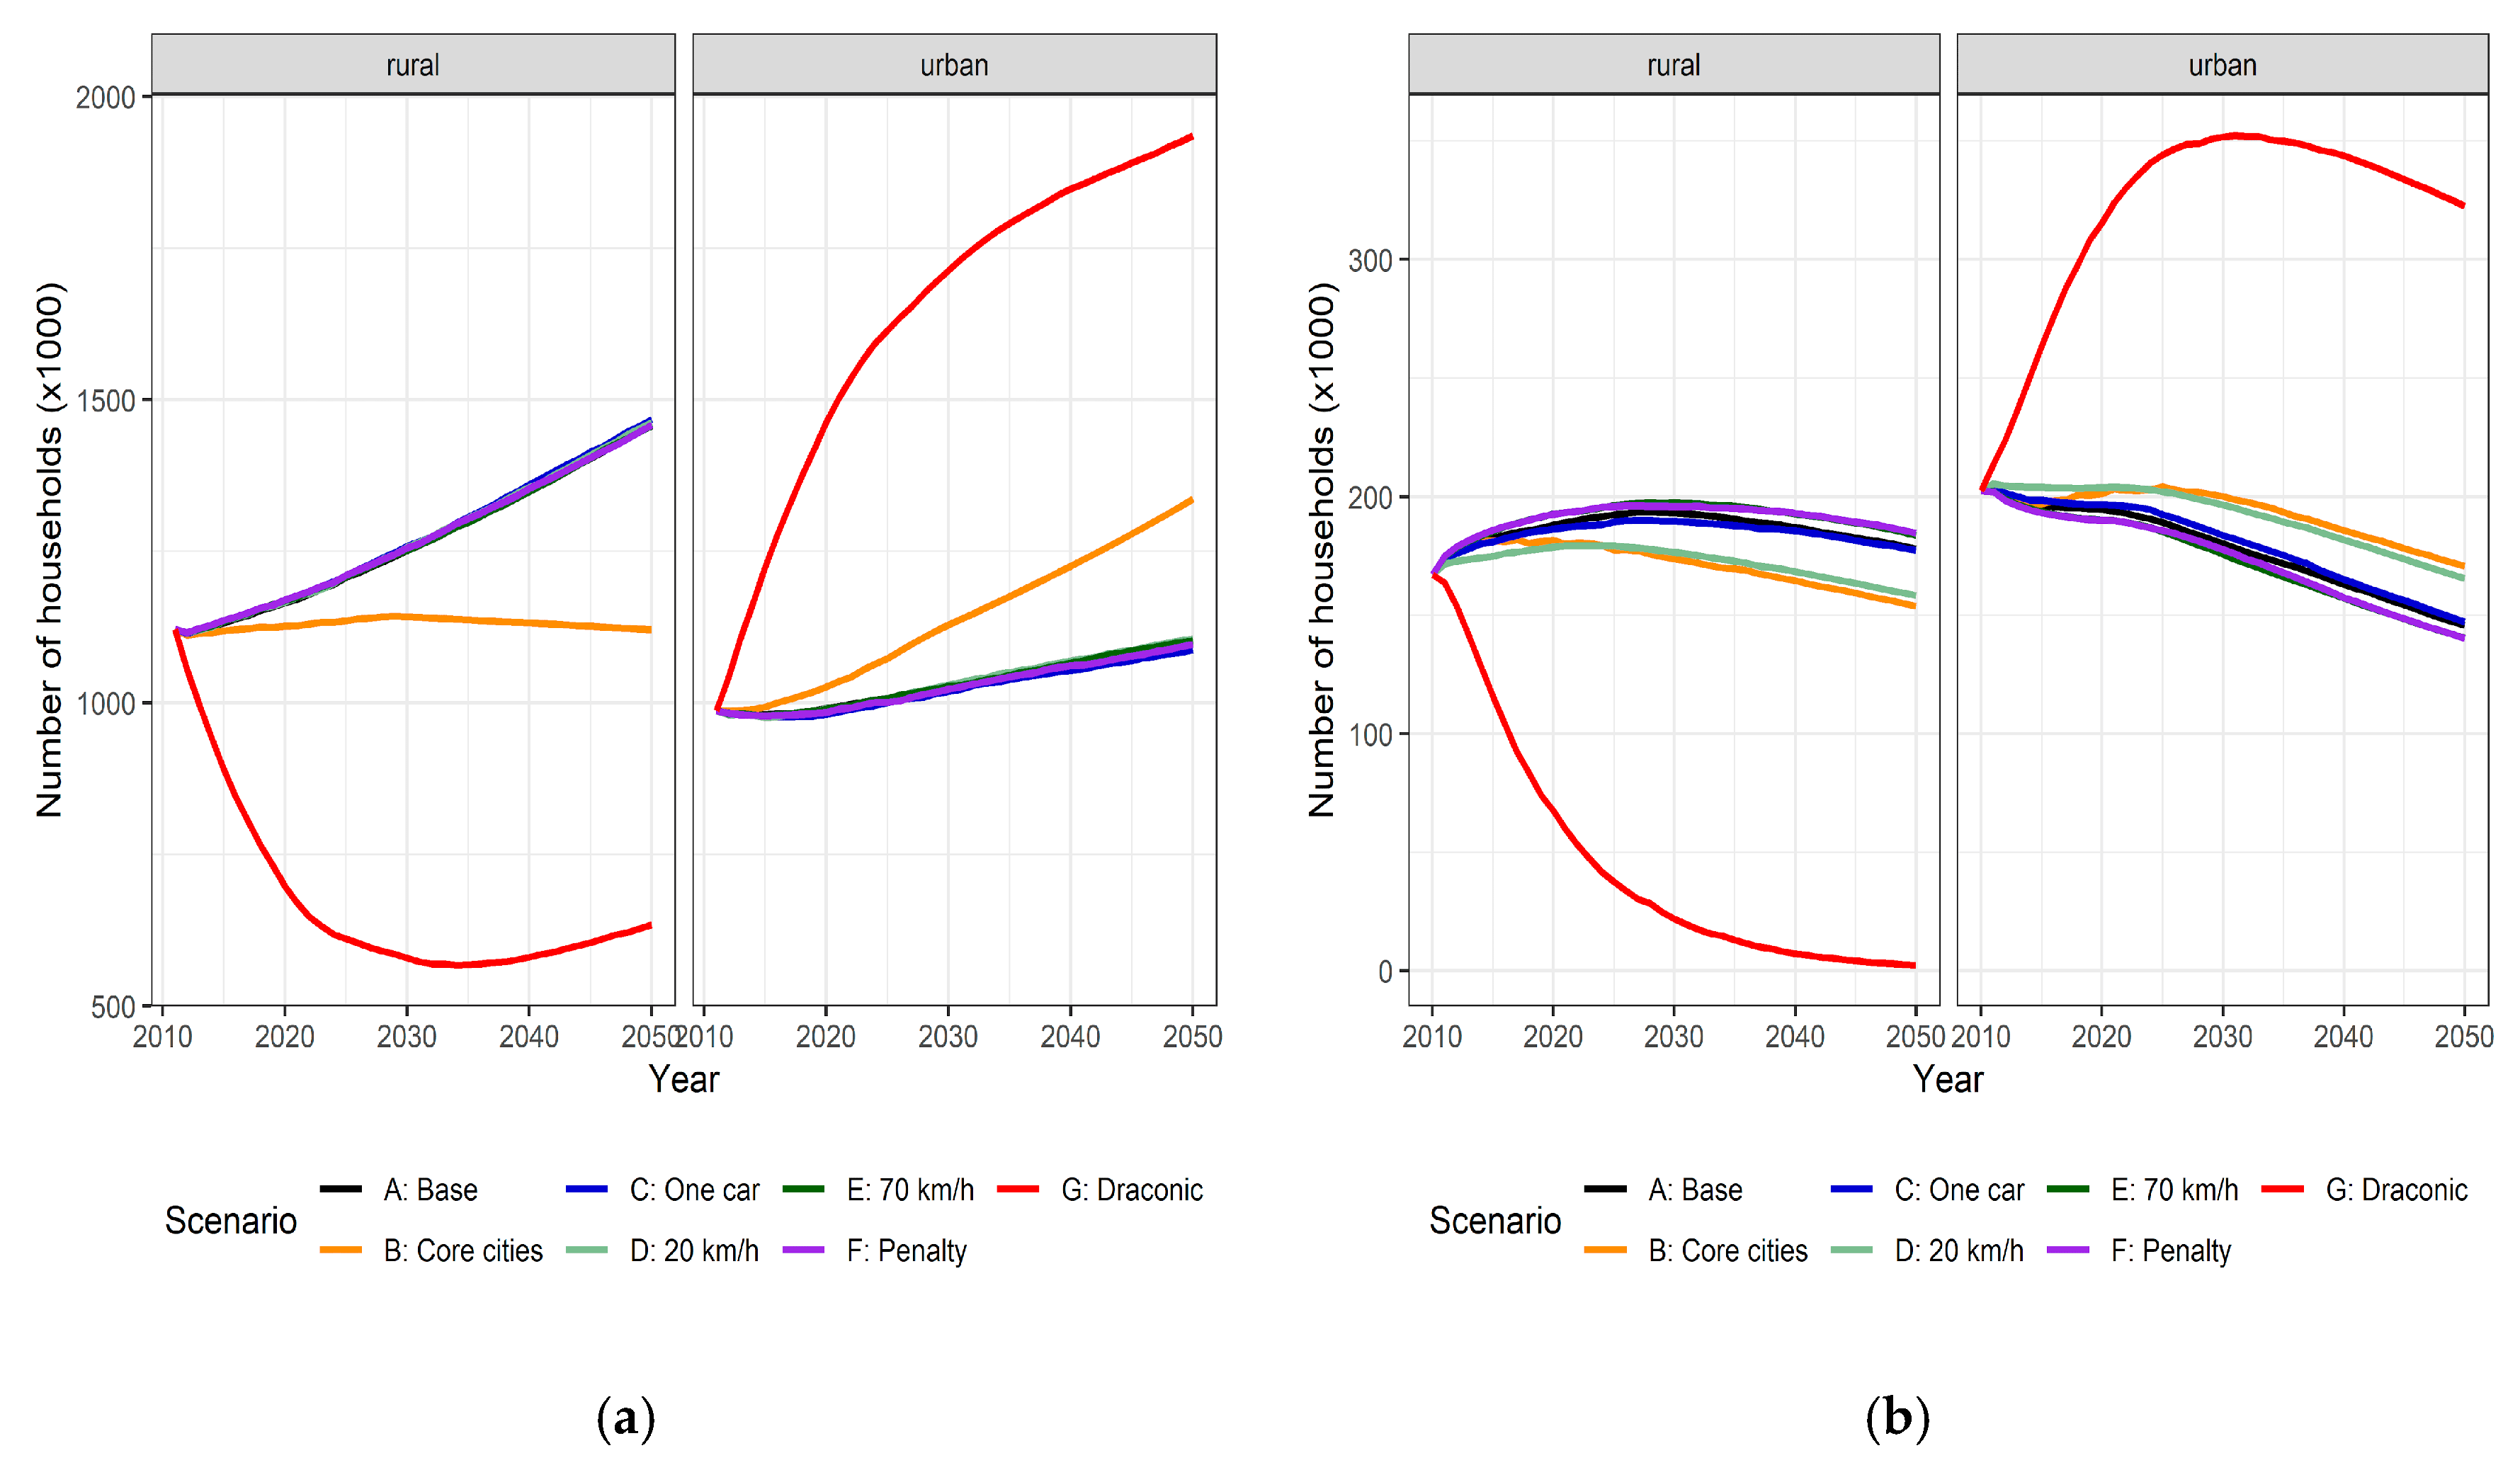
The scenarios with the largest impact on the number of households in urban and rural areas were the two land use policy scenarios. In both study areas, under the draconian resettlement scenario, most households shift from the rural to urban areas in approximately 2025, 15 years after the policy is put in place. The same shift is observed under the scenario restricting development to the core cities, but more gradually at a lower magnitude (
Figure 7).
The only transportation-related scenario significantly impacting the number of households in the urban and rural areas of either study region is the scenario reducing the urban speed limit to 20 km/h in Kagawa. Under this scenario, the number of households in Kagawa’s urban areas increased (
Figure 7). This observation may be related to the high number of vacant dwelling units in the region’s core cities.
5.2. Impacts on Transportation
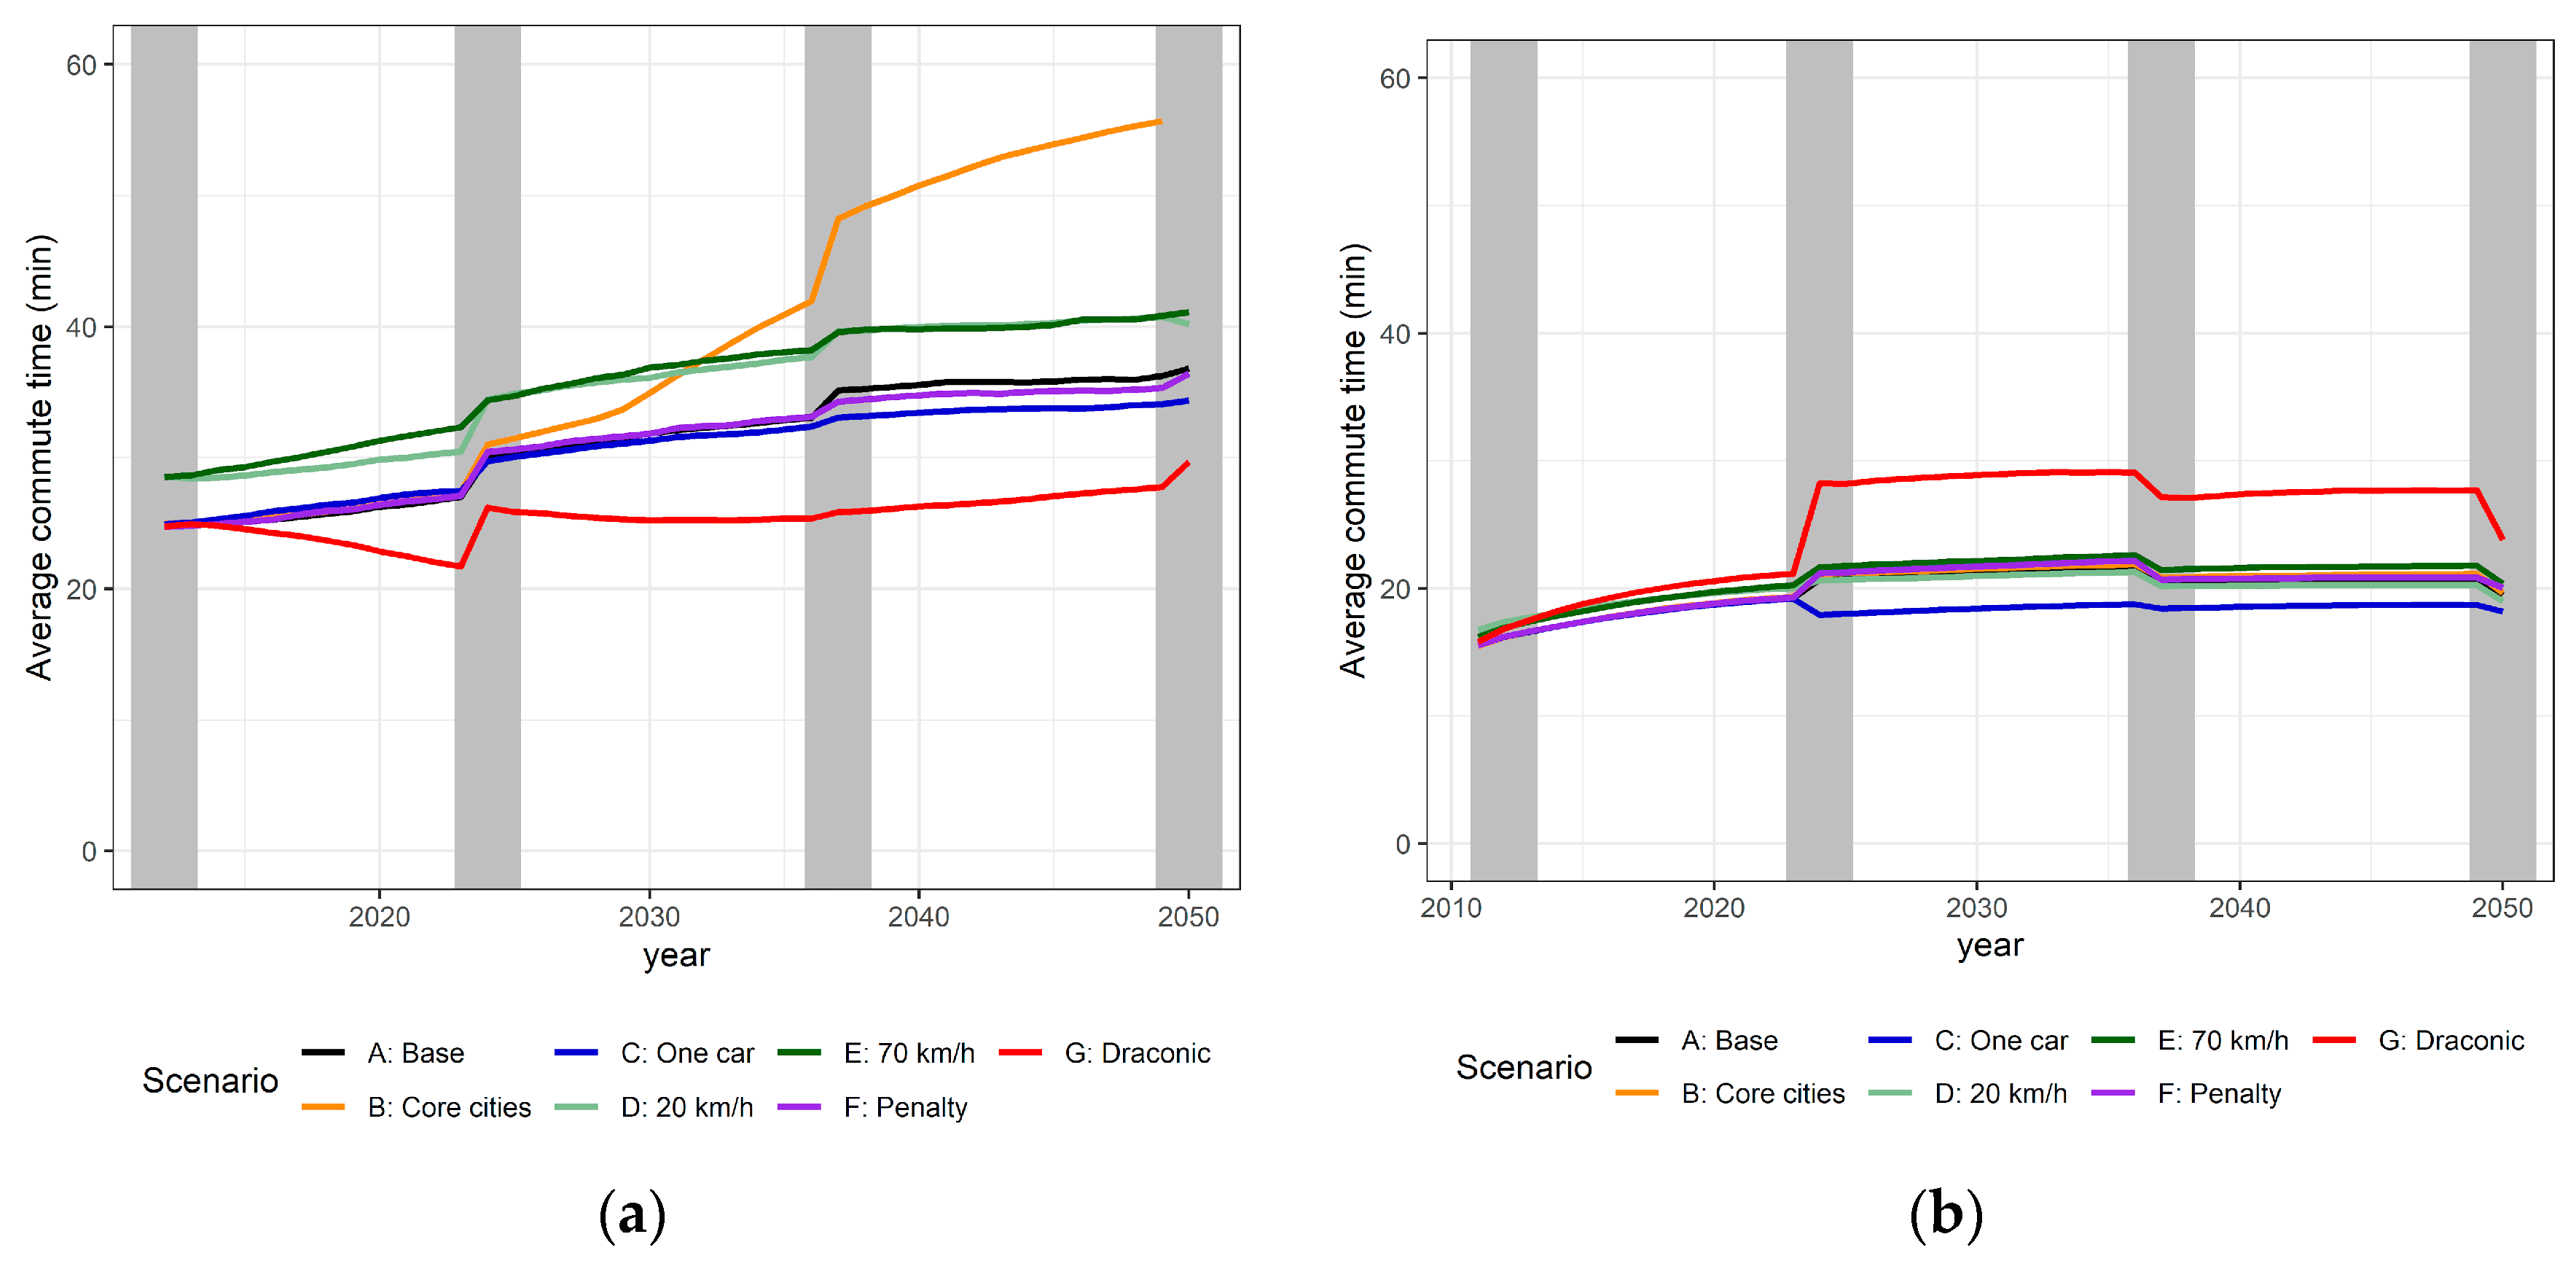
With the exception of the draconian resettlement scenario, average commute time increases under all policy scenarios in Munich. In Kagawa, commute time is maintained, or only marginally increases over time under all scenarios, with the exception of the draconian resettlement which has the opposite effect in Kagawa in comparison to Munich. Of all scenarios, the two related to land use (draconian resettlement and restricting development to the core cities) had the strongest impact on commute distance.
In the draconic scenario in Munich, the average commute time decreases until 2025—at which point the majority of households and jobs have been relocated to the core cities and urban sprawl is removed—and then remains stable. As this policy forces an increased density of urban housing until 2025, rather than relying on real estate market needs, households are able to optimize their search for housing in the core cities and can choose to move closer to their workplace to reduce their commute distance. In Kagawa, however, where there is a smaller population density and less demand on the network, the draconic resettlement policy results in an increase in commute times. Given the lighter traffic conditions in Kagawa, the scenario may not have been strong enough to induce households to relocate closer to their places of work and may have created traffic congestion in newly densified areas where there was previously no congestion.
Under the scenario restricting all future development to the core cities, the average commute time in Munich doubles (
Figure 8). One reason for this dramatic increase is that as a consequence of this policy concentrating all growth in the core cities, additional demand is placed upon areas where there is already traffic congestion, thus increasing the average travel times. The average commute time is also increased due to a more restrictive housing market where the construction of housing is driven by market demand, which does not entirely fulfill housing needs. For example, when a person living and working in a rural area decides to relocate, they may move to a core city where housing is available but maintain their job in the rural area, which results in their commute time increasing. We see here that without requiring both households and jobs to move to the core and medium sized cities, as is done in the draconian resettlement scenario, restricting development to the core cities alone has the opposite of the intended impact on commute time. In Kagawa, on the other hand, where existing traffic conditions are different, no larger impact is observed for this scenario.
As is expected by the design of the policies reducing speed limits to 20 km/h and 70 km/h on urban and rural roads, respectively, commute travel times are increased in Munich as a result of slower moving traffic. In Kagawa, however, no notable effects on commute time are observed when transportation capacities are reduced under these scenarios. Under the policy limiting vehicle ownership to one car per household, a slight decrease in average commute is observed in Kagawa which may be explained by some households relocating closer to their workplaces.
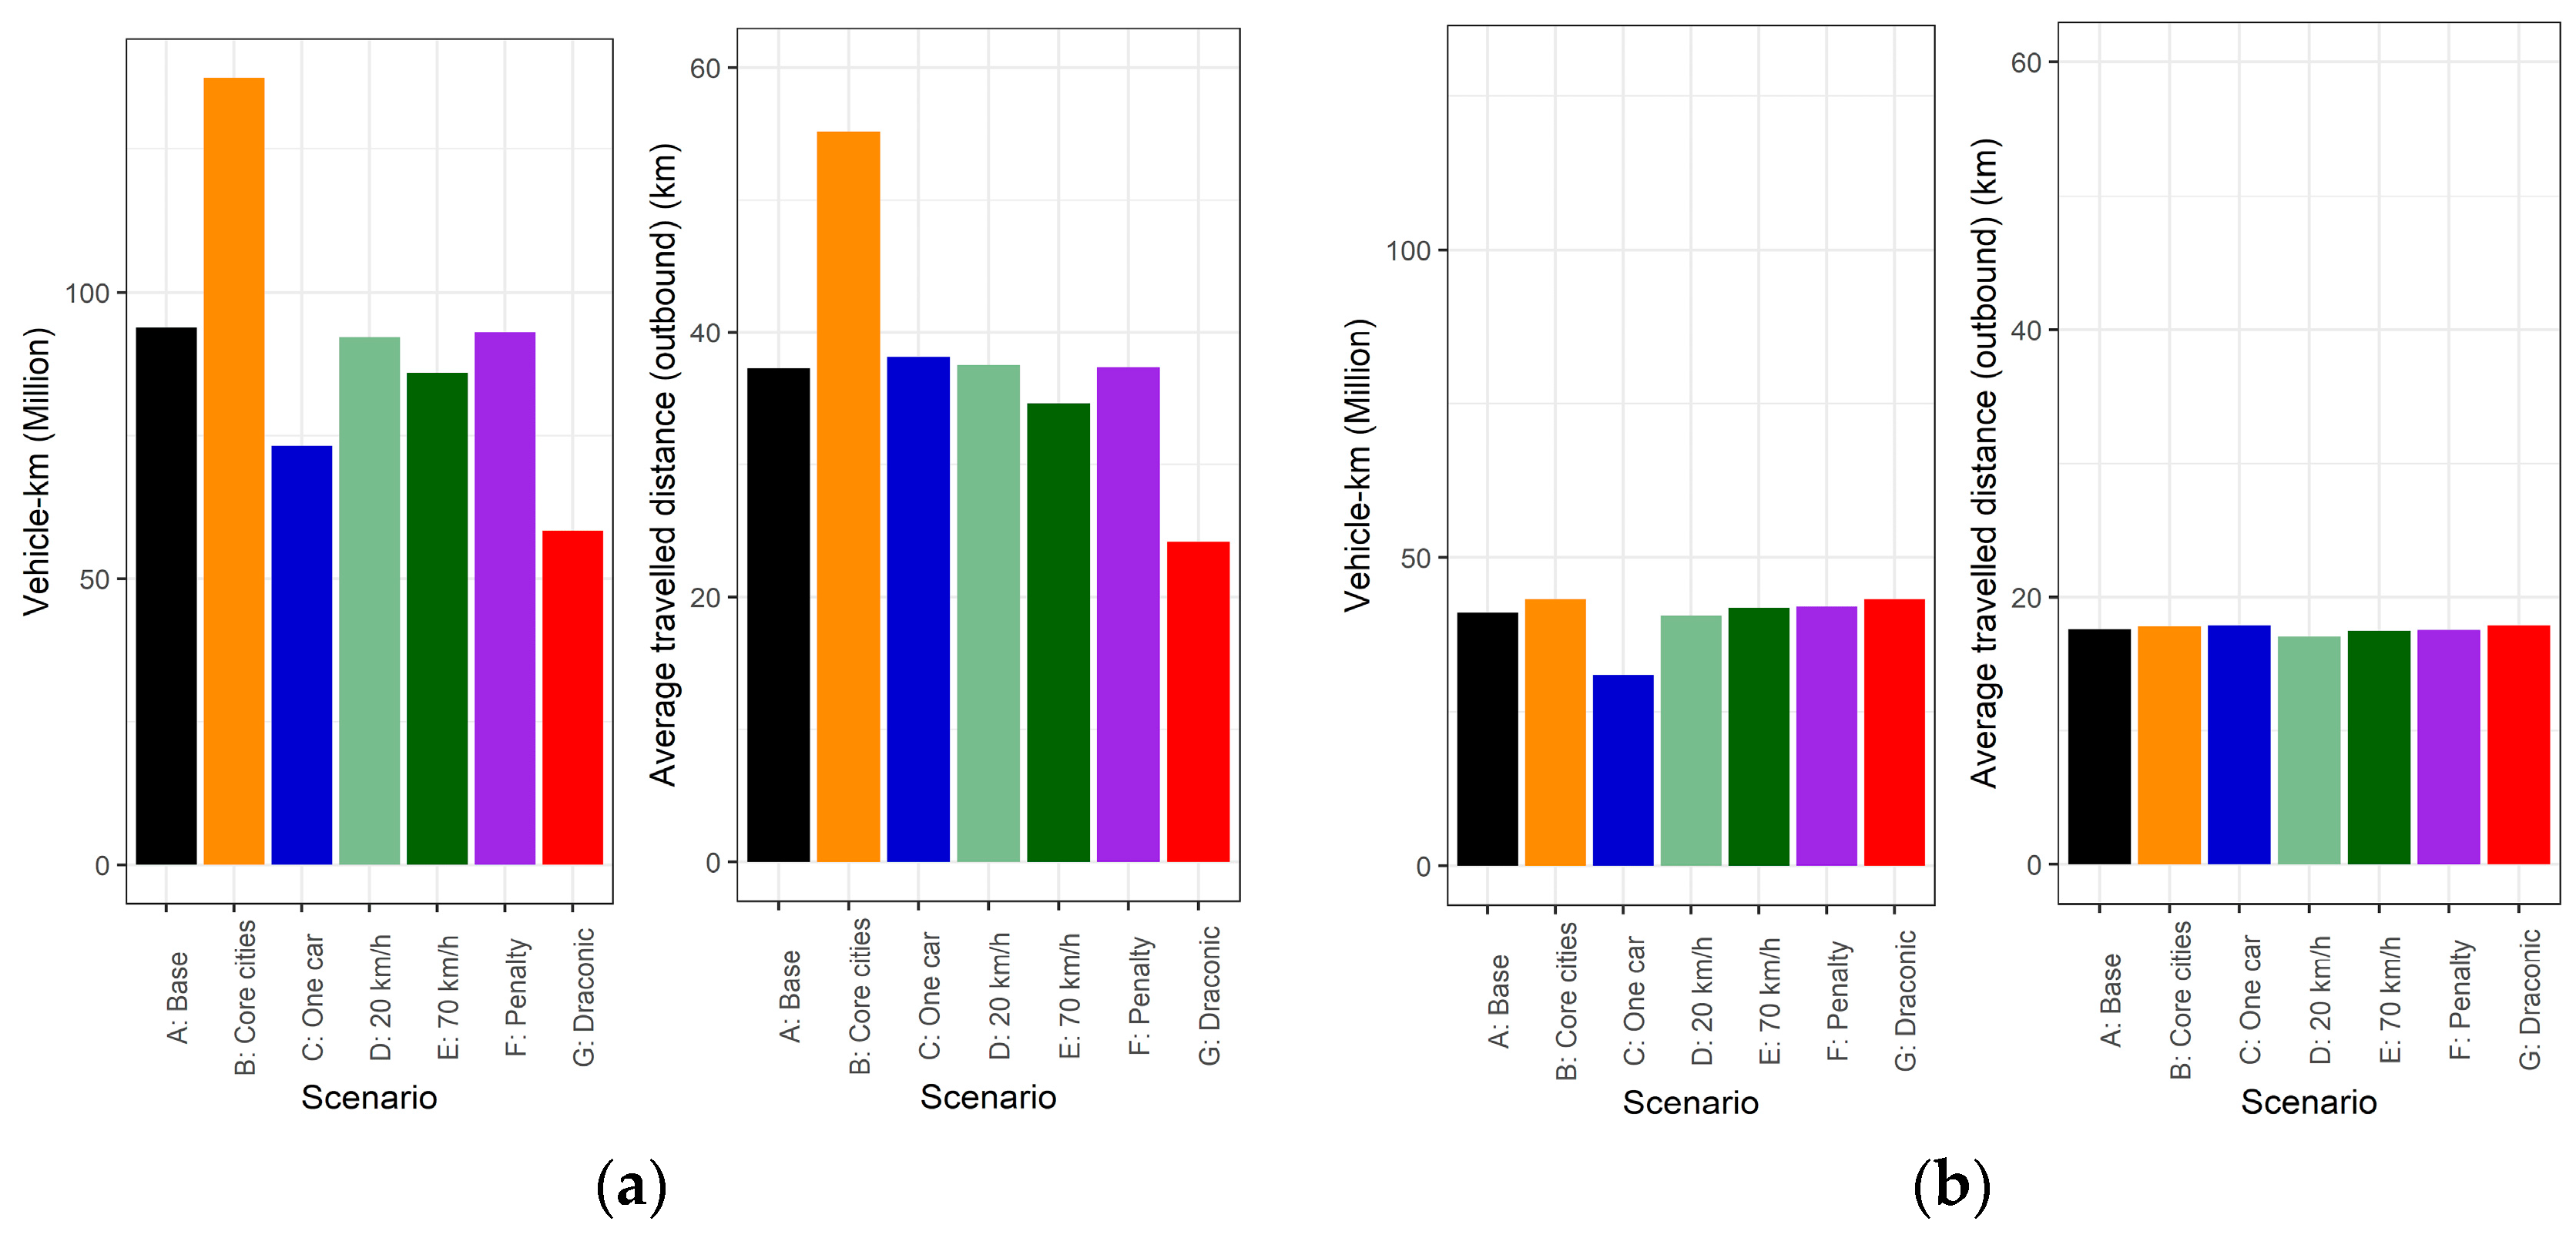
When looking at average distance, only the draconic resettlement and core cities scenarios significantly impact vehicle kilometers traveled in Munich (
Figure 9). Similar to the impacts on average commute times and for the same reasons discussed above, vehicle kilometers traveled increase under the scenario limiting development to core cities and decrease under the scenario for draconian resettlement to the core and medium-sized cities. The number of car trips and the vehicle kilometers traveled are reduced under the one car policy in both scenarios, however, the average distance of the remaining trips remains the same. As is shown in
Figure 9, the reduction of vehicle kilometers traveled is reduced under this policy as a direct outcome of the decrease in the mode share of driving.
The scenario imposing a rent penalty for households with commutes over 25 min had no effect on travel distances in Munich. It is possible that the penalty was not high enough to make households strongly consider relocating closer to their workplaces. Although imposing a reduced speed limit of 20 km/h on urban roads had no effect on vehicle kilometers traveled by car, the scenario with a recused speed limit of 70 km/h on motorways resulted in a slight reduction in vehicle kilometers traveled. The outcome for the 70 km/h scenario may be random as, on the aggregate urban and rural levels, there is no suggestion of changes to household relocation. This shift may be due to relocation actions within a region, such as a person living in a rural area moving closer to their workplace. Those are not captured in the figures presented here.
In Kagawa, almost no changes are detectable for vehicles other than the small reduction in vehicle kilometers traveled under the one car policy scenario. As
Figure 9 shows, the study area is populated rather sparsely, and these conditions may explain why the land use strategies to increase urban densification (e.g., the draconian resettlement and core cities scenarios) had no significant effect on average and total vehicle kilometers traveled.
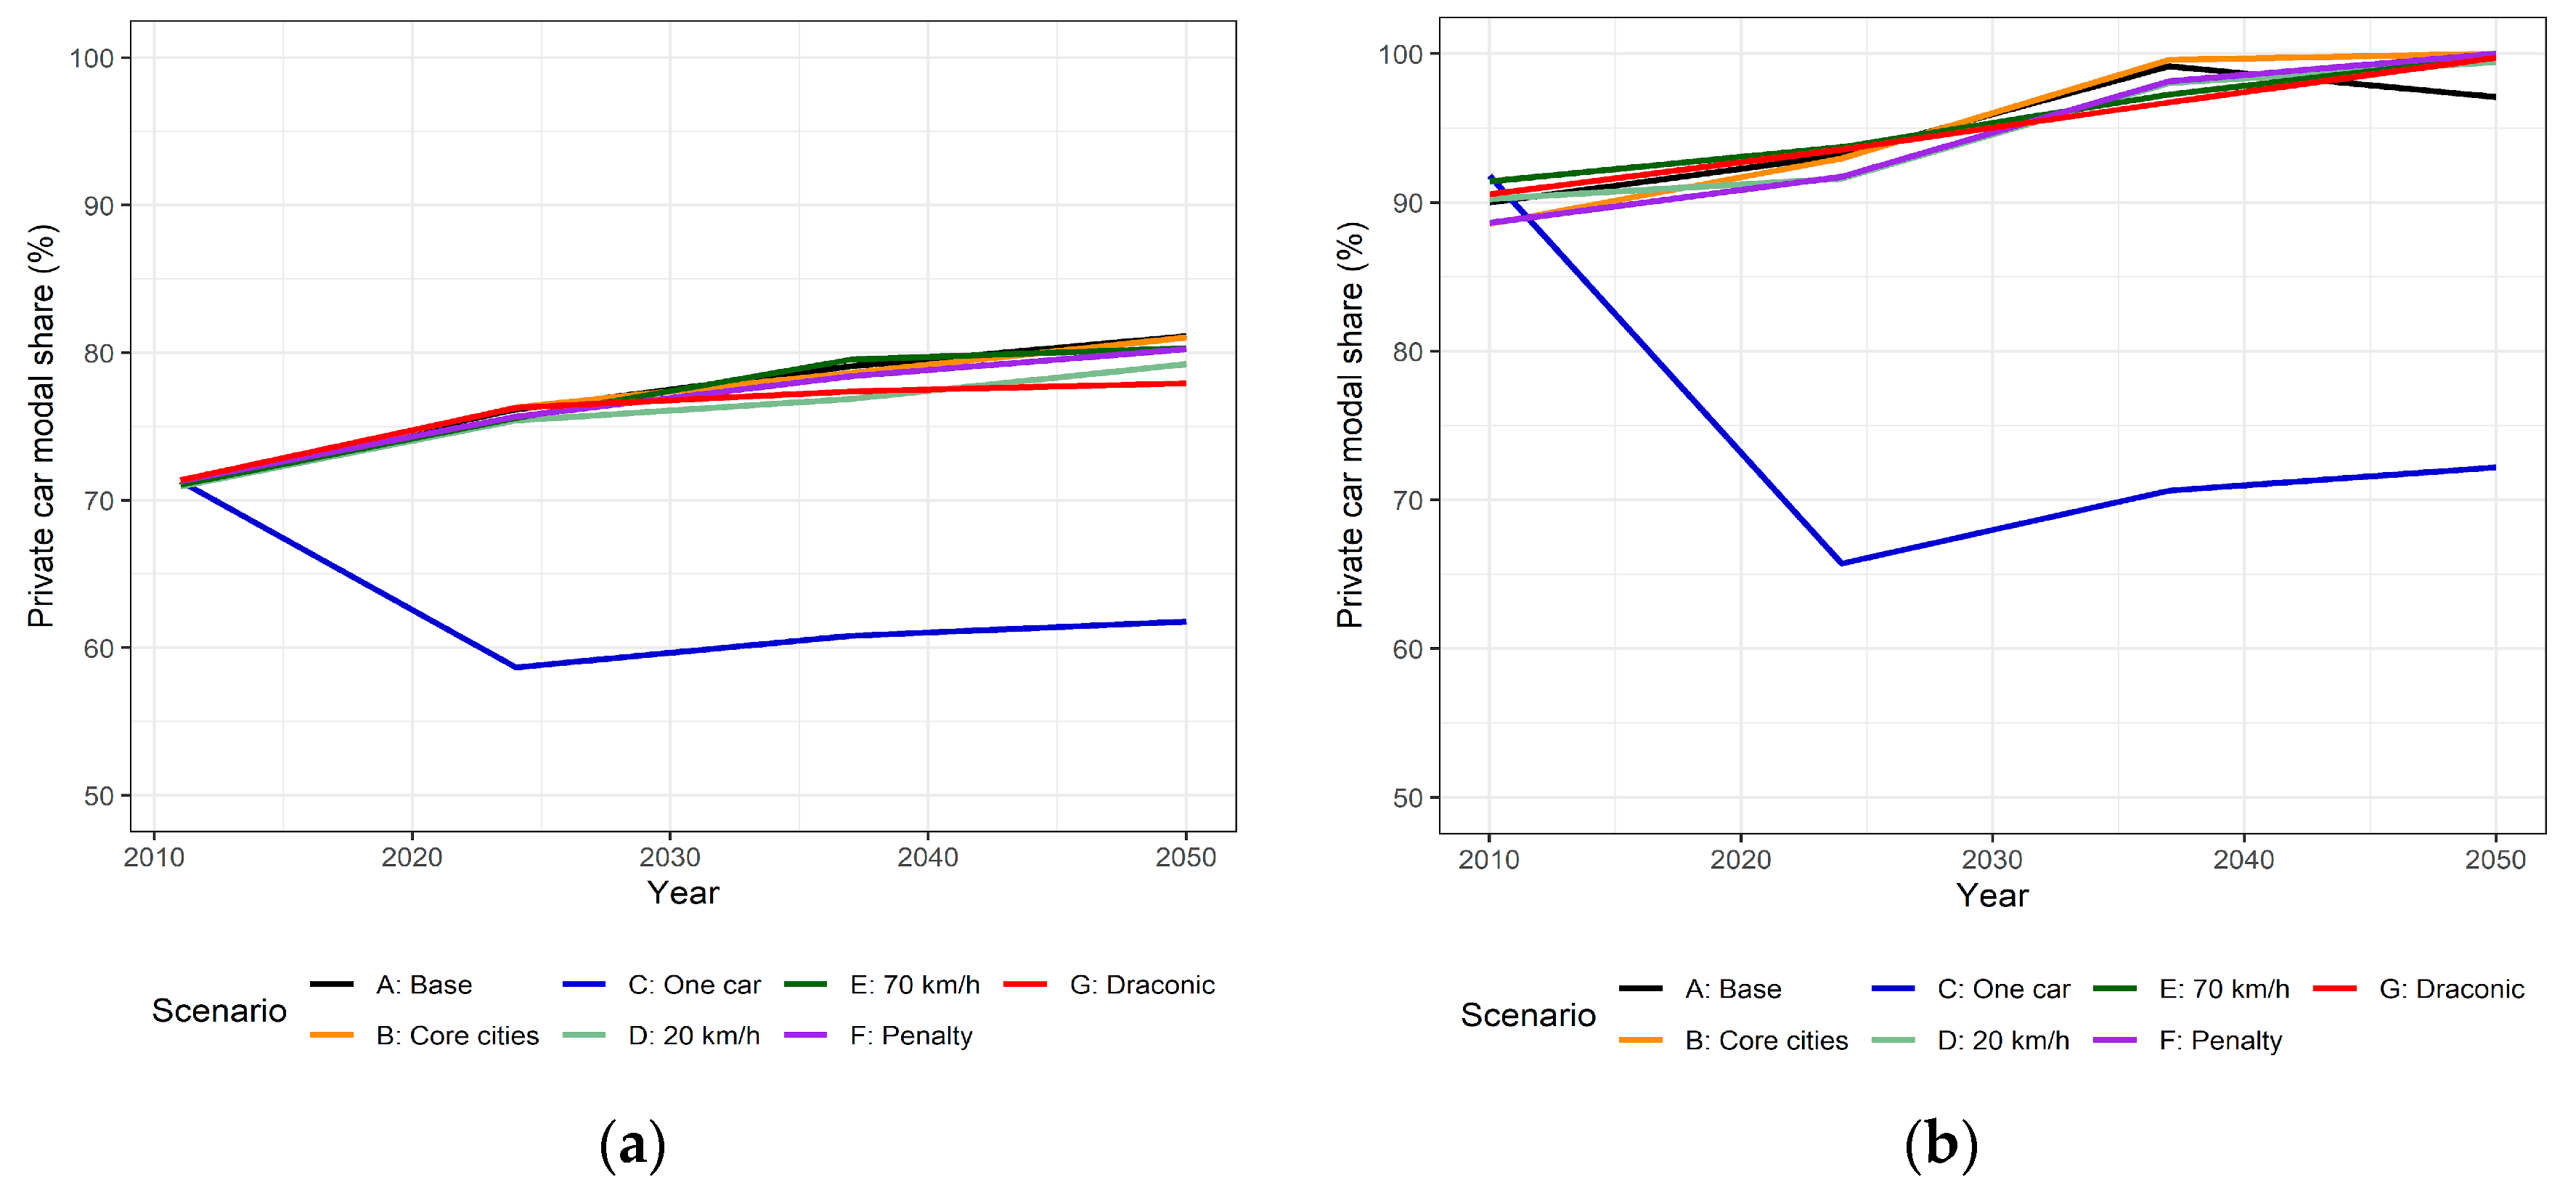
Private car mode share appears to be insensitive to most of the scenarios in both study areas and generally increases over time under all scenarios, with the exception of the one car policy scenario (
Figure 10). The car mode share appears to change abruptly, but the transport model is run in selected years only. As the car mode share is largely dependent on car ownership, the one car policy has the only direct impact on the mode share and results in a decrease in the mode share of driving. Mode shares are also expected to change significantly when the ratio between car and transit travel times changes, in that case households could just move closer to their workplace to compensate for longer commute times. In most parts of the study areas (e.g., areas outside of the core cities), however, vehicular travel times are faster than transit travel times, such that car travel times do not appear to largely alter a mode choice in favor of transit. The scenarios reducing speed limits to deter driving are also unsuccessful in affecting mode choice. Because the 70 km/h primarily affects rural areas where transit coverage is less dense and the 20 km/h scenario only affects the smaller geographical regions composed of core cities, the absolute increase in vehicular travel times observed under these scenarios are marginal and do not induce a mode shift from driving to transit. Additionally, the 20 km/h urban speed limit is only 10 km/h lower than existing speed limits and may not be low enough to effectively deter urban driving trips.
5.3. SDG Indicators
In general, all of the land use and transport policies evaluated in this study have impacts on approaching SDG. The transportation-related policy scenarios can directly reduce GHG emissions and relieve traffic congestion. In contrast, the land use-related scenarios had less influence on land use and demographic indicators, such as income distribution and dwelling quality. Further research should be done to explore economy-related scenarios to evaluate their impact on land use and demographic indicators.
As the population in the Kagawa region is declining, an already high dwelling vacancy rate increases, and the cities become even less dense. Therefore, land use and transport regulations have less influence towards the SDG.
Due to the population growth Munich is experiencing, the city will face the issue of how to shape a sustainable city with a high quality of living and a convenient transportation system. In this study area, the one car policy appears to be the most effective strategy for shifting travel demand from private cars and, consequently, improving the vehicular level of service. The draconian resettlement strategy effectively reduces vehicle kilometers travel distances and GHG emissions, but is more likely to increase congestion in the urban areas. The scenario restricting new development to core cities results in the highest levels of densification, which leads to severely congested roads in polluted cities with affordable housing.
An overview of the impact of the land use and transportation scenarios on the two identified SDG is shown in
Table 4 and
Table 5. These findings are based on the results for the ten SILO indicators developed as proxies for the SDG indicators to evaluate progress toward the SDG.
Table 4 and
Table 5 present the results for each indicator under each policy scenario in Munich and Kagawa, respectively.
5.3.1. SDG 3—Good Health and Well-being
Emissions from road traffic are the main cause of air pollution in big cities and are key risk factors for public health. To that point, reducing CO2 and NOx emissions from transportation contributes to achieving SDG 3. Due to the dominance of private car use, both Munich and Kagawa are suffering from high amounts of CO2 and NOx emissions. As expected, a reduction in air pollution from transportation can be achieved under most policy scenarios. In Munich, the scenario resulting in the lowest levels for CO2 and NOx is the policy for draconian resettlement to core and medium-sized dwellings. This policy, however, limited development to the core cities and may worsen conditions in the long term. The one-car policy reduced the total number of motorized vehicles in Munich and led to a dramatic decrease in GHG emissions from transportation. In Kagawa, the only scenario achieving relatively low levels of GHG emissions is the one-car policy scenario.
The maximum reductions on CO
2 emissions were 35% in Munich, for the draconian resettlement, and 39% in Kagawa, at the one-car policy scenario. The results are similar to the results from Wegener et al. [
6], with reductions in CO
2 emissions of 30% in land use policies. However, they found greater reductions in CO
2 emissions by reducing speed limits: 30% compared to less than 4% reduction in our study. The difference setting of the speed limit could cause the discrepancies. As expected, more radical policies in de-carbonization produced significantly higher CO
2 emissions reductions: 66% for India [
5], and between 64 and 70% for Japan [
7].
5.3.2. SDG 11—Sustainable Cities and Communities
The aims of SDG 11 include improving the quality of living and providing affordable access to housing and sustainable transportation for the entire population. In both study areas, the indicator for dwelling quality is insensitive and none of the scenarios produced significant changes. The Gini coefficient of population density is used to calculate the spatial allocation of populations, where a higher coefficient means a greater spatial concentration of the population. In Munich, this indicator fluctuates slightly across all scenarios, and even the land use scenarios promoting density do not have significant impacts. No significant impact is observed in Kagawa, however, the draconian resettlement policy marginally increased density in the study area. Dwelling price is highly correlated to the demand for housing. Due to the high dwelling vacancy rate in Kagawa, the dwelling rent to income ratio remains stable and low under all scenarios. In Munich, where the population is growing, the housing market is more competitive under all scenarios, with the largest increase in rent observed under the core cities scenario and the draconian resettlement to a lesser degree. This finding suggests that urbanization scenarios may lead to an increase in housing unaffordability.
In this study, the transportation scenarios strived to deter the use of private vehicles and induce a shift to more sustainable modes of transportation. The one-car and commute distance rent penalty scenarios also seek to relieve congestion on the road network along with the land use scenarios promoting urban densification. To assess the impact of the different scenarios, the car ownership rate is used to represent the share of private vehicle traffic and the average delay in travel time represents the level of service on the road network. Car ownership rates remain stable under all scenarios, with the exception of the one-car policy, which is the most effective in reducing the rate of cars per household in both study areas. This scenario is also the most effective policy for achieving a high level of service on the road network with the lowest congestion rate. Under the two land use scenarios, congestion rates increase dramatically above those for the base year due to the increased pressure on the road network toward the urban areas during the peak hour. In Kagawa, the draconian resettlement scenario led to the highest rate of congestion. In Munich, the core cities scenario results in the highest rates of congestion, with the rate nearly double that of the also increased draconian resettlement scenario. The average time delay is more severe under the core cities scenario in Munich because people end up living farther away from their workplaces due to the competitive housing market.
6. Conclusions
The Paris agreement sets the global warming target to well below 2 °C and pursues efforts to limit it to 1.5 °C to avoid dangerous climate change. To achieve the 1.5 °C target, GHGs have to be reduced from 2010 by 45% in 2030, 100% in 2050, in other words, GHG emissions have to be zero, and substantial negative emissions in 2100 by using climate technologies like bioenergy with carbon capture and storage (BECCS) and direct air capture with CCS (DACCS) [
24]. Even though it is a far-reaching target and the sectoral goals consistent with the target are not determined yet, urban land use and transport sectors are expected to contribute to achieve the target by incorporating technologies and policy measures.
The scenarios show that it is not trivial to reach GHG emissions reduction targets and move closer towards the SDG. Even the draconian resettlement scenario, a radical policy that could not be implemented in a democratic environment, only achieves a reduction of 35% (in Munich) or 11% (in Kagawa) of transport-related CO2 emissions by 2050. This is far below the goals set by the Paris climate agreement. To reach these targets, land use policies (that are probably going to be less radical) need to go hand in hand with stricter transport policies and technological improvements. Relocating people alone would not solve the emissions problem.
Our results showed the trade-offs between climate mitigation and quality of urban living as well as the possibility of balancing those policies. While the core cities scenario limits urban sprawl and consumption of greenfield land, traffic conditions and GHG emissions worsened. The urban compaction and densification may improve the access and efficiency to various collective or shared transport modes that would stimulate new transport technologies and services. If the ridership or operating rate is improved, then it can be reasonable to invest for better transport technologies for better usability and lower environmental load.
Last but not least, the scenarios also show the relevance of testing policies in different urban environments. While the core city scenario and the draconic resettlement scenario showed some impact on vehicle-kilometers traveled in Munich, the impact in the Kagawa region was almost negligible. The one-car policy, on the other hand, showed more impact on private car modal share in the Kagawa region than in Munich. It shows that different regions in the world need to develop their own policies to move towards SDG.
In the future, the modeling suite will be applied to more scenarios with the goal of finding better strategies to move towards SDG. In particular, the intelligent combination of various land use and transport policies will be tested to explore synergies between various policies. Furthermore, more application areas will be explored. Currently, implementations are under development in Maryland (USA), Cape Town (South Africa), Bangkok (Thailand) and Austin, Texas (USA). Applying the same scenarios in more study areas will stress-test the model and help build confidence which scenarios are more likely to work. Last but not least, work is underway to plug in the travel demand model MITO [
25] between SILO and MATSim. MITO is agent-based like SILO and MATSim but follows the trip-based paradigm. MITO explicitly accounts for travel time budgets to improve sensitivities to congestion and travel delay. The use of MITO will allow us to assess the impact of these policies not only on commute trips but on all travel.
Author Contributions
Conceptualization, R.M. and M.K.; Methodology, C.L., C.S., N.K., A.T.M., Q.Z., M.K. and R.M.; Software, C.L., N.K., A.T.M. and Q.Z.; Validation, A.T.M. and M.K.; Formal Analysis, C.L., C.S., N.K., A.T.M., Q.Z., M.K. and R.M.; Data Curation, C.L., C.S., N.K. and Q.Z.; Writing—Original Draft Preparation, C.L., C.S., N.K., A.T.M., Q.Z., M.K. and R.M.; Writing—Review & Editing, C.L., C.S., N.K., A.T.M., Q.Z., M.K. and R.M.; Funding Acquisition, R.M. and M.K. All authors have read and agreed to the published version of the manuscript.
Funding
This research was funded by the German Academic Exchange Service (DAAD) and Japan Society for the Promotion of Science (JSPS) within the project “Are sustainable development goals within reach? Development of a microsimulation urban model to test policies for a sustainable future”. The research was also completed with the support of the Technische Universität München—Institute for Advanced Study, funded by the German Excellence Initiative and the European Union Seventh Framework Programme under grant agreement No. 291763. The APC was funded by the TUM Publishing Fund.
Acknowledgments
This research was funded by the German Academic Exchange Service (DAAD) and Japan Society for the Promotion of Science (JSPS). The research was also completed with the support of the Technische Universität München—Institute for Advanced Study, funded by the German Excellence Initiative and the European Union Seventh Framework Programme under grant agreement No. 291763.
Conflicts of Interest
The authors declare no conflict of interest.
References
- United Nations Sustainable Development Goals, 17 Goals to Transform Our World. Available online: https://www.undp.org/content/undp/en/home/sustainable-development-goals.html (accessed on 25 July 2019).
- Stafford-Smith, M.; Griggs, D.; Gaffney, O.; Ullah, F.; Reyers, B.; Kanie, N.; Stigson, B.; Shrivastava, P.; Leach, M.; O’Connell, D. Integration: The key to implementing the Sustainable Development Goals. Sustain. Sci. 2017, 12, 911–919. [Google Scholar] [CrossRef] [PubMed]
- Huovila, A.; Bosch, P.; Airaksinen, M. Comparative analysis of standardized indicators for Smart sustainable cities: What indicators and standards to use and when? Cities 2019, 89, 141–153. [Google Scholar] [CrossRef]
- Blumenberg, C.; Martins, R.C.; Calu Costa, J.; Ricardo, L.I.C. Is Brazil going to achieve the road traffic deaths target? An analysis about the sustainable development goals. Inj. Prev. 2018, 24, 250–255. [Google Scholar] [CrossRef] [PubMed]
- Shukla, P.R.; Dhar, S.; Mittal, S. Sustainable low carbon transport scenarios for India. In Proceedings of the 2014 International Conference and Utility Exhibition on Green Energy for Sustainable Development (ICUE), Pattaya, Thailand, 19–21 March 2014; pp. 1–8. [Google Scholar]
- Wegener, M.; Schwarze, B.; Spiekermann, K.; Brosch, K.; Huber, F.; Müller, M.; Reutter, O. Modelling the Great Transformation in the Ruhr Area. Transp. Res. Procedia 2019, 41, 231–239. [Google Scholar] [CrossRef]
- Kii, M. Reductions in CO2 emissions from passenger cars under demography and technology scenarios in Japan by 2050. Sustainability 2020, 12, 6919. [Google Scholar] [CrossRef]
- Alderton, A.; Davern, M.; Nitvimol, K.; Butterworth, I.; Higgs, C.; Ryan, E.; Badland, H. What is the meaning of urban liveability for a city in a low-to-middle-income country? Contextualising liveability for Bangkok, Thailand. Global. Health 2019, 15, 1–13. [Google Scholar] [CrossRef] [PubMed]
- Brussel, M.; Zuidgeest, M.; Pfeffer, K.; Van Maarseveen, M. Access or accessibility? A critique of the urban transport SDG indicator. ISPRS Int. J. Geo-Inf. 2019, 8, 67. [Google Scholar] [CrossRef]
- de las Heras-Rosas, C.J.; Herrera, J. Towards Sustainable Mobility through a Change in Values. Evidence in 12 European Countries. Sustainability 2019, 11, 4274. [Google Scholar] [CrossRef]
- Hauger, G.; Angelini, A.; Nagler, M.; Rohsner, U.; Dominko, C.; Schlembach, C. Access to Transport Services and Participation in Traffic for People with Mental Health Diseases—Challenges to meet the UN Sustainable Development Goals (SDGs) to provide an overall inclusive Transportation System. IOP Conf. Ser. Mater. Sci. Eng. 2019, 603, 022028. [Google Scholar] [CrossRef]
- Hidayati, I.; Yamu, C.; Tan, W. The Emergence of Mobility Inequality in Greater Jakarta, Indonesia: A Socio-Spatial Analysis of Path Dependencies in Transport–Land Use Policies. Sustainability 2019, 11, 5115. [Google Scholar] [CrossRef]
- Kompil, M.; Jacobs-Crisioni, C.; Dijkstra, L.; Lavalle, C. Mapping accessibility to generic services in Europe: A market-potential based approach. Sustain. Cities Soc. 2019, 47, 101372. [Google Scholar] [CrossRef]
- Zainol, H.; Mohd Isa, H.; Md Sakip, S.R.; Azmi, A. Social Sustainable Accessibility for People with Disabilities at Public Transport Stations through Sustainable Development Goals in Malaysia. Environ. Proc. J. 2018, 3, 89. [Google Scholar] [CrossRef]
- Nicolau, R.; David, J.; Caetano, M.; Pereira, J.M.C. Ratio of land consumption rate to population growth rate-analysis of different formulations applied to mainland Portugal. ISPRS Int. J. Geo-Inf. 2019, 8, 10. [Google Scholar] [CrossRef]
- Raszkowski, A.; Bartniczak, B. On the road to sustainability: Implementation of the 2030 Agenda sustainable development goals (SDG) in Poland. Sustainability 2019, 11, 366. [Google Scholar] [CrossRef]
- Simon, D.; Arfvidsson, H.; Anand, G.; Bazaz, A.; Fenna, G.; Foster, K.; Jain, G.; Hansson, S.; Evans, L.M.; Moodley, N.; et al. Developing and testing the Urban Sustainable Development Goal’s targets and indicators—A five-city study. Environ. Urban. 2016, 28, 49–63. [Google Scholar] [CrossRef]
- Mehmann, J.; Teuteberg, F. The fourth-party logistics service provider approach to support sustainable development goals in transportation—A case study of the German agricultural bulk logistics sector. J. Clean. Prod. 2016, 126, 382–393. [Google Scholar] [CrossRef]
- Moeckel, R. Constraints in household relocation: Modeling land-use/transport interactions that respect time and monetary budgets. J. L. Use Transp. 2017, 10, 1–18. [Google Scholar] [CrossRef]
- Horni, A.; Nagel, K.; Axhausen, K.W. The Multi-Agent Transport Simulation MATSim; Ubiquity Press: London, UK, 2016. [Google Scholar]
- Shahumyan, H.; Moeckel, R. Integrating Models for Complex Planning Policy Analysis: Challenges and a Solution in Coupling Dissimilar Models. In Proceedings of the 14th International Conference on Computers in Urban Planning and Urban Management (CUPUM): Planning Support Systems and Smart Cities, Boston, MA, USA, 7–10 July 2015. [Google Scholar]
- Molloy, J.; Moeckel, R. Automated design of gradual zone systems. Open Geospat. Data Softw. Stand. 2017, 2, 19. [Google Scholar] [CrossRef]
- Moreno, A.T.; Moeckel, R. Population Synthesis Handling Three Geographical Resolutions. ISPRS Int. J. Geo-Inf. 2018, 7, 174. [Google Scholar] [CrossRef]
- Rogelj, J.; Shindell, D.; Jiang, K.; Fifita, S.; Forster, P.; Ginzburg, V.; HANDA, C.; Kheshgi, H.; Kobayashi, S.; Kreigler, E.; et al. Mitigation Pathways Compatible with 1.5 °C in the Context of Sustainable Development. In Global Warming of 1.5 °C. An IPCC Special Report on the Impacts of Global Warming of 1.5 °C Above Pre-Industrial Levels and Related Global Greenhouse Gas Emission Pathways, in the Context of Strengthening the Global Response to the Threat of Climate Change; Masson-Delmotte, V., Zhai, P., Pörtner, H.O., Roberts, D., Skea, J., Shukla, P.R., Pirani, A., Moufouma-Okia, W., Péan, C., Pidcock, R., et al., Eds.; Intergovernmental Panel on Climate Change: Incheon, Korea, 2018; p. 2. [Google Scholar]
- Moeckel, R.; Kuehnel, N.; Llorca, C.; Moreno, A.T.; Rayaprolu, H. Agent-Based Simulation to Improve Policy Sensitivity of Trip-Based Models. J. Adv. Transp. 2020, 2020, 1902162. [Google Scholar] [CrossRef]
| Publisher’s Note: MDPI stays neutral with regard to jurisdictional claims in published maps and institutional affiliations. |
© 2020 by the authors. Licensee MDPI, Basel, Switzerland. This article is an open access article distributed under the terms and conditions of the Creative Commons Attribution (CC BY) license (http://creativecommons.org/licenses/by/4.0/).

 ,
, 


