1. Introduction
In arid and semi-arid areas, water resources are the major factor limiting crop yields [
1]. The arid and semi-arid area occupies 52.5% of China’s land area, which is mainly distributed in Northwest, Northeast, and North China. The Hexi region is an important agricultural area in Northwest China. In 2015, the total amount of water resources in the Hexi region was 7.71 billion m³, among which 6.87 billion m³ was withdrawn for agricultural use, and only 189 million m³ was left for environmental water use [
2]. The ecological environment problem is becoming increasingly serious because the ecological water is over-squeezed by irrigation. At the same time, irrigation efficiency is quite low in general, wasting a huge amount of water, which means that the potential of agricultural water conservation is huge [
3,
4]. Therefore, to improve irrigation efficiency is the key and effective way to solve the problem of water shortage, ecological environment deterioration, and to develop agricultural production in arid and semi-arid areas.
Previous studies have shown that agricultural irrigation methods and techniques such as partial irrigation, regulated deficit irrigation, alternate furrow irrigation, or drip irrigation can effectively improve the utilization efficiency of agricultural water resources [
5,
6,
7]. Regulated deficit irrigation can not only save agricultural irrigation water but also maintain crop production, which is important for arid areas where water resources are scarce [
8]; compared to conventional irrigation, the alternate furrow irrigation could save more than 50% of water, fundamentally increasing the productivity of irrigation water [
9]. In addition to irrigation methods and techniques, the content of soil texture and organic can also affect yield and water productivity by regulating the characteristics of moisture storage and release [
10]. At the same time, the rational use of plastic mulch and the application of fertilizer can help to reduce water evaporation and accelerate crop growth to a certain extent, to increase crop yield and achieve higher water productivity, and finally obtain better irrigation efficiency [
11].
There is still potential for the development of more efficient irrigation methods and technologies for agricultural production in China, but the effect of the same technology in different regions and farmers is very different [
12,
13]. One reason is that different regions have different mechanisms and traditions concerning water management, which ultimately affect the irrigation efficiency; another reason is that farmers’ endowments, such as their ability and perception, have strong influences on the application of water-saving technology.
Water resource management measures can be divided into two kinds: institutional and market-oriented [
14]. Institutional measures are regulatory policy instruments of water management authorities; market-oriented measures are economic policy instruments to stimulate users to save water, mainly using the leverage of water price [
15,
16]. Although some studies show that small changes in water prices can only affect low-income families and only have a small impact on high-income families, water-saving is more of a moral and ethical issue, which has nothing to do with water price; as a consequence, the simple adjustment of water price cannot achieve the fundamental water-saving target, and the price cannot be implemented as a policy tool. However, in the long run, the price is still able to change the demand habits of water users [
17,
18].
In this article, key factors affecting irrigation efficiency are divided into four categories: regional differences, local water resource management, application of water-saving technology, and farmers’ perception. Through empirical analysis, we can verify and discuss the relationship between farmers’ irrigation efficiency (output value per cubic meter of water) and four groups of factors, such as regional differences, local water resource management, agricultural technologies, and farmers’ perception.
Previous studies [
5,
6,
7,
12,
13,
19,
20,
21,
22,
23] have shown that management capacity and its strictness, irrigation technology and facility conditions, and farmers’ knowledge of water resource management are key factors affecting irrigation efficiency. This article is based on questionnaire survey data; the corresponding variables are chosen to explain the following three factors: local water resource management, agricultural technologies, and farmers’ perception. For local water resource management, regulatory policy instruments (the enforcement of irrigation quotas), economic policy instruments, and farmers’ community management are the key factors that may affect water use efficiency. The most important water-saving technologies that may affect the water use efficiency in the study area are the use of drip irrigation, the proportion of no-till area, the degree of land leveling, and the conditions of the irrigation canals. From the perspective of farmers’ perception of water resources, the age, level of education and risk attitude of the head of household, who is the decision-maker in the family, as well as the proportion of cash crops, the cost of agricultural input, the cultivated area, and non-agricultural income of a household may affect the water efficiency of the farmer.
2. Study Area and Data
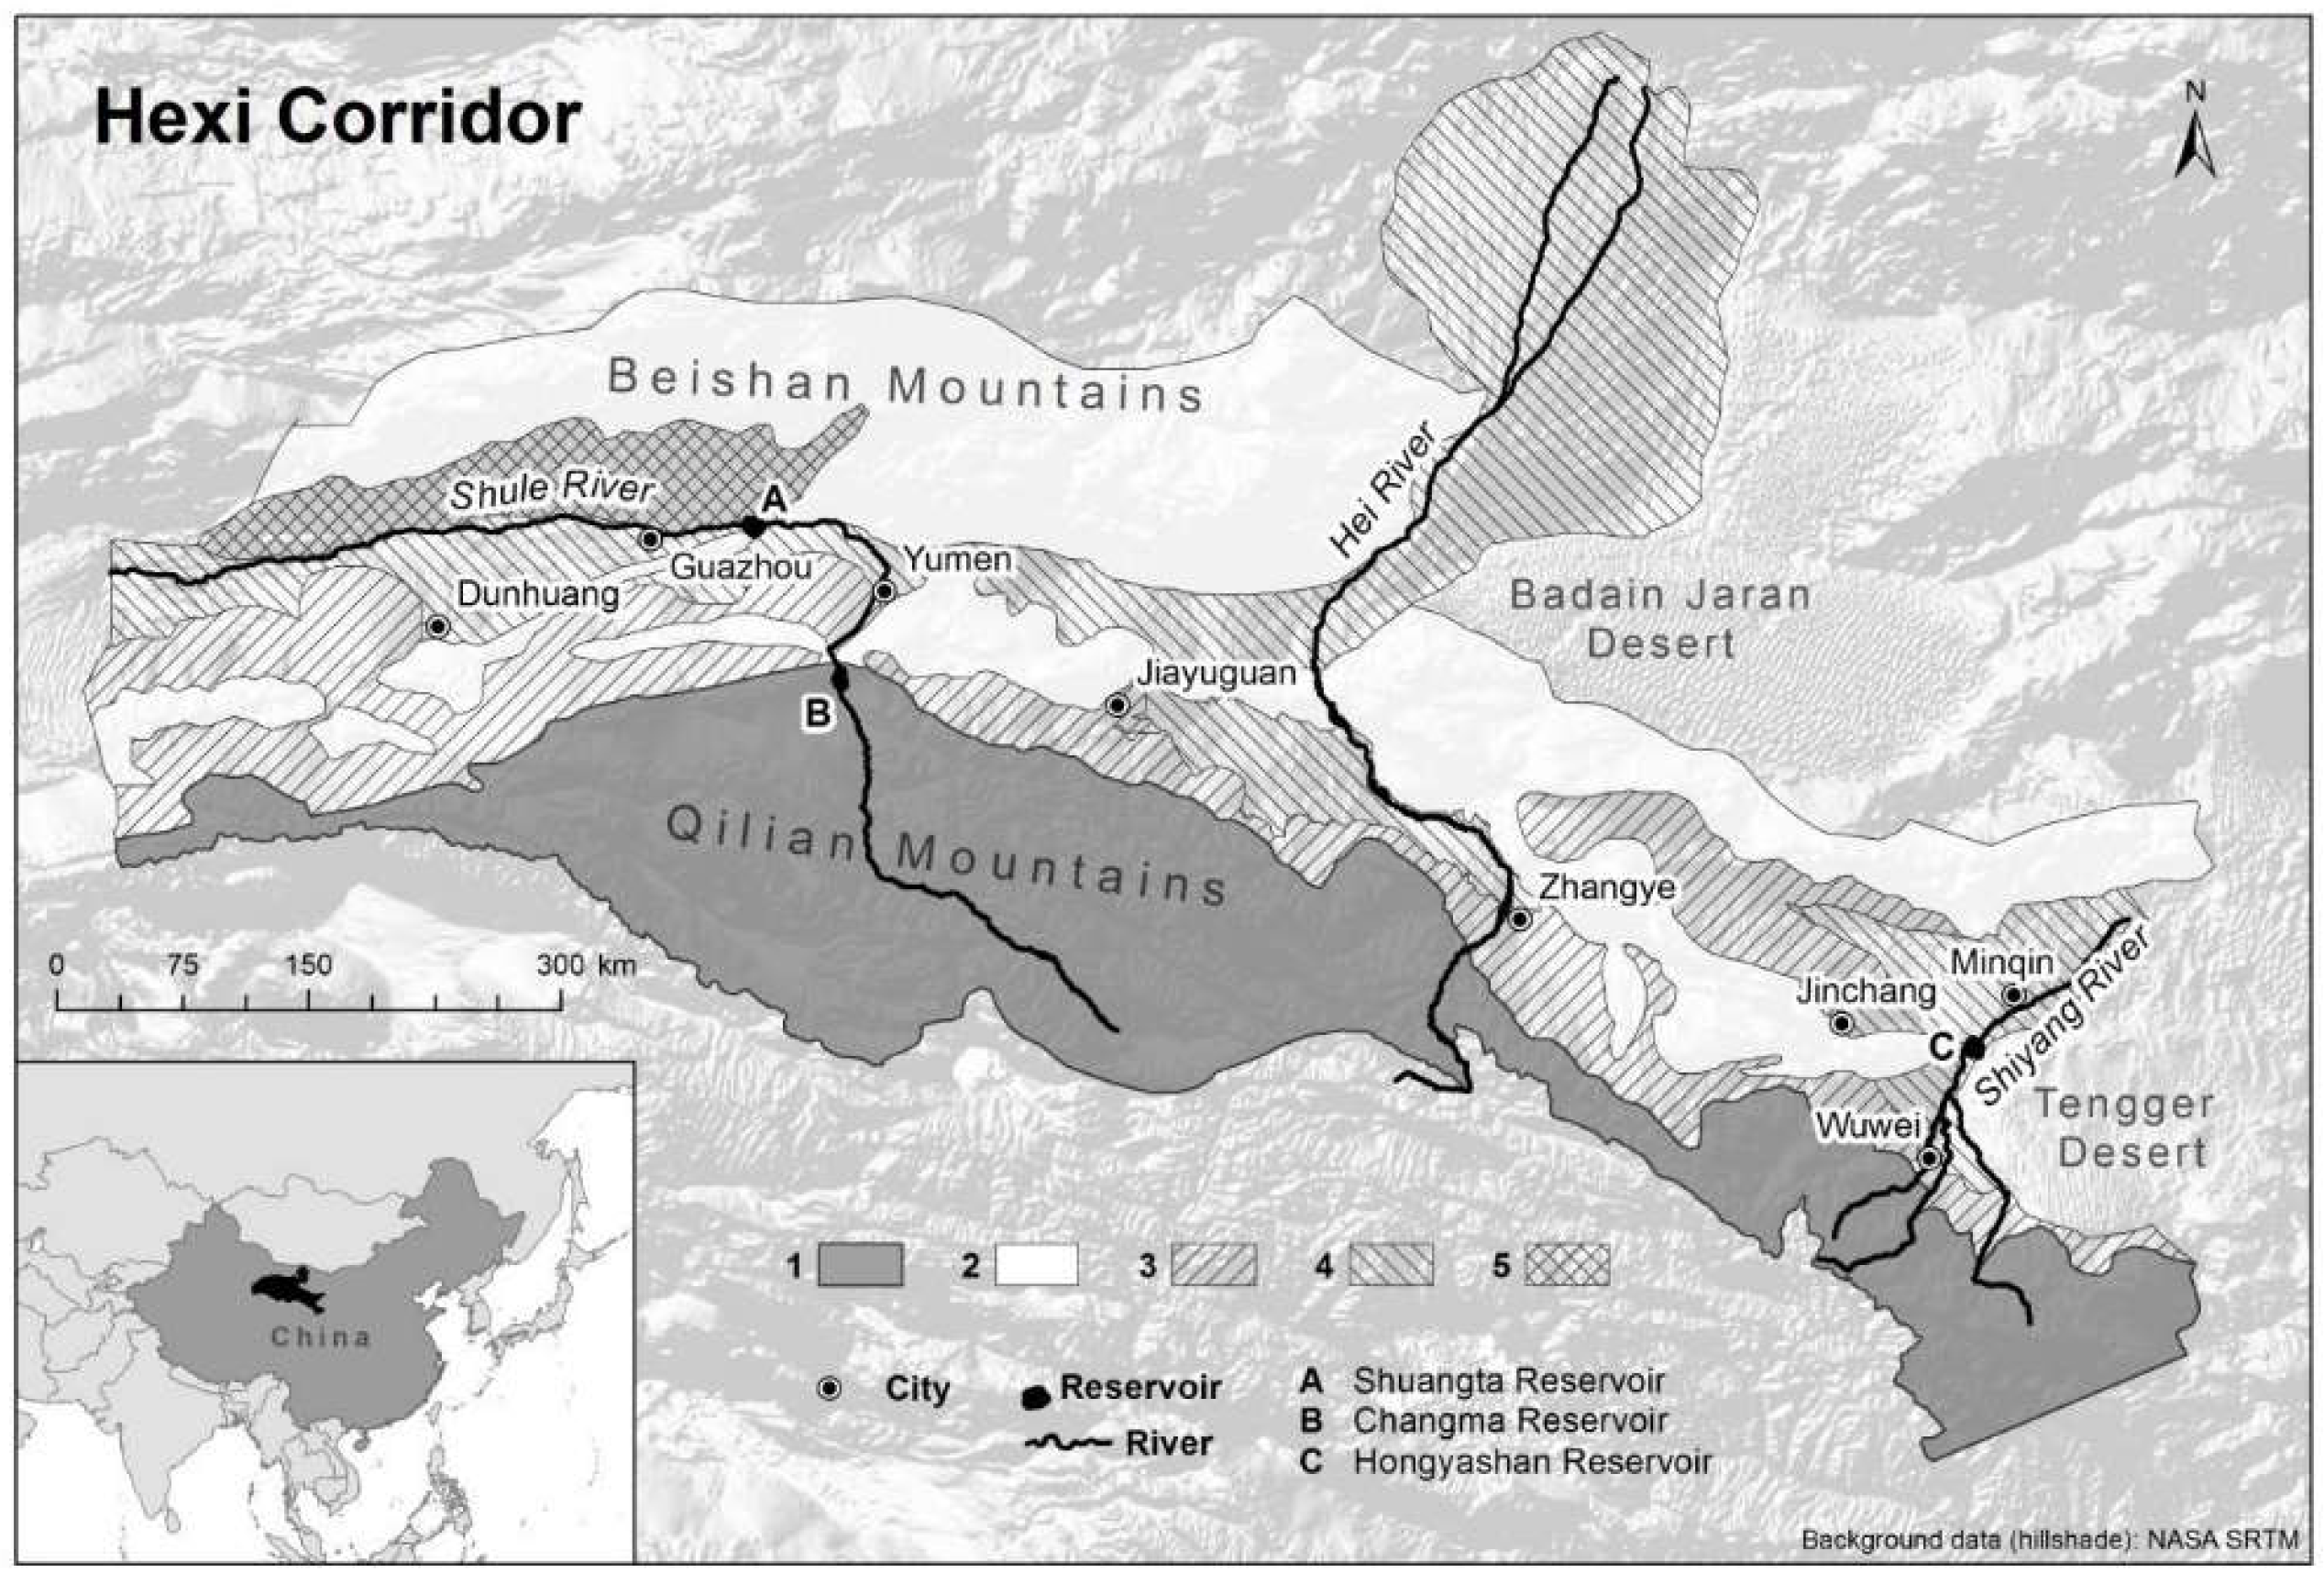
The Hexi Corridor region (37°17′–42°48′ N, 93°23′–104°12′ E) is an important historical region located in the modern Gansu Province of China, referring to a narrow stretch of traversable and relatively arable plain west of the Yellow River’s Ordos Loop (hence, the name Hexi in Chinese means “west of the river”), flanked between the much more elevated and inhospitable terrains of the Mongolian and Tibetan Plateaus (
Figure 1). It has five prefecture-level areas in Gansu Province including Wuwei, Zhangye, Jiuquan, Jinchang, Jiayuguan, and a small part of Qilian County in Qinghai Province, with an area of 215 thousand km
2. The precipitation decreases from east to west in this region, ranging from 250 mm in the east to 50 mm in the west, while the evaporation increases from 2000 mm in the east to over 3500 mm in the west [
24].
In 2015, the total population of the Hexi region was about 4.8 million, of which 2.3 million were urban population and 2.5 million rural population. By the end of 2015, the farmland area of the Hexi region amounted to 0.74 million ha [
25]. In 2015, the total amount of water resources in the Hexi region was 6.69 billion cubic meters, of which the surface water resources were 6.23 billion cubic meters and the pure groundwater resources were 461 million cubic meters [
24]. In 2015, the total water use in the Hexi region was 7.71 billion cubic meters, of which agricultural water use accounted for 81.8%, the forestry and animal husbandry sector accounted for 7.2%, industrial water use accounted for 6.1%, urban and domestic water use accounted for 2.4%, and environmental water use accounted for 2.5% [
2].
Figure 1.
Map of the Hexi Corridor region [
26]. Note: 1 = high rock mountains, 2 = low rock hills, 3 = alluvial fans, 4 = alluvial plains, 5 = foothill plains.
Figure 1.
Map of the Hexi Corridor region [
26]. Note: 1 = high rock mountains, 2 = low rock hills, 3 = alluvial fans, 4 = alluvial plains, 5 = foothill plains.
3. Literature Review
According to the literature and field survey, three groups of factors, including local water resource management, application of water-saving technology, and farmers’ perception are discussed below, except regional differences.
3.1. Local Water Resource Management
3.1.1. Regulatory Water Policy Instruments
Regulatory water policy instruments are common and easy ways to manage water shortage in areas where water is scarce. It is often used to mitigate water shortage and is usually controlled in the form of irrigation quotas. The irrigation quota is the total amount of water that can be used for the whole growth period (or full-season, year-round) of the crop, which is determined by the amount of water deficit and evaporation of irrigated areas, and the supply of irrigation water. The key objective of the quotas is to use it as a mechanism suppressing total water use, limiting farmers’ actual water use in upstream areas and ensuring a fair allocation of irrigation water to downstream areas in a centralized big- or medium-sized irrigation system. Especially in the arid and semi-arid areas, when a serious shortage of water resources and the progressive deterioration of the ecological environment occur, controlling the total amount of agricultural irrigation water strictly by determining a relatively small and reasonable irrigation quota is the simple and effective regulatory instrument that applies to the overall management of irrigated areas [
19,
20,
21,
22].
To measure the impact of regulatory water policy instruments on the level of each farmer household, the enforcement ratio: irrigation quota per 0.067 ha/actual water consumption per 0.067 ha was used. In theory, the quota ratio should be close to 1—that is, farmers make full use of water resources following the regulatory prescriptions, but in reality, the enforcement ratio is quite different in different regions and villages. Our research areas are similar: farmers need the same amount of water for irrigation; therefore, the higher the enforcement ratio, the stronger the implementation of the quota system; and the smaller the ratio, the weaker the implementation of the quota system.
3.1.2. Economic Water Policy Instruments
Studies have found that water pricing is an effective way to improve water allocation and encourage water conservation [
27,
28,
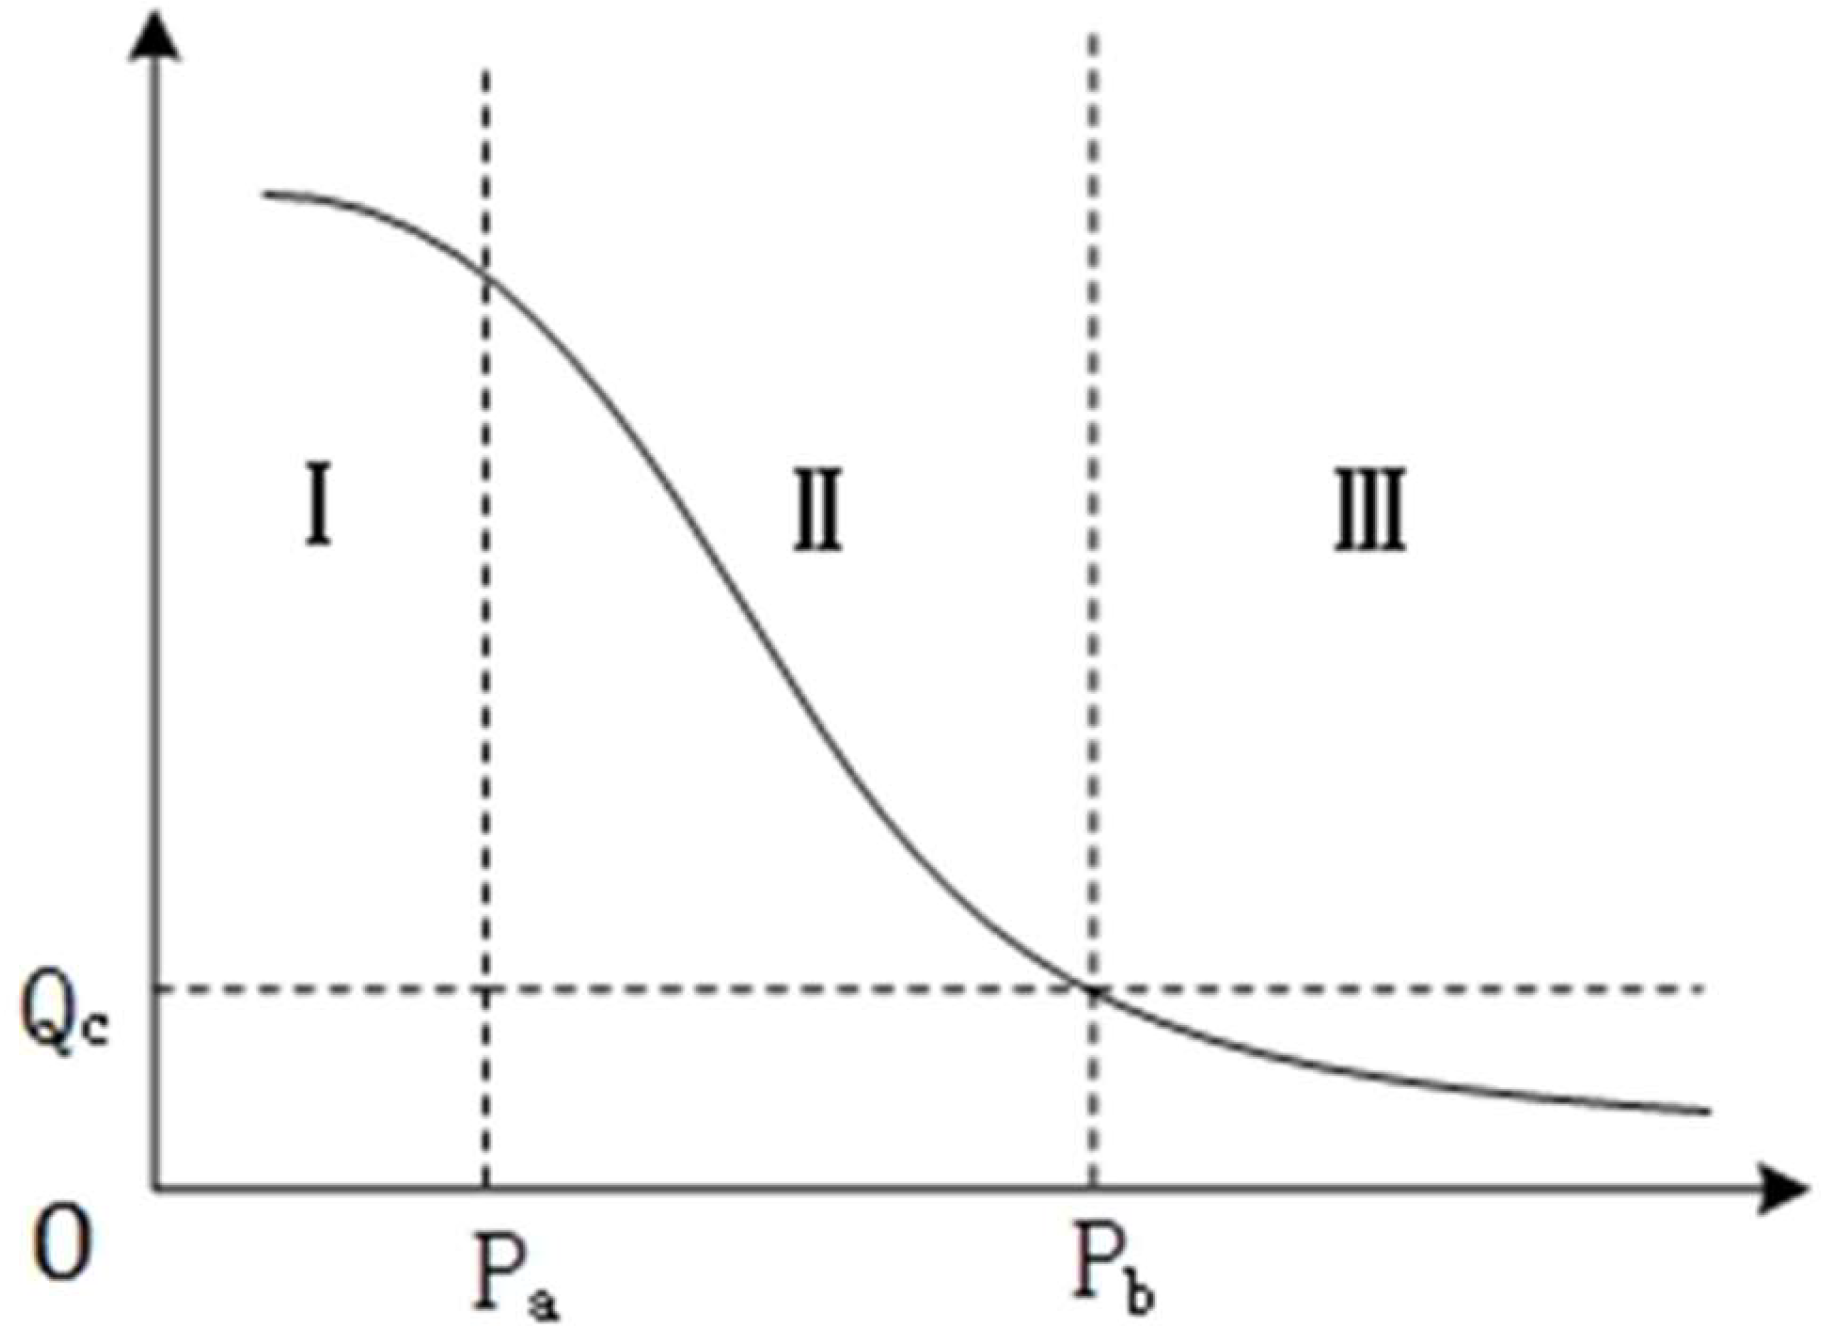
29]. According to traditional demand theory, water prices can be divided into three phases like many other commodities [
30,
31] (
Figure 2). When the price of water is at a low level, smaller than Pa (the first stage), the price elasticity of demand is less than 1, and the price change can only cause a small change in demand. Such prices are economically ineffective and will lead to market failures and inefficient use of resources. When the water price is larger than Pb (the third stage), this is close to the water price that people can afford. However, no matter how the water price increases, demand cannot be far away from the lower limit of demand, Qc, so the price of water also loses its market regulation function. Therefore, Pa to Pb is a reasonable range of water prices. In this range, water prices are flexible, water prices can fluctuate according to market supply and demand, and water price is a useful tool to adjust water demand.
It is worth mentioning that water resources have unique social attributes compared with other goods. As an irreplaceable input factor of agricultural production, agricultural irrigation water is more than a normal commodity: it also has special social characteristics. Therefore, agricultural water price management cannot simply rely on water price regulation, but it needs to combine water rights transactions, water subsidies, and management measures to achieve a win-win situation for both resource management institutions and farmers.
3.1.3. Farmers’ Community-Based Water Management
The water resources in the study area can be regarded as a kind of common-pool resource. Therefore, it is assumed that Ostrom’s Law [
32] can be applied to water management in this area. As co-owners of the common pool resource, farmers can coordinate, restrict, and supervise their irrigation activities through spontaneous organization and cooperation, discussing issues related to water allocation and irrigation rhythm, and help farmers to seek a more effective way to use water. Farmers can work together to improve their understanding of water-saving technology and application, to solve the contradiction between different water user groups. Therefore, it is also the focus of this study whether farmers’ cooperative behavior can significantly improve the efficiency of water use.
3.2. Agricultural Water-Saving Technologies and Irrigation Infrastructure
3.2.1. Agricultural Water-Saving Technologies
Studies have shown that agricultural irrigation techniques and water-saving technologies have an important impact on irrigation efficiency. Subsurface drip irrigation is a new agricultural water-saving irrigation technology: it has been widely used in arid areas in recent years. Compared with traditional irrigation, drip irrigation under mulch can promote crop water and nutrient absorption, improve crop yield and quality, and better control irrigation water [
33].
Land leveling can effectively improve the utilization of water, labor, and energy: it is one of the important technical measures to improve water resource management and irrigation efficiency. The experimental data for Uttar Pradesh in India showed that laser land leveling increased farm income by USD 145 per ha, improving system productivity by 7% and saving irrigation water use by 12–14% in rice and 10–13% in wheat [
34].
No-till farming is particularly suitable for hilly and dry areas with severe wind, and this technique reduces soil erosion using crop stubble by reducing soil tillage. At the same time, the surface of the no-tillage soil was retained by the stubble, and the growth of the plant root system at the interface of the stubble soil was promoted. A large number of straws were returned through the covering, indirectly or directly affecting the soil organic matter content, improving physical properties, and soil and water relations [
35]. Experiments have shown that no-till farming can increase the yield of maize by 19.26% and the water use efficiency by 13.3% [
36].
3.2.2. Conditions of Irrigation Infrastructure
Hexi inland river basin is a typical irrigated agricultural area: there is no agriculture without irrigation, and agricultural production depends on large-scale centralized irrigation canals. Therefore, the advantages and disadvantages of irrigation infrastructure directly affect the efficiency of water use. In the process of water delivery, the loss of water in the form of leakage results in a waste of water resources because of bad canal quality [
37].
3.3. Farmers’ Perception of Water Scarcity
Farmers, as independent individuals in agricultural production, have significant differences in crop selection, irrigation water use and management, and understanding of river basin water management policies, which directly affect the yield and irrigation efficiency of each farmer. For most rural households, their heads are the key decision-makers of agricultural productions. Therefore, this study takes the household head as the key observation object, by observing their age, education level, the experience of agricultural production, and risk preference, to analyze their impacts on crop selection, market judgment, input cost, and planting scale. The study assumes that the household head is rational and maximizing profit.
3.4. Regional Differences
Regional differences are mainly divided into three aspects: one is the hydro-geological and climatic differences, the second is the socio-economic differences, and the third is the difference between water resource management.
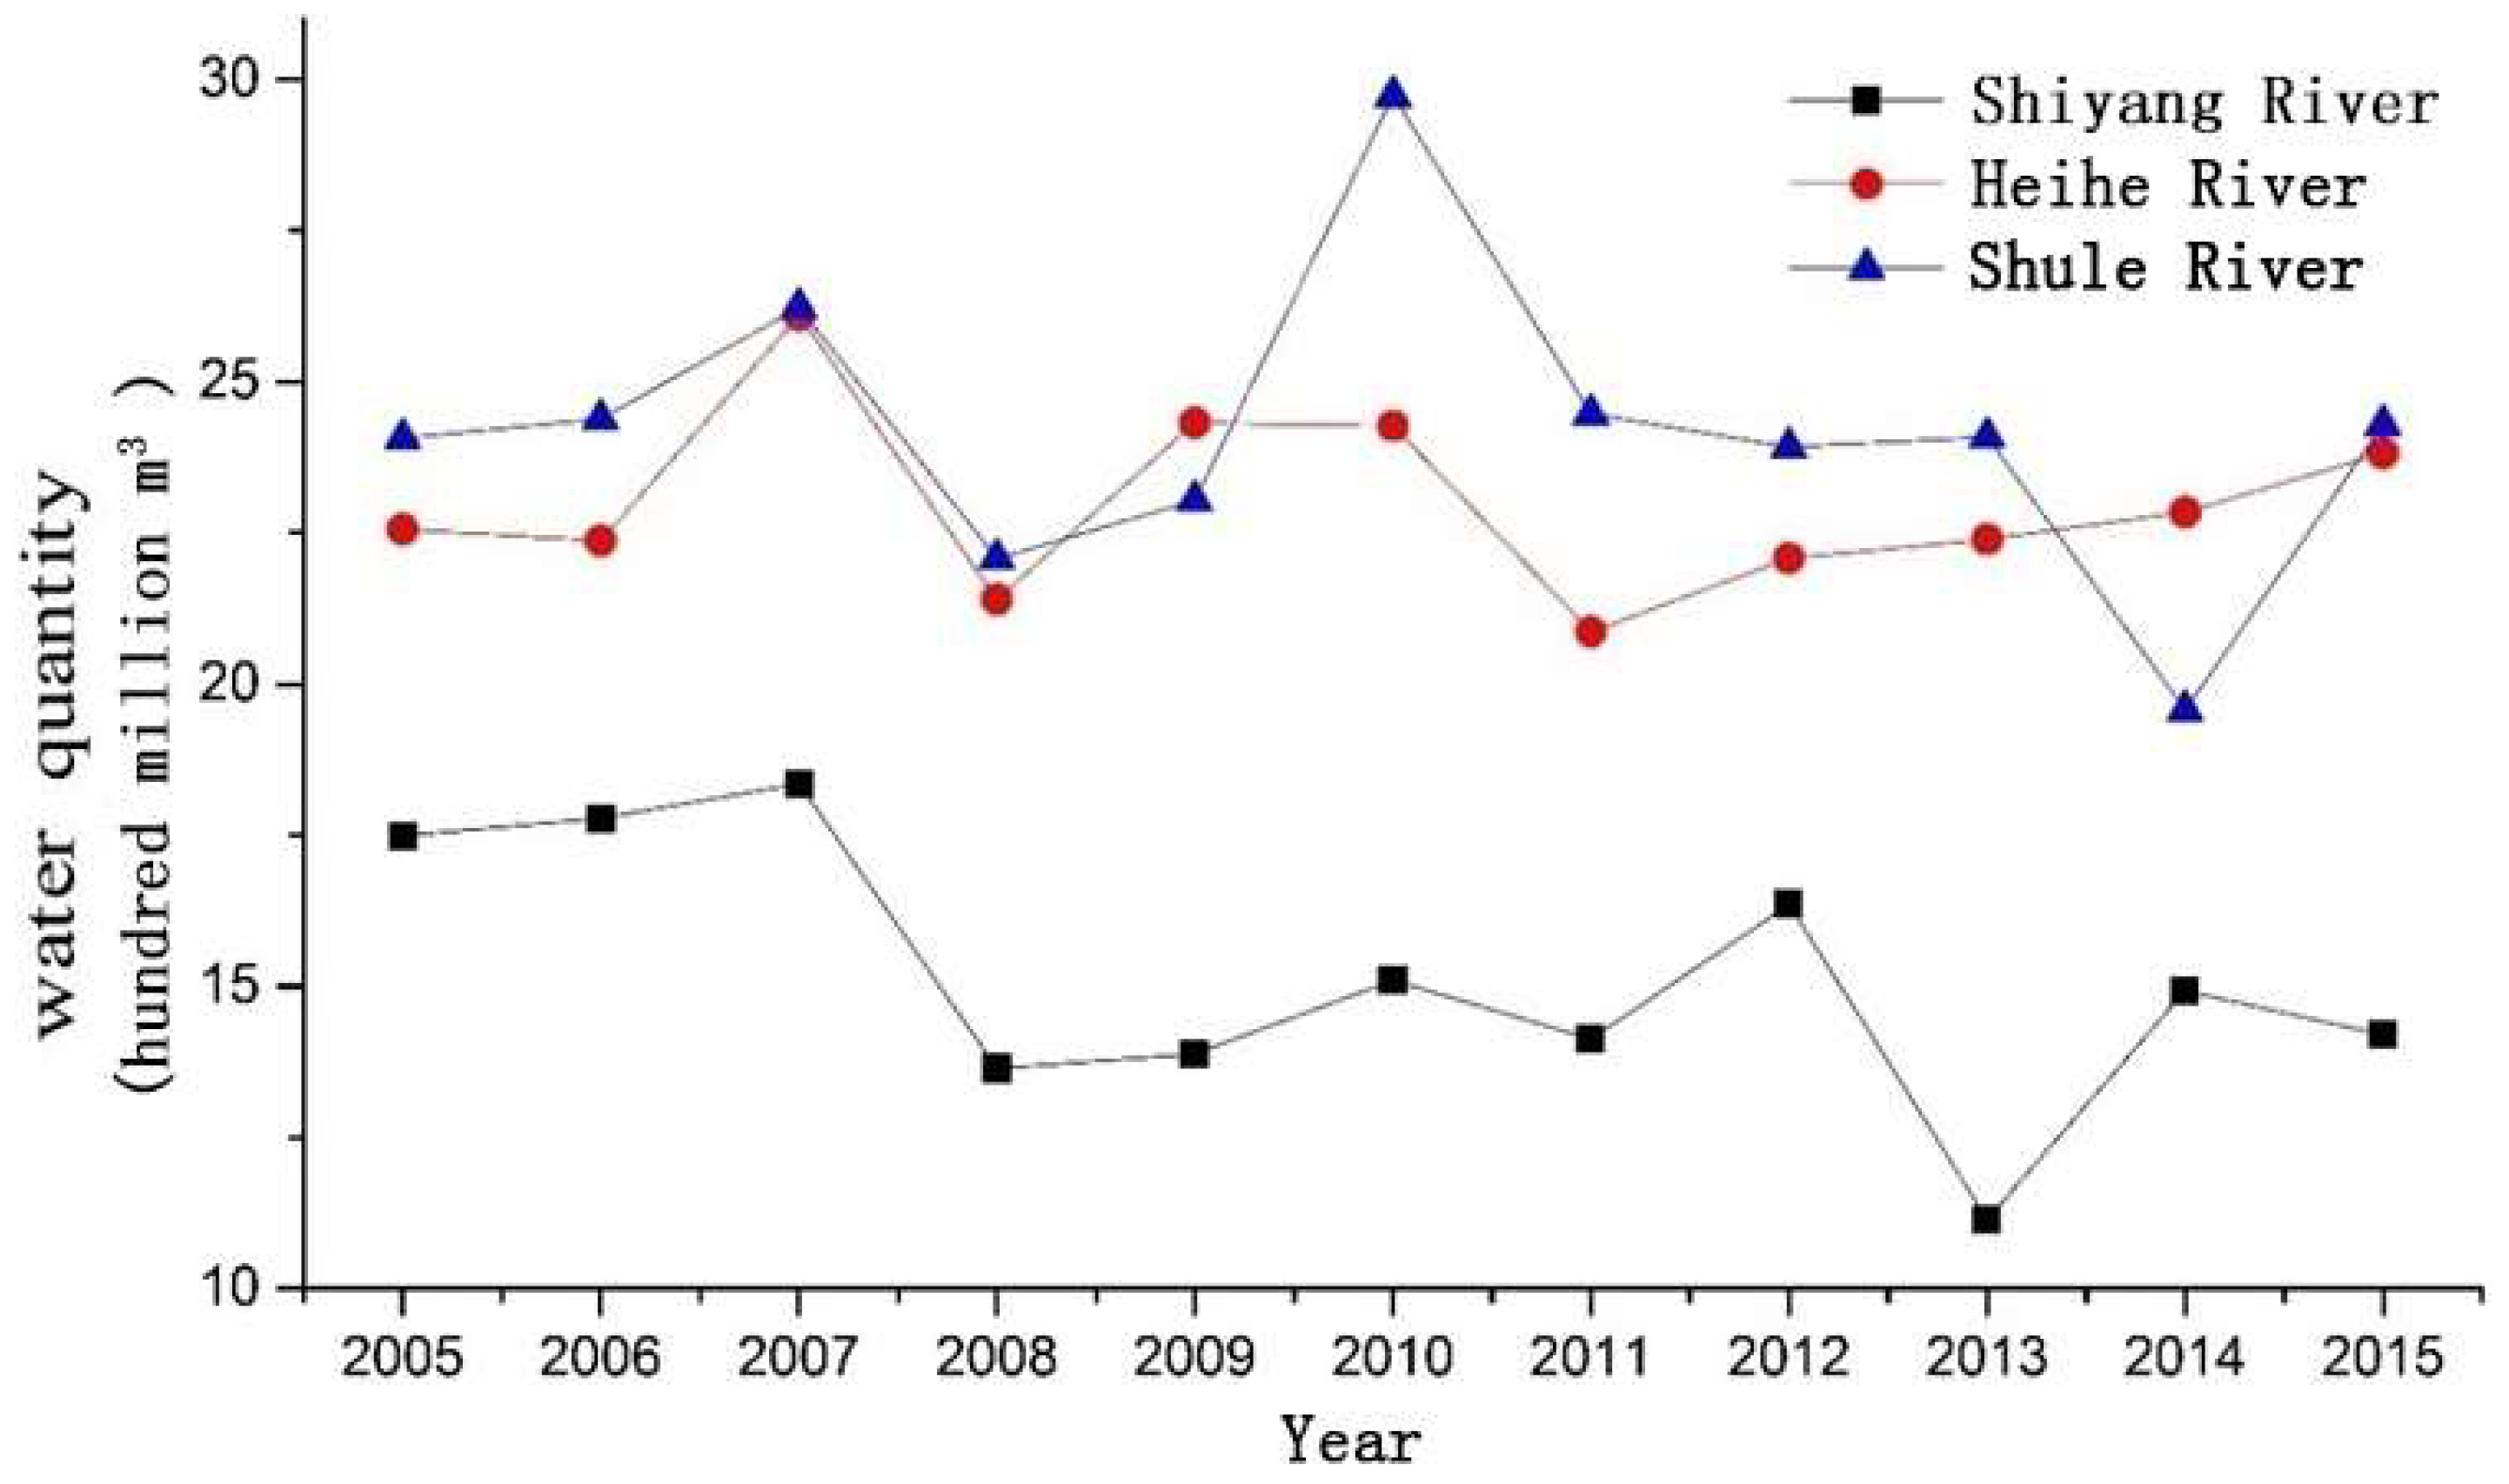
There are three inland river basins in the study area. From the east to west, the three river basins have reduced rainfall and increased evaporation, and the degree of drought gradually increased. The river upstream water volume is also different. As shown in
Figure 3, the amount of water in the upper reaches of the Shiyang River in the eastern part of the Hexi Corridor decreased significantly from 2005 to 2015, and the total amount was much lower than that of the other two inland rivers.
The water resource shortage of the three river basins is different, and the management objectives and management strictness are also quite different. Due to the most serious deterioration of the ecological environment, the Shiyang River Basin also has the largest population density, the most stringent irrigation quota, and joint management of surface water and groundwater are being implemented. The management objectives and tasks of the Shiyang River Basin Water Resources Administration are ecological governance and water use efficiency. In contrast, although the natural conditions of the Shule River Basin are the harshest, because the population density is very low, the water supply and the ecological environment pressure are relatively small, the irrigation quota of the cultivated area is highest, and the river basin water resource management is focused on the supply of irrigation water and collection of water fees, rather than ecological management. The Heihe River Basin is in the middle of the other two watersheds, in terms of the natural ecological environment, population bearing, and water demand. However, the Heihe River is the only river in these three that involves the inter-provincial distribution of water resources, and the work structure of the Heihe River Basin Authority is different, whose duties are focused on planning, coordinating, and overseeing provincial water division, and not participating in the allocation and management of water resources within the region.
4. Data and Methods
4.1. Data Collection
Our research group designed three sets of questionnaires for farm households, leaders of water users’ association, and well managers, respectively. The farm household questionnaire covered the following topics: household characteristics, crop cultivation, planting techniques, income and cost of agricultural production, crop water consumption, and water management. The questionnaire for leaders of the water users’ association included the same topics as raised in the household questionnaire, which can be used as a supplement to the household questionnaire at the village level. The well managers questionnaire is only for villages irrigated with groundwater, and villages only irrigated with surface water do not apply to the questionnaire. It investigated the use and management of groundwater for all wells managed by the well manager.
The data collection was carried out in the Shiyang River Basin, the Hei River Basin, and the Shule River Basin in 2013 and 2014. In order to obtain a representative household sample that captures the variation in water access and water quality, three to four townships were purposefully selected from relatively upstream to relatively downstream stretches along the respective river in each of the three areas. Afterward, ten villages were randomly selected from the pre-selected townships. The approach approximates a stratified random sampling method. In each village, 10 to 12 households were semi-randomly selected by the investigators who could walk through the village freely. Before the investigation, the investigators did not know that the selected households were only irrigating with surface water or groundwater or both of them. Because the farm household questionnaire involved the household water management problems in detail, the interviewee must be the household head or other members who were familiar with the household management, such as the spouse of the household head or their children who participated in farming. The interviewee of the village level questionnaire was the village cadre who was responsible for the water users’ association and was familiar with the irrigation. In the village using groundwater for irrigation, we also interviewed the current well manager. In total, 312 household questionnaires were filled out, 306 of which were valid.
The distribution of questionnaires and the basic family situation are described in
Table 1;
Table 2. The survey involved 10 villages in each of the three basins, together with a total of 30 villages and 306 households. The per household cultivated land area of Shiyang River Basin (0.86 ha) is the smallest in the three basins, which is closely related to a very strict water quota implemented since the year of 2010: (Key management planning in Shiyang River basin. The Bureau of Water Resources of Gansu Province, Development and Reform Committee of Gansu Provin, December 2007) irrigation quota for 0.17 ha cultivated land per capita. The highest is the Shule River Basin (2.08 ha). The Hei River Basin (1.31 ha) is in the middle, the same as the average level of the Hexi Corridor (1.31 ha ). The water consumption per unit cultivated land in the Shiyang River Basin is much lower than that of the other two basins, accounting for only 41.54% and 38.29% of the Hei River and Shule River Basin, respectively. However, the output value per unit area in the Shiyang River Basin (36,120 yuan (Yuan is the unit of Chinese currency RMB, USD 1 ≈ 6.2 yuan in 2013 on average.)/ha) is the highest in the three basins, which means that the Shiyang River Basin achieved higher agricultural output than the other two basins under the condition of using only 40% irrigation water, and the water-saving effect was significant (
Table 2).
Table 2 also shows that there are no significant differences in the family structure.
4.2. Method
The regression analysis method was used to analyze the factors influencing irrigation efficiency, which is measured by the output value per cubic meter of water. In the regression equation, the output value per cubic meter of water is the dependent variable. The independent variables are described in
Table 3.
Based on the planting area, yield and selling price of each crop in the last year, the output value per unit area was calculated. We needed the output value per cubic meter of water of cultivated land rather than the actual income of farmers; therefore, the total output and selling price of each crop were used for the calculation, regardless of whether these agricultural products were sold in the year or not. If the farmers sold agricultural products, we used the selling price; if the farmers did not sell, we used the average selling price of the same village. It is worth noting that the data of the Shiyang River are for 2012 and the Shule River and Hei River are for 2013. By determining that there was no abnormal weather in the three regions in those two years, it was assumed that there was no difference in agricultural production conditions, but given the price would change due to market demand, the crop price of the Shiyang River Basin was converted according to the crop price of Hei and Shule River Basin. At the same time, the total water consumption of surface water and groundwater was calculated according to the amount of household water usage, water price, water fee paid by farmers, and the depth of the well, which was calculated further with the surface water irrigation turns, amount of irrigation water each time, water price, groundwater irrigation turns, the use of electricity, and electricity fee in the year. We revisited the abnormal results—for example, if there was an abnormal value of water price, we would call the farmer to ask the reason and check it with the village leaders and the village committee (water users’ association) leaders.
The formula for calculating the output value per cubic meter of water of agriculture is as follows:
where
wp is the output value per cubic meter of water;
f is production value of crop farming;
i is crop type;
yi is total yield of crop
i;
Pi is selling price of crop
i;
w is the total amount of irrigation water in the year.
The calculation results are shown in
Table 4.
It can be seen from
Table 4 that the output value per cubic meter of water between the Hei River and the Shule River Basin is not much different, but the Shiyang River Basin is higher than the other two basins. The inner differences of farmers’ output value per cubic meter of water of the Hei River and the Shule River Basin are not significant, but the Shiyang River Basin is very different, which shows that a series of water management measures of Shiyang River has improved the water-saving efficiency of some farmers in general. The descriptive statistics of the relevant variables are shown in
Table 5.
All statistical analyses were performed by using Stata version 14.0. The multiple linear regression model was used to describe the relationship between the output value per cubic meter of water (wp) and all independent variables, including regional differences, local water resource management, farmers’ perception of water scarcity, and agricultural water-saving technologies. The model is as follows:
5. Results
The regression results are shown in
Table 6.
5.1. Water Resource Management
The results showed that the intensity of local water resource management had a strong impact on regional water efficiency. Among them, the quota ratio, surface water price, and self-governance of farmers all had strong effects on the farmers’ output value per cubic meter of water, significant at 1%, 5%, and 10%, respectively.
It is an unexpected result that the surface water price had a significant negative impact on the output value per cubic meter of water. If water price rises 0.1 yuan (66.7% on average), the output value per cubic meter of water will be reduced by 1.7 yuan. One possible explanation is that farmers are rational economic people, and rising water price causes water costs to increase; as a consequence, farmers may choose low water-demand crops, but the added values of these crops were also low so that the benefits reduced. Therefore, surface water price has a negative impact on the output value per cubic meter. Another explanation is the shortcoming of our data. We only had the cross-section data, the water price is controlled by the local government, and the water price has very limited variation in the same region. Good panel data are needed to carefully investigate how water price will affect irrigation efficiency.
The enforcement of regulatory policy instruments plays an important role in irrigation efficiency. The result shows that if the quota enforcement ratio increases by 0.1, the output value per cubic meter will be increased by 0.67 yuan. As mentioned before, the quota ratio is an index of the degree of strict irrigation water management implemented by the water resource management department of the basin. The higher quota ratio indicates that the water resource management is more effective in managing and constraining farmers’ water use, which leads to the increase in water use efficiency and the increase in the output value per cubic meter.
Self-governance needs farmers to cooperate. The cooperative behavior of farmers on water management had a positive effect on the improvement of the output value per cubic meter. The study confirmed that farmers can improve irrigation efficiency by the discussion of water-related problems.
5.2. Water-Saving Technology and Irrigation Infrastructure
In the variables of agricultural technology and irrigation infrastructure, only drip irrigation had a strong effect on the output value per cubic meter, which was significant at the 1% level. The output value per cubic meter of households with drip irrigation is 1.1 Yuan higher than those households without drip irrigation.
Land leveling and canal conditions had no significant effect on the output value per cubic meter. The reason might be that the level and progress of no-tillage, land leveling, and the state of canals in three basins are not very different, and there is no obvious difference between the farmers, as the consequence, the effects of these conventional water-saving technologies were not significant. However, this does not mean that water-saving technology does not affect water usage efficiency. At the same time, the current results also show that if we want to have a leap-forward development of water use efficiency, in addition to the general promotion of water-saving technology, the research and development and widespread promotion of more efficient water-saving technologies such as drip irrigation are the key.
5.3. Farmers’ Perception of Water Scarcity
The results showed that the age of the household head (the square of the household head’s age) had a significant effect on the output value per cubic meter at 5% level. A U- shaped relationship was found between the householder’s age and the output value per cubic meter. It meant that the output value per cubic meter gradually decreased with the increase in the age of the household head, and reached the minimum value by the age of 52, and then the output value per cubic meter increased with the age of the household head. Young householders have better physical strength, more active thinking, and stronger ability to accept outside market information to learn and apply new technologies, which contribute to the selection of plant products, the grasp of the market, and the application of water-saving technologies, which ultimately help to improve the output value per cubic meter. However, why would there be a turning point at the age of 52? This will be discussed in the discussion part of this article.
The risk attitude of the household head had a positive correlation with the output value per cubic meter (a significant level of 10%). In this paper, the risk attitude is the inverse index—the higher the risk attitude value is, the lower the tendency of farmers to choose to take a risk, and the lower the output value per cubic meter. Risk attitude is the degree of risk choice or tolerance. As mentioned before, the farmers who tend to take risks may be willing to accept new technologies and breeds. Therefore, the results showed that the higher the tendency of farmers to choose to take a risk, the higher the output value per cubic meter.
The ratio of the cash crop in the total crop area had a significant positive effect on the output value per cubic meter at the 1% level. It is indicated that when the proportion of cash crop increased by 10%, farm households’ output value per cubic meter increased by 0.28 yuan. The unique agricultural production conditions in the inland river basin of the Hexi Corridor are suitable for planting cotton, seed production, Chinese wolfberry, grapes, special fruit, and vegetables, etc. The economic value of these crops is higher than that of traditional crops. These cash crops are not only the main source of farmers’ income but also contribute to improving water efficiency.
The costs of agricultural inputs per unit sown area had a significant positive effect on the output value per cubic meter at the 1% level, but the size of the effect was not high. The agricultural costs here included water and seed costs, fertilizer and pesticide inputs, labor and mechanical inputs, and all other costs. This result means that the higher the cost of farming is, the greater crop production can be achieved and the higher the output value per cubic meter will be. In terms of cost inputs, the results showed that farmers can determine the cost input plan reasonably based on revenue expectations and can contribute to the promotion of benefits through higher cost inputs, although the added value of this benefit is not satisfactory [
38].
The results showed that the non-agricultural income had a significant negative impact (1% level) on the output value per cubic meter. If the ratio of non-agricultural income increased by 0.1, the output value per cubic meter was reduced by 0.11 yuan. Irrigation is a time-consuming activity: farmers need more time on irrigation to reach effective water use. When a farmer’s main income is from no-farming sources, it means that the farmer does not depend on agriculture, then the farmer will spend less time on agriculture, and has a less effective water use as a result.
5.4. Regional Characteristics
In fact, in addition to the above reasons, there would still be some factors, such as the socio-economic as well as hydro-geologic and climatic conditions of the basin, that have a significant impact on the output value per cubic meter. In this paper, the Shiyang River Basin was used as the reference area. The results showed that the Hei River and Shule River Basin had much lower output values per cubic meter than Shiyang River Basin—2.53 and 2.74 yuan less, respectively—indicating that the Shiyang River basin had the highest irrigation efficiency keeping all other variables the same.
6. Discussion
6.1. Application of Management Measures: Water Price and Irrigation Quota—Which Is More Effective?
Our research areas, the three inland river basins (Shiyang, Heihe, and Shule river) in Gansu Province, Northwest China, are all located in arid and semi-arid areas, where water shortage is the common situation. Therefore, improving water use efficiency, especially irrigation, is vital for sustainable development in these areas.
Water irrigation quota and price are two main measures of agricultural water resource management all over the world. Our results showed that the irrigation quota had a positive effect on the output value per cubic meter, but the water price in the region had an unexpected result—a significant negative impact on the output value per cubic meter.
In practice, irrigation quotas are usually used as a mechanism to curb demand [
19]. In the case of water shortages, the most reliable and direct way is to reduce the water consumption of farmers by limiting the supply of water [
22]. Especially in arid and semi-arid areas with water shortages and deterioration of the ecological environment, irrigation quota is the most effective water management measure. Local government should consider surface water and groundwater at the same time to achieve conjunctive management; otherwise, the simple allocation of water resources (surface water) or restricted supply will lead to over-exploitation of other water resources (groundwater) in the suitable area. In recent decades, the actual cases of Minqin in the middle and lower reaches of the Shule River Basin have confirmed this conclusion [
39].
Water resource policies in many developing countries coordinated the relationship between water conservation and the pursuit of maximizing benefits through the integrated agricultural water resource management tools [
40,
41]. Our survey data showed that the Shiyang River Basin obtained the same or higher output per unit land than the other two basins by only using 40% of irrigation water (see
Table 1 and
Table 2).
Since the implementation of comprehensive river basin management in 2010, with the strengthening of water resource management and the investment of corresponding technologies and irrigation facilities, the water resources efficiency of the Shiyang River greatly improved. The effectiveness of water resource management cannot be ignored.
Theoretically, water price can play an important role in restraining demand and saving water. Farmers’ tolerance for irrigation water price tends to be high in areas where water is scarce, and the government is more inclined to develop a higher water price [
42]. In this paper, we did not obtain the expected results. China has a national policy to protect agriculture, and the irrigation water is implicitly subsidized. As a result, farmers pay a low water price, and the current water price especially surface water price, cannot fully reflect the scarcity of water resources, and also cannot reflect the costs of the water supply process. In order to make the water price tool workable, which means a higher price can force farmers to use less water and increase water efficiency, an explicit subsidy of irrigation water can be implemented, in which local government rises the water price and gives farmers subsidy directly at the same time.
6.2. Small-Scale Family-Based Agricultural Production Is an Indirect Factor Limiting the Efficiency of Water Resource Utilization
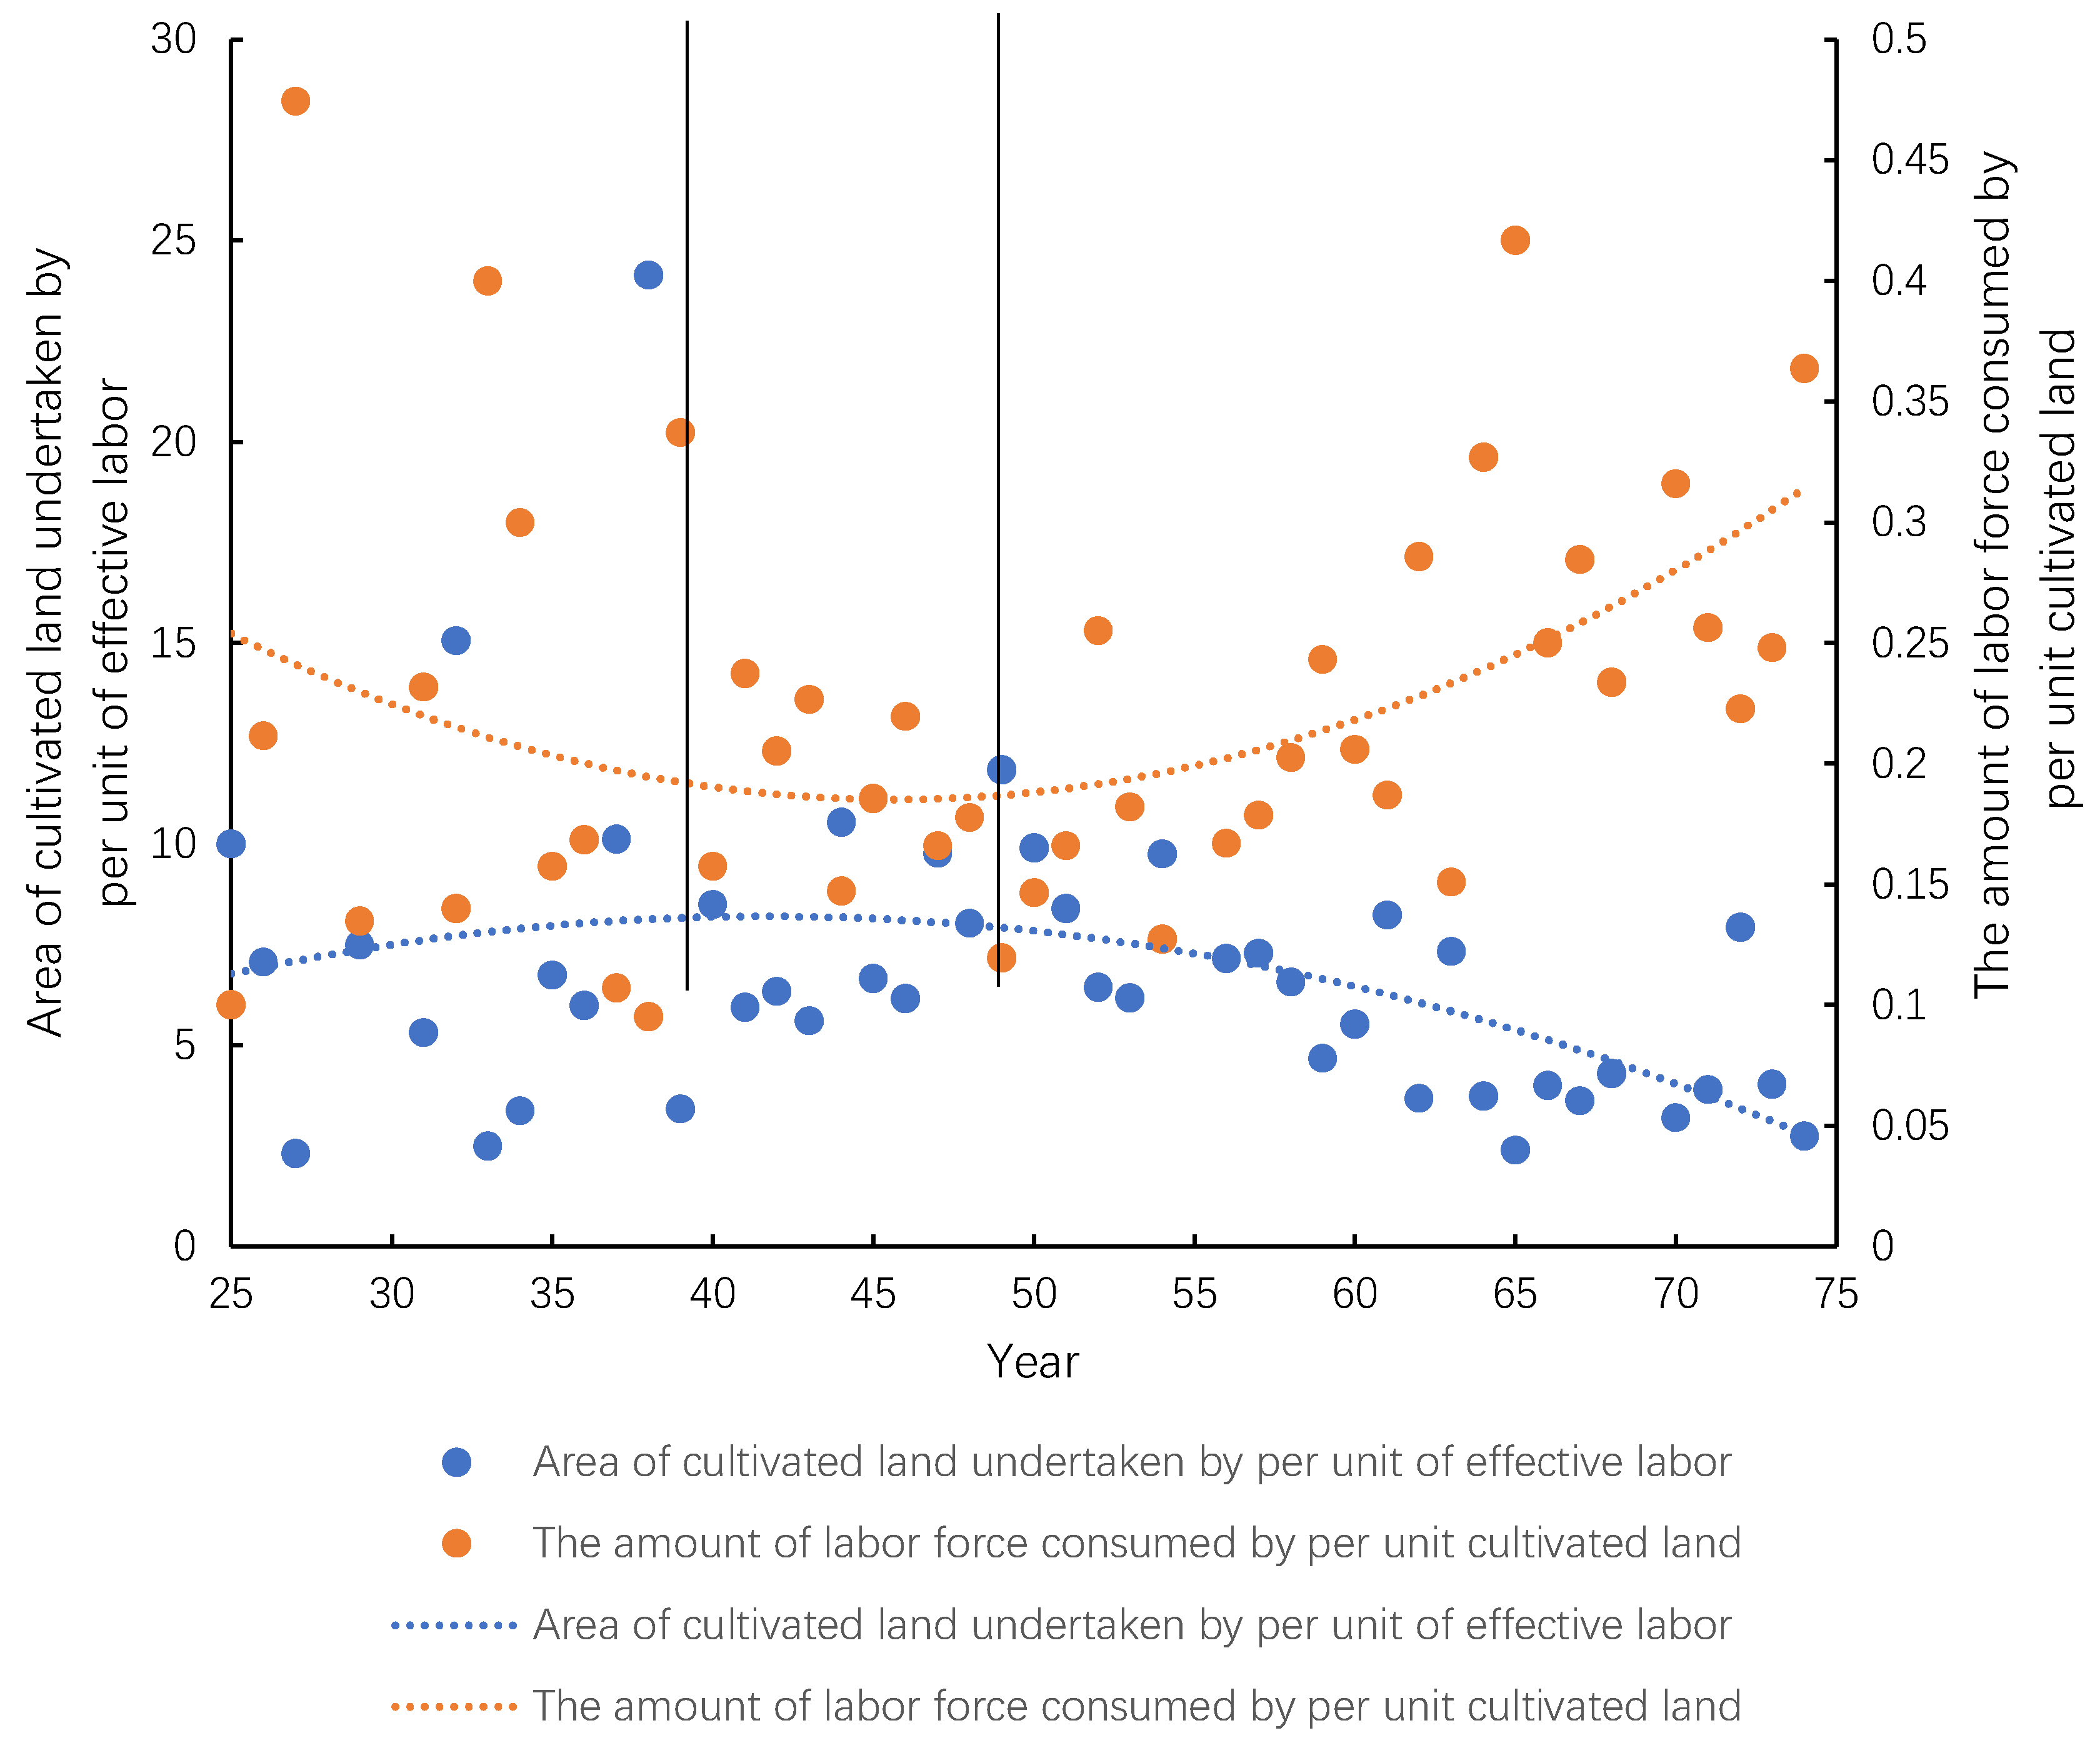
The age distribution curve of householders gave an interesting result in this article—a U-shaped relationship was found between householder age and the output value per cubic meter. It meant that the output value per cubic meter gradually decreased with the increasing age of the household head, and reached the minimum value by the age of 52, and then the output value per cubic meter increased with the age of the householder. The relationship between householder age and the output value per cubic meter before the turning point was explained in the previous part of this article, and this section focuses only on the relationship between age and agricultural intensification. The relationship between the age of householder and the amount of labor consumed by cultivated land, the relationship between the age of householder, and the area of cultivated land per unit of labor are shown in
Figure 4. The amount of labor consumed by cultivated land is the cultivated land undertaken per unit of effective labor in the surveyed household, and the effective labor force is the amount of labor force converted by family members’ time spent at home. The basis for the conversion is as follows:
Area of cultivated land undertaken per unit of effective labor (0.067 ha/per capita) = cultivated land area of family/effective labor force.
The area of cultivated land undertaken per unit of effective labor is the reciprocal of the amount of labor force consumed per unit of cultivated land. It can be seen that the age of the householder and the two labor force indices showed a quadratic linear relation. The relationship between the area of cultivated land undertaken per unit of effective labor and the age of householder was an inverted U-shaped curve, according to which the age of the householder can be divided into three stages. The first stage—at less than 40 years old, in the absence of land readjustment and other external factors, the area of cultivated land undertaken per unit of effective labor increases slightly due to land inheritance and land left by married sisters. The second stage—at 40–50 years old, the stable “platform period” is reached, and during this time, the farmers’ family population tends to be stable, their children are in school, the amount of the effective labor force is constant, and the householder and his/her spouse as the core members need to undertake most of the farm work. The third stage—at more than 50 years old, the physical strength of householder is declining, the adult children supplement the family’s labor force (maybe not a complete agricultural labor force), the area of cultivated land undertaken per unit of effective labor gradually declines, and the decline rate is far greater than the growth rate of the first stage.
According to the above analysis and the regression trend of the age of the householder and output value per cubic meter, it is not difficult to find that there is a close relationship between them. From the general trend, we can see that there is a coincidence between the lowest point of the curve of the householder’s age and water efficiency and the highest point of the curve of the householder’s age and area of the cultivated land undertaken per unit of effective labor. This means that under the traditional land contract responsibility system, the slight advantage brought by the land concentration under the natural state of the family disappeared with the increase in the householder’s age. After the age of 50, although water efficiency increases, this limited increase is due to the increase in the effective labor force. In other words, the increase in water efficiency is based on the consumption of more rural labor. If there is no external factor (such as the current situation of small-scale household management is broken by land circulation) to intervene, the current household management model will be stuck in this cycle of inefficient production of water resources for some time, in which it is impossible to promote the effective growth of water use efficiency by intensive production mode.


