Abstract
It is estimated that more than one billion people worldwide have some form of disability, and that number is expected to rise as the population ages. A lack of accessible transport can represent a challenge to commuting citizens and it can also inhibit tourists with reduced mobility. Online information about accessibility is the first point of contact that tourists have with their destination and it should therefore be considered an attribute of accessibility. In that context, this paper aims to: (a) propose a method for classifying the information about accessibility provided by the official websites of public transport systems; and (b) present and discuss the results of the application of the method to the official websites of 212 urban rail systems around the world. The results suggest that, despite it being the first indication of destination accessibility, many cities do not provide or provide unclear or insufficient information for tourists with reduced mobility on their official websites. Moreover, few official websites provide information on accessibility around stations or in the case of transfers. This novel method proved to be suitable for classifying the websites, as well as identifying aspects of the information provision that can be improved.
1. Introduction
The advent of Information and Communications Technology (ICT) has significantly changed the way people, organizations and governments communicate, interact, work and do business [1,2]. The increasing use of ICT has caused a revolution in many sectors worldwide. The tourism industry, which is one of the world’s leading economic sectors, having contributed 10.3% of the world’s total Gross Domestic Product in 2019 [3], is one of the industries that has been profoundly affected by the ICT [4].
The use of ICT and the popularization of access to the internet has affected tourist destination competitiveness [4,5,6], marketing and performance tracking [5], and has also entailed significant transformations in the way tourists behave when choosing a destination [4,5,7]. The possibility of accessing information remotely and continuously has helped to stimulate new demands for tourism. Furthermore, ICT has proven to be a valuable tool to identify the particular needs and interests of different groups of tourists. A better understanding of the demands and preferences of these groups can help to improve destination marketing and personalization of the services provided. One of the growing segments that have specific requirements comprises people with reduced mobility; those with disabilities and the elderly [5,8].
Globally, it is estimated that over one billion people have some form of disability. That is equivalent to around 15% of the world population, and the number is expected to increase, reaching 1.2 billion people by 2050 [9]. Considering only individuals with a type of disability that affects walking, leading to the need for a wheelchair, the estimate shows that there are 130 million people in this situation, which represents 1.85% of the world population [10]. Furthermore, the aging of the population is a well-known trend that is occurring faster than ever before, which is evident in almost every country and can be directly correlated with the increase in the population with disabilities [11,12,13].
The World Health Organization estimates that by 2050, 2 billion people will be over 60 years old, of which 434 million will be 80 years old or older. The increased life expectancy brings several opportunities for individuals, their families and society. However, there is not enough evidence that this longevity is accompanied by improved health status when compared with the previous generation [11]. In fact, according to the United Nations [14], 46% of the population over 60 years old has a disability, of which 250 million have a disability that is classified as moderate or severe [15].
In this context, it is possible to say that, if on the one hand, the aging process represents an increase in the population with disabilities, on the other hand, the lost mobility does not impede this population from leading an active life as, notably, this segment often has no time or budget constraints [16,17]. Thus, the increase in life expectancy boosts the niche market for senior tourism [15]. Nevertheless, the growing demand of this group for tourism represents a challenge for the industry, as older individuals must, at some point, experience declining mobility [18]. This scenario has led the tourism sector to rethink its services to provide accessible destination options [16], not only to meet the rising demand from this emerging segment but also to be aligned with the idea of sustainable tourism development [19], which is constantly emphasized nowadays [20,21,22].
Social sustainability is one of the three pillars of sustainable development and, despite often being neglected [19,23], it is fundamental to the maintaining of sustainable development as a whole [23]. The inclusion of people with reduced mobility in all spheres of society is essential to guarantee social sustainability. It is also an important aspect to be considered by public authorities, as it can do more than just contribute to the social development of a destination. It can also boost the economy and help to overcome poverty and inequalities [17].
It is well known that tourism is an activity that can strongly contribute to regional economic growth, as it is responsible for the creation of numerous direct and indirect jobs in related areas such as accommodation, retailing, attractions and transport [3,17]. It also contributes to individual physical and mental well-being [19,24]. Consequently, as part of society, people with reduced mobility should not have their right to engage in tourist activities limited due to lack of accessibility. So, the inclusion of people with reduced mobility should be an essential part of sustainable development. What is more, facilitating the access of this group to tourism should be considered a prerequisite for the sustainability of tourism itself [19,25]. That being the case, the accessibility of the services provided, as well as of the destinations themselves, should be an inherent part of any tourism policy and strategy [17,19].
In spite of the understanding that the inclusion of people with reduced mobility is an essential part of sustainable development, this group still encounters countless challenges to participate in daily activities, due to the absence or insufficiency of accessible infrastructure. The lack of accessible transport, for example, can impose barriers against access to basic needs such as education, healthcare, employment and leisure [26,27]. Thus, the existence of accessible transport options, especially public ones, ends up being a primary element for cities that aim to ensure equity of access and guarantee the fundamental human right to personal mobility [28,29].
Transportation is a significant part of tourism and it is one of the primary elements considered when choosing or rejecting a destination [15,30,31]. Studies show that transport has a strict correlation not only with the attractiveness of the destination but also with the satisfaction of the tourists [31,32,33]. It is worth noting that some modes of transport are more tourist-friendly than others. Rail systems are a popular means and a high capacity option for the transportation of citizens and tourists within urban centers and they are usually preferred by tourists [34,35]. This preference may be explained by the fact that this kind of system has fixed routes, which makes it unnecessary to have any previous specific knowledge or communication/negotiation abilities to deal with the system, the area or the local language. Consequently, tourists generally find this type of public transport more convenient, as it is physically easier to use and psychologically less challenging than buses and other modes, in which some interaction may be required and where the risk of making mistakes is greater [34,35].
The provision of information is well known to be an essential part of the transport services and bear close relation to the traveler’s perception of quality and convenience and singled out as one of the main attributes of service quality in some cases [36,37,38,39]. Availability of information about accessibility is a major factor that also affects the tourist destination selection of travelers with disabilities [40,41,42,43]. One might even say that the provision of information itself is a precondition for tourism by people with reduced mobility, as the scarcity of information can represent a barrier when they are planning their trips [30,41,44].
However, even though the potential of accessible tourism has been recognized [40,43,45], there are still many issues to be overcome. The provision of information is one of them. Studies show that in spite of its importance, information about accessibility provided by the service operators at the tourist destinations is still insufficient and unreliable, even when it comes to official websites, which, in theory, should be the most reliable source of information available [41,46,47]. In fact, official websites should serve as a model for private sector websites [8], which is why they should be considered as a benchmark.
On that basis, studies that investigate the availability of information about accessibility in public transport systems are important and urgent, as they can help to raise awareness about the topic and also provide support that future researchers can lean on for further studies. Moreover, acknowledgment of the current status of the quality of the information that is provided by official websites can help the operators of those systems to rethink the way they present the information. What is more, a method that assists in this evaluation can serve as a tool to identify the issues and implement some improvements.
In that context and considering the importance of the topic, this paper aims to: (a) propose a method to access and classify the information about accessibility that is provided by the official websites of the public transport systems; and (b) present and discuss the results of the application of the method to the official websites of the world’s 212 existing urban rail systems.
The results of this study indicate that, despite it being the first indication of destination accessibility, many cities do not provide any information or provide unclear or incomplete information on their official websites for tourists with reduced mobility. Moreover, few official websites provide information on accessibility around the stations or about accessibility in the case of transfers. The lack of information about accessibility has shown itself to be a global issue, present on all the continents and in countries with different levels of development, though especially noticeable among the developing ones. The method has proven to be a useful and viable tool to assess and classify the websites according to the information about accessibility that they provide. It has also shown itself to be suitable for assisting governments and service providers to identify aspects of the websites that can potentially be adjusted to improve the provision of information.
2. Literature Review
Accessibility is a concept that, although widely used in several areas, cannot be easily defined. This is because the concept embraces numerous meanings. Broadly, it refers to the access to physical environments, goods, information or even to services and activities at micro, meso or macro levels [48]. Broadly, accessibility can be understood as the potential to access opportunities [49]. Additionally, the term is commonly used to denote the attributes of virtual or physical environments, services, facilities or spaces that can be accessed, understood and with which it is possible to interact, regardless of personal abilities or disabilities. It also alludes to national or international technical standards for the design and construction of virtual or physical environments and services that are accessible to all [50].
In transport, the term “accessibility” is commonly used to describe how easily one can reach a destination, so it is both an indicator of transport performance and of land use [26,51]. Indeed, accessibility is the final goal of most transport activity [49]. Moreover, the term is also commonly used in the transport field to refer to access by people with disabilities to transport services and facilities, which includes all elements of the journey [50].
As previously mentioned, information provision is a key element of transport [50] and is closely related to the perception of service quality [37,38,52]. The provision of information about public transport is even more valued by tourists than it is by residents [53,54,55]. This can be explained by the fact that tourists often have no familiarity with the destination, which can make the use of the public transport system and getting around the city challenging [34,35,55].
The availability and quality of transport-related information are even more valuable for people with reduced mobility, as they are fundamental to enable trip planning [56] and independent travel [57]. In fact, the information about accessibility has been pointed out as being as important as the accessible infrastructure itself [5,47,58]. However, problems regarding the provision of information have been pointed out as one of the major barriers to tourism by people with reduced mobility [8,41,44,47,59,60]. Indeed, if this information is absent, the tourist with reduced mobility will likely choose another destination. Therefore, the availability of information about destination accessibility is a key element to expand tourism opportunities for people with reduced mobility [47,61]. In essence, one can say that the information about accessibility can be considered the first attribute of the accessibility of a destination, since, without it, the potential tourists will not even get past the trip planning phase.
As stated earlier, the advent of Information and Communications Technology has changed the tourism industry and the way tourists search for and access information [4,5,7]. Notably, the internet has become the main location where most of the interaction and communications related to tourism occurs [8,46,62]. In this context, websites have become the main source of information for tourists [8,63]. Even so, there is still an evident lack of information about accessibility on the websites, regardless of whether they are managed by the public or private sector [8,46,61]. As an effective website has been proven to be an essential tool for conserving and strengthening the relationship with the prospective tourists, as well as attracting new market segments [64], the tourism industry needs to focus on inclusion, providing a web environment that is convenient and that addresses the specific needs of all the different tourist segments [4,5,65].
In this context, some studies that discuss and assess the provision of information regarding accessibility have emerged. Westerheim et al. [66] investigate how people with mobility constraints assess information about accessibility at transport terminals. Their study proposes a unified set of information about accessibility at terminals. The authors discuss the importance of providing as detailed information as possible and how the availability of information can affect travel planning. However, the study focuses on information provided at the terminals (in loco) and did not consider the information provided online.
Eichhorn et al. [47] investigate whether tourist information accessibility schemes meet the informational needs of persons with disabilities. Surveys were used to obtain the results. Five main requirements of this group were identified, as follows: information richness and reliability, the suitability of information sources, the communication tools and customer-oriented services. The results showed that the information is still disjointed and lacks geographical reach. Although this research contributes to the understanding of specific demands for information that people with disabilities have, it only focuses on the information schemes, without considering the provision of information on other websites, such as the public transport ones.
Darcy [27], discusses the preferences of people with disabilities regarding the provision of information about accessible accommodation. However, instead of evaluating the available information, four information formats were presented and a group of respondents was asked to choose their favorite format. The formats presented were: (1) AAA tourism access icons; (2) textual presentation; (3) textual and spatial presentation; and (4) textual, spatial and digital photography, of which the fourth one was the preferred option.
Similarly, Buhalis and Michopoulou [5] conducted a qualitative study to understand the requirements and needs of the accessible market. The study found that, besides the accessibility of the physical environment, the information about accessibility and accessible information online is also necessary for this group of travelers. The authors emphasize that ICT technology could enable the destination to comply with these demands. Although the research indicates that destinations should provide detailed, accurate, comprehensive and personalized information to facilitate travel, it does not discuss in detail how to evaluate whether the information provided online is satisfactorily fulfilling those requirements.
Michopoulou and Buhalis [43] conducted group meetings and interviews with people with disabilities, to understand their informational needs. A prototype website was created incorporating these requirements and the volunteers were asked to perform some given tasks, so as to identify possible issues. Technical challenges to satisfy these information needs were also discussed. The results showed that: (1) an absolutely minimal prerequisite; (2) the destination’s accessible paths; and (3) a door-to-door access map, are the most important requisites for users with disabilities when planning a trip. This study presents some valuable outcomes, but it did not discuss the provision of information regarding transport accessibility, even though, as previously mentioned, that is essential for tourism.
May et al. [57] evaluate and compare the responses of two groups of people with mobility limitations to a crowd-sourced travel information mashup. The participants were asked to complete some given tasks at a designated website and then to classify the Information Quality and Cognitive Authority, by means of a Likert scale. The study pointed out a number of requirements for the provision of information about accessibility for people with mobility limitations. However, even though this study focuses on the provision of information about accessibility to transport, it does not consider the information provided by official sources and does not discuss the level of detail in which the information is provided, as the study subject is restricted to the crowd-sourced map-based mashup concept.
Porto et al. [44] proposed a Tourism Accessibility Index (TAI) to evaluate: (1) website information availability; (2) accessibility at the destination; and (3) tourist ability to participate in the destination’s main tourist activity. In this study, the authors investigate the availability of information about accessibility at official and non-official websites, but their data collection did not consider the quality of the information provided or any details about the information. The provision of information was collected based on a “yes” or “no” criterion.
Finally, in a more recent study, Rebernik et al. [67] designed the Disability Inclusion Evaluation Tool (DIETool) and the Disability Inclusion Performance Index (DIPI) to evaluate and monitor the accessibility and disability inclusion performance of cities. This tool consists of a set of indicators that converts the city features into a performance score. Various aspects of city life were evaluated, including transport and urban mobility. Within this range of assessment, there is an indicator of “accessible information and communication about transport”. Nevertheless, despite offering a comprehensive and valuable tool to assess the inclusion performance of the cities, this research does not cover the details of the online provision of information about accessibility.
Given this background, one can see that, in spite of the importance and urgency of the topic, there is still only a limited number of studies published in academic journals that address the provision of information about accessibility to public transport systems on official websites. Moreover, there is no study that proposes a method to collect this kind of data, with details, and classify the websites, as we propose in this paper.
3. Materials and Methods
The methodology of this study comprises five steps, as follows: (1) literature review; (2) proposed classification method; (3) Method application: data collection and processing; (4) Results and analysis; and (5) Discussion (see Figure 1).
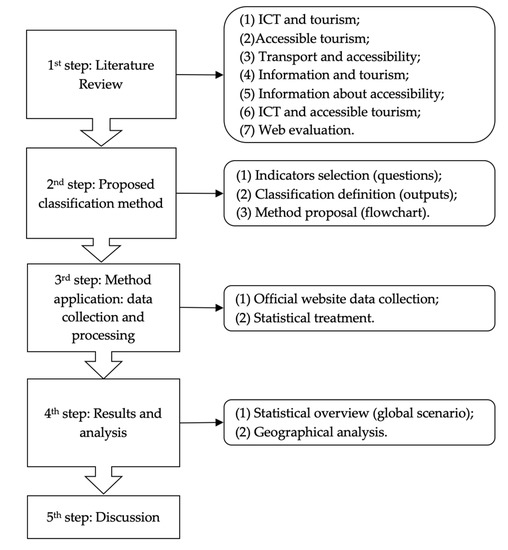
Figure 1.
Research methodology.
3.1. First Step: Literature Review
First of all, we performed a literature review at two of the most recognized academic databases and search engines available, namely: Science Direct [68] and Google Scholar [69]. The search keywords included (but were not limited to) terms such as (1) ICT/tourism; (2) accessible tourism; (3) transport and accessibility; (4) information and tourism; (5) information about accessibility; (6) ICT and accessible tourism; and (7) web evaluation. These terms were used alone and combined, so as to find suitable references. Through this review, we could see that studies that correlate ICT, transport, accessibility and website information quality and evaluation are scarce, especially when it comes to indexed research papers. As detailed in the previous section, even among similar studies there is not one that proposes a method to evaluate the information about accessibility provided by transport system websites, as we intend to do in this research.
3.2. Second Step: Proposed Classification Method
Bearing in mind the aspects that we found in the literature review to be relevant for users seeking information at a service provider website and also considering the information about accessibility that is known to be essential for people with reduced mobility, we proposed ten indicators. These indicators can be divided into three main groups, according to the terminology commonly used for website quality/performance evaluation, as can be seen in Table 1.

Table 1.
Proposed indicators (model inputs) by type.
The indicators proposed can be grouped into three types: (1) indicators of findability; (2) indicators of navigability; and (3) indicators of content quality. These factors are typically used as attributes for web-quality/performance evaluation. However, it is important to mention that these terms are often not precisely defined in the literature and, in many cases, the distinction between one term and another is not clear-cut or there is overlapping to some degree between one or more of the terms. In fact, the definition of web quality itself and which attributes comprise this concept vary greatly in the literature [70,71]. For this study, we used the definition that appears to have a better fit with our indicators, as will be explained below.
The first group of indicators refers to the findability of the websites. The term findability expresses how easy is to find the website and to access its content. Practically speaking, findability is an attribute of the website’s usability and denotes how easily the website can be found in an internet browser search [72] and how easily the user can access the information on the website [73,74].
For this study, we proposed three indicators of this group. These indicators were used to evaluate the possibility to access the website and its content in the most basic sense. The aim of each one was: (1.1) to find and access the website itself; (1.2) to access the content of the website directly in English; and (2.3) to access the content provided in the original language, using a free-translation tool to convert the content to English.
The significance of finding the website with a free search engine relies on the fact that the vast majority of internet searches are made using such a resource [72]. In the meantime, the choice to evaluate the possibility of accessing information in English was guided by the fact that this language is considered dominant at all levels of activity [75]. It is also well known to be the international language of tourism [75,76]. However, it is worth mentioning here that, even though for domestic tourists the provision of information in English may not be relevant, for foreign tourists the possibility of accessing the information in a widely recognized language is a precondition to accessing the information itself. Thus, we chose to keep the focus on foreign tourists, because we consider that, if they are covered, domestic tourists will probably also be, since, in general, the information provided in the local language tends to be more complete than that provided in another language.
The second group of indicators relates to the navigability of the website. The term navigability is applied to designate the usability and ease of use that a website design should offer to its users [69]. It refers to how the design of the website actually helps the user to find the required information [63,71,77,78]. In our study, the indicators of this group were used to assess the ease of finding information about accessibility at the website. We suggested four indicators for this group. The goal of each one of the indicators was: (2.1) to identify the existence of information about accessibility on the first page of the website; (2.2) to detect the existence of information about accessibility in other sections of the website; (2.3) to recognize whether information can be accessed through symbols; and (2.4) to examine whether the information about accessibility can be found on the system’s official map.
The first page of a website is the most consistent part of the website and it is the one that users generally rely upon when searching for information [63]. For this reason, it is important to investigate whether the information can be easily found on the website homepage or if it is necessary to go through other sections to search for it. In this respect, these indicators are pertinent because they can give us an idea about the design of the website itself or about the importance that was given to the information about accessibility. The absence of organized information, following a logical structure and/or using graphical elements that can intensify information assimilation and support user understanding, can compromise the user’s navigation satisfaction [79].
Finally, the indicators of content quality reveal how detailed the information provided by a website is. The term content quality is mostly used in the literature to denote the extent to which the website is considered to be informative [77]. It expresses the importance of the information provided by the website [71]. The indicators of content quality helped us to judge the level of detail of the information about accessibility that is provided by the website. Three indicators were listed in this group. The main objective of each one of them was: (3.1) to check if there was information about accessibility at the station; (3.2) to verify whether the location of the accessible entrances/exits was provided; and (3.3) to ascertain whether any information about the accessibility of the station’s surroundings (walkways, crosswalks, parking lots) and transfers (integrated transit lines, shuttle services, nearby bus stations) was made available.
The level of detail in which the information about accessibility is provided is important, as people with reduced mobility require specific and detailed information when they are planning their trips [43,80,81]. Detailed information makes it possible for the travelers to evaluate whether the accessibility that the system provides is enough to meet their specific needs [66]. The more tailored the information, the better the users will be able to make their own judgments about a destination, considering their particular mobility limitations [57].
As can be seen by our indicator selection, we did not consider the accessibility of the website design or whether there were assistive technologies. The accessibility of the information itself and of the website have been addressed in many studies [8,82,83,84,85,86], which can be checked for further details. In this study, we only considered the provision of information about physical accessibility, in other words, if the information is available and can be found by a person that has reduced mobility but can access the website regardless of the existence of any specific assistive tool. Based on the indicators, five outputs were proposed (Table 2).
Table 2.
Proposed classification (model outputs) and details.
As can be seen in Table 2, the method has five possible outputs. These outputs express the quality of the information about accessibility that is provided by the websites, varying from the worst, (1) No information, to the best, (5) Information per station with some detail of accessible surroundings or transfers. Thus, we believe that this method can be useful to classify the websites, enabling comparisons of systems to be made. Moreover, the classification method presented in this study differs from existing methods proposed by other authors, as it not only serves to categorize the system, it also discloses the strengths and weaknesses of the website. This assessment can help service providers to improve their provision of information about accessibility, or at least to know where the problems are.
Finally, once the indicators and the outputs were defined, we developed the novel classification method using a visual-flowcharting-based model. In this kind of model, the indicators are placed in a logical sequential order, in order to simulate the occurrence of an event [87]. It means that one answer will depend on the previous one, thus offering a clear path for the data collection process. The decision to use this model was due to the fact that it enables the representation of the method in an intuitive way, suppressing the need of complex computer algorithms [87], which ends up favoring the reader and making replication or adaptation to other contexts easier.
Another important observation is related to the proposed indicators. While developing this method, we did not use a weighting methodology, as that kind of approach is both complex to design and apply, as well as being highly reliant on the context in which it is being used [67]. To determine the weighting for indicators of user behavior, for example, it is necessary to investigate the preferences of the specific group that will be evaluated, in order to determine the importance of each one of the indicators to that particular group. Consequently, the same set of indicators can be perceived in a totally different way in a different context, due to geographical, social, cultural, political and economic characteristics. In view of this, we developed a method whose main indicators, when combined, can elicit a significant first assessment of the website’s provision of information about accessibility. The breakdown of the proposed indicators into sub-indicators, in order to perform more specific evaluations according to local specifics, can be a subject for further study. The classification method proposed in this study can be seen in Figure 2.
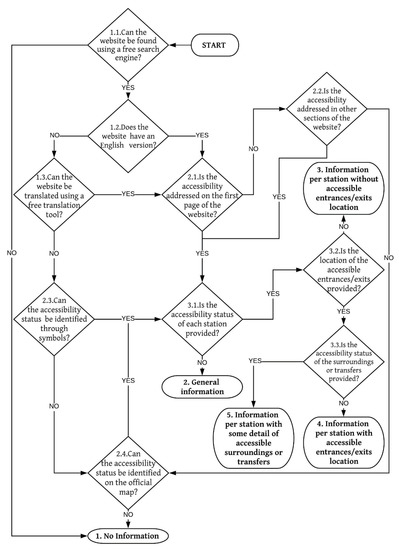
Figure 2.
Flowchart classification method.
As the design of the websites and the way the information is presented may vary significantly from one city to another, after developing the method we performed a pretesting application conducted by three different researchers at a dozen systems’ websites. These websites were randomly chosen. This test helped us to improve and validate the method. Once the pretesting application was completed, the flowchart was adjusted, resulting in the final version that can be seen in Figure 2. Additionally, some possible doubts that might appear in exceptional cases were identified and the action that should be taken in each one of those situations was listed, as presented in Table 3.
Table 3.
Method application exceptional situations and actions.
Table 3 presents some situations that arise during the application of the method. As can be seen, most of the occurrences and actions could be presumed, as they were already covered in the definition of the method outputs (Table 2). However, the extra clarification may contribute to a better understanding of the method and also highlight its coherence.
3.3. Third Step: Method Application: Data Collection and Processing
Once the classification method was developed, we proceeded to the application. The initial step was to list the world’s urban rail systems. It is important to mention that there is no consensus over the number of systems worldwide. This is due to the fact that the definition of what is an urban rail system is not precise and the global systems are diverse. Around the world, urban rail systems are referred to as metro, subway, MRT, u-bahn or underground. However, systems identified as light rail, monorail, metrorail, skytrain and others often share characteristics of heavy urban rail systems, which makes the categorization difficult. According to the International Association of Public Transport [88], in 2017 there were 178 cities in 56 countries with urban rail systems. The UITP only considers high capacity urban rail systems that do not share the right-of-way with other traffic and that have at least two cars and a total minimum capacity of 100 passengers. Above ground or suburban systems are not counted.
In order to expand our dataset, we used the definition presented by one of the most complete and accredited repositories of urban rail systems, the online platform urbanrail.net. On this platform, the urban rail system is defined as: (1) high capacity electric urban rail system that moves within the city; that runs (2) totally independent of other rail or street traffic; and that provides (3) high-frequency service with a maximum interval of approximately 10 min during normal daytime service [89]. Based on this definition it was possible to list 212 systems located in 59 different countries. Notice that, by this definition, above-ground systems and sections of suburban rail systems that are within the city limits were also considered if they met all these criteria. The list with the name of the city, country and type of system was taken from the online repository metrobits.com [90], which also uses the aforementioned definition.
The next step was the application of the method to collect the data and classify the system’s websites according to the information about accessibility that they provide. This application was carried out during the months of November and December 2019 and January 2020. In order to lower the risk of bias in the collection, all the systems were checked by at least two different researchers and, in the rare cases when divergence in the results appeared, the system was checked again by the previous two researchers that collected the data and then by a third one. These differences occurred mostly in cases where the system’s website was not satisfactorily translated or due to human error during the application process.
As explained before, the application of the method starts with the search of the URL address of the system’s official website, using a free internet search engine such as Google [91], Baidu [92], or Bing [93]. The search was done using the keyword “name-of-the-city metro” and other similar expressions. It is worth mentioning that we decided to exclusively consider official websites in this study, because they are expected to provide more detailed and reliable information. In fact, studies suggest that government-run websites are superior, in terms of quality and quantity of information provided, when compared with private sector websites [46] and urban rail systems are usually operated by the public sector alone or by a public–private partnership [94]. It should be mentioned that, by official website, we mean not only the website of the system itself but, particularly in the absence of one, other official websites such as one provided by the city government, the ministry of tourism or other government websites.
At this point, it is worth highlighting that the results represent the overall provision of information about accessibility in the city, considering the entire urban rail network. It is important to note that this study did not have the intention of identifying the accessibility of the system itself, as the focus is on the provision of information about accessibility. Thus, in cases where the city has many different systems, the method was applied separately to all the system’s websites and then compared, in order to present a single result that represents the status of the city.
Once the official website of the system was found, we proceeded to the next step, which consisted of accessing the website to check if it has an English version or if it can be translated using a free translation tool such as Google Translator [95]. Then, we continued the application of the method, following the sequence presented in the flowchart of Figure 2 and the guidance detailed in Table 3. The website URL address, the result for each one of the steps (indicators) and the final classification (output) of the systems were gathered in an Excel file to be later used to facilitate the systematization of the results and the analyses.
3.4. Fourth Step: Results and Analysis
After finishing the application of the method to classify the websites of the 212 systems worldwide, according to the information about the accessibility that they provide, we proceeded to the results and analysis phase. Descriptive statistics were used to organize the data, creating groups, and assigning percentage values to make manipulation, comparison and interpretation of the results obtained easier [96]. The results were also grouped by continent and by geographical region, according to the division proposed under the M49 standard of the United Nations [97]. The grouping of the data into continents and regions was carried out to enable the evaluation of any existing local trends and to allow comparison of the results at different levels of analysis.
3.5. Fifth Step: Discussion
Finally, once the results were presented, we moved to the discussion phase. In the discussion section, we list the main results of the application of the method to the websites of the urban rail systems around the world. We also point out some aspects that should be taken into consideration and that can provide insights regarding the results. Lastly, the performance of the method itself is also analyzed and some limitations are discussed, as well as offering some suggestions for future work.
4. Results
The classification method proposed in this study was used to assess the information about accessibility available on the official websites of the world’s 212 urban rail systems. The research found that there are urban rail systems on all five continents. Asia is the continent with the largest number of systems (86), which represents 41% of the total. China stands out, with 30 systems, which represents almost 35% of the systems on the continent and 14% of the world total. Europe is the second continent in number of systems, with 37% of the total (78 systems). The continent also has the second country in number of systems. Germany has 19 systems, which corresponds to approximately 9% of the 212 world systems and 24% of the systems on the European continent. The Americas, which here includes Northern America, Latin America and the Caribbean, have a total of 45 systems, 21% of the total. The United States of America also occupies the second position in number of systems, tying with Germany on 19 systems. The country alone also accounts for 42% of the systems on the continent. In contrast, Africa and Oceania figure far behind the other continents. Africa only has two systems and Oceania only has one, which means that each one of those two continents has less than 1% of the total number of systems.
As previously mentioned, China, Germany and the USA are the countries with the highest number of systems. Together with Japan, which has 15 systems, those four countries account for 39% of the total systems in the world. Even though other countries have multiple cities with urban rail systems, such as India (9), Brazil (8), Italy (8), Russia (8), France (7), Spain (7), South Korea (6), Iran (5) and Turkey (5), 59% of the countries only have one system within their territory. The spatial distribution of these systems over the globe can be seen in Figure 3:
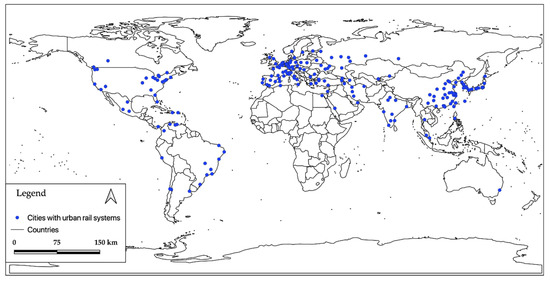
Figure 3.
Global spatial distribution of the cities with urban rail systems considered in this study.
Besides the division of the world into continents, the United Nations proposes subdivisions to facilitate statistical analysis. Based on those subdivisions, it is possible to compare regions within the same continent and recognize tendencies. The list of countries, with the number of systems that they have, the total number of systems in each one of the regions and the global percentage share of each one of them are all presented in Table 4.
Table 4.
Global distribution of the systems by country and region.
In Table 4, one can see that Eastern Asia is the region with the most systems, contributing almost 26% of the global total, followed by Western Europe and Northern America. Asia has the largest number of systems in the world, but 64% of the systems of that continent are concentrated in Eastern Asia. Europe and the Americas, on the other hand, have a better distribution of systems among its regions.
4.1. Method Application—Classification Results
The results of the method application show that 28% of the websites were classified as no information, 17% fall into the general information category, 29% have information per station without accessible entrances/exits location, 17% were found to have information per station with accessible entrances/exits location and 9% of them got the best classification, having information per station with some detail of accessible surroundings or transfers.
Asia is the continent with the highest proportion of websites without information. On that continent, 40% of the websites have no information, 17% have general information, 13% have information per station without accessible entrances/exits location, 27% have information per station with accessible entrances/exits location and only 3% of the websites have information per station with some detail of accessible surroundings or transfers. It means that, despite having the world’s largest number of systems, Asia has 49 of its systems’ websites, representing 57% of the systems on the continent, classified as no information or general information. However, it is worth noticing that 30% of Asia’s websites have detailed information, which means that there is information about the location of the accessible entrances/exits and, in some cases, there is also information about the surroundings and transfers.
Europe is behind Asia in the total number of systems, yet it is the continent with the largest proportion of urban rail systems within its territory. There are 44 countries on this continent, of which 23 have at least one system. On this continent, 17% of the systems’ websites have no information, 23% have general information, 43% have information per station, but without details of the accessible entrances/exits location, 9% also have details of the location of the accessible entrances/exits and 8% have some details about the status of accessibility of transfers or surroundings. It shows that 60% of their systems’ websites have information per station. However, even though in general the European websites have more information about accessibility than the Asian ones, Europe still performs worse than Asia in terms of the provision of detailed information on their websites. On this continent, only 17% of the websites have information about the location of the accessible entrances/exits, with or without extra information about the surroundings or accessibility of modal transfer options.
The Americas also had similar results. Over the whole continent, 25% of the systems’ websites were classified as no information. Websites with general information accounted for 7% of the total, while the ones with information per station without details of the accessible entrances/exits location totaled 33%. The websites with information per station and details of the accessible entrances/exits location amounted to 13%. The Americas was the continent with the highest percentage of websites providing, in addition to information about the accessible entrances/exits, some information about the accessibility of the transfers and station surroundings. In total, 22% of the continent’s websites offer this level of detail. The Americas is also the continent that has the largest percentage of websites with some information per station. Almost 69% of their websites provide this information, against 60% in Europe and 43% in Asia. Moreover, when we consider only the websites that offer information with details of, at least, the location of the accessible entrances/exits, the ones located in the Americas show a better result than in Asia and Europe. On that continent, 35% of the websites offer that level of detail, against the aforementioned 30% in Asia and 17% in Europe.
Africa only has two systems, which were classified as no information and general information. Finally, the single system located in Oceania has a website that has information per station without accessible entrances/exits location.
As can be seen in Table 5, the majority of the systems that are located on the Asian continent are in the Eastern region. This was also one of the regions where it was possible to find more information about accessibility. More than half of the urban rail systems’ websites in that region offer information about accessibility per station that is only behind the South-Eastern region, where 75% of the websites provide that kind of information. As previously mentioned, China is the country with the most systems evaluated (30 in total). However, 73% of them have no information or the information is general.
Table 5.
Results of classification method application by UN region.
Unlike Asia, Europe does not present such a significant discrepancy between its regions. Yet it is possible to note that Northern Europe has a better output, as more than 70% of its systems’ websites have detailed information about the stations’ accessibility and almost 43% of them have some information about the surroundings and transfers. In fact, one can see that, apart from Eastern Europe, in all the other regions more than 60% of the websites have some kind of information about the accessibility of the stations.
The Americas have a balanced distribution of systems within its two regions, but there is a clear imbalance when it comes to the level of information about accessibility provided on their systems’ websites. The Northern American region has the largest number of systems with information about the accessibility of surroundings and transfers. In fact, 56% of the systems that earned the highest classification proposed by this method are in this region. It represents 10 systems, with seven of them in the USA and three in Canada. Latin America, on the other hand, has 50% of its systems’ websites without information and there are no systems in that region that provided the most complete information, which includes the surroundings and transfers. It is worth mentioning that the six systems that are located in Central America and the Caribbean contribute to this scenario, as those systems are all classified as no information, while in South America 50% of the investigated websites have some information about accessibility.
4.2. Method Application—Indicators Results
The classification of the systems’ websites is important to draw the big picture, but in order to understand in depth which are the factors influencing these outcomes it is necessary to analyze the results of each indicator. The percentage distribution of the data by indicator is presented in Table 6.
Table 6.
Results of classification method application by UN region 2.
As can be seen in Table 6, the majority of the systems’ websites are available online. Among the websites that could not be found by internet search, half are from Asian countries. Except for Genoa (Italy), Chiba (Japan) and The Hague (Netherlands), all the cities that have no available websites are in developing countries [98].
With regard to the availability of an English version, 109 out of the 212 websites were found to have an English language option. That represents 56% of the 194 websites that could be found using a search engine. Considering the 85 websites that have no English version available, 39 are systems located in Asia, with 30 of them in Eastern Asia, while 33 are in Europe, 12 are in Latin America and one is in Africa. In fact, the results show that in Eastern Asia, Central Asia, Western Europe, Eastern Europe and Latin America more than half of the systems have no English version.
Even though 44% of the systems’ websites have no English version, 95% of them can be translated using a free translation tool. Of the 85 websites that have no English version, only four cannot be translated, three of them from China (Nanjing, Harbin and Xian). The other website that is not translatable is from Germany (Duisburg). On that website, it is possible to see that there is a section about accessibility, but the information is provided in a format that did not allow translation and the symbols are insufficient for an understanding of the accessibility status.
As seen, although access to information can be hampered by the absence of English content, it is not an insurmountable barrier. In fact, 190 out of the 194 websites that could be found through an internet search can be understood in English (provided by the website or translated from the original content). Of those 190 websites, 97 (51%) address accessibility on their homepage. Asia accounts for 25% of those systems, with the majority of them located in Eastern Asia. South Korea deserves mention, because all of its six systems provided information about accessibility on their websites’ homepage. The European systems represent 42% of the systems’ websites that cite the accessibility on the first page, including 12 out of the 19 German websites. The Americas have 32% of the total, 22 of which are located in Northern America. That covers the four Canadian websites and 18 out of the 19 systems in the USA. The only system in Oceania is also on the list.
If we take into consideration the 93 systems’ websites that do not address accessibility on their homepage, we see that 57% of them refer to accessibility in another section. It is worth noting that the websites that figure among the other 43%, in which accessibility is not mentioned in any section, mainly relate to developing countries [98]. There are only eight (out of the 40) systems that do not refer to accessibility on their websites but relate to developed countries. Those systems are mainly located in Europe: Dortmund and Mülheim (Germany), Brescia and Catania (Italy), Poznan (Poland), Palma de Mallorca (Spain) and Lille (France). The only one in the group that is outside Europe is Kamakura (Japan).
As previously mentioned, there were only four websites that could not be translated using the free translation tool. According to the method proposed, the next step was checking if the information could be understood through symbols, which was not the case for any of those four websites.
With regard to the existence of information about accessibility on the system’s official map, of the 44 websites where this indicator was checked, only three of them (7% of the total) presented some suggestion of accessibility. In none of them was the information detailed enough and those systems ended up being classified as general information. For the other 41 websites, there was not any indication of accessibility on the system’s map.
In total, there were 153 websites at which accessibility is addressed or is represented through symbols or on the map. Of those, 24% (37 systems) have no information per station, falling into the classification general information. The other 76%, which covers 116 systems, have information per station. This means that 55% of the websites evaluated in this study provide some kind of information about accessibility on their official website. If we consider only the 194 systems whose websites are available, we see that 60% of them address accessibility and have some kind of detailed information.
Out of those 116 websites that provide information per station, 53% (61 systems) do not indicate the location of the accessible entrances/exits. The other 47% (55 systems) have this information available. It is possible that some systems do not specify information about the accessible entrances/exits because the system only has one entrance/exit or because all entrances/exits are accessible. However, as neither of the situations is mentioned on the website it was considered that those systems do not offer information about location. What is more, in some cases there was information about accessible transfers or about the surroundings, but as there was no information about location the information about surroundings ended up not being collected/considered.
Finally, among the 55 systems that have information with details of which entrances/exits are accessible, 65% (36 systems) do not have any information about the accessibility of the station’s surroundings or about the accessibility of the transfer options. Thus, only 35% (19 systems) have the most detailed information. Of those 19 systems, only three are in Asia and they are located in high-income countries [98]. They are: Taiwan, Singapore and Hong Kong, a special administrative region of China. There are six systems in Europe, half of them in Northern Europe—Stockholm (Sweden), Newcastle and London (United Kingdom)—and the other three—Berlin (Germany), Budapest (Hungary) and Barcelona (Spain)—in other regions. As mentioned before, Northern America is the leading region in terms of detailed information. That region has 10 out of the 19 systems, with fourlocated in Canada and the rest in the USA.
5. Discussion and Conclusions
As mentioned in the Introduction, this paper aimed to: (a) propose a method to access and classify the information about accessibility provided by the official websites of the public transport systems; and (b) present and discuss the results of the application of the method to the official websites of the world’s 212 existing urban rail systems.
With regard to the application of the method to the websites of the urban rail systems, the results helped us to gain an overall picture of how the information about accessibility is being provided worldwide. It also made it possible to identify some major issues and perceive some trends.
The results show that, out of the 212 websites, more than half have information about accessibility, with at least an indication of accessibility per station. However, 45% of the systems have no information or have information that is too general. Out of those 116 systems that provide some information about accessibility per station, 53% provide information but do not state the location of accessible entrances/exits, 31% provide this information and only 16% provide any extra information on the accessibility of the surroundings or transfers. This shows that, even when the information is provided per station, it is still not properly detailed, which can introduce a degree of uncertainty for tourists planning a trip [43]. The most critical aspect was found to be the lack of information on the surroundings and transfers. A small number of systems actually provide some detail about the accessibility of the station surroundings or of the accessibility to other modes of transport that can be used in combination with the urban rail system. Even at the websites where some information is provided, it is still modest. Not even one system out of the 212 that were considered in this study provides complete and detailed information on transfers and surroundings, so no website can be considered a benchmark. It is an issue that needs to be addressed [99], as the provision of information that enables “door-to-door” travel planning is essential to ensure the convenience and dignity of travelers with reduced mobility [5,81].
In a world where there is much discussion about the importance of connecting and integrating services, such as transport, it is fundamental to think about the information regarding accessibility as part of this context. Integrating different modes of transport and enhancing the walkability of the city are essential steps to building a sustainable and livable city, but it is also important to integrate the information and the way it is provided.
As the results have shown, 44% of the systems’ websites have no English version. This indicates that the provision of information about accessibility in English is an important step to be taken by cities that aim to attract foreign tourists with reduced mobility. Nevertheless, the availability of other language options should also be considered in further studies as, despite it being the international language of tourism, offering information only in English may not be enough in a globalized world [100], especially given that some tourists may not sufficiently understand it [43]. It is important to highlight that the lack of information in English, despite being an obvious limitation that may impose difficulties in the accessing of information, did not represent a major barrier according to the results of this study. In fact, it was possible to access the information in English for 98% of the websites, even if in many cases a translation tool was required.
Another critical aspect to be improved relates to where the information is placed. Only 51% of the websites mention or link the section where the information about accessibility is provided on their homepages. Even though in 77% of the cases the information still can be found in other sections of the website, it is often hard to find it, especially given that each system refers to accessibility and to people with reduced mobility in a different way. The provision of a link to the information on the first page of the website is beneficial, simple and costless to implement and can make the information search process less time-consuming. Moreover, the importance of providing the information about accessibility, or a link to it, on the website’s homepage is justified by the fact that the first impression that the user has while navigating and searching for information on this page influences the willingness to choose that particular travel destination [63,100].
Furthermore, websites should facilitate access to information by providing symbols/images that can guide the users to the information. In this study, we found that at no website was it possible to understand the level of accessibility of the system by only relying on symbols. That is also the case with the official maps. In 93% of the cases when the map was checked, there was no information about accessibility shown on it. Studies show that the provision of photographs, images and maps showing the details of the facilities can assist travelers with disabilities in evaluating whether the accessibility provided meets their specific needs, which will ultimately have a positive impact on their perception of the reliability and accuracy of the information that is being provided [5,57].
Regarding the method itself, the results show that it is suitable for what it was designed for. The method that we propose in this paper performed as expected and was useful in assisting the collection and classification of information about accessibility provided by urban rail websites for tourists with reduced mobility. Moreover, this method also has proven to be suitable as a diagnostic tool to identify aspects of the official websites that need to be improved.
The distribution of the data through the flowchart, indicating which were the most common flow paths during the method application, as well as the number of system websites that were checked for each one of the indicators, is presented, along with the number and respective percentage of systems that followed one or another path (yes or no), in Figure 4.
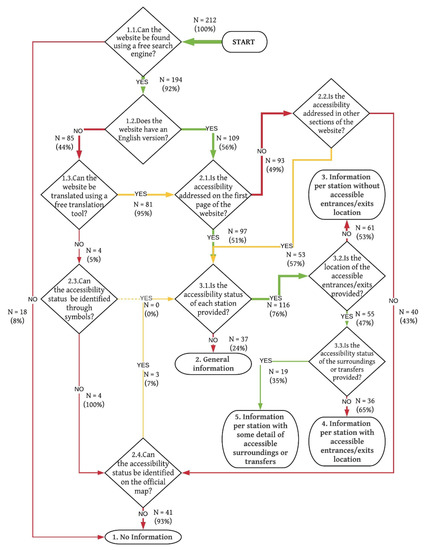
Figure 4.
Flowchart classification method with the distribution of the data flow through the chart.
Figure 4 presents an overview of the data flow within the chart. The lines were weighted to show how the data were dispersed through the flowchart. This was done in order to facilitate the visualization, thus favoring the reader and emphasizing the data trends discussed at the beginning of this section.
The optimal result, in which the website returns yes for all the indicators, is represented in green. No is represented in red and serves as an indication of where improvement is needed. Consequently, when the data are collected using the classification method proposed in this study, one can obtain not only the final classification of the system’s website but also a clear indication of the aspects that can be improved, as can be seen in Figure 5b. Additionally, we show in yellow the answers that do not belong to the optimal path but which are nevertheless positive.

Figure 5.
Comparison of the application of the method: (a) Optimum path and number of systems that followed it; (b) Example of Stockholm (Sweden) that yielded the same output but did not follow the optimum path, with indication of where the information provision can be improved.
As can be seen in Figure 5a, only 17 systems followed the optimal path all the way through to the final outcome. This means that two of the systems that obtained the best classification can still improve in certain aspects. Those two systems were Stockholm (Sweden), which returned a no for the indicator of provision of content in an English version, as shown in Figure 5b, and Newcastle (United Kingdom), which did not mention accessibility on the homepage.
As can be seen in Figure 5, beyond classifying the systems’ websites according to their information about accessibility provision, the method can also provide valuable additional feedback regarding aspects of the website that can be improved. Thus, the improvements that can be implemented based on the feedback may enhance the experience of the tourists with reduced mobility who are seeking information about accessibility. Moreover, the provision of information can be valuable not only for people with reduced mobility due to disabilities or aging. It can be beneficial for those that have temporary mobility constraints occasioned by injuries, pregnancy, traveling with young children, a child’s pushchair or luggage [5,57,66].
It is important to bear in mind that information about accessibility is still not fully trusted by those who need it [8]. This is understandable because as we can see, the information provided by official websites is often incomplete, doubtful, confusing, hard to find or not updated. This happens also because, unlike the physical environment, which is subject to specific legislation, such as the American Disability Act (USA), the Commonwealth Disability Discrimination Act (Australia), among many others, and the accessibility of the website itself, which has clear recommendations set by the Web Accessibility Initiative (WAI), there is no common or standardized guide or legislation on how information about accessibility for tourists should be provided [40,43]. The creation of standards with clear definitions of what kind of information about accessibility is needed and where it should be placed on the official websites would be beneficial, as it could make the information more reliable.
Further studies can extend this method to consider the provision of information about accessibility for other groups that have other specific needs, such as visual, hearing or cognitive impairments. The accessibility of the website design can be also considered through the combination of the method proposed in this study and other well-recognized standards, such as the one provided by the World Wide Web Consortium (W3C). Automatic evaluation tools such as AChecker, eXaminator, TAW, Total Validator, WAVE, Web Accessibility Assessment Tool, EvalAccess, Cynthia Says, MAGENTA, HERA, Amp and Sort Site can also be used to evaluate the websites’ overall accessibility.
Although this method was intended to be used to provide a first assessment of the provision of information about accessibility by the official public transport websites, it can serve as a basis for more specific approaches. The method can be customized for application in other contexts, including the possibility of accessing the website in other languages, or even removing the language indicators altogether for small scale analysis that only considers domestic tourists, for example. The breakdown of the proposed indicators into sub-indicators, so as to perform more specific evaluations according to local peculiarities can be a subject of further studies. For application on a smaller scale (to compare systems within the same country, for example) the indicators can be validated and weighted according to the local characteristics. The application of questionnaires, interviews, group guided meetings and other qualitative research methods can be used to attain this goal.
Having said that, we believe that the proposed classification method presented herein can contribute to this research area and can serve as a reference for further studies. Furthermore, the world overview that was presented in this study can help to shed light on this matter, which can be a starting point for other studies that aim to address these issues more deeply.
Author Contributions
Conceptualization, A.F.F.; methodology, A.F.F., Y.A., M.G.d.O.P. and S.K.J.C.; validation, A.F.F., Y.A. and M.G.d.O.P.; formal analysis, A.F.F. and Y.A; investigation, A.F.F. and M.G.d.O.P.; data curation, A.F.F. and Y.A.; writing—original draft preparation, A.F.F.; writing—review and editing, A.F.F. and S.K.J.C.; visualization, A.F.F.; supervision, A.F.F.; project administration, A.F.F.; funding acquisition, S.K.J.C. All authors have read and agreed to the published version of the manuscript.
Funding
The APC was funded by the Ministry of Transportation and Communications of the Republic of China (Taiwan), project name “Development of Public Transport Information Exchange Platform”, project code number MOTC-ITC-PTX-RPB-108.
Acknowledgments
The first author would like to thank the Ministry of Education of the Republic of China (Taiwan) for financial support through the provision of a doctor’s degree scholarship.
Conflicts of Interest
The authors declare no conflict of interest. The funders had no role in the design of the study; in the collection, analyses or interpretation of data; in the writing of the manuscript or in the decision to publish the results.
References
- Vu, K.; Hanafizadeh, P.; Bohlin, E. ICT as a driver of economic growth: A survey of the literature and directions for future research. Telecommun. Policy 2020, 44, 101922. [Google Scholar] [CrossRef]
- Jorgenson, D.W.; Vu, K.M. The ICT revolution, world economic growth, and policy issues. Telecommun. Policy 2016, 40, 383–397. [Google Scholar] [CrossRef]
- World Travel & Tourism Council. Travel & Tourism—Economic Impact & Trends 2020; World Travel & Tourism Council: London, UK, 2020. [Google Scholar]
- Buhalis, D.; Law, R. Progress in information technology and tourism management: 20 years on and 10 years after the Internet—The state of eTourism research. Tour. Manag. 2008, 29, 609–623. [Google Scholar] [CrossRef]
- Buhalis, D.; Michopoulou, E. Information-enabled tourism destination marketing: Addressing the accessibility market. Curr. Issues Tour. 2011, 14, 145–168. [Google Scholar] [CrossRef]
- Doolin, B.; Burgess, L.; Cooper, J. Evaluating the use of the web for tourism marketing: A case study from New Zealand. Tour. Manag. 2002, 25, 557–561. [Google Scholar] [CrossRef]
- Bizirgianni, I.; Dionysopoulou, P. The influence of tourist trends of youth tourism through social media (SM) & information and communication technologies (ICTs). Procedia Soc. Behav. Sci. 2013, 73, 652–660. [Google Scholar]
- Domínguez Vila, T.; Alén González, E.; Darcy, S. Website accessibility in the tourism industry: An analysis of official national tourism organization websites around the world. Disabil. Rehabil. 2018, 40, 2895–2906. [Google Scholar] [CrossRef]
- World Health Organization. World Report on Disability; World Health Organization and World Bank: Geneva, Switzerland, 2011. [Google Scholar]
- The Wheelchair Foundation. Available online: https://www.wheelchairfoundation.org/programs/from-the-heart-schools-program/materials-and-supplies/analysis-of-wheelchair-need/ (accessed on 5 June 2018).
- World Health Organization. Ageing and Health; World Health Organization: Geneva, Switzerland; Available online: https://www.who.int/news-room/fact-sheets/detail/ageing-and-health (accessed on 29 April 2020).
- JCHS. Projections & Implications for Housing a Growing Population: Older Households 2015–2035. Available online: www.jchs.hardvard.edu (accessed on 15 August 2019).
- Vignier, N.; Ravaud, J.F.; Winance, M.; Lepoutre, F.X.; Ville, I. Demographics of wheelchair users in France: Results of national community-based handicaps-incapacités-dépendance surveys. J. Rehabil. Med. 2008, 40, 231–239. [Google Scholar] [CrossRef]
- United Nations. Ageing and Disability. Available online: https://www.un.org/development/desa/disabilities/disability-and-ageing.html (accessed on 25 May 2020).
- Nikitina, O.; Vorontsova, G. Aging population and tourism: Socially determined model of consumer behavior in the “senior tourism” segment. Procedia Soc. Behav. Sci. 2015, 214, 845–851. [Google Scholar] [CrossRef]
- Alén, E.; Domínguez, T.; Losada, N. New opportunities for the tourism market: Senior tourism and accessible tourism. In Visions for Global Tourism Industry—Creating and Sustaining Competitive Strategies, 1st ed.; Kasimoglu, M., Ed.; IntechOpen: London, UK, 2012; Volume 1, pp. 139–166. [Google Scholar]
- World Tourism Organization. United Nations. Accessible Tourism. Available online: https://www.unwto.org/accessibility (accessed on 2 October 2020).
- World Health Organization. World Report on Ageing and Health; WHO: Geneva, Switzerland, 2015. [Google Scholar]
- Huang, L.; Lau, N. Enhancing the Smart Tourism Experience for People with Visual Impairments by Gamified Application Approach through Needs Analysis in Hong Kong. Sustainability 2020, 12, 6213. [Google Scholar] [CrossRef]
- Sharpley, R. Tourism and sustainable development: Exploring the theoretical divide. J. Sustain. Tour. 2000, 8, 1–19. [Google Scholar] [CrossRef]
- Del Chiappa, G.; Usai, S.; Cocco, A.; Atzeni, M. Sustainable tourism development and climate change: A supply-side perspective. J. Tour. Herit. Serv. Mark. 2018, 4, 3–9. [Google Scholar]
- Yoopetch, C.; Nimsai, S. Science mapping the knowledge base on sustainable tourism development, 1990–2018. Sustainability 2019, 11, 3631. [Google Scholar] [CrossRef]
- Wolbring, G.; Rybchinski, T. Social Sustainability and Its Indicators through a Disability Studies and an Ability Studies Lens. Sustainability 2013, 5, 4889–4907. [Google Scholar] [CrossRef]
- Pyke, S.; Hartwell, H.; Blake, A.; Hemingway, A. Exploring well-being as a tourism product resource. Tour. Manag. 2016, 55, 94–105. [Google Scholar] [CrossRef]
- Loi, K.I.; Kong, W.H. Tourism for All: Challenges and Issues Faced by People with Vision Impairment. Tour. Plan. Dev. 2017, 14, 181–197. [Google Scholar] [CrossRef]
- Grisé, E.; Boisjoly, G.; Maguire, M.; El-Geneidy, A. Elevating access: Comparing accessibility to jobs by public transport for individuals with and without a physical disability. Transp. Res. Part A Policy Pract. 2018, 125, 280–293. [Google Scholar] [CrossRef]
- Darcy, S. Inherent complexity: Disability, accessible tourism and accommodation information preferences. Tour. Manag. 2010, 31, 816–826. [Google Scholar] [CrossRef]
- UN General Assembly. Universal Declaration of Human Rights. 1948. Available online: www.refworld.org/docid/3ae6b3712c.html (accessed on 17 August 2018).
- Fasciglione, M. Article 20 [Personal Mobility]. In United Nations Convention on the Rights of Persons with Disabilities; Della Fina, V., Cera, R., Palmisano, G., Eds.; Springer: Cham, Switzerland, 2017. [Google Scholar]
- UNWTO. Recommendations on Accessible Tourism for All; World Tourism Organization: Madrid, Spain, 2013. [Google Scholar]
- Prideaux, B. The role of the transport system in destination development. Tour. Manag. 2000, 21, 53–63. [Google Scholar] [CrossRef]
- Khadaroo, J.; Seetanah, B. The role of transport infrastructure in international tourism development: A gravity model approach. Tour. Manag. 2008, 29, 831–840. [Google Scholar] [CrossRef]
- Boopen, S. Transport capital as a determinant of tourism development: A time series approach. Tourismos 2005, 1, 55–73. [Google Scholar]
- Hall, C.M.; Gossling, S.; Scott, D. (Eds.) The Routledge Handbook of Tourism and Sustainability; Routledge: London, UK, 2015. [Google Scholar]
- Lew, A.; McKercher, B. Modeling tourist movements: A local destination analysis. Ann. Tour. Res. 2006, 33, 403–423. [Google Scholar] [CrossRef]
- Kong, P.; Landesvatter, C.; Cornet, H.; Frenkler, F. Beyond Operational Improvement: A Qualitative Study on User Preferences for Public Transport in Singapore. In Proceedings of the 26th ITS World Congress, Singapore, 21–25 October 2019. [Google Scholar]
- Shen, W.; Xiao, W.; Wang, X. Passenger satisfaction evaluation model for Urban rail transit: A structural equation modeling based on partial least squares. Transp. Policy 2016, 46, 20–31. [Google Scholar] [CrossRef]
- Eboli, L.; Mazzulla, G. Relationships between rail passengers’ satisfaction and service quality: A framework for identifying key service factors. Public Transp. 2015, 7, 185–201. [Google Scholar] [CrossRef]
- Tyrinopoulos, Y.; Antoniou, C. Public transit user satisfaction: Variability and policy implications. Transp. Policy 2008, 15, 260–272. [Google Scholar] [CrossRef]
- Vila, T.D.; Darcy, S.; González, E.A. Competing for the disability tourism market—A comparative exploration of the factors of accessible tourism competitiveness in Spain and Australia. Tour. Manag. 2015, 47, 261–272. [Google Scholar] [CrossRef]
- Buhalis, D.; Darcy, S. Accessible Tourism: Concepts and Issues, 1st ed.; Channel View Publications: Bristol, UK, 2010. [Google Scholar]
- Chang, Y.C.; Chen, C.F. Identifying mobility service needs for disabled air passengers. Tour. Manag. 2011, 32, 1214–1217. [Google Scholar] [CrossRef]
- Michopoulou, E.; Buhalis, D. Information provision for challenging markets: The case of the accessibility requiring market in the context of tourism. Inf. Manag. 2013, 50, 229–239. [Google Scholar] [CrossRef]
- Porto, N.; Rucci, A.C.; Darcy, S.; Garbero, N.; Almond, B. Critical elements in accessible tourism for destination competitiveness and comparison: Principal component analysis from Oceania and South America. Tour. Manag. 2019, 75, 169–185. [Google Scholar]
- Dwyer, L.; Darcy, S. Economic contribution of tourists with disabilities: An Australian approach and methodology. In Accessible Tourism: Concepts and Issues, 1st ed.; Buhalis, D., Darcy, S., Eds.; Channel View Publications: Bristol, UK, 2011; pp. 213–239. [Google Scholar]
- Dion, C.P.; Woodside, A.G. Usefulness of government and private destination websites. In Tourism-Marketing Performance Metrics and Usefulness Auditing of Destination Websites; Emerald Group Publishing Limited: Bingley, UK, 2010. [Google Scholar]
- Eichhorn, V.; Miller, G.; Michopoulou, E.; Buhalis, D. Enabling access to tourism through information schemes? Ann. Tour. Res. 2008, 35, 189–210. [Google Scholar] [CrossRef]
- Iwarsson, S.; Ståhl, A. Accessibility, usability and universal design—positioning and definition of concepts describing person-environment relationships. Disabil. Rehabil. 2003, 25, 57–66. [Google Scholar] [CrossRef] [PubMed]
- Litman, T. Evaluating accessibility for transportation planning. Measuring People’s Ability to Reach Desired Goods and Activities. Vic. Transp. Policy Inst. 2020, 1, 1–64. [Google Scholar]
- UN DESA. Good Practices of Accessible Urban Development: Making Urban Environments Inclusive and Fully Accessible to All; United Nations Department of Economic and Social Affairs: New York, NY, USA, 2016. [Google Scholar]
- Chen, A.; Yang, C.; Kongsomsaksakul, S.; Lee, M. Network-based accessibility measures for vulnerability analysis of degradable transportation networks. Netw. Spat. Econ. 2007, 7, 241–256. [Google Scholar] [CrossRef]
- de Oña, J.; de Oña, R.; Eboli, L.; Mazzulla, G. Index numbers for monitoring transit service quality. Transp. Res. Part A Policy Pract. 2016, 84, 18–30. [Google Scholar] [CrossRef]
- Thompson, K. Tourists’ use of public transportation information: What they need and what they get. In Proceedings of the The Association for European Transport Conference, Strasbourg, France, 4–6 October 2004. [Google Scholar]
- Kinsella, J.; Caulfield, B. An examination of the quality and ease of use of public transport in Dublin from a newcomer’s perspective. J. Public Transp. 2011, 14, 4. [Google Scholar] [CrossRef]
- Le-Klähn, D.T.; Hall, C.M.; Gerike, R. Analysis of visitor satisfaction with public transport in Munich. J. Public Transp. 2014, 17, 5. [Google Scholar] [CrossRef]
- Waara, N. Older and disabled people’s need and valuation of traveller information in public transport. In Proceedings of the European Transport Conference, Leiden, Netherlands, 5–7 October 2009. [Google Scholar]
- May, A.; Parker, C.J.; Taylor, N.; Ross, T. Evaluating a concept design of a crowd-sourced ‘mashup’providing ease-of-access information for people with limited mobility. Transp. Res. Part C Emerg. Technol. 2014, 49, 103–113. [Google Scholar] [CrossRef]
- Rumetshofer, H.; Wöß, W. Tourism information systems promoting barrier-free tourism for people with disabilities. In International Conference on Computers for Handicapped Persons; Springer: Berlin/Heidelberg, Germany, 2004; pp. 280–286. [Google Scholar]
- Drews, W.; Schemer, C. eTourism for all? Online travel planning of disabled people. In Information and Communication Technologies in Tourism 2010; Springer: Vienna, Austria, 2010; pp. 507–518. [Google Scholar]
- Darcy, S. Anxiety to Access: Tourism Patterns and Experiences of New South Wales People with a Physical Disability; Tourism New South Wales: Sydney, NSW, Australia, 1998. [Google Scholar]
- Eichhorn, V.; Buhalis, D. Accessibility—A Key Objective for the Tourism Industry. In Accessible Tourism: Concepts and Issues; Buhalis, D., Darcy, S., Eds.; Channel View Publications: Bristol, UK, 2011; pp. 46–61. [Google Scholar]
- Jażdżewska, I.; Jagnuszewska, A. Tourism-themed internet portals—Are new media creating a new tourist? A case study of Polish students. In Bulletin of Geography. Socio-Economic Series; Rogatka, K., Szymańska, D., Eds.; Nicolaus Copernicus University: Toruń, Poland, 2017; pp. 35–44. [Google Scholar]
- Luna-Nevarez, C.; Hyman, M.R. Common practices in destination website design. J. Destin. Mark. Manag. 2012, 1, 94–106. [Google Scholar] [CrossRef]
- Law, R.; Qi, S.; Buhalis, D. Progress in tourism management: A review of website evaluation in tourism research. Tour. Manag. 2010, 31, 297–313. [Google Scholar] [CrossRef]
- Ip, C.; Law, R.; Lee, H.A. A review of website evaluation studies in the tourism and hospitality fields from 1996 to 2009. Int. J. Tour. Res. 2011, 13, 234–265. [Google Scholar] [CrossRef]
- Westerheim, H.; Haugset, B.; Natvig, M. Developing a unified set of information covering accessibility at public transport terminals. IET Intell. Transp. Syst. 2007, 1, 75–80. [Google Scholar] [CrossRef]
- Rebernik, N.; Szajczyk, M.; Bahillo, A.; Goličnik Marušić, B. Measuring Disability Inclusion Performance in Cities Using Disability Inclusion Evaluation Tool (DIETool). Sustainability 2020, 12, 1378. [Google Scholar] [CrossRef]
- Science Direct. Available online: http://www.sciencedirect.com (accessed on 10 June 2019).
- Google Scholar. Available online: http://scholar.google.com (accessed on 10 June 2019).
- Król, K.; Zdonek, D. Aggregated Indices in Website Quality Assessment. Future Internet 2020, 12, 72. [Google Scholar] [CrossRef]
- Hernández, B.; Jiménez, J.; Martín, M.J. Key website factors in e-business strategy. Int. J. Inf. Manag. 2009, 29, 362–371. [Google Scholar] [CrossRef]
- Kopackova, H.; Michalek, K.; Cejna, K. Accessibility and findability of local e-government websites in the Czech Republic. Univers. Access Inf. Soc. 2010, 9, 51–61. [Google Scholar] [CrossRef]
- Jacob, E.K.; Loehrlein, A. Information architecture. Annu. Rev. Inf. Sci. Technol. 2009, 43, 1–64. [Google Scholar] [CrossRef]
- Morville, P. Ambient Findability: What We Find Changes Who We Become; O’Reilly: Sebastopol, CA, USA, 2005. [Google Scholar]
- Botez, N. English Language-an Essential Tool for Easily Accessing Knowledge and Better Integrating within a Rapid Changing Labour Market in the Present Day Romanian Socio-Economic and Cultural Context. Econ. Transdiscipl. Cogn. 2015, 18, 101. [Google Scholar]
- Mbaya, M. The spread of the English language in the French-speaking countries of Africa: The case of Senegal. J. Humanit. 2001, 15, 61–76. [Google Scholar] [CrossRef]
- Huizingh, E.K. The content and design of web sites: An empirical study. Inf. Manag. 2000, 37, 123–134. [Google Scholar] [CrossRef]
- Kim, H.; Fesenmaier, D.R. Persuasive design of destination web sites: An analysis of first impression. J. Travel Res. 2008, 47, 3–13. [Google Scholar] [CrossRef]
- De Marsico, M.; Levialdi, S. Evaluating web sites: Exploiting user’s expectations. Int. J. Hum. Comput. Stud. 2004, 60, 381–416. [Google Scholar] [CrossRef]
- Pühretmair, F. It’s time to make eTourism accessible. In International Conference on Computers for Handicapped Persons; Springer: Berlin/Heidelberg, Germany, 2004; pp. 272–279. [Google Scholar]
- Zajadacz, A. Evolution of models of disability as a basis for further policy changes in accessible tourism. J. Tour. Futures 2015, 1, 189–202. [Google Scholar] [CrossRef]
- Akgül, Y.; Vatansever, K. Web accessibility evaluation of government websites for people with disabilities in Turkey. J. Adv. Manag. Sci. 2016, 4, 201–210. [Google Scholar] [CrossRef]
- Buzzi, M.; Rossi, R.; Sbrana, S. Web Access for All: Standards, Tools, Legislation. In Proceedings of the IADIS International Conference on e-Society, Avila, Spain, 10–13 March, 2011; pp. 539–542. [Google Scholar]
- Shi, Y. The accessibility of Queensland visitor information centres’ websites. Tour. Manag. 2011, 27, 829–841. [Google Scholar] [CrossRef]
- Federici, S.; Micangeli, A.; Ruspantini, I.; Borgianni, S.; Corradi, F.; Pasqualotto, E.; Olivetti Belardinelli, M. Checking an integrated model of web accessibility and usability evaluation for disabled people. Disabil. Rehabil. 2005, 27, 781–790. [Google Scholar] [CrossRef]
- Jaeger, P.T. Assessing Section 508 compliance on federal e-government Web sites: A multi-method, user-centered evaluation of accessibility for persons with disabilities. Gov. Inf. Q. 2006, 23, 169–190. [Google Scholar] [CrossRef]
- Khalil, Y.F. A probabilistic visual-flowcharting-based model for consequence assessment of fire and explosion events involving leaks of flammable gases. J. Loss Prev. Process Ind. 2017, 50, 190–204. [Google Scholar] [CrossRef]
- Union Internationale des Transports Publics. World Metro Figures 2018—Statistic Brief; International Association of Public Transport: Brussels, Belgium, 2018. [Google Scholar]
- Schwandl, R. urbanrail.net. Available online: http://urbanrail.net/ (accessed on 4 August 2019).
- Metrobits. World Metro Database. Available online: http://www.mic-ro.com/metro/table.html (accessed on 4 August 2019).
- Google. Available online: www.google.com (accessed on 10 November 2019).
- Baidu. Available online: www.baidu.com (accessed on 10 November 2019).
- Bing. Available online: www.bing.com (accessed on 10 November 2019).
- Li, X.; Love, P.E. State-of-the-Art Review of Urban Rail Transit Public–Private Partnerships. J. Infrastruct. Syst. 2020, 26, 03120002. [Google Scholar] [CrossRef]
- Google Translator. Available online: www.translate.google.com (accessed on 10 November 2019).
- Washington, S.; Karlaftis, M.G.; Mannering, F.; Anastasopoulos, P. Statistical and Econometric Methods for Transportation Data Analysis; CRC press LLC: Boca Raton, FL, USA, 2003. [Google Scholar]
- United Nations. Methodology: Standard Country or Area Codes for Statistical Use (M49). Available online: https://unstats.un.org/unsd/methodology/m49/ (accessed on 25 March 2020).
- United Nations. The World Economic Situation and Prospects (WESP): Country Classification. 2014. Available online: https://www.un.org/en/development/desa/policy/wesp/wesp_current/2014wesp_country_classification.pdf (accessed on 30 October 2020).
- Cavinato, J.L.; Cuckovich, M.L. Transportation and tourism for the disabled: An assessment. Transp. J. 1992, 31, 46–53. [Google Scholar]
- Fernández-Cavia, J.; Rovira, C.; Díaz-Luque, P.; Cavaller, V. Web Quality Index (WQI) for official tourist destination websites. Proposal for an assessment system. Tour. Manag. Perspect. 2014, 9, 5–13. [Google Scholar] [CrossRef]


Publisher’s Note: MDPI stays neutral with regard to jurisdictional claims in published maps and institutional affiliations. |
© 2020 by the authors. Licensee MDPI, Basel, Switzerland. This article is an open access article distributed under the terms and conditions of the Creative Commons Attribution (CC BY) license (http://creativecommons.org/licenses/by/4.0/).