Article

Education in Programming and Mathematical Learning: Functionality of a Programming Language in Educational Processes

Faculty of Education, University Square 3, CP 02071 Albacete, Spain
*
Author to whom correspondence should be addressed.
Sustainability 2020, 12(23), 10129; https://doi.org/10.3390/su122310129
Submission received: 31 October 2020 / Revised: 30 November 2020 / Accepted: 1 December 2020 / Published: 4 December 2020
(This article belongs to the Special Issue ICT and Sustainable Education)

Abstract

:
(1) Background: It is becoming more common to incorporate education in programming into educational environments. (2) Methods: In order to show the benefits of including teaching programming, we present an investigation carried out with a group of Spanish schoolchildren in the fifth year of primary education (ages 10–11). We demonstrate an integrated experience in the ordinary curriculum connecting technology to mathematics education. We created a work project for students to use Scratch and to assess its benefits, created two groups of students, an experimental and a control group, with a sample of 3795 individuals. They were administered the online version of the Battery of Mathematical Competence Evaluation (BECOMA On) at two timepoints, the pretest (the beginning of the project) and the post-test (the final stage). (3) Results: The results showed statistically significant differences between groups and timepoints, with the experimental group scoring higher, demonstrating the effectiveness of the education in programming program for mathematics. (4) Conclusions: Education systems face a challenge in the sphere of the consolidation of technologies in education with the consequent need to change didactic designs to enhance quality, equitable, sustainable education processes.

1. Introduction

Information and Communication Technologies (ICT) offer an enormous breadth of important new pedagogical tools. These tools turn out to be remarkably appealing to students, increasing their motivation in the learning process [1]. In this study, out of the wide range of technological resources applicable to schools, we focus on teaching programming. The essential core of computer education is the incorporation of programming into school contexts, rather than ICT, which is more focused on useful skills for the knowledge society. Various reports influence this conceptual differentiation [2,3]. Computer Science Education (CSE) is a research field with decades of research about teaching programming [4,5].
The inclusion of education in programming in the classroom is a reality in educational processes today [6,7]. Traditionally, the integration of Information and Communication Technologies has been focused on activities in support of learning curriculum subjects throughout the different educational levels, but education in programming requires going further. It involves the inclusion of programming under essential principles such as problem-solving and creativity [8].
Current and future schoolchildren should be considered technology consumers and creators. Furthermore, in terms of lifelong learning, the European Commission considers education in programming as a fundamental skill to be integrated into schools throughout the 21st century [9], considering its instrumental and transversal nature in the acquisition of other skills [10,11]. Teacher training, together with the early integration of learning these skills, is especially important in achieving this [12,13,14,15,16,17]. There are multiple occurrences of integration of programming into schools [10,18,19,20,21,22,23], including the work of mathematical content through programming [24,25,26,27,28,29].
One of the foundations of this integration of education in programming in schools may be the development of the Sustainable Development Goals (SDGs); the search for practical and innovative solutions to certain situations and problems could justify such a relationship. The SDGs are part of a 15-year action plan adopted by all United Nations member states in 2015 as part of the 2030 Agenda for Sustainable Development, which seeks to increase prosperity, promote peace, and eradicate global poverty before 2030. Through 17 SDG and 169 targets, it is an attempt to make human rights a reality for all [30]. The research presented below is particularly related to three goals: Goal 4—Quality Education, Goal 5—Gender Equality, and Goal 12—Sustainable Consumption and Production.
The first of those goals, Quality Education, seeks the achievement of inclusive, equitable, and quality education that promotes learning opportunities throughout life for all. Its targets include the development of the necessary skills (technical and professional competencies) in the population to access the labor market and stimulate entrepreneurship. To achieve this goal, the use of technology in educational processes is a key issue in all stages of the educational system [31,32]. There is a need to adjust educational practices to the innovations and transformations that have resulted from the integration of emerging technologies in schools. This generates progress and change and makes it essential to be able to adapt the teaching and learning processes. Innovation generates quality in education, and technology is an ideal instrument for establishing a connection between them.
The second SDG, Gender Equality, is a fundamental right to put an end to any type of discrimination between men and women. One of the targets proposed for this goal is to ensure the effective participation of women in all contexts, facilitating their leadership, decision-making, and empowerment at all levels. Despite this, there are still some problems regarding full parity [33,34,35]; a clear example being the existing inequality in scientific disciplines between men and women in different domains, as indicated by various studies [36,37,38,39,40], including mathematics [41,42,43,44,45,46].
Finally, the third goal, Sustainable Consumption and Production, highlights the need to increase the efficiency of resources and promote healthier and more responsible lifestyles. Among the targets for this goal, one thing that stands out is the importance of supporting countries in strengthening their scientific and technological capacities, in order to promote more sustainable consumption and production habits. It is necessary to combat the idea that technological consumption only causes harm to the environment [47,48]. As an example, in this study, we applied an assessment instrument electronically to a large sample of students instead of using a pencil and paper format, with consequent energy savings in courier transportation and paper consumption.
Therefore, this study establishes a connection between the three aforementioned SDGs. The application of this educational experience is aimed at providing students with strategies to solve problems and communicate ideas through the computer and the work of a programming language applied to mathematics, under the title of the project “Learn mathematics (and other things) with the new Scratch 3”. The main contribution of this article is to offer a contribution to mathematics learning, in this case, through education in programming. The study objective was to compare the results in an online version of the Battery of Mathematical Competence Evaluation (BECOMA On) between two groups of students, a control and an experimental group, at two different timepoints, pretest and post-test. Between the two timepoints, the students carried out a project with the Scratch 3 programming language; this made it possible to measure the impact of that project. In short, the study aimed to assess students’ mathematics progress via education in programming. In addition, this method of evaluation via ICT allowed a thorough evaluation of a school population, giving information about their competence and potential in mathematics.

2. Materials and Methods

2.1. Participants

This study was part of an initiative from the Spanish Ministry of Education and Vocational Training carried out during the 2018/19 academic year with students in the fifth grade of primary education (10–11 years old) through the National Institute of Educational Technologies and Faculty Training (INTEF), in collaboration with the Spanish autonomous regions and municipalities. The sample comprised 147 Spanish schools, which were selected by each autonomous region and municipality based mainly on the availability of sufficient ICT resources to carry out the study. The sample was balanced between state-funded, privately-funded, and independent (concertado) schools from both urban and rural environments.
The sample was divided into two groups of non-equivalent schoolchildren without random assignment, the experimental group (142 schools) and the control group (5 schools). The experimental group did programming activities with Scratch 3, the control group continued with their usual teaching and learning processes without working on any mathematical programming activities. Both groups participated in a pretest and post-test measurement in order to estimate the impact of the intervention with Scratch. The distribution of the participating sample is shown in Table 1.
As Table 1 shows, the final valid sample that participated in all the phases of the study was large: 2178 schoolchildren from 16 autonomous regions and 2 Spanish municipalities. Nevertheless, there was a loss of subjects throughout the phases mainly due to the fact that some schools had to drop out of the study due to problems with the provision of necessary computer equipment for the planned programming activities.

2.2. Variables and Instruments

The Scratch Maths program [24,25] is a project from University College London created in 2015. It is designed to support mathematical learning through curricular materials adapted to programming for students between 9 and 11 years old, with two essential aspects [13]: the algorithm and the concept of a 360° rotation. This graphical programming environment allows students to create stories, games, and interactive animations by editing scenes and objects, and subsequently to share what they create with other users.
In this experiment, we used the new version, Scratch 3, and its content was adapted to the Spanish perspective and the legislated primary education curriculum, laid out in Royal Decree 126/2014, of February 28, 2014, on the enactment of the basic curriculum for primary education. An example of its practical application can be found in The School of Computational Thinking and Its Impact on Learning: School Year 2018–2019 [49]. Students were given an introduction to the application and taught the main options in the software environment up to the creation of scenarios and objects to produce animations. The students in both the experimental and the control groups received the same hours of mathematics class according to the established curriculum, mainly content from the geometry block. However, in that class time, the experimental group also learned programming with Scratch. None of the participating students had worked with Scratch before.
In addition, to measure mathematical competence at both study timepoints, we used an online version of the Battery of Mathematical Competence Evaluation (BECOMA On). We created an ICT method for evaluating this by adapting the battery to a Google Docs questionnaire, which allowed a thorough evaluation to be carried out on a school population in order to determine their competence and potential for mathematics. This instrument has 30 items with a score of 0, 1, or 2 points, with the total score ranging from 0 to 60 points. The items are divided into content blocks: Arithmetic (14 items), Geometry (5 items), Magnitudes and Proportionality (6 items), and Statistics and Probability (5 items). In terms of statistical validity [45], the test shows a reliability index of 0.83, and validity indices between 0.78 and 0.86 (criterion and construct).

2.3. Process

Before the study proper, the fifth grade primary teachers were given a tutored online training course of about 30 h on Scratch 3, between December 2018 and February 2019. This course addressed computer programming in the teaching and learning processes for the area of mathematics, from conceptualization to implementation and integration. This was to ensure that students would be taught programming as well as mathematical concepts. In addition, the teachers were introduced to the BECOMA On in a training seminar, and they learned about its structure and conceptualization, as well as instructions and recommendations for its application. Those educators that passed this training activity went on to perform the implementation phase in the classroom with the students in the experimental group for 40 h over three months, from March to May 2019. The work with Scratch was divided into three modules: Mosaic Patterns, the Geometry of the Beetle, and Interacting Objects. Each module included practice activities for students to learn how to handle the program, together with the key vocabulary worked on. All of this learning content was given exclusively in schools. The control group was taught via the regular teaching–learning process without using any alternative educational tools for mathematics education, such as Geogebra. Education in programming was only given to the experimental group. Students in both the experimental and control groups took the initial pretest in February 2019, before the Scratch experiment, and the post-test in June 2019 [49].

3. Results

The reliability at both study timepoints was high, with a Cronbach Alpha of 0.81 at the pretest and 0.84 at the post-test. The descriptive statistics for the two timepoints are shown in Table 2.
The scores increased between the two study timepoints, the mean at the pretest being 36.08 (SD = 9.27) and at post-test, 38.79 (SD = 9.59). We conducted an analysis of covariance (ANCOVA) in order to examine the impact of the mathematics programming project and determine any statistically significant differences at the post-test between the experimental group and the control group. We found statistically significant differences, with an F value = 17.76 and a significance p < 0.001. The effect size of the intervention project for both groups and both study timepoints was 0.45, reflecting a medium or moderate effect [50]. This showed that the intervention project had a significant impact on the mathematical competence of the students in the experimental group, in contrast to the children in the control group.
In order to look more deeply into those differences, to examine which items had the greater impact on the differences in the results between the study timepoints, we performed t-tests for a comparison of means for each timepoint, assessing the items that make up the BECOMA On and the total score. The results at the pretest are shown in Table 3.
Table 3 shows that there were significant differences between the two groups in various items at the pretest. The experimental group scored higher in Items 25 (p < 0.05) and 27 (p < 0.05), the control group scored higher in in items 7 (p < 0.01), 8 (p < 0.01), 9 (p < 0.05), 10 (p < 0.01), 11 (p < 0.001), and 21 (p < 0.01). In all these items with statistically significant differences, the effect size indices ranged between 0.16 and 0.32.
The post-test results are shown in Table 4.
In the post-test, we found the opposite pattern to the pretest, with the experimental group scoring higher with statistically significant differences in more items; in this case, Items 14 (p < 0.01), 21 (p < 0.05), 27 (p < 0.01), 29 (p < 0.001), and 30 (p < 0.01). For the control group, the statistically significant difference continued in Item 8 (p < 0.01). In terms of the total score in the instrument, the experimental group had a higher mean score (38.65; SD = 9.66), than the control group (36.84; SD = 9.53), although the difference was not statistically significant (p = 0.070). The effect size at the post-test of the items with statistically significant differences ranged between 0.23 and 0.44, significantly higher than the values at the pretest, demonstrating the effectiveness of the education in programming program with the students in the experimental group. Table 5 shows the difference in the mean scores between the two groups for the two study timepoints.
The differences between the group means at the two study timepoints were greater for the experimental group than for the control group, the total difference between the pretest and post-test for the experimental group was 3.85, and for the control group, 1.46. It is striking that there were no negative scores in the experimental group; in other words, there was no lower score in any of the instrument items at the post-test compared to the pretest, something that did occur in the control group in 8 out of the 30 items in the instrument. The items that stood out as having the greatest differences between the pre- and post-test in the experimental group were Items 10 (difference of 0.25), 11 (difference of 0.24), 12 (difference of 0.23), 29 (difference of 0.24), and 30 (difference of 0.21). In the control group, the items with the greatest differences were Items 12 (difference of 0.23) and 15 (difference of 0.19), in terms of positive differences, and 20 (difference of −0.15) and 21 (difference of −0.23), in terms of negative differences.
The differences we found in effect sizes between the two groups at the two study timepoints are shown in Table 6.
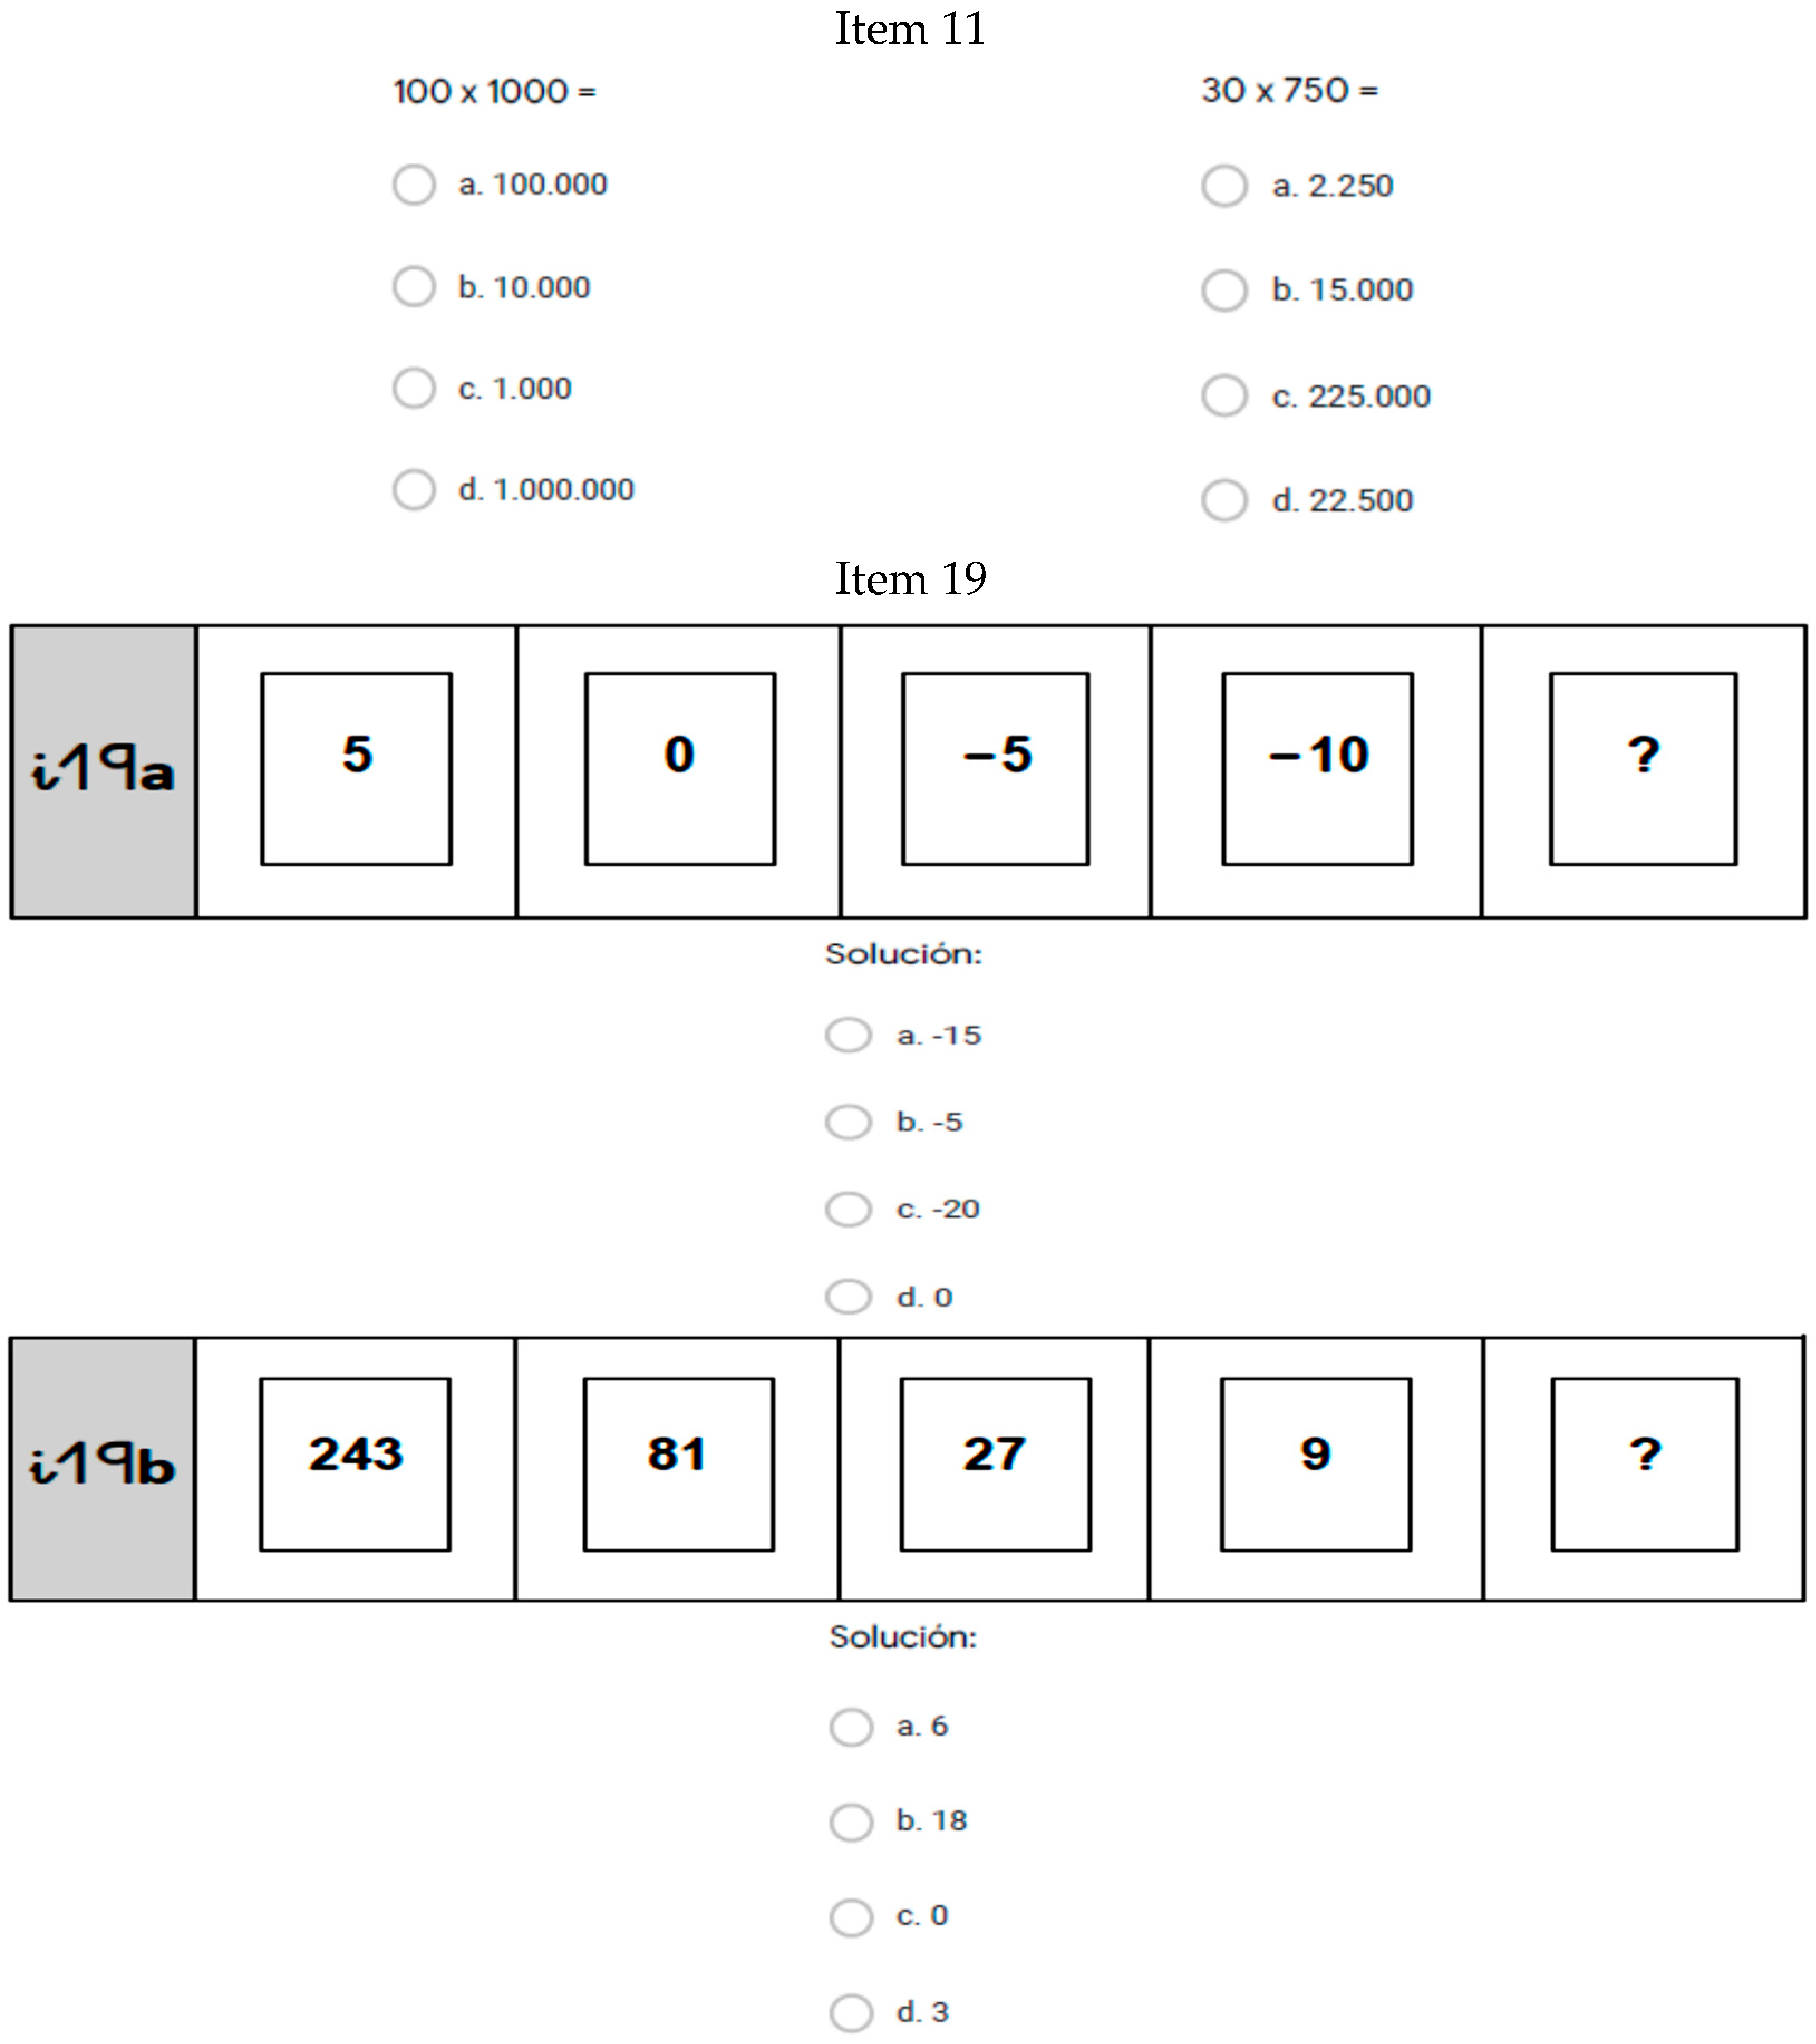
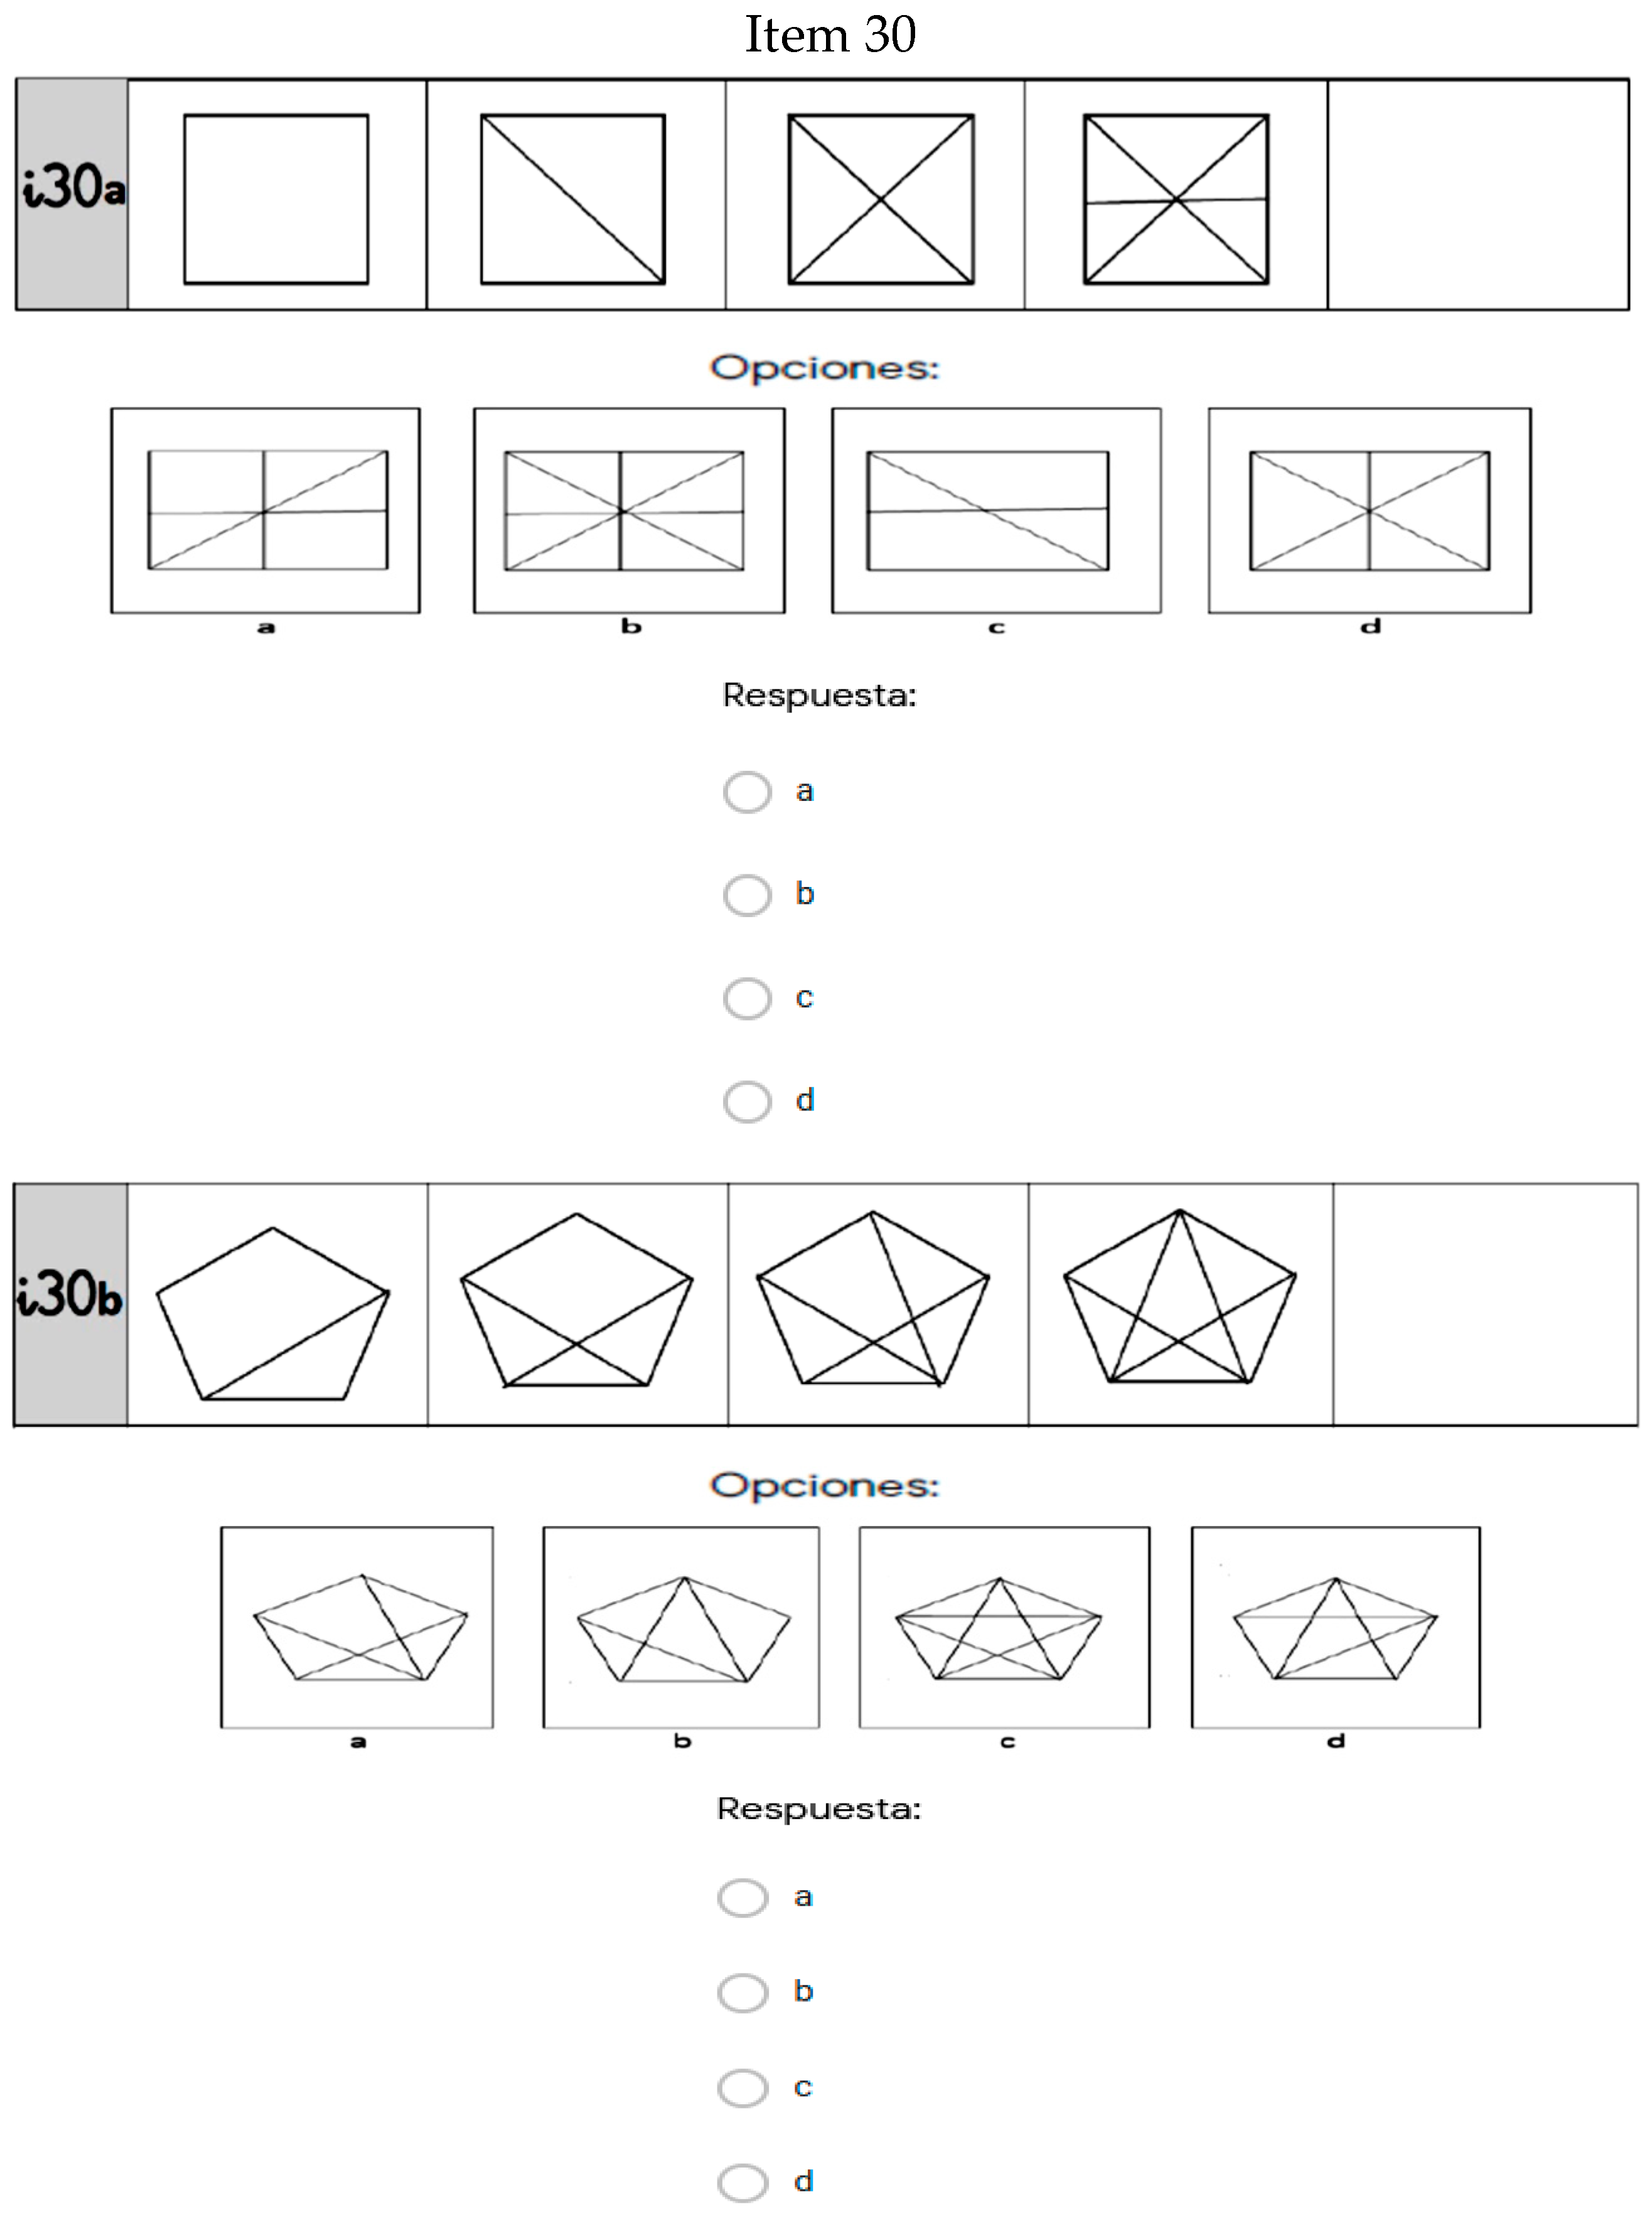
The total effect size of the study was higher in the experimental group (0.40) compared to the control group (0.15), with the difference between the effect size of the two groups being 0.25. The largest effect sizes for the differences between the pre- and post-test in the experimental group were in Items 10 (0.32), 11 (0.28), 12 (0.28), 29 (0.32), and 30 (0.27). In the control group, the largest effect sizes were in items 5 (0.26), 12 (0.30), 15 (0.25), and 21 (0.26). The items with the greatest differences in effect sizes between the two groups were Items 11 (0.25), 19 (0.19), and 30 (0.23), with the experimental group having higher values. It is worth mentioning that in 21 of the 30 items, the higher values for effect size were in the experimental group.
In summary, on comparing the means and effect sizes for the two timepoints, we found that Items 11, 19, and 30 demonstrated the largest differences between the experimental and control groups after the project (Items 11 and 19 were about arithmetic content, Item 30 was about geometry). The items are shown in Figure 1.
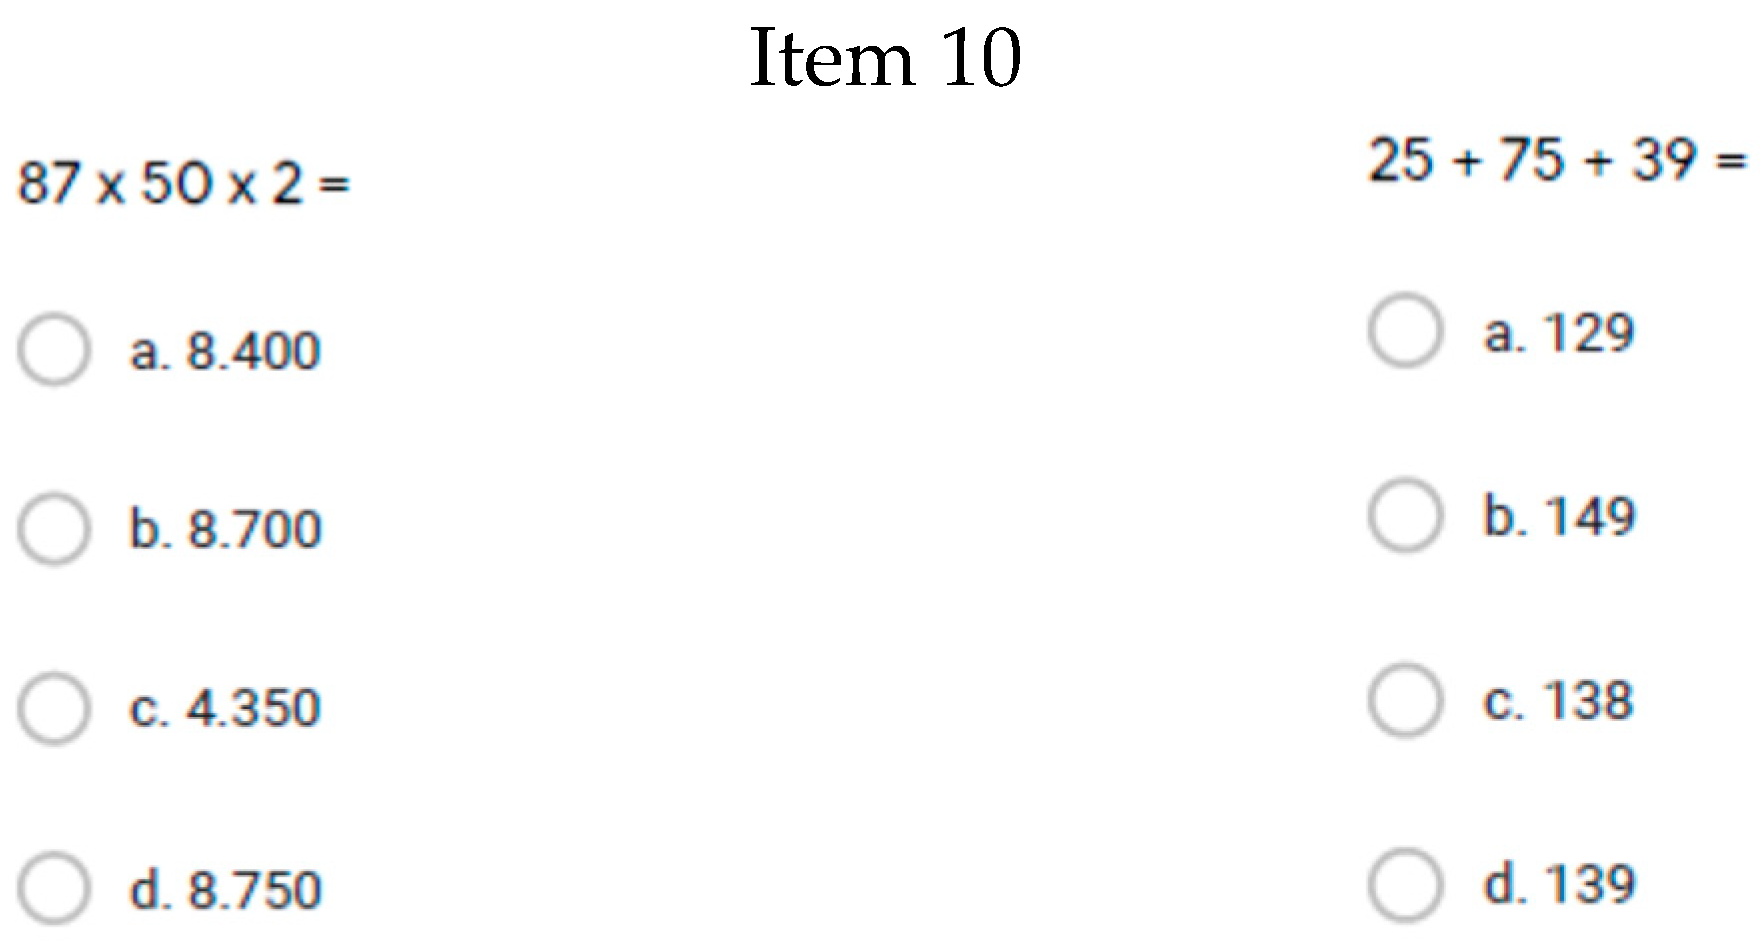
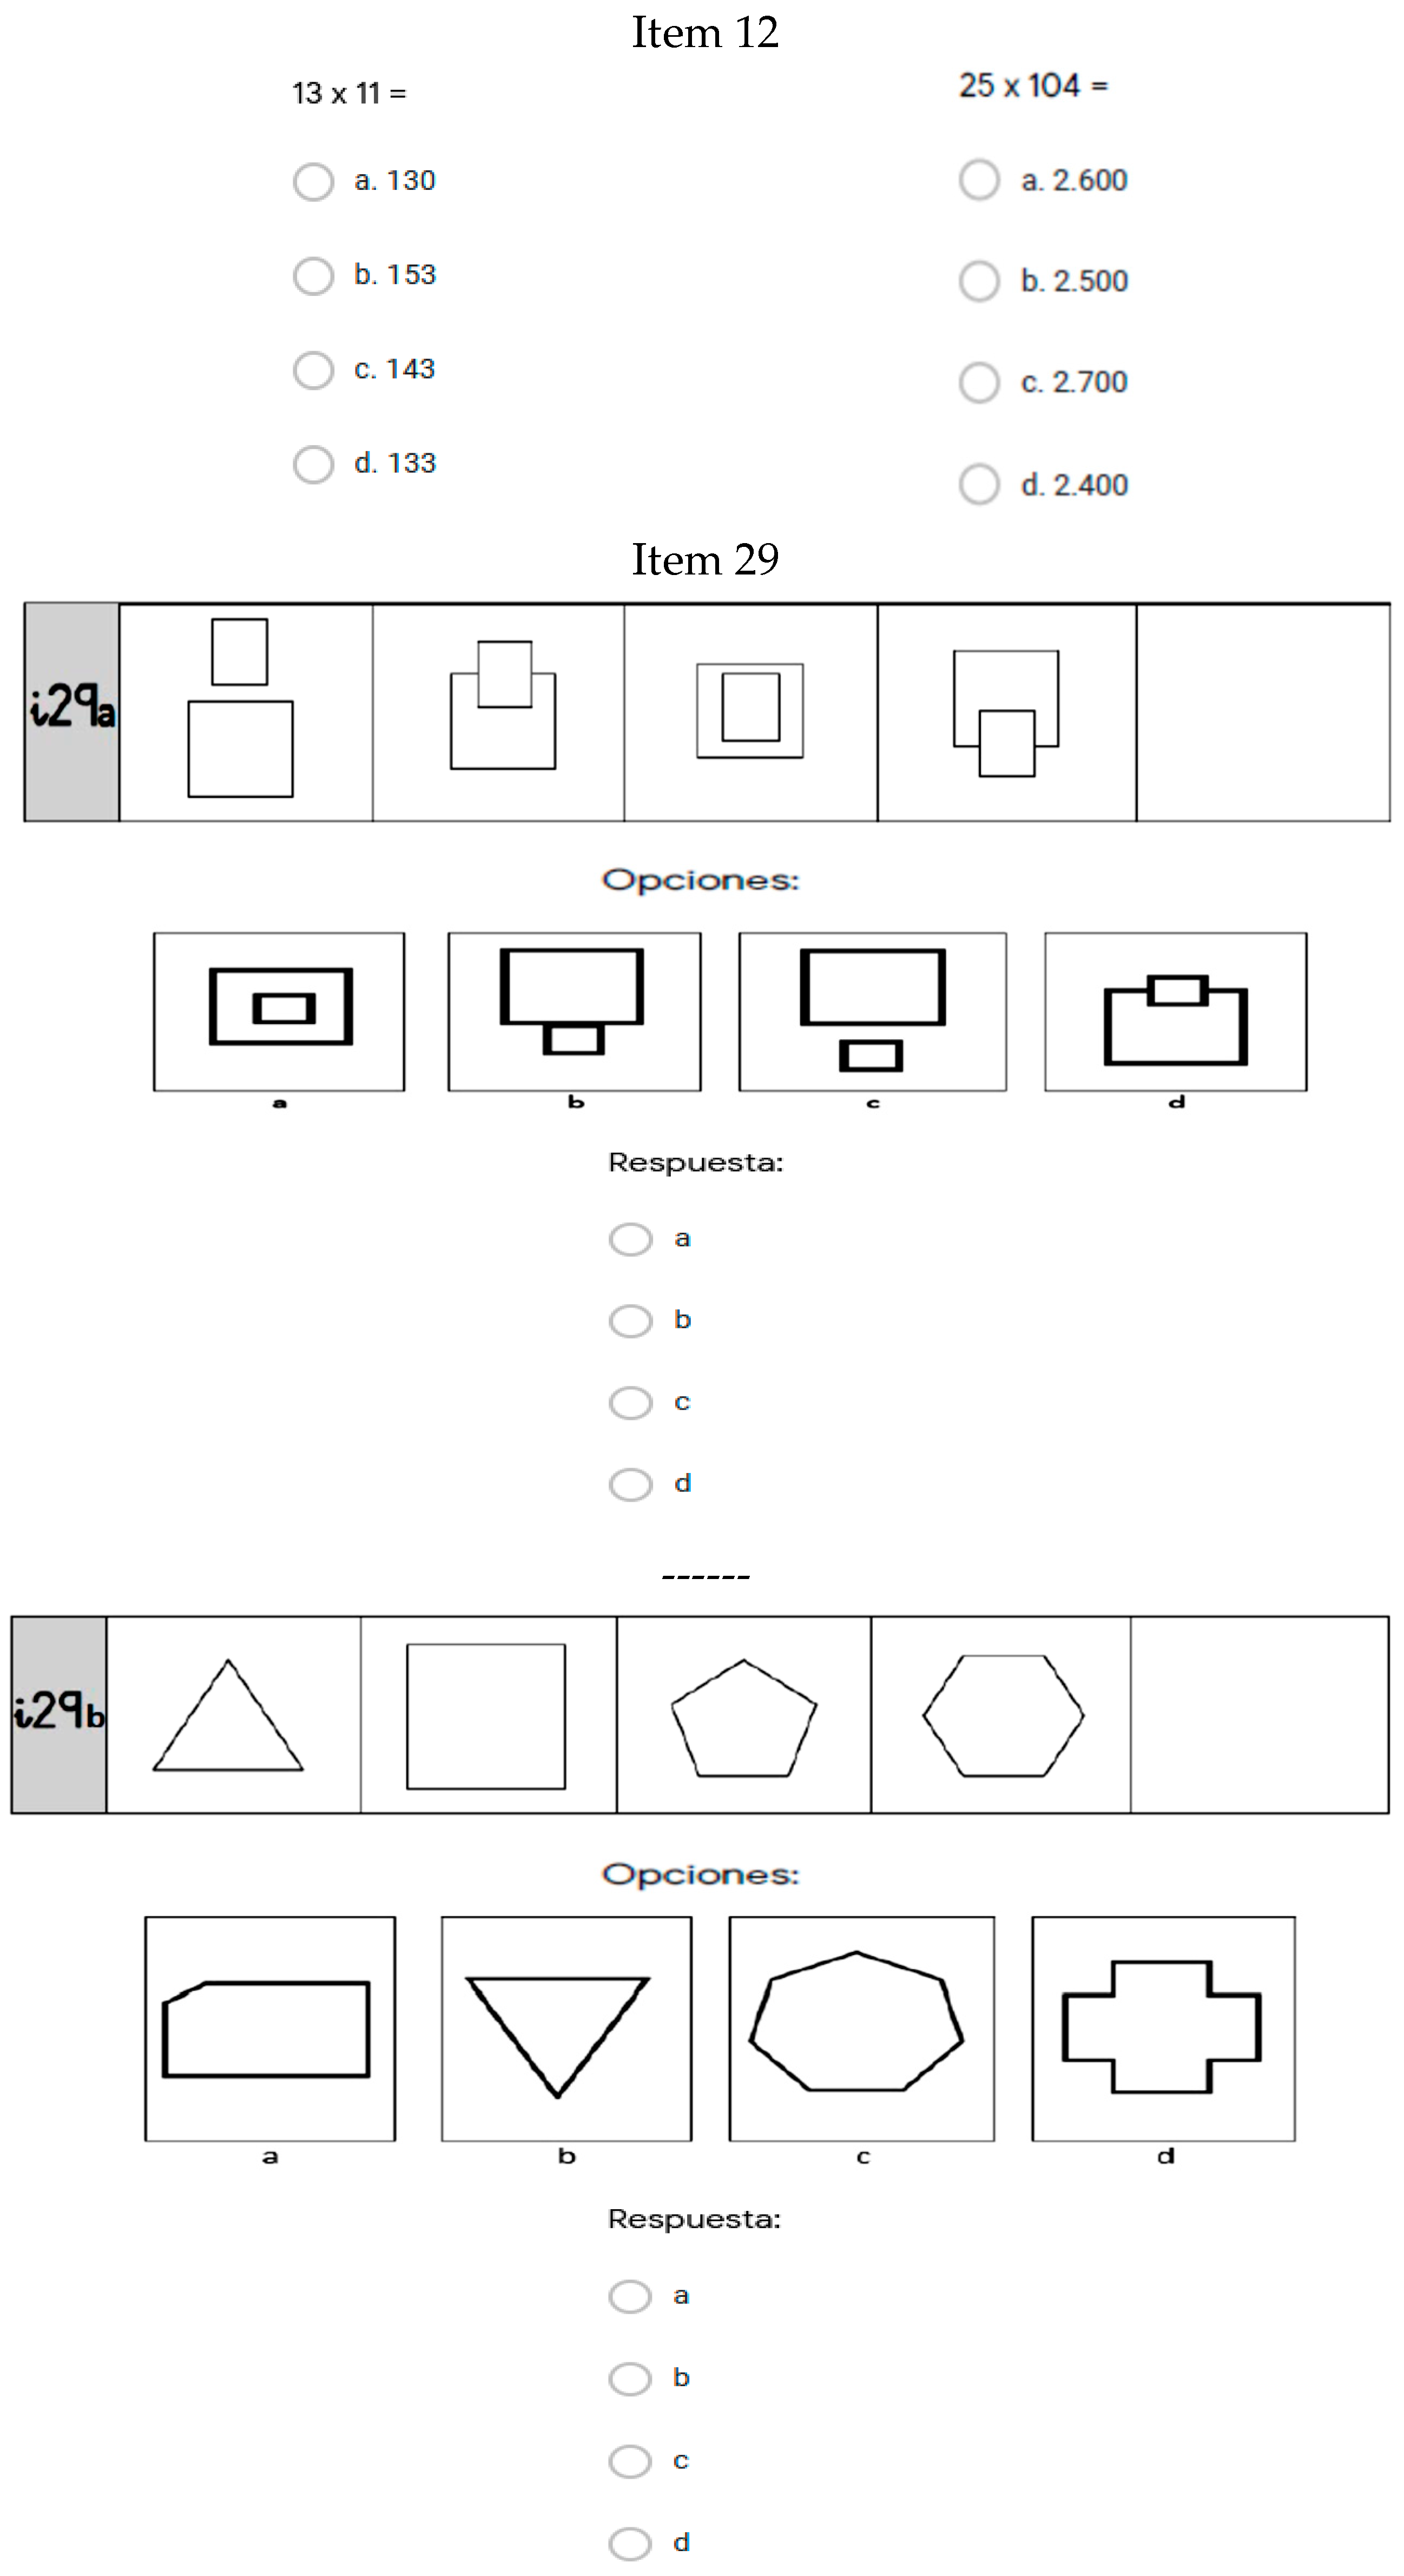
It is also worth noting Items 10, 11, 12, 29, and 30, (two about arithmetic content, and three about geometry), as they were the items with the largest differences between the pre- and post-test in the experimental group. The items are shown in Figure 2, with the exception of 11 and 30 (which appear in Figure 1):
Finally, in accordance with the SDGs, in this case, Goal 5—Gender Equality, the results based on the sex of the participants at each timepoint are shown in Table 7 and Table 8.
Both boys and girls in the experimental group had higher scores. The difference in mean scores between the pre- and post-test was 4.13 for the boys and 3.58 for the girls. In the control group, the difference in mean scores between the pre-and post-test was 1.44 for the boys and 1.76 for the girls. Thus, following the program (the experimental group), both boys and girls had higher scores, something that we did not see to the same extent in the control group.

4. Discussion

Globalization is producing rapid and frequent exchanges of ideas and innovation, which changes how people assimilate society’s cultural patterns. The roadmap set out by the Sustainable Development Goals is an ideal framework for maintaining global balance at the social and environmental level, and therefore, also at the educational level. In schools, students have to learn knowledge that is continually changing; learning evolves gradually, with the need to integrate more collaborative and participatory methodologies that demand greater commitment and involvement in tasks from students [51]. We find ourselves within a networked society that has brought about changes in the social and relational structures of the population. Coming generations will be digital natives, and artificial intelligence—machine learning—will be increasingly incorporated into the teaching and learning process. Technology offers a wide variety of opportunities for more visual and intuitive learning [52]. Teaching design should include learning how to use these resources and methodologies, which includes education in programming being incorporated into all areas of learning in an interdisciplinary manner [53,54].
This study aimed to assess whether there is empirical evidence justifying the integration of education in programming into schools. To do this, we implemented a project in mathematics using Scratch and assessed its effects via a pre- and post-test with an experimental group and a control group, using a test battery to assess mathematical competence. Education in programming needs to be integrated into schools [55,56], and the schools’ current situations need to be assessed to facilitate their decisions about whether to include it [57,58]. It is essential to generalize research in order to assess whether it works and what its effects are; there are examples pursuing this goal [59,60], a goal that is shared by our study.
Our results show that the fifth grade primary education students who participated in the project and who worked on mathematical competence through computer programming activities developed their mathematics skills more than the students who were taught mathematics via other activities and the usual resources for this area. These differences were more apparent in specific items than in the global differences between the two groups at the pretest (p = 0.454) and at the post-test (p = 0.070). Mean scores increased between the pretest and the post-test, with a p < 0.001 and an effect size of 0.45. The difference between the pretest and the post-test was larger in the experimental group (3.85) than in the control group (1.46), as was the effect size (0.40 for the experimental group, 0.15 for the control group). The items that exhibited differences between the two groups, with the experimental group scoring higher, were in arithmetic and geometry content. In terms of sex, boys and girls in the experimental group had better results than the control group at the post-test compared with the pretest.
The inclusion of new didactic methodologies in the teaching/learning process promotes educational innovation and encourages students to take on active roles. This represents a greater cognitive load for the students but, in the case of the present study, their interest and motivation towards learning in the area of mathematics was not affected. This was analyzed by asking the students at both stages of the study to rate (on a scale from 0 to 10) their interest in and motivation towards mathematics. The results showed little difference between the study timepoints: in the pretest, we found a mean value of 7.71 (SD = 2.37) for the experimental group and 7.90 (SD = 2.63) for the control group. At the post-test, the results were 7.75 (SD = 2.37) for the experimental group and 7.97 (SD = 2.20) for the control group. The reliability of the results between timepoints was high, with values above 0.80. Therefore, the learning of mathematics and technology appear closely related, something that other studies have noted and analyzed [61,62].
One limitation of this study that is worth highlighting is the small size of the control group, something to be considered in subsequent studies. Replicating this study with a similar size experimental group while expanding the control group is the main line for the development of future research. We will attempt to maintain the homogeneity of the characteristics and circumstances of this current study as much as possible. There is also the possibility of establishing relationships between the results according to variables such as gender or academic performance in mathematics.
Ultimately, education systems will not be able to remain outside of the technology revolution in educational practices [63]. This will need initial and continuous training for teachers [64], with a goal to transmit to students, as facilitators and mediators, the importance of technology in applying, analyzing, evaluating, and creating knowledge [65]. Putting the concepts of lifelong learning and continual learning into practice becomes important, knowledge becomes obsolete, and technology helps us move forward.

Author Contributions

R.G.-P. designed the study, collected and analyzed the data, and wrote the manuscript. A.P.-R. contributed to the interpretation of the data and wrote, revised, and refined the manuscript. R.G.-P. and A.P.-R. participated in sending the article to the journal. Both authors contributed to the article and approved the submitted version. All authors have read and agreed to the published version of the manuscript.

Funding

This study was supported by the National Institute of Educational Technologies and Faculty Training (INTEF), the National University of Distance Education (UNED), and the University of Castilla–La Mancha (UCLM).

Acknowledgments

The authors wish to highlight the enormous gratitude towards the collaborating educational institutions mentioned above.

Conflicts of Interest

The authors declare no conflict of interest.

References

  1. Elstad, E.; Christophersen, K.A. Perceptions of Digital Competency among Student Teachers: Contributing to the Development of Student Teachers’ Instructional Self-Efficacy in Technology-Rich Classrooms. Educ. Sci. 2017, 7, 1–15. [Google Scholar] [CrossRef]
  2. Caspersen, M.E.; Gal-Ezer, J.; McGettrick, A.; Nardelli, E. Informatics for All the strategy. In Technical Report; Association for Computing Machinery: New York, NY, USA, 2018. [Google Scholar] [CrossRef]
  3. Velázquez, J.A. Informe del Grupo de Trabajo SCIE/CODDII Sobre la Enseñanza Preuniversitaria de la Informática; Sociedad Científica Informática de España (SCIE): Madrid, España, 2018. [Google Scholar]
  4. Sackman, H. Man-Computer Problem Solving: Experimental Evaluation of Time-Sharing and Batch Processing; Auerbach: Princeton, NJ, USA, 1970. [Google Scholar]
  5. Weinberg, G.M. The Psychology of Computer Programming; Van Nostrand Reinhold: New York, NY, USA, 1971. [Google Scholar]
  6. Berge, O. Rethinking Digital Literacy in Nordic School Curricula. Nord. J. Digit. Lit. 2017, 12, 5–7. [Google Scholar] [CrossRef] [Green Version]
  7. Bocconi, S.; Chioccariello, A.; Earp, J. The Nordic Approach to Introducing Computational Thinking and Programming in Compulsory Education; Report prepared for the Nordic@BETT2018 Steering Group: Roma, Italy, 2018. [Google Scholar] [CrossRef]
  8. Passey, D. Computer science (CS) in the compulsory education curriculum: Implications for future research. Educ. Inf. Technol. 2016, 22, 421–443. [Google Scholar] [CrossRef] [Green Version]
  9. European Commission. Comunicación de la Comisión al Parlamento Europeo, al Consejo, al Comité Económico y Social Europeo y al Comité de las Regiones Sobre el Plan de Acción de Educación Digital; European Commission: Bruselas, Belgium, 2018. [Google Scholar]
  10. Bocconi, S.; Chioccariello, A.; Dettori, G.; Ferrari, A.; Engelhardt, K. Developing Computational Thinking in Compulsory Education—Implications for Policy and Practice; European Commission, Joint Research Centre: Sevilla, Spain, 2016. [Google Scholar] [CrossRef]
  11. Rodríguez, L.J.; Serrado, A.; Thibaut, E.; Velázquez, J.A.; López, D.; Bahamonde, A. Hacia una Nueva Educación en Matemáticas e Informática en la Educación Secundaria; Real Sociedad Matemática Española (RSME) y Sociedad Científica Informática de España (SCIE): Madrid, España, 2020. [Google Scholar]
  12. Aslan, A.; Zhu, C. Investigating variables predicting Turkish pre-service teachers’ integration of ICT into teaching practices. Br. J. Educ. Technol. 2017, 48, 552–570. [Google Scholar] [CrossRef]
  13. Falcó, J.M. Evaluación de la competencia digital docente en la comunidad autónoma de Aragón. Rev. Electrónica Investig. Educ. 2017, 19, 73–83. [Google Scholar] [CrossRef] [Green Version]
  14. Gudmundsdottir, G.B.; Hatlevik, O.E. Newly qualified teachers’ professional digital competence: Implications for teacher education. Eur. J. Teach. Educ. 2018, 41, 214–231. [Google Scholar] [CrossRef] [Green Version]
  15. Instefjord, E.J.; Munthe, E. Educating digitally competent teachers: A study of integration of professional digital competence in teacher education. Teach. Teach. Educ. 2017, 67, 37–45. [Google Scholar] [CrossRef]
  16. Kelentrić, M.; Helland, K.; Arstorp, A.T. Professional Digital Competence Framework for Teachers; Norwegian Centre for ICT in Education: Oslo, Norway, 2017. [Google Scholar]
  17. Sentance, S.; Csizmadia, A. Computing in the curriculum: Challenges and strategies from a teacher’s perspective. Educ. Inf. Technol. 2016, 22, 469–495. [Google Scholar] [CrossRef] [Green Version]
  18. Clements, D.H. The Future of Educational Computing Research: The Case of Computer Programming. Inf. Technol. Child. Educ. Annu. 1999, 1, 147–179. [Google Scholar]
  19. Israel, M.; Pearson, J.N.; Tapia, T.; Wherfel, Q.M.; Reese, G. Supporting all learners in school-wide computational thinking: A cross-case qualitative analysis. Comput. Educ. 2015, 82, 263–279. [Google Scholar] [CrossRef]
  20. Lye, S.Y.; Koh, J.H.L. Review on teaching and learning of computational thinking through programming: What is next for K-12? Comput. Hum. Behav. 2014, 41, 51–61. [Google Scholar] [CrossRef]
  21. Voogt, J.; Fisser, P.; Good, J.; Mishra, P.; Yadav, A. Computational thinking in compulsory education: Towards an agenda for research and practice. Educ. Inf. Technol. 2015, 20, 715–728. [Google Scholar] [CrossRef] [Green Version]
  22. Wing, J.M. Computational thinking’s influence on research and education for all. Ital. J. Educ. Technol. 2017, 25, 7–14. [Google Scholar] [CrossRef]
  23. Armoni, M. Computing in schools—Computer science, computational thinking, programming, coding: The anomalies of transitivity in K-12 computer science education. ACM Inroads 2016, 7, 24–27. [Google Scholar] [CrossRef]
  24. Benton, L.; Hoyles, C.; Kalas, I.; Noss, R. Building Mathematical Knowledge with Programming: Insights from the ScratchMaths Project. In Constructionism in Action 2016: Conference Proceedings; Suksapattana Foundation: Bangkok, Thailand, 2016; pp. 26–33. [Google Scholar]
  25. Benton, L.; Hoyles, C.; Kalas, I.; Noss, R. Bridging Primary Programming and Mathematics: Some Findings of Design Research in England. Digit. Exp. Math. Educ. 2017, 3, 115–138. [Google Scholar] [CrossRef] [Green Version]
  26. Benton, L.; Saunders, P.; Kalas, I.; Hoyles, C.; Noss, R. Designing for learning mathematics through programming: A case study of pupils engaging with place value. Int. J. Child-Comput. Interact. 2018, 16, 68–76. [Google Scholar] [CrossRef]
  27. McCoy, L.P. Computer-based mathematics learning. J. Res. Comput. Educ. 1996, 28, 438–460. [Google Scholar] [CrossRef]
  28. Miller, R.B.; Kelly, G.N.; Kelly, J.T. Effects of Logo computer programming experience on problem solving and spatial relations ability. Contemp. Educ. Psychol. 1988, 13, 348–357. [Google Scholar] [CrossRef]
  29. Yelland, N. Mindstorms or a storm in a teacup? A review of research with Logo. Int. J. Math. Educ. Sci. Technol. 1995, 26, 853–869. [Google Scholar] [CrossRef]
  30. United Nations. Resolution Adopted by the General Assembly on 25 September 2015: Ransforming Our World: The 2030 Agenda for Sustainable Development; United Nations: New York, NY, USA, 2015. [Google Scholar]
  31. Cano, L.M. Concepciones Docentes, usos de TIC en el Aula y Estilos de Enseñanza; Editorial Universidad Pontificia Bolivariana: Medellín, Colombia, 2020. [Google Scholar] [CrossRef]
  32. Suárez-Álvarez, R.; Vázquez-Barrio, T.; Torrecillas, T. Metodología y formación docente cuestiones claves para la integración de las TIC en la educación. Ámbitos. Rev. Int. Comun. 2020, 49, 197–215. [Google Scholar] [CrossRef]
  33. Calvo, G. Las identidades de género según las y los adolescentes. Percepciones, desigualdades y necesidades educativas. Contextos Educ. Rev. Educ. 2018, 21, 169–184. [Google Scholar] [CrossRef]
  34. Hadjar, A.; Krolak-Schwerdt, S.; Priem, K.; Glock, S. Gender and educational achievement. Educ. Res. 2014, 56, 117–125. [Google Scholar] [CrossRef]
  35. Mizala, A.; Martínez, F.; Martínez, S. Pre-Service Elementary School Teachers’ Expectations About Student Performance: How their Beliefs are Affected by their Mathematics Anxiety and Student’s Gender. Teach. Teach. Educ. 2015, 50, 70–78. [Google Scholar] [CrossRef]
  36. Botella, C.; Rueda, S.; López-Iñesta, E.; Marzal, P. Gender Diversity in STEM Disciplines: A Multiple Factor Problem. Entropy 2019, 21, 1–17. [Google Scholar] [CrossRef] [Green Version]
  37. Cantoral, R.; Reyes-Gasperini, D.; Montiel, G. Socioepistemología, Matemáticas y Realidad. Rev. Latinoam. Etnomatemática 2014, 7, 91–116. [Google Scholar]
  38. Lehman, K.J.; Sax, L.J.; Zimmerman, H.B. Women planning to major in computer science: Who are they and what makes them unique? J. Comput. Sci. Educ. 2017, 26, 277–298. [Google Scholar] [CrossRef]
  39. McCullough, L. Proportions of Women in STEM Leadership in the Academy in the USA. Educ. Sci. 2020, 10, 1–13. [Google Scholar] [CrossRef] [Green Version]
  40. UNESCO. Descifrar el Código: La Educación de las Niñas en Ciencias, Tecnología, Ingeniería y Matemáticas (STEM); UNESCO: Paris, France, 2019. [Google Scholar]
  41. Del Río, M.F.; Strasser, K.; Susperreguy, M.I. ¿Son las habilidades matemáticas un asunto de Género? Los estereotipos de género acerca de las matemáticas en niños y niñas de Kínder, sus familias y educadoras. Calid. Educ. 2016, 45, 20–53. [Google Scholar] [CrossRef] [Green Version]
  42. Farfán, R.M.; Simón, G. Género y matemáticas: Una investigación con niñas y niños talento. Acta Sci. 2017, 19, 427–446. [Google Scholar]
  43. Fuentes, S.; Renobell, V. La influencia del género en el aprendizaje matemático en España. Evidencias desde PISA. Rev. Sociol. Educ. RASE 2019, 13, 63–80. [Google Scholar] [CrossRef]
  44. Ministerio de Educación y Formación Profesional. PISA 2018. Programa para la Evaluación Internacional de los Estudiantes. In Informe Español; Ministerio de Educación y Formación Profesional: Madrid, Spain, 2019. [Google Scholar]
  45. Palomares-Ruiz, A.; García-Perales, R. Math Performance and Sex: The Predictive Capacity of Self-Efficacy, Interest and Motivation for Learning Mathematics. Front. Psychol. 2020, 11, 1–24. [Google Scholar] [CrossRef] [PubMed]
  46. Suberviola, I. Coeducación: Un derecho y un deber del profesorado. Rev. Electrónica Interuniv. Form. Profr. 2012, 15, 59–67. [Google Scholar]
  47. Olcina, M. lmpactos Ambientales de las TIC y Hábitos de Consumo Tecnológico de las Nativas Digitales: Encuestas Electrónicas y Análisis de Grupos Focales. Master’s Thesis, Facultad de Educación, Universidad Nacional de Educación a Distancia, Madrid, España, 2015. [Google Scholar]
  48. Tucho, F.; Vicente-Mariño, M.; García De Madariaga, J.M. La cara oculta de la sociedad de la información: El impacto medioambiental de la producción, el consumo y los residuos tecnológicos. Chasqui 2018, 136, 43–59. [Google Scholar]
  49. Ministerio de Educación y Formación Profesional e Instituto Nacional de Tecnologías Educativas y de Formación del Profesorado. La Escuela del Pensamiento Computacional y su Impacto en el Aprendizaje: Curso Escolar 2018–2019; Ministerio de Educación y Formación Profesional e Instituto Nacional de Tecnologías Educativas y de Formación del Profesorado (INTEF), Área de Experimentación en el Aula: Madrid, España, 2019.
  50. Cohen, J. Statistical Power Analysis for the Behavioral Sciences, 2nd ed.; Erlbaum: Hillsdale, MI, USA, 1988. [Google Scholar]
  51. Arabit, J.; Prendes, M.P. Metodologías y Tecnologías para enseñar STEM en Educación Primaria: Análisis de necesidades. Píxel-BIT Rev. De Medios Y Educ. 2020, 57, 107–128. [Google Scholar] [CrossRef]
  52. Tapia, C. Tipologías de uso educativo de las Tecnologías de la Información y Comunicación: Una revisión sistemática de la literatura. Edutec. Rev. Electrónica Tecnol. Educ. 2020, 71, 16–34. [Google Scholar] [CrossRef]
  53. Basogain, X.; Olmedo, M.E. Integración de Pensamiento Computacional en Educación Básica. Dos Experiencias Pedagógicas de Aprendizaje Colaborativo online. Rev. Educ. A Distancia (Red) 2020, 20, 1–21. [Google Scholar] [CrossRef] [Green Version]
  54. Chen, G.; Shen, J.; Barth-Cohen, L.; Jiang, S.; Huang, X.; Eltoukhy, M. Assessing elementary students’ computational thinking in everyday reasoning and robotics programming. Comput. Educ. 2017, 109, 162–175. [Google Scholar] [CrossRef] [Green Version]
  55. Grover, S.; Pea, R. Computational Thinking: A competency whose time has come. In Computer Science Education: Perspectives on Teaching and Learning in School; Sentance, S., Barendsen, E., Carsten, S., Eds.; Bloomsbury Academic: London, UK, 2018; pp. 19–38. [Google Scholar]
  56. Heintz, F.; Mannila, L.; Nordén, L.Å.; Parnes, P.; Regnell, B. Introducing Programming and Digital Competence in Swedish K-9 Education. In Informatics in Schools: Focus on Learning Programming; Dagienė, V., Hellas, A., Eds.; Springer International Publishing: Helsinki, Finland, 2017; pp. 117–128. [Google Scholar]
  57. Moreno-León, J.; Robles, G.; Román-González, M. Code to learn: Where does it belong in the K-12 curriculum. J. Inf. Technol. Educ. Res. 2016, 15, 283–303. [Google Scholar] [CrossRef]
  58. Rolandsson, L.; Skogh, I.B. Programming in School: Look Back to Move Forward. ACM Trans. Comput. Educ. 2014, 14, 1–25. [Google Scholar] [CrossRef]
  59. Heintz, F.; Mannila, L. Computational Thinking for All—An Experience Report on Scaling up Teaching Computational Thinking to All Students ina Major City in Sweden. In Proceedings of the ACM Technical Symposium on Computer Science Education (SIGCSE), Baltimore, MD, USA, 21–24 February 2018. [Google Scholar]
  60. Toikkanen, T.; Leinonen, T. The Code ABC MOOC: Experiences from a Coding and Computational Thinking MOOC for Finnish PrimarySchool Teachers. In Emerging Research, Practice, and Policy on Computational Thinking, Educational Communications and Technology: Issues and Innovations; Rich, P.J., Hodges, C.B., Eds.; Springer International Publishing: Helsinki, Finland, 2017; pp. 239–248. [Google Scholar] [CrossRef]
  61. Aldon, G.; Hitt, F.; Bazzini, L.; Gellert, U. Mathematics and Technology; Springer International Publishing: Cham, Switzerland, 2017. [Google Scholar] [CrossRef]
  62. García-Perales, R.; Almeida, L.S. Programa de enriquecimiento para alumnado con alta capacidad: Efectos positivos para el currículum. Comunicar 2019, 60, 39–48. [Google Scholar] [CrossRef]
  63. Prendes, M.P. La Tecnología Educativa en la Pedagogía del siglo XXI: Una visión en 3D. RIITE 2018, 4, 6–16. [Google Scholar] [CrossRef]
  64. Cabero, J.; Barroso, J. ICT teacher training: A view of the TPACK model. Cult. Educ. 2016, 28, 647–663. [Google Scholar] [CrossRef]
  65. Anderson, T. Theories for Learning with Emerging Technologies. In Emergence and Innovation in Digital Learning: Foundations and Applications; Veletsianos, G., Ed.; Athabasca University Press: Edmonton, AL, Canada, 2016; pp. 35–50. [Google Scholar]
Figure 1. BECOMA On items in which the differences were greater between the experimental group and the control group.
Sustainability 12 10129 g001aSustainability 12 10129 g001b
Figure 2. BECOMA On items with the largest differences between pre- and post-test in the experimental group.
Sustainability 12 10129 g002aSustainability 12 10129 g002b
Table 1. Participating sample for the research groups.
GroupPretestPost-Test
Experimental (EG)36292159
Control (CG)16697
Total37952256
Source: Authors’ own work (2020).
Table 2. Descriptive statistics at the pretest and post-test.
MinMaxMSDAsymmetryKurtosis
Pretest35936.089.27−0.03−0.30
Post-test116038.799.59−0.09−0.54
Source: Authors’ own work (2020).
Table 3. t test for independent samples in pretest.
ItemsEGCGtdfpd
MSDMSD
IT 11.350.841.330.84−0.3337930.7380.02
IT 20.910.780.980.801.0637930.2880.09
IT 31.130.851.200.870.9837930.3270.08
IT 41.490.751.480.74−0.1437930.8850.01
IT 51.540.711.520.74−0.3337930.7410.03
IT 61.460.681.520.661.0037930.3150.09
IT 71.570.681.750.523.3737930.001 **0.27
IT 81.330.791.510.742.8437930.005 **0.23
IT 91.120.831.300.792.7837930.005 **0.22
IT 100.920.801.050.802.1037930.036 *0.16
IT 110.730.841.000.904.0437930.000 ***0.32
IT 121.430.871.480.830.7937930.4300.06
IT 131.610.721.630.720.3337930.7400.03
IT 141.630.651.550.71−1.5937930.1130.12
IT 151.030.770.950.76−1.4037930.1600.10
IT 160.810.770.800.73−0.3237930.7480.01
IT 170.800.760.750.76−0.8537930.3970.07
IT 181.070.751.000.73−1.1037930.2710.09
IT 191.050.741.070.760.4337930.6640.03
IT 201.130.891.200.891.0537930.2950.08
IT 210.810.891.000.912.6237930.009 **0.21
IT 221.480.841.430.87−0.8137930.4180.06
IT 231.160.891.140.89−0.2637930.7930.02
IT 241.040.860.920.83−1.8637930.0630.14
IT 251.280.801.130.87−2.3937930.017 *0.19
IT 260.970.751.010.750.5437930.5890.05
IT 271.130.960.950.95−2.3937930.017 *0.19
IT 280.560.650.510.61−0.9737930.3320.08
IT 290.980.751.010.730.4237930.6740.04
IT 301.270.811.230.83−0.5037930.6160.05
Total34.809.6935.3890.740.7537930.4540.06
* Significant at 5% (p < 0.05). ** Significant at 1% (p < 0.01). *** Significant at 0.01% (p < 0.001). Source: Authors’ own work (2020).
Table 4. t test for independent samples in post-test.
ItemsEGCGtdfpd
MSDMSD
IT 11.460.811.430.73−0.3722540.7100.04
IT 21.020.791.100.780.9622540.3390.10
IT 31.240.851.120.87−1.2922540.1980.14
IT 41.590.681.530.69−0.8822540.3760.09
IT 51.660.621.700.600.6022540.5470.06
IT 61.490.661.600.591.6422540.1010.17
IT 71.620.631.750.521.9622540.0510.21
IT 81.420.751.670.643.1722540.002 **0.34
IT 91.310.781.390.760.9722540.3320.10
IT 101.170.761.220.780.6022540.5490.07
IT 110.970.861.030.860.7122540.4800.07
IT 121.660.721.710.680.6722540.5040.07
IT 131.770.571.760.61−0.1422540.8890.02
IT 141.710.571.510.72−3.3922540.001 **0.35
IT 151.120.771.140.790.2922540.7700.03
IT 160.980.800.870.80−1.3622540.1730.14
IT 170.940.770.880.78−0.7522540.4510.08
IT 181.230.741.110.78−1.4422540.1490.16
IT 191.210.721.090.76−1.5822540.1140.17
IT 201.230.871.050.88−1.9622540.0510.21
IT 210.980.910.770.81−2.1822540.029 *0.23
IT 221.580.781.440.85−1.6822540.0930.18
IT 231.220.871.130.91−0.9522540.3340.10
IT 241.100.861.030.85−0.7522540.4550.08
IT 251.360.801.140.83−2.5922540.010 *0.27
IT 261.040.750.990.76−0.6322540.5260.07
IT 271.180.950.910.94−2.7422540.006 **0.28
IT 280.700.690.600.67−1.4822540.1390.15
IT 291.220.750.890.75−4.2522540.000 ***0.44
IT 301.480.741.260.77−2.8322540.005 **0.30
Total38.659.6636.849.53−1.8122540.0700.19
* Significant at 5% (p < 0.05). ** Significant at 1% (p < 0.01). *** Significant at 0.01% (p < 0.001). Source: Authors’ own work (2020).
Table 5. Difference of means between groups for the two study timepoints.
ItemsEGCG
Post-TestPretestDif.Post-TestPretestDif.
IT 11.461.350.111.431.330.10
IT 21.020.910.111.100.980.12
IT 31.241.130.111.121.20−0.08
IT 41.591.490.101.531.480.05
IT 51.661.540.121.701.520.18
IT 61.491.460.031.601.520.08
IT 71.621.570.051.751.750.00
IT 81.421.330.091.671.510.16
IT 91.311.120.191.391.300.09
IT 101.170.920.251.221.050.17
IT 110.970.730.241.031.000.03
IT 121.661.430.231.711.480.23
IT 131.771.610.161.761.630.13
IT 141.711.630.081.511.55−0.04
IT 151.121.030.091.140.950.19
IT 160.980.810.170.870.800.07
IT 170.940.800.140.880.750.13
IT 181.231.070.161.111.000.11
IT 191.211.050.161.091.070.02
IT 201.231.130.101.051.20−0.15
IT 210.980.810.170.771.00−0.23
IT 221.581.480.101.441.430.01
IT 231.221.160.061.131.14−0.01
IT 241.101.040.061.030.920.11
IT 251.361.280.081.141.130.01
IT 261.040.970.070.991.01−0.02
IT 271.181.130.050.910.95−0.04
IT 280.700.560.140.600.510.09
IT 291.220.980.240.891.01−0.12
IT 301.481.270.211.261.230.03
Total38.6534.803.8536.8435.381.46
Source: Authors’ own work (2020).
Table 6. Difference in effect size between groups for the two study timepoints.
ItemsEGCGDif.
IT 10.130.120.01
IT 20.140.15−0.01
IT 30.130.090.04
IT 40.140.070.07
IT 50.180.26−0.08
IT 60.040.13−0.09
IT 70.080.000.08
IT 80.120.23−0.11
IT 90.230.120.11
IT 100.320.210.11
IT 110.280.030.25
IT 120.280.30−0.02
IT 130.240.190.05
IT 140.130.060.07
IT 150.120.25−0.13
IT 160.220.090.13
IT 170.180.170.01
IT 180.210.150.06
IT 190.220.030.19
IT 200.110.17−0.06
IT 210.190.26−0.07
IT 220.120.010.11
IT 230.070.010.06
IT 240.070.13−0.06
IT 250.100.010.09
IT 260.090.030.06
IT 270.050.040.01
IT 280.210.140.07
IT 290.320.160.16
IT 300.270.040.23
Total0.400.150.25
Source: Authors’ own work (2020).
Table 7. Study sample by sex.
SexEGCG
PretestPost-TestPretestPost-Test
Boys192011128242
Girls170910478455
Total3629215916697
Source: Authors’ own work (2020).
Table 8. Results by sex at each timepoint.
SexEGCG
PretestPost-TestPretestPost-Test
MSDMSDMSDMSD
Boys35.1110.0539.2410.1936.7310.6738.1711.13
Girls34.469.2638.049.0434.068.6035.828.06
Total34.809.6938.659.6635.389.7436.849.53
Source: Authors’ own work (2020).
Publisher’s Note: MDPI stays neutral with regard to jurisdictional claims in published maps and institutional affiliations.

