Article

How to Choose a Hydrological Recovery Mode for Degraded Semiarid Wetland in China? A Case Study on Restoration of Phragmites australis Saline-Alkaline Wetland

1
State Key Laboratory of Water Environment Simulation, School of Environment, Beijing Normal University, Beijing 100875, China
2
Key Laboratory of Wetland Ecology and Environment, Northeast Institute of Geography and Agroecology, Chinese Academy of Science, 4888 Shengbei Street, Changchun 130012, China
3
School of Applied Meteorology, Nanjing University of Information Science and Technology, Nanjing 210044, China
4
Institute of Grassland Science, Northeast Normal University, Changchun 130024, China
*
Author to whom correspondence should be addressed.
Sustainability 2020, 12(23), 10103; https://doi.org/10.3390/su122310103
Submission received: 8 November 2020 / Revised: 25 November 2020 / Accepted: 1 December 2020 / Published: 3 December 2020
(This article belongs to the Section Environmental Sustainability and Applications)

Abstract

:
Hydrological recovery is the basis for restoring the structure and function of wetlands in semiarid and arid areas of China. Selecting an appropriate hydrological recovery mode may be helpful for improving the effectiveness of wetland restoration. We conducted pot experiments to study the effects of the flooding frequency, duration, depth, and occurrence time on the height, biomass, ion contents, and photosynthetic physiology of Phragmites australis in degraded saline–alkaline marsh in the West Songnen Plain, China. At the end of the growing season, we found that the biomass, photosynthetic parameters, and water use efficiency (WUE) of the leaves increased, whereas the Na+ concentration decreased, and the K+ content remained unchanged under an increased flooding frequency treatment. As the flooding depth increased, the plant height increased, but there were no differences in the photosynthetic parameters, biomass, and WUE under flooding at 5 cm and 10 cm. Under different flooding duration treatments, the plant height and biomass were greater, but the photosynthetic parameters and Na+ and K+ contents were lower under a flooding duration of three months. The flooding occurrence time had little effect on the growth of P. australis. Our results indicate that the flooding frequency and duration had greater effects than the flooding depth and occurrence time in the hydrological recovery model for P. australis restoration. The biomass accumulated by P. australis was related to lower Na+ contents and the maintenance of a high K+/Na+ contents, and WUE increased by adjusting photosynthesis under a moderate flooding frequency and duration. These results have important implications for the restoration of degraded semiarid wetlands with man-made channel systems in conditions with limited freshwater resources.

1. Introduction

Wetlands are considered the “kidneys” of the Earth and they have many important ecological functions, e.g., carbon sequestration, nutrient cycling, water purification, erosion control, and wildlife habitats [1]. However, wetland degradation has occurred, including area reductions, water quality deterioration, and loss of functions due to disturbances caused by natural environmental changes and human activities [2]. Some estimates suggest that more than half of the world’s wetlands have been lost, and most of these losses occurred in the twentieth century [3]. In response, many researchers have focused on wetland restoration and creation throughout the world with the aims of increasing the wetland areas and improving their ecological functions, e.g., wetland hydrological restoration [4] and eutrophication control [5]. A lack of water resources is the main factor responsible for driving wetland degradation in arid and semiarid areas of China [6,7]. Therefore, hydrological recovery is essential for the wetland structure and functional restoration in northern China.
Freshwater resources are limited throughout the world and they are required by many ecosystems, such as forests, grasslands, wetlands, and agriculture. Therefore, it is necessary to optimize the use of freshwater resources and develop a suitable hydrological recovery mode, which is a prerequisite for the restoration of marshland areas. Water is an important environmental factor that affects plant growth and development [8], and it influences the accumulation of organic matter and primary productivity of plants [9]. Hydrological characteristics can determine changes in plant populations [10] and altered plant diversity and the direction of community succession [11]. Research into wetlands has shown that increasing the flooding depth can inhibit the vegetation richness [12] and propagation rate [5]. Hypoxia is enhanced by increasing the flooding duration and it is the main factor that influences the survival and growth of wetland plants [13]. Alternating flooding and drought can promote the accumulation of biomass in Phragmites australis [14]. However, hydrological recovery mode such as those with different flooding depths, durations, and frequencies have rarely been compared. Selecting a suitable hydrological recovery mode may help to increase the likelihood of successful wetland restoration and optimize the allocation of freshwater resources.
The Songnen Plain in China is one of the important soda saline–alkaline wetlands that remain in the world [15,16]. This Mesozoic–Cenozoic sedimentary basin has a thick clay layer and it was mainly affected by rivers [17], but the impacts of climate change have resulted in various changes to the river systems, with alternating fluvial and lacustrine episodes on a large scale [18], while the effects of human activities have also severely degraded the saline–alkaline wetland, and some areas have become alkaline. Due to the degradation of grassland, the area of saline–alkaline land on the Songnen Plain increased from 1.08 million ha in 1958 to 2.57 million ha in 2001 [19]. Wetland accounted for 6404 km2 in 1954, but this area was 74% smaller in 2008, mainly due to a significant increase in the air temperature and the precipitation rate decreasing at a rate of 23.1 mm per decade which have reduced the climatic supply of water to the wetlands [20]. P. australis has a dense distribution in almost monospecific stands in the saline–alkaline wetlands of the western Songnen Plain. P. australis has a worldwide distribution and it can adapt to fluctuating hydroperiods [21], as well as levels 1 m above and below the average water level of neighboring water bodies [22]. Studies have shown that the flooding depth [23,24,25], flooding duration [7,26], and flooding occurrence time [26] can significantly affect the growth of P. australis. However, these studies did not compare the effects of variations in these factors on the restoration of degraded saline–alkaline wetland populated by P. australis.
In this study, our aim was to determine an effective hydrological recovery mode for restoring P. australis populations in degraded semiarid wetlands in China by investigating the saline–alkaline wetlands on the Songnen Plain as a case study. We aimed to determine the appropriate time for adding water (when and for how long) as well as a suitable quantity (depth) and intensity (frequency) by studying the growth and photosynthetic responses of P. australis to different hydrological recovery mode (flooding frequency, duration, depth, and occurrence time). Our results may help restoration managers to understand how the frequency, depth, and duration of flooding might affect the survival, growth, and morphology of targeted plant species in order to increase the likelihood of successful wetland restoration [27].

2. Materials and Methods

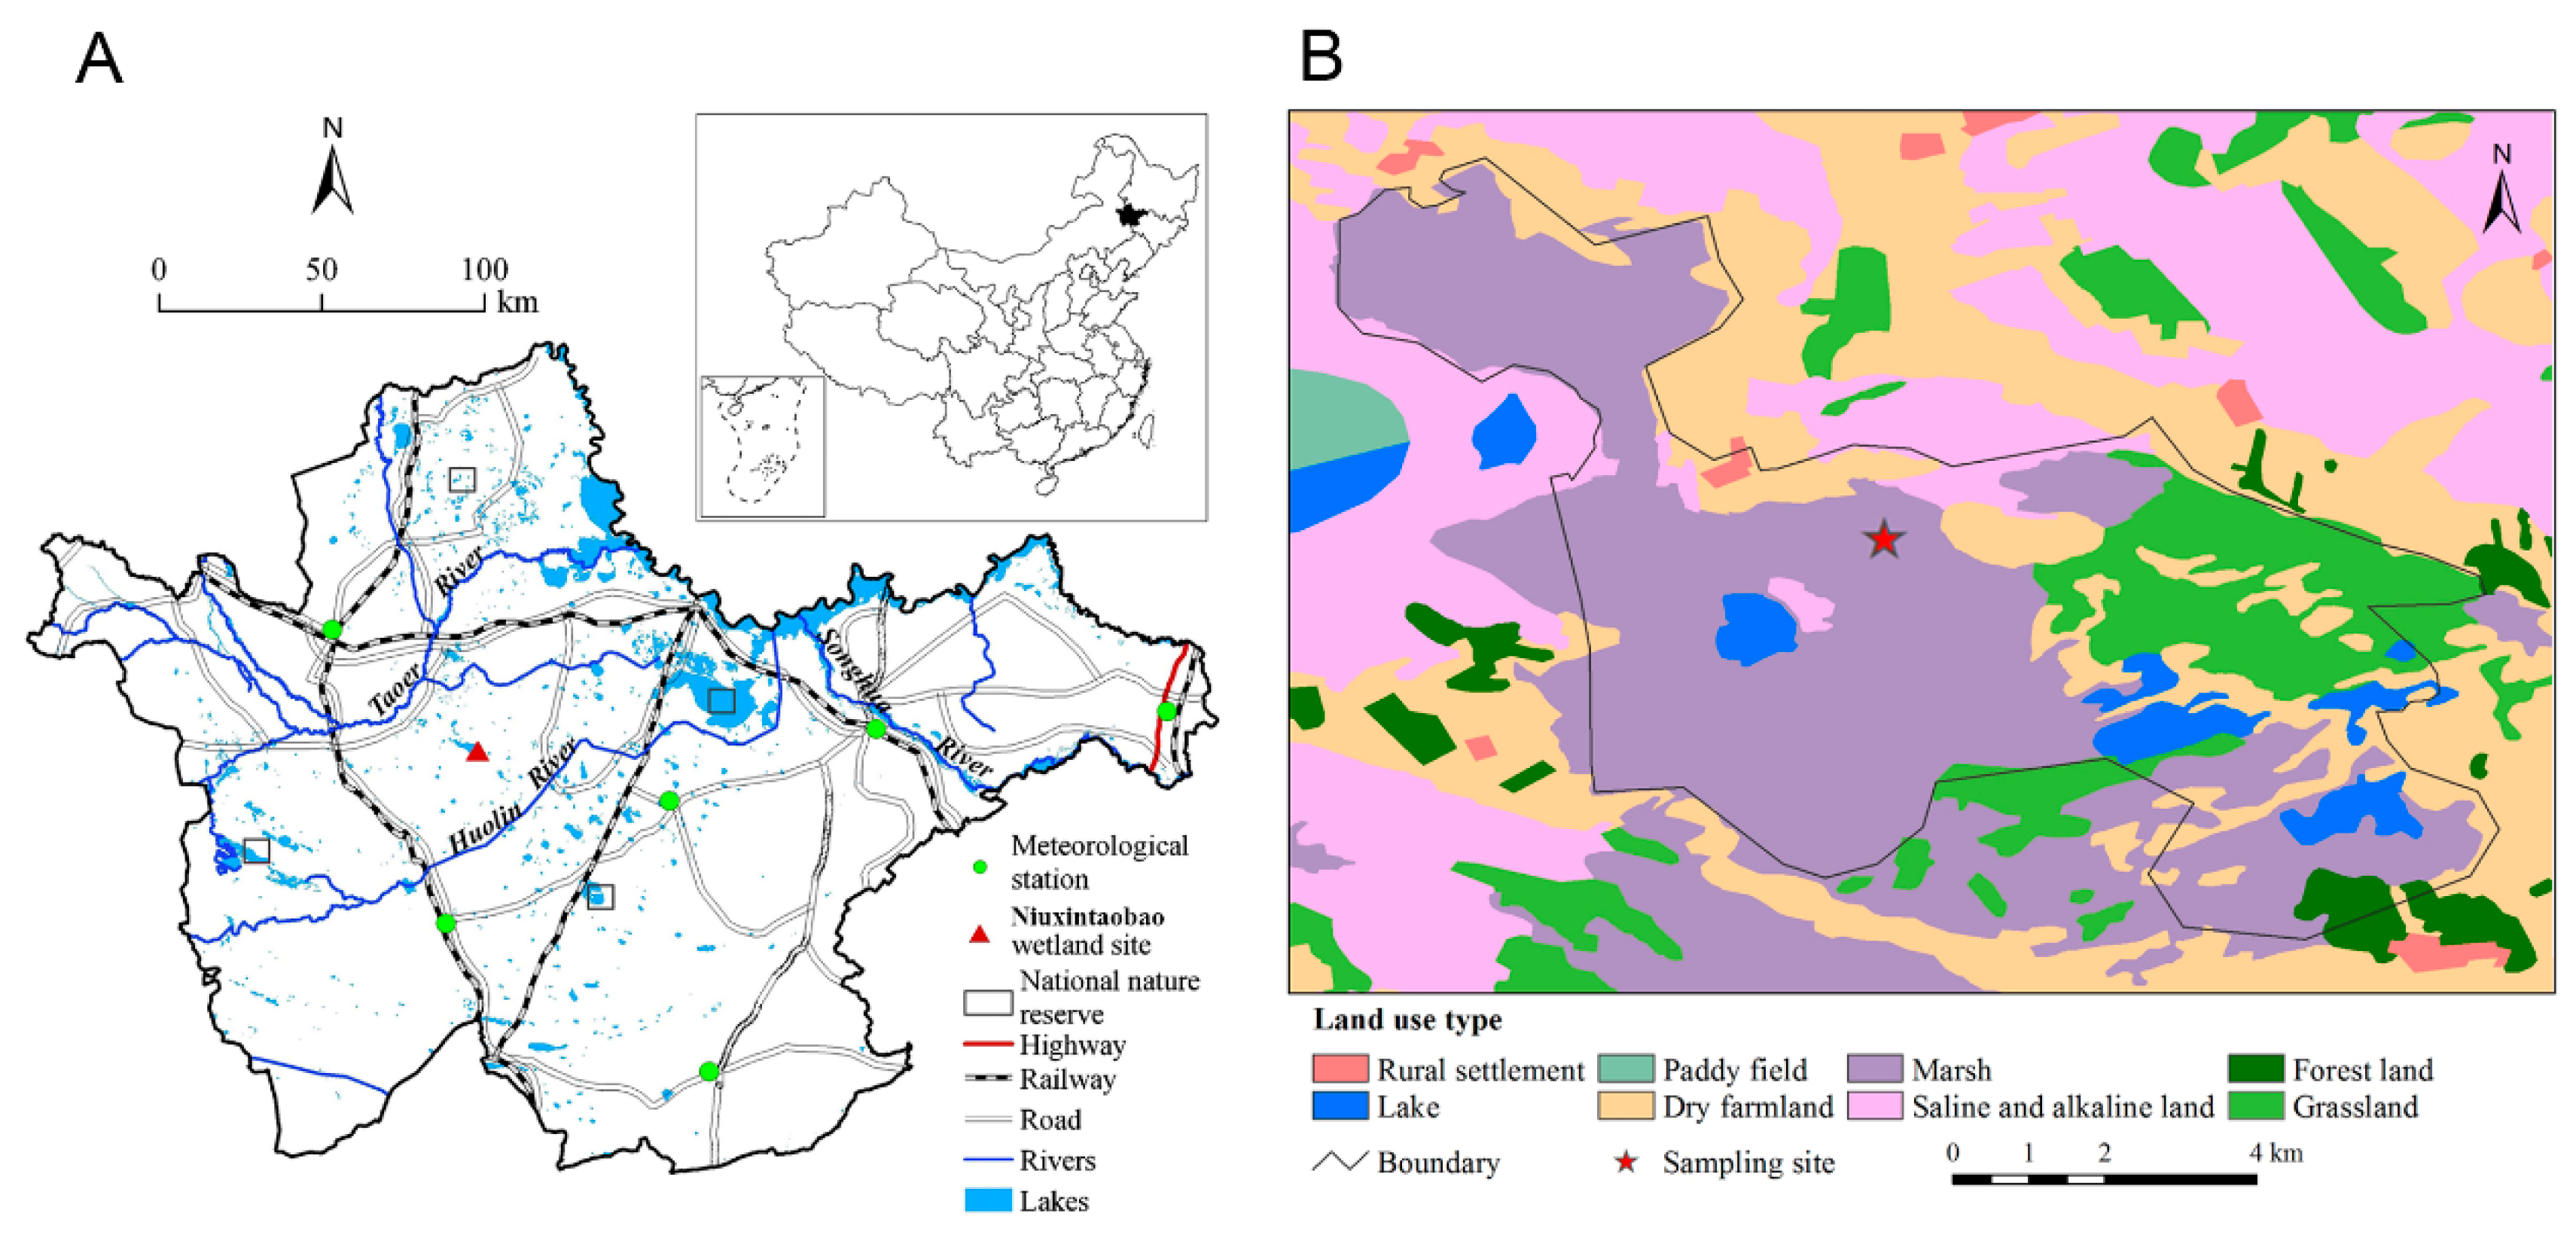
2.1. Study Materials

We used P. australis and saline–alkaline soil from Niuxintaobao wetland (45°13′ N, 123°21′ E) on the western Songnen Plain, Northeast China, which has an area of more than 3300 hm2 (Figure 1). This area has a typical semiarid and moderate monsoon climate with average rainfall of 395.7 mm per year−1 and evaporation of 1696.9 mm per year−1. The wetland was formed by interfluvial flooding by the Huolin and Tao’er Rivers. The total radiation per year in the region is 5259 MJ m–2 and the accumulated temperature ≥10 °C is 2921.3 °C, with a frost-free period of 137 days [9]. P. australis is a typical plant that colonizes saline–alkaline soil and it only reaches a height of 50 cm in the degraded regions of the wetland. From 2002 to 2013, a large area of degraded P. australis wetland was restored, which was mainly fed by water diverted from the Huolin and Tao’er Rivers [26].
We conducted pot experiments in 2013. Soil clods (20 × 20 × 20 cm3) containing P. australis rhizomes, buds, and young seedlings were collected and sprayed with water to keep them moist before transplanting into pots. Soil with a depth of 20–30 cm, but without P. australis was prepared in May. In an open space, saline soil was mixed evenly and then used to fill pots (diameter of 30 cm and height of 35 cm) to a depth 5 cm, before adding one plant. Finally, the spaces in each pot were filled with mixed soil. The distance from the soil surface to the bottom was 25 cm after watering. The remaining depth of 10 cm was required for the flooding depth treatment. All pots were weighed using digital scales. Freshwater irrigation was applied for 2 weeks to restore the growth of P. australis before the experiments started. The same numbers of plants were prepared for the different water treatments.

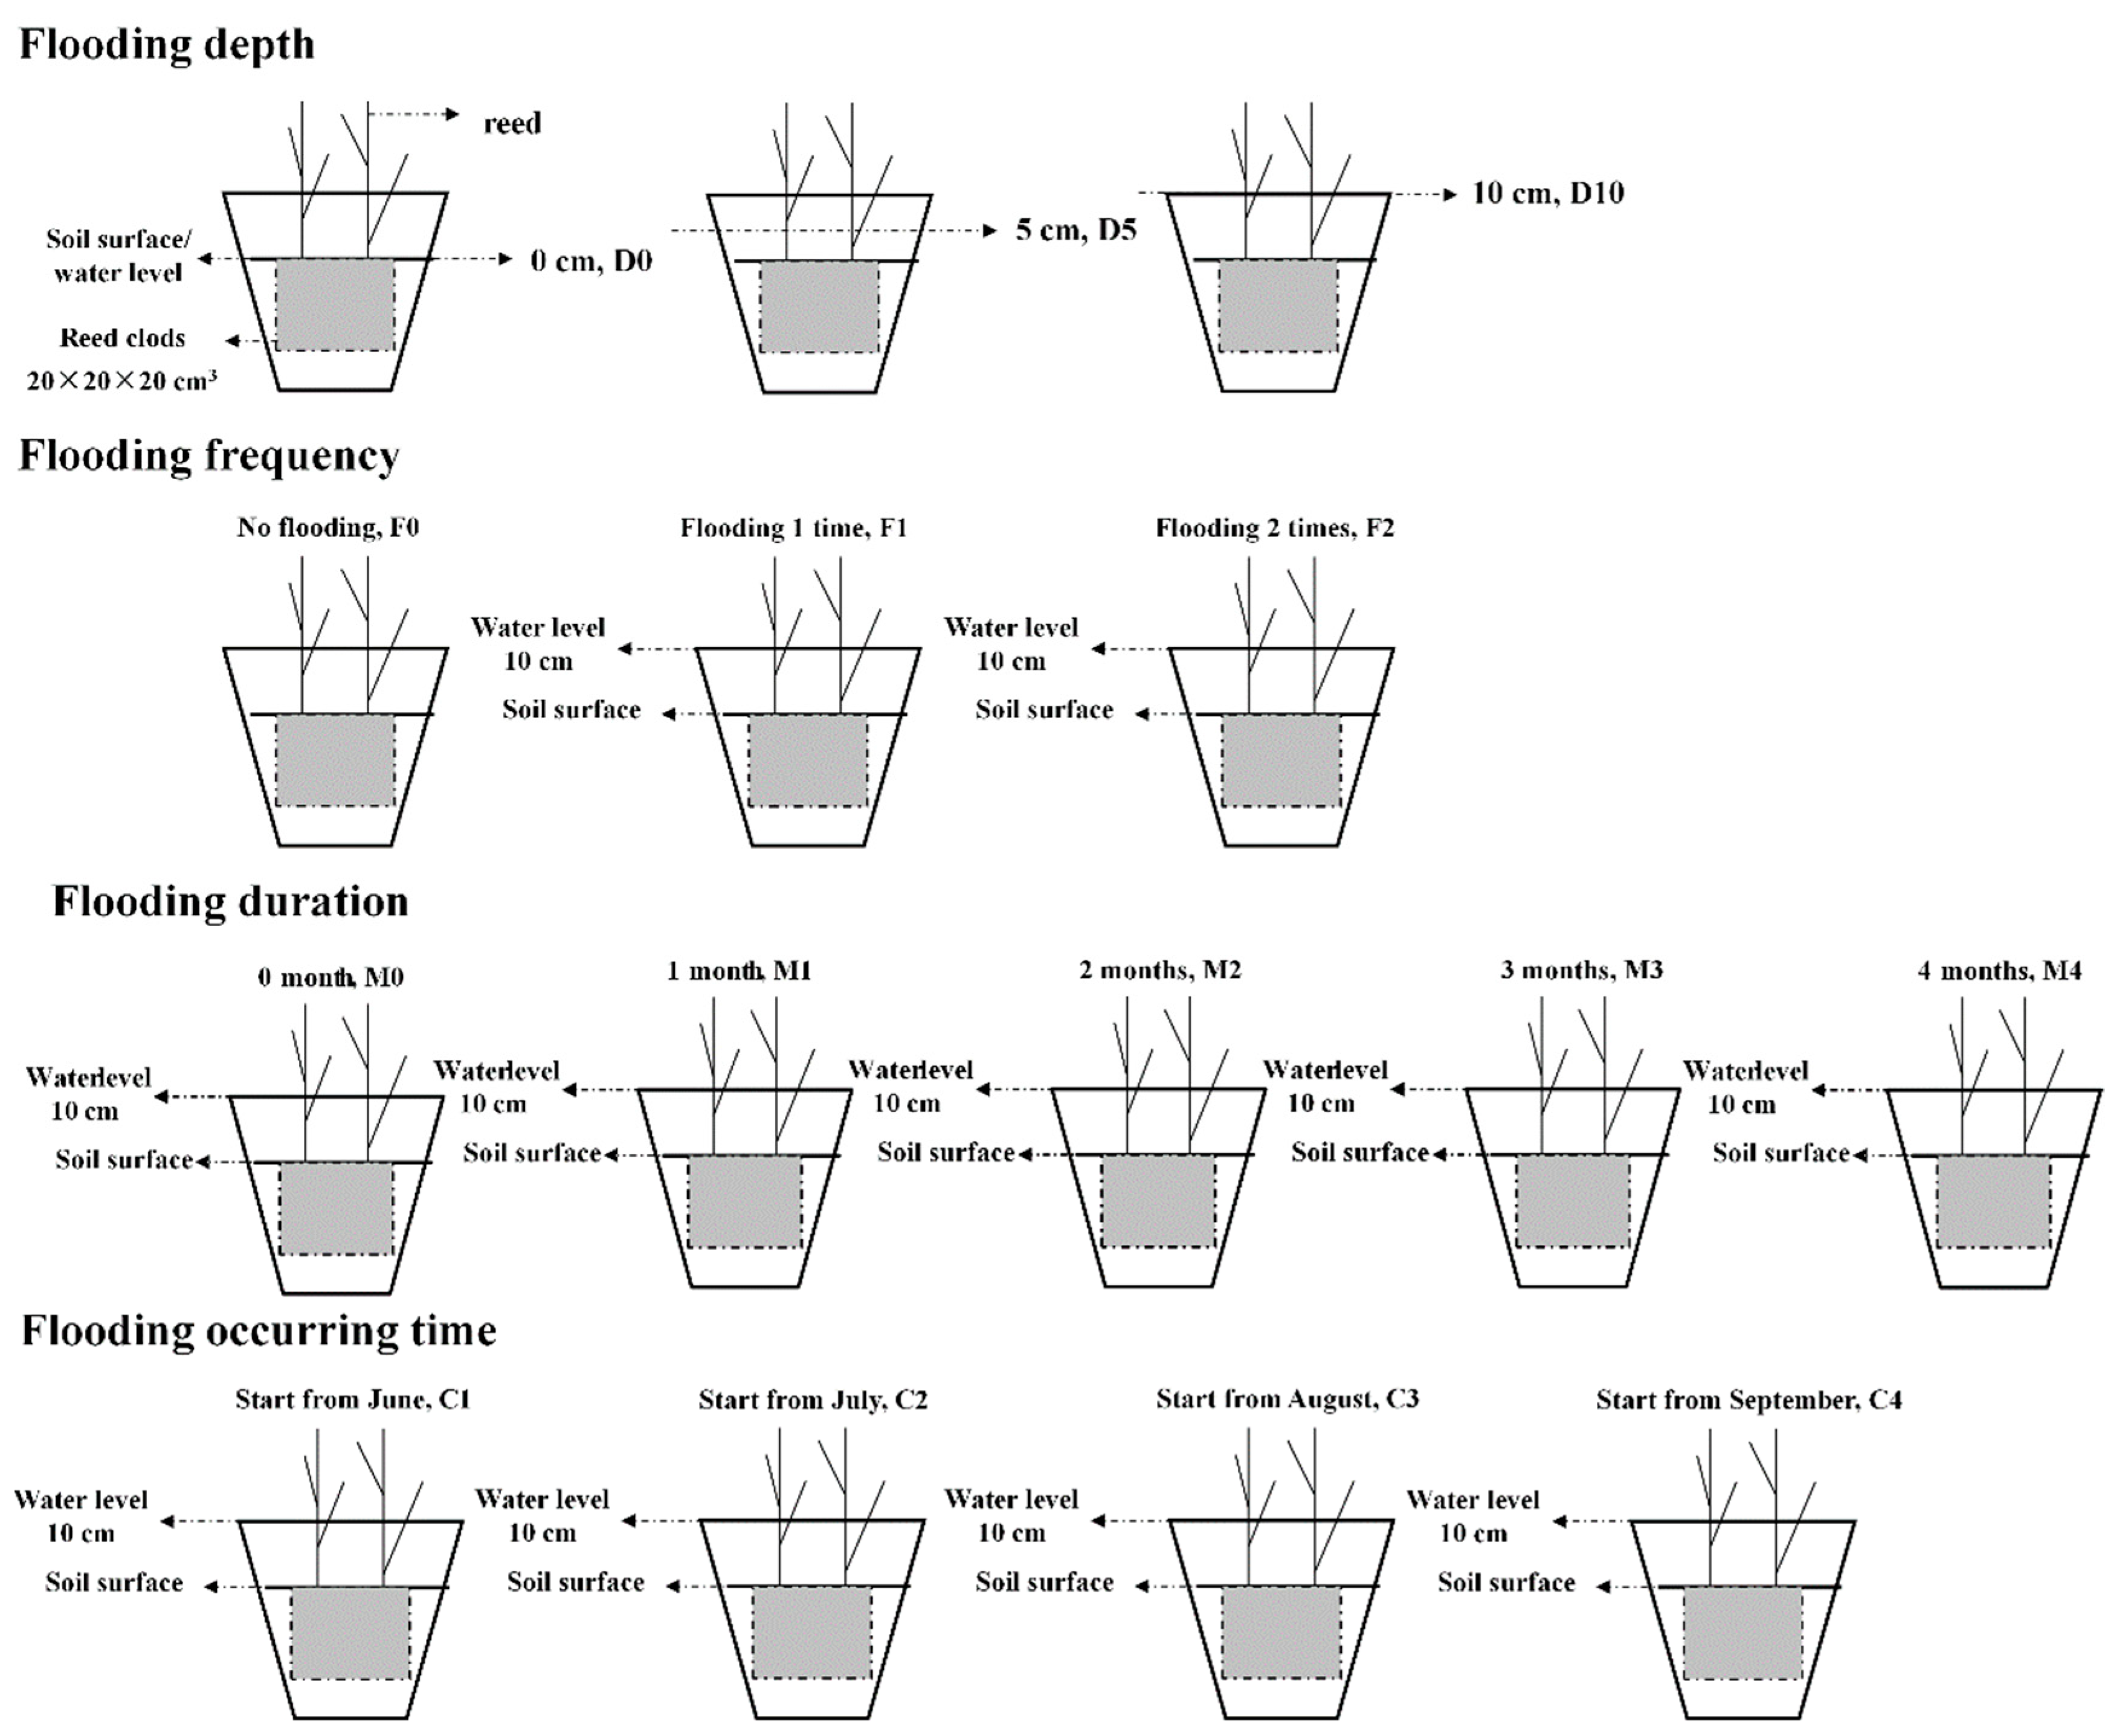
2.2. Flooding Treatments

We set different flooding frequencies, depths, durations, and occurrence times in separate pot experiments, as follows (Figure 2). (1) We set three flooding depth levels for the whole growing season: 0 cm, 5 cm, and 10 cm (D0, D5, D10), while the flooding duration, flooding frequency, and flooding occurrence time remained t10 cm. (2) We set three flooding frequencies during four months: No flooding, flooding one time, flooding two times (F0, F1, F2), respectively, which indicated flooding for 0 time; flooding 1 time for the whole season and flooding duration with 2 months; flooding 2 times, and each time set flooding and drainage for 1 month, respectively, and total duration of flooding was 2 months. (3) Five flooding durations were set: 0 months, 1 month, 2 months, 3 months, and 4 months (M0, M1, M2, M3, M4), respectively. (4) Four flooding occurrence times were set: Flooding for one month starting from June, July, August, and September, (C1, C2, C3, C4), respectively. The experimental period lasted from May until 1 October. Except for the flooding treatments with different depths, drought was avoided by keeping the water content at 35–40% of the field capacity using a syringe (weight-based method). All pots were kept in a greenhouse to avoid disturbance by rainwater. The greenhouse was ventilated to keep a similar temperature inside to that outside. Three replicates were tested for each treatment, with a total of 36 pots.

2.3. Sampling and Determination

Before harvesting, we sampled five random plants per treatment to determine the net photosynthetic rate (Pn), transpiration rate (E), and stomatal conductance (Gs) in September. We measured the fully expanded youngest leaves from each plant at 9:00–11:00 am on each sampling date using a portable open flow gas exchange system (LI-6400; LI-COR Inc., Lincoln, NE, USA), which simultaneously analyzed the field light intensity (1400 μmol m–2 s–1). The leaf measurements were repeated five times and the averages were recorded. The water use efficiency (WUE) was calculated for the leaves as follows: WUE (g kg−1) = Pn μmol (CO2 m−2 s−1)/E mmol (H2O m−2 s−1).
At the end of the growing season, we determined the heights of five P. australis plants for each treatment. The absolute height was determined using a measuring tape. The above- and belowground organs were separated from the plants in each pot, washed with tap water and distilled water, and oven dried at 105 °C for 15 min and then 70 °C for 48 h, before determining the dry weight. In addition, 100 mg of each dried crushed sample was treated with 10 mL deionized water at 100 °C for 1 h, and the extract was used to determine the Na+ and K+ contents with an atomic absorption spectrophotometer (TAS-990, Purkinje General, Beijing, China) [28].

2.4. Statistical Analyses

We performed one-way analysis of variance using SPSS 22.0 (SPSS Inc, Chicago, IL, USA). A transformation was necessary to satisfy the statistical requirement if the data were not normally distributed. The means and standard errors were calculated. Different treatments were analyzed using the least-significant difference method for multiple comparisons (p < 0.05).

3. Results

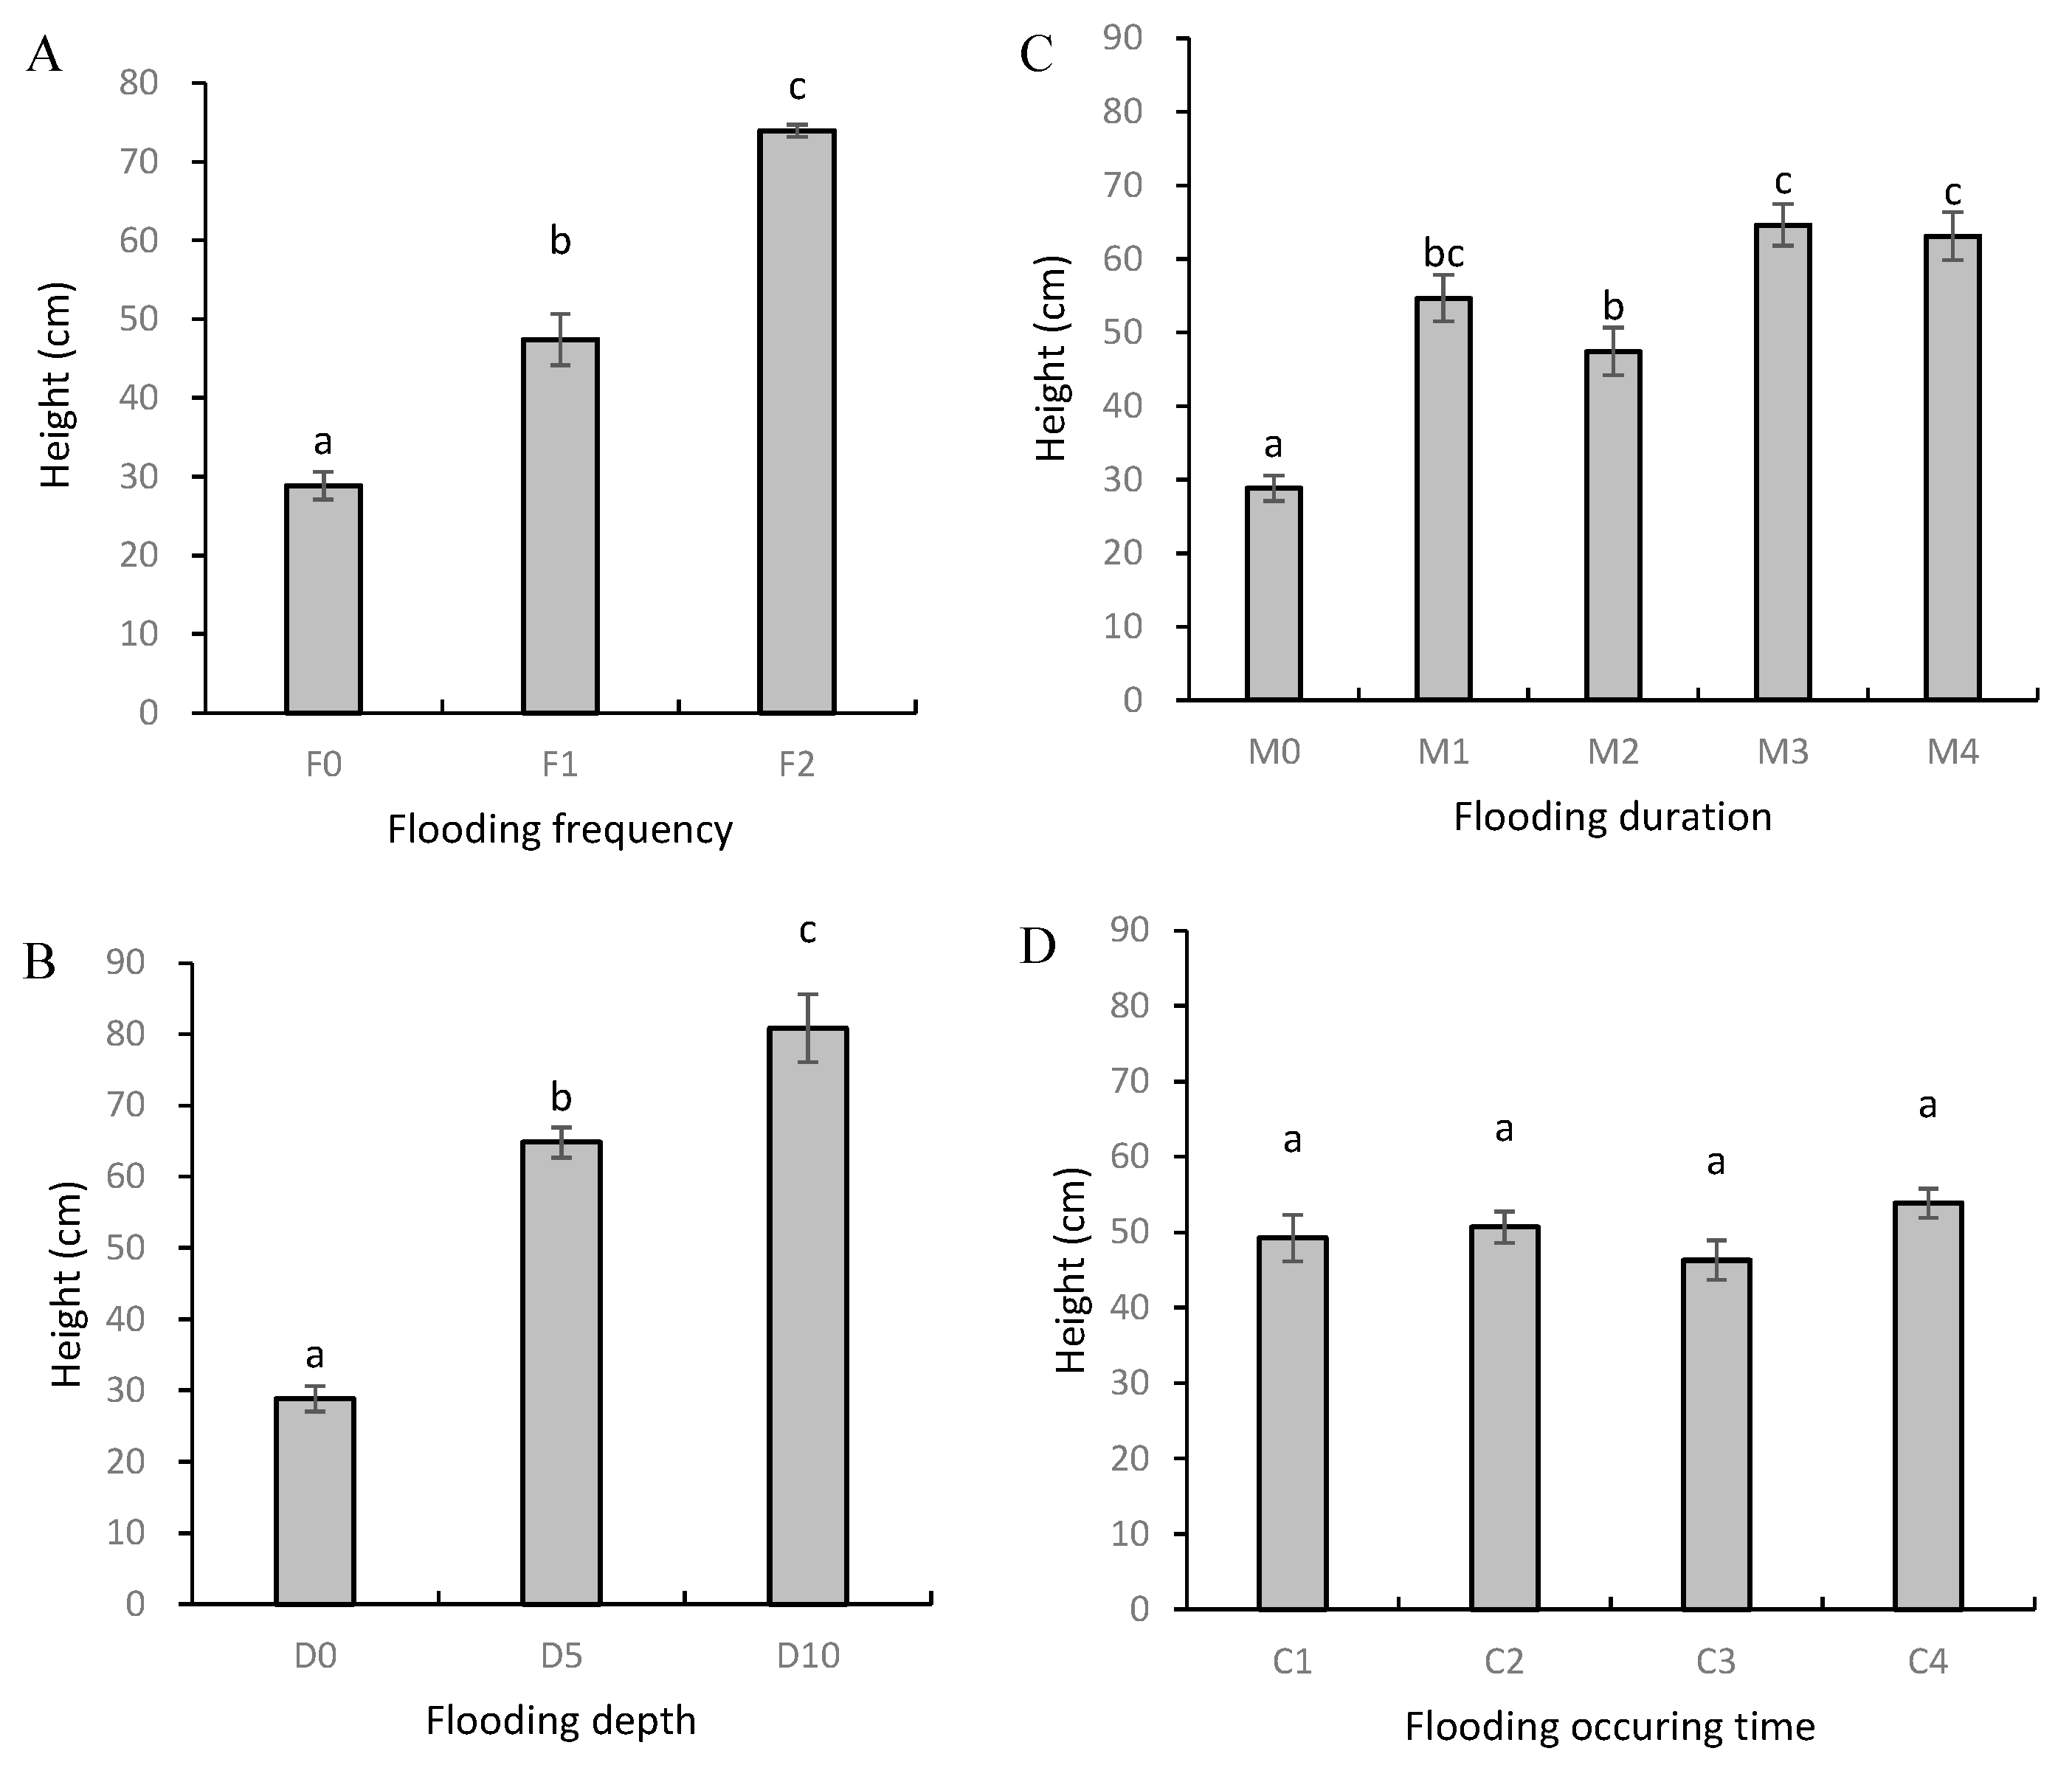
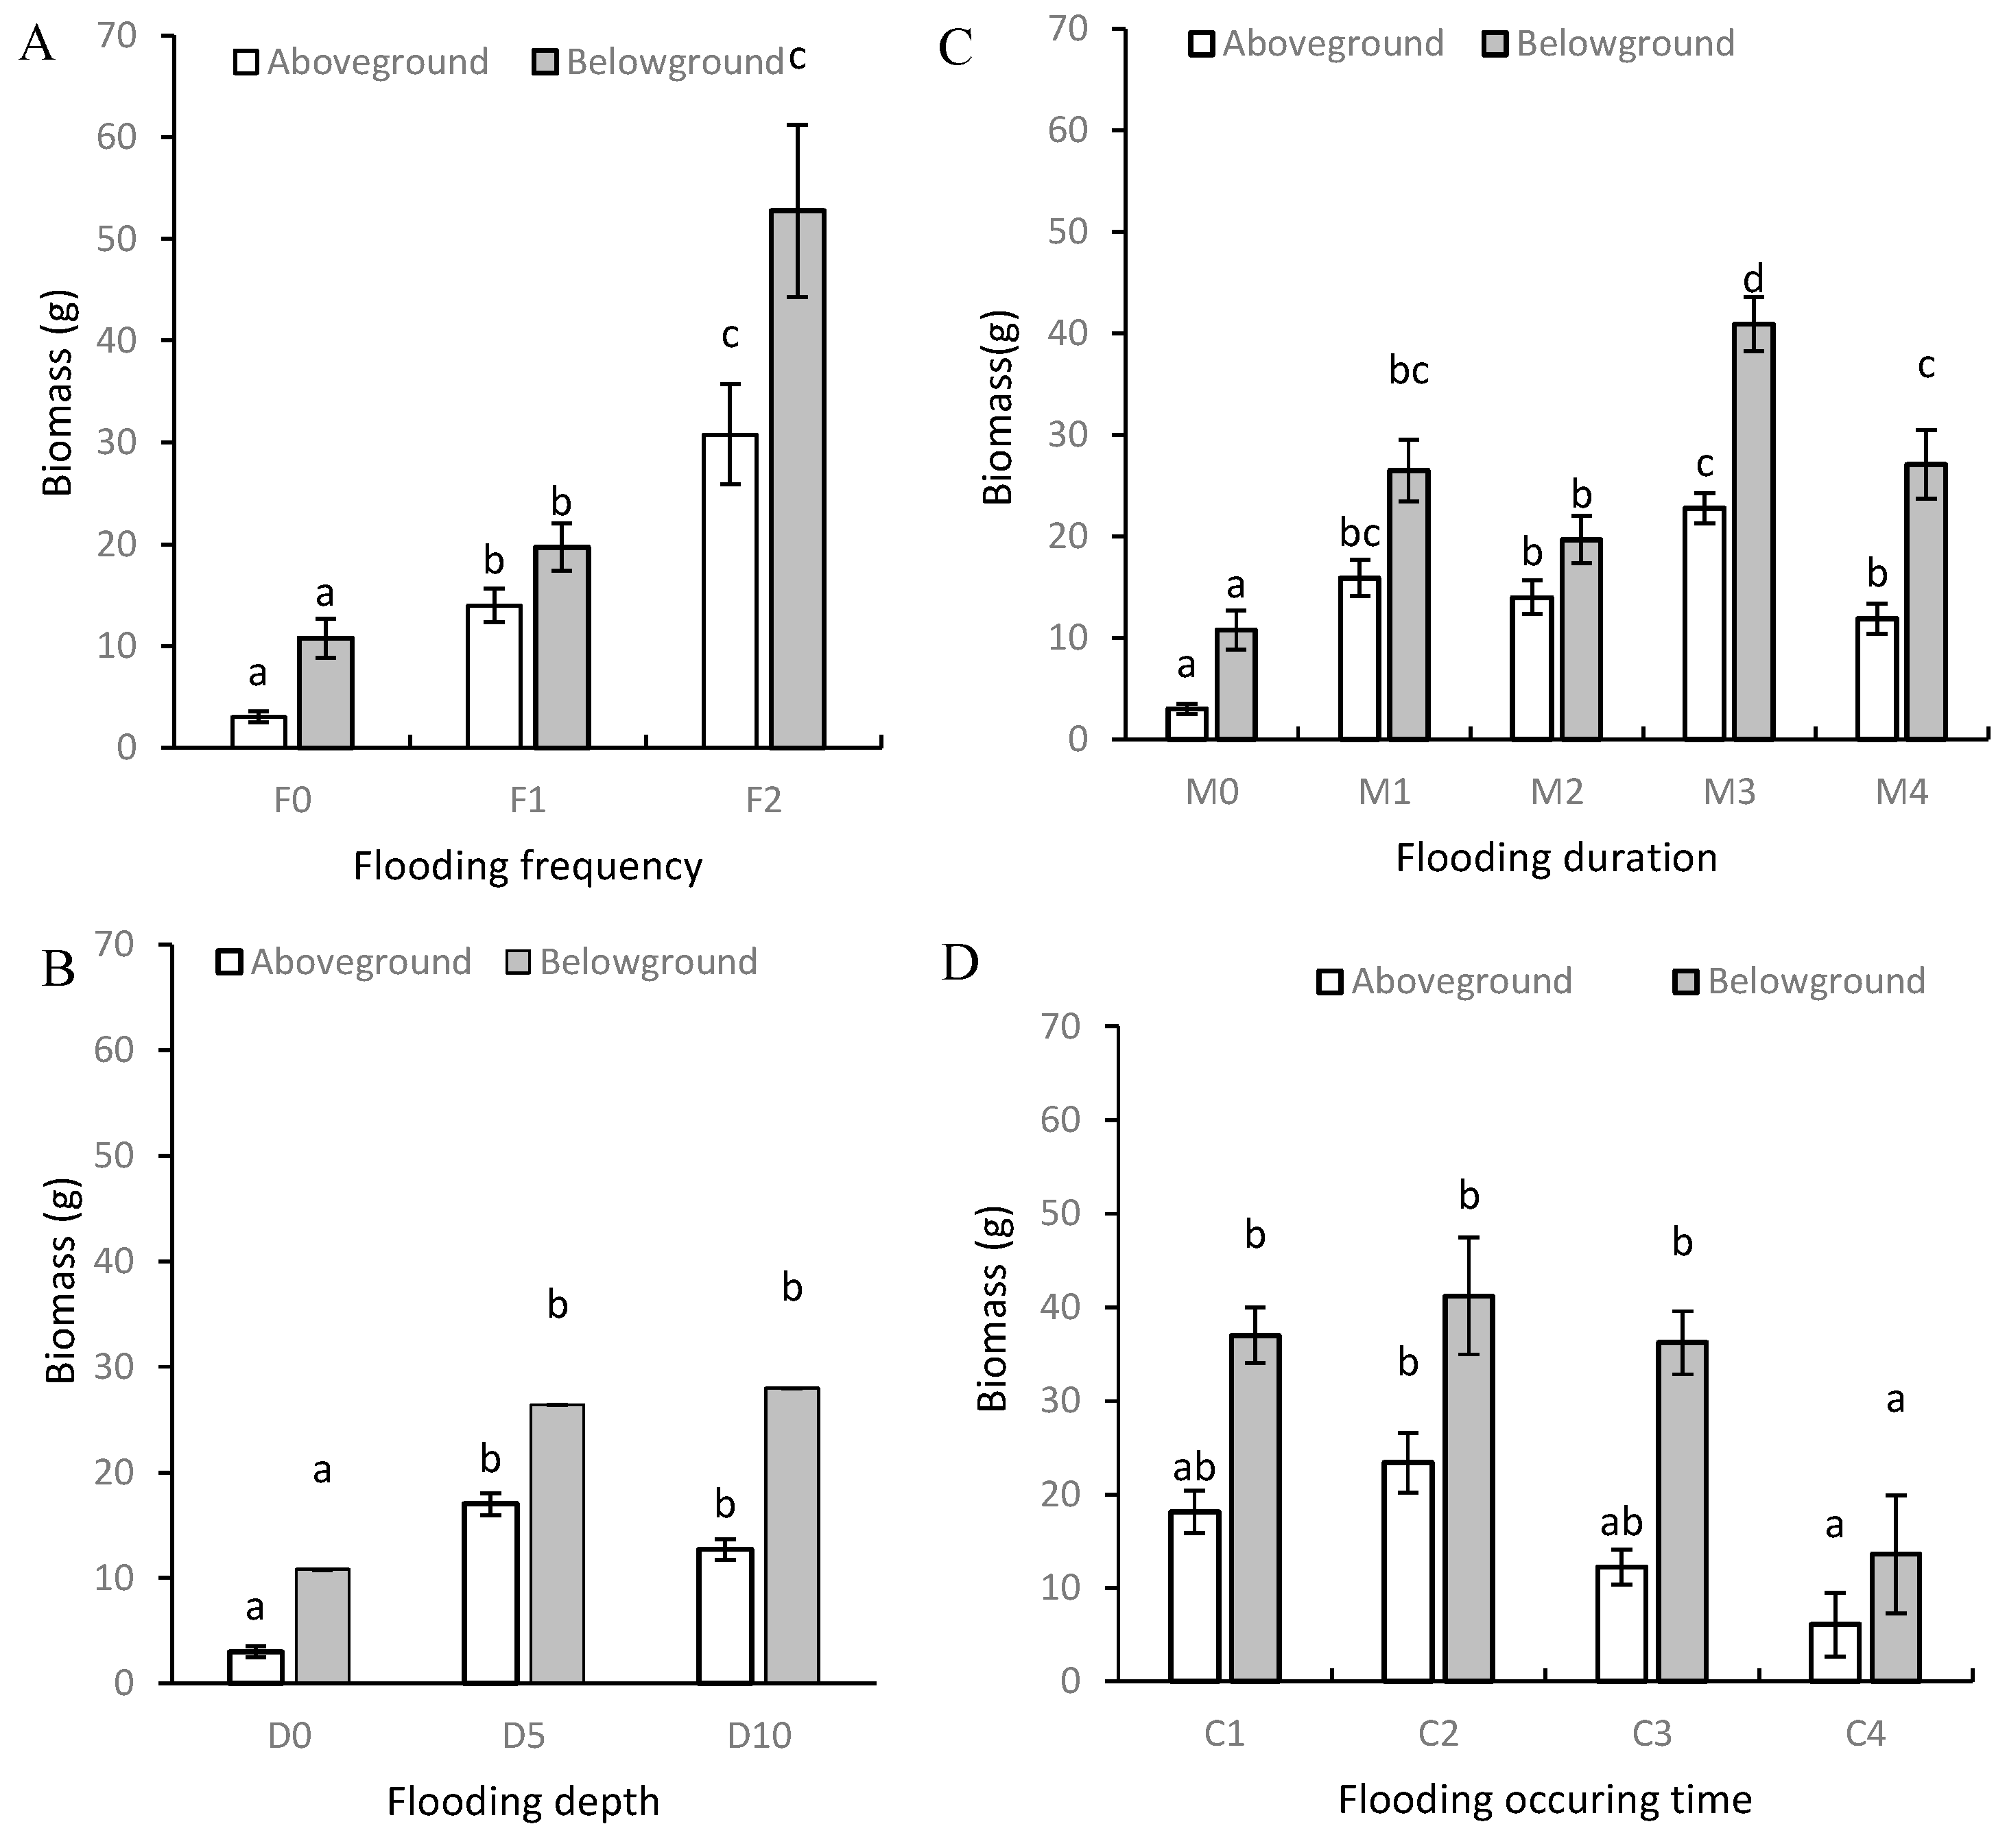
3.1. Plant Height and Biomass

The height of P. australis was significantly affected by the flooding frequency, depth, and duration (p < 0.05, Table 1), but not by the flooding occurrence time. However, there was no significant difference in the height between M1 and M2, and no significant differences among M1, M3, and M4 (Figure 3C). The plant height was greater under D10 than D5 (Figure 3B). Increasing the flooding duration affected the plant height, but there were no significance differences between that under M1 and those with the other treatments. The average heights were higher under M3 and M4 than M1 and M2 (Figure 3C). P. australis grew higher with a greater flooding higher frequency and flooding depth, with an average height of 80 cm in the pots.
The biomass of P. australis was influenced significantly by the flooding frequency, depth, duration, and flooding occurrence time (p < 0.05, Table 1). As the flooding frequency increased, the aboveground and belowground biomasses both increased markedly, where the highest increases under F2 were 9.3 and 3.9 times greater than those under F0, respectively (Figure 4A). There was no significant difference in the biomass under the D5 and D10 flooding depth treatments (Figure 4B). As the flooding duration increased, the biomass varied and it was higher under M3. The aboveground and belowground biomasses were highest under M3, i.e., 6.6- and 2.8-times higher than those under D0, respectively (Figure 4C). As the flooding occurrence time advanced, the plant biomass did not change significantly from C1 to C3, but it decreased significantly under C4 (Figure 4D). The accumulated biomass was higher under C2, where the aboveground and belowground biomasses were 6.8 and 2.8 times higher than those with no flooding (D0), respectively. The biomass of P. australis was greatest under the increased flooding frequency treatment (F2).

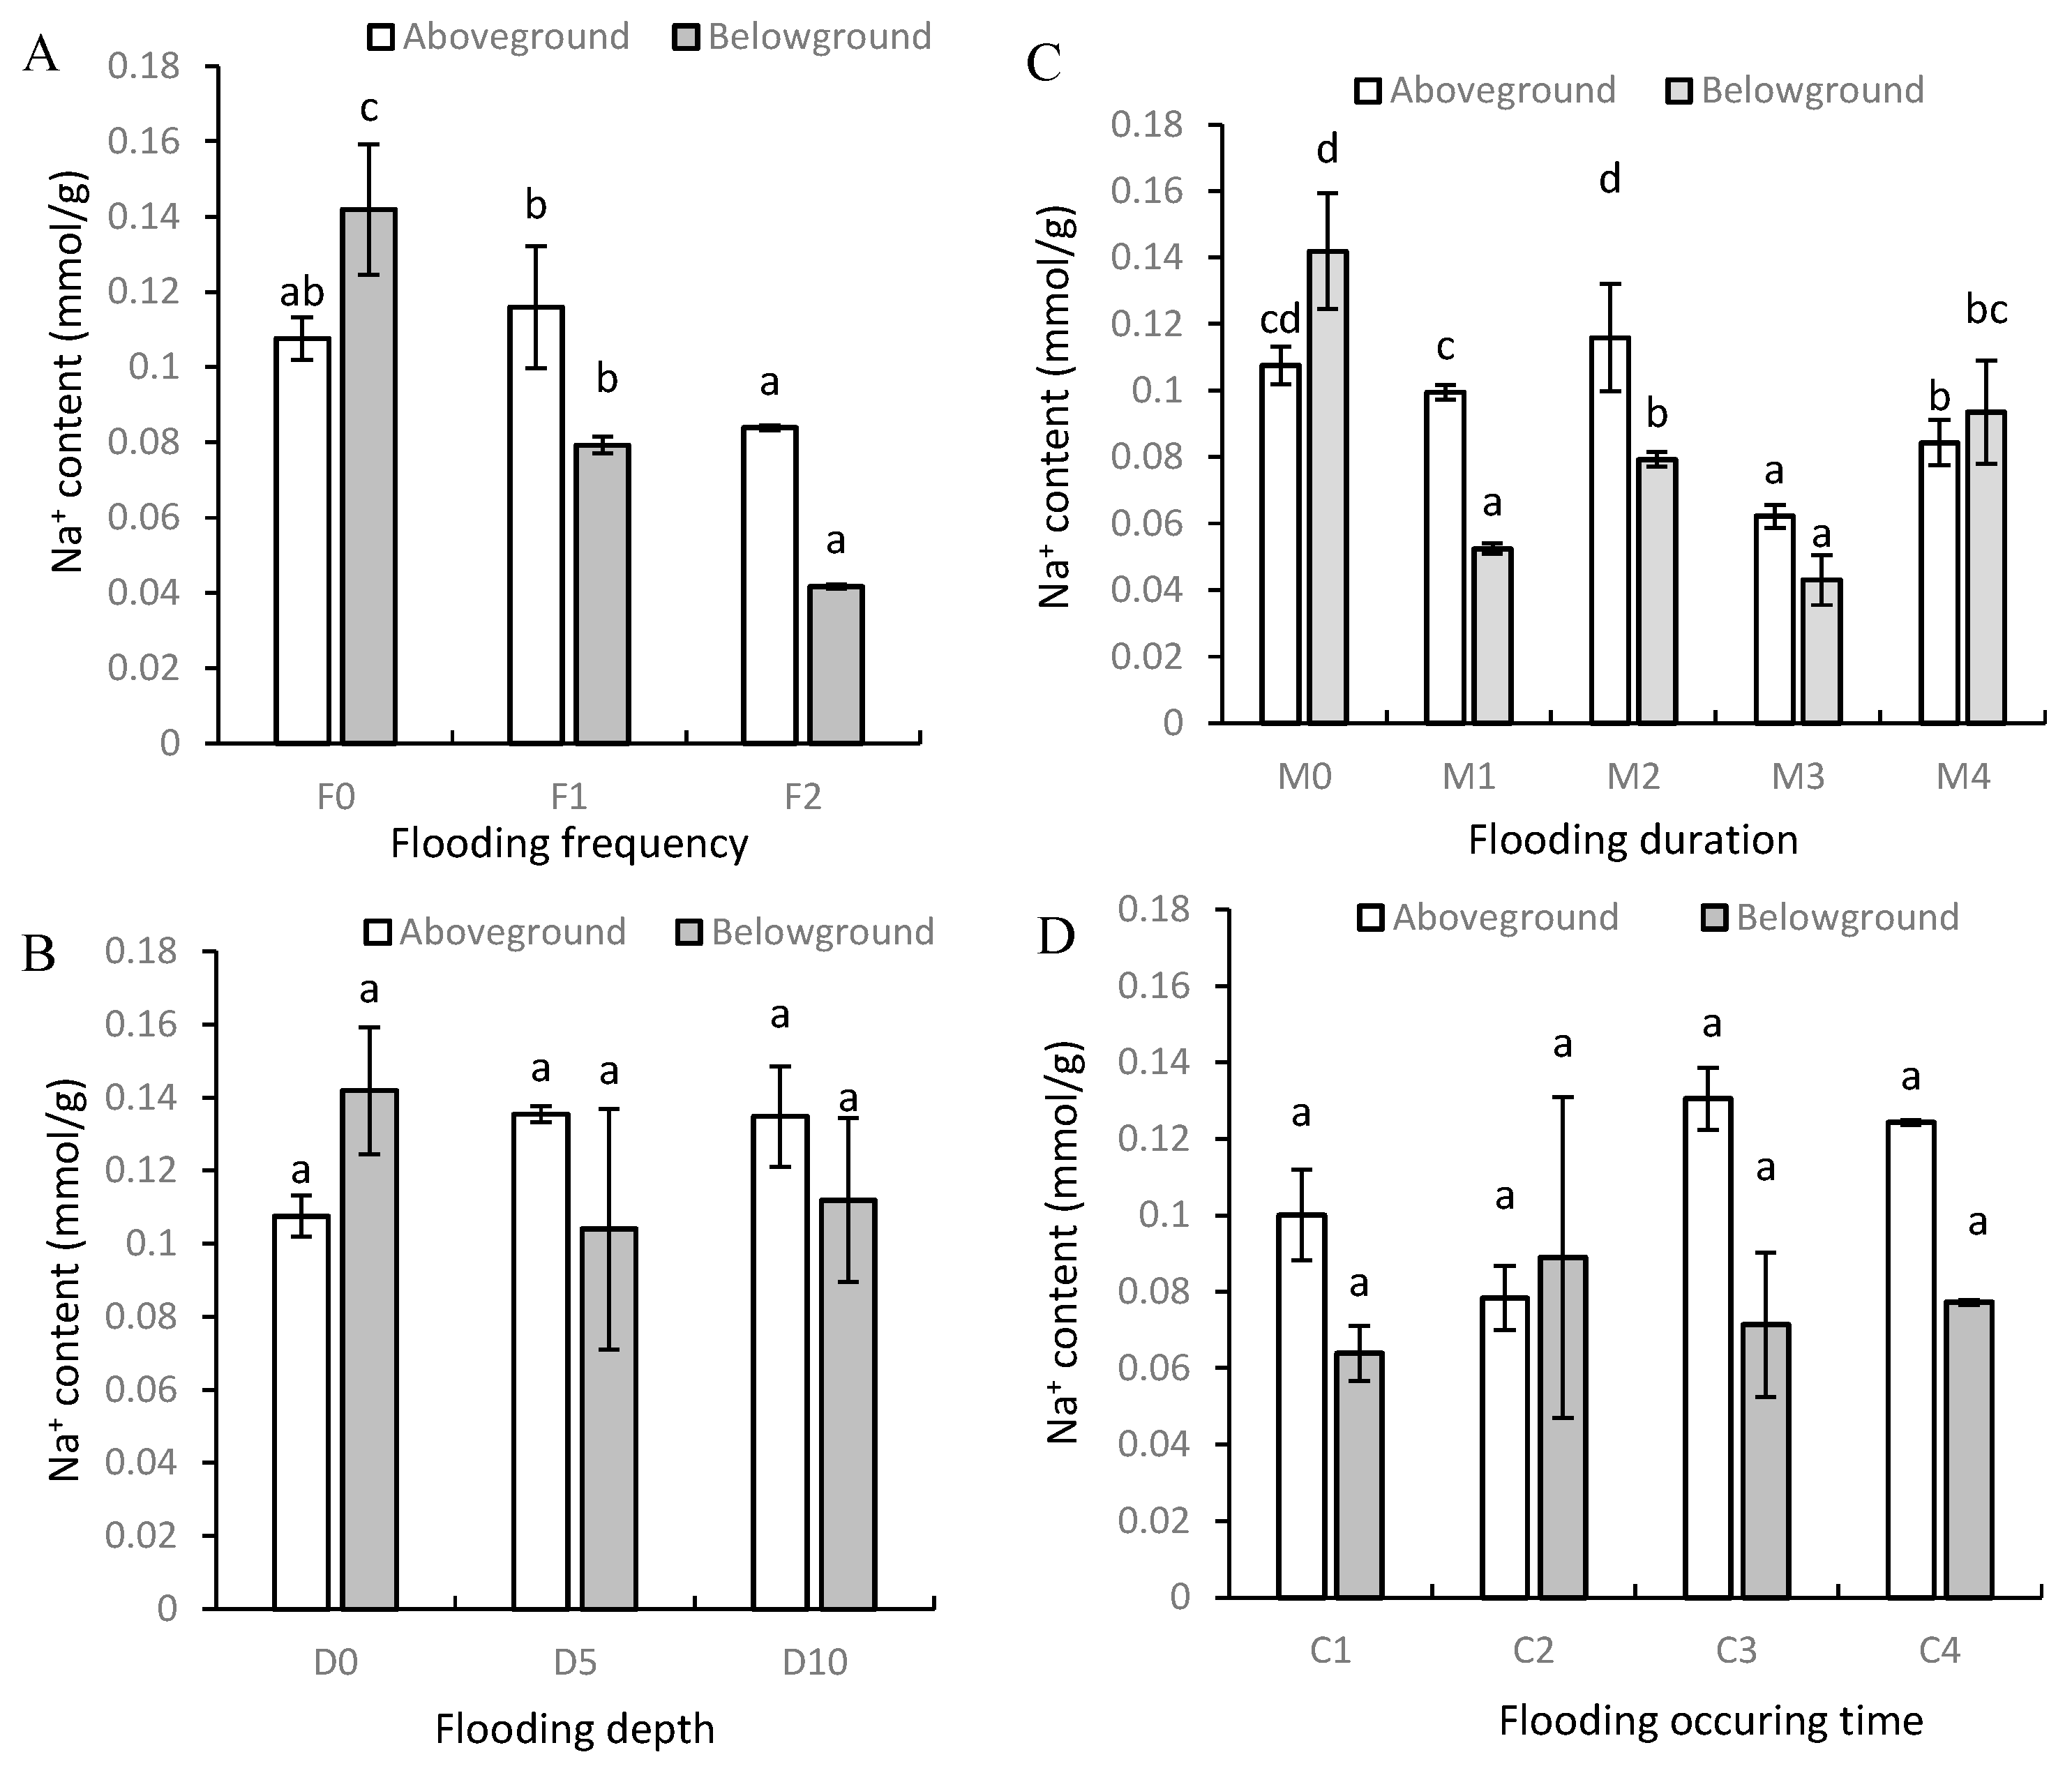
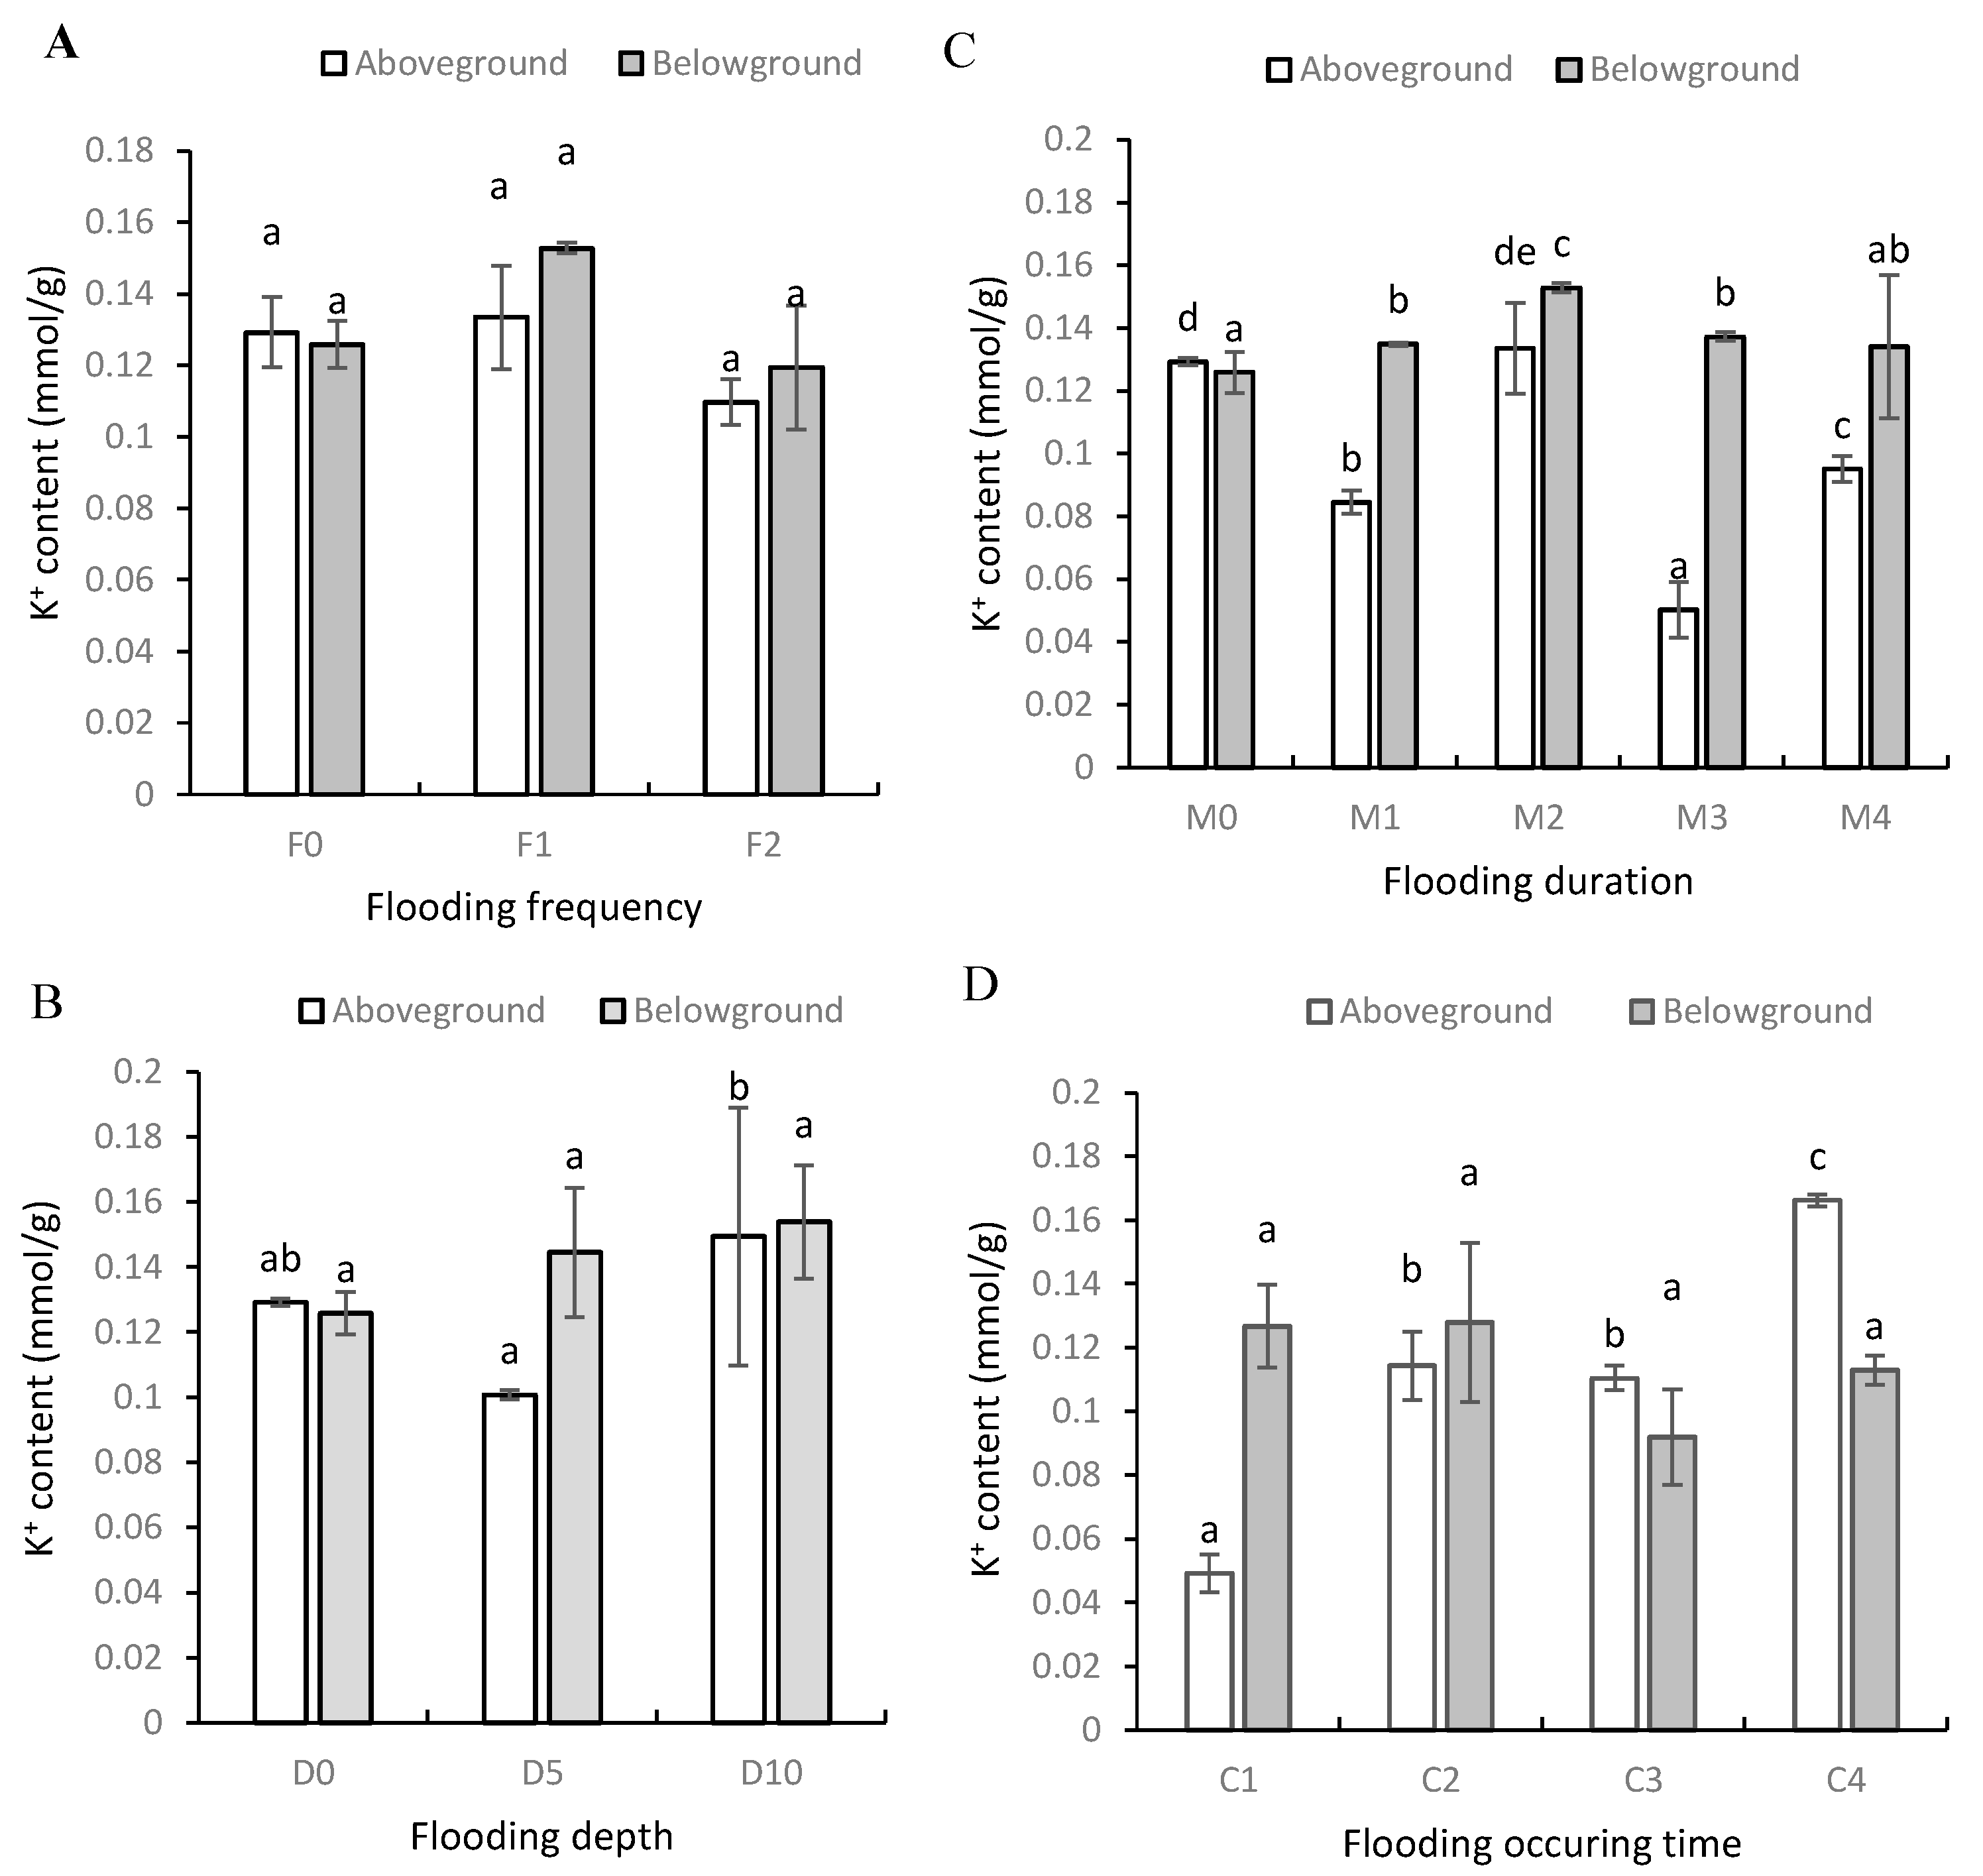
3.2. Na+ and K+ Contents

The Na+ contents of plants were affected by the flooding frequency and flooding duration (p < 0.05), but not by the flooding depth and flooding occurrence time (Table 1, Figure 5). Under the different flooding frequency treatments, the Na+ concentrations in the aboveground and belowground organs were lower under F2 compared with F0, which were 22% and 71% lower, respectively (Figure 5A). Under the different flooding duration treatments, the Na+ content of the aboveground organs was lowest under M3, and the Na+ contents of the belowground organs were lowest under M1 and M3 (Figure 5B).
The K+ contents of the aboveground organs were affected by the flooding duration, flooding depth, and flooding occurrence time, but the K+ contents of the belowground organs were only affected by the flooding duration (Table 1, Figure 6). Under the different flooding duration treatments, the K+ contents of the aboveground organs were lower under M1 and M3 compared with the control D0, but higher in the belowground organs (Figure 6B). As the flooding depth increased, the K+ contents of the aboveground organs increased significantly up to D10 (Figure 6C). As the flooding occurrence time advanced, the K+ contents of the aboveground organs increased, where the highest value was obtained under C4, and it was 29–238% higher than those under the other treatments (Figure 6D).

3.3. Photosynthetic Parameters and WUE

The photosynthetic parameters and WUE were affected by all hydrological recovery modes (p < 0.05, Table 1). The photosynthetic parameters were higher under F1 than F2 (Table 2), whereas the opposite was found for WUE, where WUE was 7.2% higher under F2 compared with F1 and Pn was 23.8% higher under F1 compared with F2. There were no significant differences in Pn, E, and WUE under D5 and D10. The photosynthetic parameters comprising Pn and E varied as the flooding duration increased, with higher values under M0 and M2, but lower values under M1, M3, and M4. WUE exhibited the opposite trend to Pn, where the photosynthetic rate was higher when WUE was lower. Similarly, the photosynthetic parameters and WUE varied under different flooding occurrence time, with higher values under C2 and C4 than C1 and C3, where WUE again exhibited the opposite trend to the photosynthetic rate.

4. Discussion

The preferred habitats of P. australis are described as un-shaded, low-lying areas that are intermittently or permanently flooded with shallow still water [29], and it appears to be well adapted to growing in areas with a widely fluctuating hydroperiod [30]. An important characteristic of most wetland plants in semiarid regions is their capacity to withstand fluctuations between extended dry phases and floods [31]. However, the applied anthropogenic adjustment methods rarely consider these fluctuations when restoring wetlands. In general, the water depth and cover periods are the main factors considered by policy makers or ecological engineers when restoring marshes. Our results indicate that the flooding depth treatment had a greater effect on the plant height compared to the other three treatments, but increasing the flooding depth did not enhance the biomass accumulation (Figure 3 and Figure 4). The effects of the flooding duration and frequency on the establishment of plant species have been shown to be greater than that of the flooding depth [32]. We also found that the effects of the flooding frequency and duration were greater than those of the flooding depth on enhancing the biomass accumulation by P. australis. However, the aboveground biomass did not have a linear correlation with the flooding duration (R2 = 0.30), but instead the relationship was described by a parabolic binary equation (y = −2.6357x 2 + 18.284x − 12.34, R2 = 0.77, where x is the flooding duration and y is the aboveground biomass), which showed that the highest biomass would be achieved with a flooding duration of 2.5 months.
Our results indicated that the effects of the flooding frequency were more significant and positive compared with the other treatments (Figure 3 and Figure 4). The F2 treatment involved flooding and draining twice, and this treatment reflected hydrological conditions comprising intermittent flooding or water level fluctuations between dry phases and floods. Under F2, both the aboveground and belowground biomasses accumulated significantly, thereby indicating the positive adaptation of P. australis to growth under these conditions. The pot experiments restricted the expansion of the plant rhizomes, so the experimental heights and biomass were lower than those expected in the field, but it would be possible to lower the water depth and increase flooding frequency when restoring P. australis in wetlands, and this approach may also save water.
If the water levels are low in saline–alkaline marshland, plants will suffer from Na+ and high pH stresses. High sodic salt levels induce the expression of an amiloride resistant Na+/H+ antiporter, which could account for the remarkable tolerance of NaCl by some plants [33]. Plants then compartmentalize the sodium into one organ to reduce its transport and the harmful effects of ions on other organs [30]. In these organs, plants restrict the excess Na+ to vacuoles to facilitate their metabolic functions [30,34]. This salt tolerance mechanism is also active in P. australis when growing in degraded saline–alkaline marshes. High Na+ and low H+ concentrations outside the root cells make it easier for Na+/H+ antiporters to export H+ and import excess Na+ to support the growth of P. australis. More Na+ is then allocated to the belowground organs (rhizomes and roots) compared with the aboveground organs (stems and leaves) to reduce the damaging effects of salinity on the shoots and leaves, as found under the F0 and D0 treatments in the present study. This sodium localization disappears after hydrological recovery. Some water treatments (C1, C3 and C4), may have disrupted the salt tolerance capacity of P. australis (Figure 5D). The flooding duration and frequency markedly affected the Na+ level in the soil to reduce the absorption capacity by P. australis (Figure 5) because the Na+ ions may have been forced deeper into the soil as the flooding duration increased.
K+ is essential for all plant life and is the major cationic inorganic nutrient in most terrestrial plants [35]. When plants grow in saline soils, one of the key factors that determine salinity tolerance is the capacity to maintain a high cytosolic K+/Na+ [36]. The different hydrological recovery modes caused intermittent saline stress in P. australis, except flooding for the whole growing season (Figure 6). Compared with D0 (no water), the K+ contents decreased under the flooding duration treatments, but increased under the flooding occurrence time treatments, and remained unchanged under the flooding frequency treatments. However, the Na+/K+ contents of P. australis were higher under F2, M1, and M3, especially in the belowground organs, which coincided with the trend in the belowground biomass (Table S1). The maintenance of high Na+/K+ contents is also a positive response of P. australis to hydrological changes.
Photosynthesis is highly sensitive to the environment, where the immediate sensing of minimal environmental changes triggers a series of adjustments, thereby eventually leading to adaptation through changes in primary production [37]. P. australis exhibits high phenotypic plasticity in terms of its photosynthetic response to climatic change [38]. Our results indicated that P. australis also exhibited growth plasticity in response to water availability changes, where the height and biomass changes were mainly adjusted by Pn and WUE (Table 2). Flooding slightly affected the physiological behavior of P. australis in terms of leaf gas exchange and water relationships [39]. Biochemical and physiological measurements indicate that the leaves of P. australis utilize a C3 mechanism for carbon fixation. Zheng et al. [40] demonstrated the existence of a C3-like ecotype in swamp environments. However, the photosynthetic carbon assimilation characteristics of P. australis shift to C4 metabolism in response to increasing drought stress [41]. When P. australis adapted to long-term drought in habitats such as swamp or marshland, together with high temperature, the photosynthetic membrane structure and photosynthetic characteristics changed compared with the swamp ecotype [42].
In general, the Pn and Gs values in P. australis plants treated with hypoxia are positively correlated and Pn also has a strong positive relationship with E [39]. Clevering [43] suggested that the water depth may be a much stronger selective force for wetland plants than the nutrient availability when the water supply is restricted. In wetter habitats, the growth of P. australis is more limited by the nutrient status than the water depth [24], which may explain why we found that Pn increased in P. australis under water restriction, whereas Pn decreased when sufficient water was available (Table 2), for which a decreasing trend was found as the water depth increased under D0, D5, and D10. Relatively long-term water restriction and sufficient phases were provided under F1, and thus, Pn was higher and the biomass accumulation was greater. M4 involved flooding for the whole season and the sufficient water led to decreases or no changes in Pn and WUE compared with the control. Under different flooding durations, Pn was lower, but WUE was higher under M1 and M3, and thus, the water demand may have been greatest in these development phases for P. australis. Under C1, C2, and C4, Pn increased but WUE decreased or remained unchanged in P. australis. The four photosynthetic responses exhibited by P. australis under different hydrological recovery modes, demonstrate its high adaptability to environmental water changes.
Wetlands are increasingly being restored in many areas and these efforts aim to recover the hydrological regime in wetlands mainly by focusing on the flooding depth and time [32,44]. Our results indicated that the flooding frequency and duration are more important than the flooding depth and occurrence time, and these factors may have critical effects on the hydrologic conditions to allow the rapid recovery of P. australis populations. These findings may be integrated into methods for effectively improving saline–alkali soil to facilitate the restoration and conservation of wetlands. Our findings indicated that precipitation may be the main issue on Songnen Plain because it may have led to different flooding frequencies. Decreased precipitation is a key factor that affects wetland systems by changing hydrological regimes [44]. Thus, we consider that policy makers should not focus only on the flooding depth and time, but instead flooding cycles should be artificially implemented. Our findings may help to meet the demand for constructing an ecological civilization in China, and the Central Committee of the Communist Party of China and the State Council of the People’s Republic of China clearly stated that the wetland area should not be less than 800 million acres by 2020.
This study had some limitations. In particular, the experimental period was short and the plants were grown in pots, so the treatments did not compare with the actual situations in wetlands. Thus, we could not determine restoration thresholds for different hydrological variables, and our results might not be applicable to actual wetland restoration situations. However, we found that the flooding frequency and duration may be crucial for the successful restoration of channeled man-made systems, and our results also have implications for wetland management in the presence of P. australis.

5. Conclusions

In this study, we investigated the effective hydrological recovery of P. australis populations in a degraded semiarid wetland in China by considering the Songnen Plain saline-alkaline wetland as a case study. Our results indicated that all hydrological recovery modes had significant effects on the plant biomass, saline ion concentrations, photosynthesis, and WUE. Increasing the flooding duration and flooding depth had positive effects on the height of P. australis, and increasing the flooding frequency enhanced the accumulated biomass. A moderate flooding duration (3 months in the early growing season) and flooding frequency (flooding and draining twice) markedly reduced the absorption of Na+ by P. australis, where the former decreased the K+ level, whereas the latter left the K+ level unchanged. P. australis exhibited positive physiological responses to different hydrological recovery modes by adjusting its photosynthetic rate and WUE. Our results indicate that it may be possible to lower the water depth, reduce the flooding duration, and increase the flooding frequency to enhance P. australis production and save water. Our results suggest that the flooding frequency and duration are more important than the flooding depth and occurrence time, and these findings may facilitate the implementation of more effective wetland restoration strategies.

Supplementary Materials

The following are available online at https://www.mdpi.com/2071-1050/12/23/10103/s1, Table S1: Pearson correlation analysis among different indicators.

Author Contributions

Conceptualization, S.Y. and X.L.; data curation, X.L.; formal analysis, Z.D., Y.Y.; funding acquisition, S.Y, X.L. and N.Z.; methodology, X.L.; project administration, X.L. and N.Z.; resources, Y.Y., S.A. and Z.D.; software, Z.D. and S.A.; supervision, X.L. and N.Z.; validation, N.Z.; investigation, Y.Y., S.A. and Z.D.; writing—original draft, S.Y. and Y.Y.; writing—review and editing, S.Y. and X.L.; visualization, X.L. All authors have read and agreed to the published version of the manuscript.

Funding

This research was funded by [the Key Project of National Natural Science Foundation of China] grant number [51639001], and [National Natural Science Foundation of China] grant number [41771550, 31100403], and [the Natural Science Research Project of colleges and universities in Jiangsu Province] grant number [19KJB170022].

Acknowledgments

The research was funded by the National Natural Science Foundation of China (41771550, 31100403, 41877024), and the Natural Science Research Project of colleges and universities in Jiangsu Province (19KJB170022).

Conflicts of Interest

The authors declare no conflict of interest. The National Natural Science Foundation of China (31100403) was the funding sponsors in the choice of research project; design of the study; in the collection, analyses or interpretation of data. The National Natural Science Foundation of China (41771550), the Key Project of National Natural Science Foundation of China (51639001) and the Natural Science Research Project of colleges and universities in Jiangsu Province (19KJB170022) were the funding sponsors in the writing of the manuscript; and in the decision to publish the results.

References

  1. Qin, P.; Mitsch, W.J. Wetland restoration and ecological engineering: International conference of wetland restoration and ecological engineering. Ecol. Eng. 2009, 35, 437–441. [Google Scholar] [CrossRef]
  2. Bai, J.; Cui, B.; Cao, H.; Li, A.; Zhang, B. Wetlands degradation and ecological restoration. Sci. World J. 2013. [Google Scholar] [CrossRef]
  3. Mitsch, W.J.; Gosselink, J.G. Wetlands, 5th ed.; John Wiley and Sons: New York, NY, USA, 2015. [Google Scholar]
  4. Sullivan, P.L.; Gaiser, E.E.; Surratt, D.; Rudnick, D.T.; Davis, S.E.; Sklar, F.H. Wetland ecosystem response to hydrologic restoration and management: The Everglades and its urban-agricultural boundary (FL, U.S.A.). Wetlands 2014, 34, 1–8. [Google Scholar] [CrossRef]
  5. Miller, R.L.; Fujii, R. Plant community, primary productivity, and environmental conditions following wetland re-establishment in the Sacramento-San Joaquin Delta, California. Wetl. Ecol. Manag. 2010, 18, 1–16. [Google Scholar] [CrossRef]
  6. Wen, B.L.; Liu, X.T.; Li, X.J.; Yang, F.Y.; Li, X.Y. Restoration and rational use of degraded saline reed wetlands: A case study in western Songnen Plain, China. Chin. Geogra Sci. 2012, 22, 1–11. [Google Scholar] [CrossRef]
  7. Li, X.Y.; Liu, X.T.; Li, X.J.; Lin, J.; Wen, B. Growth and physiological response of organs of Phragmites australis to different water compensation in degraded wetlands. Wetl. Sci. 2012, 10, 23–31, (English edition of Chinses Journal). [Google Scholar]
  8. Manivannan, P.; Jaleel, C.A.; Kishorekumar, A.; Sankar, B.; Somasundaram, R.; Sridharan, R.; Panneerselvam, R. Changes in antioxidant metabolism of Vigna unguiculate (L.) Walp. by propiconazole under water deficit stress. Colloids Surf. B Biointerfaces 2007, 57, 69–74. [Google Scholar] [CrossRef]
  9. Yang, F.Y.; Li, X.J.; Liu, X.T.; Sun, L. Recovery pattern of degradation saline-alkaline reed wetland in the Songnen Plain. Wetl. Sci. 2009, 7, 306–313, (In Chinese with English Abstract). [Google Scholar]
  10. Epting, R.J.; Robison, C.P.; Reddi, R.C. Gauge Record Hydrologic Statistics: Indicators for Lake Classification. Environ. Bioindic. 2008, 3, 193–204. [Google Scholar] [CrossRef]
  11. Barrett, R.; Nielsen, D.L.; Croome, R. Associations between the plant communities of floodplain wetlands, water regime and wetland type. River Res. Appl. 2010, 26, 866–876. [Google Scholar] [CrossRef]
  12. Toth, L.A. Restoration response of relict broadleaf marshes to increased water depths. Wetlands 2010, 30, 263–274. [Google Scholar] [CrossRef]
  13. Jackson, M.B.; Armstrong, W. Formation of aerenchyma and the processes of plant ventilation in relation to soil flooding and submergence. Plant. Biol. 1999, 1, 274–287. [Google Scholar] [CrossRef]
  14. Li, X.Y.; Wen, B.L.; Yang, F.; Hartley, A.; Li, X. Effects of alternate flooding-drought conditions on degenerated Phragmites australis salt marsh in Northeast China. Restor. Ecol. 2017, 25, 810–819. [Google Scholar] [CrossRef]
  15. Guan, Y.; Liu, G.; Liu, Q. The study of salt-affected soils in the Yellow River delta based on remote sensing. J. Remote Sens. 2001, 5, 46–52. [Google Scholar]
  16. Li, Y.Y.; Zhao, K.; Ding, Y.L.; Ren, J.H. An empirical method for soil salinity and moisture inversion in west of Jilin. In 2013 the International Conference on Remote Sensing, Environment and Transportation Engineering (RSETE 2013), Nanjing, China, 26 July 2013; Atlantis Press: Paris, France, 2013; pp. 19–21. [Google Scholar]
  17. Qiu, S.W.; Wang, X.K.; Zhang, S.Q.; Lian, Y.; Zhang, Z.Q.; Zhu, J.H. The evolution of the large paleolake in Songnen Plain and its formation. Quat. Sci. 2012, 32, 1011–1021, (In Chinese with English Abstract). [Google Scholar]
  18. Yang, B.G.; Sun, Z.C.; Lv, J.F. The changes of Songhua-Liao River system. Geogr. Res. 1983, 2, 48–56, (Chinese with English Abstract). [Google Scholar]
  19. Liu, X. Management on Degraded Land and Agricultural Development in the Songnen Plain; Science Press: Beijing, China, 2001; p. 64. [Google Scholar]
  20. Wang, Z.; Huang, N.; Luo, L.; Li, X.; Ren, C.; Song, K.; Chen, J.M. Shrinkage and fragmentation of marshes in the West Songnen Plain, China, from 1954 to 2008 and its possible causes. Int. J. Appl. Earth Obs. 2011, 13, 477–486. [Google Scholar] [CrossRef]
  21. Pagter, M.; Bragato, C.; Brix, H. Tolerance and physiological responses of Phragmites australis to water deficit. Aquat. Bot. 2005, 81, 285–299. [Google Scholar] [CrossRef]
  22. Mauchamp, A.; Mehty, M. Submergence-induced damage of photosynthetic apparatus in Phragmites australis. Environ. Exp. Bot. 2004, 51, 227–235. [Google Scholar] [CrossRef]
  23. Vretare, V.; Weisner, S.E.B.; Strand, J.A.; Granéli, W. Phenotypic plasticity in Phragmites australis as a functional response to water depth. Aquat. Bot. 2001, 69, 263–274. [Google Scholar] [CrossRef]
  24. Engloner, A.I. Annual growth dynamics and morphological differences of reed (Phragmites australis [Cav.] Trin. Ex Steudel) in relation to water supply. Flora 2004, 199, 256–262. [Google Scholar] [CrossRef]
  25. Wang, X.H.; Tong, S.Z.; Lu, X.G. The ecological characteristics dynamic of Phragmites australis community in wetland of Semi-arid areas-A case of Momoge Wetland. Wetl. Sci. 2008, 6, 386–391, (In Chinese with English Abstract). [Google Scholar]
  26. Li, X.Y.; Qi, M.M.; Li, C.; Li, X.J.; Liu, X.T.; Wang, Y.; Lin, J. Effects of flooding occurrence time and duration on P. australis growth and soil physical-chemical characteristics in degraded inland marshes. Res. Soil Water Conserv. 2016, 23, 83–89, (In Chinese with English abstract). [Google Scholar]
  27. Sloey, T.M.; Howard, R.J.; Hester, M.W. Response of Schoenoplectus acutus and Schoenoplectus californicus at different life-history stages to hydrologic regime. Wetlands 2016, 36, 37–46. [Google Scholar] [CrossRef]
  28. Li, X.Y.; Liu, J.J.; Zhang, Y.T.; Ma, C.S. Physiological responses and adaptive strategies of wheat seedlings to salt and alkali stresses. Soil Sci. Plant. Nutr. 2009, 55, 680–684. [Google Scholar] [CrossRef]
  29. Haslam, S.M. Biological flora of the British Isles Phragmites communis Trin. J. Ecol. 1972, 60, 585–610. [Google Scholar] [CrossRef]
  30. Parida, A.K.; Das, A.B. Salt tolerance and salinity effects on plants: A review. Ecotox. Environ. Safe. 2005, 60, 324–349. [Google Scholar] [CrossRef]
  31. Vivian, L.M.; Godfree, R.C.; Colloff, M.J.; Mayence, C.E.; Marshall, D.J. Wetland plant growth under contrasting water regimes associated with river regulation and drought: Implications for environmental water management. Plant. Ecol. 2014, 215, 997–1011. [Google Scholar] [CrossRef]
  32. Casanova, M.T.; Brock, M.A. How do depth, duration and frequency of flooding influence the establishment of wetland plant communities. Plant. Ecol. 2000, 147, 237–250. [Google Scholar] [CrossRef]
  33. Tartari, A.; Forlani, G. Osmotic adjustments in a psychrophilic alga, Xanthonema sp. (Xanthophyceae). Environ. Exp. Bot. 2008, 63, 342–350. [Google Scholar] [CrossRef]
  34. Zhu, G.L.; Deng, X.W.; Zuo, W.N. Determination of free proline in plants. Plant. Physiol. Commun. 1983, 1, 35–37. [Google Scholar]
  35. Li, X.Y.; Mu, C.S.; Lin, J.X.; Wang, Y.; Li, X.J. Effect of alkaline potassium and sodium salts on growth, photosynthesis, ions absorption and solutes synthesis of wheat seedlings. Exp. Agr. 2014, 50, 144–157. [Google Scholar] [CrossRef]
  36. Ashraf, M.; Rahmatullah; Ahmad, R.; Bhatti, A.S.; Afzal, M.; Sarwar, A.; Maqsood, M.A.; Kanwal, S. Amelioration of salt stress in Sugar cane (Saccharum officinarum L.) by supplying potassium and siliconin hydroponics. Pedosphere 2010, 20, 153–162. [Google Scholar] [CrossRef]
  37. Centritto, M.; Loreto, F. Photosynthesis in a changing world: Photosynthesis and abiotic stresses. Agr. Ecosyst. Environ. 2005, 106, 115–117. [Google Scholar] [CrossRef]
  38. Lessmann, J.M.; Brix, H.; Bauer, V.; Clevering, O.A.; Comıín, F.A. Effect of climatic gradients on the photosynthetic responses of four Phragmites australis populations. Aquat. Bot. 2001, 69, 109–126. [Google Scholar] [CrossRef]
  39. Gorai, M.; Ennajeh, M.; Song, J.; Khemira, H.; Neffati, M. Changes in leaf gas exchange, water relations, biomass production and solute accumulation in Phragmites australis under hypoxic conditions. Acta Ecol. Sin. 2011, 31, 97–102. [Google Scholar] [CrossRef]
  40. Zheng, W.J.; Zheng, X.P.; Zhang, C.L. A survey of photosynthetic carbon metabolism in 4 ecotypes of Phragmites australis in northwest China: Leaf anatomy, ultrastructure, and activities of ribulose1, 5- bisphosphate carboxylase, phosphoenolpyruvate carboxylase and glycollate oxidase. Physiol. Plant. 2000, 110, 201–208. [Google Scholar] [CrossRef]
  41. Gong, C.M.; Bai, J.; Deng, J.M.; Wang, G.X.; Liu, X.P. Leaf anatomy and photosynthetic carbon metabolic characteristic in Phragmites communis in different soil water availability. Plant. Ecol. 2011, 212, 675–687. [Google Scholar] [CrossRef]
  42. Zhu, X.Y.; Wang, S.M.; Zhang, C.L. Composition and characteristic difference in photosynthetic membranes of two ecotypes of Reed (Phragmites communis L.) from different habitats. Photosynthestica 2003, 41, 97–104. [Google Scholar] [CrossRef]
  43. Clevering, O.A.; Lissner, J. Taxonomy, chromosome numbers, clonal diversity and population dynamics of Phragmites australis. Aquat. Bot. 1999, 64, 185–208. [Google Scholar] [CrossRef]
  44. Liu, B.; Jiang, M.; Tong, S.; Zhang, W.; Wu, H.; Liu, Y.; Lu, X. Differential flooding impacts on Echinochloa caudata and Scirpus planiculmis: Implications for weed control in wetlands. Wetlands 2016, 36, 979–984. [Google Scholar] [CrossRef]
Figure 1. Map of the study site, (A) the location of Niuxintaobao Wetland in Songnen Plain (cited from [20], and (B) the sampling location in Niuxintaobao wetland in this study.
Sustainability 12 10103 g001
Figure 2. Flooding frequency, depth, duration and occurring time treatments.
Sustainability 12 10103 g002
Figure 3. Effects of flooding frequency (A), depth (B), duration (C), and occurrence time (D) on height of P. australis. Note: Different letters indicate significant differences (p < 0.05).
Sustainability 12 10103 g003
Figure 4. Effects of flooding frequency (A), depth (B), duration (C), and occurrence time (D) on biomass of P. australis (per pot). Note: Different letters in the same columns indicate significant differences (p < 0.05).
Sustainability 12 10103 g004
Figure 5. Effects of flooding frequency (A), depth (B), duration (C), and occurrence time (D) on Na+ contents of P. australis. Note: Different letters in the same columns indicate significant differences (p < 0.05).
Sustainability 12 10103 g005
Figure 6. Effects of flooding frequency (A), depth (B), duration (C), and occurrence time (D) on K+ contents of P. australis. Note: Different letters in the same columns indicate significant differences (p < 0.05).
Sustainability 12 10103 g006
Table 1. ANOVA analysis of hydrological condition effects on P. australis.
Flooding FrequencyFlooding DepthFlooding DurationFlooding Occurring Time
Height ******ns
Biomass (A)********
Biomass (B)********
Na+ (A)**ns**ns
Na+ (B)**ns**ns
K+ (A)*******
K+ (B)**ns**ns
Pn********
Gs********
E********
Water use efficiency (WUE)********
Note: * indicates significance in the same parameters and hydrological treatments (p <0.05), ** indicates extreme significance in the same parameters and hydrological treatments (p <0.01), ns indicates no significant in the same parameters and hydrological treatments.
Table 2. Photosynthesis parameters and water use efficiency (WUE) under different hydrological conditions.
Pn (μmol CO2 m−2 s−1)Gs (mmol H2O m−2 s−1)E (mmol H2O m−2 s−1)WUE (g/kg)
Flooding Frequency
F014.65 ± 0.65a0.19 ± 0.02a5.73 ± 0.53a2.56 ± 0.13a
F121.54 ± 0.46b0.33 ± 0.02b8.51 ± 0.39b2.93 ± 0.39a
F217.40 ± 0.21c0.25 ± 0.01c5.53 ± 0.14a3.14 ± 0.07b
Flooding Depth
D014.65 ± 0.65b0.19 ± 0.02c5.73 ± 0.53b2.56 ± 0.13a
D510.57 ± 0.35a0.13 ± 0.00a3.81 ± 0.13a2.77 ± 0.08a
D1010.55 ± 0.33a0.15 ± 0.00b4.02 ± 0.05a2.62 ± 0.08a
Flooding Duration
M014.65 ± 2.05c0.19 ± 0.05c5.73 ± 1.67d2.67 ± 0.13b
M18.55 ± 1.36b0.03 ± 0.03a0.90 ± 0.81a11.18 ± 0.58d
M221.54 ± 0.46d0.33 ± 0.02d8.51 ± 0.39e2.93 ± 0.39b
M39.18 ± 0.80b0.05 ± 0.01a1.61 ± 0.30b5.85 ± 0.47c
M44.26 ± 1.83a0.16 ± 0.04b4.10 ± 0.86c0.98 ± 0.07a
Flooding Occurring Time
C111.62 ± 0.13b0.14 ± 0.01b4.02 ± 0.14b2.95 ± 0.09c
C216.25 ± 0.26d0.30 ± 0.00d7.51 ± 0.11d2.16 ± 0.01a
C39.73 ± 0.15a0.08 ± 0.00a2.46 ± 0.08a4.01 ± 0.09d
C415.58 ± 0.31c0.22 ± 0.01c6.24 ± 0.18c2.51 ± 0.03b
Note: Different letters indicate significance in the same parameters and hydrological treatments (p < 0.05).
Publisher’s Note: MDPI stays neutral with regard to jurisdictional claims in published maps and institutional affiliations.

