Abstract
In this study, the water quality of the irrigation system and concentration of trace metals in the sediments were combined to establish a farmland trace metal contamination and management model (FTM_CMM). The purpose of this model was to clarify the main sources of the trace metals that have caused the contamination of paddy soil in central Taiwan. The results of the model simulation showed that the trace metals in the paddy soil mainly came from the irrigation water and especially from the sediments in the irrigation channels. The contribution of the sediments in the irrigation channel to the individual trace metals in the paddy soil ranged from 56% to 72% as the contributions for Cr, Cu, Ni, and Zn were 72%, 68%, 56%, and 62%, respectively. The trace metal species according to their concentration in the contaminated soil ranked in the order of Zn > Cr ≈ Cu > Ni, which is about the same as in the channel sediment. During the simulation process, Cr, Cu, Ni, and Zn exceeded the control standards for farmlands in the 18th, 12th, 13th, and 17th years, respectively. This highlights that, in addition to the management of irrigation water quality, the management of trace metal contaminated sediment in adjacent canal irrigation systems is also an important part of the prevention of trace metal contamination in farmland.
1. Introduction
The harmful effects of environmental contamination were often ignored in the past because economic development was always given the first priority. However, once the problems from contamination emerge, there are often considerable social costs that must be paid. In Taiwan, agricultural soils contaminated with trace metals (TMs) are an obvious example. In past decades, due to the negligence of the competent authorities, farmland irrigation and drainage systems in Taiwan used the same channels, which caused TM-containing industrial wastewater to be discharged directly into irrigation channels, thus contaminating farmlands with TMs [1,2]. Due to the low mobility of TMs in a soil environment [3], they are not easily diffused or diluted, so they easily accumulate in surface soil. Soil contaminated with TMs in agricultural areas is likely to affect people’s health and safety once the TMs have translocated into the edible parts of crops [4,5]. TMs also affect the growth and quality of crops [6]. Over past decades, the Taiwanese government has spent billions of dollars on farmland pollution control and remediation. According to data from the Environmental Protection Agency of Taiwan (EPA Taiwan), as of the end of 2018, a total of 1138.5 hectares of farmland sites across Taiwan have been declared as contaminated. A total of approximately USD 60 million has been allocated as expenditures for soil remediation on f-armlands [7].
In order to prevent pollutants from directly entering the human body through the food chain and to safeguard people’s health, EPA Taiwan began performing soil contamination investigations in 1983 [8]. First, the farmland soil on which edible crops were grown was given priority for contamination prevention and control. Then, a systematic and nationwide survey on TM contamination in agricultural lands was launched. The survey included eight TMs and was divided into five stages that spanned from the development of a 1600-hectare grid of a large sampling area to the detailed investigation of small single-hectare sampling areas. Originally, grid sampling was the standard procedure for the soil surveillance performed by environmental protection and agricultural authorities. However, this type of study excludes the connection between the contaminants in paddy soils and those in the irrigation water. Based on the characteristics of the various sources of TMs in paddy soil, farmland contamination is closely related to the water source of the irrigation channel as TMs are transmitted through the channel. Many studies have used a kriging and mapping system to investigate the relationship between anthropogenic activities and the distribution of soil contamination [9,10,11,12]. These results have pointed out that the spatial distribution of TMs in contaminated soils is strongly related to the location of industrial plants and irrigation systems and that the most important contaminants are TMs such as chromium (Cr), copper (Cu), nickel (Ni), and zinc (Zn).
For paddy soils where the TM content exceeds the control standards announced by EPA Taiwan, statistical analysis with paired t-tests, the correlation between the TM content in the topsoil and that in the corresponding aqueduct sediments and irrigation water has been determined to be 86% and 57%, respectively [13]. Furthermore, it can be inferred that the factories in nearby areas have made a significant contribution to the occurrence of TM contamination [14]. Industrial wastewater discharged into irrigation channels and then used as irrigation water by farmers has resulted in the accumulation of TMs in farmland soils. In addition, many studies in the past have shown that farmland contamination is closely related to irrigation and drainage systems, especially when irrigation water is contaminated by the wastewater from factories [1,15].
However, there have been few past studies that have discussed the direct and cumulative effects of channel water quality and sediment TM concentrations on the TMs in paddy soil. In this study, the water quality of the irrigation system and the concentrations of TMs in the sediment were combined to establish a farmland TM contamination and management model (FTM_CMM), which may be used to understand the main sources of TMs in paddy soil and to provide direction to the development of current contamination control strategies and farmland conservation programs. As a result, this proposed screening method can effectively target a contaminated area and provide government agencies the ability to enforce farmland management, investigation, and restoration effectively.
2. Materials and Methods
2.1. Establishment of Background Information
The target paddy soils that were studied are located in central Taiwan and have been heavily contaminated with TMs, including Cr, Cu, Ni, and Zn. The irrigation water is supplied by the East–West Second Canal irrigation system, one of the major irrigation systems in Changhua County. The process of this study is shown in Figure 1 and included the following main steps:
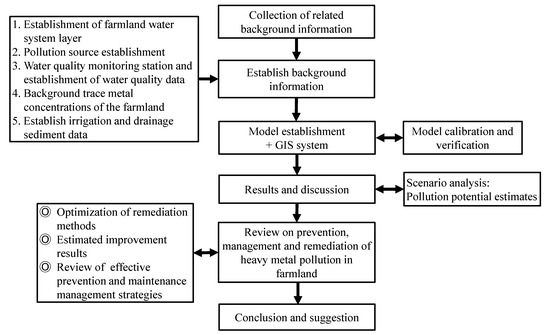
Figure 1.
The main procedures of this study.
- The collection of the related background information.
- The establishment of the background information.
- The model establishment and application of the GIS (Geographic Information System).
- Results and discussion.
- Review of the prevention, management, and remediation of TM-contaminated farmland.
- Conclusions and suggestions.
2.2. Model Development
The FTM_CMM uses the concept of mass balance to calculate the input and output of TMs in paddy soils. The accumulation of TMs in soil mainly comes from external sources, such as irrigation water, irrigation channel sediment, fertilizers, and atmospheric deposition (Figure 2). When irrigation water is used in a paddy field, irrigation water and sediments containing TMs are also introduced, which accumulate in the paddy soil due to soil physical or chemical adsorption and sedimentation. In addition, the use of TM-containing fertilizers and atmospheric deposition can increase the TM content of soil. In contrast, a decrease in the TM concentration in soil can occur through runoff, percolation, and plant uptake processes. The total mass of soil TMs can be written as a one-dimensional conservation equation:
Mac,i = ΣMin,i − ΣMout,i
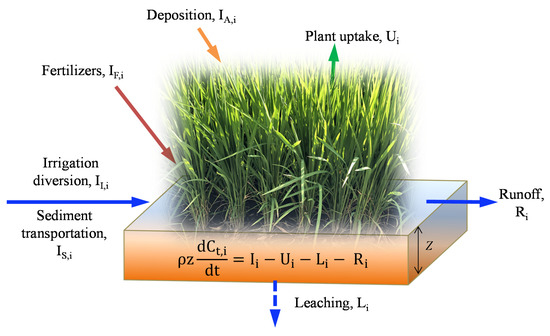
Figure 2.
Mass balance of trace metals (TMs) in the paddy soil as affected by different paths.
Or expressed as:
Ct,i (t) = C0,i + Cac,i (t)t
Among these values, Min,i refers to the different paths for TMs of type i to be input into the soil, Mout,i refers to the different paths for TMs of type i to be released from the soil, and Mac,i is TMs of type i that are being accumulated in the soil. C0,i refers to the background total metal concentration of i type TMs in the soil, Ct,i (t) refers to total TM concentration of type i at the time of t, and Cac,i (t) refers to the accumulated TM concentration rate of type i in the soil at the period time of t. Assuming that the soil properties have not changed during the simulation, the change in the mass of TMs per unit volume or weight is equivalent to the change in concentration.
2.2.1. Mass Balance Equation
Since the topsoil (plough layer) of a paddy field is regularly plowed twice a year, the TMs at a fixed depth (usually 20 cm in Taiwan) are completely mixed and the concentration is not affected by vertical depth or horizontal position. Using a homogeneous soil layer of a fixed depth (z) and bulk density (ρ) can simplify the calculation of the model. The mass balance for TMs in the homogeneous mixing soil can be expressed by the following equation [16,17,18]:
The total type i TM content of the plough layer system (topsoil), Ct,i (mg/kg), depends on the input rate at the soil surface, Ii (mg/m2/year); output rate consisting of the removal rate in the harvested products, Ui (mg/m2/year); the leaching rate in the soil lower layer, Li (mg/m2/year); and the runoff rate at the soil surface, Ri (mg/m2/year).
2.2.2. External Inputs
The input sources of TMs (Ii) in agricultural soil may include the following: the introduction of irrigation water, II,i (mg/m2/year); fertilizer use, IF,i (mg/m2/year); atmospheric deposition, IA,i (mg/m2/year); and alluvial sediment carried from irrigation channels to paddy soil, IS,i (mg/m2/year), which can be represented as follows:
Ii = II,i + IF,i + IA,i + IS,i +…
2.2.3. Estimation of TMs from Irrigation Water
The sources of TMs in canal irrigation systems include the transport of irrigation water and sediment in each square meter. The annual runoff volume, QR (m3/m2/year), can be calculated from the field water balance expressed as
where QI (m3/m2/year) is irrigation, QP (m3/m2/year) is precipitation, ET (m3/m2/year) is evapotranspiration, and QL (m3/m2/year) is percolation within each unit area per year. In addition, the different mass transportation paths can be expressed as the following equations, respectively:
where CWI,i (mg/m3) is the TM concentration in irrigation water for type i and CWR,i (mg/m3) is TM concentration in drainage (runoff) water for type i.
QR = QI + QP − ET − QL
II,i = QI × CWI,i
Ri = QR × CWR,i
2.2.4. TM Adsorption
In soil, TMs may be combined with soil particles, the organic matter present in soil, or dissolved in the soil solution. The TMs in the water–soil–plant systems depend on their concentrations in the dissolved form. The total TM concentration can be expressed as
where Kf,i denotes the partition coefficients (mg(1−n)/kg·(m3)n) and n denotes the sorption parameter (unitless). θ denotes the moisture content of the soil (m3/m3). The former term of the above equation indicates that TMs are adsorbed in the soil, and the manner of this adsorption can be expressed by the Freundlich isothermal adsorption equation [16]. The latter term represents the phase of the TMs in the soil solution. The model assumes that under homogeneous conditions, the total concentration of trace metals in the plough layer includes solid phase and solution phase. In paddy soil, linear adsorption isotherms (n = 1) are observed for TMs [17].
Ct,i = ρ Kf,i CWI,in + θCWI,I
2.2.5. Bottom Sediments
When farmland is in the process of diversion irrigation, the irrigation water may washout bottom sediment that contains TMs, IS,i (mg/m2/year), in the channel into the farmland. The TMs in the sediment will also enter the paddy soil, and b (unitless) is the specific thickness ratio or the weight ratio of the bottom sediment washout in the paddy soil per year. CS,i (mg/kg) is the content of TMs in the bottom sediment. It is assumed that the mass and concentration of the sediment will not change during the process of transporting to the paddy field, and the boundary conditions of the plough layer will not be affected. This can be expressed as
IS,i = b × CS,i
2.2.6. Atmospheric Deposition and Fertilizers
Wet and dry atmospheric deposition may also contain TMs. Its flux can be expressed as IA,i (mg/m2/year). It is related to the amount of atmospheric deposition, DA (kg/m2/year) and the content of TMs in the deposition (or dust fall), CA,i (mg/kg). DA refers to the average weight of the deposition in each square meter area of paddy soil per year. In order to simplify the model, atmospheric deposition is represented by dust fall (the particle size is about 10–100 μm). When dust fall enters the topsoil, it is regarded as completely mixed, and its properties are the same as that of the topsoil and do not consider the proportion of the dissolved constituents in the falling dust.
IA,i = DA × CA,i
Fertilizers are often applied during cultivation, and TMs in fertilizers may also accumulate in the soil. Considering that the cumulative flux of fertilizer use, IF,i (mg/m2/year), is related to annual fertilization, WF (kg/m2/year), and different TM contents, CF,i (mg/kg), then this can be expressed as
where ΣWF means the total average weight of different fertilization applied in each square meter area of soil in each year. Based on individual fertilizer usage and TM content, the total amount of TM accumulation in the soil can be obtained. Because different chemical fertilizers are mainly used in the study area, it is assumed that all the fertilizers are 100% soluble.
IF,i = ΣWF × CF,i
2.2.7. Leaching
Leaching, Li (mg/m2/year), is one TM output pathway from soil. It always relates to the rate of percolation, v (m/year); the thickness of the soil layer, z (m); and the TM concentration in the soil, Ct,i (mg/kg). When the TMs have a low concentration, the concentration gradient in the different soil layers and depths can be ignored. The fixed depth of the soil may be assumed to be uniform throughout the plough layer. The leaching process can be described simply by the convective–dispersive transport equation [17]:
where θ denotes the moisture content of soil (m3/m3) and v denotes the rate of percolation (m/year). Linear isotherm adsorption (n = 1) is used in this model, and kd,i are partition coefficients.
Li = θ v Ct,i/Kd,i
2.2.8. Plant Uptake
Plant uptake, Ui (mg/m2/year), is the amount of TMs removed from the soil by plants that are harvested. Plant uptake depends on the total soil TM concentration and can be expressed as follows [19]:
where kc,i is a coefficient relating the uptake with the yield of the plant (Yi, kg/m2/year) and the bioconcentration factor (BCFi), which is the relationship between the TM concentration in the harvested plant (Cp,i) and the total soil TM concentration (Ct,i). Cp,i represents the TM concentration in the harvested plant parts (mg/kg in dry matter based) [20]. In order to simplify the calculation, it is assumed that the BCF value of each TM will not change with a change in concentration in the soil, that is, the ratio of Cp/Ct is assumed to be constant during the simulation.
BCFi = Cp,i/Ct,i
If it is a linear relationship, then n = 1
Ui = Yi × Cp,i = Yi × BCFi × Ct,i
2.2.9. Governing Equations
Finally, if the thickness of the topsoil is fixed in the homogeneous mixing soil, the external input equation can be obtained as follows:
Ii = (QI × CWI,i + DA × CA,i + ΣWF × CF,i) − QR × CWR,i
Combining the above equations, the governing equation can be expressed as
or simplified as
ρz dCt,i/dt = (QI × CWI,i + DA × CA,i + ΣWF × CF,i − QR × CWR,i) − Yi × BCFi × Ct,i – θ × v/Kd,i × Ct,i
The analytical solution of the above equation is as follows:
where C0,i is for the initial TM concentration in soil for each TM. In order to simplify the description of the equation, the following formulas are expressed as
where ku,i is equal to the plant uptake rate constant (year) and kl,i is equal to the leaching rate constant (per year). The governing equation can be simplified as
Ct,i = (QI × CWI,i + DA ×CA,i + ΣWF × CF,i − QR × CWR,i)/ρz × (1 − exp(−Yi × BCFi − θ v/Kd,i)/ρz × t))/((−Yi × BCFi − θ v/Kd,i)/ρz) + exp(−Yi × BCFi − θ v/Kd,i)/ρz × t) × C0,i
Ii = (QI × CWI,i + DA × CA,i + ΣWF × CF,i − QR × CWR,i)/ρz
ku,i = Yi × BCFi/ρz
kl,i = θ × v/Kd,i/ρz
dCt,i/dt = Ii − ku,i × Ct,i − kl,i × Ct,i
The analytical solution of the equation can simplify the description as follows:
2.2.10. Combined Bottom Sediments
The sediment in an irrigation channel may enter a paddy field due to water diversion, flood erosion, or other factors. When a paddy field is in the process of diversion irrigation, the irrigation water may washout bottom sediment containing TMs, IS,i (mg/m2/year), in the channel into the paddy soil, and b (unitless) is the specific thickness or the weight ratio of the bottom sediment washout in the soil per year. CS,i (mg/kg) is the content of TMs in the bottom sediment. The flux in TMs via sediment transportation can be expressed as IS,i (mg/m2/year):
IS,i = b × CS,i
If the transportation of sediment is included in the mass balance equation and the topsoil is of a fixed depth, then the governing equation is as follows:
where b is the weight ratio of the sediment alluvial to the total weight of the soil in a unit square meter per year. CT,i is the target year soil total trace metal concentration after combining sediment.
CT,i = Ct,i × (1 − b) + b × IS,i = Ct,i × (1 − b) + b × CS,i
2.2.11. Case Study
In order to identify the distribution of TMs among the farmlands irrigated by the East–West Second and Third irrigation canals with high contamination potential within Changhua County in central Taiwan (Figure 3), EPA Taiwan carried out a study entitled “The Investigation Project for National Agricultural Land with High Potential of Heavy Metal Contamination (IV)” from 2016 to 2017. After collecting and analyzing the relevant documents on the environmental factors (such as pH, water quality), related historical survey records, irrigation system information, surrounding geological characteristics, and spatial–temporal distribution data, it was concluded that the farmland’s TM contamination was closely related to the irrigation system. In general, the irrigation system has been proved a major path for contaminant migration and a cause of agricultural soil contamination [21]. Obviously, poor management of the irrigation system leads to an indiscriminate mix of irrigation water and discharged wastewater from the manufacturing industries, which is the main cause of farmland TMs contamination. In order to understand and confirm the real cause of pollution, this study used mathematical methods to verify whether the results of past investigations are correct. The relevant parameters and data analysis of the model in case study area were as follows: The data of the geographic information system was established from the National Land Surveying and Mapping Center, Ministry of the Interior, R.O.C. The target year of the simulation was set at 40 years, mainly because Taiwan’s economy began to take off rapidly in the 1970s and 1980s. There are a large number of metal plating plants in this study area, and TM contaminants are discharged into irrigation channels along with the discharges. The study area is the main rice production area in the western plain of Taiwan. In the past few decades, chemical fertilizers were the main fertilizer used. In the simulation process, the cumulative amount of TMs was calculated based on the annual average fertilizer usage and converted into the model calculation based on the TM content in the fertilizer. The content of TMs in fertilizers refers to the related research results [22]. The air deposition (dust fall) annual average value was taken from the study area from 2006 to 2015 [23,24], and according to its TM content [25], it was converted into a cumulative milligram per square meter per year for the input data of this model. The consumptive characteristic of irrigation water for paddy fields was evaluated from Chen et al. [26]. The mean value (including the upstream, middle, and downstream channel) of irrigation water quality (CWI,i) and sediment metal concentration (CS,i) were taken from the more complete survey results in 2006 [27] to represent the mean value of the past decades. The water budget of each component paddy field was taken from the study results of Fan et al. [28] during 2004–2009, including irrigation water (QI), precipitation (QP), evapotranspiration (ET), runoff (QR), and vertical percolation (QL) [28,29]. Considering that the paddy field irrigation rate is fast during irrigation period, in order to simplify the calculation process, this study regards the water quality of irrigation water and runoff water as the same. As there is no relevant research report on paddy field partition coefficients (kd,i) in Taiwan, the relevant parameters of this study refer to the recommended values of the U.S. EPA [30]. There are two harvests a year in the study area, and the annual yield of rice grain (Yg) is about 1.1 kg/m2/year [31]. The accumulation ability of rice for different trace metals was significantly different [32]. The mean BCF (bioconcentration factor) values of Cu, Ni, and Zn in rice were taken from the study results of Kunhikrishnan et al. [33]. Since there were no BCF relevant data on Cr, this study referred to the study results of Chen in 2000 [2] and used the half value of Ni as the calculated value for the input data of this model. All relevant data and parameters are summarized in Table 1. Those parameters were converted into the annual mean value or constant input to the model for simulation, while ignoring the influence of other external environmental factors (such as temperature, pH, soil type, etc.). Soil sampling and analysis were completed by the EPA project [21]. First, 1300 sets of soil samples were screened by portable XRF (X-ray fluorescence spectrometer) in the studied irrigation area using the grid method, and then samples with XRF screening results exceeding the regulatory standards were selected, and the aqua regia digestion method was used for the full analysis of TMs. Among them, there were 119 sampling sites in area (a) and 174 sampling sites in area (b). The detection limits of the detector (710 ICP-OE) for Cr, Cu, Ni, and Zn were 1.55, 1.38, 1.24, and 1.52 mg/kg, respectively. The main contaminants in the agricultural lands were Cr, Cu, Ni, and Zn with an average aqua regia soluble concentration between 296 and 1056 mg/kg (Figure 4). The average concentrations from the 119 sampling sites for Cr, Cu, Ni, and Zn in study area (a) were 410, 464, 348, and 1024 mg/kg, respectively, and from the 174 sampling sites in study area (b) they were 390, 296, 430, and 1056 mg/kg, respectively. Since 1991, the remediation of farmlands contaminated with TMs in Changhua County has been performed continuously through many remediation projects funded by central and local governments. The above two groups of paddy field soil contamination data belong to two different projects, and the remediation work began in 2019.
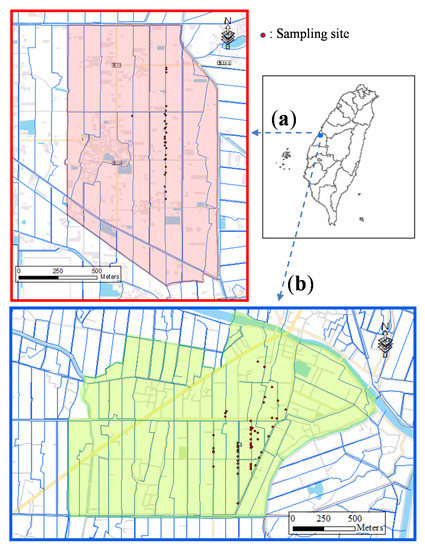
Figure 3.
The relevant location and irrigation system in this study areas (a) for calibration and (b) for verification.

Table 1.
Default values of model parameters and definition for simulation in paddy soil.
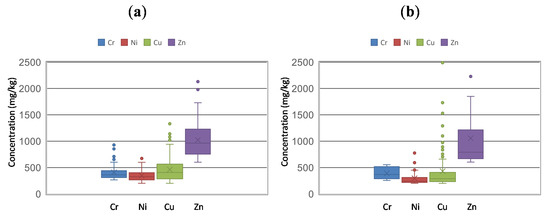
Figure 4.
Concentrations of TMs in contaminated paddy soil and vicinal irrigation system sediments in study areas (a) for calibration and (b) for verification.
2.2.12. Model Parameters
The required parameters include soil specific gravity, irrigation water quality, irrigation water volume, field water consumption, sediment TM concentration, fertilizer consumption and characteristics, air deposition and TM content, crop yield and TM uptake rate, and other factors. The related parameters were assigned as shown in Table 1.
2.2.13. Model Calibration and Verification
Surveying data from 2016 to 2017 [21] were used for model calibration and verification. The data included irrigation channel water quality, sediment TM concentrations, paddy soil TM concentrations, and other data. The model calibration and verification used mean absolute percentage error (MAPE) as a measure of quality for this model [34]:
where Ai is the actual value and Fi is the forecast value.
2.2.14. Model Limits
This model does not consider the horizontal transport and adsorption of TMs in a paddy field, and it is limited to assessing the accumulation of TMs in the soil at a limited depth (in the upper arable soil horizon, plough layer, or topsoil, 0–20 cm) per unit area. In order to simplify the calculation of the model, some parameters were taken from long-term survey or observational data, such as atmospheric deposition, fertilizer use, harvesting, irrigation water quality, evaporation, infiltration, and other data. The model ignored the synergistic effects in the process of leaching or uptake of metals and also ignored the impact factors of changes in oxidation–reduction potential, microbial activity, soil/solution pH, etc., on the efficiency of soil absorption/desorption of trace metals.
2.3. Software
In this study, Microsoft Excel 2019 and ArcGIS Desktop 10 were used as data collation and plotting software, and Microsoft Excel 2019 was used as data input and numerical calculation software.
3. Results
3.1. Model Calibration and Verification
In Taiwan, a series of surveys on TM-contaminated soils and background concentrations in agricultural land began being conducted in 1982 [2]. The background concentrations of TMs in the paddy soils of the study area of the current study are shown in Table 2 and are based on the survey results over years [10]. The background average concentrations of Cr, Cu, Ni, and Zn were 97.2 mg/kg, 85.9 mg/g, 108.4 mg/kg, and 215.5 mg/kg, respectively, in the study area. In order to evaluate the credibility and reliability of the model simulation results, we use the model evaluation criterion MAPE for testing the model accuracy of this study. The results of the calibration and verification (Table 2) show that Cu and Ni are in the good and high prediction range, and the other TMs meet the high prediction range. In addition, according to the results of calibration and verification, the optimal ratio for sediment alluvial weight is about 1.4–1.5% (Figure 5). The average concentration of TMs in the channel sediments in the study area for Cr, Cu, Ni, and Zn was 756.8, 757.0, 594.8, and 1802.8 mg/kg, respectively [27].
Table 2.
The background concentrations of TMs (mg/kg) in the agricultural soils of this study and the results of the model calibration and verification.
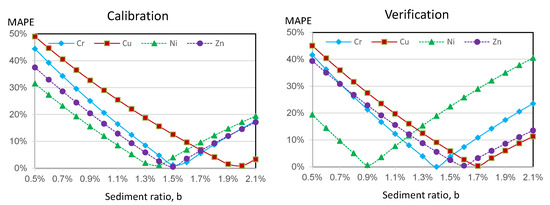
Figure 5.
Calibration and verification results for different TMs and different ratios of sediment.
3.2. Model Simulation Analysis
In the results of this study, as shown in Figure 6, Figure 7 and Figure 8, it was found that the TMs in the paddy soil have mainly come from the sediment in the irrigation channel. For the paddy soil in the study area, the sediment in the channel acts as a TM pool and is one of the main sources for many of the TMs in the contaminated paddy soil. The TM species according to their concentration in the contaminated soil rank in the order of Zn > Cr ≈ Cu > Ni, which is about the same as in the channel sediment.
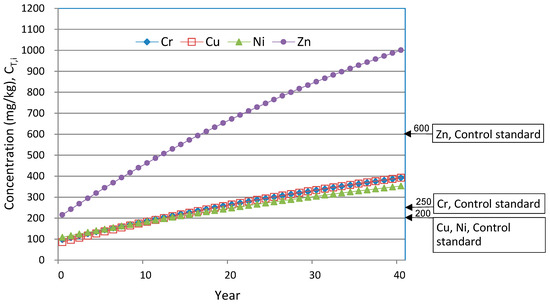
Figure 6.
Model simulating the changes of TM concentrations in paddy soil with time.
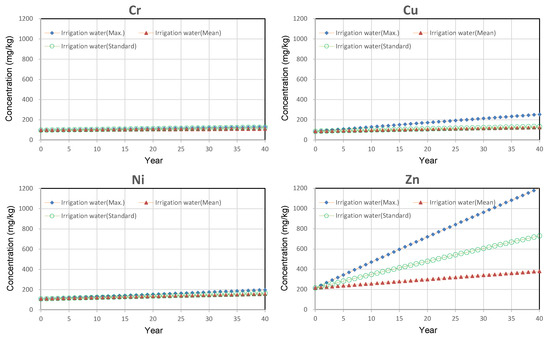
Figure 7.
The stimulated concentrations of TMs in paddy soils using irrigation water of different qualities.
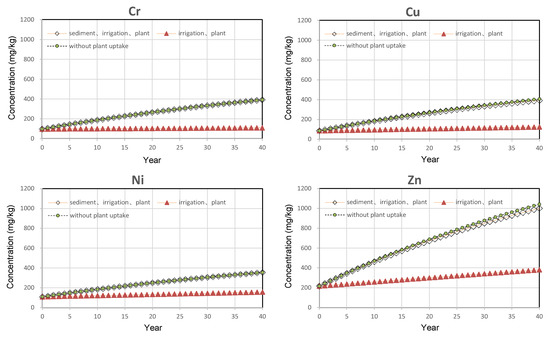
Figure 8.
The change in the TM concentrations in paddy soil in time under different scenarios.
With the simulation process, the first TM that exceeded the control standard for farmland (200 mg/kg) was Cu, which occurred at about the 12th year, and in the 40th year, it was almost close to the control standard for normal lands (400 mg/kg) (Table 3). The next was Ni, which surpassed the control standard for normal lands at 200 mg/kg in the 13th year. The accumulation rate of Cr was almost the same as that of Cu. Owing to the higher standard value of regulation, it exceeded the control standard for normal lands with 250 mg/kg in the 18th year. Zn exceeded the control standard for farmlands (600 mg/kg) at about the 17th year, and the simulated value was about 1000 mg/kg in the 40th year. Since Zn has a higher standard value for normal land (2000 mg/kg), its concentration by the end of the simulation period was only about half of the control standard.
Table 3.
The control and monitoring standards for the concentrations of TMs in the soil of normal lands and farmlands as announced by the Environmental Protection Agency (EPA) of Taiwan.
For the monitoring standard of farmlands, the concentrations of Zn, Ni, Cu, and Cr exceeded the monitoring standard for farmland in the second, third, fourth, and ninth year, respectively. Except for Cr, the concentrations of the other three TMs exceeded the monitoring standards for farmlands within five years. This stimulation result reveals that the competent authorities should regularly implement soil sampling and monitoring projects to prevent the contamination of paddy soil.
3.3. Irrigation Water without Sediment Transportation
According to the results of previous surveys on irrigation channels, the long-term average concentrations of TMs in irrigation water can meet the standards for irrigation water quality (Table 4). The results of the model simulation also show that with long-term farming (Figure 7), concentrations of TMs are still below monitoring standards, and there is no problem with the sustainable use of the farmland. However, once the TMs in the irrigation water exceed irrigation water standards for decades, the paddy soil may still potentially become contaminated and exceed control standards, such as with Zn. A related study has also been found in India [35].
Table 4.
Irrigation water quality during the simulation period in this study area.
3.4. Irrigation Channel Sediment
When TMs are released into a water environment, the dilution effect of the water and its chemical composition can change the total concentration of TMs and the relative content of their different chemical species. They can also interact with the suspended solids and sediment in the water. As a result, the distribution of TMs in the water phase and solid phase changes and reactions occur, including diffusion, precipitation, adsorption, sedimentation, and more, and TMs accumulate in the irrigation channel sediment.
The TMs in a water environment can be roughly divided into solid matter and dissolved matter. The solid matter in water, including suspended solids and sediment, plays an important role in the transmission and distribution of TMs in a water environment. Sediment may enter a paddy field and contaminate paddy soils through diversion irrigation, flooding, or farmers dredging the sediment. In Figure 8, when comparing the situation with and without sediment, the difference in the final concentration of TM can be found, and the amount of change in concentration is the degree of influence of the sediment. The simulation results of this study have shown that 56–72% of the TMs in the contaminated paddy soil were a result of the sedimentation process in the sediment of the irrigation channel. The individual concentrations of TMs in the contaminated paddy soil resulting from the sediment in the irrigation channel for Cr, Cu, Ni, and Zn were 72%, 68%, 56%, and 62%, respectively, as shown in Figure 8. This also shows that, consistent with the survey results, most of the TMs accumulate at the inlet of the irrigated paddy field [13].
3.5. Plant Uptake
To protect the air quality in Taiwan, farmers are prohibited from burning rice straw and weeds in the field. Most of the rice straw is chopped by harvesters and then directly decomposed into fertilizers by plowing and burying in the paddy field. Therefore, the plant uptake removal of TMs in the paddy field mainly comes from the rice grains at harvest. In general, the TMs that are more likely to accumulate in rice are relatively more likely to be removed [33,36]. Related studies have pointed out that Zn and Cu are trace essential elements required for plant growth and are more easily absorbed by rice. Ni and Cr are less likely to be absorbed by plants and are more stable in soil [37,38]. The simulation results show that through rice harvesting, the removal rate (percent per year) of TMs in the paddy soil follows Zn > Cu > Ni > Cr, with rates of 4%, 3%, 0.3%, and 0.1%, respectively, as shown in Figure 8.
3.6. Model Sensitivity Analysis
To understand the influence of each main parameter on the analysis results of this model, this study conducted a sensitivity analysis on several main parameters and sources. When each parameter was increased by 50%, the significance of the impact on the estimated value of the target year was evaluated. Based on the default data for the study area, the sensitive factors of this model were sediment concentration (CS), bioconcentration factor (BCF), irrigation water quality (CWI), atmospheric deposition concentration (CA), percolation velocity (ν), and fertilization concentration (CF). From the analysis results (Figure 9), it can be seen that the influence of sediment concentration (CS) is the highest, and the range of influence is from 36% to 42%. The variety of different TMs mainly comes from the influence of the concentration ratios of the TMs in the sediment and irrigation water and the higher the concentration ratio, the greater the influence. The effect of BCF is between −0.1% and −2.0%, which ranges for Cr, Ni, Cu, and Zn in this order. For Zn and Cu, which are essential elements, the cumulative concentrations in plants are higher than those of Cr and Ni. The removal rates of Zn and Cu for the contaminated soil are also higher. Another influencing factor is the concentration of TMs in the contaminated soil: the higher the concentration of the TMs in the soil, the higher the amount absorbed by the plants. Relatively, Zn and Cu are also TMs with higher concentrations in the contaminated paddy soil. The order of influence from the irrigation water is Zn, Ni, Cu, and Cr, which is slightly different from the order of the sediment. The main reason is that the concentration of Ni in the irrigation channel is higher than that of Cu and the concentration of Ni more easily becomes higher in the paddy soil because of its relatively higher concentration in the environment. Ni also forms oxide precipitates less easily than Cu, so its mobility is higher than that of Cu. In this study, since all of the TM levels in the irrigation water were lower than the irrigation water quality standards, the impact of irrigation water is not so significant for the contamination of paddy soil, and its impact range is between 1.0% and 6.7%.
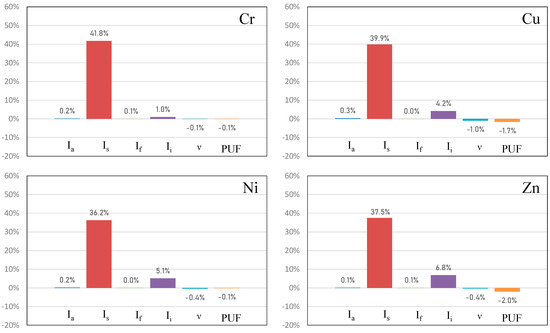
Figure 9.
Sensitivity analysis of the main parameters (when each increases by 50%).
3.7. Review on the Prevention, Management, and Remediation of TM-Contaminated Farmlands
In Taiwan, the current prevention and control strategy for TM-contaminated farmlands focuses on remediation. Through the use of data ascertained by well-designed investigations of contaminated farmland, government authorities are able to announce and conduct a variety of plans for the control and evaluation of farmland remediation. However, potential sources for the contaminants of farmland have been neglected. Therefore, even after the remediation of TM-contaminated farmland is complete, there still exists the possibility for recontamination, thus losing the original remediation benefits.
The current TM contamination problem in farmland is serious, and the competent authorities have adopted a method for remediating contaminated farmland in stages. However, most of the contaminated sites have been rectified and deregulated. At the same time, the strict inspection and control of the wastewater discharge from surrounding high-polluting factories are being performed to avoid further contamination of farmland with TMs. However, most of the contaminated sediments in the irrigation channels have not been properly treated. The current control strategy only focuses on monitoring the quality of discharge and irrigation water. To be able to avoid the recontamination of farmland with TMs, the management of the surrounding irrigation channels, especially of sediment contaminated with TMs, should take priority over the remediation of the farmland.
4. Conclusions
In this study, we combined the water quality of the irrigation system and the concentrations of TMs in the sediment to establish a farmland TM contamination and management model (FTM_CMM). The model is simple and easy to use and is suitable for the long-term evaluation of paddy field management strategies. The simulation shows that the TM content in the topsoil and the corresponding TM content in the irrigation channel sediment are 56% to 72%. This highlights that, in addition to the management of irrigation water quality, the management of TM-contaminated sediment in adjacent canal irrigation systems is also an important part of the prevention of TM contamination in farmland.
Author Contributions
Conceptualization, H.-Y.Y.; methodology, S.-K.C. and C.-J.L.; validation, H.-Y.Y. and S.-K.C.; formal analysis, H.-Y.Y., J.-S.W., and S.-K.C.; resources, C.-J.L. and H.-Y.L; writing—original draft preparation, H.-Y.Y., S.-K.C., and J.-S.W.; writing—review and editing, C.-J.L. and H.-Y.L. All authors have read and agreed to the published version of the manuscript.
Funding
This research was supported by National Chung Hsing University and in part by the Ministry of Education, Taiwan, R.O.C., under the Higher Education Sprout Project. The views or opinions expressed in this article are those of the writers and should not be construed as the opinions of National Chung Hsing University.
Acknowledgments
The authors would like to thank the Environmental Protection Bureau of Changhua County and the Environmental Protection Administration of Taiwan for providing the contamination information and data for paddy soil.
Conflicts of Interest
The authors declare no conflict of interest.
References
- Cheng, B.Y.; Fang, W.T.; Shyu, G.S.; Chang, T.K. Distribution of heavy metals in the sediments of agricultural fields adjacent to urban areas in Central Taiwan. Paddy Water Environ. 2013, 11, 343–351. [Google Scholar] [CrossRef]
- Chen, Z.S. Relationship between heavy metal concentrations in soils of Taiwan and uptake by crops. Food Fertil. Technol. Cent. Tech. Bull. 2000, 149, 1–15. [Google Scholar]
- Cipullo, S.; Snapir, B.; Tardif, S.; Campo, P.; Prpich, G.; Coulon, F. Insights into mixed contaminants interactions and its implication for heavy metals and metalloids mobility, bioavailability and risk assessment. Sci. Total Environ. 2018, 645, 662–673. [Google Scholar] [CrossRef] [PubMed]
- Zhang, X.; Zhong, T.; Liu, L.; Ouyang, X.; Qian, Q. Impact of Soil Heavy Metal Pollution on Food Safety in China. PLoS ONE 2015, 10, e0135182. [Google Scholar] [CrossRef]
- Huang, S.H.; Wang, Y.L.; Li, S.H.; Chien, L.C.; Chang, T.C.; Hseu, Z.Y.; Hsi, H.C. Environmental and health risks of heavy metals in farmland soils of drinking water protection areas and a contaminated paddy field in Taiwan. Sustainability 2019, 11, 5166. [Google Scholar] [CrossRef]
- Emenike, C.U.; Jayanthi, B.; Agamuthu, P.; Fauziah, S.H. Biotransformation and removal of heavy metals: A review of phytoremediation and microbial remediation assessment on contaminated soil. Environ. Rev. 2018, 26, 156–168. [Google Scholar] [CrossRef]
- Taiwan Environmental Protection Administration (EPA Taiwan). Annual Report Soil and Groundwater Pollution Remediation. Soil and Groundwater Pollution Fund Management Board. 2018. Available online: https://sgw.epa.gov.tw/public/download/annual-report/e845ec08-16c2-432d-942f-1a62b69f4f9a (accessed on 10 May 2019).
- Lin, Y.P.; Chang, T.K. Geostatistical simulation and estimation of the spatial variability of soil zinc. J. Environ. Sci. Health A 2000, 35, 327–347. [Google Scholar] [CrossRef]
- Juang, K.W.; Chen, Y.S.; Lee, D.Y. Using sequential indicator simulation to assess the uncertainty of delineating heavy-metal contaminated soils. Environ. Pollut. 2004, 127, 229–238. [Google Scholar] [CrossRef]
- Lin, Y.P.; Cheng, B.Y.; Shyu, G.S.; Chang, T.K. Combining a finite mixture distribution model with indicator kriging to delineate and map the spatial patterns of soil heavy metal pollution in Chunghua County, central Taiwan. Environ. Pollut. 2010, 158, 235–244. [Google Scholar] [CrossRef]
- Lin, Y.P.; Teng, T.P.; Chang, T.K. Multivariate analysis of soil heavy metal pollution and landscape pattern in Changhua county in Taiwan. Landsc. Urban. Plan. 2002, 62, 19–35. [Google Scholar] [CrossRef]
- Lin, Y.P. Simulating spatial distributions, variability and uncertainty of soil arsenic by geostatistical simulations in geographic information systems. Open Environ. Sci. 2008, 2, 26–33. [Google Scholar] [CrossRef]
- Taiwan Environmental Protection Administration (EPA Taiwan). Investigation of Contaminated Farmlands in Central Taiwan, EPA, R.O.C.; Editor. 2012. Available online: https://data.epa.gov.tw/dataset/soil_p_06 (accessed on 9 October 2012).
- Lin, Y.P.; Chang, T.K.; Shih, C.W.; Tseng, C.H. Factorial and indicator kriging methods using a geographic information system to delineate spatial variation and pollution sources of soil heavy metals. Environ. Geol. 2002, 42, 900–909. [Google Scholar] [CrossRef]
- Zhang, C.; Appel, E.; Qiao, Q. Heavy metal pollution in farmland irrigated with river water near a steel plant—Magnetic and geochemical signature. Geophys. J. Int. 2012, 192, 963–974. [Google Scholar] [CrossRef]
- Peng, C.; Wang, M.; Chen, W. Modelling cadmium contamination in paddy soils under long-term remediation measures: Model development and stochastic simulations. Environ. Pollut. 2016, 216, 146–155. [Google Scholar] [CrossRef]
- Feng, W.; Guo, Z.; Peng, C.; Xiao, X.; Shi, L.; Han, X.; Ran, H. Modelling mass balance of cadmium in paddy soils under long term control scenarios. Environ. Sci. Process. Impacts 2018, 20, 1158–1166. [Google Scholar] [CrossRef]
- Posch, M.; de Vries, W. Dynamic modelling of metals—Time scales and target loads. Environ. Model. Softw. 2009, 24, 86–95. [Google Scholar] [CrossRef]
- Oporto, C.; Smolders, E.; Vandecasteele, C. Identifying the cause of soil cadmium contamination with Monte Carlo mass balance modelling: A case study from Potosi, Bolivia. Environ. Technol. 2012, 33, 555–561. [Google Scholar] [CrossRef]
- Hladun, K.R.; Parker, D.R.; Trumble, J.T. Cadmium, Copper, and Lead Accumulation and Bioconcentration in the Vegetative and Reproductive Organs of Raphanus sativus: Implications for Plant Performance and Pollination. J. Chem. Ecol. 2015, 41, 386–395. [Google Scholar] [CrossRef]
- Taiwan Environmental Protection Administration (EPA Taiwan). Control and Investigation Project for National Agricultural Land with High Potential of Heavy Metal Pollution (IV); EPA, R.O.C.: Taipei, Taiwan, 2017.
- Wu, Z.Z.; Wang, B.S. Investigation on the content of heavy metals in fertilizer materials. J. Agric. 2012, 82, 6–10. [Google Scholar]
- Changhua County Environmental Protection Bureau. Changhua County Air Pollution Prevention and Control Plan (104–108); Changhua County Government: Changhua County, Taiwan, 2017.
- Zhang, L.; Fang, G.C.; Liu, C.K.; Huang, Y.L.; Huang, J.H.; Huang, C.S. Dry deposition fluxes and deposition velocities of seven trace metal species at five sites in central Taiwan—A summary of surrogate surface measurements and a comparison with model estimations. Atmos. Chem. Phys. 2012, 12, 3405–3417. [Google Scholar] [CrossRef]
- Taiwan Environmental Protection Administration (EPA Taiwan). Investigation and Research on the Content of Elements in the Air in the South of Taichung. 2010. Available online: https://www.epa.gov.tw/DisplayFile.aspx?FileID=B9D3CF7D40B58057&P=75d59dfa-1fb7-4e3f-a661-e79509236c43 (accessed on 5 May 2020).
- Chen, F.W.; Liu, C.W. Estimation on consumptive characteristic of irrigation water for paddy fields using water balance theorem. J. Taiwan Agric. Eng. 2013, 59, 77–98. [Google Scholar]
- Taiwan Environmental Protection Administration (EPA Taiwan). The Investigation in Effects of the Irrigation Water and Sediment on the Heavy Metal Contaminate of Rice Land; EPA, R.O.C.: Taipei, Taiwan, 2006.
- Fan, S.Y.; Chen, J.Y.; Chang, Y.C.; Kan, C.E.; Cheng, C.C. The reasonable scale of water reuse system in irrigation area: A case study of Chitong irrigation district in Taiwan. Paddy Water Environ. 2013, 11, 35–44. [Google Scholar] [CrossRef]
- Liu, C.W.; Chen, S.K.; Jou, S.W.; Kuo, S.F. Estimation of the infiltration rate of a paddy field in Yun-Lin, Taiwan. Agric. Syst. 2001, 68, 41–54. [Google Scholar] [CrossRef]
- Allison, J.D.; Allison, T.L. Partition Coefficients for Metals in Surface Water, Soil, and Waste; U.S. Environmental Protection Agency: Washington, DC, USA, 2005.
- Council of Argricultral, Executive Yuan (R.O.C.). Rice Planting, Harvest Area and Yield in Taiwan; COA, R.O.C.: Taipei, Taiwan, 2011–2019. Available online: https://agrstat.coa.gov.tw/sdweb/public/official/OfficialInformation.aspx (accessed on 13 August 2020).
- Zhao, K.; Zhang, W.; Zhou, L.; Liu, X.; Xu, J.; Huang, P. Modeling transfer of heavy metals in soil–rice system and their risk assessment in paddy fields. Environ. Earth Sci. 2009, 59, 519–527. [Google Scholar] [CrossRef]
- Kunhikrishnan, A.; Go, W.-R.; Park, J.H.; Kim, K.-R.; Kim, H.S.; Kim, K.-H.; Kim, W.-I.; Cho, N.-J. Heavy Metal(loid) Levels in Paddy Soils and Brown Rice in Korea. Korean J. Soil Sci. Fertil. 2015, 48, 515–521. [Google Scholar] [CrossRef]
- Xiong, P.; Shi, J.; Pei, L.; Ding, S. A novel linear time-varying GM (1,N) model for forecasting haze: A case study of Beijing, China. Sustainability 2019, 11, 3832. [Google Scholar] [CrossRef]
- Rattan, R.K.; Datta, S.P.; Chhonkar, P.K.; Suribabu, K.; Singh, A.K. Long-term impact of irrigation with sewage effluents on heavy metal content in soils, crops and groundwater—A case study. Agric. Ecosyst. Environ. 2005, 109, 310–322. [Google Scholar] [CrossRef]
- Hseu, Z.Y.; Su, S.W.; Lai, H.Y.; Guo, H.Y.; Chen, T.C.; Chen, Z.S. Remediation techniques and heavy metal uptake by different rice varieties in metal-contaminated soils of Taiwan: New aspects for food safety regulation and sustainable agriculture. Soil Sci. Plant. Nutr. 2010, 56, 31–52. [Google Scholar] [CrossRef]
- Kong, X.; Liu, T.; Yu, Z.; Chen, Z.; Lei, D.; Wang, Z.; Zhang, H.; Li, Q.; Zhang, S. Heavy metal bioaccumulation in rice from a high geological background area in Guizhou Province, China. Int. J. Environ. Res. Public Health 2018, 15, 2281. [Google Scholar] [CrossRef]
- Rahimi, G.; Kolahchi, Z.; Charkhabi, A.; Ghasem, R. Uptake and translocation of some heavy metals by rice crop (Oryza sativa) in paddy soils. Agriculture 2017, 63, 163–175. [Google Scholar] [CrossRef]
Publisher’s Note: MDPI stays neutral with regard to jurisdictional claims in published maps and institutional affiliations. |
© 2020 by the authors. Licensee MDPI, Basel, Switzerland. This article is an open access article distributed under the terms and conditions of the Creative Commons Attribution (CC BY) license (http://creativecommons.org/licenses/by/4.0/).