Article

The Assessment of Climate Change and Land-Use Influences on the Runoff of a Typical Coastal Basin in Northern China

1
College of Water Sciences, Beijing Normal University, Beijing 100875, China
2
Beijing Key Laboratory of Urban Hydrological Cycle and Sponge City Technology, Beijing 100875, China
*
Author to whom correspondence should be addressed.
Sustainability 2020, 12(23), 10050; https://doi.org/10.3390/su122310050
Submission received: 14 October 2020 / Revised: 20 November 2020 / Accepted: 22 November 2020 / Published: 2 December 2020

Abstract

:
Land use and climate change are the two major driving factors of watershed runoff change, and it is of great significance to study the influence of watershed hydrological processes on water resource planning and management. This study takes the Changyang River basin as the study area, builds a SWAT model and explores the applicability of the SWAT model in the basin. Moreover, we combine data on land use and climate change in different periods to construct a variety of scenario models to quantitatively analyze the impacts of different scenarios on runoff. The results show that the R2 and Ensof the model are 0.71 and 0.68 in the calibration period, respectively, and those in the verification period are 0.68 and 0.65, respectively, indicating that the SWAT model has good applicability in simulating the runoff of the Changyang River basin. Under the comprehensive scenario of land use and climate change on runoff, we found that land use and climate change have a certain contribution to the change in runoff. Therefore, the runoff of the basin increased by 0.22 m3/s, in which land-use change caused the runoff in the basin to increase by 0.07 m3/s attributed to the decreased area of arable land and the increased area of urban land in the basin. Moreover, climate change has caused the runoff in the basin to increase by 0.13 m3/s, mainly influenced by the increased precipitation. The results show that climate change has a more significant effect on runoff in the basin.

1. Introduction

Water resources are the foundation of sustainable socioeconomic development [1,2]. However, in recent decades, due to the impact of global climate change, the quantity of water resources has decreased worldwide, which has gradually become an important constraining factor on future socioeconomic development [3,4]. Runoff is an important part of the global hydrological cycle and is also significant in relation to the allocation of water resources [5]. Changes in runoff directly affect life and production activities in a basin [6,7]. At the same time, the nature of river runoff response to basin disturbance is seasonal, so we cannot study the annual runoff to infer the effect of basin disturbance on runoff, which is not available [8]. Changes in runoff are mainly affected by climate change, land use, and human activities [9]. According to the fifth IPCC assessment report, the average surface temperature in China is increasing at a rate of 0.12 °C each decade [10,11]. The continuously rising temperature greatly changes the temporal and spatial distributions of precipitation in local areas, which impacts the water cycle of the river basin and even the distribution of water resources in the whole river basin [12,13]. In addition, in recent years, with the increase in human activity intensity, land use has changed, affecting surface morphology, soil conditions, and surface cover, causing changes in evapotranspiration and infiltration in the basin. For example, Li et al. used time series analysis and modified double mass curves to quantitatively calculate the relative contributions of forest disturbance to each streamflow component and the results showed that forest disturbance increased annual streamflow by 27.7 ± 13.7 mm. [14] Climate change and land use can both affect runoff directly and indirectly. Therefore, it is of great significance to study the impact of land use and climate change on runoff for future water resource planning and development [15,16].
Recently, many studies have been conducted to assess the impact of climate change and land use on runoff, both domestically and overseas. The results show that the dominant factors affecting runoff vary in different river basins. For example, Yan et al. found that runoff was dominated by climate change in the Hailar River basin in Northeast China (climate change and land use with respect to the reduction of runoff accounted for 76% and 15%, respectively, from 2000 to 2010) [17]. Yang et al. concluded that climate change in the upper reaches of the Wenyu River had a more significant impact on runoff than did land use from 1980 to 2014, with contributions of 100.46% and 2.09%, respectively [18]. However, land-use change from 1961 to 2013 had a more significant impact on runoff than did climate change at the Tangnaihe Hydrological Station, located in the upper reaches of the Yellow River [19,20]. In most studies, the impacts of climate change on runoff are dominant, while in fewer studies, the impacts of land use on runoff are more significant. In short, existing studies have shown that land use and climate change will greatly affect runoff changes in a basin, but the dominant factors affecting runoff still need to be analyzed in different study areas.
The Changyang River basin is located in Weihai city in Shangdong Province, where the main land cover in the basin is cultivated land; thus, the basin is greatly affected by human activities [21,22]. In addition, this river is faced with the problem of water shortage due to the seasonality of precipitation and the large demand of irrigation for agriculture so it is significant to study the runoff variation in this basin for future water resource utilization. What is more, this basin is a typical coastal basin in Northern China and the SWAT model is rarely used in this type of area. Therefore, studying the impact of climate change and land use on runoff in this basin based on existing data is representative and can provide some theoretical guidance for future water resource management in coastal basins. In this study, we used the Changyang River basin as the study area and built a SWAT model based on historical meteorological data. At the same time, we discussed the applicability of the SWAT model in the basin and used the scenario analysis method combined with meteorological factors (including precipitation and temperature) and the change in land use to quantitatively assess the effect of climate change and land use on runoff, which provides the Changyang River basin with a scientific basis for water resource planning and utilization under the circumstance of global warming.

2. Materials and Methods

2.1. Study Region

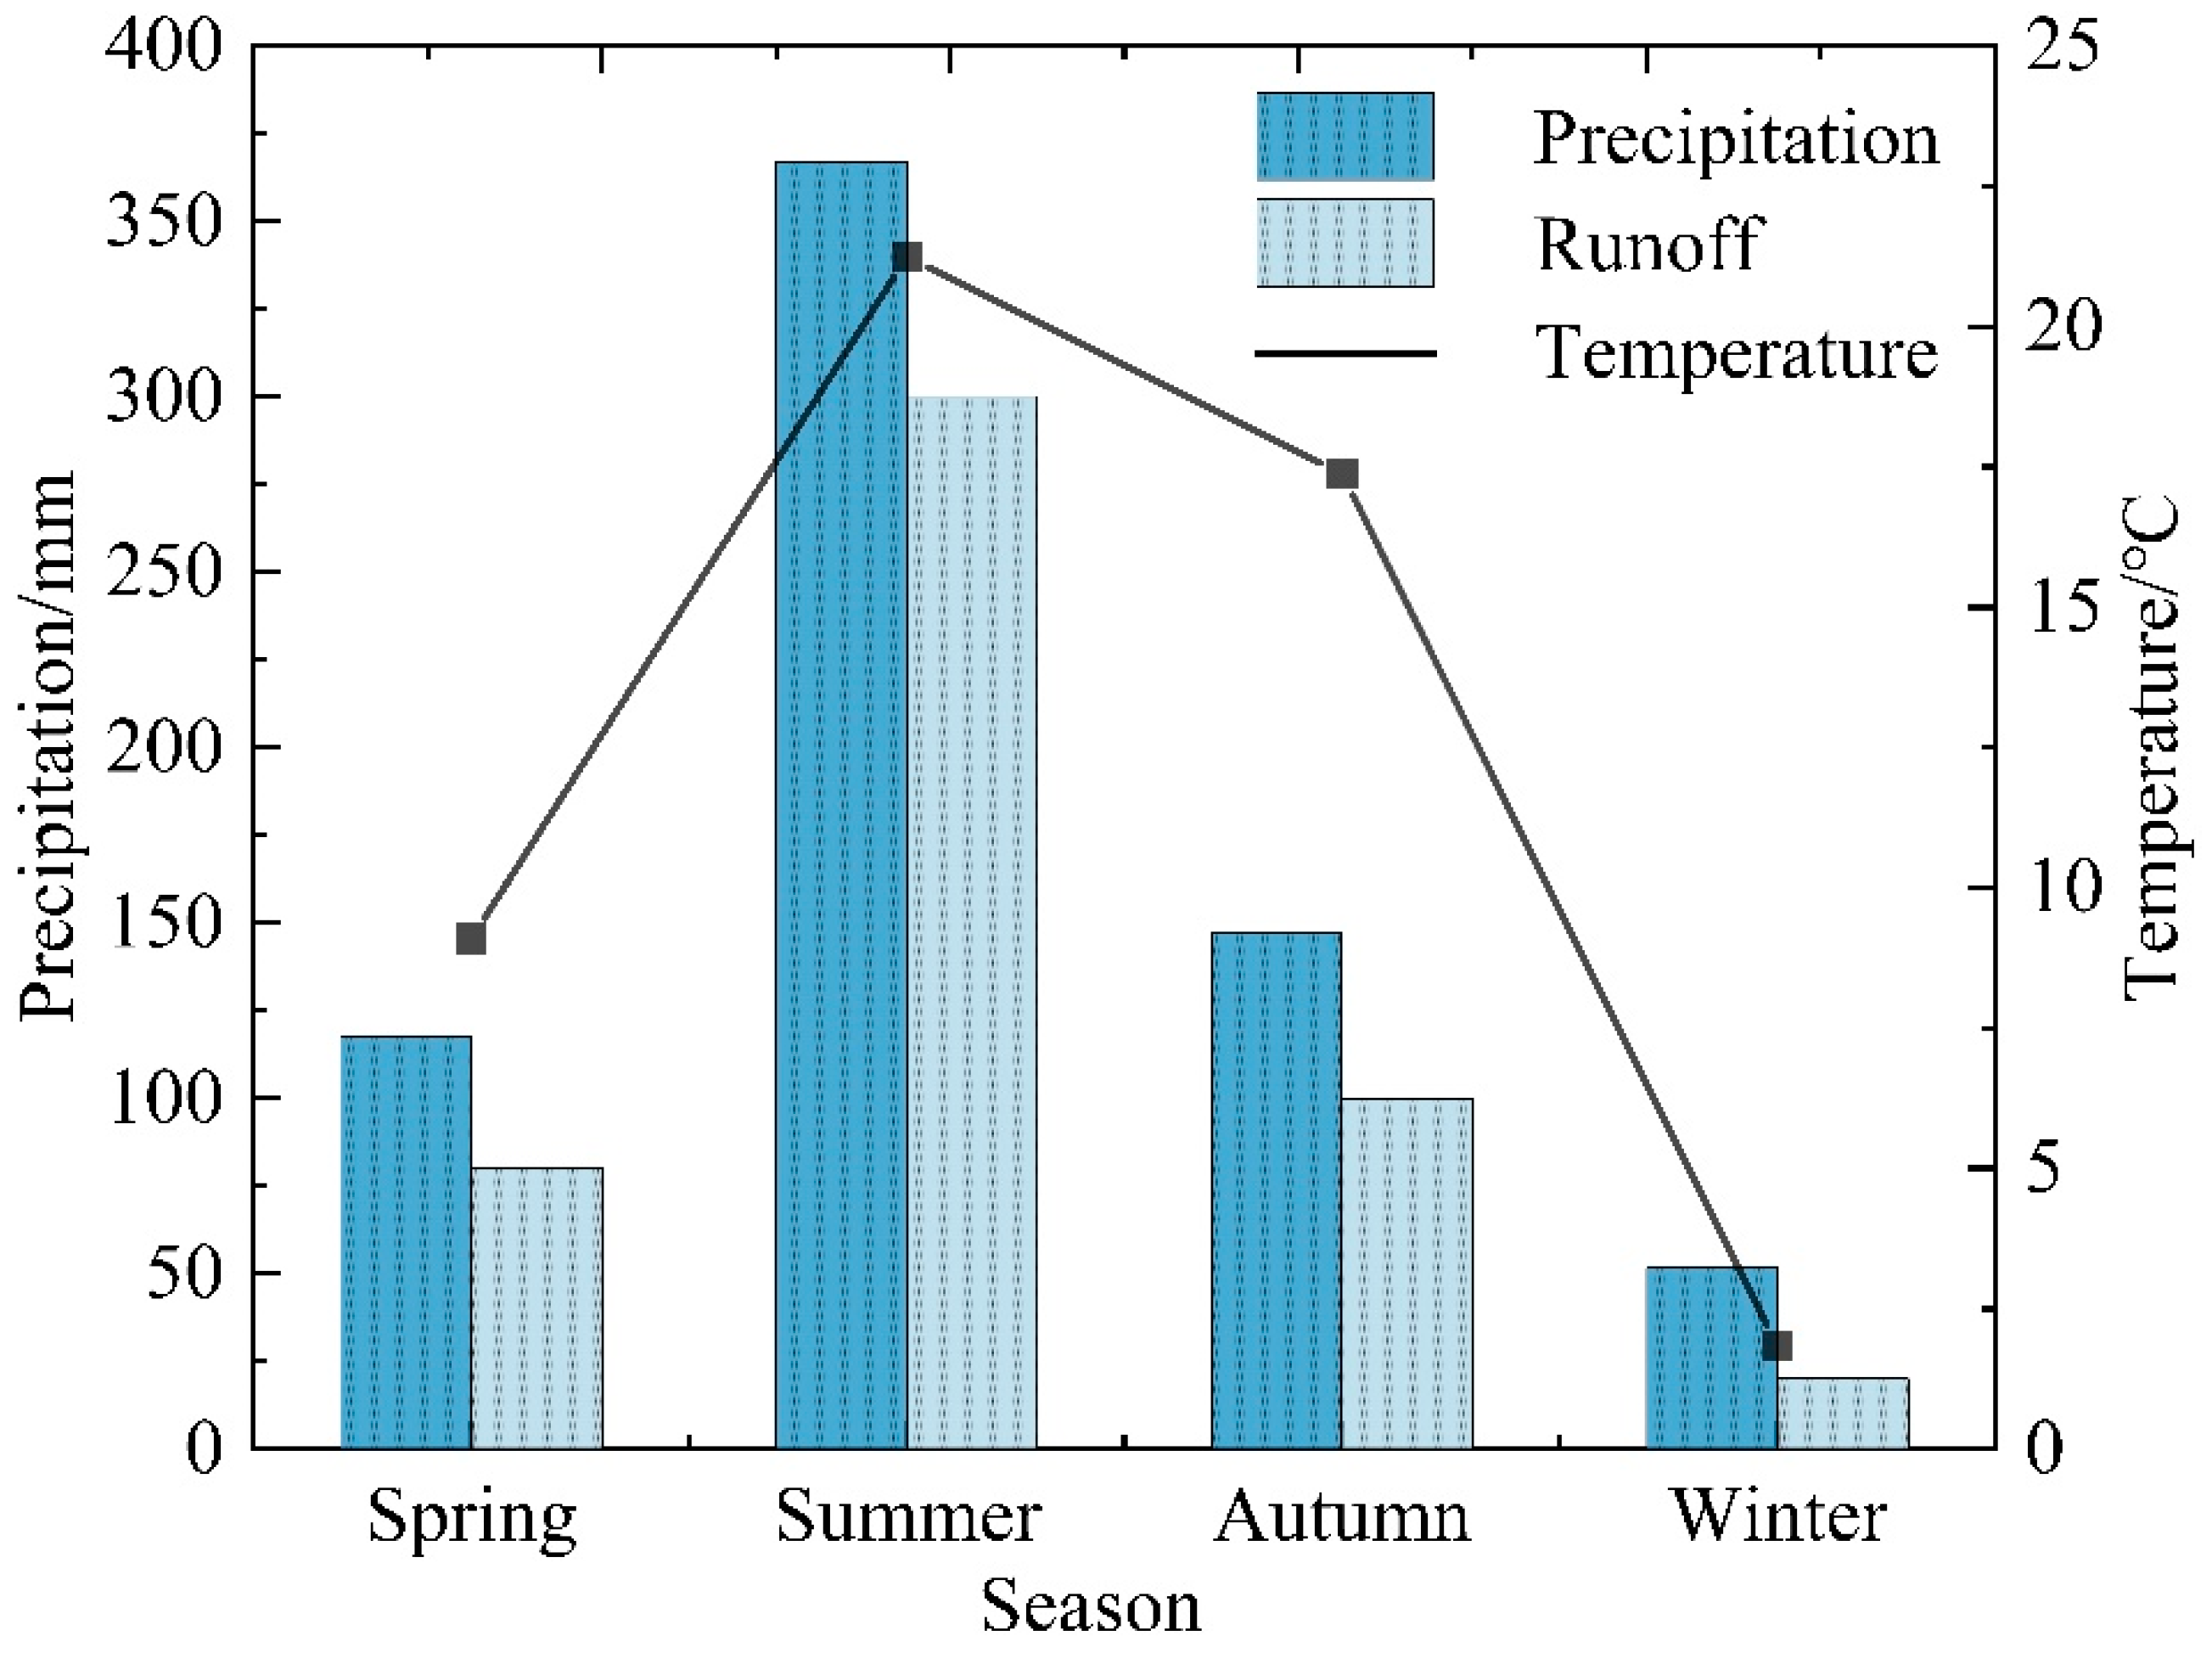
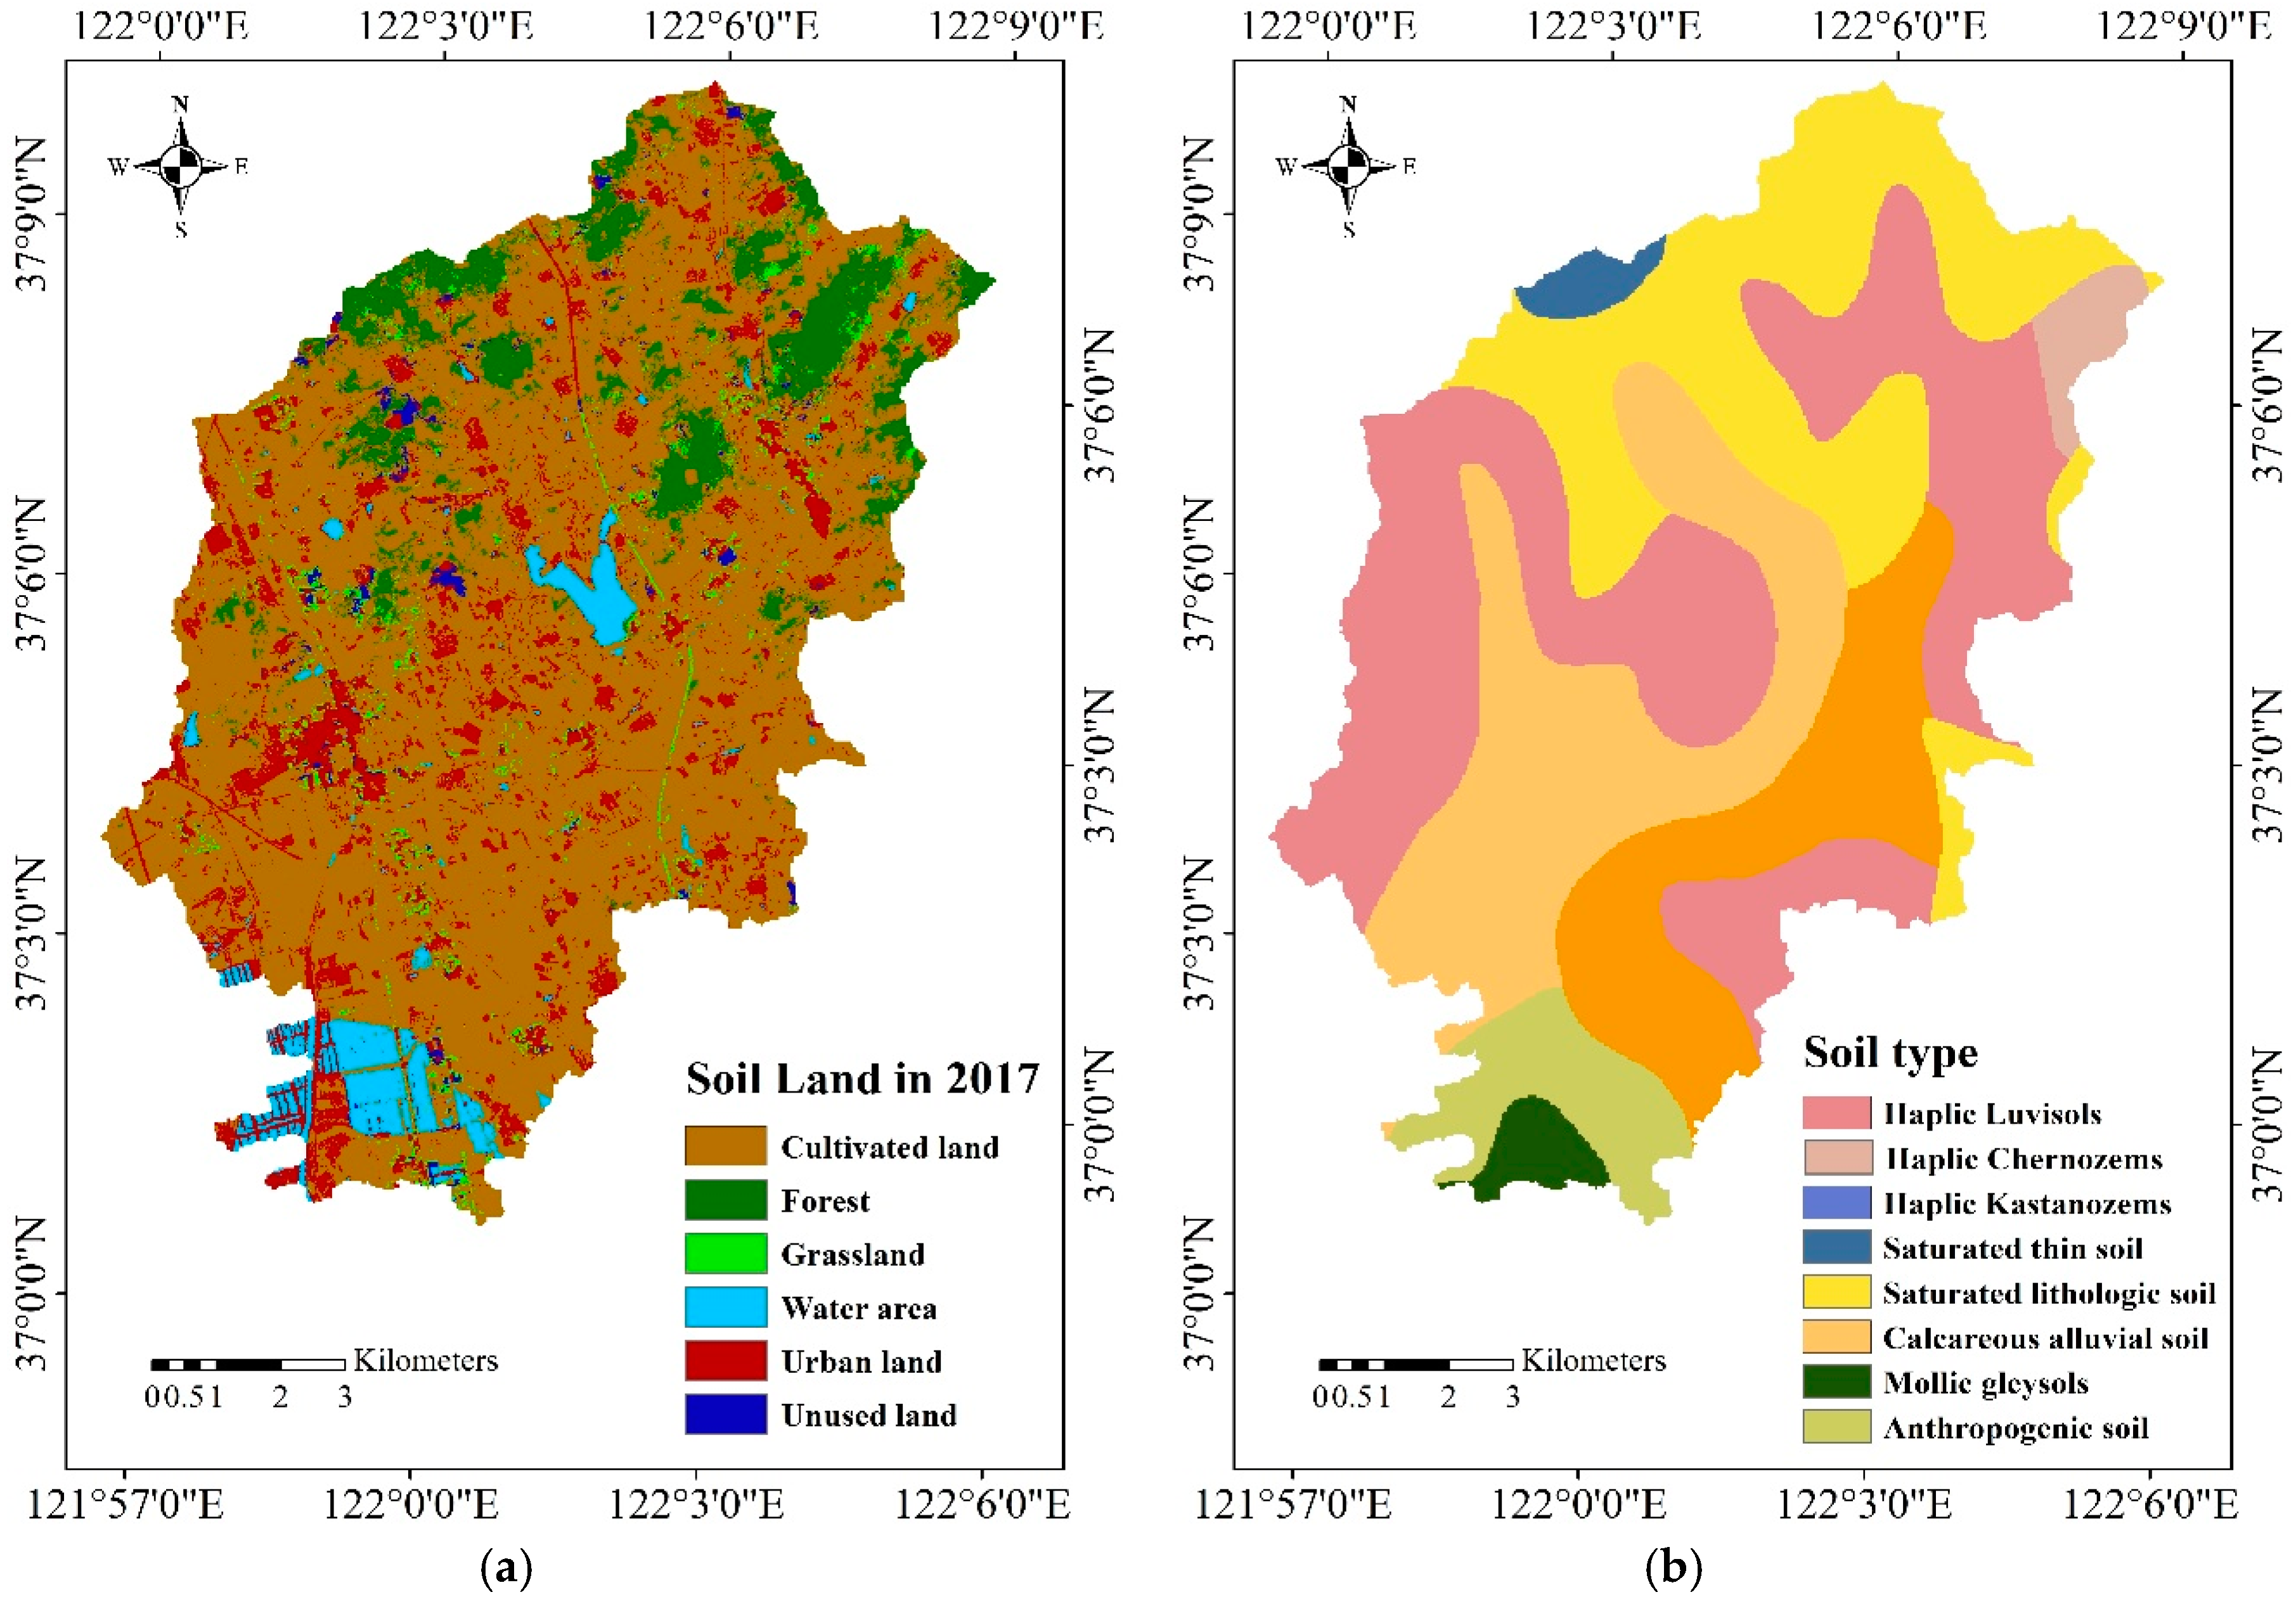
The Changyang River basin is located in Weihai city, Shandong Province, China (Figure 1). Its geographical location is between 36°59’–37°11’N and 121°53’–122°10’E. The length of the main river is approximately 3903.88 m, with a basin area of 119.2 km2. The river has two major tributaries, including the Dong Changyang River and the Xi Changyang River, and it finally enters the Yellow Sea. The study area has a temperate continental monsoon climate, with four distinct seasons. The mean annual precipitation and mean annual temperature in this river basin are 685.6 mm and 10.8 °C, respectively, according to meteorological data observed during 1979–2018 (Figure 2). Its topography is predominantly mountains and hills and the average slope of the river is under 25°. The main vegetation types are coniferous broad-leaved forest, shrubs and herb [22]. The main economic crops in the basin are corn, peanuts, and apples [22]. According to the UN Food and Agriculture Organization (FAO) provided by the World Coordination of Soil Database (HWSD), the main soil types in the study area are calcareous alluvial soil, jane highly active luvisols and bleaching highly active luvisol gley [22] (Figure 3).

2.2. Data Sources

The input data of the SWAT model are mainly divided into two categories: spatial data and attribute data, which generally include Digital Elevation Model(DEM) data, land-use data, soil data, meteorological data and hydrological data [23].
The digital elevation model data, with a resolution of 30 m, are downloaded from the geospatial data cloud website and are treated by clipping and projection transformation using ArcGIS. Land-use data, with an accuracy of 30 m, are sourced from the Data Center of Resources and Environment Sciences of the Chinese Academy of Sciences and include land-use maps from 2005 and 2017. In the Changyang River basin, the main land-use types are cultivated land, urban land, forestland, water area and grassland (see Table 1). Soil type data and soil attribute data are derived from the HWDS database obtained by clipping and reclassifying. Meteorological data are from the Hydrological Statistical Yearbook processed with SWAT Weather software including daily precipitation, maximum and minimum temperature, humidity, and wind speed. The time series of meteorological data is from 1990 to 2018.

2.3. SWAT Model

The SWAT model is a semi-distributed, continuous-time hydrological model for simulating water flow and sediment processes, and the model was developed by the United States Development of Agriculture (USDA) [24]. In addition to the hydrology module, the SWAT model has some other modules, such as reservoir routing, pesticides, and sediments. Based on watershed discretization processing, the model can better reflect basin spatial heterogeneity [25,26]. Moreover, due to the easy accessibility of the data and user-friendly interface, this model is widely used to simulate runoff change under different scenarios settings [27]. Therefore, we used this model in the Changyang River basin to simulate runoff processes under different climate change conditions and land-use conditions. At each computational hydrological unit, the hydrology is determined by the following water balance equation:
S W t = S W 0 + i = 1 t ( R d a y Q s u r f E a W s e e p i Q g w )
where SWt is the final soil water content, SW0 is the initial soil moisture content, t is the time step, Rday is the precipitation, Qsurf is the surface runoff, Ea is the soil evaporation and plant transpiration, Wseep is the infiltration and lateral flow at the bottom of the soil profile, and Qgw is the base flow. The units of these variables are millimeters.
The construction of the ArcSWAT model based on ArcGIS mainly includes the following three processes. The first step is watershed division. Watersheds are defined based on DEM data, and river networks are generated after DEM data are loaded. The area threshold of the river network can be modified, and smaller values generate more detailed river networks. After the formation of the river network, a point near the output hydrological station was defined as the total outlet of the basin, and the sub-basin was divided. In this paper, the river network was divided according to the default area threshold of the model, and the final basin was divided into 28 sub-basins, as shown in Figure 1. Second, hydrological response unit analysis was performed. The land-use data and soil data were reclassified, and then the threshold value was set. Finally, the hydrological response unit was divided [28], and input data were obtained. Missing or invalid meteorological data, such as precipitation, temperature, wind speed, radiation and relative humidity, were filled in by SwatWeather. After the model construction was completed, a simulation could be run.

2.4. Calibration and Validation of the SWAT Model

In this study, we used the SWAT - CUP to calibrate and validate the model. The time series of observed runoff data on Songcun station was from 2011 to 2018. Therefore, we took 2011–2012 as the preheating period to improve the precision of the model [23]. We further took 2012–2016 as the calibration period and 2017–2018 as the validation period. In this study, SUFI-2 was used for parameter optimization, and the Latin hypercube sampling method was used to obtain the simulated value of the output variable [29]. According to its cumulative distribution of 2.5% and 97.5%, we obtained the total uncertainty of the output result. Parameter sensitivity estimated the average change in the objective function caused by the change in each parameter [30]. Represented by the T-stat and p-value, a greater absolute value of the T-value and a smaller p-value represent a parameter with greater sensitivity [31,32]. In this study, it was specified that the parameter corresponding to p-value < 0.1 was a sensitive parameter.
Based on the measured flow data of the Songcun station, we used three indices to evaluate the simulation accuracy of the SWAT model in the Changyang River basin: the decision coefficient R2, the Nash–Sutcliffe coefficient Ens, and the relative error RE [33]. The calculation formulae are as follows:
R 2 = ( i = 1 n ( Q i o b s Q ) a v e o b s ( Q i s i m Q ) a v e s i m ) 2 i = 1 n ( Q i o b s Q ) a v e o b s 2 i = 1 n ( Q i s i m Q ) a v e s i m 2
E n s = 1 [ i = 1 n ( Q i o b s Q ) i s i m 2 i = 1 n ( Q i o b s Q ) a v e o b s 2 ]
R E = i = 1 n ( Q i o b s Q ) i s i m i = 1 n Q i o b s
where n is the length of the simulated time series, Q      i o b s is the measured runoff value in the ith month, Q       i s i m is the simulated runoff value in the ith month, Q a v e o b s is the simulated average runoff value, and Q a v e o b s is the measured average runoff value. The determination coefficient R2 (range: 0~1) represents the fitting degree between the simulated runoff value and measured runoff value. The closer the calculated R2 is to 1, the higher the fitting degree is. The value range of the Nash–Sutcliffe coefficient is 0~1, and the closer the value is to 1, the better the simulation effect of the model is. If the value of Ens is less than 0, the simulation result of the model is very poor. Only when Ens > 0.5 can the simulation results be accepted. The relative error is less than 0.25, indicating that the model simulation results are reasonable and within the acceptable range [34].

2.5. Scenario Settings

After determining the applicability of the SWAT model in the Changyang River basin, three different scenarios were set up in this study to quantitatively analyze the comprehensive impact of land use and climate change on monthly runoff in the river basin.
We set up four sub-scenarios by using land-use data and meteorological data in different years to explore the individual contribution rates of land use and climate change to runoff. Among these scenarios, we consider scenario 1 as the baseline scenario and explore the impact of climate change on watershed runoff by comparing scenario 1 with scenario 2. At the same time, we further analyze the impact of land use on watershed runoff and the comprehensive impact of land use and climate change on watershed runoff by comparing scenario 1 with scenario 3 and scenario 1 with scenario 4, respectively. Different scenarios are shown in Table 2.
Because the main land-use type in the basin is cultivated land, we combined forestland with grassland and set up two land-use scenarios: expanding cultivated land and returning farmland to forest [21]. The case that combined the land-use data for 2005 and the meteorological data from 1990–2005 were taken as the baseline period. Scenario L1: The scenario of expanding cultivated land. It is strictly forbidden to reclaim farmland in the 25° steep slope zone according to the law of the People’s Republic of China on Soil and Water Conservation [35]. Therefore, we set all woodlands and grasslands with slopes below 25° as cultivated land, and other land-use types except woodlands and grasslands were reserved in this sub-scenario. Scenario L2: The scenario of converting farmland into forest. The specific setting is as follows: all cultivated land with a slope of more than 10° in the basin is converted into woodland, and land-use types other than cultivated land are reserved.
Therefore, we consider it as the baseline scenario of the climate change scenario by inputting the land-use data from 2005 and meteorological data from 1990 to 2005 to the model. The rainfall input data and temperature input data of the model were separately changed to explore the response of watershed runoff to climate change. The following four scenarios were set up: the temperature increases by 1 °C and decreases by 1 °C under unchanged precipitation; the precipitation increases by 10% and decreases by 10% under unchanged temperature.

3. Results

3.1. Model Calibration and Validation

In this study, 28 parameters are related to runoff in the SWAT model, and we selected 15 parameters for sensitivity analysis. The 10 parameters with the strongest sensitivity are listed in Table 3. These parameters had a certain contribution rate to the runoff change, and the most sensitive parameters for runoff in the study area were the curve number (CN2), available water capacity of the soil layer (SOL_ AWC), threshold depth of “base flow” produced by shallow aquifer (GWQMN) and average slope (HRU_SLP), bulk density of saturated soil (SOL_ BD), and Manning’s coefficient of the main stream (CH_N2), etc.
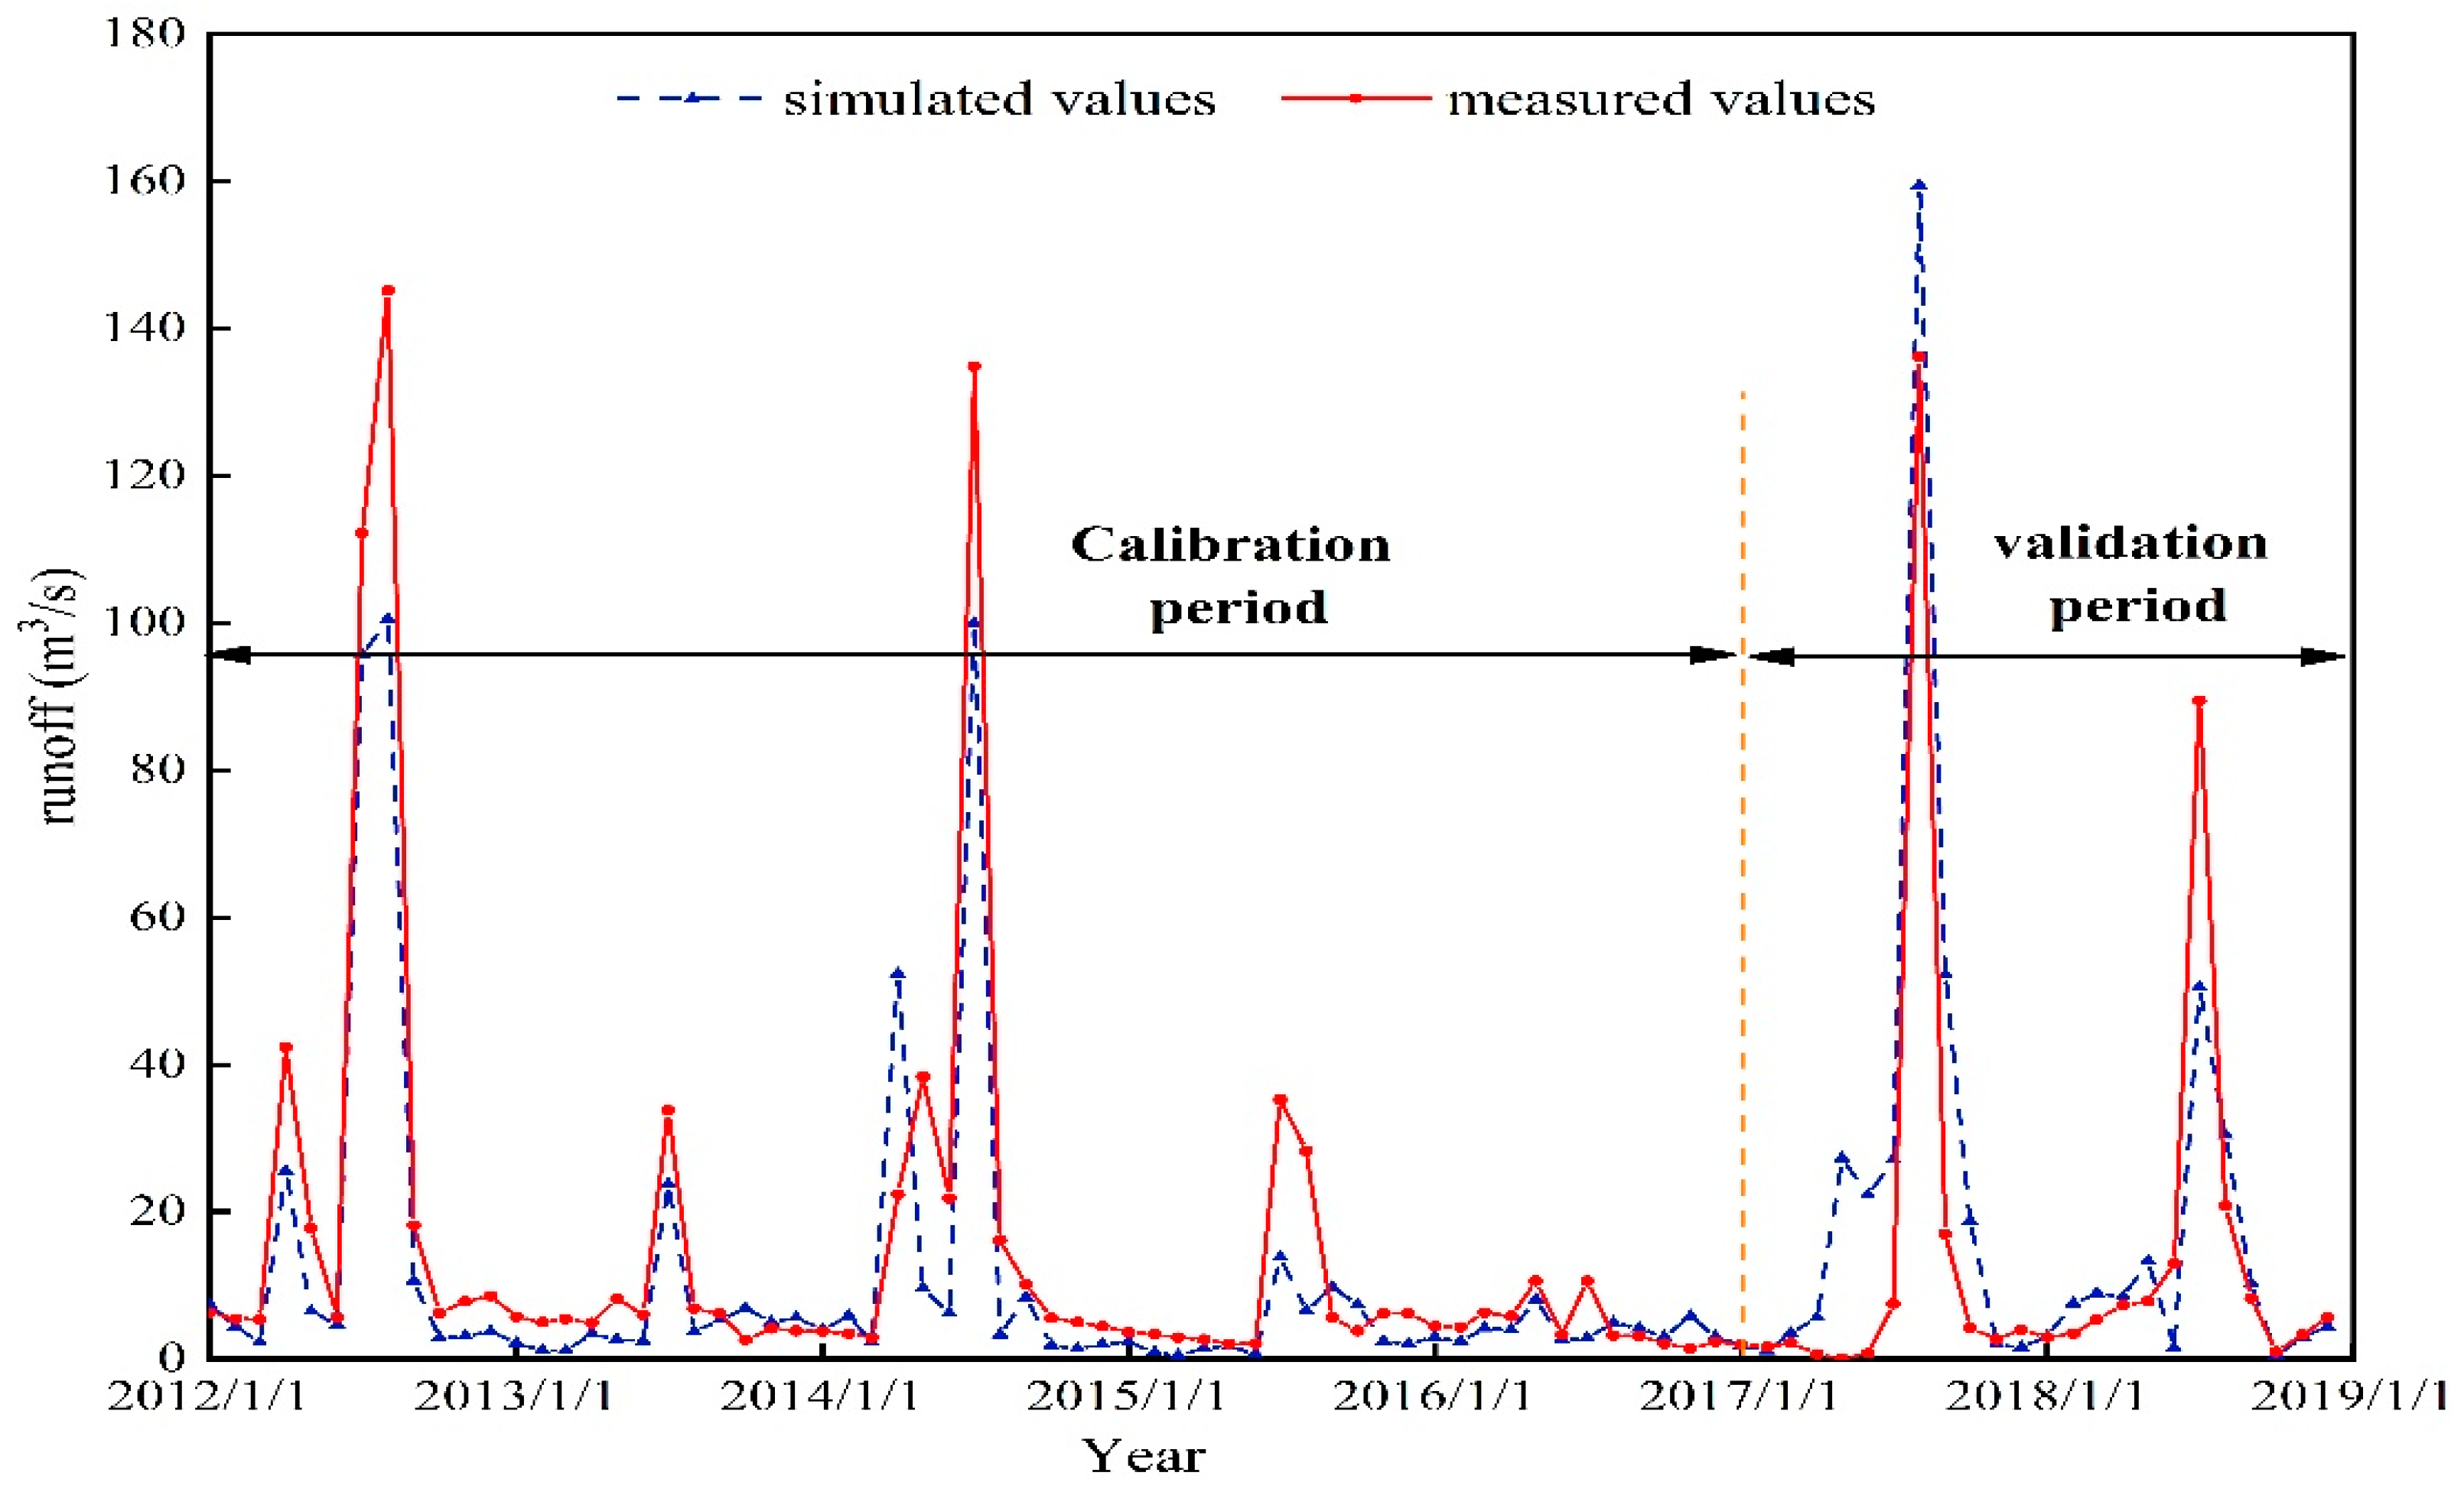
After analyzing parameter sensitivity, the values of R2, Ens and RE in the calibration period were 0.71, 0.68 and 0.128, and the values of R2, Ens and RE in the validation period were 0.68, 0.65 and 0.189, respectively. The results show that the SWAT model has good applicability in the Changyang River basin. The results of calibration and validation are shown in Table 4 and Figure 4.

3.2. Contribution of Land Use and Climate Change to Runoff Variation

In this study, four scenarios were set to analyze the joint influence of land use and climate change on runoff in the basin. The specific results are shown in Table 5. Comparing scenario 1 with scenario 2, the average annual runoff increased by 0.13 m3/s due to climate change from 2006–2018 to 1990–2005, with an increase rate of 20%. The precipitation in 2006–2018 increased by 67.66 mm and 9.7%, and the temperature increased by 0.12 °C and 1.1% compared with the climate from 1990–2005. Comparatively, the variation range of precipitation in the basin was larger than that of temperature. Comparing scenario 1 with scenario 3, the average annual runoff increased by 0.07 m3/s, an increase rate of 10.7% due to the change in land use. We found that the area of arable land decreased and the area of urban land and woodland increased in the basin; among them, the area of urban land increased by 1.33% and the woodland area increased by 0.43% when we compared the land-use situation in 2005 with that in 2017. Therefore, the following reason for this change was analyzed. First, urbanization leads to pavement hardening, which reduces the loss of precipitation by infiltration and increases runoff. Moreover, the increase in the vegetation area will increase the effect of interception on precipitation, which causes more precipitation to convert into evaporation. According to the principle of water balance, the runoff in the basin decreases [36,37]; however, the urban area increases more than the forest area, and the runoff in the basin is largely impacted by urbanization. Therefore, the runoff under such circumstances has a trend of increasing overall.
By comparing scenario 1 and scenario 4, we found that the runoff in the basin increased by 0.22 m3/s, an increase rate of 33.38% under the combined influence of climate change (2006–2018→1990–2005) and land use (2017→2005). There was a superimposed effect between climate change and land use on runoff. Therefore, it can be seen that the runoff in the basin increases due to the synergistic effect of climate change and land use, among which climate change has a more significant impact on the runoff.

3.3. Scenario Analysis of Land Use

Relative variation for different land-use change scenarios is shown in Table 6.Comparing scenario L1 and the baseline scenario, the average annual runoff in the basin increased by 0.03 m3/s and the rate of increase was 4.61% under the scenario where all woodlands and grasslands with a slope less than 25° were converted into cultivated land (cultivated land proportion increased by 8.4% compared with the baseline period). Due to the large use of fertilizer by local residents, soil becomes severely hardened, and the porosity of soil is reduced. Moreover, the main crops in the basin are wheat, corn, and peanuts, and they are shallow tillage crops, which makes the surface soil particles smaller and abates the soil surface aeration water permeability [38]. Therefore, the common effect of both results greatly reduces the soil infiltration capacity and in turn increases the runoff in the basin.
Based on the baseline period, all cultivated land with a slope of 10° or above 10° in the basin is converted into forestland, and other land-use types other than cultivated land are retained (the proportion of forestland increases by 49.57%). The results show that the average annual runoff of the basin decreases by 0.11 m3/s and that the runoff in the base period decreases by 16.92%. The area of cultivated land accounted for over 70% of the entire Changyang basin. Under the circumstances of converting cultivated land into forestland, the complex canopy structure of forest can be a very good rainfall interception mechanism that can increase the evaporation of water. At the same time, the fallen leaves at the bottom of the litter can slow precipitation and increase infiltration, which decreases runoff in the basin. Therefore, it is necessary to promote the conversion of farmland to forests and afforestation projects in areas prone to soil erosion to reduce the generation of runoff.

3.4. Scenario Analysis of Climate Change

Relative variation for different climate change scenarios is shown in Table 7. The model built by land-use data in 2005 and meteorological data from 1990 to 2005 was taken as the baseline scenario when studying the impact of climate change on runoff. When the temperature remained unchanged and precipitation increased by 10% and decreased by 10%, the average annual runoff of the basin increased by 0.08 m3/s and decreased by 0.06 m3/s, respectively, with an increase and decrease in amplitude of 12.31% and 9.23%, respectively. The change in runoff in the Changyang River basin is consistent with the change in precipitation through comparative analysis, and the two variables are positively correlated. When the precipitation in the basin remains unchanged and the temperature increases by 1 °C and decreases by 1 °C, the average annual runoff of the basin decreases by 0.03 m3/s and increases by 0.02 m3/s, respectively, with a decrease rate and an increase rate of 4.62% and 3.07%, respectively. The runoff in the Changyang basin is more affected by the change in precipitation than by the influence of the temperature on runoff. Precipitation is a key variable of water balance in the river basin directly involved in the water cycle process, with a direct impact on runoff [39,40]. However, temperature indirectly affects runoff by changing the distribution pattern of rainfall; thus, the change in runoff is more sensitive to rainfall.

4. Discussion

The use of the SWAT model for the Changyang River basin of Wendeng District, Shandong Province, was established in this study. The monthly runoff simulation results of Songcun Station were calibrated and verified through parameter sensitivity analysis. The scenario analysis method was adopted to explore the response of runoff to land use and climate change.
The SWAT model was endowed with good applicability in the Changyang River basin. Its determination coefficient, efficiency coefficient and relative error were 0.71, 0.68 and 0.128, respectively, in the calibration period (2012 to 2016), and they were 0.68, 0.65 and 0.189, respectively, in the validation period (2017 to 2018). However, there were some uncertainties in the accuracy of the model when it was used in this basin. First, the dominant land-use type in this basin is cultivated land, which accounts for more than 70% of the Changyang River basin. Therefore, due to human seasonal cultivation, land use played a great role in the underlying surface of the basin and had an impact on runoff, which might affect the model simulation accuracy, such as cultivating corn in April and wheat in September [41]. In addition, there were more uncertain factors that should be further considered in the SWAT model. Aimed at a specific basin, we should conduct the sensitivity analysis about the parameters before parameter calibration. After screening out the parameters, the value range of sensitivity parameters should also be considered for its great impact on the results of runoff simulation. For example, the value range of CN2 is about 35–98. The value range is less and the uncertainty interval is narrower so that we can improve the confidence level.
However, it reduces the sensitivity of the parameters so it needs comprehensive consideration before we run the SWAT model. Therefore, it is necessary to further analyze the model’s uncertain factors to improve its simulation accuracy in the basin.
According to the results of the comprehensive scenario of land use and climate change regarding runoff, both land use and climate change contributed to runoff change. Compared with scenario 1, the runoff decreased by 0.22 m3/s due to the combined effects of land use and climate change. Therefore, the runoff increased by 0.07 m3/s and 0.13 m3/s due to changes in land use and climate change, respectively. Climate change has been shown to play a more significant role in runoff than changes in land use. By changing the input data, including meteorological data and land-use data, we obtained separate contribution rates of climate change and land use to runoff. The scenario of climate change was relatively simple and fixed, and we obtained the variation trend under the combinatorial scenario [42]. In the future, the scenario settings about climate change and land use can be more accurate and based on the actual climate, which would provide more guidance for water resource planning [43].
There were two scenarios set for the cultivated land area of the basin in the land-use change scenario. According to the calculated results, compared with the baseline period, the runoff of the basin increased by 0.03 m3/s and decreased by 0.11 m3/s under the scenarios of expanding cultivated land and returning farmland to forest, respectively. Due to the large cultivated land area of the basin, the forestland area increased greatly. This increase led to a significant reduction in runoff because forestland played a dominant role in runoff change, and the simulated results were in line with the actual theory.
The annual runoff increased by 0.08 m3/s and decreased by 0.06 m3/s, respectively, when the precipitation increased by 10% and decreased by 10%, respectively, under the unchanged temperature in the scenario of climate change. It was found that the runoff change in the Changyang River basin was positively correlated with precipitation change. The annual runoff decreased by 0.03 m3/s and increased by 0.02 m3/s when the temperature increased by 1 °C and decreased by 1 °C, respectively, under unchanged precipitation. The temperature growth played a negative role in the annual average flow, and the change in runoff was more sensitive to precipitation factors. In terms of the impact scenario of climate change on runoff, it is necessary to consider the impacts of various factors on runoff instead of limiting research attention on only temperature and precipitation. Other meteorological factors, such as radiation and relative humidity, are changed in the context of climate change. It is possible to further analyze the impacts of other climate change factors on runoff in future research.

5. Conclusions

Aimed at the Changyang River basin, which is a typical coastal basin in Northern China, this study established a SWAT model in Changyang River basin and assessed its runoff variation to climate change and land use quantitatively. The results show (1) the SWAT model obtains good performance in this river basin and the R2 and ENS of the model are 0.71 and 0.68 in the calibration period, respectively. (2) Climate change has a significant impact on the hydrological change compared to land use, and caused the runoff in the basin to increase by 0.13 m3/s, which was mainly influenced by the increased precipitation. Furthermore, the change in runoff is positively correlated with the change in precipitation. (3) Land-use change has caused the runoff in the basin to increase by 0.07 m3/s which is attributed to the decreased area of arable land and the increased area of urban land in the basin. In short, the study states that the SWAT model can be applied in coastal basins and the results provide the theoretical data support for the local water resources managers on how to allocate water resources properly in a typical coastal basin.

Author Contributions

Conceptualization, J.L. and B.X.; methodology, Y.Y.; formal analysis, J.L.; writing—original draft preparation, J.L.; writing—review and editing, B.X. All authors have read and agree to the published version of the manuscript.

Funding

This study was supported by the National Natural Science Foundation of China (Grant 31670451).

Conflicts of Interest

The authors declare no conflict of interest.

References

  1. Barnett, T.P.; Adam, J.C.; Lettenmaier, D.P. Potential impacts of a warming climate on water availability in snow-dominated regions. Nature 2005, 438, 303–309. [Google Scholar] [CrossRef] [PubMed]
  2. Yao, J.; Wang, G.; Xue, W.; Yao, Z.; Xue, B. Assessing the Adaptability of Water Resources System in Shandong Province, China, Using a Novel Comprehensive Co-evolution Model. Water Resour. Manag. 2019, 33, 657–675. [Google Scholar] [CrossRef]
  3. Iqbal, Z.; Shahid, S.; Ahmed, K.; Ismail, T.; Khan, N.; Virk, Z.T.; Johar, W. Evaluation of global climate models for precipitation projection in sub-Himalaya region of Pakistan. Atmos. Res. 2020, 245, 105061. [Google Scholar] [CrossRef]
  4. Sabbaghi, M.A.; Nazari, M.; Araghinejad, S.; Soufizadeh, S. Economic impacts of climate change on water resources and agriculture in Zayandehroud river basin in Iran. Agric. Water Manag. 2020, 241, 106323. [Google Scholar] [CrossRef]
  5. Dragoi, E.-N.; Vasseghian, Y. Modeling of mass transfer in vacuum membrane distillation process for radioactive wastewater treatment using artificial neural networks. Toxin Rev. 2020, 1–10. [Google Scholar] [CrossRef]
  6. Vörösmarty, C.J.; McIntyre, P.B.; Gessner, M.O.; Dudgeon, D.; Prusevich, A.; Green, P.; Glidden, S.; Bunn, S.; Sullivan, C.A.; Liermann, C.R.; et al. Global threats to human water security and river biodiversity. Nature 2010, 467, 555–561. [Google Scholar] [CrossRef]
  7. Xue, B.; Wang, G.; Xiao, J.; Tan, Q.; Shrestha, S.; Sun, W.; Liu, T. Global evapotranspiration hiatus explained by vegetation structural and physiological controls. Ecol. Eng. 2020, 158, 106046. [Google Scholar] [CrossRef]
  8. Aryal, Y.; Zhu, J. Effect of watershed disturbance on seasonal hydrological drought: An improved double mass curve (IDMC) technique. J. Hydrol. 2020, 585, 124746. [Google Scholar] [CrossRef]
  9. Liu, J.; Xue, B.; Sun, W.; Guo, Q. Water balance changes in response to climate change in the upper Hailar River Basin, China. Hydrol. Res. 2020, 51, 1023–1035. [Google Scholar] [CrossRef]
  10. Zhuang, Y.; Zhang, J. Diurnal asymmetry in future temperature changes over the main Belt and Road regions. Ecosyst. Heal. Sustain. 2020, 6. [Google Scholar] [CrossRef] [Green Version]
  11. Xue, B.; Wang, G.; Xiao, J.; Helman, D.; Sun, W.; Wang, J.; Liu, T. Global convergence but regional disparity in the hydrological resilience of ecosystems and watersheds to drought. J. Hydrol. 2020, 591, 125589. [Google Scholar] [CrossRef]
  12. Xu, X.; Yang, D.; Yang, H.; Lei, H. Attribution analysis based on the Budyko hypothesis for detecting the dominant cause of runoff decline in Haihe basin. J. Hydrol. 2014, 510, 530–540. [Google Scholar] [CrossRef]
  13. Xue, B.-L.; Guo, Q.; Hu, T.; Wang, G.; Wang, Y.; Tao, S.; Su, Y.; Liu, J.; Zhao, X. Evaluation of modeled global vegetation carbon dynamics: Analysis based on global carbon flux and above-ground biomass data. Ecol. Model. 2017, 355, 84–96. [Google Scholar] [CrossRef] [Green Version]
  14. Li, Q.; Wei, X.; Zhang, M.; Liu, W.; Giles-Hansen, K.; Wang, Y. The cumulative effects of forest disturbance and climate variability on streamflow components in a large forest-dominated watershed. J. Hydrol. 2018, 557, 448–459. [Google Scholar] [CrossRef]
  15. Li, X.; Cheng, G.; Ge, Y.; Li, H.; Han, F.; Hu, X.; Tian, W.; Tian, Y.; Pan, X.; Nian, Y.; et al. Hydrological Cycle in the Heihe River Basin and Its Implication for Water Resource Management in Endorheic Basins. J. Geophys. Res. Atmos. 2018, 123, 890–914. [Google Scholar] [CrossRef]
  16. Saha, A.; Joseph, J.; Ghosh, S. Climate controls on the terrestrial water balance: Influence of aridity on the basin characteristics parameter in the Budyko framework. Sci. Total. Environ. 2020, 739, 139863. [Google Scholar] [CrossRef] [PubMed]
  17. Yan, Y.; Xue, B.; Sun, W.; Zhang, H. Quantification of climate change and land cover/use transition impacts on runoff variations in the upper Hailar Basin, NE China. Hydrol. Res. 2020, 51, 976–993. [Google Scholar] [CrossRef]
  18. Yang, J.; Reichert, P.; Abbaspour, K.; Xia, J.; Yang, H. Comparing uncertainty analysis techniques for a SWAT application to the Chaohe Basin in China. J. Hydrol. 2008, 358, 1–23. [Google Scholar] [CrossRef]
  19. Cuo, L.; Zhang, Y.; Gao, Y.; Hao, Z.; Cairang, L. The impacts of climate change and land cover/use transition on the hydrology in the upper Yellow River Basin, China. J. Hydrol. 2013, 502, 37–52. [Google Scholar] [CrossRef]
  20. Bao, Z.; Zhang, J.; Wang, G.; Chen, Q.; Guan, T.; Yan, X.; Liu, C.; Liu, J.; Wang, J. The impact of climate variability and land use/cover change on the water balance in the Middle Yellow River Basin, China. J. Hydrol. 2019, 577. [Google Scholar] [CrossRef]
  21. Zuo, D.P.; Xu, Z.X.; Lin, F. Spatiotemporal variation of available water resources in the Muzhu River basin. J. Beijing Norm. Univ. 2014, 50, 461–466. [Google Scholar]
  22. Zhang, H.; Xue, B.; Yan, Y. Impact of Climate and Land Use Change on Runoff in Huanglei River Basin Based on SWAT Model. J. Beijing Norm. Univ. 2020, 3, 445–453. [Google Scholar]
  23. Wang, D.; Hejazi, M. Quantifying the relative contribution of the climate and direct human impacts on mean annual streamflow in the contiguous United States. Water Resour. Res. 2011, 47. [Google Scholar] [CrossRef] [Green Version]
  24. Cui, F.X.; Agrusa, J.; George, B.P.; Lema, J. What Could Tourism Do to a Small Fishing Village: A Case Study of the City of Weihai, China. Tur. Estud. E Prat. 2015, 4, 85–107. [Google Scholar]
  25. Sun, H.; Wang, Q.; Gao, Z.; Chen, M. Analysis on land use changes and their driving forces in Weihai City between 2005 and 2015. Remote Sens. Modeling Ecosyst. Sustain. XV 2018, 10767, 107670U. [Google Scholar] [CrossRef]
  26. Lin, Q.; Guo, J.; Yan, J.; Heng, W. Land use and landscape pattern changes of Weihai, China based on object-oriented SVM classification from Landsat MSS/TM/OLI images. Eur. J. Remote. Sens. 2018, 51, 1036–1048. [Google Scholar] [CrossRef] [Green Version]
  27. Wang, G.; Yang, H.; Wang, L.; Xu, Z.; Xue, B. Using the SWAT model to assess impacts of land use changes on runoff generation in headwaters. Hydrol. Process. 2012, 28, 1032–1042. [Google Scholar] [CrossRef]
  28. Arnold, J.G.; Srinivasan, R.; Muttiah, R.S.; Williams, J.R. Large area hydrologic modeling and assessment part i: Model development. JAWRA J. Am. Water Resour. Assoc. 1998, 34, 73–89. [Google Scholar] [CrossRef]
  29. Moriasi, D.N.; Arnold, J.G.; Van Liew, M.W.; Bingner, R.L.; Harmel, R.D.; Veith, T.L. Model Evaluation Guidelines for Systematic Quantification of Accuracy in Watershed Simulations. Trans. ASABE 2007, 50, 885–900. [Google Scholar] [CrossRef]
  30. Bhatta, B.; Shrestha, S.; Shrestha, P.K.; Talchabhadel, R. Evaluation and application of a SWAT model to assess the climate change impact on the hydrology of the Himalayan River Basin. Catena 2019, 181, 104082. [Google Scholar] [CrossRef]
  31. Liu, W.; Park, S.; Bailey, R.T.; Molina-Navarro, E.; Andersen, H.E.; Thodsen, H.; Nielsen, A.; Jeppesen, E.; Jensen, J.S.; Trolle, D. Quantifying the streamflow response to groundwater abstractions for irrigation or drinking water at catchment scale using SWAT and SWAT–MODFLOW. Environ. Sci. Eur. 2020, 32, 1–25. [Google Scholar] [CrossRef]
  32. Anoh, K.A.; Koua, T.J.J.; Kouamé, K.J.; Jourda, J.P.; Laurent, F. Modelling water flow in a complex watershed in humid a tropical area using SWAT: A case study of Taabo watershed in Ivory Coast. Int. J. River Basin Manag. 2017, 16, 157–167. [Google Scholar] [CrossRef]
  33. Sun, W.; Fan, J.; Wang, G.; Ishidaira, H.; Bastola, S.; Yu, J.; Fu, Y.H.; Kiem, A.S.; Zuo, D.; Xu, Z. Calibrating a hydrological model in a regional river of the Qinghai–Tibet plateau using river water width determined from high spatial resolution satellite images. Remote. Sens. Environ. 2018, 214, 100–114. [Google Scholar] [CrossRef]
  34. Bailey, R.; Rathjens, H.; Bieger, K.; Chaubey, I.; Arnold, J. SWATMOD-Prep: Graphical User Interface for Preparing Coupled SWAT-MODFLOW Simulations. JAWRA J. Am. Water Resour. Assoc. 2017, 53, 400–410. [Google Scholar] [CrossRef]
  35. Van Griensven, A.; Meixner, T.; Grunwald, S.; Bishop, T.; DiLuzio, M.; Srinivasan, R. A global sensitivity analysis tool for the parameters of multi-variable catchment models. J. Hydrol. 2006, 324, 10–23. [Google Scholar] [CrossRef]
  36. Cibin, R.; Sudheer, K.P.; Chaubey, I. Sensitivity and identifiability of stream flow generation parameters of the SWAT model. Hydrol. Process. 2010, 24, 1133–1148. [Google Scholar] [CrossRef]
  37. Babalola, T.E.; Oguntunde, P.G.; Ajayi, A.E.; Akinluyi, F.O.; Sutanudjaja, E.H. Evaluating a finer resolution global hydrological model’s simulation of discharge in four West-African river basins. Model. Earth Syst. Environ. 2020, 1–12. [Google Scholar] [CrossRef]
  38. Asl-Rousta, B.; Mousavi, S.J.; Ehtiat, M.; Ahmadi, M. SWAT-Based Hydrological Modelling Using Model Selection Criteria. Water Resour. Manag. 2018, 32, 2181–2197. [Google Scholar] [CrossRef]
  39. Cao, F.; Li, J.; Fu, X.; Wu, G. Impacts of land conversion and management measures on net primary productivity in semi-arid grassland. Ecosyst. Health Sustain. 2020, 6. [Google Scholar] [CrossRef] [Green Version]
  40. Mustafin, R.F.; Sultanova, R.R.; Khasanova, L.M.; Rajanova, A.R.; Khazipova, A.F. Influence of Intensity of Rain Strains and Slopes on the Development of Soil Erosion under the Forest. J. Environ. Account. Manag. 2020, 8, 387–395. [Google Scholar] [CrossRef]
  41. Teuling, A.J.; De Badts, E.A.G.; Jansen, F.A.; Fuchs, R.; Buitink, J.; Van Dijke, A.J.H.; Sterling, S. Climate change, reforestation/afforestation, and urbanization impacts on evapotranspiration and streamflow in Europe. Hydrol. Earth Syst. Sci. 2019, 23, 3631–3652. [Google Scholar] [CrossRef] [Green Version]
  42. Sang, L.; Zhang, C.; Yang, J.; Zhu, D.; Yun, W. Simulation of land use spatial pattern of towns and villages based on CA–Markov model. Math. Comput. Model. 2011, 54, 938–943. [Google Scholar] [CrossRef]
  43. Mango, L.M.; Melesse, A.M.; McClain, M.E.; Gann, D.; Setegn, S.G. Land use and climate change impacts on the hydrology of the upper Mara River Basin, Kenya: Results of a modeling study to support better resource management. Hydrol. Earth Syst. Sci. 2011, 15, 2245–2258. [Google Scholar] [CrossRef] [Green Version]
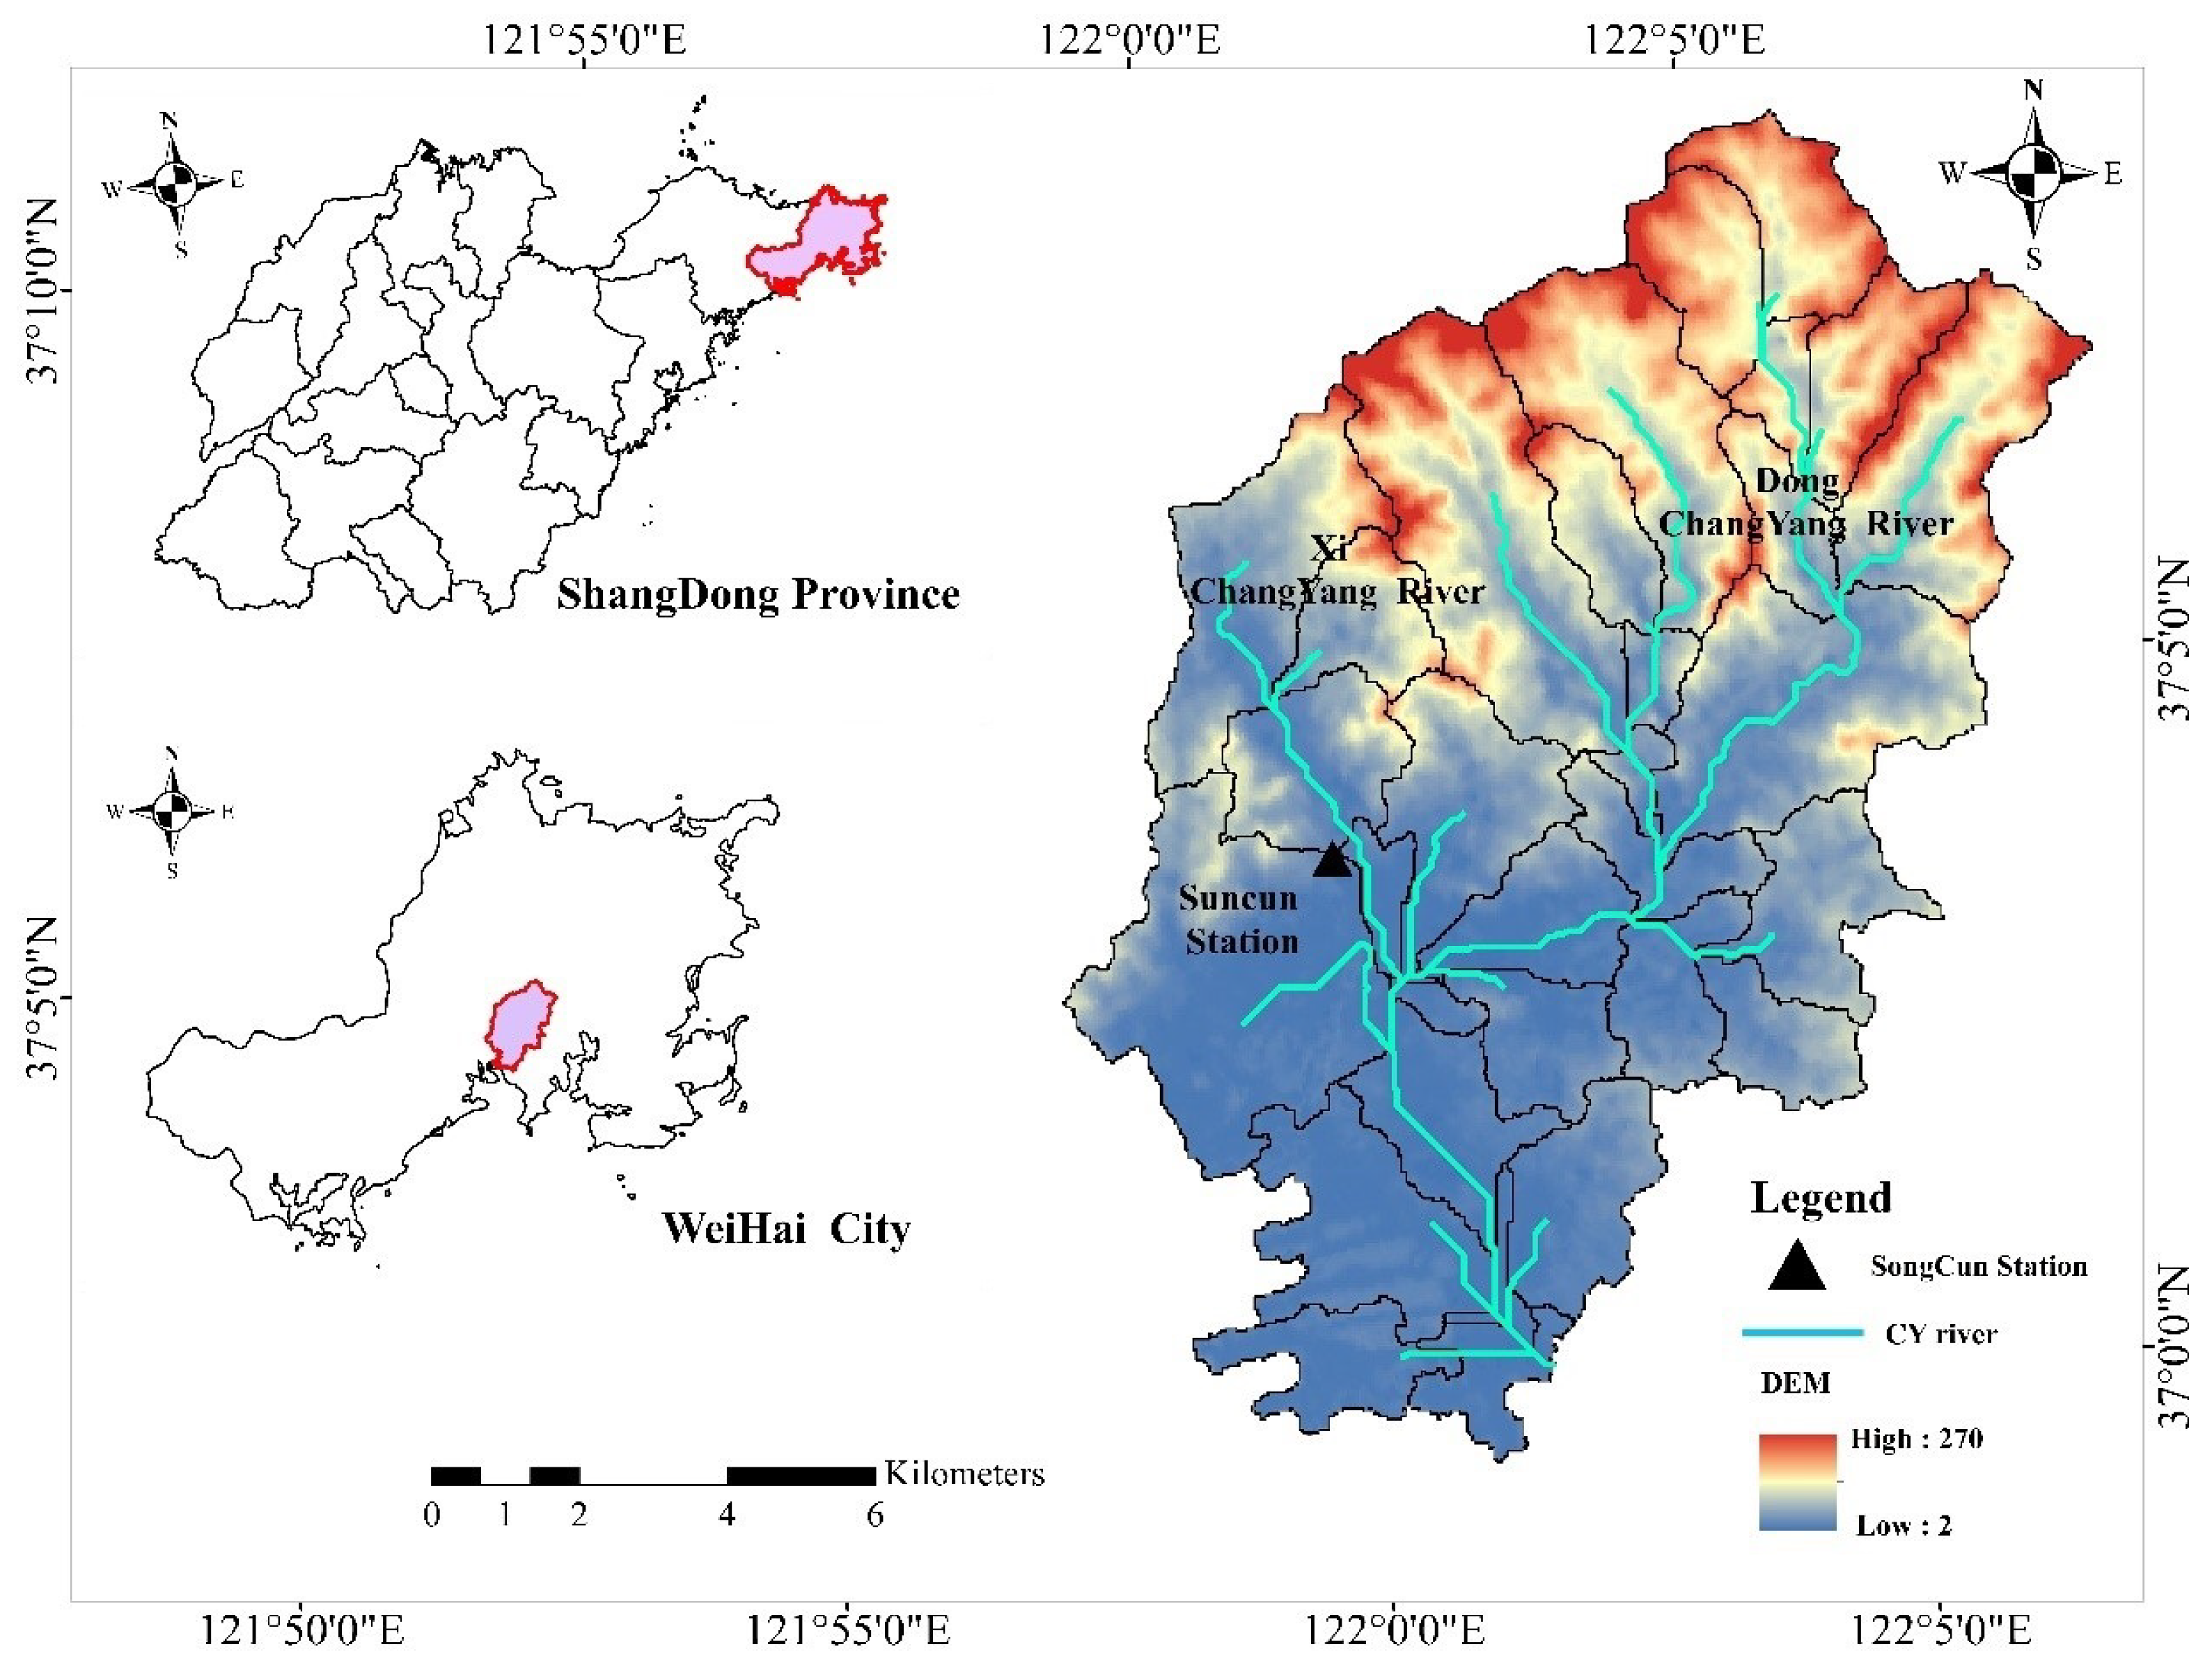
Figure 1. Map showing the location of the Changyang River basin.
Sustainability 12 10050 g001
Figure 2. Average seasonal precipitation, runoff and temperature.
Sustainability 12 10050 g002
Figure 3. Distribution of land use/cover types in 2017 (a) and distribution of soil types (b).
Sustainability 12 10050 g003
Figure 4. Measured and simulated monthly streamflow graphs (Songcun Station) for the calibration period and the validation period.
Sustainability 12 10050 g004
Table 1. Land-use data in the Changyang River basin (%).
YearCultivated LandUrban LandForest AreaWater AreaGrasslandUnused Land
200574.5812.319.402.111.400.15
201772.3613.649.831.922.070.14
Table 2. Integrated simulation scenarios of land use and climate change impacts on runoff.
ScenariosLand Use/Cover DataMeteorological Data
120051990–2005
220052006–2018
320171990–2005
420172006–2018
Table 3. Parameter sensitivity analysis.
RankParameter NameVariable Namet-Statp-Value
1CN2Curve number4.820.00
2SOL_AWCAvailable water capacity of the soil layer4.360.00
3GWQMNThreshold depth of “base flow” from shallow aquifer3.950.00
4HRU_SLPAverage slope3.690.00
5SOL_BDBulk density of saturated soil2.880.00
6CH_N2Manning’s coefficient of the main stream2.370.01
7REVAPMNThreshold of water level of shallow aquifer2.050.07
8SOL_ALBThe albedo of moist soil–1.890.13
9SURLAGLag coefficient of surface runoff–1.630.15
10MSK_CO1Muskingum coefficient1.230.19
Table 4. The results of calibration and validation.
PeriodHydrological StationR2ENSRE
CalibrationSongcun station0.710.680.128
ValidationSongcun station0.680.650.189
Table 5. Relative variation in mean annual runoff for different scenarios.
ScenarioAnnual Mean Precipitation
(mm)
Annual Mean Temperature
(mm)
Annual Mean Runoff
(m3/s)
Variation of Runoff
(m3/s)
Variation Rate of Runoff
(%)
1690.6910.620.65
2758.3510.740.78+0.13+20
3690.6910.620.72+0.07+10.7
4758.3510.740.870.22+33.38
Table 6. Relative variation in mean annual runoff for different land-use change scenarios.
ScenarioAnnual Mean Runoff (m3/s)Variation of Runoff (m3/s)Variation Rate of Runoff (%)
Baseline scenario0.65
L10.68+0.03+4.61
L20.54–0.11–16.92
Table 7. Relative variation in mean annual runoff for different climate change scenarios.
ScenarioVariationAnnual Mean Runoff (m3/s)The Change of Runoff (m3/s)The Change Rate of Runoff (%)
+10%0.73+0.08+12.31
Precipitation00.65
−10%0.59−0.06−9.23
+1 °C0.62−0.03−4.62
Temperature00.65
−1 °C0.67+0.02+3.07
Publisher’s Note: MDPI stays neutral with regard to jurisdictional claims in published maps and institutional affiliations.