Article

Smart-Guided Pedestrian Emergency Evacuation in Slender-Shape Infrastructure with Digital Twin Simulations

1
Key Laboratory of Concrete and Prestressed Concrete Structures of the Ministry of Education, Southeast University, Nanjing 211189, China
2
National and Local Joint Engineering Research Center for Intelligent Construction and Maintenance, Nanjing 211189, China
3
Institute of Microelectronics, Agency for Science, Technology and Research, Singapore 138634, Singapore
4
School of Transportation, Southeast University, Nanjing 211189, China
*
Author to whom correspondence should be addressed.
These authors contributed equally to this work.
Sustainability 2020, 12(22), 9701; https://doi.org/10.3390/su12229701
Submission received: 2 November 2020 / Revised: 13 November 2020 / Accepted: 18 November 2020 / Published: 20 November 2020

Abstract

:
Rapid exploitation of city underground space has led to the development of increasingly more underground slender-shape infrastructure like pedestrian tunnels, concourses, subway walkways, underground shopping streets, etc. Pedestrian evacuation in those public places in case of emergency can be disastrous if not properly guided. Therefore, it is important to understand how to enhance the evacuation efficiency through proper active guidance. In this study, we propose a digital twin based guiding system for pedestrian emergency evacuation inside a slender-shape infrastructure, aiming at enhancing the overall evacuation efficiency. Composition and calibration process of the guiding system are described, and a cellular automata based model is established to serve as the digital twin model. Two guidance strategies, namely traditional fixed guidance and smart guidance, are adopted by the digital twin to generate guidance instructions. A smart guidance strategy using a semi-empirical approach is proposed based on the understanding of the free movement and congested movement of pedestrian flow. Systems under different guiding strategies are compared and discussed over their effectiveness to promote excavation efficiency in different pedestrian population distribution settings. The simulation results show that a system under smart guidance tends to have shorter evacuation time (up to 23.8% time saving) and performs with more stability for pedestrian evacuations over the traditional fixed guided systems. The study provides insight for potential real applications of a similar kind.

1. Introduction

Rapid exploitation of city underground space has led to the development of increasingly more underground infrastructure characterized by their slender shape, like pedestrian tunnels, concourses, subway walkways, underground shopping streets, underpasses, subway station platforms, etc. Those public spaces can become crowded during special events or severe emergency situations like in fire accidents. Crowd congestion can be disastrous if not handled properly [1,2,3]. For these slender structures, people can easily get disoriented and confused during emergencies, which may lead to chaos and life threating scenarios. Effective guidance systems could greatly enhance the effectiveness of evacuations [4], especially for infrastructure with multiple exits where non-guided behavior of pedestrians can be chaotic. Therefore, it is crucial to understand the movement of pedestrians and the role that guidance plays for these pedestrian emergency evacuations.
One way to learn more about the pedestrian dynamics during an evacuation is by conducting realistic numerical simulations. Many types of models can be used for describing pedestrian flows, such as macroscopic fluid-dynamic and gas-kinetic models [5,6,7,8,9], microscopic noninteger off-lattice models and microscopic cellular automata (CA) [10,11,12].
CA models share the characteristic of simplicity and amenability in the numerical simulations in comparison with the off-lattice models. Therefore, they have been applied as an effective tool for realistically modeled particle-like objects in complex nonlinear systems, such as vehicular traffic flow [13,14,15]. By introducing proper empirical rules, a CA model can also be used for the simulation of pedestrian dynamics and is well-suited for modelling pedestrian behavior in emergency evacuations. Fukui and Ishibashi (FI) proposed a CA model for bi-directional pedestrian flow simulation in passageway [16,17]. A floor field model was proposed to capture the interactions between pedestrians by introducing ideas from chemotaxis [18,19]. More realistic simulations were achieved by variations and combination of the FI model and the field floor model to arrive at more realistic fundamental diagrams [20,21,22,23]. To take into consideration the stochastic nature of the pedestrian flow, a pre-fixed probability model and a list-based kinetic Monte Carlo method were applied to the CA modelling process [24,25,26,27]. Bi-direction pedestrian flows with different walk speeds were also examined using a CA model based on kinetic Monte Carlo method [25].
Out of the consideration for pedestrian flow characteristics, previous studies also considered effects of various influencing factors in evacuations. For example, the influence of obstacles and geometrical parameters such as gate location and width were studied [10,28]. The probabilistic simulation of fire spreading effect and its impact on pedestrian behaviors were included in the modelling process [29]. The effect of fire location on routing determination and moving velocity of pedestrians were examined [30]. However, the objective of these delicate simulations were normally aimed at improving the internal space design for pedestrian facilities, and thus they shared passive nature in general, meaning that these studies tended to focus on understanding spontaneous reactions of pedestrians rather than to improve the evacuation efficiency by imposing active strategic guidance. In fact, to the best knowledge of the authors, very few studies have yet incorporated such active guidance and their impacts in pedestrian evacuation simulations using CA simulations.
With the rapid growth of information technologies and operation technologies, significant efforts have been made in the manufacturing sector to achieve smarter and more proactive management systems [31]. Industry 4.0 [32], a concept from Germany, specializes mainly in the manufacturing industry, highlights the importance of establishing a cyber-physical system (CPS) where the physical space and cyber space share deep coupling with each other. The CPSs are capable of synchronizing the real processes with its digital copy in cyber space in real time through data communication. In the cyber space, smart algorithms and artificial intelligence process the incoming data and feed the results back to the physical space in various ways. In essence, Industry 4.0 is the trend towards automation and data exchange in manufacturing technologies and processes characterized by CPSs, supported by technologies such as the internet of things (IoT), cloud computing, cognitive computing, artificial intelligence, and so on [33,34,35]. The establishment of CPS can greatly improve the way that complex systems can be interpreted to support their maintenance, enabling a new simulation approach, which benefit from the ubiquitous connectivity in manufacturing systems to offer a real-time synchronization between the physical asset and its digital representation. This simulation approach is generally referred to as the elaboration of Digital Twins (DT) [36].
A Digital Twin is a high-fidelity representation of the operational dynamics of its physical counterpart, enabled by near real-time synchronization between the cyberspace and physical space [37]. The convergence of the digital world and physical world enables smart decisions to be made at every single point of manufacturing operations, thus nurturing a data-driven smart manufacturing environment. Therefore, DT provide a means of simulating, predicting, and optimizing physical manufacturing systems and processes. Using DT, together with intelligent algorithms, organizations can achieve data-driven operation monitoring and optimization, develop innovative products and services, and diversify value creation and business models [38,39]. So far, many applications of DT have been focusing on systems and processes in manufacturing sectors [39,40,41,42], although some illustrations have been attempted in the field of architecture [43], railway turnout systems [44], and bridges [45], with the aim of enabling design improvement, operational instructions, as well as failure and fatigue prediction. While digital twin concept has grown in popularity in various research studies, as well as applications in the manufacturing sectors, their applications in the area of public safety and infrastructure maintenance are still quite limited.
In this study, we will try to bring the digital twin concept into pedestrian evacuation guidance for slender-shaped infrastructure, focusing on the effects of active guidance and their respective effects on evacuations. The basic idea is to establish a digital twin based on a simple CA model where real-time locations of pedestrians can be periodically updated based on monitored information. We firstly introduce the general idea and composition of the proposed system. We then introduce the pedestrian movement rules of the CA model to simulate pedestrian dynamics during evacuations. Afterwards, two basic guidance strategies are proposed based on which active guidance can be arrived based on the known information of pedestrian distribution. In order to test the effectiveness of the proposed guidance strategy, parametric studies are performed and discussed for different guidance strategies over different pedestrian initial distributions to simulate different possible scenarios in reality. Factors like pedestrian population density and crowd localization are the main factors under consideration. The study offers insights over the potential improvement of introducing active guidance strategies in pedestrian emergency evacuations, which is meaningful for potential real world applications.

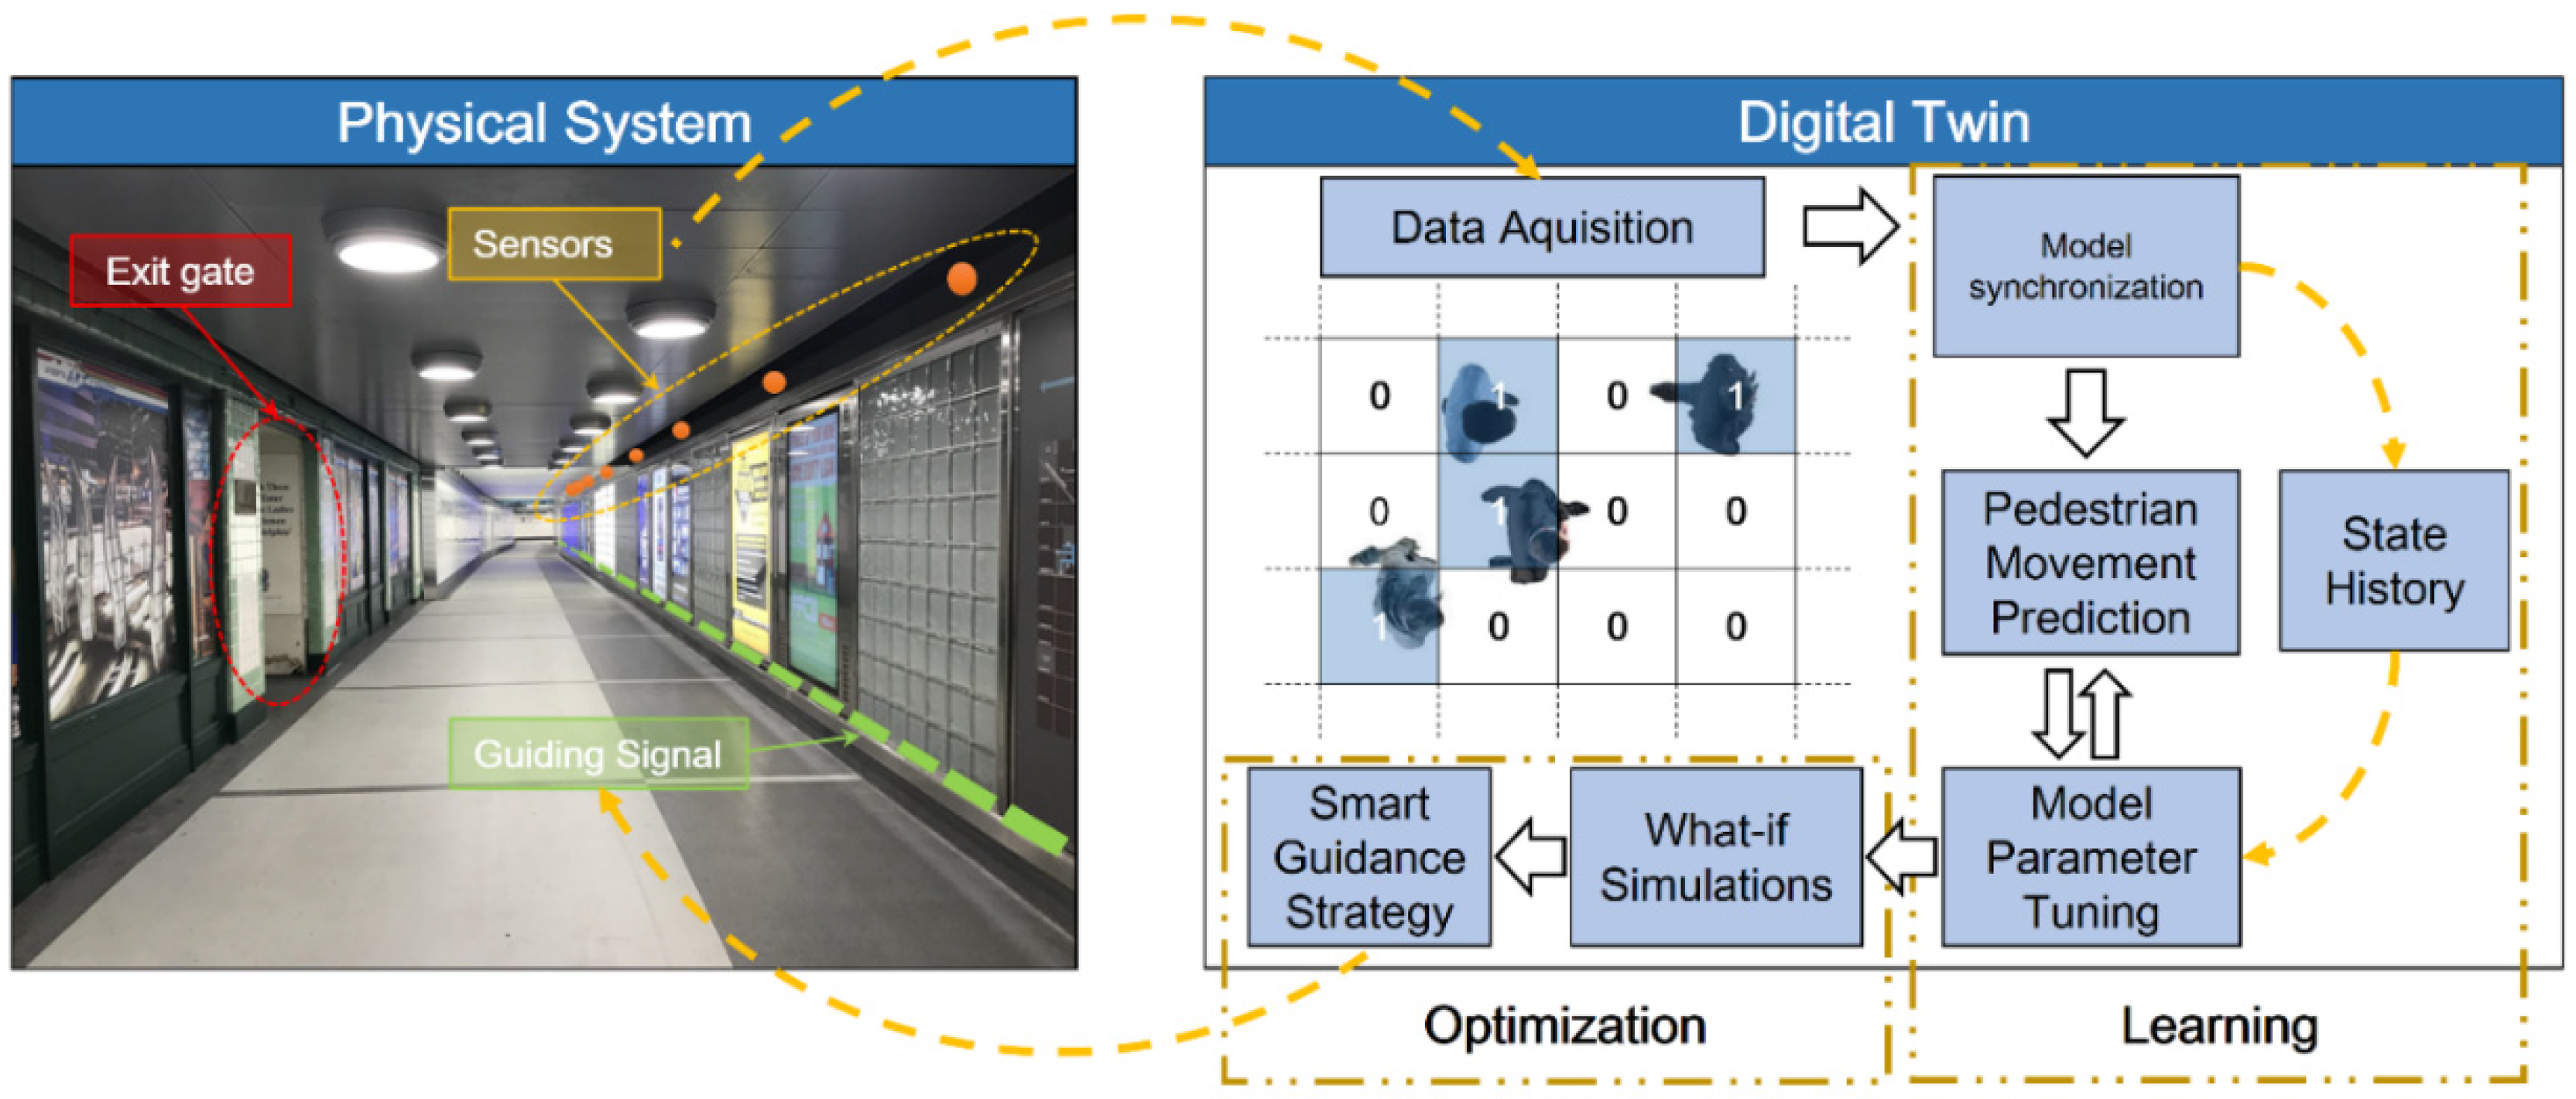
2. Smart Guidance through Digital Twin Simulations

For people in an emergency evacuation situation, making informed decisions to evacuate for safety can be difficult, due to various factors such as misinformation, panic disorders, or blocked view. Their chances of survival would be significantly enhanced if an effective guidance system were presented. However, the current guidance systems for emergency evacuations are normally designed according to the geometry of the internal space of the infrastructure alone which typically set in guiding directions. Naturally, the fixed guidance system could only be expected to work properly under certain conditions, and can fail to effectively accommodate for other cases. Therefore, it is meaningful to introduce a guidance system that would adaptively alter in guidance direction according to the current pedestrian population distribution and geometry of the infrastructure internal space.
In this study, we bring in the concept of digital twin to represent the condition of the pedestrian distribution inside a slender shape infrastructure. Figure 1 demonstrates a schematic diagram of a DT concept for an underground pedestrian tunnel. Because the distribution of pedestrians in the infrastructure in every given time is different, the evacuation efficiency will subsequently be affected if an emergency should occur. The infrastructure can be monitored by various sensors, which may potentially include computer vision based sensors, temperature sensors, and smog sensors, which can provide sufficient accuracy information regarding the distribution of people inside the infrastructure as well as its current service state. The functionality of the sensing system should be robust enough to cope with difficult situations such as fire or smoke, depending on specific application of the infrastructure. All these sensors are then connected with the Internet of Things (IoT) to share information, which are then integrated through a data acquisition system and sent to the digital twin. IoT refers to connections between a network of physical assets through which data can flow between themselves. The connections are made possible by the secure implementation of computer networks, the Internet, and communication protocols. The IoT is the infrastructure in the physical space for connecting physical assets [46].
Pedestrian behavioral dynamics in emergency evacuations are sophisticated on both the individual and system level. In this study, movement dynamics of pedestrians during evacuation are of our main concern. Therefore, a CA based model seems to be an ideal candidate to form the digital twin which offers high versatility and calculation efficiency. Details of the model will be introduced in the next section. Due to the fact that a CA model naturally divides the infrastructure internal space into discrete cells, it is very easy to synchronize the digital twin with pedestrians’ location obtained by a monitoring system registering into corresponding cells, as shown schematically in Figure 1. Based on the synchronized state, this evacuation model can then make prediction of pedestrian movement and constantly compare the predicted results with the monitored states, based on which it can get its parameters estimated and tuned to keep the model up to date. Parameter tuning can be achieved based on data driven approaches through machine learning by minimizing the difference of the predicted state and the monitored states. After these, we create a digital duplicate of the current state for the evacuation process, which gives us the opportunity to orchestrate the evacuations within the virtual environment by running what-if simulations, testing for best evacuation guidance strategy, and then apply it back to the physical world to improve the efficiency of the pedestrian evacuations. The instructions in the physical world can be conducted by different approaches inside the infrastructure—for example, a visual based guidance system like alterable distributed guiding signal (Figure 1), an audio based system like vocal signals, automatic physical barriers, or enforced by personals in duty, depending on specific application scenarios.
In the long term, the proposed digital twin can be used to capture the operational history of the particular infrastructure, formed by the large volume of its operational states. Over time, these states become the operational history of the infrastructure, which characterize the particular operational state evolution of the infrastructure in terms of pedestrian behavior. As the volume of data is constantly accumulating and being processed, the performance of the digital twin will be increasingly enhanced, resulting in a more accurate understanding of the pedestrian behavioral dynamics. This information could lead to the establishment of predictive warnings system for certain dangers, such as overcrowding or other related potential hazards.

3. Digital Twin of Evacuation Process inside Slender-Shape Infrastructure

In this study, we will exemplify the idea proposed in Section 2 by proposing a simple digital twin using CA model where different guidance strategies are introduced. As the guidance systems are aimed at enhancing the overall efficiency of the emergency evacuations, the proposed strategies are then simulated with their effects compared based on hundreds of possible scenarios in different initial pedestrian distribution density setting, considering factors such as overall density and position of pedestrian crowds.

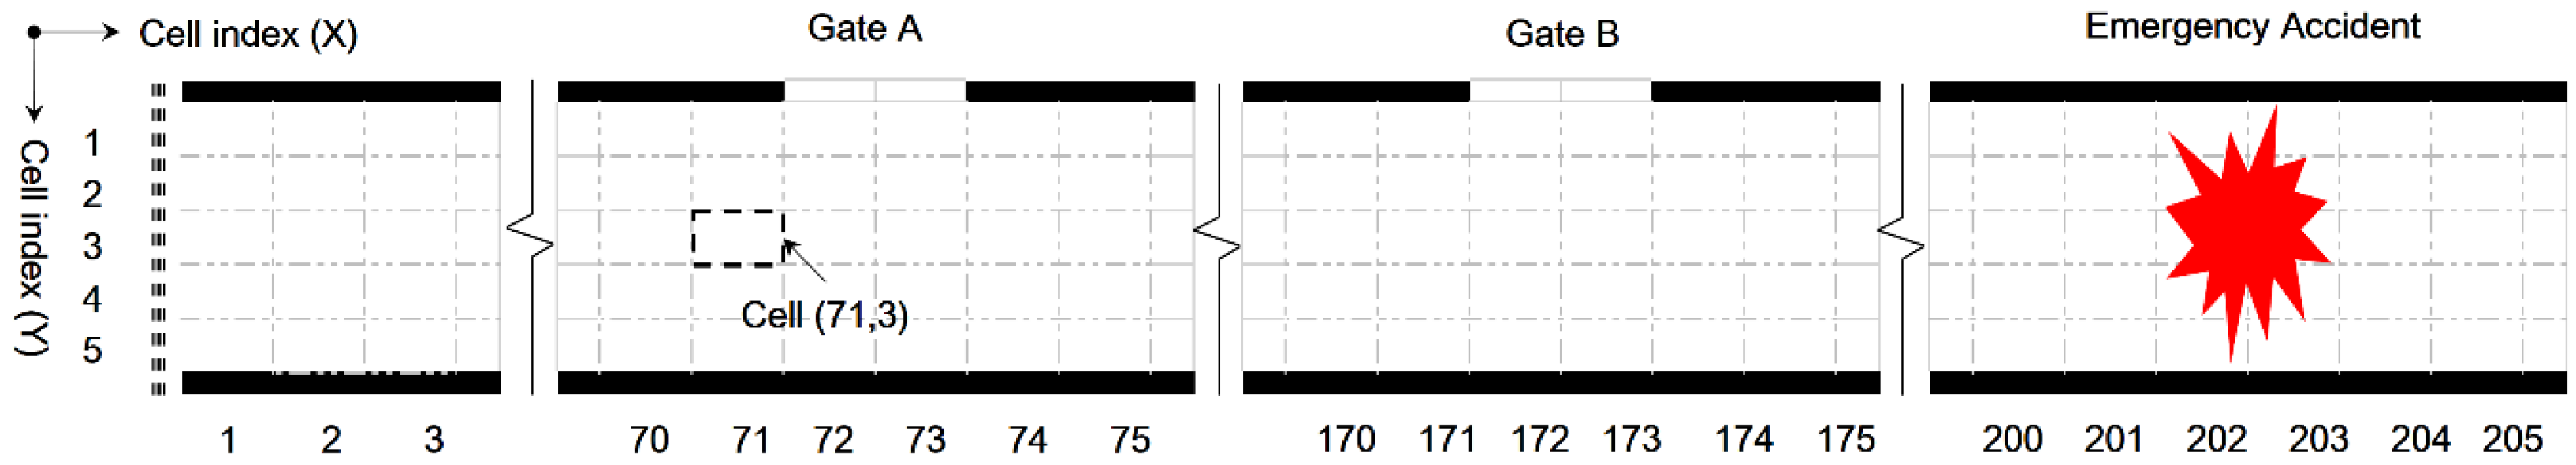
3.1. Infrastructure Internal Space

Because the intention of the current research is to study the effects of active guidance on the evacuation performance, relatively simplified assumptions are made for the infrastructure design and pedestrian movement rules. A slender-shape infrastructure internal space is assumed characterized by a long rectangular shape, where an emergency accident such as fire accident is assumed to strike inside the infrastructure and two possible exit gates are presented for pedestrian evacuation (see Figure 2). Pedestrians are assumed only to be able to evacuate for safety through these exit gates. This assumption goes in line with the situation in long slender infrastructure such as underground shopping streets, pedestrian tunnels, etc., where the infrastructure tends to be very long and the main entrances are too far away to serve as evacuation destinations. Likewise, for slender enclosed infrastructure taking long box shape, like metro platforms or under passes, staircases are normally the only possible exits for pedestrian evacuations, which can be represented by the exit gates as well. Therefore, this simplified infrastructure internal space model can be quite representative for many types of slender-shaped underground infrastructure.
To properly simulate the behavior of pedestrians inside a slender-shape infrastructure, we put forward a 2D cellular automaton framework. In this model, the infrastructure internal space is represented by a long slim 2D grid made up of unit cells. Each cell can either be empty or occupied by one pedestrian. Specifically, the infrastructure internal space model in this study consists of 5 cells in the y direction and 240 cells in the x direction. The cell locations in the tunnel are represented by their x and y index. One particular example of unit cell positioning is illustrated in Figure 2. Two exit gates are assumed located at one side of the tunnel wall, each with a gate width of 2-unit-cell length. The locations of gate A and gate B correspond to column 72 to 73, and 172 to 173, respectively. An emergency accident (e.g., fire accident) is assumed to strike at column 202 and 203 for all simulated cases. A complete blocking effect from the emergency incident is assumed to occur at the strike location for all simulated cases, meaning that pedestrians cannot move from one side of the accident location to the other side. Therefore, people left of the accident will be forced to evacuate through Gate A and Gate B. In this study, our primary attention will be focusing on modelling pedestrian movement evacuation through Gate A and Gate B, based on which we can evaluate the effectiveness of different evacuation strategies.

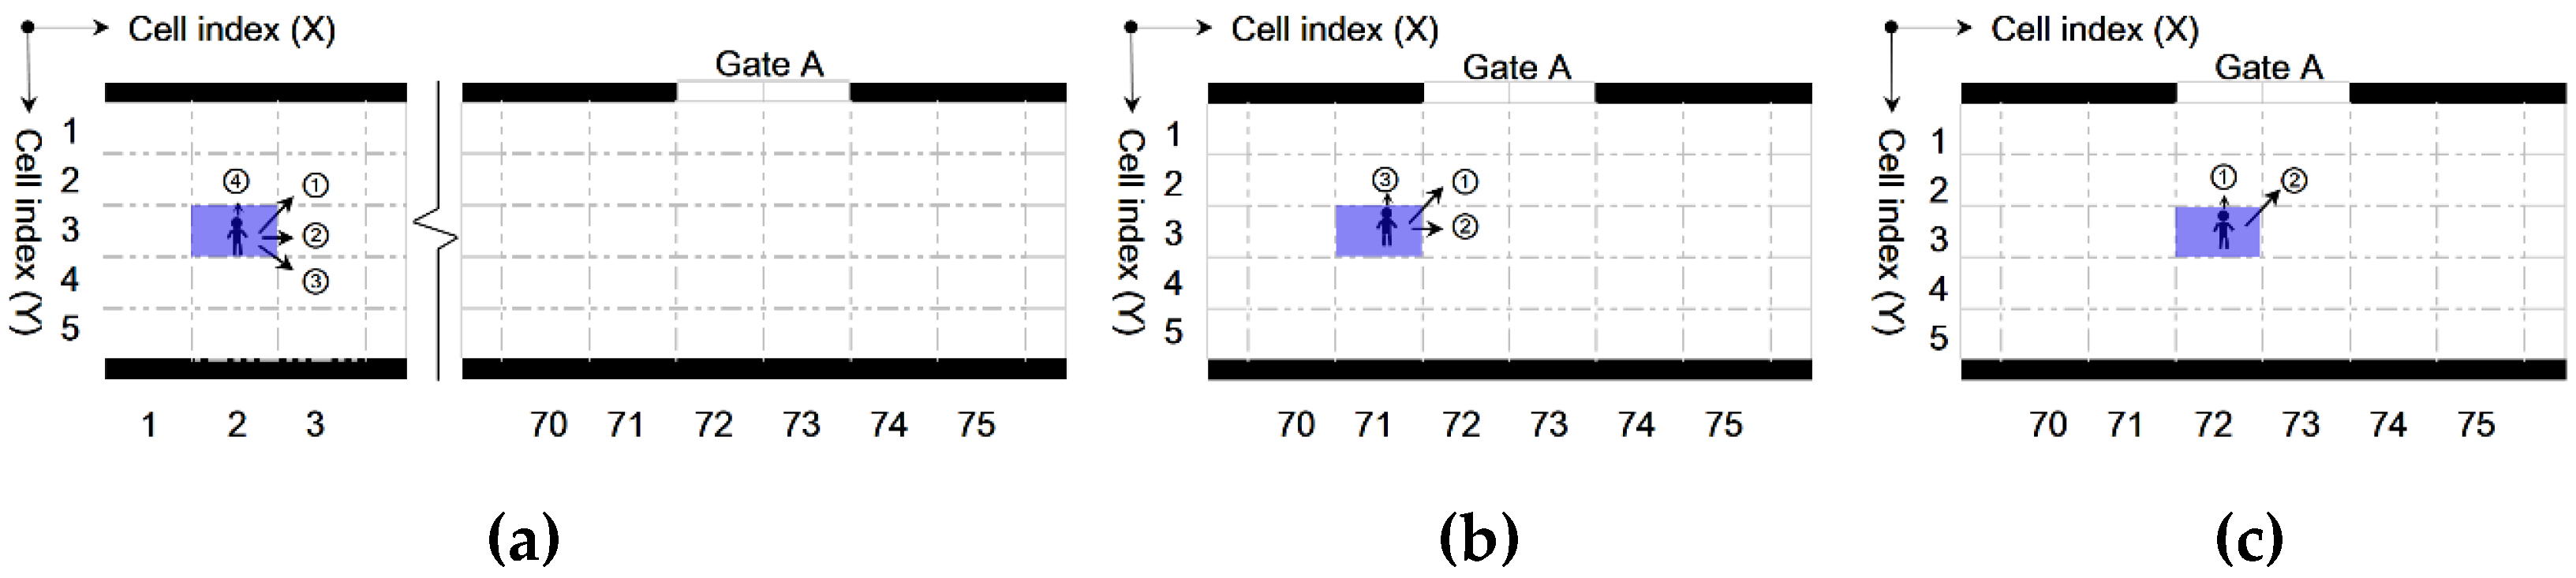
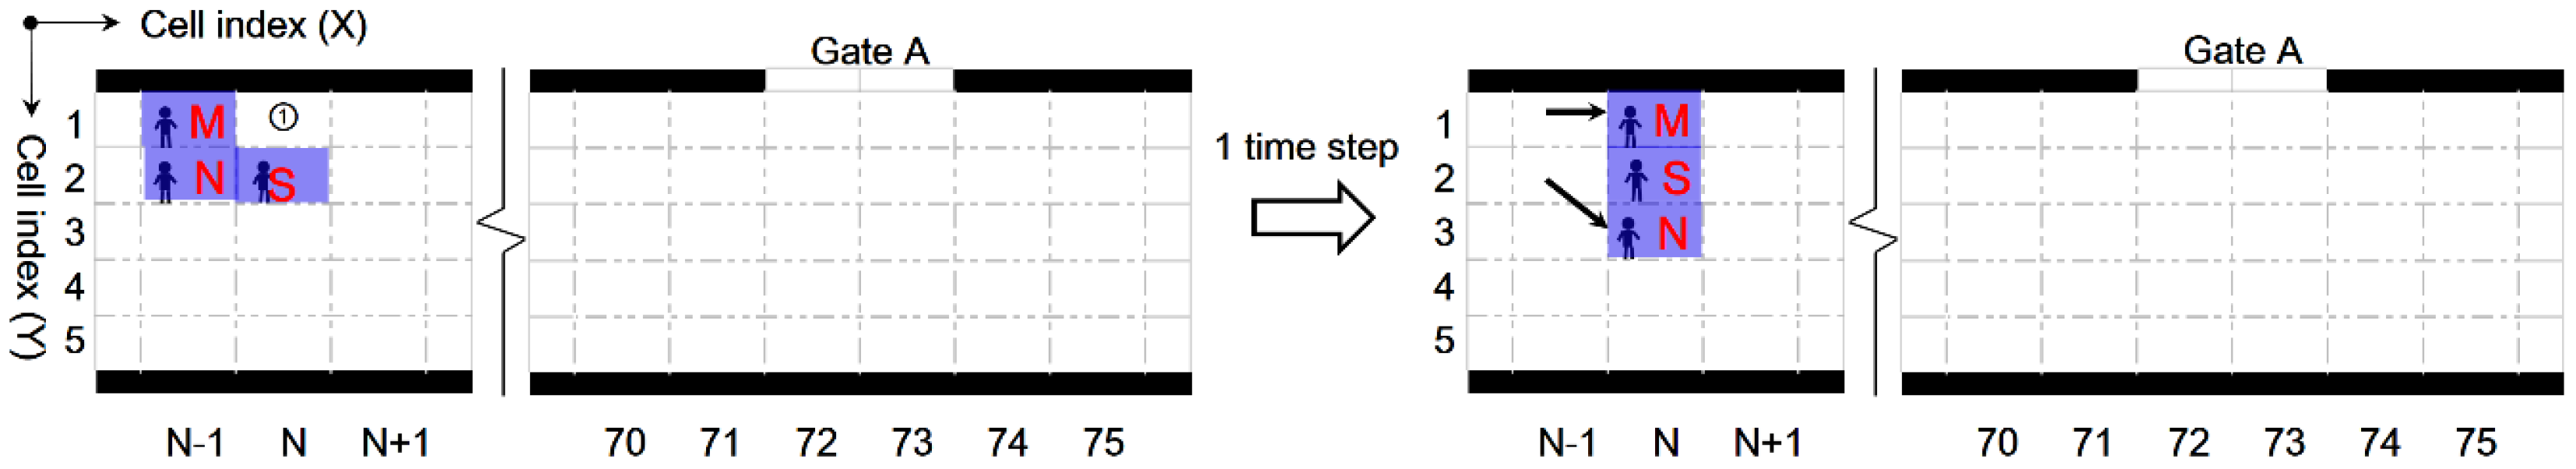
3.2. Pedestrian Movement Rules

In the proposed evacuation model, pedestrians could be registered into the model by conveniently marking the corresponding unit cell with value 1, otherwise a value 0 will be used to represent empty space. Pedestrian movement is realized by changing the values stored in the unit cells at each time step concurrently according to the movement rules, which depict the value-updating rules for the next time step for every cell according to the current status of itself and its neighbors. By properly setting up the rules, the pedestrians will be moving to gates through time, realistically simulating their movements. After initialization for all pedestrian locations, we assume no extra pedestrian will be added to the system during the evacuation process, and all pedestrians will have to evacuate through the exit gates. Each pedestrian has a unique tracking label, stored in his/her position vector, through which we could track the movement time history of a particular individual. However, the primary concern of this study is the group behavior of the pedestrians. The following movement rules are set up to simulate the pedestrian movement inside the infrastructure: (1) pedestrians move at same velocity at one cell per time step; (2) each unit cell can only accommodate for one pedestrian; (3) the guiding system is assumed capable of delivering effectively directional instructions to all pedestrians; (4) all people are assumed to follow the instructions given by the guiding system; (5) during the evacuation process, once a specific evacuation direction is assigned to a pedestrian by the guiding system, he/she will continue with that direction throughout the whole evacuation process without changing it.
We represent the status of the unit cell system by the following terminologies,
P N ( t ) = ( x ,   y )
cell ( x , y , t ) = {        1       c e l l   ( x , y )         o c c u p i e d   a t   t i m e   s t e p   t    0       c e l l   ( x , y )          e m p t y   a t   t i m e   s t e p   t
where P N ( t ) is the location vector of the Nth pedestrian at time t and cell (x,y,t) denotes the status of the unit cell.
The movement rules depicting the behavioral dynamics of a pedestrian with other nearby pedestrians or his/her surrounding environment should be determined as close to reality as possible. In this study, we assume movement priority strategies of pedestrians would alter according to current location of pedestrians relative to exit gates. Detailed movement strategies of pedestrians are demonstrated using 2D movement priority diagrams as shown in Figure 3 and Figure 4, where relocation movement strategies are established with a certain priority sequence. We assume pedestrians would use different movement strategy according to their current locations relative to the exit gates, namely, when they are (a) far away from the exit gates (scenario-1), (b) near the gates (scenario-2), or (c) arriving at the gates (scenario-3). Figure 3 demonstrates the detailed movement priority sequence assumed of the next relocation position for a representative pedestrian according to their current location inside the infrastructure. Pedestrians will move to the next available location corresponding to the highest priority sequence order among all possible movement strategies.
As can be seen, in scenario-1 when people are still relative far away from the exit gates, they generally want to move towards the nearest exit gate direction, and tend to concern less on whether they have to move further sideways (strategy 3), or shift to the side (strategy 4), which is closer to the exit in Y axis direction but remain the same in the X axis. The assumption is made because in this region the likelihood of pedestrian traffic congestion is still relatively low, and people can afford some second-best moving options. However, in scenario-2 and scenario-3, when a pedestrian gets much closer to the gates, their hope for a successful escape tends to grow stronger. In these conditions, we assume pedestrians will only adopt the movement strategies that will better their current conditions. Specifically, in scenario-2, as pedestrians move near the exit gates, we assume they would not consider moving further away from the exit gates a viable option in their moving strategic set; in scenario-3, only two options are left for pedestrians, which would bring him/her closer to the successful escape. In other words, a pedestrian will not back off in scenario-2 and scenario-3 as they see the exit gate. Every step will bring them closer to the exit gate.
If all listed moving options in the priority diagrams are not viable, meaning that the pedestrian is blocked by other pedestrians for all available moving strategies, then he/she will have to wait at the present cell and keep still for the current time step, and evaluate the moving strategies again in the next time step. The movement rules could be formulated in Equation (3) as follows. The following equations demonstrate the Nth pedestrian’s position at time step t and step t + 1,
P N ( t ) = ( x , y ) , P N ( t + 1 ) = ( x , y ) , i f   c e l l ( x , y , t ) = 0
where (x’, y’) is the cell corresponding to the highest priority sequence order among all possible movement strategies.
Unit cell occupation status can then be updated,
c e l l ( x , y , t + 1 ) = 0 ,   c e l l ( x , y , t + 1 ) = 1 ,
When people getting nearer to the gate, they get increasingly crowded. Therefore, condition cell(x’,y’,t + 1) = 0 is not judged anymore, and no empty unit cell will be left after the Nth pedestrian moving out. The following equations depict the pedestrian position update, with pedestrians’ corresponding movement priority sequence indicated in Figure 3b,c for position near or at the exit gates, respectively.
Pedestrian position,
P N ( t ) = ( x , y ) ,   P N ( t + 1 ) = ( x , y ) ,
Unit cell occupation status updated as,
c e l l ( x , y , t + 1 ) = 1 ,
As all pedestrians are trying to move to cells nearer to the exit gates, movement conflicts could occur due to pedestrians’ concurrent choice of the same cell as their next relocation destination. To address this problem, we set the rules that the pedestrian position vector with lower y value has the higher movement priority over others. This arrangement may affect evacuation time of a specific individual, but will not affect the evacuation dynamics of pedestrians as a whole. The assumption offers a simplified simulation approximation avoiding computational conflicts. Figure 4 illustrates the above rules by demonstrating the movement strategies of three representative pedestrians for time step t + 1, when pedestrian S is forced to wait at the current time step t. As shown in Figure 4, position ① (cell (N,1)) is the optimal target relocation position for both pedestrian M and N in time step t. However, due to the conflict rule of relocation, pedestrian M possesses the priority to occupy that cell in the next time step, while pedestrian N has to move to the position that corresponds to his/her lower priority relocation strategy.

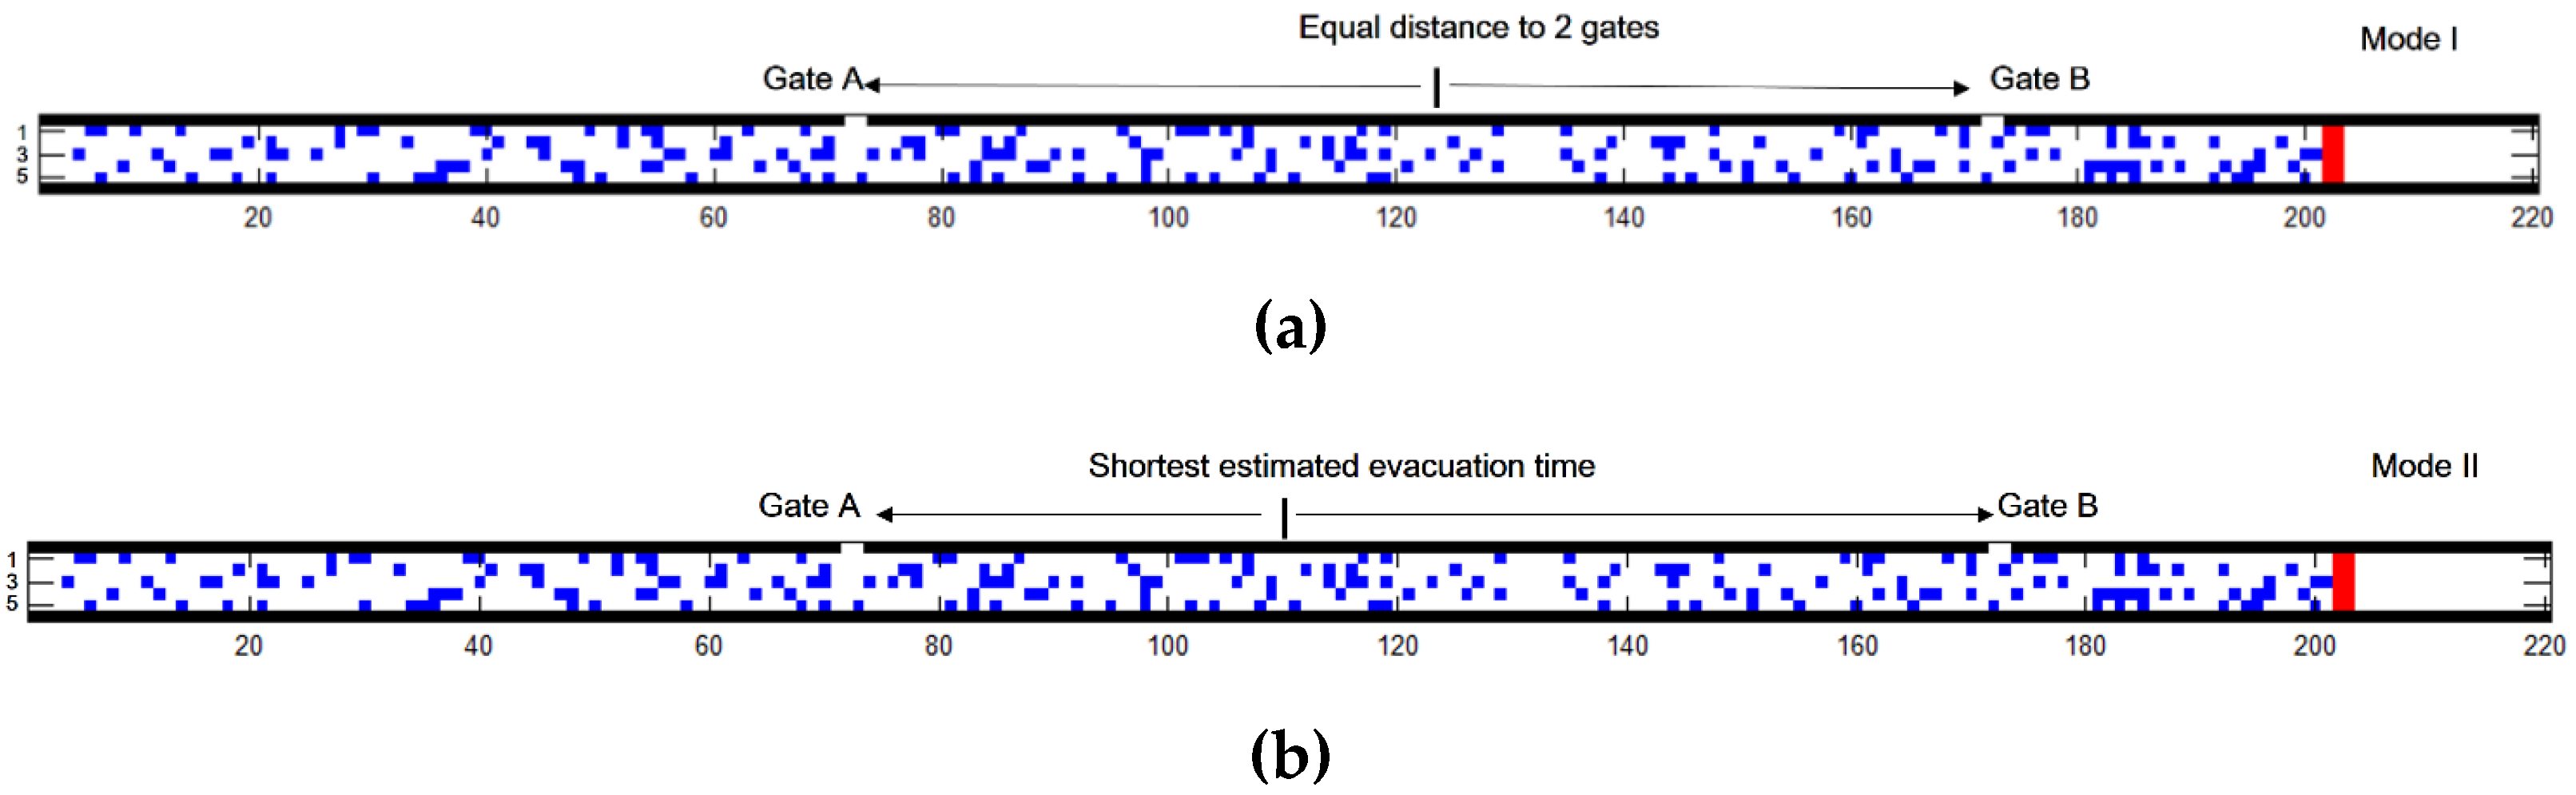
3.3. Evacuation Guiding Strategies

Giving the movement rules set up in Section 3.2, the spontaneous movement of pedestrians in emergency evacuations could be simulated on the micro level. In a multi-exits problem in a slender-shape infrastructure model, the exit gate selection would heavily rely on the guidance offered by the guiding system. In this paper, we refer to the methodologies to determine the evacuation directions for the pedestrians as the evacuation guiding strategies. The evacuation guiding strategy is an important part integrated into the digital twin through which enhanced evacuation efficiency could be accomplished that ultimately benefits the evacuation process in reality. We will introduce two types of guiding strategies in this section, in which a fixed guiding strategy will be used as a baseline to evaluate the effect of the smart guiding strategy. Figure 5 illustrates the proposed strategies in 2D schematic diagrams.
(1)
Strategy 1: fixed guidance according to geometry of the infrastructure internal space
This is the common guidance approach adopted by various infrastructure in reality. These instruction arrangements would normally take the design of the infrastructure internal space as the main factor of consideration. Therefore, we assume that the pedestrians will be guided to their nearest gates by the guiding sign inside the infrastructure which change in guiding direction at midway of the two gates.
In our digital twin model, the following procedures are carried out. After registering all pedestrian locations in the CA model, location of the emergency accident and potential available exit gates are identified for each pedestrian. Afterwards, according to the location of pedestrians and available exit gates, the nearest exit gate is assigned for each pedestrian as the evacuation destination. Specifically, for the Nth pedestrian staying at cell (x,y) when the emergency accident occurs, his/her distance to the exit gates are:
Distance of the Nth pedestrian to Gate A or Gate B,
  D N , A   o r   B = | x N G A   o r   B | + y N ,
where GA and GB are the x coordinates of the 2 exit gates shown in Figure 2. The pedestrian will be instructed to go to the nearest gate.
(2)
Strategy 2: smart guidance based on estimated evacuation time
This is a strategy to instruct pedestrians picking the optimal directions considering current pedestrian distribution inside the infrastructure, so as to enhance the efficiency of the evacuation system as a whole. The general idea is that after the pedestrian locations obtained by sensors getting registered into the CA model, a smart algorithm will be activated to evaluate for the best evacuation gates for pedestrians according to the whole pedestrian population distribution, rather than solely considering their distance to the exit gates.
Ideally, a good practical smart algorithm should show improvement in evacuation efficiency over the fixed guidance system (strategy 1), meanwhile fast enough in response time to achieve real-time guidance. In this paper, to address the improvement of the evacuation efficiency, a relative simple semi-empirical approach with sufficiently good result is proposed. The methodology could be further refined by incorporating more detailed factors of more realistic behaviors of pedestrians into consideration if needed.
The proposed method aims to minimize the total evacuation time through calculating the monitored actual population distribution status. To be more practical, an assumption is made that two different movement states of pedestrians can be categorized during in an emergency evacuation process, namely, the free movement state and congested movement state. The former refers to a movement state where pedestrians are free to move at their will, with a minor influence from other pedestrians, while the latter represents a movement state where pedestrian flow becomes slow due to congestion formation. The state actually presented will largely depend on the interaction between the pedestrian flow and the evacuation capacity of the exit gate. The free movement state typically appears when the speed of people gathering around the gate is smaller than the evacuation capacity of the gate, which is most likely to happen when pedestrians are in relative low population density. The congested movement mode, however, often show up with relatively high pedestrian population density and limited evacuation capacity of the exit gates, where pedestrian crowds start to form, making the evacuation capacity of the exit gate the bottleneck for the evacuation.
In the proposed empirical method to tackle the multi-exits evacuation guidance problem, we make a simplified assumption that the movement of pedestrians heading for the same exit gate will be mainly governed by either the free movement state or the congested movement state. The assumption is based on the observation that there typically exists a clear cut over the two state depending on a critical pedestrian population density, beyond which pedestrian congestion will occur, which propagates back towards the incoming direction of the pedestrian flow, until the whole pedestrian flow becomes congested movement flow. The assumption ignores the transition period of pedestrian movement from free movement state to congested movement state around the exit gate. However, for the slender-shape infrastructure with a large number of people, this period is typically short in comparison with the whole evacuation time, and therefore the assumption should provide a sufficient accurate approximation for the main contradiction of the problem. Of course, for some particular cases, a certain degree of combination of the two states will be coexisting during the whole evacuation process. However, the intention of the proposed method is to give a simple estimation of where to separate pedestrians for different evacuation destinations rather than to reach to the most accurate separation point. Therefore, we will stick with the current method for judging the effectiveness of introducing active guidance, while more refined analysis with higher accuracy can be accomplished using more complicated methodologies.
Let TN,f denote the Nth pedestrian’s estimated time to reach to the exit gate in free movement state, while TN,c the evacuation time the pedestrian required to leave the gate due to the existence of crowds around the gate area in obstructed movement state. At the instance of the emergency accident, for the Nth pedestrian at cell ( x N ,   y N ) , the distance of the pedestrian to the exit gates can be calculated according to Equation (7). If the free movement state occurs for the Nth pedestrian and all the other pedestrians ahead of him/her to the selected exit gate, we can roughly make an estimation of the time required by all pedestrians to get out of the exit gate. The following formula can be obtained by ignoring delay arising from potential congestion during the evacuation process with movement velocity of 1-unit cell per time step.
T N , f   ( A   o r   B ) = | x N G A   o r   B | + y N
If the congested movement state is assumed for the Nth pedestrian and all the other pedestrians ahead of him/her to the selected exit gate, due to existence of crowded area around the gate, we can use the following formula to estimate the time required for the pedestrian to evacuate through the exit gate:
T N ,   c   ( A   o r   B ) = ( D i   ( A   o r   B ) <   D N   ( A   o r   B ) ) k C e x i t    ( 0 < i N t o t a l ) ,
where C e x i t denotes the exit gate evacuation capacity, which equals to exit gate width per time step; D i   ( A   o r   B ) denotes the distance of the ith pedestrian to the exit gate A or B; i is an integer among 0 to Ntotal, which is every pedestrian’s ID number; and k is an empirical coefficient to adjust for the exit gate evacuation capacity and a function of localized pedestrian population density around the gate, with value ranges from 0 to 1. This is because the pedestrian movement flow is stochastic in nature, and the gate width only offers the upper bound estimation of the actual pedestrian flow rate. The actual flow rate will depend on the temporal and spatial characteristics of the pedestrian flow. Therefore, parameter k could be obtained and tuned through virtual simulations, or through analysis of accumulated monitoring data in the real project over time, based on statistics or machine learning techniques. However, a detailed discussion of this will be beyond the scope of this study. For the purpose of this paper, we assume k equals to 1, namely the upper boundary of the evacuation capacity.
Estimated evacuate time of pedestrian N can be calculated as
T N   ( A   o r   B ) = m a x   ( T N , f   ( A   o r   B ) , T N ,   c   ( A   o r   B ) )
Starting from the location of the emergency accident, calculate the estimated evacuation time for every pedestrian until finding the Mth pedestrian, whose estimated escaping time to gate A and gate B are the same, namely
T M ,   A = T M ,   B
Pedestrians can then be grouped accordingly, where pedestrians to the left of the Mth pedestrian will be instructed to evacuate from Gate A, while pedestrians to the right to escape through Gate B.

4. Numerical Experiments

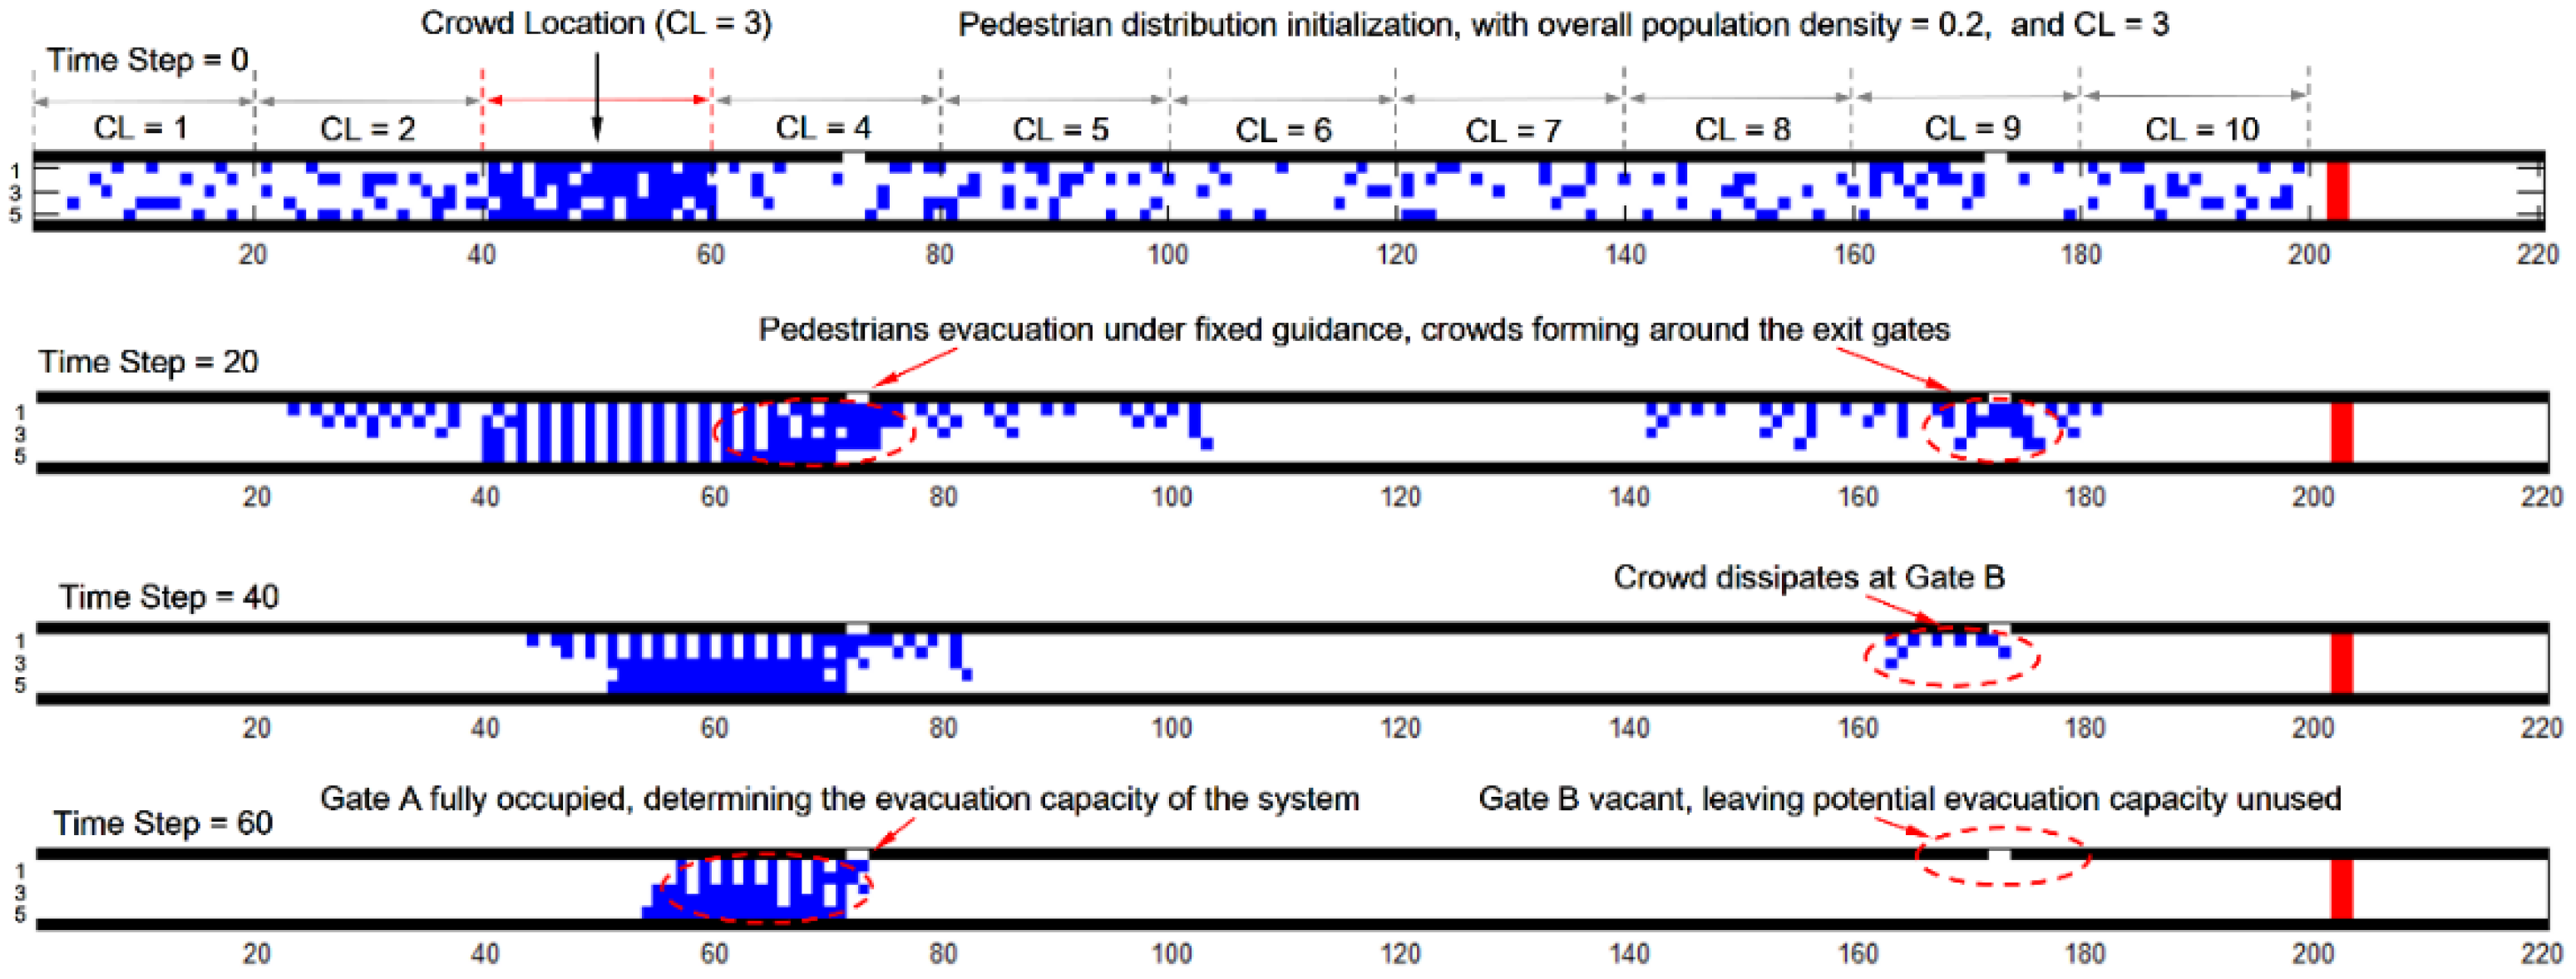
Simulation Initialization

To evaluate the idea of introducing smart guidance into the digital twin, and the performance of the proposed smart guiding algorithm, we conducted a parametric study using numerical experiments at different initial pedestrian population density settings to mimic different potential cases in reality which could be measured by sensors. Two basic aspects of pedestrian population density distribution are considered in the initialization process of the pedestrian locations. Namely, the overall population density and position of localized pedestrian crowds. The inclusion of the localized pedestrian crowds is to consider the potential unevenness of population distribution that can be observed in reality. This can account for, for instance, people gathering around popular stores in the context of an underground shopping street, or people pouring out of a bus inside a tunnel at an emergency scenario. Furthermore, inclusion of the crowd region also creates more complex spatial population density variations for the guiding system to cope with, and therefore creating a richer database for the evaluation of the performance of different guiding strategies. In the initialization of both the uniformly distributed region and the crowd region, the pedestrian population density is considered to be uniformly distributed over the corresponding infrastructure internal space. For a uniformly distributed region, we introduced 5 baseline population densities ranging from 0.1 to 0.5, with 0.1 indicating 10% of the unit cells being occupied by pedestrians, while 0.5 for 50% occupation. For the crowd region, a population density value of 0.9 was applied, with a length of 20 unit cells for all simulated cases. We make the position of the crowd region a major variable of consideration by creating a series of positions along the tunnel alignment. In total, 10 different positions are considered in the parametric study (CL = 1 to 10), as shown in Figure 6, which demonstrates one particular realization of pedestrian evacuation process under strategy 1.

5. Results and Discussions

Due to the stochastic nature of the simulation, we run the simulation 100 times at each density setting combination point with the final averaged results of all realizations summarized in Figure 7.
Figure 7a,b illustrate the averaged total evacuation time of the fixed guided evacuations and smart guided ones from 100 simulated realizations at different population density setting combinations. Figure 7c presents the total evacuation time saving in percentage of the smart guided evacuations over the fixed guided ones at different population density settings. As demonstrated in Figure 7a,b, the evacuation time increases with higher overall population density for both the fixed guided system and the smart guided system. As shown in Figure 7a, the evacuation time of the fixed guided system ranges from 60.3 (density = 0.1, CL = 3) to 126.6 (density = 0.5, CL = 6) time steps, with an average evacuation time for all different density combination of 93.3 time steps. The evacuation time of the smart guided system ranges from 61.3 (density = 0.1, CL = 3) to 105.6 (density = 0.5, CL = 1) time steps, with the average evacuation time for all different density combination of 85.5 time steps. Overall, evacuation time increases with higher overall densities for both the fix guided system and the smart guided system. While both the fixed guided and the smart guided system see growth in evacuation time with increased overall density, the fixed guided system experiences more rapid growth in evacuation time than that of the smart guided system, indicating that the smart guided system performs less susceptible to the influence of different overall population density levels. The shape of the evacuation time surface also indicates that the crowd location will also influence the evacuation time. The evacuation time forms a ridge shape around CL between 6 and 7 across different densities for both the fixed guided and smart guided systems. Similarly, valleys indicating short evacuation times can also be identified when CL values get to 3 and 8 for both systems. For the fixed guided system, the feature of ridges and valleys are very obvious across all different density levels. However, for the smart guided system, those features are only obvious for low density levels, and become less prominent at higher density levels. These means that the performance of the smart guided system is overall more immune to the influence of the position change of the crowd locations.
According to Figure 7c, the amount of time saving can be improved with increased overall population density. Specifically, as density level increases from 0.1 to 0.5, the corresponding average time saving of the smart guided system over fixed guided system are −0.2%, 3.7%, 8.7%, 12.6%, and 12.0%, respectively. Overall, an average value of 7.3 % improvement can be obtained for all different population density settings. Therefore, the proposed smart algorithm is found to most obviously outperform the fixed guidance system around density settings corresponding to mid to high population densities (density around 0.3 to 0.5) and when crowd locations are set between 6 to 10. These setting will give rise to time saving values ranging from 8.7% to 23.8%, with the highest value achieved at density of 0.4 and CL of 6. The smart algorithm shows little obvious improvement when the overall density is low (around 0.1 or 0.2), which could be refined by further adjusting to the guiding algorithm.
Figure 7d–f present the standard deviation (std.) distribution of the aforementioned parameters from the 100 simulation realizations with respect to different population density settings. From Figure 7d,e, we can see that the fixed guided system presents overall higher values of standard deviation over that of the smart guided system, with an average value of 3.39 and 2.62, respectively. The shape of the standard deviation surface of the smart guided system is also flatter than that of the fixed guided system. These all indicate that the smart guided system demonstrated less fluctuation over different simulation realizations and over different population density settings, therefore a more robust guiding method offering more consistent results.
In order to understand the time saving mechanism of introducing the smart guidance, we pick two representative points in the total results dataset and illustrate in Figure 8 as examples to be elaborate in detail. The solid lines in Figure 8a–d present the averaged results of 100 simulated time series realizations at Point A, where the overall population density equals to 0.4 with CL equals to 6. Likewise, Figure 8e–h presents the results at Point B, where the overall population density equals to 0.2 and CL is set to 7. Time series plotted in dashed lines in Figure 8 indicate the upper and lower boundaries of respective variables. By assuming the time series of various simulated results at a particular time step follow Gaussian probability distribution, the upper and lower boundary curves could be conveniently obtained by plus or minus two times of the standard deviation of all simulation realizations to the average value at each time step. According to the probability theories, the region encompassed by the upper and lower boundary curves corresponds to a confidence level of 95.44% probability that a realization of simulation is falling into.
Figure 8a,c presents the time series of the portion of people gathering around the exit gate areas for Point A under fixed and smart guidance respectively, while Figure 8e,g present the same variables for Point B. The exit gate area is defined in Figure 3c, incorporating in total 10 unit cells close to the exit gate. These areas are defined so that the dynamics of the crowds could be conveniently monitored. Figure 8b,d demonstrates the time series of number of pedestrians successfully evacuated through each gate and those still waiting to be evacuated for Point A under fixed and smart guidance respectively. Illustration of the same variables can be found in Figure 8f,h for Point B.
Despite the stochastic nature of the simulations, when averaging the results for all 100 realizations, the cumulative trend of the pedestrian evacuation process can be clearly observed. It is noticeable that the evacuation curves overall take similar configuration, initiating with a short curved line at the start, following by straight line sections with different slopes, which indicate changes in pedestrian evacuation rate.
It is noticeable that the evacuation curves overall take similar composition, a short curved line at the start, followed by sections of straight lines. The straight lines for both gates generally initiate with remarkably consistent slope, overlapping over a certain period of time, before the possible occurrence of curve separation at certain time step with a sudden change in curve slope. The overlapped curves indicate that the evacuation rate is largely determined by the capacity of the exit gates despite variations in pedestrian flow. Likewise, curve slope change would indicate the variation in pedestrian evacuation rate. It is a prominent contrast that curves illustrating fixed guidance and that of smart guidance behave differently in terms of this curve separation behavior. Generally, the evacuation curves for fixed guidance see curve separation earlier than that of smart guidance.
As shown in Figure 8b, under Point A density setting, the fixed guidance curves indicate that pedestrian evacuation rate at gate A is consistent during the entire evacuation process, while gate B experienced a period with zero evacuation rate starting from time step 75. The separation of these two curves indicate that after time step 75, only gate A is still mobilized for pedestrian evacuation. Correspondingly, in Figure 8d, no obvious curve separation is observed during the entire evacuation process, indicating that both gates are effectively mobilized. In the case of Point B density setting, similar phenomenon can be observed that fixed-guidance curves see more prominent separation (around time step 65), while smart-guidance curve only see minor separation which occurs later in time (around time step 70). The curve of pedestrians remaining inside the infrastructure explain the cumulative evacuation behavior of pedestrians which also share the same position of the slope changing point as the individual gate. It is noted that the effective mobilization of the two gates for evacuation over the whole period help greatly to decrease the total evacuation time.
Characteristics of the evacuation curves could be further understood by examining the crowds around the gate areas. From Figure 8a,c,e,g, we can identify that crowds normally take within 10 time steps to accumulates over the gate areas, which explained the existence of the short transient curve sections at the beginning of the evacuation curves. After this transition period comes a relatively long and stable stage with minor changes depending on the actual population density distribution, until the final crowd’s dissipation come into play. The crowd dissipation behavior is found to be more consistent in smart guided cases. As shown in Figure 8a, for density setting at Point A, fixed guidance strategy leads to crowd dissipation at gate B starting from time step 55 and that of gate A from time step 100, while no obvious difference in dissipation initiation time for respective smart-guided cases is shown in Figure 8c. A similar outcome can be seen in Point B density setting, where under fixed guidance, gate A see crowds dissipation around time step 55, much earlier than that of gate B, while under smart guidance, the two gates almost dissipate concurrently. The dissipation period illustrated in the crowd dynamic curves corresponds to the slope changing behavior in the evacuation curves.
The above demonstration illustrates that the introduction of the smart guidance helps to more scientifically divide people to evacuate through respective gates so that crowds tends to dissipate simultaneously and more evacuation capacity is reached, resulting in shorter total evacuation time and improved safety for pedestrians collectively.

6. Summary and Conclusions
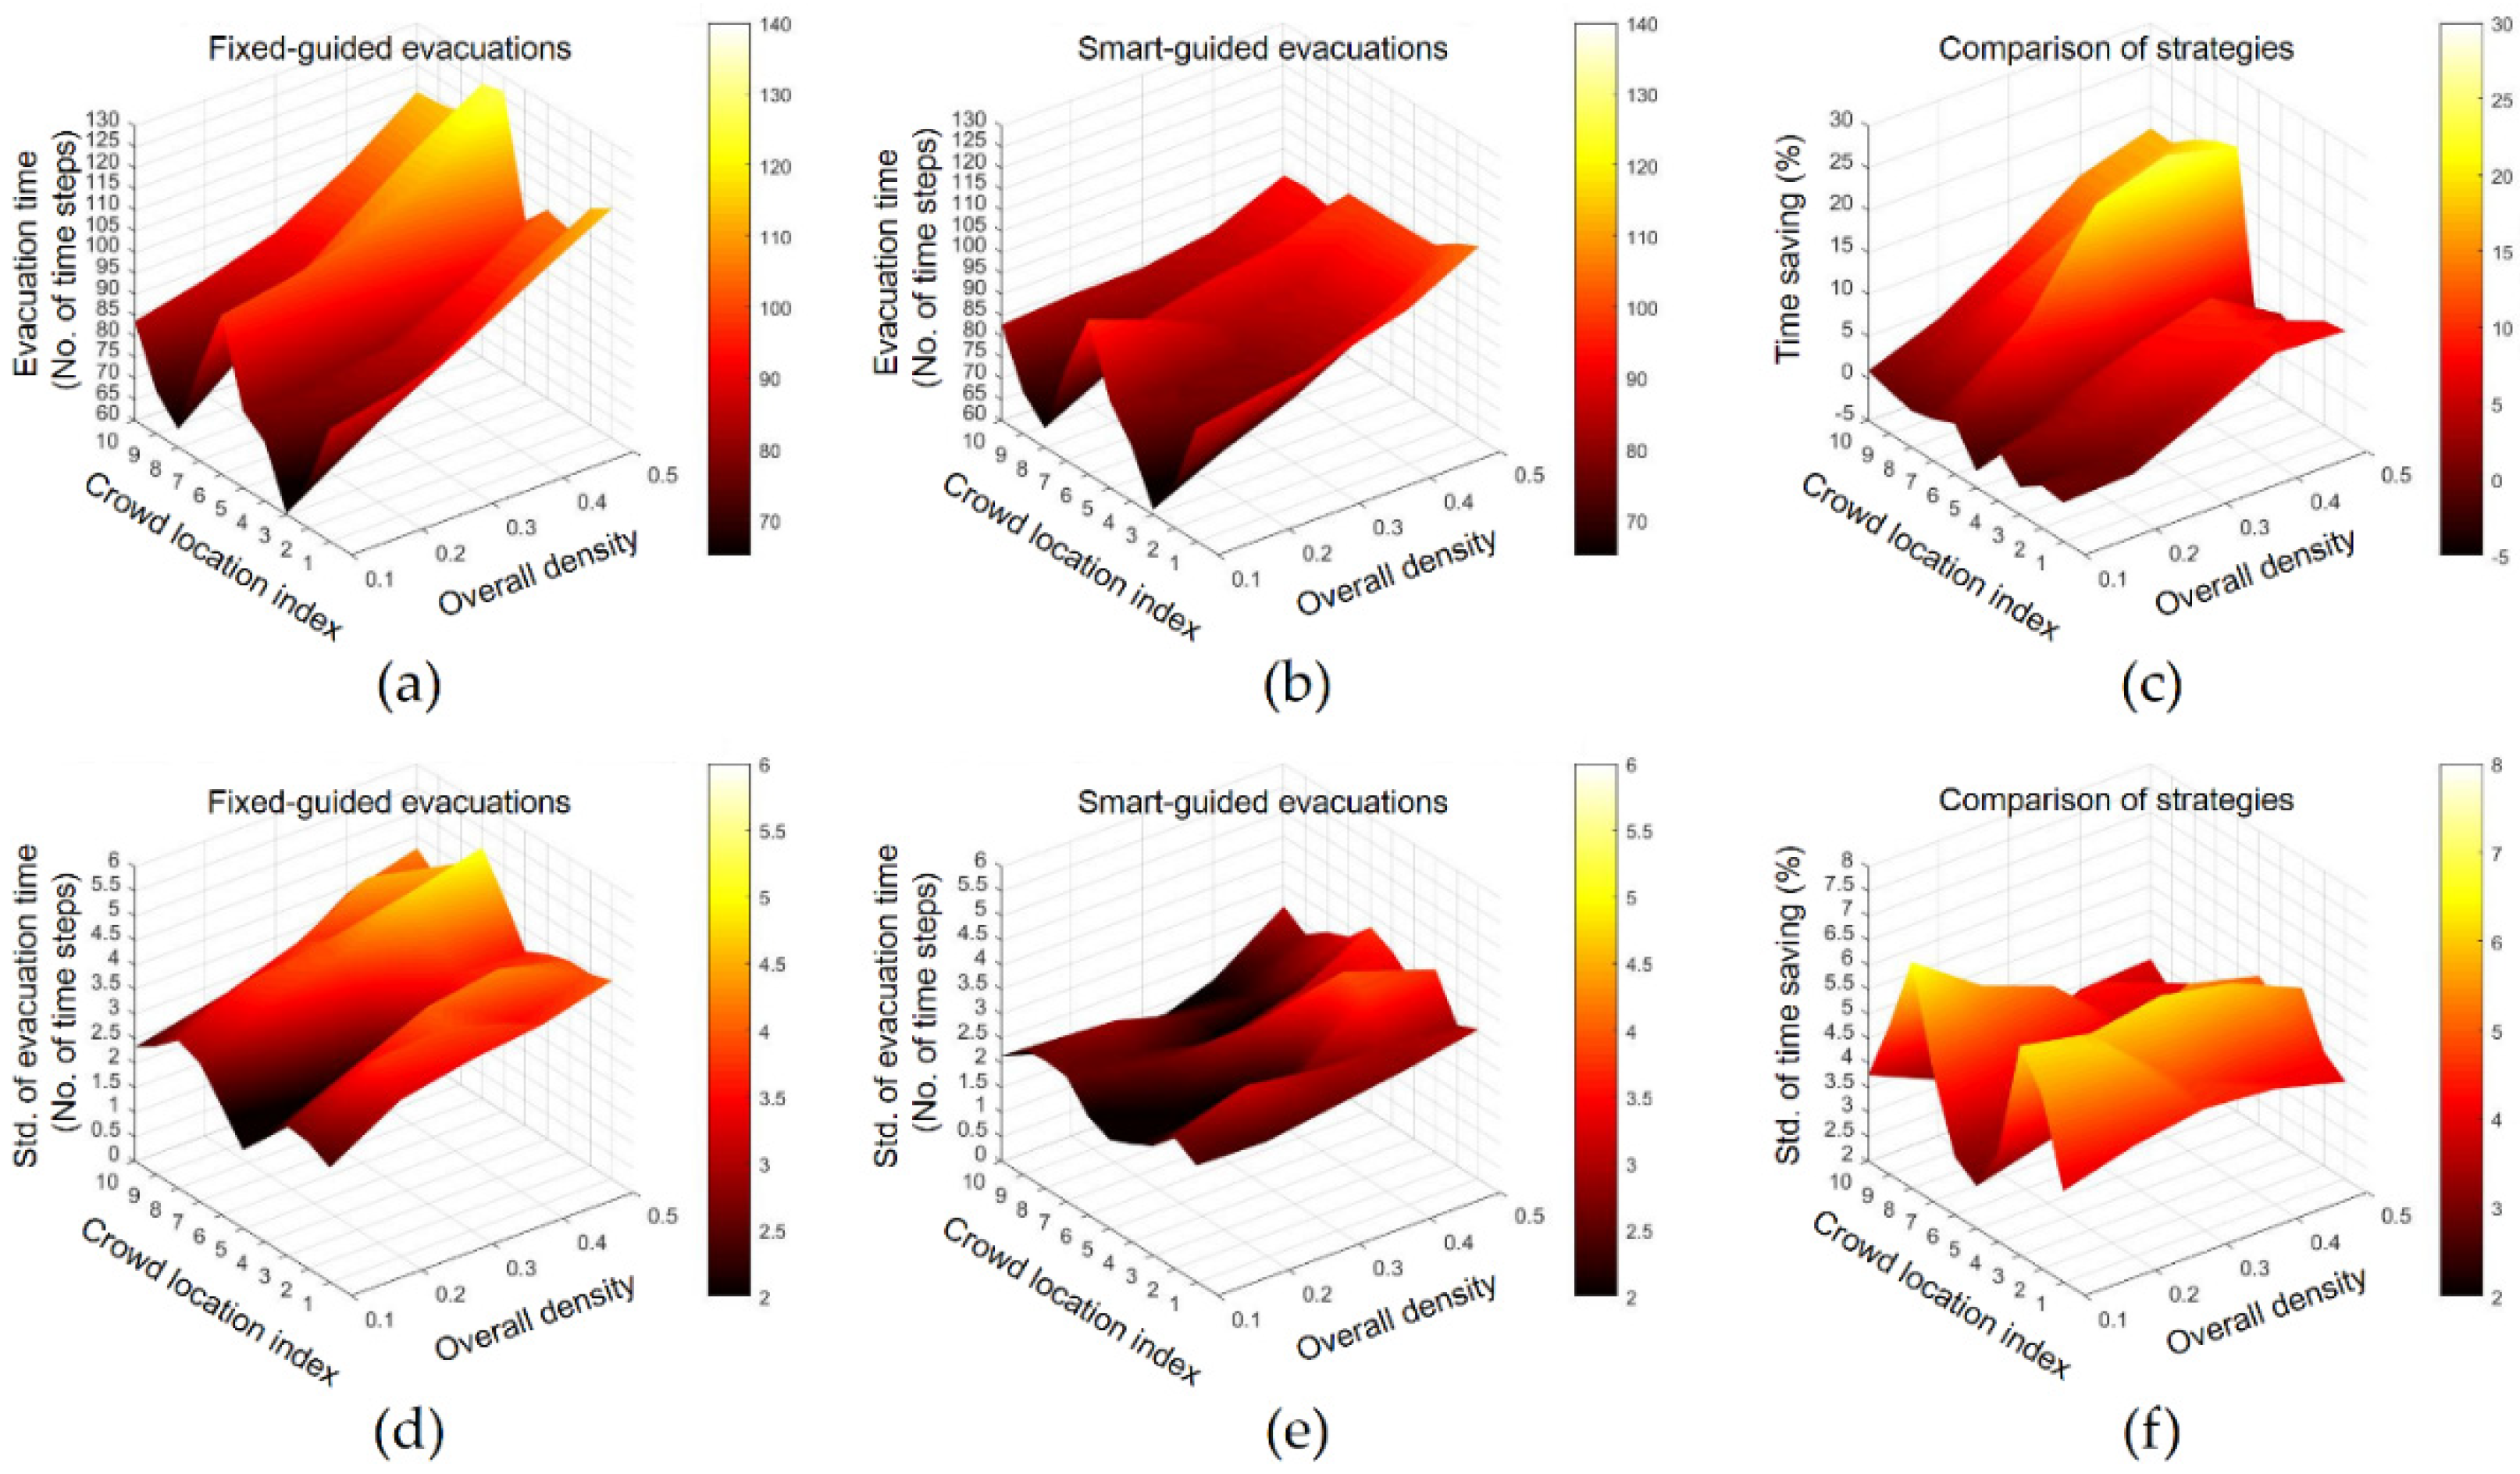
Due to the rapid exploitation of the underground space, pedestrian emergency evacuation inside slender-shaped infrastructure is becoming increasingly important, and those evacuations can be disastrous if not properly guided. Aiming at improving the overall evacuation efficiency, a digital twin based framework to cope with emergency evacuation inside slender-shape infrastructure is proposed. The system composition and calibration of the digital twin are described, leveraging the benefits of recent development in technologies such as various sensors, IoT, data driven models, and machine learning, which are becoming increasingly low in cost and popular in application in the engineering practice. A CA based model is served as the digital twin to tackle the multi-exits evacuation problem. CA movement rules are established according to relative position of the pedestrians to the exit gates. This paper introduces two types of guidance strategies to guide pedestrians to the exit gates, namely a fixed guiding strategy and smart guiding strategy. The former only determines the guiding direction by considering the geometry of the infrastructure internal space, while the latter also takes into consideration the actual population distribution obtained by the monitoring system. For the smart guidance strategy, a semi-empirical approach is proposed based on the understanding of the free movement state and congested movement state of the pedestrian flow. The two strategies are compared and discussed by running 100 simulations in different pedestrian distribution settings where the overall population density and the location of crowd are treated as the main variables. In the physical world, the instructions derived in the DT can be conducted by different approaches inside the infrastructure, like visual/audio based guiding systems, automatic physical barriers, or enforced by personals in duty. Some of the main findings based on the simulation results can be summarized below.
(a)
In general, evacuation time increases with higher overall density for both guiding strategies. However, the smart-guided simulations tends to experience slower growth in evacuation time than that of the fixed guided ones for increased density settings, and thus more resilient to pedestrian population density change.
(b)
Different pedestrian crowd location also influences the total evacuation time, and the performance of the smart guided system is overall more immune to the influence of the position change of these regions in comparison with the fixed guided cases.
(c)
The smart-guided system is found to most obviously outperform the fixed-guided system in mid to high population densities (density around 0.3 to 0.5), which results in time saving ranging from 8.7% to 23.8%. In relative lower density settings, improvements of the smart guided system over fixed guided ones are not obvious.
(d)
Simulation results indicate that the smart guided system demonstrates smaller discrepancy over different simulation realizations, demonstrating more consistent results, and therefore a more robust guiding system.
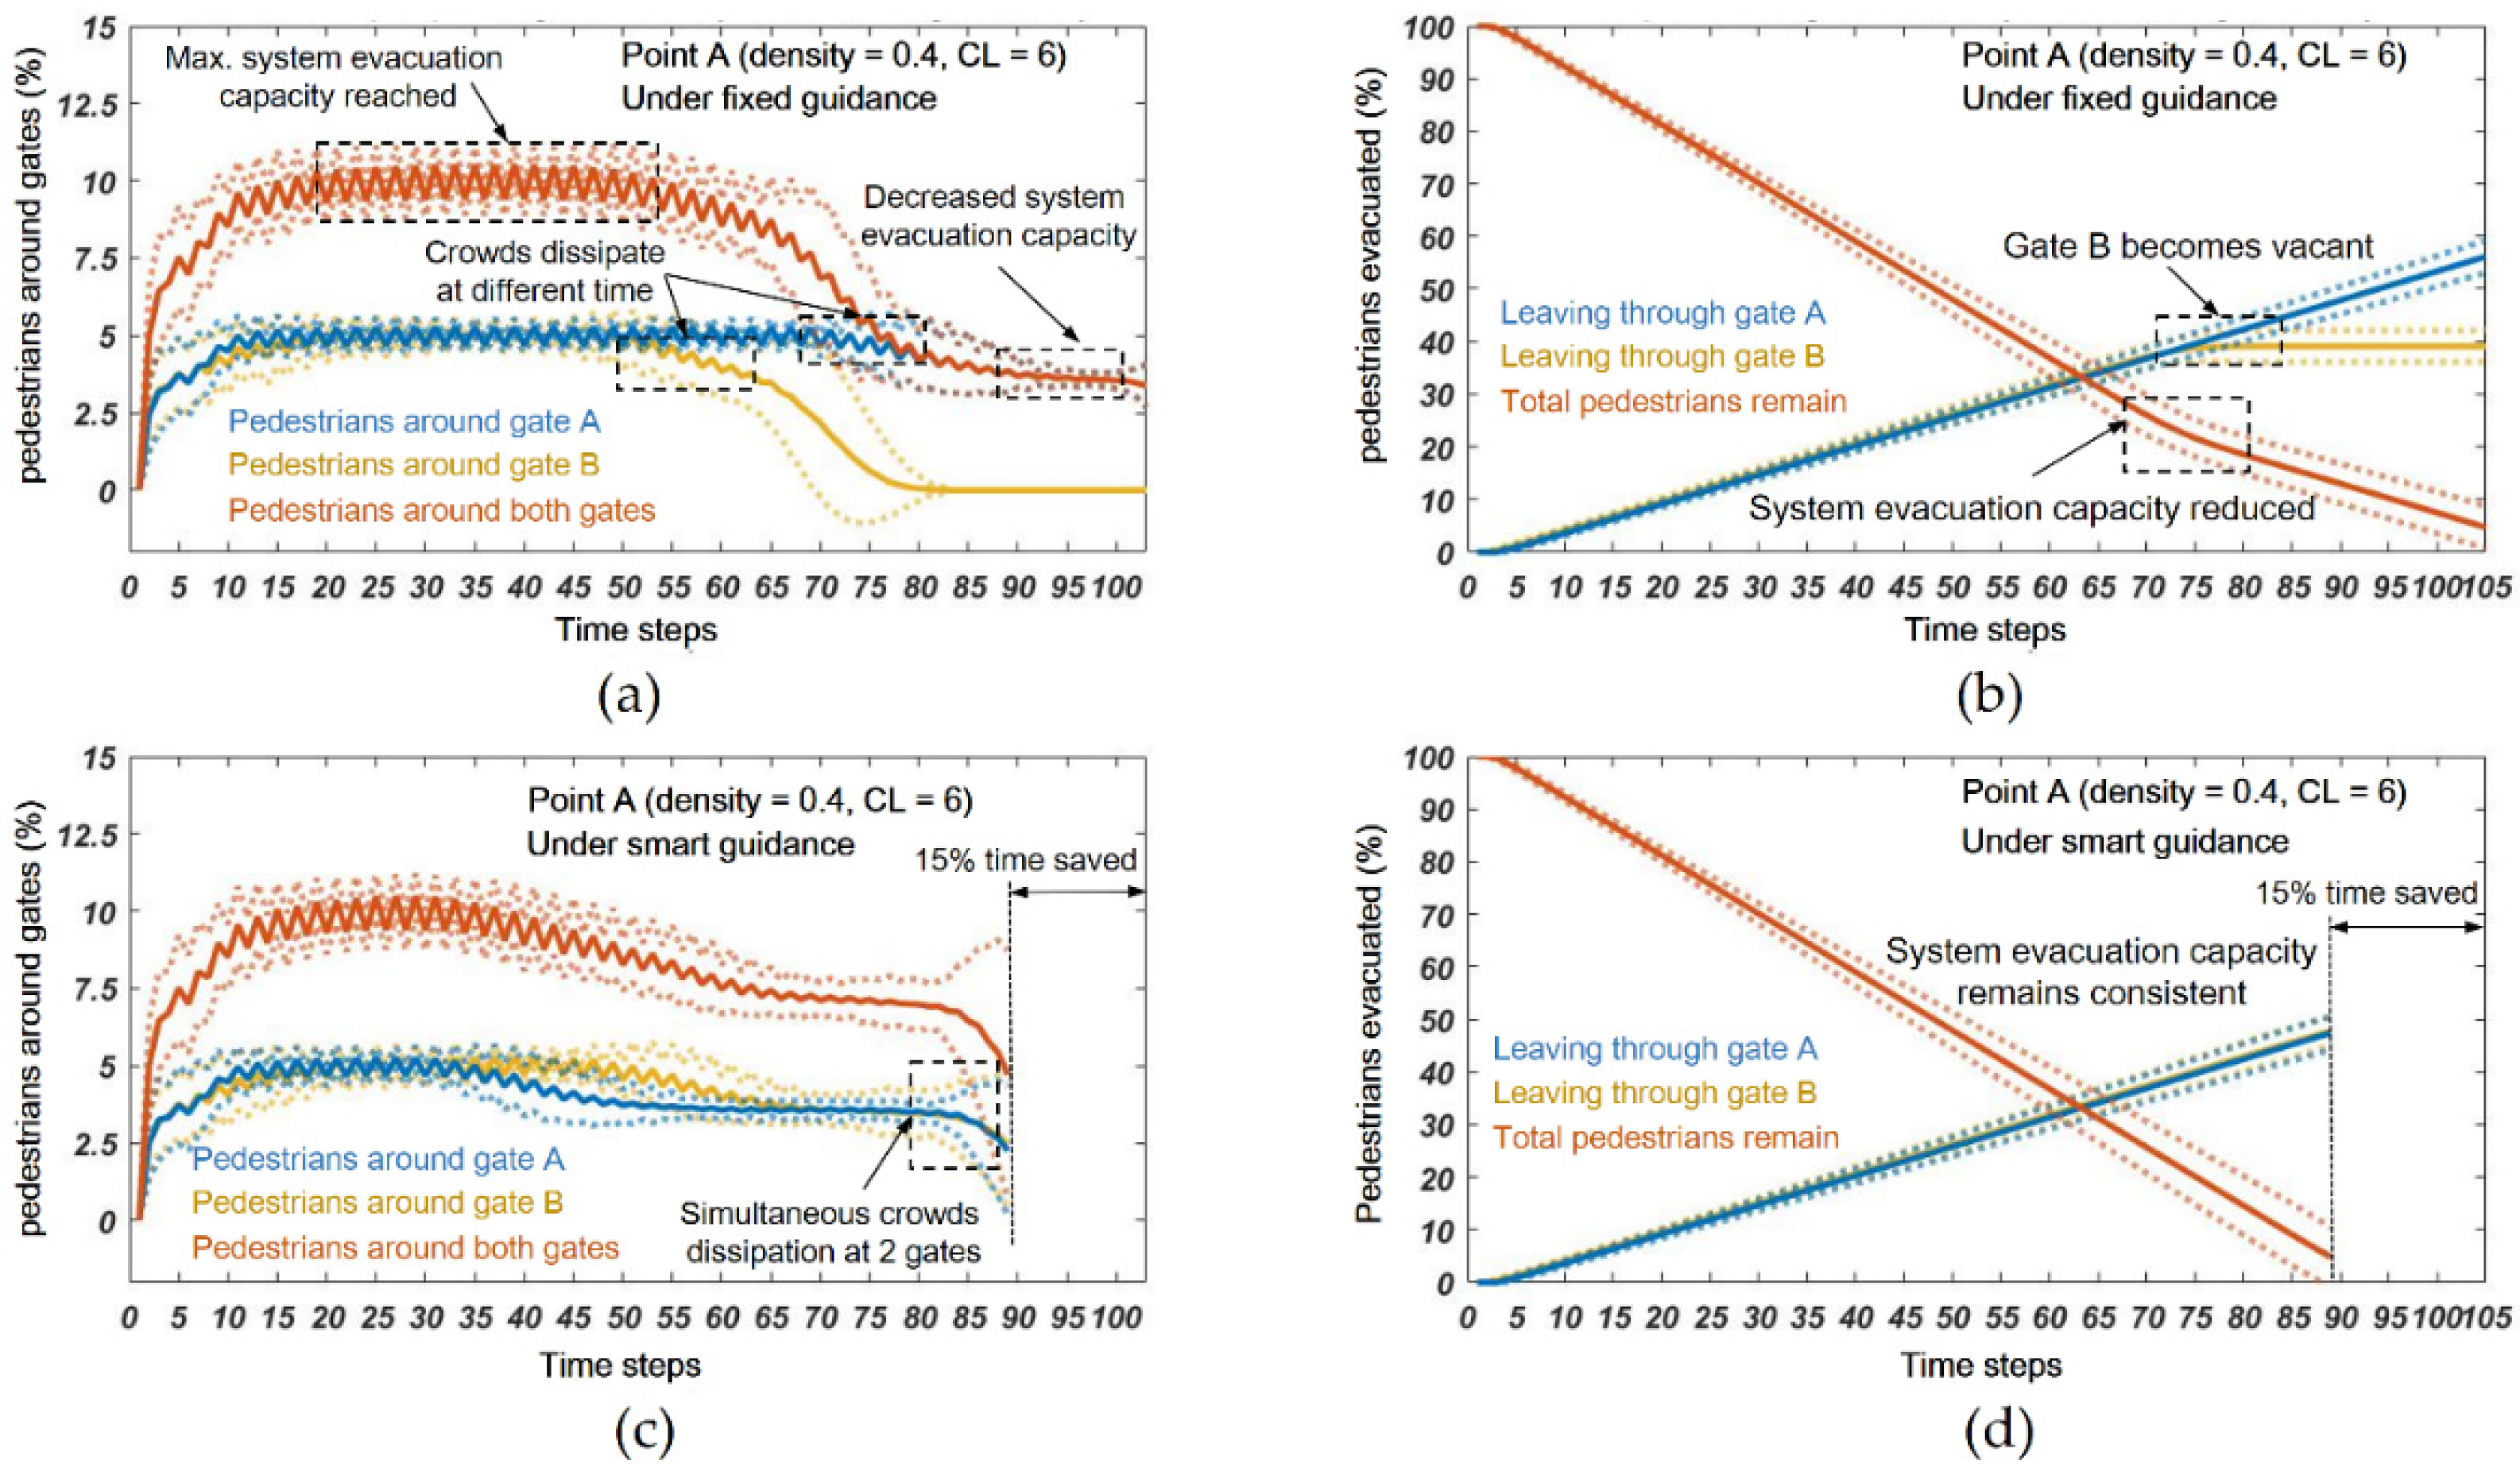
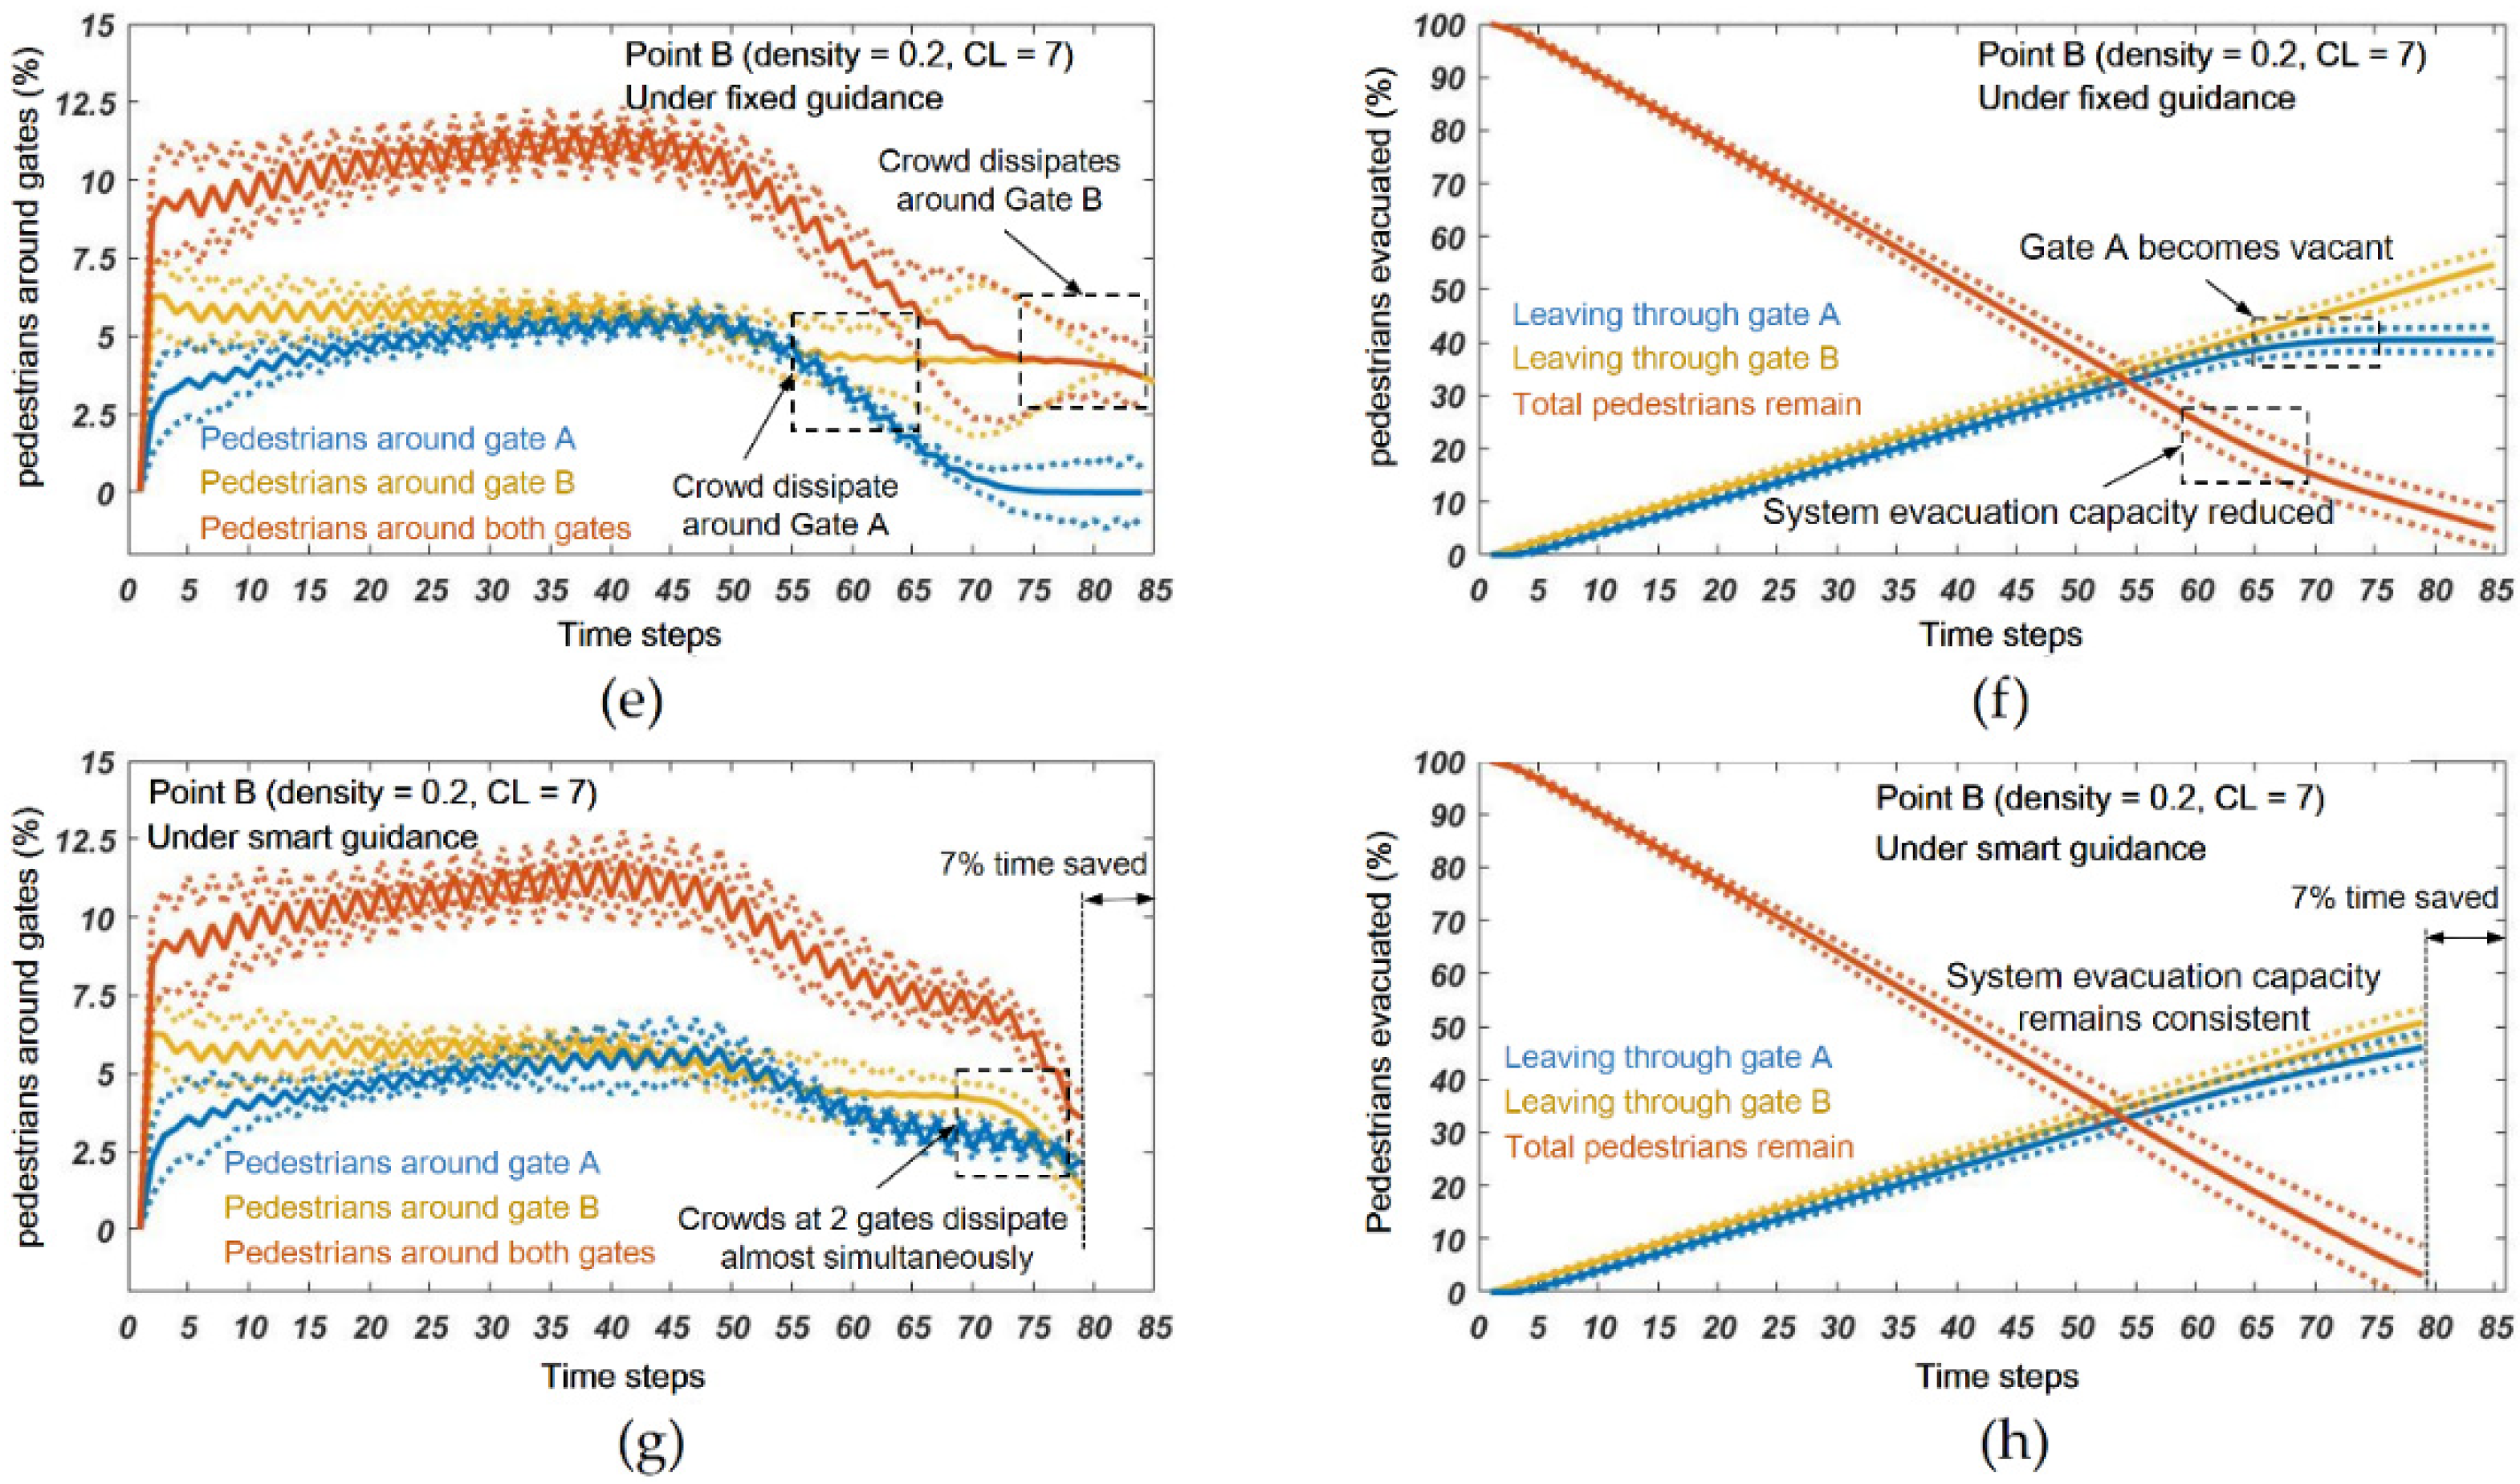
(e)
A closer examination of the pedestrian evacuation behavior shows that the introduction of the smart guidance helps to more scientifically divide people to evacuate through respective exit gates so that crowds tend to dissipate simultaneously, and therefore, more evacuation capacity of the exit gates can be mobilized, resulting in shorter total evacuation time and improved safety for pedestrians collectively.
In summary, a system under smart guidance tends to have a shorter evacuation time and performs more stable for pedestrian evacuations over the traditional fixed guided systems, which provides insight for potential real applications of a similar kind. Comparing to the previous works in the literature that only concerned pedestrian flow characteristics or passive interactions between pedestrians and the geometry of the infrastructure internal space, this work showcased for the first time the potential benefits from an active smart-guidance system in the context of pedestrian emergency evacuations. The system based on the application of digital twin concept, created a risk mitigation mechanism dynamically adaptable for various scenarios, and therefore enhanced substantially the efficiency and robustness of the system response for emergency evacuations. Expanded applications could be easily devised based on similar ideas to benefit various interactive environments in the fast-evolving smart city context. In the current research, a relatively simplified guidance algorithm was adopted with limited evacuation efficiency improvement. Our next step is to develop a guidance algorithm with self-evolving capability for complex and more realistic infrastructure geometry settings.

Author Contributions

T.H. devised the project and the main conceptual ideas. T.H. and J.Z. designed the model and the computational framework of the simulations. T.H. and J.Z. wrote the manuscript. W.L. supervised the project and in charge of overall direction and planning. All authors have read and agreed to the published version of the manuscript.

Funding

The authors would like to acknowledge the financial support provided by National Key R&D Program of China (Grant NO. 2018YFB1601304).

Acknowledgments

The authors would like to thank the reviewers for their valuable comments and suggestions and the editorial team for their professional and efficient handling of the paper.

Conflicts of Interest

The authors declare no conflict of interest.

References

  1. Fahy, R.F.; Proulx, G.; Aiman, L. Panic or not in fire: Clarifying the misconception. Fire Mater. 2012, 36, 328–338. [Google Scholar] [CrossRef]
  2. Helbing, D.; Johansson, A.; Al-Abideen, H.Z. Dynamics of crowd disasters: An empirical study. Phys. Rev. E 2007, 75, 046109. [Google Scholar] [CrossRef] [PubMed] [Green Version]
  3. Lin, P.; Ma, J.; Liu, T.; Ran, T.; Si, Y.; Li, T. An experimental study of the “faster-is-slower” effect using mice under panic. Phys. A Stat. Mech. Appl. 2016, 452, 157–166. [Google Scholar] [CrossRef]
  4. Haghani, M.; Sarvi, M. Human exit choice in crowded built environments: Investigating underlying behavioural differences between normal egress and emergency evacuations. Fire Saf. J. 2016, 85, 1–9. [Google Scholar] [CrossRef]
  5. Henderson, L.F. On the fluid mechanics of human crowd motion. Transp. Res. 1974, 8, 509–515. [Google Scholar] [CrossRef]
  6. Huang, L.; Wong, S.C.; Zhang, M.; Shu, C.W.; Lam, W.H. Revisiting Hughes’ dynamic continuum model for pedestrian flow and the development of an efficient solution algorithm. Transp. Res. Part B Methodol. 2009, 43, 127–141. [Google Scholar] [CrossRef]
  7. Hughes, R.L. A continuum theory for the flow of pedestrians. Transp. Res. Part B Methodol. 2002, 36, 507–535. [Google Scholar] [CrossRef]
  8. Hughes, R.L. The flow of human crowds. Annu. Rev. Fluid Mech. 2003, 35, 169–182. [Google Scholar] [CrossRef]
  9. Helbing, D.; Farkas, I.J.; Vicsek, T. Freezing by heating in a driven mesoscopic system. Phys. Rev. Lett. 2000, 84, 1240. [Google Scholar] [CrossRef] [Green Version]
  10. Varas, A.; Cornejo, M.D.; Mainemer, D.; Toledo, B.; Rogan, J.; Munoz, V.; Valdivia, J.A. Cellular automaton model for evacuation process with obstacles. Phys. A Stat. Mech. Appl. 2007, 382, 631–642. [Google Scholar] [CrossRef] [Green Version]
  11. Wolfram, S. Theory and Applications of Cellular Automata; World Scientific: Singapore, 1986. [Google Scholar]
  12. Wolfram, S. Cellular Automata and Complexity; Addison-Wesley: Boston, MA, USA, 1994. [Google Scholar]
  13. Knospe, W.; Santen, L.; Schadschneider, A.; Schreckenberg, M. Towards a realistic microscopic description of highway traffic. J. Phys. A Math. Gen. 2000, 33, L477. [Google Scholar] [CrossRef]
  14. Knospe, W.; Santen, L.; Schadschneider, A.; Schreckenberg, M. Single-vehicle data of highway traffic: Microscopic description of traffic phases. Phys. Rev. E 2002, 65, 056133. [Google Scholar] [CrossRef] [PubMed] [Green Version]
  15. Nagel, K.; Schreckenberg, M. A cellular automaton model for freeway traffic. J. Phys. I 1992, 2, 2221–2229. [Google Scholar] [CrossRef]
  16. Fukui, M.; Ishibashi, Y. Self-organized phase transitions in cellular automaton models for pedestrians. J. Phys. Soc. Jpn. 1999, 68, 2861–2863. [Google Scholar] [CrossRef]
  17. Fukui, M.; Ishibashi, Y. Jamming transition in cellular automaton models for pedestrians on passageway. Phys. Soc. Jpn 1999, 68, 3738–3739. [Google Scholar] [CrossRef]
  18. Burstedde, C.; Klauck, K.; Schadschneider, A.; Zittartz, J. Simulation of pedestrian dynamics using a two-dimensional cellular automaton. Phys. A Stat. Mech. Appl. 2001, 295, 507–525. [Google Scholar] [CrossRef] [Green Version]
  19. Kirchner, A.; Schadschneider, A. Simulation of evacuation processes using a bionics-inspired cellular automaton model for pedestrian dynamics. Phys. A Stat. Mech. Appl 2002, 312, 260–276. [Google Scholar] [CrossRef] [Green Version]
  20. Muramatsu, M.; Nagatani, T. Jamming transition in two-dimensional pedestrian traffic. Phys. A Stat. Mech. Appl. 2000, 275, 281–291. [Google Scholar] [CrossRef]
  21. Takimoto, K.; Nagatani, T. Spatio-temporal distribution of escape time in evacuation process. Phys. A Stat. Mech. Appl. 2003, 320, 611–621. [Google Scholar] [CrossRef]
  22. Yue, H.; Guan, H.; Zhang, J.; Shao, C. Study on bi-direction pedestrian flow using cellular automata simulation. Physica Phys. A Stat. Mech. Appl. 2010, 389, 527–539. [Google Scholar] [CrossRef]
  23. Yue, H.; Hao, H.; Chen, X.; Shao, C. Simulation of pedestrian flow on square lattice based on cellular automata model. Phys. A Stat. Mech. Appl. 2007, 384, 567–588. [Google Scholar] [CrossRef]
  24. Sun, Y. Simulations of bi-direction pedestrian flow using kinetic Monte Carlo methods. Phys. A Stat. Mech. Appl. 2019, 524, 519–531. [Google Scholar] [CrossRef]
  25. Sun, Y. Kinetic Monte Carlo simulations of bi-direction pedestrian flow with different walk speeds. Phys. A Stat. Mech. Appl. 2020, 124295. [Google Scholar] [CrossRef]
  26. Weng, W.; Chen, T.; Yuan, H.Y.; Fan, W.C. Cellular automaton simulation of pedestrian counter flow with different walk velocities. Phys. Rev. E 2006, 74, 036102. [Google Scholar] [CrossRef]
  27. Yang, L.; Li, J.; Liu, S. Simulation of pedestrian counter-flow with right-moving preference. Phys. A Stat. Mech Appl. 2008, 387, 3281–3289. [Google Scholar] [CrossRef]
  28. Alizadeh, R. A dynamic cellular automaton model for evacuation process with obstacles. Saf. Sci. 2011, 49, 315–323. [Google Scholar] [CrossRef]
  29. Zheng, Y.; Jia, B.; Li, X.G.; Zhu, N. Evacuation dynamics with fire spreading based on cellular automaton. Phys. A Stat. Mech. Appl. 2011, 390, 3147–3156. [Google Scholar] [CrossRef]
  30. Yang, L.; Fang, W.; Huang, R.; Deng, Z. Occupant evacuation model based on cellular automata in fire. Chin. Sci. Bull. 2002, 47, 1484. [Google Scholar] [CrossRef]
  31. Lee, J.; Wu, F.; Zhao, W.; Ghaffari, M.; Liao, L.; Siegel, D. Prognostics and health management design for rotary machinery systems—Reviews, methodology and applications. Mech. Syst. Signal Process. 2014, 42, 314–334. [Google Scholar] [CrossRef]
  32. Moeuf, A.; Pellerin, R.; Lamouri, S.; Tamayo-Giraldo, S.; Barbaray, R. The industrial management of SMEs in the era of Industry 4.0. Int. J. Prod. Res. 2018, 56, 1118–1136. [Google Scholar] [CrossRef] [Green Version]
  33. Hermann, M.; Pentek, T.; Otto, B. Design principles for industrie 4.0 scenarios. In Proceedings of the 49th Hawaii International Conference on System Sciences (HICSS), Koloa, HI, USA, 5–8 January 2016. [Google Scholar] [CrossRef] [Green Version]
  34. Kagermann, H.; Wahlster, W.; Helbig, J. Recommendations for Implementing the Strategic Initiative Industrie 4.0: Final Report of the Industrie 4.0 Working Group; Acatech: München, Germany, 2013; pp. 19–26. [Google Scholar]
  35. Lasi, H.; Hussain, H.I.; Ślusarczyk, B.; Jermsittiparsert, K. Industry 4.0. Bus. Inf. Syst. Eng. 2014, 6, 239–242. [Google Scholar] [CrossRef]
  36. Negri, E.; Fumagalli, L.; Macchi, M. A review of the roles of digital twin in cps-based production systems. Procedia Manuf. 2017, 11, 939–948. [Google Scholar] [CrossRef]
  37. Schleich, B.; Anwer, N.; Mathieu, L.; Wartzack, S. Shaping the digital twin for design and production engineering. CIRP Ann. 2017, 66, 141–144. [Google Scholar] [CrossRef] [Green Version]
  38. Lu, Y.; Xu, X. Cloud-based manufacturing equipment and big data analytics to enable on-demand manufacturing services. Robot. Comput.-Integr. Manuf. 2019, 57, 92–102. [Google Scholar] [CrossRef]
  39. Tao, F.; Sui, F.; Liu, A.; Qi, Q.; Zhang, M.; Song, B.; Guo, Z.; Lu, S.C.Y.; Nee, A.Y.C. Digital twin-driven product design framework. Int. J. Prod. Res. 2019, 57, 3935–3953. [Google Scholar] [CrossRef] [Green Version]
  40. Cheng, J.; Zhang, H.; Tao, F.; Juang, C.F. DT-II: Digital twin enhanced Industrial Internet reference framework towards smart manufacturing. Robot. Comput.-Integr. Manuf. 2020, 62, 101881. [Google Scholar] [CrossRef]
  41. Cimino, C.; Negri, E.; Fumagalli, L. Review of digital twin applications in manufacturing. Comput. Ind. 2019, 113, 103130. [Google Scholar] [CrossRef]
  42. Lu, Y.; Liu, C.; Kevin, I.; Wang, K.; Huang, H.; Xu, X. Digital Twin-driven smart manufacturing: Connotation, reference model, applications and research issues. Robot. Comput.-Integr. Manuf. 2020, 61, 101837. [Google Scholar] [CrossRef]
  43. Ito, K. Change beyond building information modeling to a “Digital Twin” in architecture. Jpn. Archit. Rev. 2019, 2, 391. [Google Scholar] [CrossRef] [Green Version]
  44. Kaewunruen, S.; Lian, Q. Digital twin aided sustainability-based lifecycle management for railway turnout systems. J. Clean. Prod. 2019, 228, 1537–1551. [Google Scholar] [CrossRef]
  45. Lu, R.; Brilakis, I. Digital twinning of existing reinforced concrete bridges from labelled point clusters. Autom. Construct. 2019, 105, 102837. [Google Scholar] [CrossRef]
  46. Bagheri, B.; Lee, J. Big Future for Cyber-Physical Manufacturing Systems. Des. World 2015. Available online: https://www.researchgate.net/publication/282355928_Big_future_for_cyberphysical_manufacturing_systems (accessed on 2 November 2020).
Figure 1. Digital Twin Concept for a Pedestrian Tunnel.
Sustainability 12 09701 g001
Figure 2. Cellular Automaton Model for Pedestrian Evacuation in a Slender-Shape Infrastructure.
Sustainability 12 09701 g002
Figure 3. Pedestrian Movement Strategy Diagram. (a) Far Away From Exit Gate; (b) Near the Exit Gate; (c) at the Exit Gate.
Sustainability 12 09701 g003
Figure 4. Pedestrian Movement Priority Diagram.
Sustainability 12 09701 g004
Figure 5. Pedestrian Movement Priority Diagram. (a) Pedestrians Evacuate Through the Nearest Exit Gate; (b) Pedestrians Evacuate Through Exit Gate Based on Estimated Evacuation Time.
Sustainability 12 09701 g005
Figure 6. Pedestrian Evacuation Process with Pedestrian Crowd.
Sustainability 12 09701 g006
Figure 7. Evacuation Time in Different Density Distribution Settings. (a) Total Evacuation Time Under Fixed Guidance; (b) Total Evacuation Time Under Smart Guidance; (c) Total Time Saving; (d) std. of Total Evacuation Time Under Fixed Guidance; (e) std. of Total Evacuation Time Under Smart Guidance; (f) std. of Total Time Saving.
Sustainability 12 09701 g007
Figure 8. Evacuation Simulations at Particular Density Settings. (a) Pedestrians at Gate Areas Under Fixed Guidance (Point A); (b) Pedestrians Leaving the Infrastructure Under Fixed Guidance (Point A); (c) Pedestrians at Gate Areas Under Smart Guidance (Point A); (d) Pedestrians Leaving the Infrastructure Under Smart Guidance (Point A); (e) Pedestrians at Gate Areas Under Fixed Guidance (Point B); (f) Pedestrians Leaving the Infrastructure Under Fixed Guidance (Point B); (g) Pedestrians at Gate Areas Under Smart Guidance (Point B); (h) Pedestrians Leaving the Infrastructure Under Smart Guidance (Point B); 15% Saving of Total Evacuation Time is Achieved for Smart-Guided Evacuations Over Fixed-Guided Ones for Point A Density Combination, while 7% is Obtained for Point B Density Settings.
Sustainability 12 09701 g008aSustainability 12 09701 g008b
Publisher’s Note: MDPI stays neutral with regard to jurisdictional claims in published maps and institutional affiliations.

