Article

Identifying Urban Traveling Hotspots Using an Interaction-Based Spatio-Temporal Data Field and Trajectory Data: A Case Study within the Sixth Ring Road of Beijing

1
College of Resources Environment and Tourism, Capital Normal University, Beijing 100048, China
2
Beijing Laboratory of Water Resources Security, Capital Normal University, Beijing 100048, China
3
3D Information Collection and Application Key Lab of Education Ministry, Capital Normal University, Beijing 100048, China
4
Beijing State Key Laboratory Incubation Base of Urban Environmental Processes and Digital Simulation, Capital Normal University, Beijing 100048, China
*
Author to whom correspondence should be addressed.
Sustainability 2020, 12(22), 9662; https://doi.org/10.3390/su12229662
Submission received: 26 September 2020 / Revised: 9 November 2020 / Accepted: 16 November 2020 / Published: 19 November 2020
(This article belongs to the Special Issue Spatial Analysis and Geographic Information Systems)

Abstract

:
Exploring urban travelling hotspots has become a popular trend in geographic research in recent years. Their identification involved the idea of spatial autocorrelation and spatial clustering based on density in the previous research. However, there are some limitations to them, including the unremarkable results and the determination of various parameters. At the same time, none of them reflect the influences of their neighbors. Therefore, we used the concept of the data field and improved it with the impact of spatial interaction to solve those problems in this study. First of all, an interaction-based spatio-temporal data field identification for urban hotspots has been built. Then, the urban travelling hotspots of Beijing on weekdays and weekends are identified in six different periods. The detected hotspots are passed through qualitative and quantitative evaluations and compared with the other two methods. The results show that our method could discover more accurate hotspots than the other two methods. The spatio-temporal distributions of hotspots fit commuting activities, business activities, and nightlife activities on weekdays, and the hotspots discovered at weekends depict the entertainment activities of residents. Finally, we further discuss the spatial structures of urban hotspots in a particular period (09:00–12:00) as an example. It reflects the strong regularity of human travelling on weekdays, while human activities are more varied on weekends. Overall, this work has a certain theoretical and practical value for urban planning and traffic management.

1. Introduction

Intra-city human activities have accelerated the urbanization process in recent years. There is a huge urban population due to rural-to-urban migrations, especially. Furthermore, rapid urban expansion causes imbalanced urban development, such as traffic congestion, resource shortage, and environmental degradation [1,2,3]. The emergence of these problems is closely related to human mobility in the city [2]. For example, a large number of commuting activities aggravate traffic problems and air pollution in a particular period. These phenomena lead to various issues and discussions about urban structure and urban sustainable development [1,3]. Human activities in the urban area, by its very nature, could be categorized as travelling activities. The occurrence of them would be varied alone but would be geographically or temporally regular. Therefore, there is a feasible way to study the characteristics and patterns of these travelling activities. It is critical for planners and managers to understand urban structures and sustainable development for the modern city.
At the same time, the acquisition of geo big data became more convenient with the rapid development of location-based service (LBS) and information and communication technology (ICT) [4,5]. Big data such as taxi trajectories, mobile phone records, and social media data include geographic locations and the time when they appeared. Each datum records human activities from individuals, which track people and updates in real-time. These data are widely used to solve the problem of the human–environment relationship [5]. Compared with conventional questionnaires and remote sensing data, they not only could be captured easily but also play a vital role in social sensing as the sensor of individuals [3,5]. The advantages of those geo big data bring new opportunities to observe, quantify, and even predict the dynamic patterns of human activities and the urban environment from an individual to a society level.
Most human travelling activities are driven by many reasons. No matter what those reasons are, these urban travels are also known as the spatio-temporal tracks that lead to a series of spatio-temporal phenomena. Exploring inherent patterns of these phenomena has become more and more popular in urban study. Previous research mainly focused on the traces of human travelling, travelling origin–destination (OD) flow, and the patterns of urban areas involved in travels. Specifically, the traces of human travelling included a series of travelling points that are responsible for the human daily mobility patterns at the individual and population levels—for example, travelling motifs [6,7,8]. There are also several studies uncovering and forecasting the spatio-temporal travelling routines through travelling traces [9,10,11]. At the same time, travelling OD flows as the expression of spatial interactions between two places also play an essential role in discovering the patterns of human travelling. Yao et al. caught hot spatial interactions with multiple flows using OD flow clustering which could reflect the patterns of human travelling [12]. Evaluating those flows with the mutual constricted relationship is a feasible way as well [13]. Besides, there is research using the volume of travelling flows and snapshots depicting human travelling patterns [14]. Furthermore, analyzing the distribution of human travels and the urban areas in which they appeared is also a research trend from recent years. Some of them explored the spatial distributions of travels for diverse social activities [15] and the geographical characteristics of urban travel demand [16]. Apart from that, Yang et al. evaluated the diverse popularity of places in the urban area by human travelling [17,18]. Other research focused on the spatio-temporal characteristics of urban travelling hotspots [2,19,20].
Generally, most of the studies working on the spatio-temporal patterns of urban travelling could be categorized as discussions about where the popular areas of these travels appeared—in other words, urban travelling hotspots. There are also many hotspots that we will study in the urban area, such as crime hotspots, pollution hotspots, and epidemic hotspots. However, searching for the locations and boundaries of those hotspots accurately is a common goal in the geographical view. One conventional method is spatial autocorrelation, such as local Moran’s I and Getis-Ord Gi*, which means using the quantitative statistic index to identify hot or cold areas at various scales [21,22]. Recently, the idea of the emerging hotspot (EHS) was introduced to detect changes in trends of space–time data [23]. Harris et al. combined EHS analysis to study the condition of forest loss [24]. Another popular method that identifies urban hotspots is density-based clustering. Some research detected urban hotspots of trajectory with density-based spatial clustering of applications with noise (DBSCAN) [25,26]. One discovered the spatio-temporal hotspots of pick-ups and drop-offs and their intersections with an improved DBSCAN method and analyzed their dynamic distributions [27]. Wang et al. improved the traditional DBSCAN algorithm to suit the spatial network space to detect areas with dense events [28]. Furthermore, kernel density estimation (KDE) played an important role in hotspot identification. For example, Zhang et al. explored and clustered the travelling patterns of residents in the urban space using KDE [29]. Yang et al. studied the spatio-temporal characteristics of urban travelling hotspots by an improved one [2]. Meanwhile, there is an extension in which some studies found hotspot locations with KDE and its improved methods in the urban road network [30,31]. However, spatial autocorrelation would be bad at narrowing the hot area down to a limited range with the most events. Density-based clustering and kernel density estimation have an obstacle, which is the determination of critical parameters, including the number of (1) clusters and (2) cluster centers and (3) radius, which would cause dynamic distribution of hotspots [19]. At the same time, all of them would consider the aggregating high-density center rather than the influences by surrounding objects.
Fortunately, the concept of the data field was proposed to solve this problem. It simulates the mutual interactions between particles in the physical field to depict the relationship between data objects [19,32]. There are previous research studies which used this idea in data clustering [33,34], image segmentation [35], and detecting urban hotspots [19,20,36]. Despite the increasing success in identifying hotspots with a data field, the spatial interaction in the geographical space would not be considered in mutual interactions, which is an important factor driven by human activities. As a result, this study improves the spatio-temporal data field with the impact of long-range spatial interaction to discover urban travelling hotspots. A case study employs the proposed method to identify urban hotspots, and then the accuracy of results is evaluated. Finally, we analyze the spatio-temporal characteristics of the spatial distribution of those hotspots and their interactions. Figure 1 illustrates the overall framework of this study.
The remainder of this article is structured as follows. Section 2 discusses the basic theory and applications of the data field. Section 3 introduces the proposed methods and evaluations used in this study. In Section 4, we present a case study within the Sixth Ring Road in Beijing. Next, we discuss some broader thinking about the interactions between hotspots under the urban spatial network in Section 5, before concluding and pointing out directions for future work in Section 6.

2. Data Field Theory and Its Classical Expansions

There is a mutual interaction between individual particles, described as “the concept of the field” in physical space. Each particle is regarded as a field source. Each field source would radiate energy and influence others around it simultaneously; its energy value is considered as field potential. Li [32] developed this concept for abstract data objects and their distributions. According to his idea, the mutual interaction between data objects is depicted by the aid of a data field [20]. Meanwhile, the concept of potential energy in the physical system had been brought to measure the influence of the interaction between data objects with a suitable potential function [33,35]. As a result, the potential value is an exact quantitative expression about how a field source (an object) influences its neighbors.
In general, the radiation distance of the field source determines the type of the field [32]. There are long-range fields and short-range fields in the data field. As the position in the long-range field is far away from the field source, the potential value does not vanish. The short-range field, however, can be represented the character which is the value that dropped sharply with an increasing distance in the space. The potential functions of the short-range field fit specifically to quantify these characteristics of distance decay with the Gaussian kernel function [19,20,32,33].
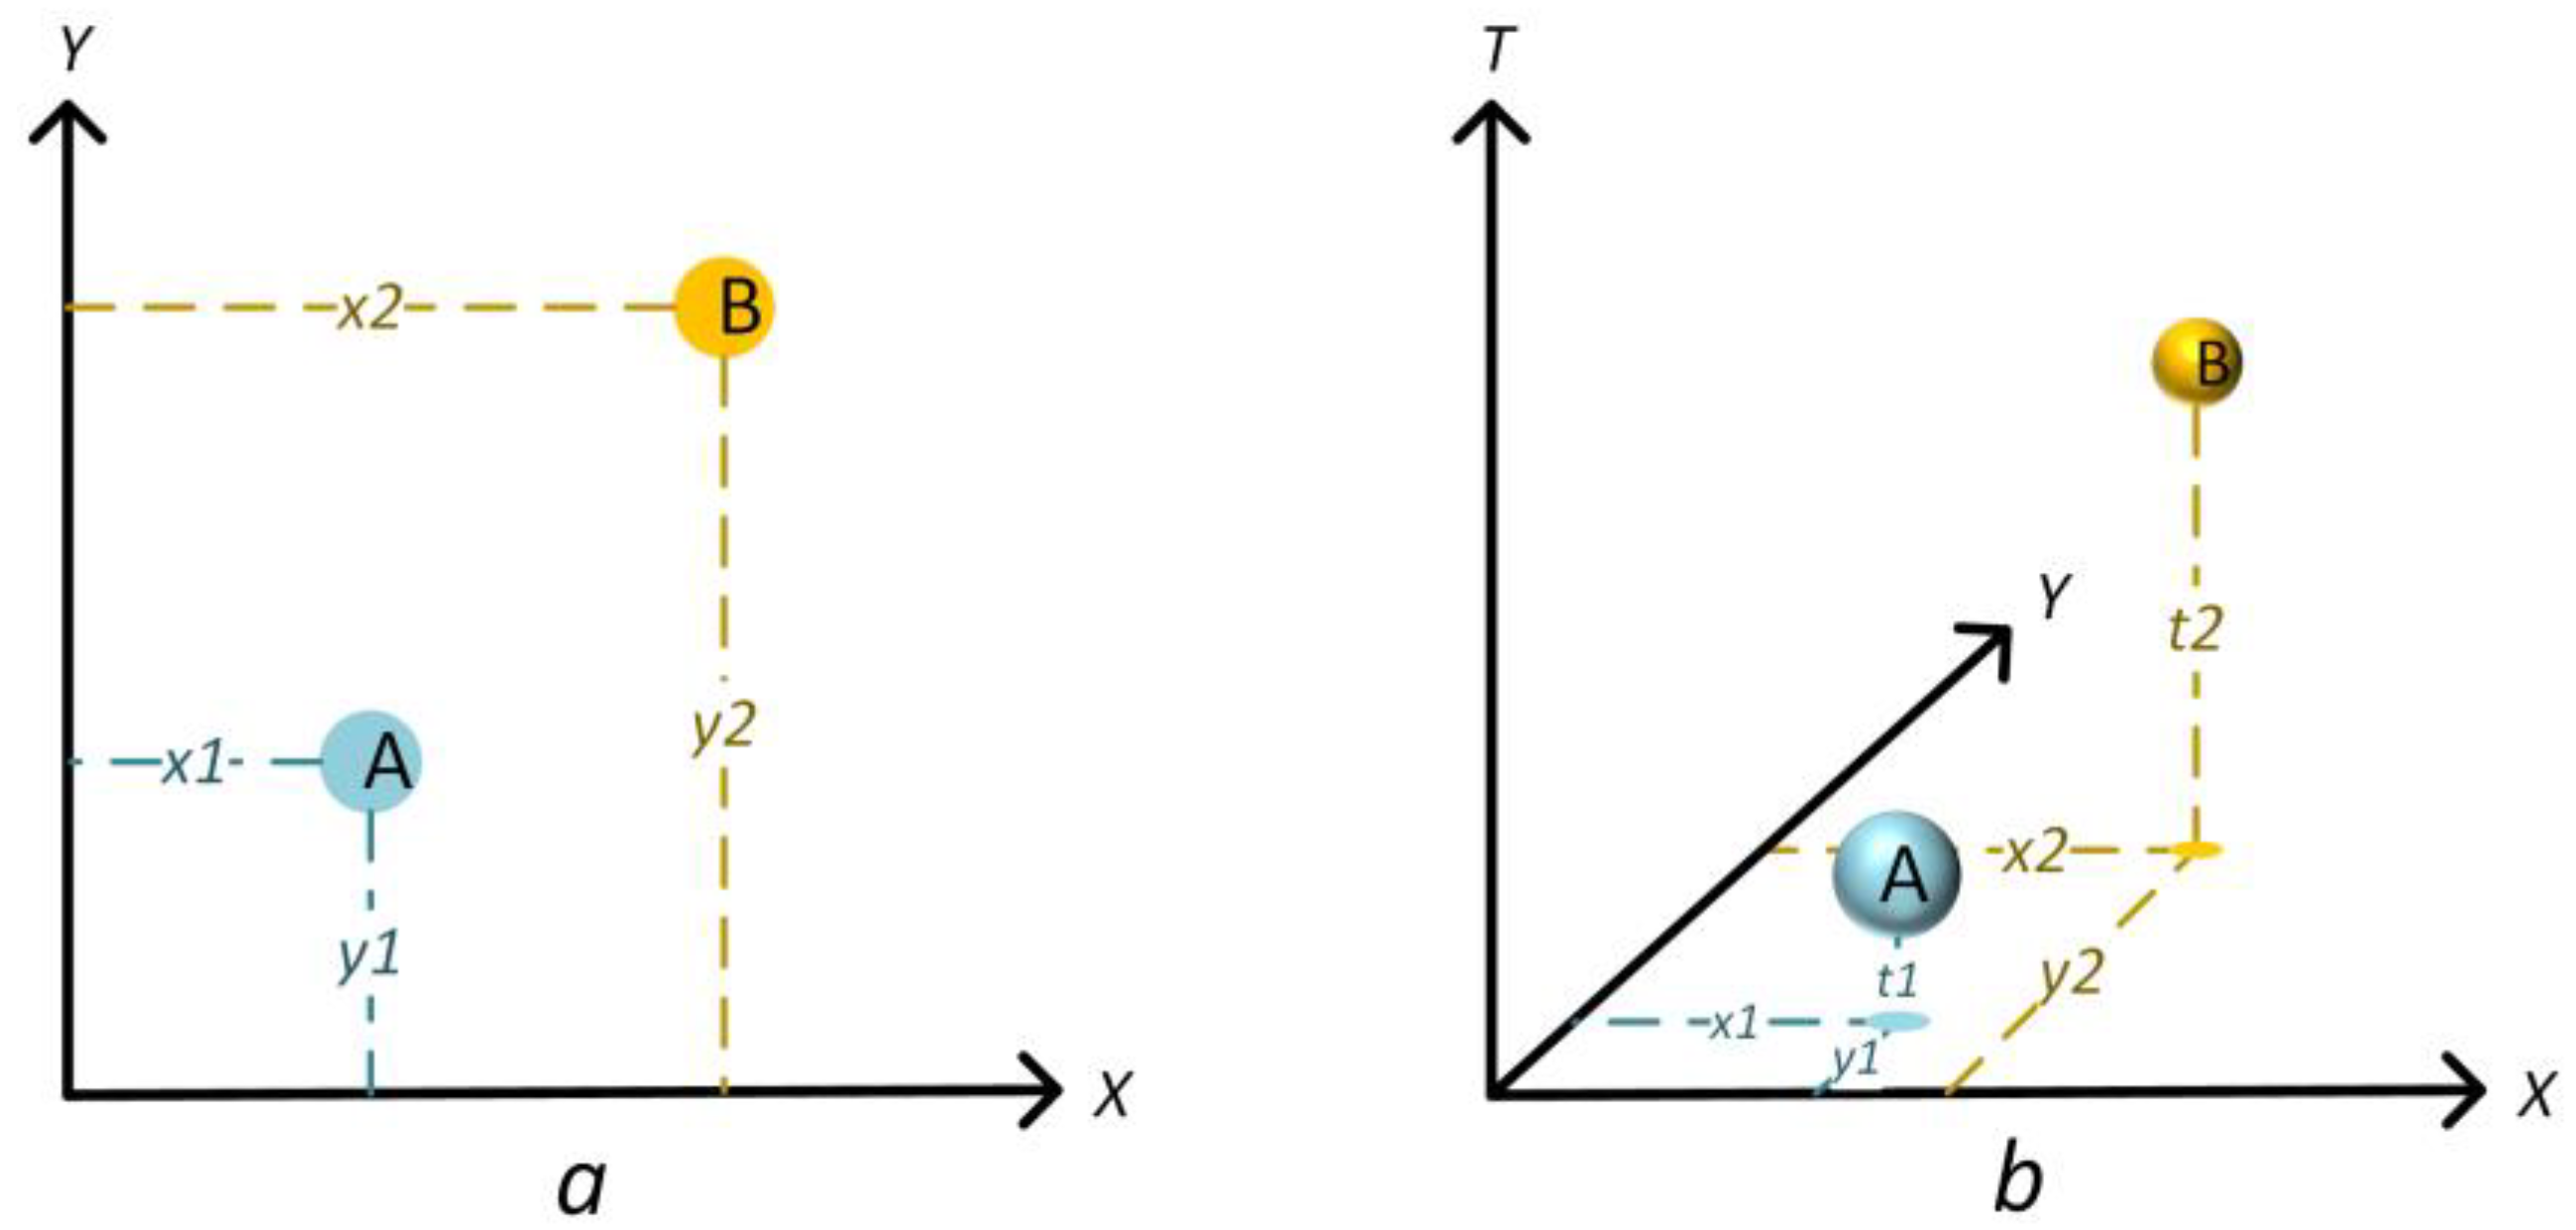
Instead of random microparticles in physical space, location-based data points, such as trajectory data, would be aggregated in a particular area because of humans and the environment. Therefore, they have their own data field and influence each other due to the nature of them. Zhao et al. followed the idea of the data field and proposed a trajectory data field [19]. In trajectory data, each point is treated as a field source with mass. Its potential value depends on the number of field sources around it and the distance between them. However, taxi trajectories are the aid of distinctive spatio-temporal data with rich time information. There is a temporal dimensional expansion from the classical spatial data field [36]. Typically, the coordinates of two dimensions, x and y , describe the location where the data point occurred. In a spatio-temporal space, the energy radiating from the field source is controlled by the distance from the source and the time after the field source formed [20,36]. Figure 2 illustrates the theoretical relationship of two points in a spatial space and in a spatio-temporal space.
Added with the time parameter, the traditional trajectory data field was evolved into the spatio-temporal data field. Supposing that the trajectories dataset D = { p 1 , p 2 , , p n } is in the spatio-temporal data field, each pick-up or drop-off is abstract, as p i = { x i , y i , t i } , where x i , y i , t i is separately represented to the coordinates x and y and the time that the event showed up. The definition of the potential value of p i is expressed as the following Equations (1) and (2):
φ ( i ) = j = 1 n m j × e ( d i j σ ) k × 1 t i j
t i j = t i j t m i n t m a x t m i n
where m j represents the mass of the data object p j , normally equaled to 1; d i j means the distance between the object p i and p j ; σ is the impact factor that controls the range of interactions among the objects [33]; k is the distance index, normally equaled to 2; t i j is defined as the normalization of the interval of two data points happened; t m i n means the minimal interval in the dataset; t m a x means the maximal interval in the dataset.
The impact factor measures the range within which a field source can influence others in the data field. When the impact factor σ is greater, the interaction range R is larger. According to the principle of Gaussian kernel function, the influences of the short-range field vanish at 3 2 σ from the field source. In previous studies, the value of σ equaled to around 0.3 [19,36], and entropy was used to evaluate the distributions of data points and select a suitable impact factor for the dataset [32].

3. Methodology

Data field theory is a data-driven methodology simulating the form and distribution of a dataset that puts data points as the priority. As a result, there are several applications in many study fields, such as discovering urban hotspots [19,20,36] and data clustering [33,34]. In this section, we improve the previous methods for detecting hotspots based on a data field with spatial interaction and introduce evaluations of their accuracy.

3.1. Interaction-Based Spatio-Temporal Data Field (STDF) Identification for Urban Hotspots

In this part, the framework of interaction-based spatio-temporal data field (STDF) identification for urban hotspots is introduced. There are three steps, including calculating the potential value for each trajectory point with spatial interaction, calculating the sum of potential value in the urban unit, and detecting urban hotspots by edge detection.

3.1.1. Calculation of Potential Value

In geographical space, mutual influences between individual locations are reflected by spatial interaction and temporal activities [20]. However, spatial interaction includes two types, which are touched interaction and untouched interaction. For example, closer objects are more related to others around them and their relationships with distance decay are presented by untouched interactions, which can also be regarded as short-range interactions. More importantly, touched interactions caused by human-driven activities would also be a vital part of spatial interactions. They can be mentioned in long-range interactions since the places seem to be geographically irrelative. Figure 3 shows how the points from neighbors and couples affect one another. A conventional data field with or without a temporal dimension is a mathematical function to draw short-range interactions. As is known to all, the long-range interaction is one of the most important variations when discovering spatio-temporal patterns in urban space, including detecting urban hotspots. Existing data field methods discovered urban hotspots by the lack of long-range interactions. Therefore, we added the influence of long-range interactions into the data field in this study.
First of all, a mathematic function needed to be found to depict the long-range interaction in the space. The concept of a long-range field with a slow distance decay can be referred to as a long-range interaction. Generally, the potential function of pseudo gravity is often used to express the long-range field [32]. In a spatio-temporal space, a long-range spatial interaction F contains an origin O = { x o , y o , t o } and a destination D = { x d , y d , t d } ; the potential value of the origin affected by the destination from a long-range interaction can be expressed as follows:
φ D ( O ) = m D × 1 1 + d O D σ × 1 t O D
where m D represents the mass of destination D ; d O D means the distance between the origin O and the destination D ; σ means the impact factor; and t O D determines the normalization of the interval of the origin O and the destination D that happened as Equation (2).
Second of all, the influence of the long-range interaction can be considered when the distance of a pair of origin and destination fell outside the distance of the short-range interaction R . Nonetheless, there are two common distance measures used for calculations in geographic studies, which are the Euclidean distance and the Manhattan distance. Compared with the Euclidean distance, the Manhattan distance would be suitable to characterize the geographic relationship between taxi trajectories, because their existences rely on the road network. In this study, the Manhattan distance is employed in the distance measurement of two data points.
Combined with the spatial interaction, the potential value of the point p i in the spatio-temporal data field is calculated as follows:
φ ( i ) = j = 1 n φ j ( i )
φ j ( i ) = { m j × e ( d i j σ 1 ) 2 × 1 t i j ,     d i j 3 2 σ 1     m j × 1 1 + d i j σ 2 × 1 t i j ,         d i j > 3 2 σ 1
where m j is defined as the mass of data point j and the potential value of data point j in the pair of OD flows when d i j < 3 2 σ 1 and d i j 3 2 σ 1 , respectively; d i j means the distance between data objects (origin and destination) i and j ; σ 1 and σ 2 are the impact factors, according to the rule of minimal entropy; σ 1 and σ 2 are amounts equal to 0.5 and 0.01, respectively; t i j is the normalization of the interval of data point i and j , calculated by Equation (2).
Points A, B, and C are three points in the space. The graduated circles represent the impact radiated from data points. Spatial interaction is depicted by the graduated line with an arrow. The potential values at locations 1 and 2 are the scalar sum of their neighbors A and B, respectively, while the potential value at location 3 is regarded as the overlying of its neighbor A and couple C.

3.1.2. Quantifying the Potential Value of the Study Unit

Identifying collective spatio-temporal patterns from geo big data might be a variable challenge caused by the granularity of the analysis unit [37,38]. Trajectory data points with potential values can determine the maximal details as the minimal analysis unit undoubtedly. However, they are not regular enough to extract urban travelling modes. It is more efficient that these data points are projected into a fitting study unit with the increasing size of the study object. As a result, a specific urban unit is introduced as the study unit in this work. The potential value of one study unit is represented as Equation (5), which is quantified to the total potential value of data points within the unit.
φ ( g ) = i = 1 n φ ( i )
where φ ( g ) means the potential value of the unit g ; n means the number of the points projected in the unit.

3.1.3. Determining the Urban Hotspots by Edge Detection

There are various methods to identify hot and cold spots, including clustering based on potential value and edge detection. Thresholding segmentation, introduced by Rosin, is a simple and effective method for finding the boundary of images, which is a bilevel thresholding algorithm based on a histogram plot [39]. It aims to find the location with a maximal distance from a straight line starting at the peak and ending at the first empty bin of the histogram. All values in the histogram plot would be divided by this location. This method is suitable for histograms with only one dominant value (a peak) and a lower end. A histogram ranked by the potential values of urban units gives a long-tailed distribution curve that fits the thresholding segmentation algorithm. Therefore, we employed this method to determine hotspots in the urban area.

3.2. Evaluating the Proposed Methods

In this part, there are two aspects involved in the accuracy evaluation of urban travel hotspots, which are basic validation and prediction accuracy index (PAI).

3.2.1. Basic Validation

Identifying urban hotspots addresses the discovery of social sensing and the patterns of human activities. The most common validating method is a direct visual comparison. As a result, we first compared the results of the proposed identification method with two other methods by directly showing results on a map.

3.2.2. Quantifying the Accuracy of Identification

To validate the accuracy of detecting hotspots, researchers have begun to consider assessments that can be used to measure how good a method is for identification. There is an assessment named the prediction accuracy index (PAI), frequently used to evaluate the accuracy of crime prediction hotspots. It solved the problem of other assessments which do not take into account the size of the study areas where the crimes are predicted [40,41]. It has become the most popular accuracy measurement of predicting the spatial patterns of crimes [40,41,42,43]. The idea of the PAI can also be borrowed for quantifying the accuracy of identifying urban travel hotspots. The popularity of travel hotspots increases with the number of pick-ups and drop-offs that appear in an area in some respects. Counting the proportion of pick-ups and drop-offs that occur in the areas that are identified as hotspots to all of the areas is the method of calculation of the PAI. Equation (7) illustrates the process of the PAI as follows:
P r e d i c t i o n   A c c u r a c y   I n d e x = ( n N ) ( a A ) × 100 %
where n means the number of events within the areas identified as hotspots; N means the number of events within the study area; a and A represent the area of the hotspots and the study area, respectively.

4. Case Study

4.1. Study Area and Dataset

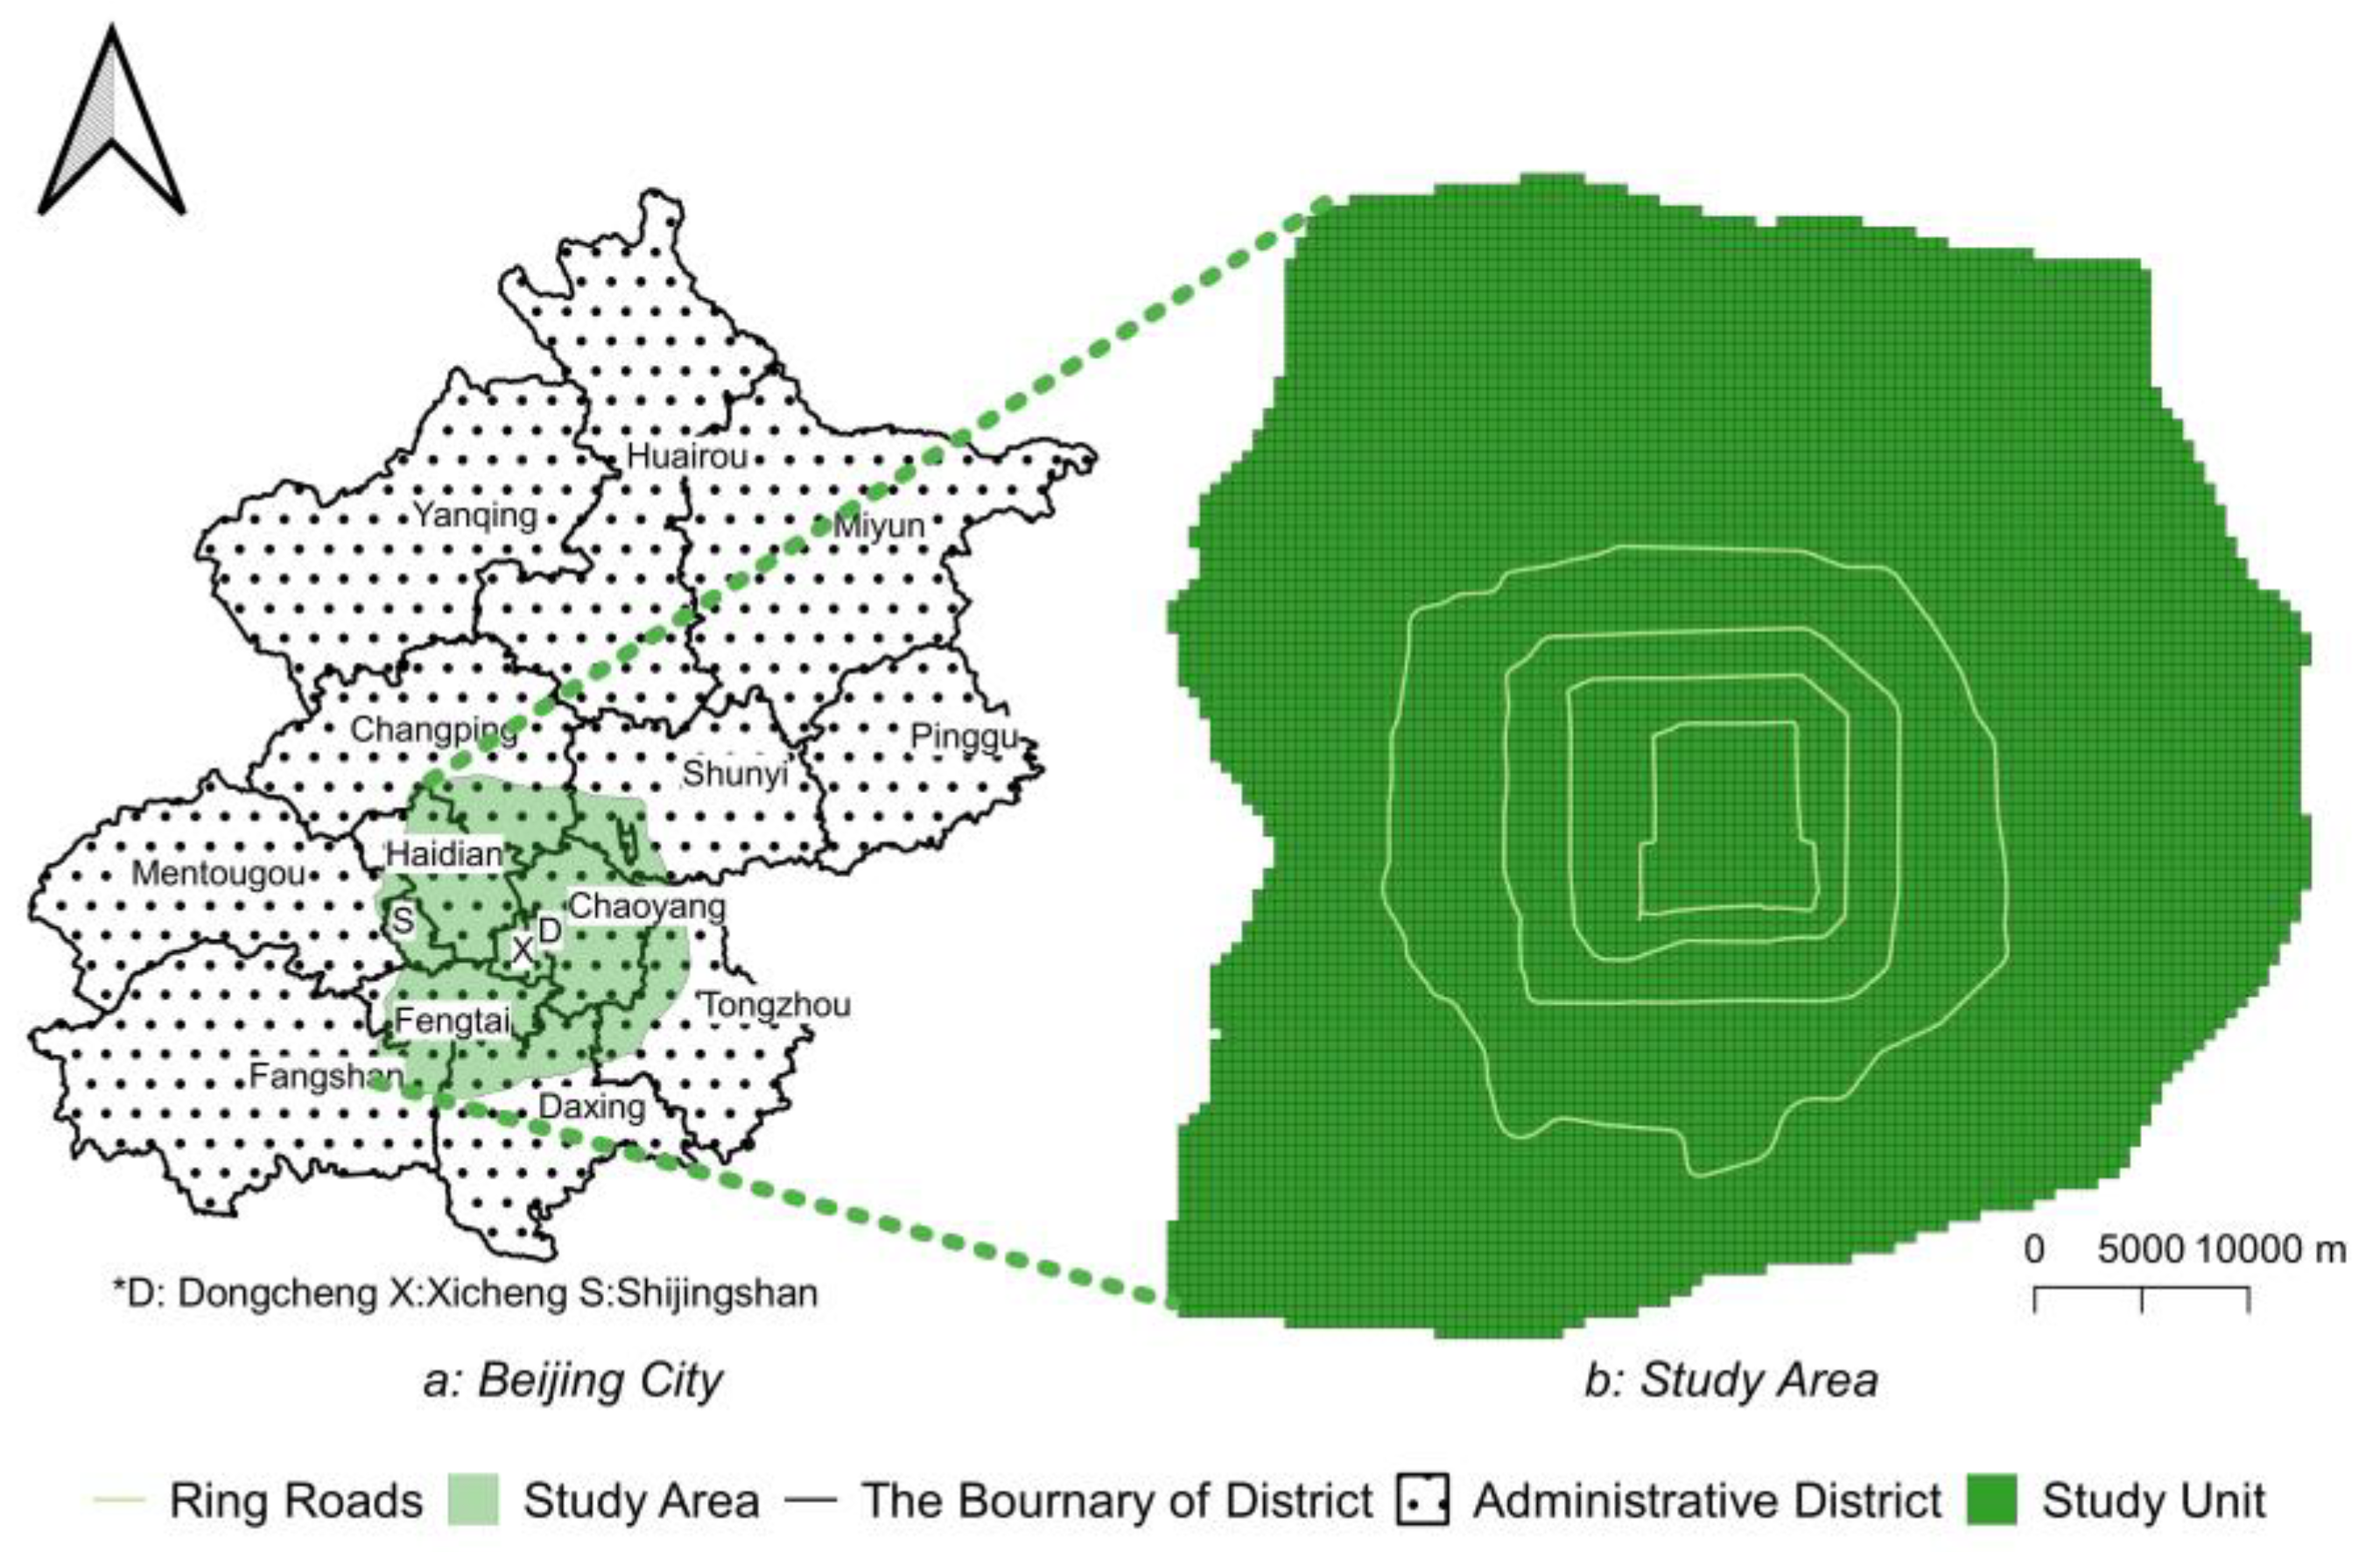
As the center of politics, economy, technology, and transportation in China, Beijing attracts attention from all over the world. Additionally, it is a suitable area to discover urban travelling problems. Specifically, the study area in this article is within the Sixth Ring Road in Beijing, including six main administrative districts and also part of the suburbs. This area is the main region of human activities, with a huge population and convenient and complete transportation systems as well as well-developed road networks. Traditionally, 500 m, or a walking time of less than 6 min, is used to define the walkability of an area [44]. Considering the scale of human activity and spatial distribution of trajectories, we considered 500 m as the research diameter and divided the whole study area into regular grids (500 × 500 square meters). These regular grids became the urban units in this study. Figure 4 shows the whole study area and the distribution of regular grids.
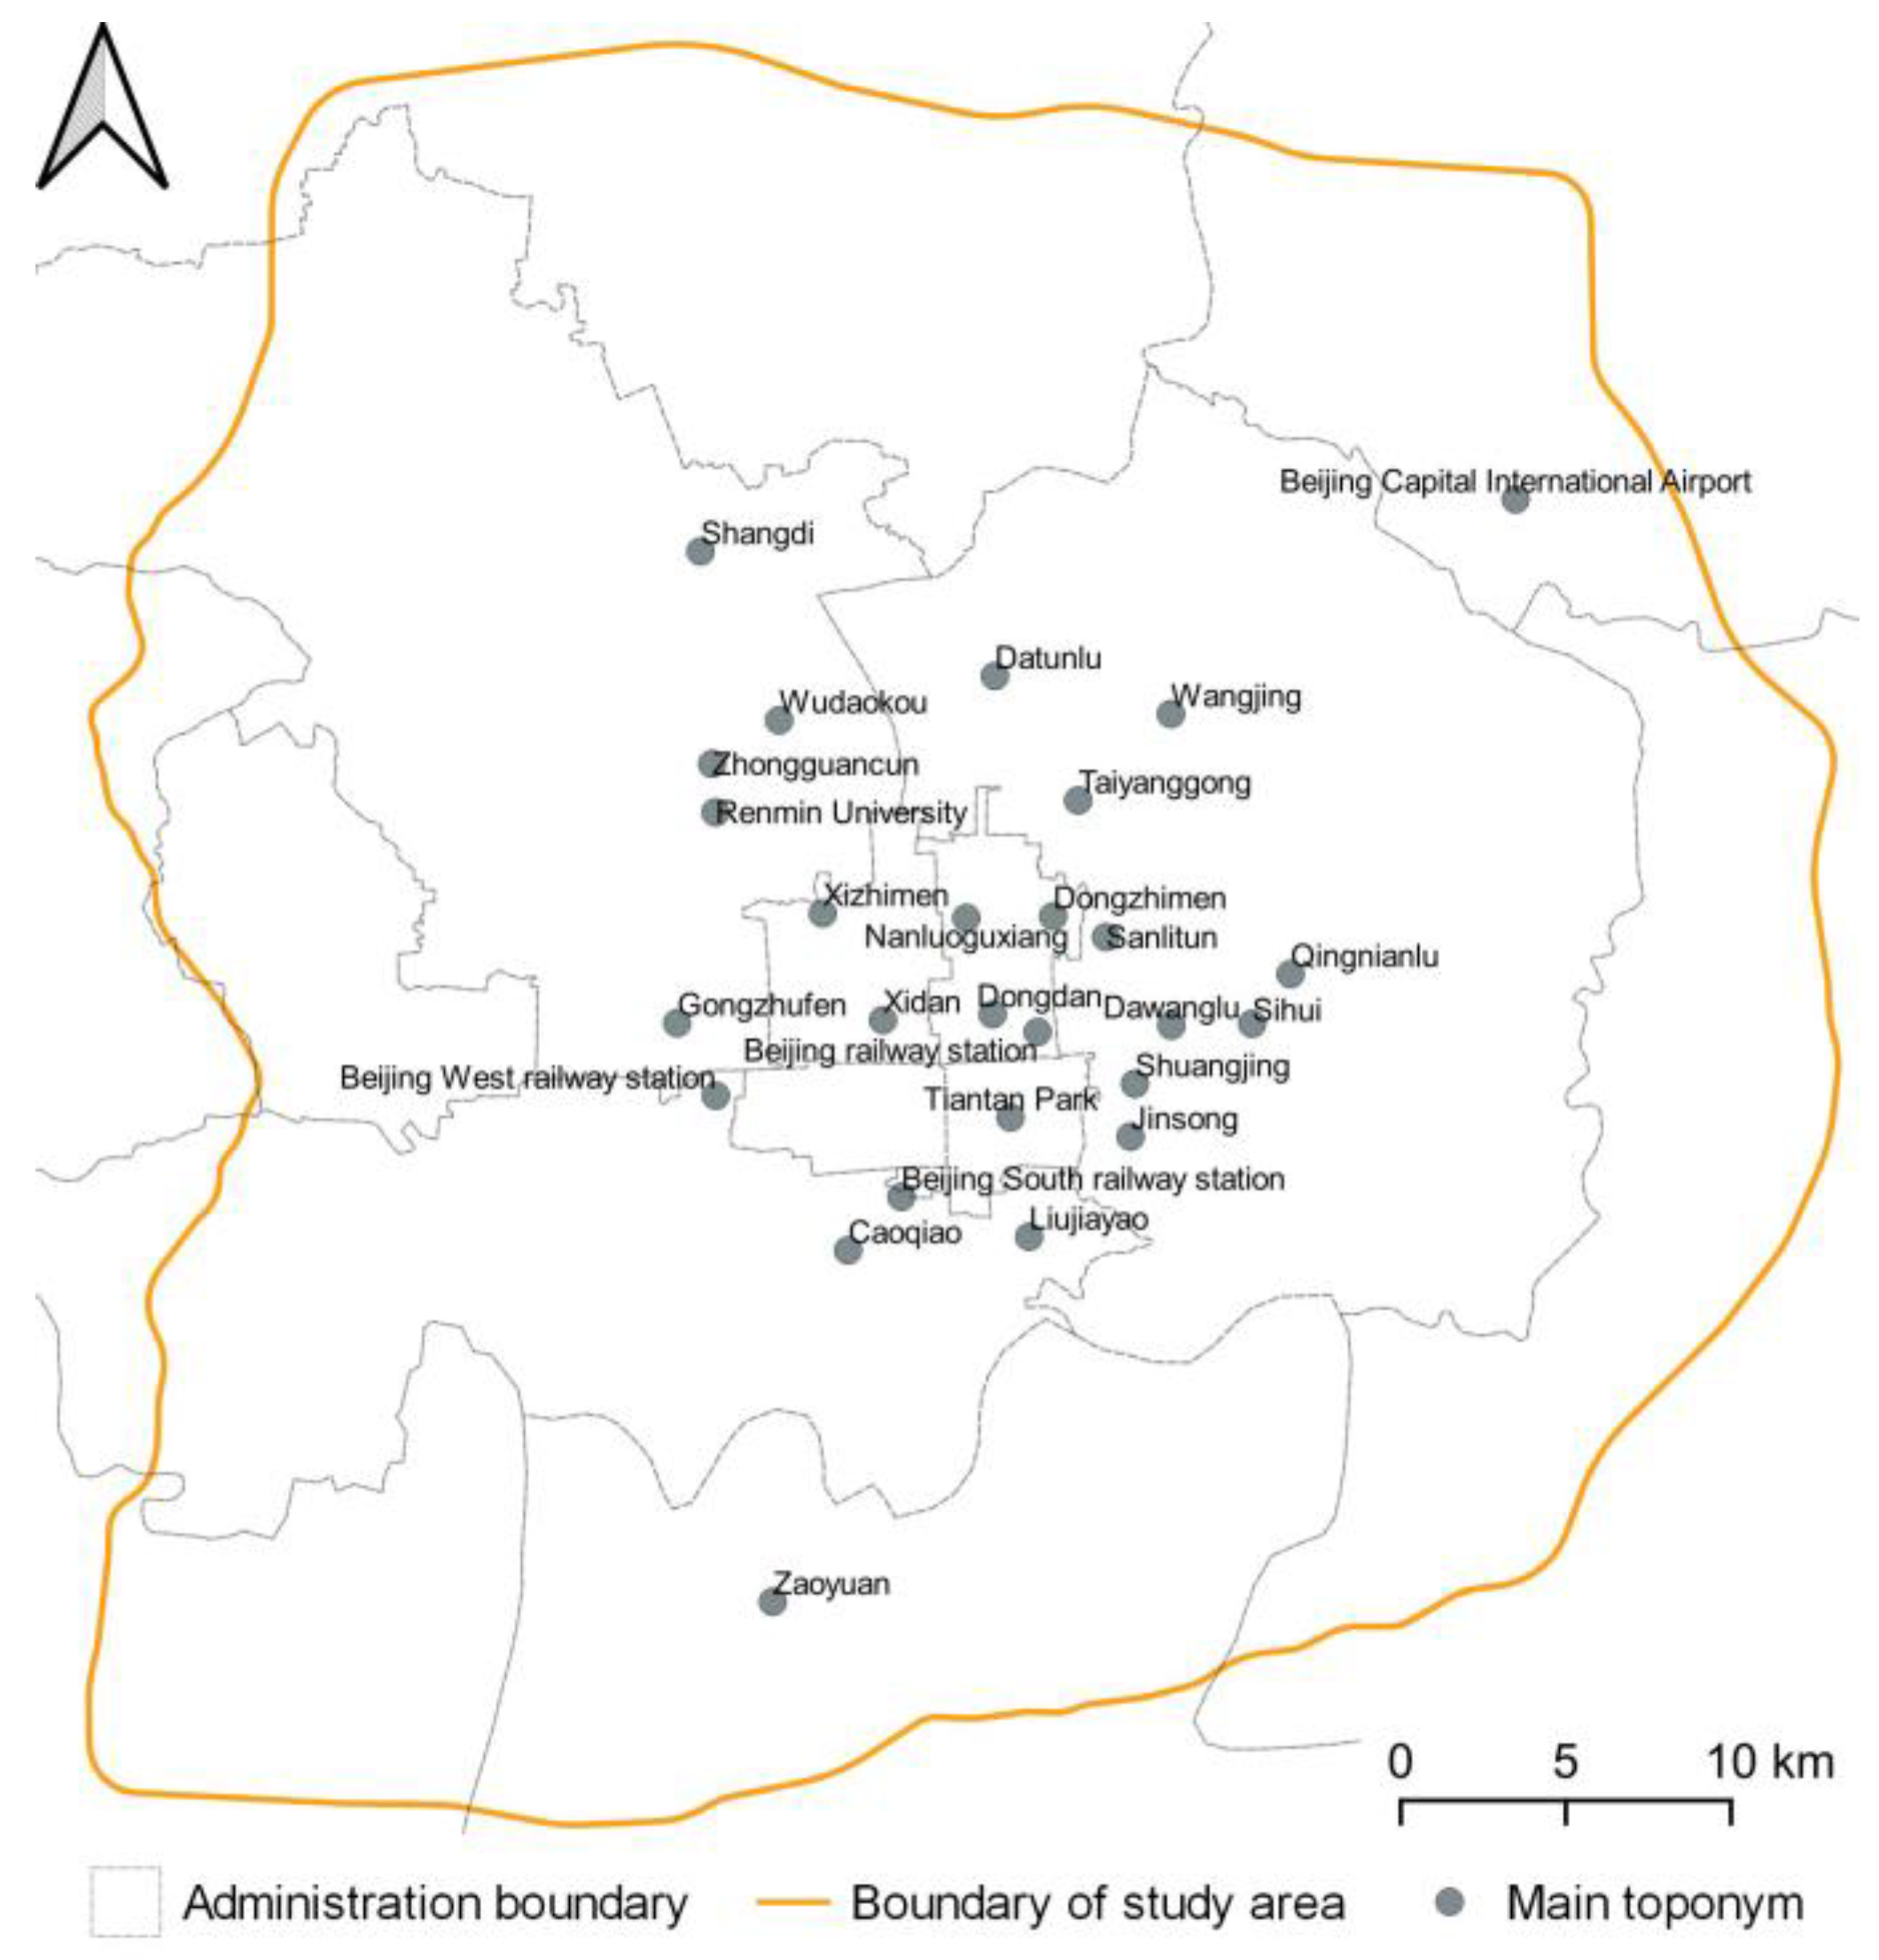
Although the subway and buses are the most popular types of public transportation, taxis played an important role in the urban transportation system in recent years [17]. Trajectory dataare attractive for analyzing intra-city interactions and human travelling patterns. In this study, we applied a taxi dataset including pick-ups and drop-offs collected from more than 15,000 taxis in a week (10 June to 16 June in 2016) in Beijing. All these data points are integrated into 24 h and grouped with 4-h intervals for the purpose of exploring the temporal characteristics of them. Meanwhile, taxi origin–destination (OD) flows that embody human travelling activities are abstracted as a pair of pick-up and drop-off points. After data preprocessing, each data point contains its taxi’s ID, location, recording time, and status (vacancy or occupancy). Furthermore, taxi OD flows are effective to express a real human trip. The extracted OD flows reflect the spatial interactions between urban areas, especially long-range interactions. Table 1 shows examples of processed taxi data. The study area is denoted in green in Figure 4a. All place names mentioned in Section 4 and Section 5 are corresponded to in Figure A1 of Appendix A.

4.2. Spatio-Temporal Patterns of Urban Travelling Hotspots

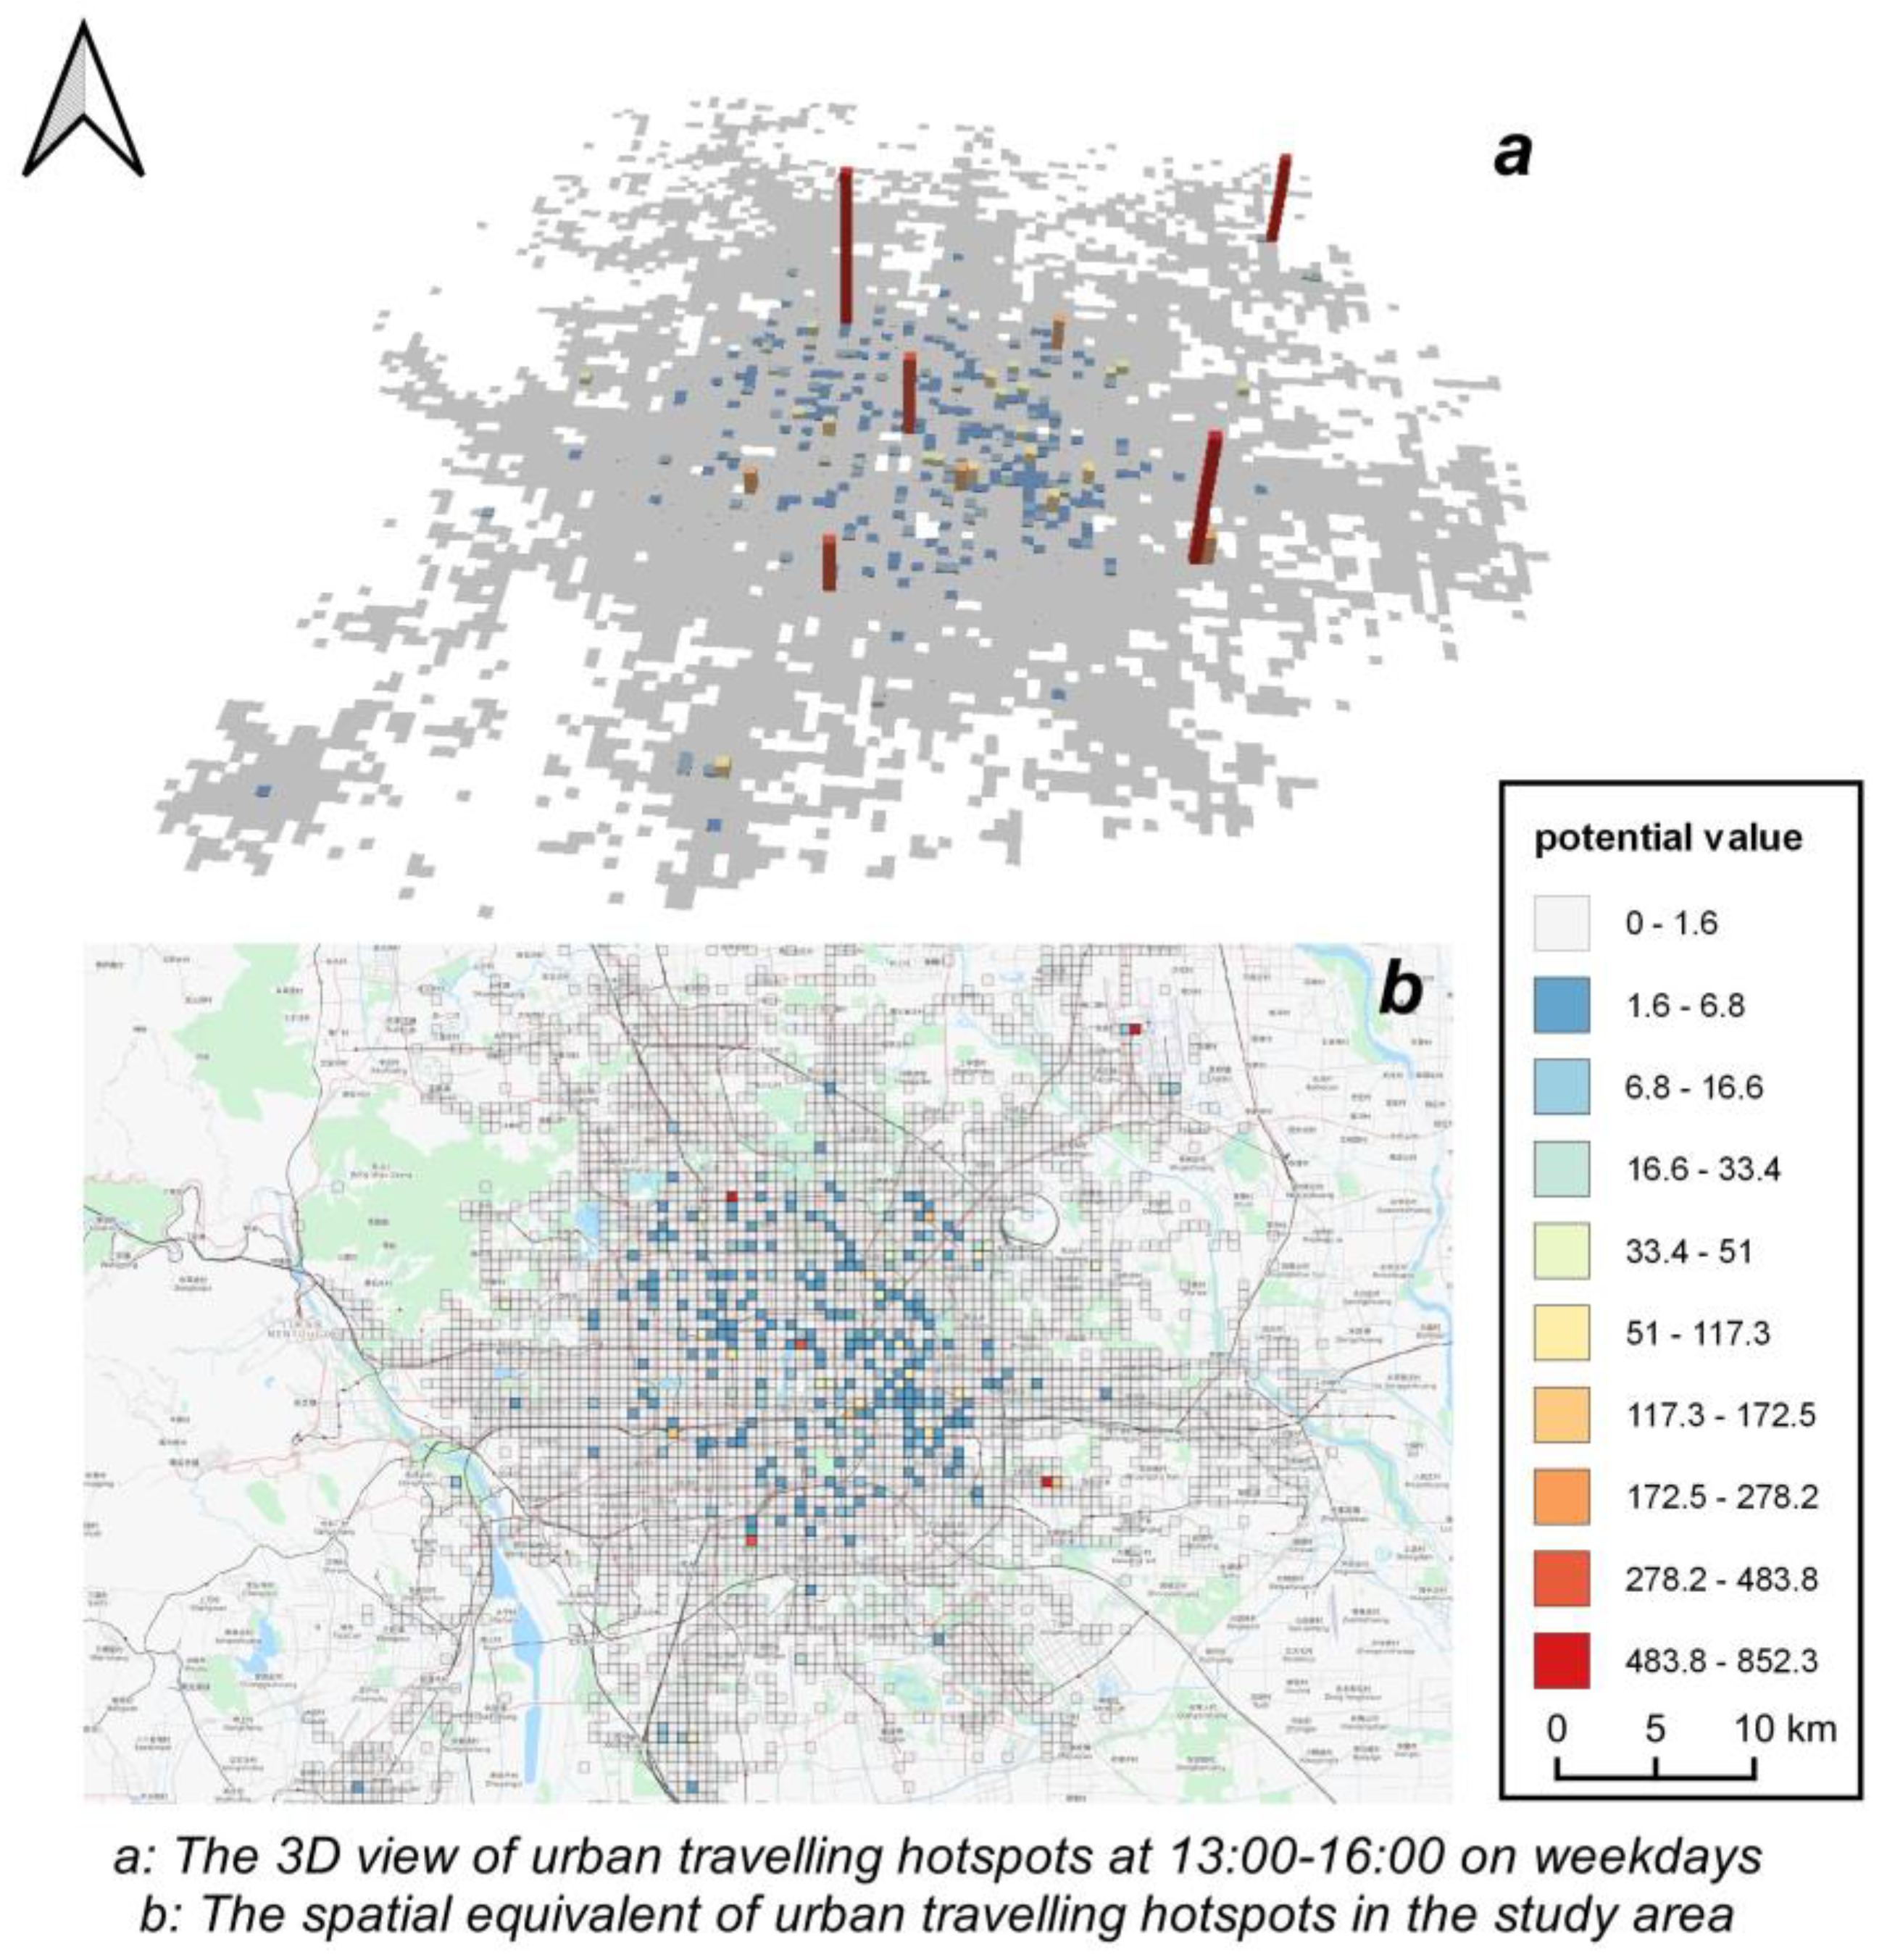
Previous studies showed that there is a considerable variation at different hours and different days regarding the number of taxi pick-ups and drop-offs [17,18]. Therefore, we selected, separately, two groups of OD flows that appeared on weekdays and weekends. In the beginning, we employed the interaction-based STDF to calculate the potential value of each grid in the study area. There is a 3D view showing the result of the potential value assignment in Figure 5, which was obtained from the taxi OD flows dataset (weekdays 13:00–16:00). The potential value is the measurement of the dimension of height. Furthermore, the red columns and grids with high potential value represent the popular travelling areas in the study area.

4.2.1. Dynamic Characteristics of Hotspots on Weekdays

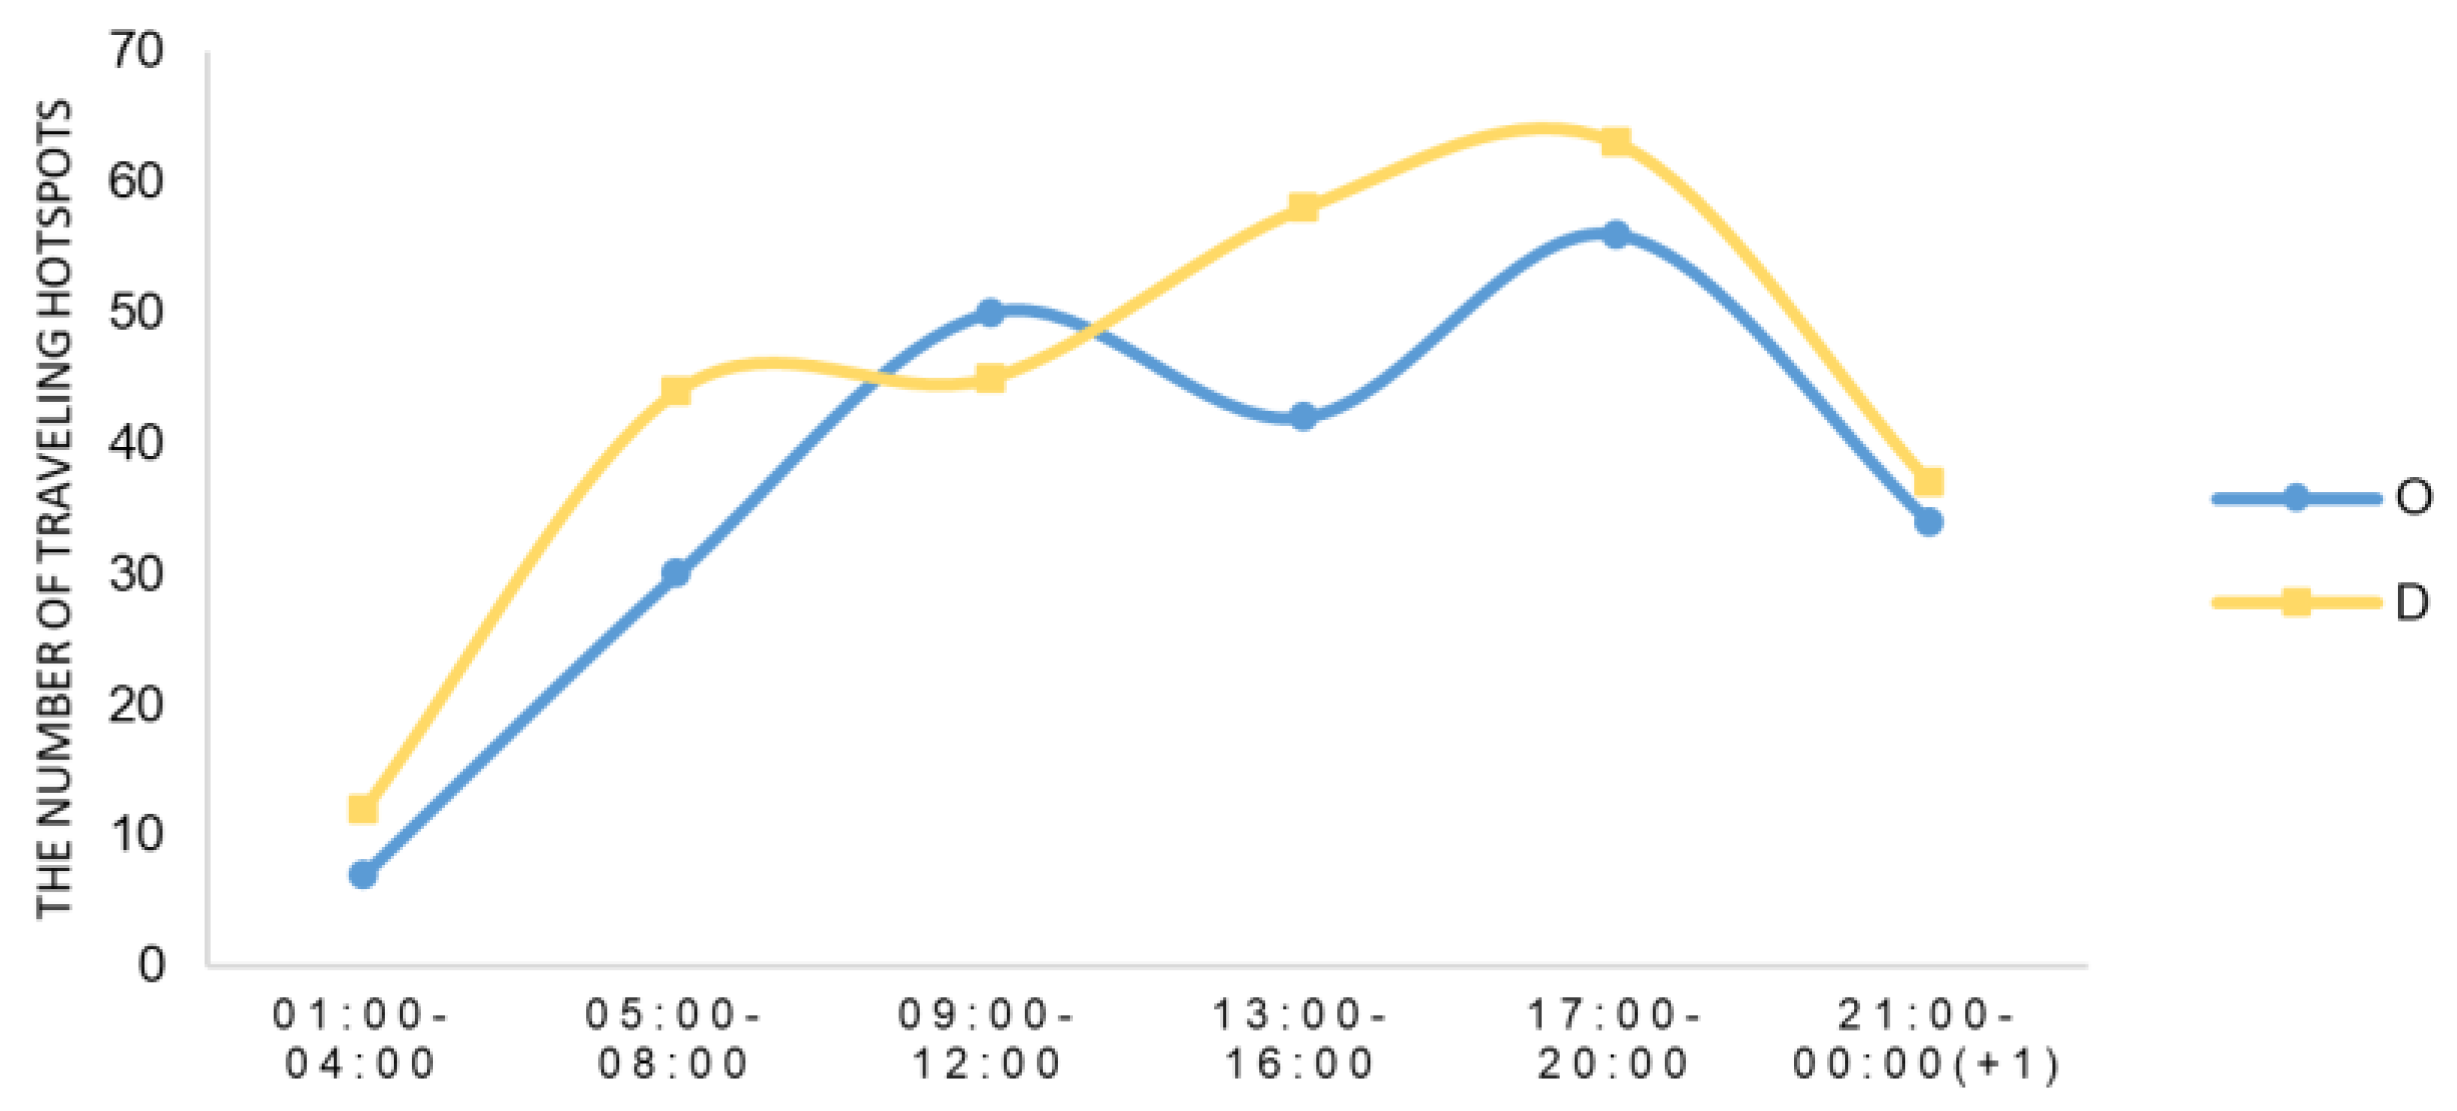
We divided all taxi trajectories into two groups including pick-ups (O) and drop-offs (D). Normally, the spatio-temporal patterns of them are not same as each other. As a result, the trend of the number of travelling hotspots in the study area was unwrapped at the beginning. Figure 6 illustrates the difference between the number of hotspots identified between the origins and destinations on weekdays. The blue line with the circle mark represents the number of pick-up hotspots, while the yellow line with the square mark constitutes the tendency of drop-off hotspots. Although both of them have a similar upward fluctuation, the quantity of destination hotspots is greater than the those of origins. The reason for this might be that passengers would find the nearest place to them where taxi drivers aggregate frequently when travel started, and they would be dropped off at the exact same destinations. At 01:00–04:00, the number of origin hotspots was the smallest. Influenced by human activities, it increased to 50 hotspots as a peak at 09:00–12:00. After a slight decrease, the number of pick-up hotspots rose to over 50 again at 17:00–20:00. Then, it dropped to around 35 in the evening (21:00–00:00 + 1). Similar to the pick-up hotspots, the number of destination hotspots had been through a small increase from 01:00–04:00 to 05:00–08:00. Then, the maximum amount appeared at 17:00–20:00 with a mild increase, which was over 60. In the end, it fell back to as same as the number of pick-up hotspots.
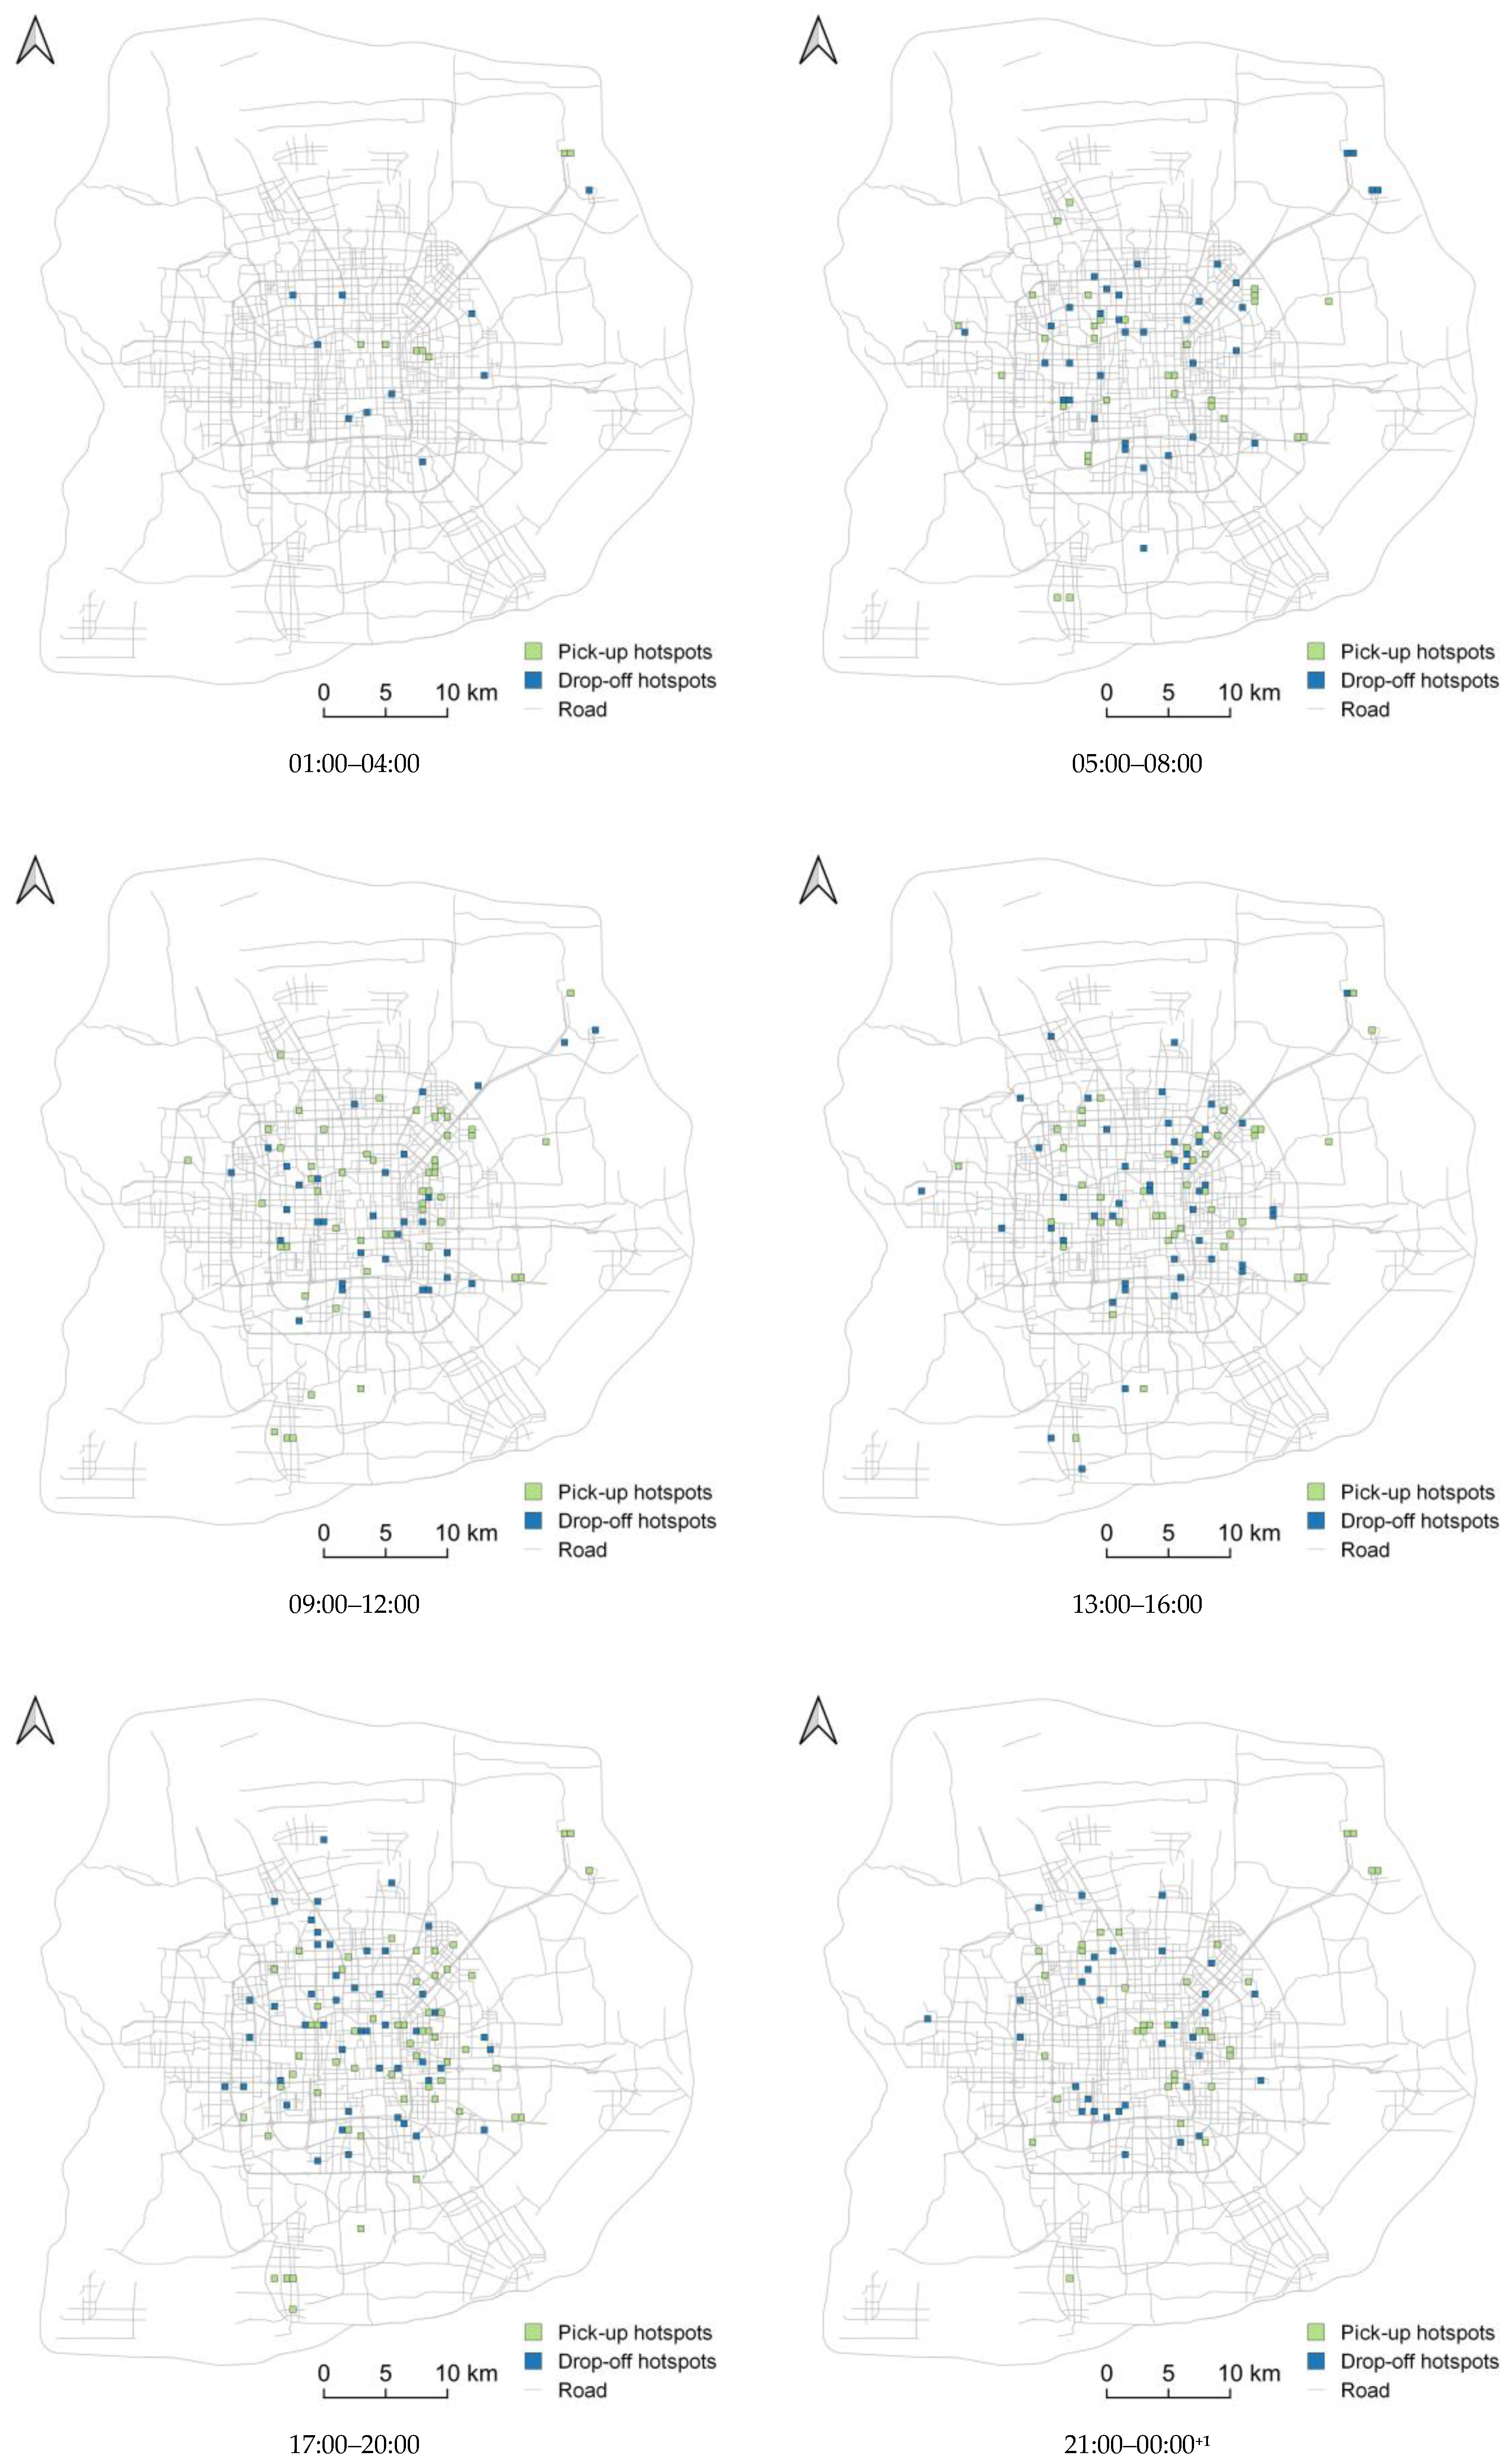
The spatio-temporal distributions of pick-up and drop-off hotspots at six distinct periods are depicted in Figure 7. The green grids and blue grids represent the hotspots of origins and destinations, respectively. These hotspots are discovered, almost on the whole, within the Fifth Ring Road, except those from 01:00–04:00. At the same time, there are several areas identified as pick-up and drop-off hotspots simultaneously at each period, such as Sanlitun, Wangjing, Beijing railway station, and Beijing Capital International Airport. This means that human activities are more active to fit the needs of work and business. Furthermore, the travel demands are varied on weekdays.
Specifically, there are three places, grouped in Beijing Capital International Airport, Sanlitun, and Nanluoguxiang, where we detected seven pick-up hotspot areas in the early morning. After this period, the urban travelling hotspots were scattered from the center of the city to the Fifth Ring Road for the rest of the periods. However, the time interval 05:00–08:00 is the only period when the hotspots were not detected at Beijing Capital International Airport. There might be two reasons for this phenomenon. One is there are fewer flights than other periods. The other is that other activities such as commuting are more popular and predominant at this time interval. In this period, the hotspots are identified around the two main railway stations (Beijing railway station and Beijing West railway station) and residential communities, such as Xizhimen, Shuangjing, Caoqiao, Shangdi, and Zaoyuan. Except for those places that appeared in the last period, there are more hotspots distributed around places with more entertainment activities, such as Tiantan Park, Qianmen, Xidan, and Nanluoguxiang, or the areas with full of students (Wudaokou, Renmin University, and Datunlu) at 09:00–12:00. During 09:00–16:00, university students, old people, and children could have a chance to travel in the city. As a result, areas including university campuses and local parks would also be identified as hotspots on weekdays. At 13:00–16:00, the quantity and spatial distribution of hotspots both narrowed slightly. The popular pick-up areas that people prefer to choose are around entertainment sites and transportation centers, such as Xidan, Nanluoguxiang, Xizhimen, Sanlitun, Taiyanggong, Wangjing, and Wudaokou as well as Beijing railway station, Beijing West railway station, and Beijing Capital International Airport. After this period, the hotspots were discovered with a larger range than at 13:00–16:00. People tend to depart from some business areas, transportation hubs, and nightlife centers because there are enormous commuting activities and business trips in this period. Nightlife activities began to be popular after work as well. The hotspot areas included Dongzhimen, Sanlitun, Dawanglu, Qingnianlu, Wangjing, Datunlu, Wudaokou, Zhongguancun, Xizhimen, Xidan, Shuangjing, Zaoyuan, Beijing railway station, Beijing West railway station, Beijing South railway station, and Beijing Capital International Airport. In the deep of night, the hotspots are clustered at nightlife centers, housing areas, and transportation centers, such as Sanlitun, Nanluoguxiang, Wudaokou, Wangjing, Dawanglu, Shuangjing, Liujiayao, Zaoyuan, Beijing railway station, and Beijing Capital International Airport.
As illustrated in Figure 7, the spatio-temporal characteristics of drop-off hotspots have differences with pick-up hotspots. First of all, compared with pick-up hotspots, there are some resident hotspots discovered, apart from those at nightlife centers and transportation hubs, at 01:00–04:00. The main reason that passengers went back home is the end of various nightlife activities and business trips. In the next period, there are some hotspots that contain hospitals, such as the Children’s hospital and Jishuitan hospital. The other hotspots are distributed from the northeast of the Fifth Ring Road to the south of the Third Ring Road, which are some areas containing aggregated business activities, such as Dongzhimen, Wangjing, and railway stations. Then, at 09:00–12:00, hotspots are added around some business areas, including Sanlitun, Xizhimen, Caoqiao, Tiantan Park, and Beijing Capital International Airport. After this period, hotspots are identified in some areas with more types of human activities throughout the whole study area, such as Taiyanggong, Wangjing, Sanlitun, Nanluoguxiang, Wudaokou, Xidan, Gongzhufen, Qingnianlu, Jinsong, railway stations, and the airport. In the evening, entertainment activities are more predominant in the form of drop-off hotspots. Therefore, hotspots appeared at Datunlu, Dongzhimen, Xizhimen, Zhongguancun, and Dongdan, and vanished at Wangjing, Gongzhufen, and Jinsong at 17:00–20:00. Similar to the pick-up hotspots, the drop-off hotspots are clustered at nightlife centers, residential communities, and transportation centers, such as Sanlitun, Nanluoguxiang, Wudaokou, Taiyanggong, Shangdi, railway stations, and the airport.
Generally, the appearing pick-up and drop-off hotspots reflected the types of human activities in the urban space. The spatio-temporal distributions of travel hotspots fit the routines of daily life on weekdays. There are distinct temporal differences between periods, such as the commuting and business periods and the nightlife period. Only a few nightlife places and the airport were identified in the early morning. Commuting activities dominated the travel hotspots at 05:00–08:00. However, human activities such as student activities during the daytime caused the hotspots to be scattered to some entertainment sites, universities, and urban parks. At 17:00–20:00, commutes and the closing times of attractions began to influence the hotspot areas. Nightlife activities also led to some travels from entertainment sites. After this period, the hotspots were often around nightlife centers. Apart from that, transportation centers were hotspot areas all day due to frequent business trips on weekdays.

4.2.2. Dynamic Characteristics of Hotspots on Weekends

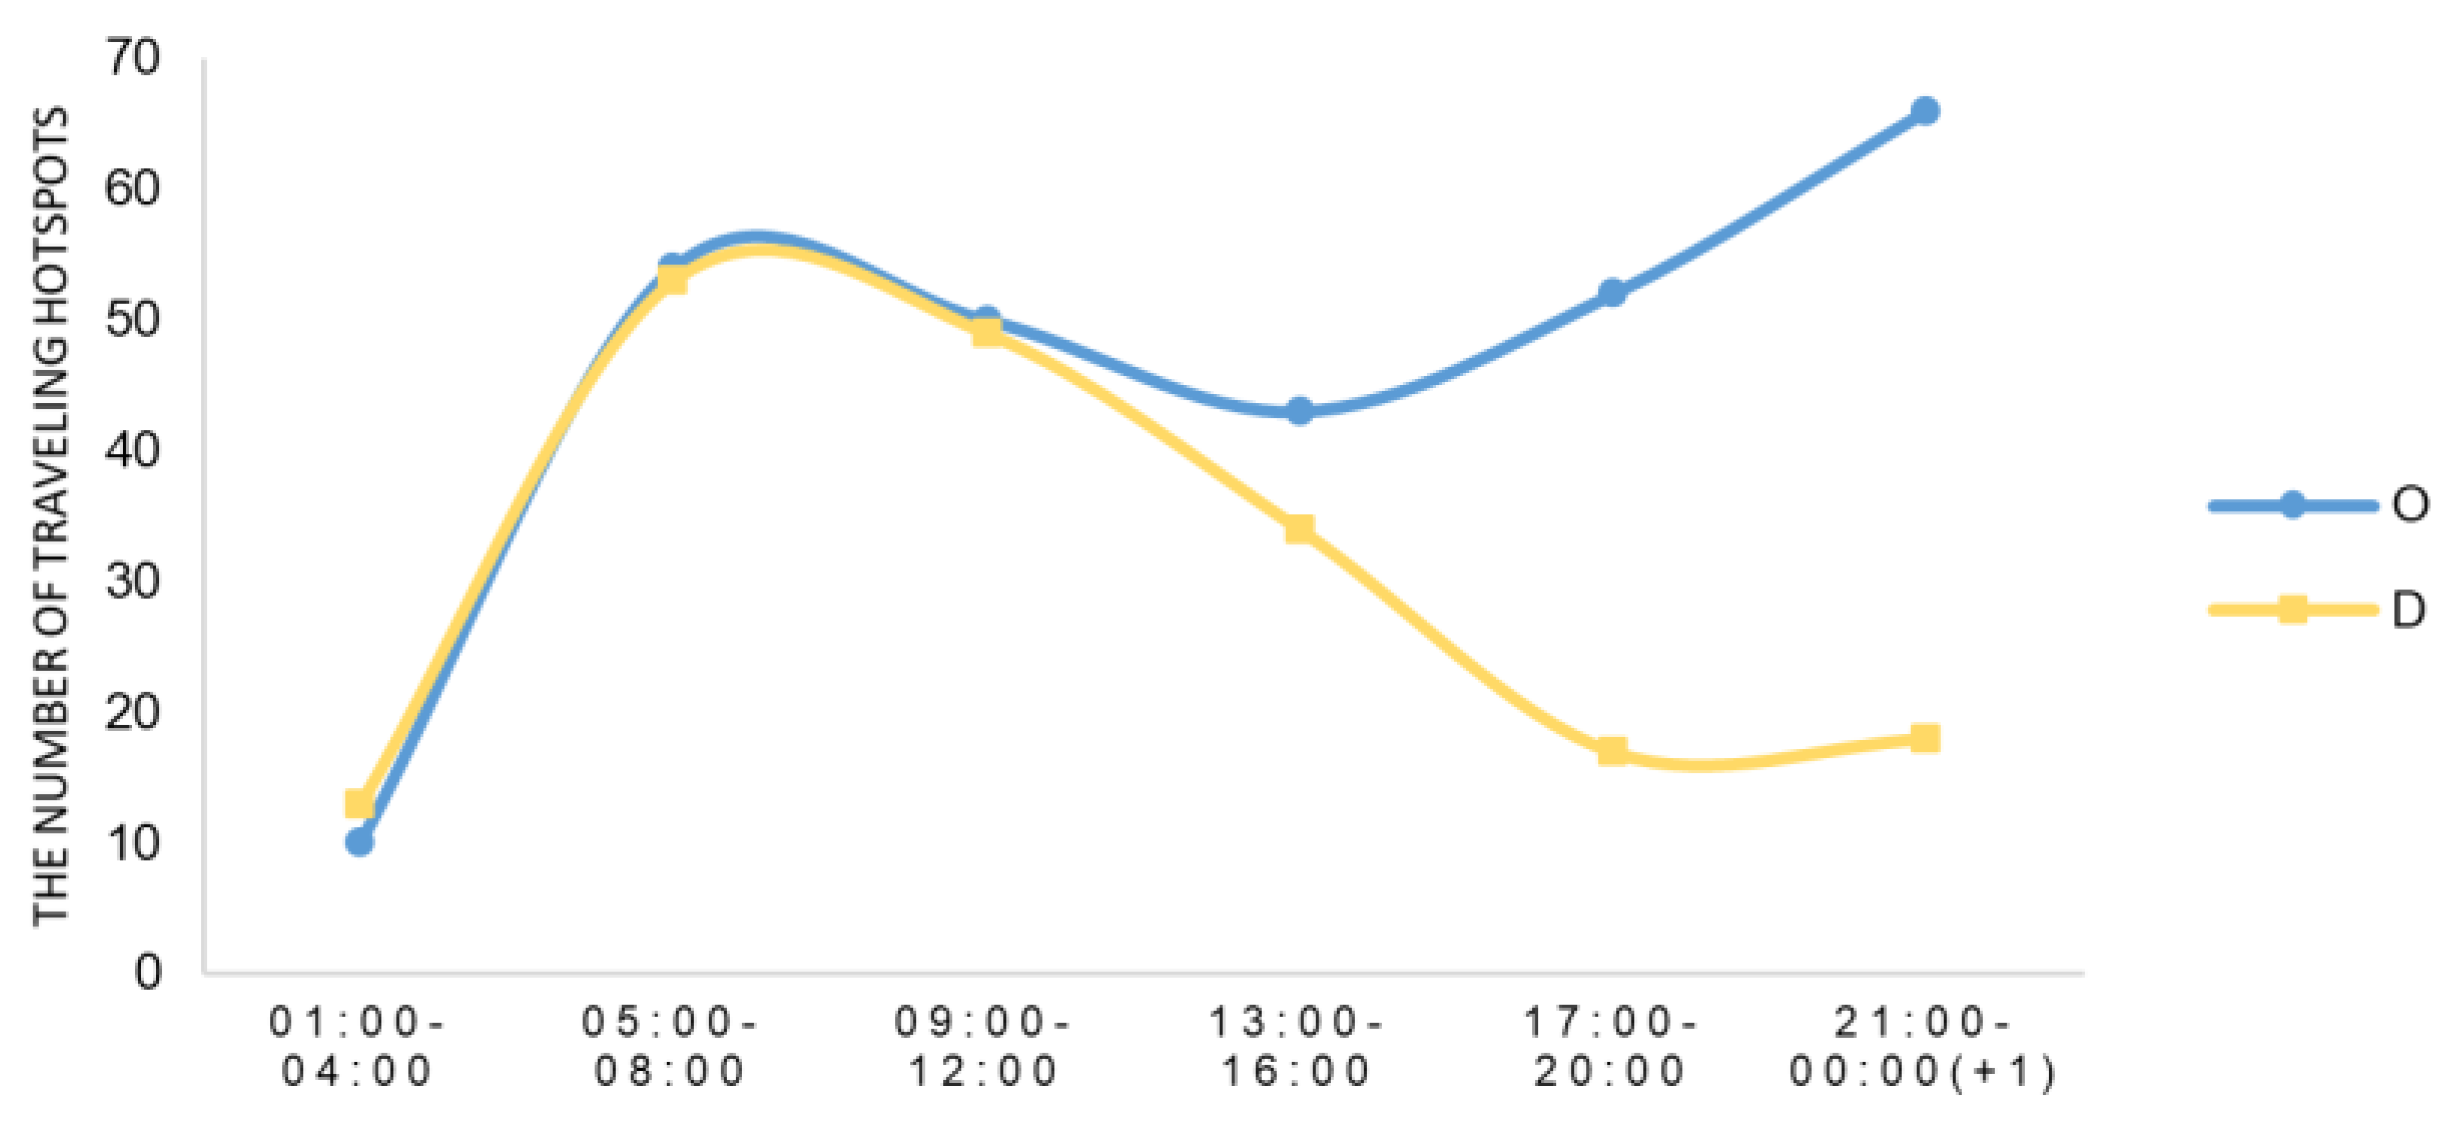
Figure 8 illustrates the difference between the number of hotspots identified between the origins and destinations on weekends. Different from the travelling hotspots on weekdays, the number of them has an opposite trend after 13:00. While the numbers of origin and destination hotspots are similar from 01:00–04:00 to 09:00–12:00, after that, the number of drop-off hotspots is more short-distributed. This might be explained by the fact that more and more people visit some places for recreation from the entire city around the afternoon at weekends. The pick-up hotspots reached more than 50 as a peak at 05:00–08:00. Then, there was a slight drop before 13:00–16:00 and the value fell to just over 40. Influenced by the active nightlife, the number of pick-up hotspots climbed constantly to 50 at 17:00–20:00 and even to 66 in the evening (21:00–00:00+1). As for the drop-off hotspots, there was a sharp fall from the peak of over 50 at 05:00–08:00 to under 20 at 17:00–20:00. The number was consistent into the next period, which was similar to the number from 01:00–04:00.
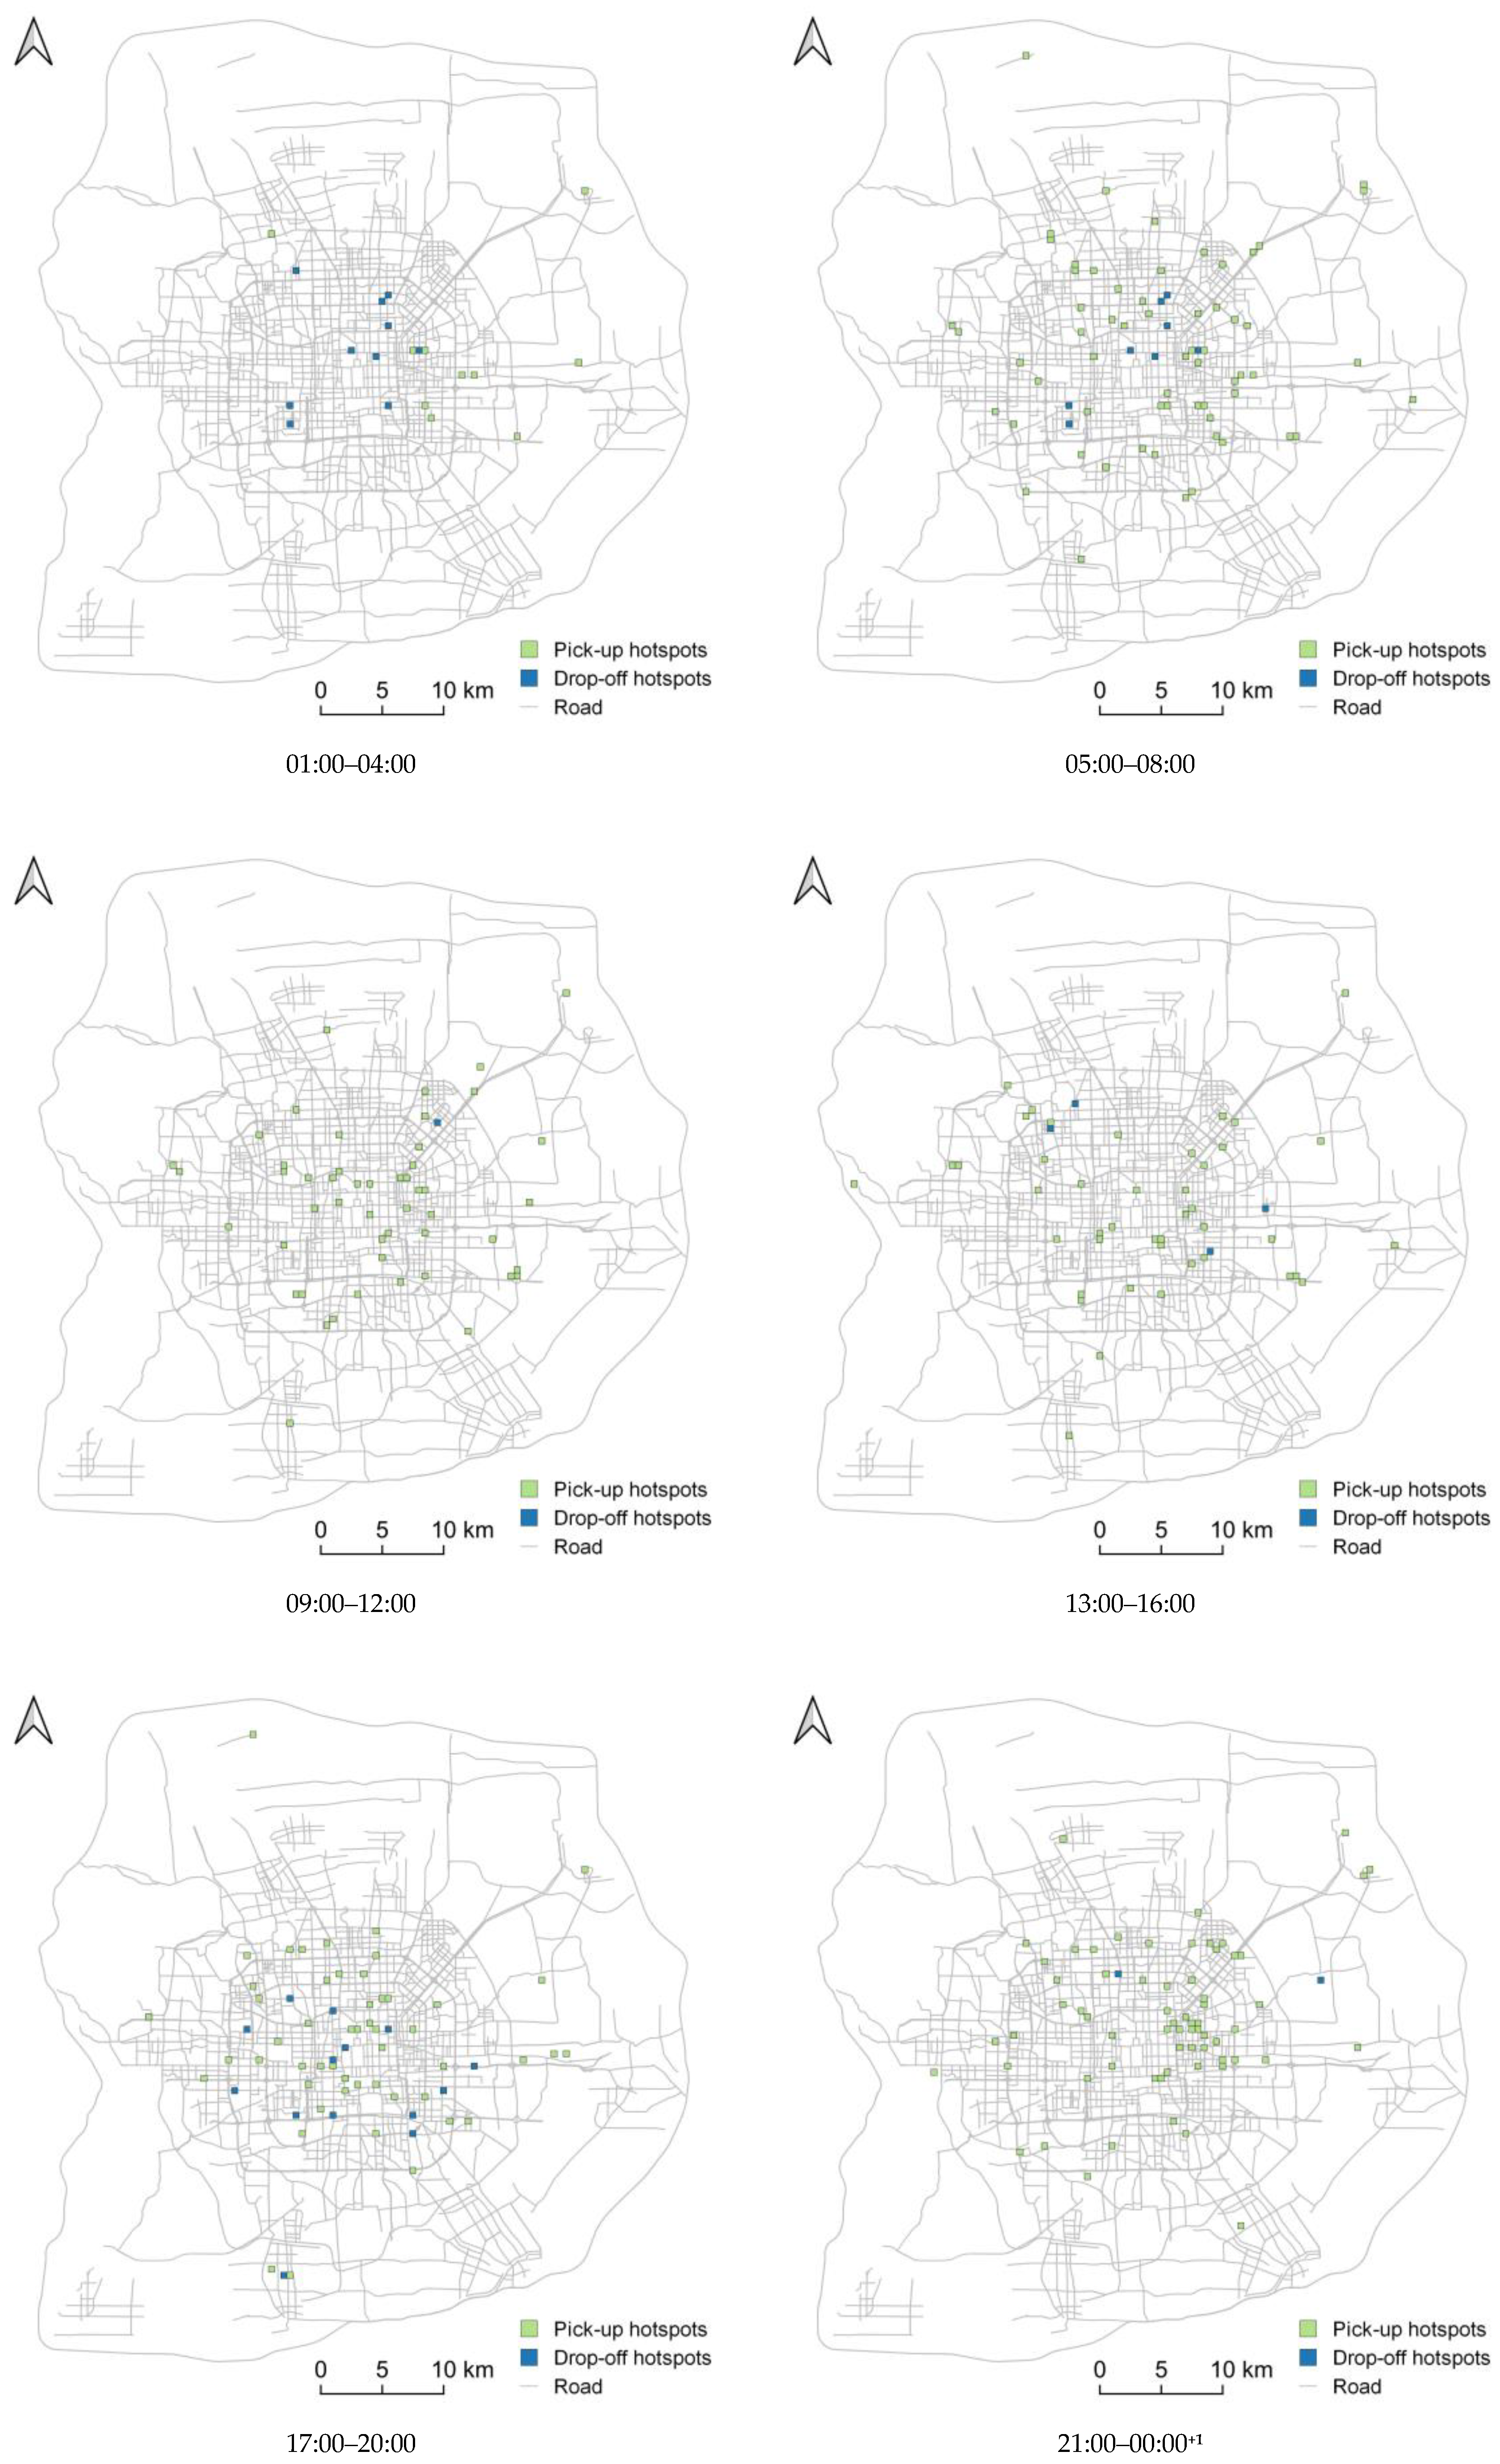
The spatio-temporal patterns of pick-up and drop-off hotspots at six different periods are illustrated in Figure 9. Different from the spatial distribution of hotspots on weekdays, most of the hotspots of origins and destinations appeared at the same grids on weekends. Especially at 09:00–12:00, there is only one place around Wangjing identified as only containing drop-off hotspots. This phenomenon reflects that human activities are relatively homogeneous at weekends.
The green grids show the spatial distribution of pick-up hotspots on weekends. Specifically, there are some popular places detected at Beijing Capital International Airport, Sanlitun, Qingnianlu, Shuangjing, and Wudaokou at 01:00–04:00; most of them are distributed in the east of the city. These places are popular nightlife centers, except the airport. After this period, the pick-up hotspots are scattered throughout the whole study area for the rest of the periods. At 05:00–08:00, the hotspot areas are identified at transportation hubs and residences in the city, which include Beijing Capital International Airport, Beijing railway station, Sihui, Wangjing, Dongdaqiao, Shuangjing-Jinsong, Liujiayao, Caoqiao, and Gongzhufen. After this period, the number of hotspots decreased gently. There are 50 hotspots that appeared regularly within the Fifth Ring Road at 09:00–12:00. Those places covered entertainment sites, such as Tiantan Park, Xisi, Xizhimen, Wudaokou, Wangjing, Dongzhimen, Dongdan, and Sanlitun. Furthermore, transportation centers are the main popular departure sites for people in this period. In the afternoon, the popular pick-up areas transferred people to other famous entertainment centers and transportation hubs in the city, such as Xidan, Nanluoguxiang, Sanlitun, Taiyanggong, Wangjing, Jinsong, Zhongguancun, Caoqiao, and Zaoyuan, as well as Beijing railway station, Beijing West railway station, and Beijing Capital International Airport. With the development of nightlife, more entertainment sites in the entire study area become popular. Besides those hotspots shown in the last period, Dawanglu, Datunlu, Wudaokou, and Xizhimen are also discovered as pick-up hotspots. In the deep of night, the hotspots are clustered at nightlife centers and transportation centers from the north Fifth Ring Road to the south Fourth Ring Road, where Sanlitun attracts a huge cluster of hotspots.
The blue grids in Figure 9 show the dynamic distribution of drop-off hotspots on weekends. Different from pick-up hotspots at 01:00–04:00, the drop-off hotspots in this period are distributed not only around nightlife centers but also around areas with various university students, such as Sanlitun, Nanluoguxiang, Wudaokou, and Taiyanggong. However, the hotspots of destinations have the same distribution as the hotspots of origins from 05:00 to 12:00. This is because human activities on weekends would not become popular in this period. At 13:00–16:00, there are fewer places discovered as hotspots throughout the entire study area, including Nanluoguxiang, Xidan, Jinsong, Liujiayao, Caoqiao, Qingnianlu, Wangjing, Wudaokou, Haidianhuangzhuang, Xingong, Zaoyuan, Beijing railway station, and Beijing Capital International Airport. In the evening, the spatial distribution of drop-off hotspots is nearly located entirely within the Fourth Ring Road. At 17:00–20:00, all hotspots detected are scattered at those places highly related to residents’ daily life, such as Xidan, Dongzhimen, Jinsong, Sihui, and Zaoyuan. While Beijing railway station and Beijing Capital International Airport are identified as hotspots in the deep of night, except from that, people prefer to arrive around Sanlitun, Dawanglu, Xizhimen, Taiyanggong, Wangjing, and Liujiayao.
In general, the hotspots detected on weekends are dispersed in the entire urban space, while the types of places that hotspots covered are almost all entertainment sites. The pick-up hotspots distributed around residences and entertainment centers since 13:00 and the drop-off hotspots are concentrated on the busiest entertainment sites in the urban spaces from the afternoon to the deep of night. This is because people tend to be relaxed on weekends. Before the afternoon, the daily routines of residents are stable. As a result, the pick-up hotspots are detected around residence communities in the morning. Besides, transportation hubs, such as railway stations and airports, also are identified as travelling hotspots at weekends. Business trips and tourists are the two important factors that contributed to frequent visits.

4.3. Evaluation of Accuracy

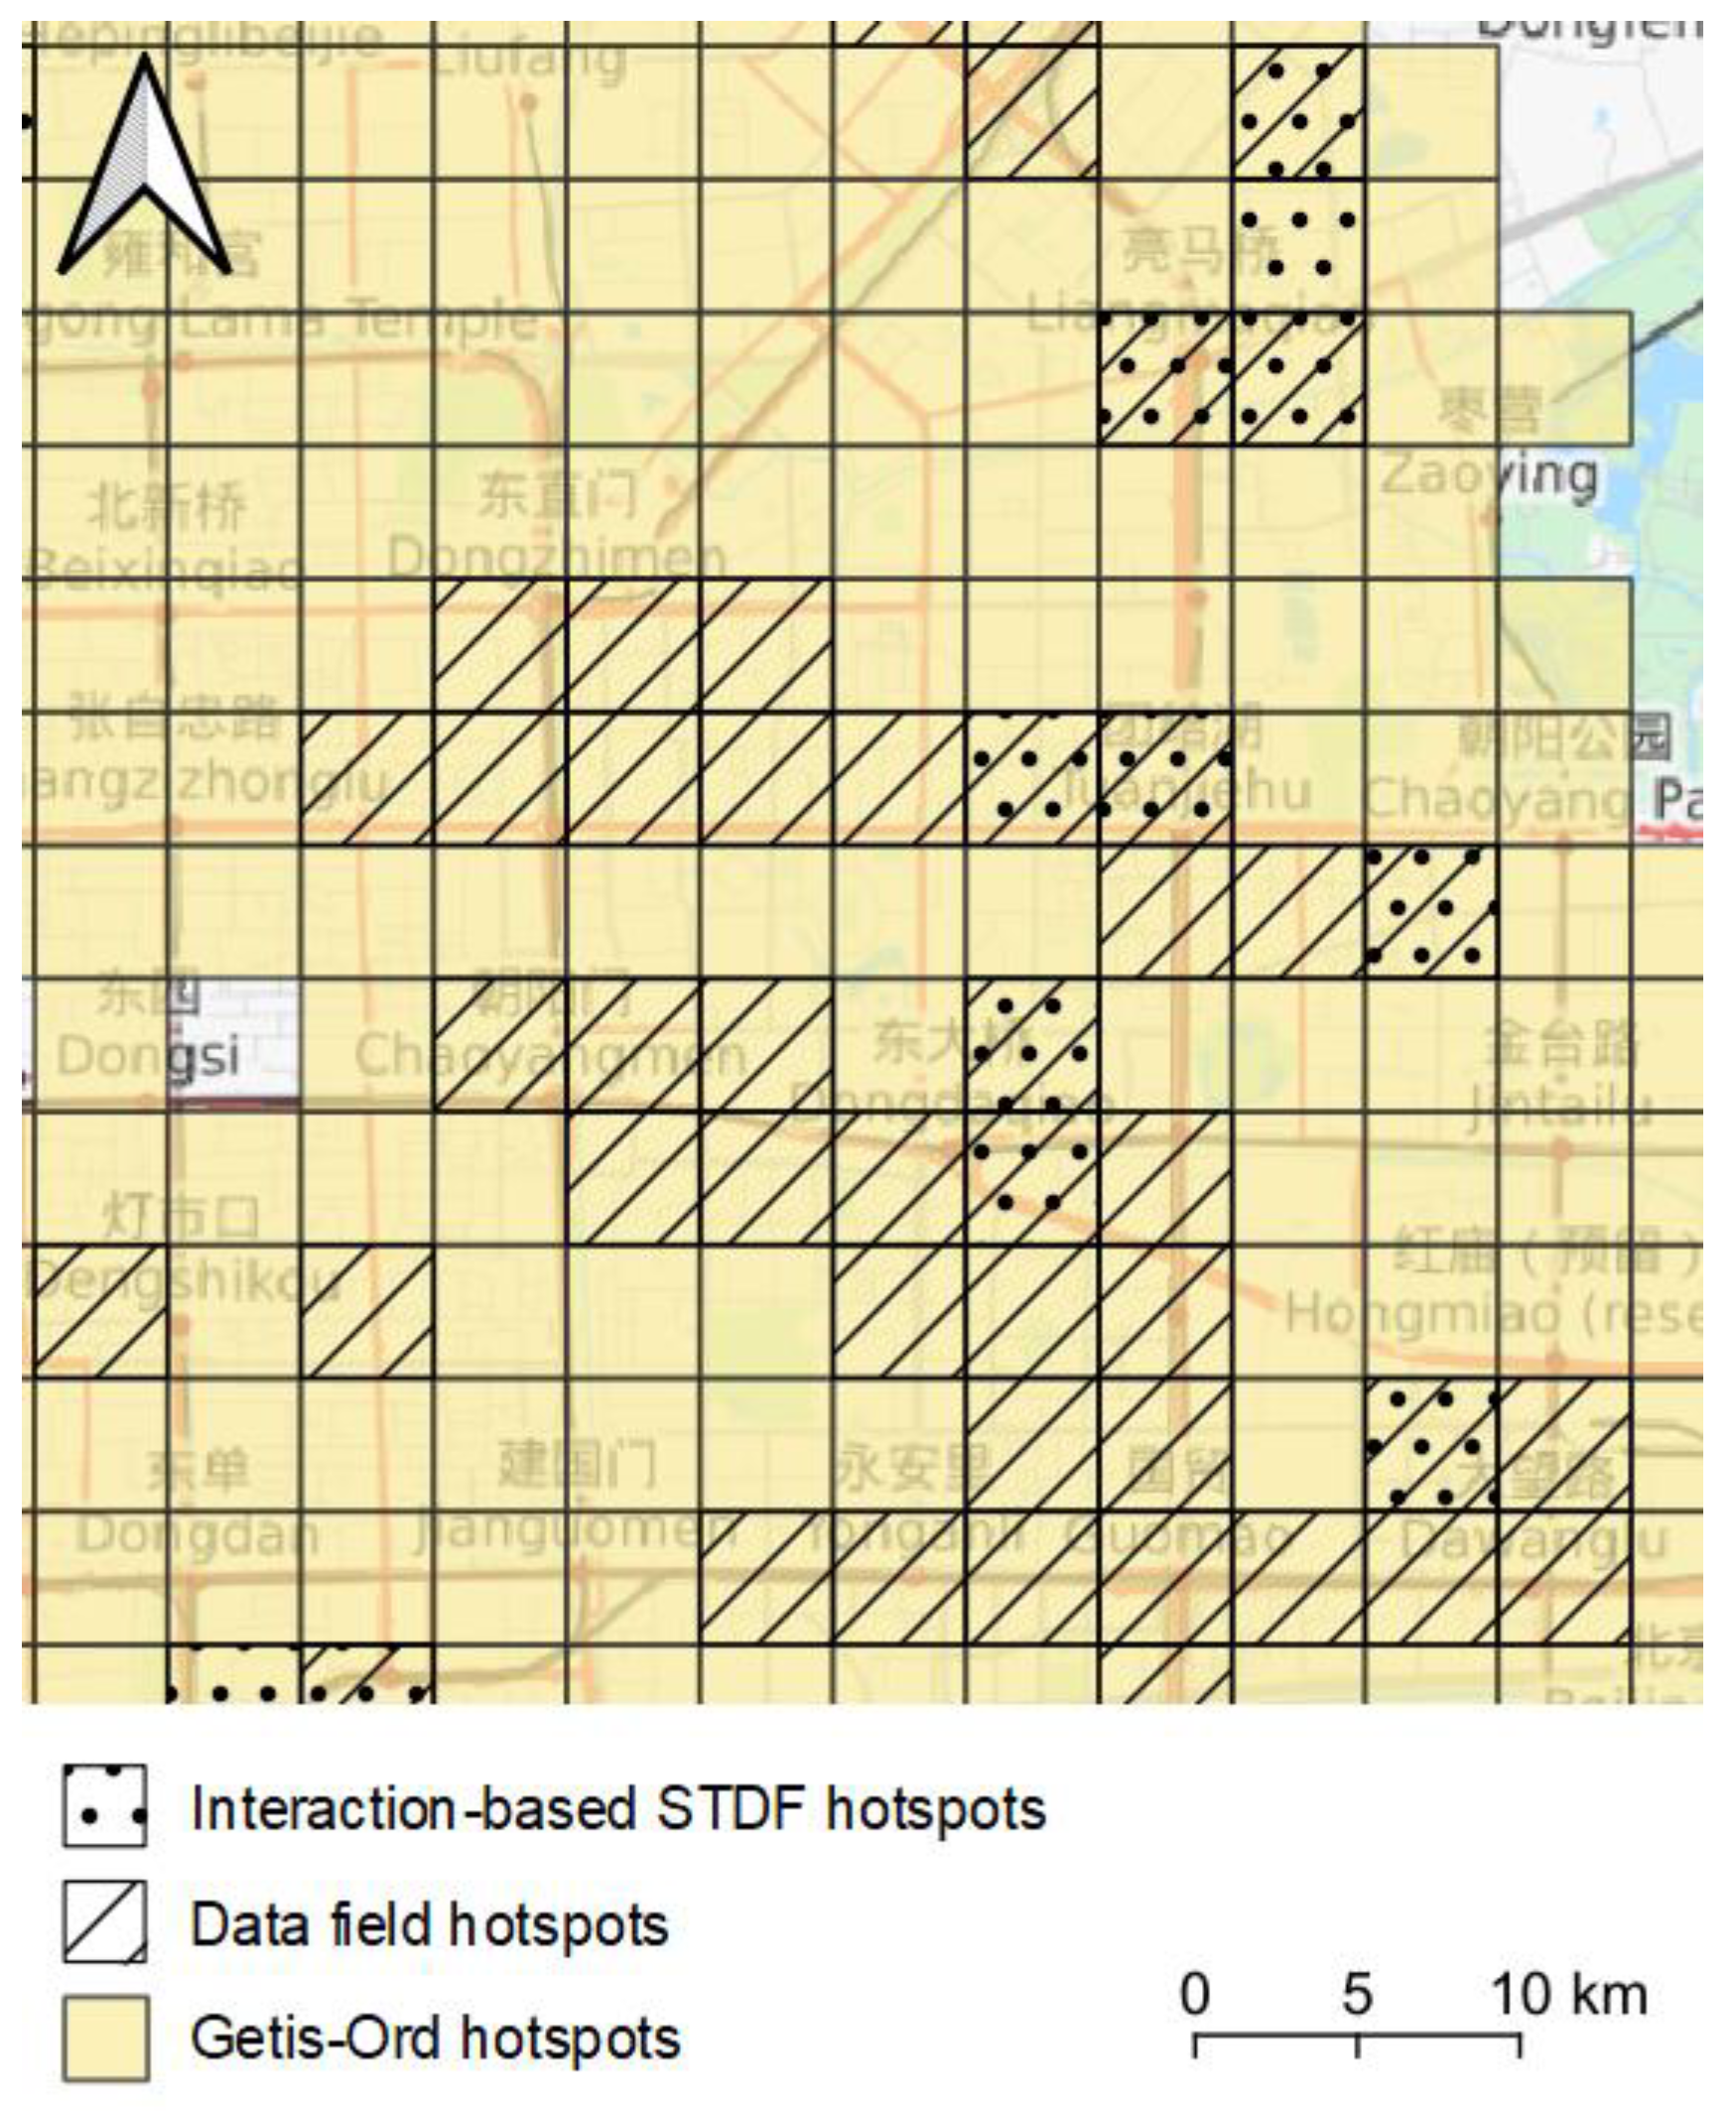
We further compared the overlapping results between the Getis-Ord Gi* hotspot analysis, the trajectory data field, and the proposed method to investigate the effectiveness of the proposed method in a particular area. As shown in Figure 10, the yellow grids, the grids with the hashed black line, and the grids with black dots represent the spatial distribution of the Getis-Ord Gi * hotspot analysis, the trajectory data field, and the proposed method at 09:00–12:00 on weekdays, respectively. Furthermore, the orange and the purple ones are the grids overlapped by those three colors. There are 140 complete grids in this particular area. The result of the Getis-Ord Gi * hotspot analysis covered the entire area. It cannot be a piece of evidence to reflect the popular travel areas in people’s daily lives. The spatial distributions of travel hotspots discovered by the other two methods are more identical in comparison. However, the hotspot areas with black lines which appeared in 42 grids crossed a large area from the west of the Second Ring Road to the east of the Third Ring Road. The two main hotspot areas depicted in Figure 10 covered 3.25 km2 and 5.5 km2, which are too big to fit the human cognition of hotspots. The hotspots extracted by the trajectory data field are not precise enough to be representative of the popular area. As for our method, 10 hotspots were detected from all of the grids, which make up a 7.1% share of this area. For instance, the black dot hotspots cover the exact area of a famous entertainment site in Sanlitun, while the black lines cover a large and inaccurate area to reflect this popular place, which surrounds the center of Sanlitun.
In general, the method with a greater PAI value has a good performance. Table 2 shows the quantitative comparison of different methods that identify urban travel hotspots on weekdays and weekends. It indicates that the pros and cons of the three identifying algorithms are reflected through the trajectory data. The results show that there are distinct differences between Getis-Ord Gi * hotspot analysis and the methods from the perspective of the data field. The PAI values of the trajectory data field and the proposed method are higher than that of the Getis-Ord Gi *. It means that methods from the perspective of a data field could find more pick-ups and drop-offs in a smaller area. Additionally, the proposed identification method performed better than the trajectory data field in most instances, especially those trajectories on weekends. In particular, the mean PAIs of the proposed method of origins on weekdays and weekends are nearly three times higher than the mean values of the Getis-Ord Gi * analysis, and almost twice as great as the trajectory data field. The mean values of destinations on weekdays and weekends have a similar trend, although the proposed method discovered a few more drop-offs while covering a similar area. Moreover, the Wilcoxon signed rank (WSR) test results shown in Figure 11 provide an additional insight that cannot be gained from the specific and mean PAI results. In the case of origins on weekdays, the proposed method has a better performance than other methods with a lower significance ( p 0.05 ) . There is a same significant result for the proposed method when it identified drop-off hotspots. At weekends, the proposed method outperformed the other two methods ( p 0.1 ) for discovering either origins or destinations.

5. Discussion

In this section, we further analyze the spatio-temporal patterns of spatial interaction between urban travelling hotspots using spatial interaction networks. At the same time, the structures of cities are closely related to intra-city human travelling patterns [45,46,47,48]. The spatial structures of hotspots will also be discovered in this process. The hotspots detected from 09:00–12:00 are chosen to be an example of discovering the characteristics of urban spatial structures. In the beginning, the directed and weighted spatial-interaction network of hotspots (SINH) has been built. Then, degree centrality has been employed to depict the characteristics of spatial interactions between hotspots and urban structures.
Because of the direction of each node, the in-degree centrality only belongs to the pick-up hotspots, and the out-degree centrality is suitable for the drop-off hotspots. As illustrated in Figure 12, the hotspots discovered on weekends are more popular for both pick-up and drop-off passengers than on weekdays. It indicates that the departure areas and arriving areas meet the regular demands for residents in the city at 09:00–12:00 on weekdays. However, the pick-up and drop-off hotspots are various and contain different types of urban travel on weekdays. There is further evidence to prove this phenomenon from the spatial distribution of urban travelling hotspots. The grids 4358, 4359, 4003, 4962, 5087, and 5841 contribute significantly to urban travelling on weekdays, which cover Sanlitun, Caoqiao, Wufangqiao, Beijing railway station, and Beijing West railway station. These areas play a significant role as bridges in connecting other grids, which are seen as the travelling centers in the study area. The grids 3794, 4441, 4856, 5824, and 6037, with higher out-degree centrality than others, are the most important departure hotspots, which include Xidan, Xizhimen, Jianguomen, Tiantan Park, Sanyuan Bridge, and Beijing South railway station on weekdays. Meanwhile, Jinsong, Shilihe, Dahongmen, and Beijing Capital International Airport have a great in-degree centrality to attract travel because they are located in grids 4775, 4130, 3692, 8651, and 5303. The nodes with a great in-degree centrality and a great out-degree centrality appeared in different areas, which means the distributions of urban travels with strong regularity are stable on weekdays.
Compared with weekdays, the most popular grids in the urban space involve both destinations and places of departure. The travelling hotspots identified on weekends which dominate urban travels are aggregated at Sanlitun, Taiyanggong, Wufangqiao, Beijing railway station, and Beijing Capital International Airport (grids 4358, 4359, 6717, 5841, 5518, 9289, and 5405). The spatial distributions and the urban functions of these areas demonstrate that human activities fit various residents’ needs more than on weekdays. Indeed, entertainment sites would be the most popular demand for residents’ travel on weekends.
Although the spatial distribution of hotspots would be dispersed geographically either on weekdays or on weekends, connections between the two of them exist directly with a short path. This means that the spatial-interaction network of hotspots is similar to a small-world network on weekdays and weekends.

6. Conclusions

Identifying urban travelling hotspots has become a popular trend for researchers in recent years. It also plays a vital role in discovering the characteristics of human mobility. At the same time, taxis, an important means of public transportation, reflect urban individual travels. Trajectory data with pick-up points and drop-off points could be seen as an abstract of spatial interactions that connect two different places in the city directly. They also provide a new opportunity for reflecting urban spatial structures, which are helpful to solve urban problems and promote urban sustainable development. Therefore, this study combined the data field theory with spatial interactions and proposed an identification tool named the interaction-based spatio-temporal data field to discover urban travelling hotspots. The proposed method could give us new insights into what is happening to human travels in the urban area. There is a case study to detect urban travelling hotspots using the proposed method within the Sixth Ring Road in Beijing. First of all, trajectory data were aggregated to pick-ups and drop-offs at six periods on weekdays and weekends. Each 4-h period was integrated as a time interval. Then, urban travelling hotspots were identified with the proposed method at each period. Next, we analyzed the spatio-temporal patterns of those hotspots during a day. Finally, qualitative and quantitative evaluations were employed to test the accuracy of the proposed method.
The following conclusions were obtained in this study:
(1) Urban travelling hotspots are most scattered within Fifth Ring Road at different periods. However, the quantities and geographic distributions of them are quite distinct. In quantity, the number of hotspots was no more than 60 at any period on weekdays. There was a similar trend with two peaks for origins and destinations on weekdays. Compared with the numbers on weekdays, the first peak with around 50 hotspots appeared at 05:00–08:00 for pick-ups and drop-offs at weekends. After 13:00–16:00, the number of pick-up hotspots had an upward trend, reaching over 60, while the number of drop-off hotspots dropped to under 20. The spatial distribution of hotspots fit the needs of regular residents in the city. For instance, job–home areas would be popular during the commute period (including 05:00–08:00 and 17:00–20:00) on weekdays due to a large number of commuting activities. The hotspots were almost all distributed around entertainment sites at weekends. At the same time, transportation hubs and nightlife centers become hotspots at a particular time either on weekdays or weekends.
(2) The results from the case study were compared with hotspots identified by Getis-Ord Gi* and identification with data field through overlapping comparison and PAI. In total, the accuracy of the proposed method performed better than the other two methods. Specifically, 99.3%, 30%, and 7.1% of areas were identified as hotspots in the sample area by Getis-Ord Gi*, data field, and interaction-based STDF, respectively. The PAI and mean PAI results show that the hotspots identified by the proposed method could discover more points in smaller areas. These results also pass the WSR test with a lower significance ( p 0.1 ) .
(3) We further discuss the centrality of travelling hotspots in urban structures. Workplaces and transportation centers became popular areas on weekdays, while entertainment sites dominated urban travels at weekends. Furthermore, the connections between hotspots reflected the characteristics of the small-world network on weekdays and weekends.
This research offers a new perspective for analyzing human travelling and urban structures based on the data field theory, yet there are limitations here. In the beginning, this proposed method is suitable for fixed study units. However, the hotspot area should be irregular with human cognition and experience in the urban environment rather than existing areas. In addition, the difference in time between two data points appearing is an important factor in the interaction-based STDF. Considering the threshold of urban travel time, an appropriate time interval could help us to better explore the characteristics of urban travel.

Author Contributions

Conceptualization, D.Y. and J.Z.; methodology, D.Y.; validation, D.Y.; formal analysis, D.Y.; resources, J.Z.; writing—original draft preparation, D.Y.; writing—review and editing, D.Y., J.Q. and Y.L.; visualization, D.Y.; supervision, J.Z. All authors have read and agreed to the published version of the manuscript.

Funding

This research was funded by the National Nature Science Foundation of China, grant number No. 42071376.

Acknowledgments

We would like to acknowledge the editors for the editing assistance and the reviewers for their constructive comments on our paper. We are also grateful for the valuable comments of Jun Xu.

Conflicts of Interest

The authors declare no conflict of interest.

Appendix A

Figure A1. The main toponym in human cognition in the study area.
Sustainability 12 09662 g0a1

References

  1. Li, S.; Ma, Y. Urbanization, economic development and environmental change. Sustainability 2014, 6, 5143–5161. [Google Scholar] [CrossRef] [Green Version]
  2. Yang, X.; Zhao, Z.; Lu, S. Exploring spatio-temporal patterns of urban human mobility hotspots. Sustainability 2016, 8, 674. [Google Scholar] [CrossRef] [Green Version]
  3. Qin, K.; Xu, Y.; Kang, C.; Sobolevsky, S.; Kwan, M.-P. Modeling spatio-temporal evolution of urban crowd flows. ISPRS Int. Geo-Inf. 2019, 8, 570. [Google Scholar] [CrossRef] [Green Version]
  4. Crampton, J.W.; Graham, M.; Poorthuis, A.; Shelton, T.; Stephens, M.; Wilson, M.W.; Zook, M. Beyond the geotag: Situating “Big Data” and leveraging the potential of the geoweb. Cartogr. Geogr. Inf. Sci. 2013, 40, 130–139. [Google Scholar] [CrossRef]
  5. Liu, Y.; Liu, X.; Gao, S.; Gong, L.; Kang, C.; Zhi, Y.; Shi, L. Social sensing: A new approach to understanding our socioeconomic environments. Ann. Assoc. Am. Geogr. 2015, 105, 512–530. [Google Scholar] [CrossRef]
  6. Schneider, C.M.; Belik, V.; Couronné, T.; Smoreda, Z.; González, M.C. Unravelling daily human mobility motifs. J. R. Soc. Interface 2013, 10, 20130246. [Google Scholar] [CrossRef] [Green Version]
  7. Pappalardo, L.; Simini, F.; Rinzivillo, S.; Pedreschi, D.; Giannotti, F.; Barabási, A.-L. Returners and explorers dichotomy in human mobility. Nat. Commun. 2015, 6, 8166. [Google Scholar] [CrossRef] [Green Version]
  8. Yan, X.Y.; Wang, W.X.; Gao, Z.Y.; Lai, Y.-C. Universal model of individual and population mobility on diverse spatial scales. Nat. Commun. 2017, 8, 1639. [Google Scholar] [CrossRef] [Green Version]
  9. Pappalardo, L.; Simini, F. Data-driven generation of spatio-temporal routines in human mobility. Data Min. Knowl. Discov. 2018, 32, 787–829. [Google Scholar] [CrossRef] [Green Version]
  10. Yang, C.; Yan, F.; Ukkusuri, S.V. Unraveling traveler mobility patterns and predicting user behavior in the Shenzhen metro system. Transportmetrica 2018, 14, 576–597. [Google Scholar] [CrossRef]
  11. Chen, P.; Shi, W.; Zhou, X.; Liu, Z.; Fu, X. STLP-GSM: A method to predict future locations of individuals based on geotagged social media data. Int. J. Geogr. Inf. Sci. 2019, 33, 2337–2362. [Google Scholar] [CrossRef]
  12. Yao, X.; Zhu, D.; Gao, Y.; Wu, L.; Zhang, P.; Liu, Y. A stepwise spatio-temporal flow clustering method for discovering mobility trends. IEEE Access 2018, 6, 44666–44675. [Google Scholar] [CrossRef]
  13. Tao, R.; Thill, J.-C. Flow cross K-function: A bivariate flow analytical method. Int. J. Geogr. Inf. Sci. 2019, 33, 2055–2071. [Google Scholar] [CrossRef]
  14. Zhu, D.; Huang, Z.; Shi, L.; Wu, L.; Liu, Y. Inferring spatial interaction patterns from sequential snapshots of spatial distributions. Int. J. Geogr. Inf. Sci. 2018, 32, 783–805. [Google Scholar] [CrossRef]
  15. Xu, Y.; Belyi, A.; Bojic, I.; Ratti, C. Human mobility and socioeconomic status: Analysis of Singapore and Boston. Comput. Environ. Urban Syst. 2018, 72, 51–67. [Google Scholar] [CrossRef]
  16. Tang, J.; Gao, F.; Liu, F.; Zhang, W.; Qi, Y. Understanding spatio-temporal characteristics of urban travel demand based on the combination of GWR and GLM. Sustainability 2019, 11, 5525. [Google Scholar] [CrossRef] [Green Version]
  17. Yang, J.; Yi, D.; Qiao, B.; Zhang, J. Spatio-temporal change characteristics of spatial-interaction networks: Case study within the sixth ring road of Beijing, China. ISPRS Int. Geo-Inf. 2019, 8, 273. [Google Scholar] [CrossRef] [Green Version]
  18. Yang, J.; Yi, D.; Liu, J.; Liu, Y.; Zhang, J. Spatiotemporal change characteristics of nodes’ heterogeneity in the directed and weighted spatial interaction networks: Case study within the sixth ring road of Beijing, China. Sustainability 2019, 11, 6359. [Google Scholar] [CrossRef] [Green Version]
  19. Zhao, P.; Qin, K.; Ye, X.; Wang, Y.; Chen, Y. A trajectory clustering approach based on decision graph and data field for detecting hotspots. Int. J. Geogr. Inf. Sci. 2017, 31, 1101–1127. [Google Scholar] [CrossRef]
  20. Xia, Z.; Li, H.; Chen, Y.; Liao, W. Identify and delimitate urban hotspot areas using a network-based spatiotemporal field clustering method. ISPRS Int. Geo-Inf. 2019, 8, 344. [Google Scholar] [CrossRef] [Green Version]
  21. Anselin, L. Local indicators of spatial association—LISA. Geogr. Anal. 2010, 27, 93–115. [Google Scholar] [CrossRef]
  22. Getis, A. The analysis of spatial association by use of distance statistics. Geogr. Anal. 2010, 24, 189–206. [Google Scholar] [CrossRef]
  23. Reinau, K.H. Emerging hot spot analysis: Estimating the development in the speed of freight in a region using tracking data from logistics companies. In Proceedings of the Association of American Geographers Annual Meeting, Boston, MA, USA, 5–9 April 2017. [Google Scholar]
  24. Harris, N.L.; Goldman, E.; Gabris, C.; Nordling, J.; Minnemeyer, S.; Ansari, S.; Hansen, M. Using spatial statistics to identify emerging hot spots of forest loss. Environ. Res. Lett. 2017, 12, 24012. [Google Scholar] [CrossRef]
  25. Usman, M.; Sitanggang, I.S.; Syaufina, L. Hotspot distribution analyses based on peat characteristics using density-based spatial clustering. Procedia. Environ. Sci. 2015, 24, 132–140. [Google Scholar] [CrossRef] [Green Version]
  26. Zhou, D.; Hong, R.; Xia, J. Identification of taxi pick-up and drop-off hotspots using the density-based spatial clustering method. In Proceedings of the CICTP 2017, Shanghai, China, 7–9 July 2017. [Google Scholar]
  27. Pei, T.; Wang, W.; Zhang, H.; Ma, T.; Du, Y.; Zhou, C. Density-based clustering for data containing two types of points. Int. J. Geogr. Inf. Sci. 2015, 29, 175–193. [Google Scholar] [CrossRef]
  28. Wang, T.; Ren, C.; Luo, Y.; Tian, J. NS-DBSCAN: A density-based clustering algorithm in network space. ISPRS Int. Geo-Inf. 2019, 8, 218. [Google Scholar] [CrossRef] [Green Version]
  29. Zhang, P.; Deng, M.; Shi, Y.; Zhao, L. Detecting hotspots of urban residents’ behaviours based on spatio-temporal clustering techniques. GeoJournal 2017, 82, 923–935. [Google Scholar] [CrossRef]
  30. Zhou, Y.; Fang, Z.; Thill, J.-C.; Li, Q.; Li, Y. Functionally critical locations in an urban transportation network: Identification and space–time analysis using taxi trajectories. Comput. Environ. Urban Syst. 2015, 52, 34–47. [Google Scholar] [CrossRef]
  31. Deng, M.; Yang, X.; Shi, Y.; Gong, J.; Liu, Y.; Liu, H. A density-based approach for detecting network-constrained clusters in spatial point events. Int. J. Geogr. Inf. Sci. 2019, 33, 466–488. [Google Scholar] [CrossRef]
  32. Li, D.; Du, Y. Artificial Intelligent with Uncertainty; Chapman and Hall, CRC: Boca Raton, FL, USA, 2007. [Google Scholar]
  33. Wang, S.; Gan, W.; Li, D.; Li, D. Data field for hierarchical clustering. Int. J. Data. Warehous. 2011, 7, 43–63. [Google Scholar] [CrossRef] [Green Version]
  34. Li, C.; Ding, G.; Wang, D.; Li, Y.; Wang, S. Clustering by fast search and find of density peaks with data field. Chin. J. Electron. 2016, 25, 397–402. [Google Scholar]
  35. Wu, T.; Qin, K. Image data field for homogeneous region based segmentation. Comput. Electr. Eng. 2012, 38, 459–470. [Google Scholar] [CrossRef]
  36. Qin, K.; Zhou, Q.; Wu, T.; Xu, Y.Q. Hotspots Detection from Trajectory Data Based on Spatiotemporal Data Field Clustering; ISPRS—International Archives of the Photogrammetry, Remote Sensing and Spatial Information Sciences: Wuhan, China, 2017. [Google Scholar]
  37. Chen, L.; Gao, Y.; Zhu, D.; Yuan, Y.; Liu, Y. Quantifying the scale effect in geospatial big data using semi-variograms. PLoS ONE 2019, 14, e0225139. [Google Scholar] [CrossRef]
  38. Openshaw, S. The Modifiable Areal Unit Problem. Concepts and Techniques in Modern Geography; Geo Books: Norwich, UK, 1984. [Google Scholar]
  39. Rosin, P. Unimodal thresholding. Pattern Recognit. 2001, 34, 2083–2096. [Google Scholar] [CrossRef]
  40. Chainey, S.; Tompson, L.; Uhlig, S. The utility of hotspot mapping for predicting spatial patterns of crime. Secur. J. 2008, 21, 4–28. [Google Scholar] [CrossRef]
  41. Adepeju, M.; Rosser, G.; Cheng, T. Novel evaluation metrics for sparse spatio-temporal point process hotspot predictions—A crime case study. Int. J. Geogr. Inf. Sci. 2016, 30, 2133–2154. [Google Scholar] [CrossRef]
  42. Yang, B.; Liu, L.; Lan, M.; Wang, Z.; Zhou, H.; Yu, H. A spatio-temporal method for crime prediction using historical crime data and transitional zones identified from nightlight imagery. Int. J. Geogr. Inf. Sci. 2020, 1740–1764. [Google Scholar] [CrossRef]
  43. Hu, Y.; Wang, F.; Guin, C.; Zhu, H. A spatio-temporal kernel density estimation framework for predictive crime hotspot mapping and evaluation. Appl. Geogr. 2018, 99, 89–97. [Google Scholar] [CrossRef]
  44. Wang, Y.; Gu, Y.; Dou, M.; Qiao, M. Using spatial semantics and interactions to identify urban functional regions. ISPRS Int. Geo-Inf. 2018, 7, 130. [Google Scholar] [CrossRef] [Green Version]
  45. Liu, X.; Gong, L.; Gong, Y.; Liu, Y. Revealing travel patterns and city structure with taxi trip data. J. Transp. Geogr. 2015, 43, 78–90. [Google Scholar] [CrossRef] [Green Version]
  46. Zhong, C.; Arisona, S.M.; Huang, X.; Batty, M.; Schmitt, G. Detecting the dynamics of urban structure through spatial network analysis. Int. J. Geogr. Inf. Sci. 2014, 28, 2178–2199. [Google Scholar] [CrossRef]
  47. Shanmukhappa, T.; Ho, I.W.-H.; Tse, C.K. Spatial analysis of bus transport networks using network theory. Physica A 2018, 502, 295–314. [Google Scholar] [CrossRef]
  48. Wang, Y.; Deng, Y.; Ren, F.; Zhu, R.; Wang, P.; Du, T.; Du, Q. Analysing the spatial configuration of urban bus networks based on the geospatial network analysis method. Cities 2020, 96, 102406. [Google Scholar] [CrossRef]
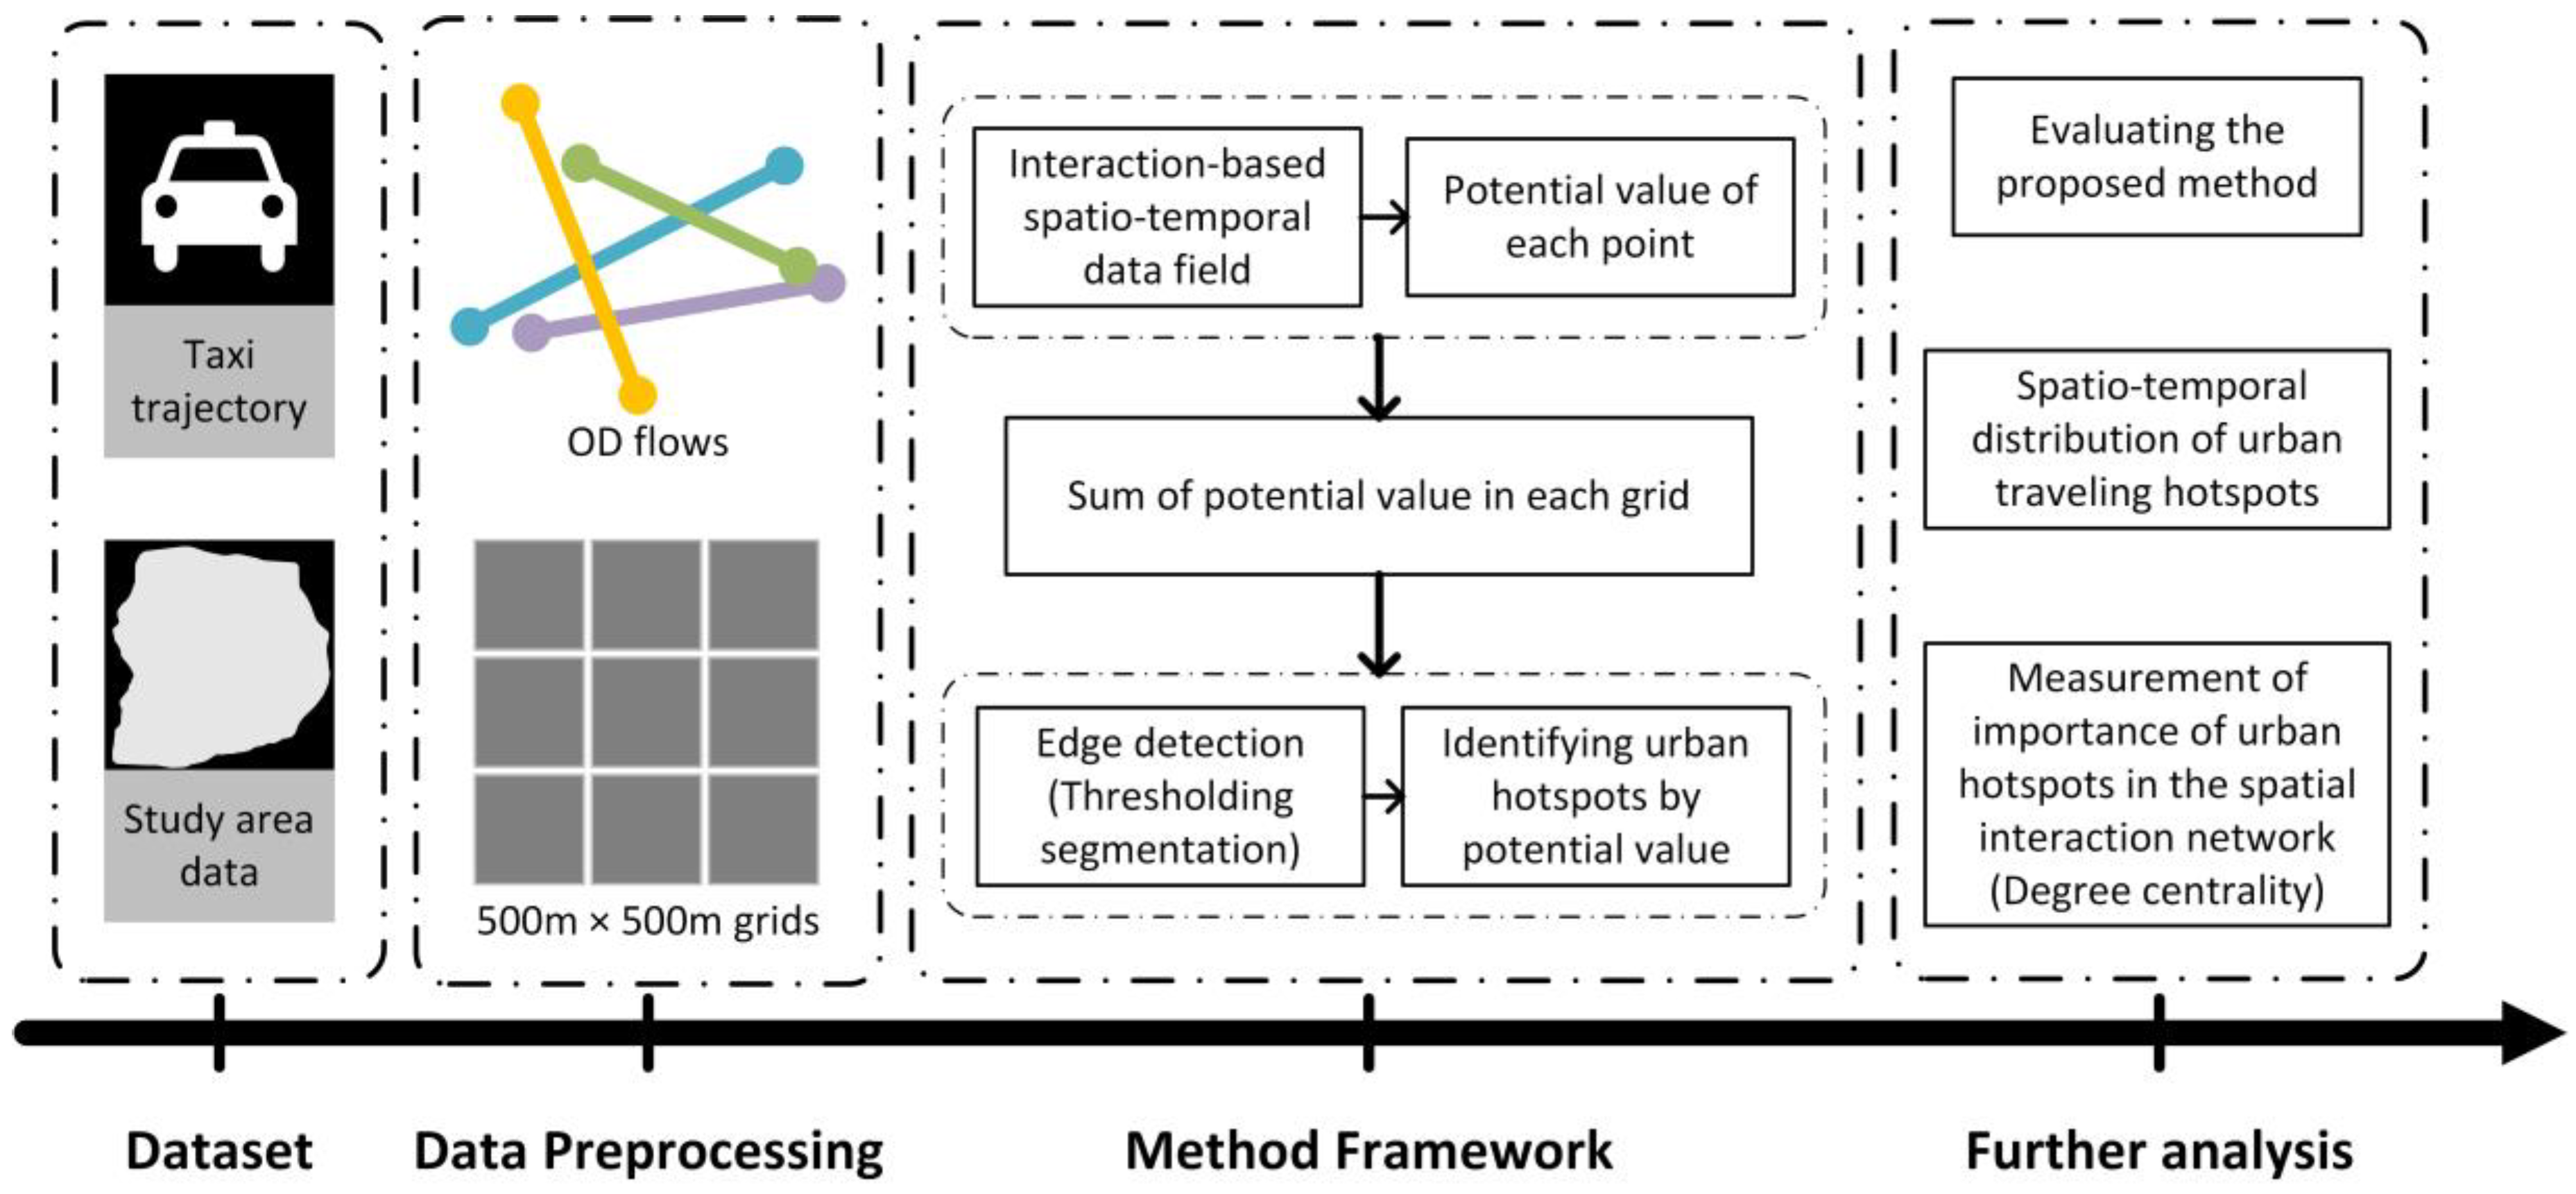
Figure 1. The overall flowchart of the research structure.
Sustainability 12 09662 g001
Figure 2. The conceptual expression of points in a spatial space (a) and in a spatio-temporal space (b). Point A and point B are represented as A ( x 1 , y 1 ) and B ( x 2 , y 2 ) in the two-dimensional space, while in the spatio-temporal space, point A and point B are quantified as A ( x 1 , y 1 , t 1 ) and B ( x 2 , y 2 , t 2 ) .
Sustainability 12 09662 g002
Figure 3. The sketch-map of the data field with spatial interaction.
Sustainability 12 09662 g003
Figure 4. The study area represented (b), which is denoted in green (a).
Sustainability 12 09662 g004
Figure 5. An example of the result of calculating potential value in the grid.
Sustainability 12 09662 g005
Figure 6. The different numbers of origins (O) and destinations (D) at different times on weekdays.
Sustainability 12 09662 g006
Figure 7. The dynamic distribution of pick-up and drop-off hotspots on weekdays at different periods.
Sustainability 12 09662 g007
Figure 8. The different numbers of origins (O) and destinations (D) at different times on weekends.
Sustainability 12 09662 g008
Figure 9. The dynamic distribution of pick-up and drop-off hotspots on weekends at different periods.
Sustainability 12 09662 g009
Figure 10. The comparison of different hotspot identifications.
Sustainability 12 09662 g010
Figure 11. The results of the Wilcoxon signed rank (WSR) test, showing the significance of any differences between the PAI values of the methods. The green part means the comparison of methods for origins on weekdays, the blue part represents destinations on weekdays, the purple part represents origins on weekends, and the grey part represents destinations on weekends. All parts follow the rule that the row method is more accurate than the column method. When the color becomes darker, the significance is lower.
Sustainability 12 09662 g011
Figure 12. The directed spatial-interaction network of hotspots at 09:00–12:00 on weekdays and weekends. The blue nodes, the green nodes, and the yellow nodes represent the grids as both pick-up and drop-off hotspots, only pick-up hotspots, and only drop-off hotspots, respectively. The more important nodes with a greater degree centrality are bigger.
Sustainability 12 09662 g012
Table 1. Samples of origin–destination (OD) flows with pick-ups and drop-offs.
Taxi IDPick-Up TimePick-Up LocationDrop-Off TimeDrop-Off Location
10002016-6-10 10:37:44116.58874, 40.079052016-6-10 11:5:1116.39498, 39.99156
121792016-6-12 14:33:52116.39114, 39.855522016-6-12 14:50:22116.31633, 39.89542
19702016-6-14 20:58:35116.55133, 40.063252016-6-14 21:7:54116.47403, 40.01265
Table 2. The prediction accuracy index (PAI) value of different methods on weekdays and weekends.
Weekdays/WeekendsMethod01:00–04:0005:00–08:0009:00–12:0013:00–16:0017:00–20:0021:00–00:00+1Mean
OWeekdaysGetis-Ord Gi*3.6803.4233.7373.8163.8153.6083.680
Data field12.27010.0039.5989.1746.8116.0188.979
Interaction-based STDF24.6828.2528.3779.9298.2288.85711.388
WeekendsGetis-Ord Gi*3.6362.9263.1503.3053.9223.1373.346
Data field7.4384.8026.1566.8565.1085.1395.917
Interaction-based STDF10.0897.7878.1058.15914.9356.4989.262
DWeekdaysGetis-Ord Gi*3.6693.4133.6243.9513.8153.4853.660
Data field8.45410.3138.6868.8956.5875.8468.130
Interaction-based STDF10.56511.6238.9527.9837.4206.3018.807
WeekendsGetis-Ord Gi*3.5723.0573.2633.4123.8953.1533.392
Data field10.1504.7035.8637.0885.5995.8586.544
Interaction-based STDF6.6048.4228.1398.40212.7615.8648.365
Publisher’s Note: MDPI stays neutral with regard to jurisdictional claims in published maps and institutional affiliations.