Landslide Risk Mapping in an Urban Area of the City of Natal, Brazil


Abstract
1. Introduction
2. Materials and Methods
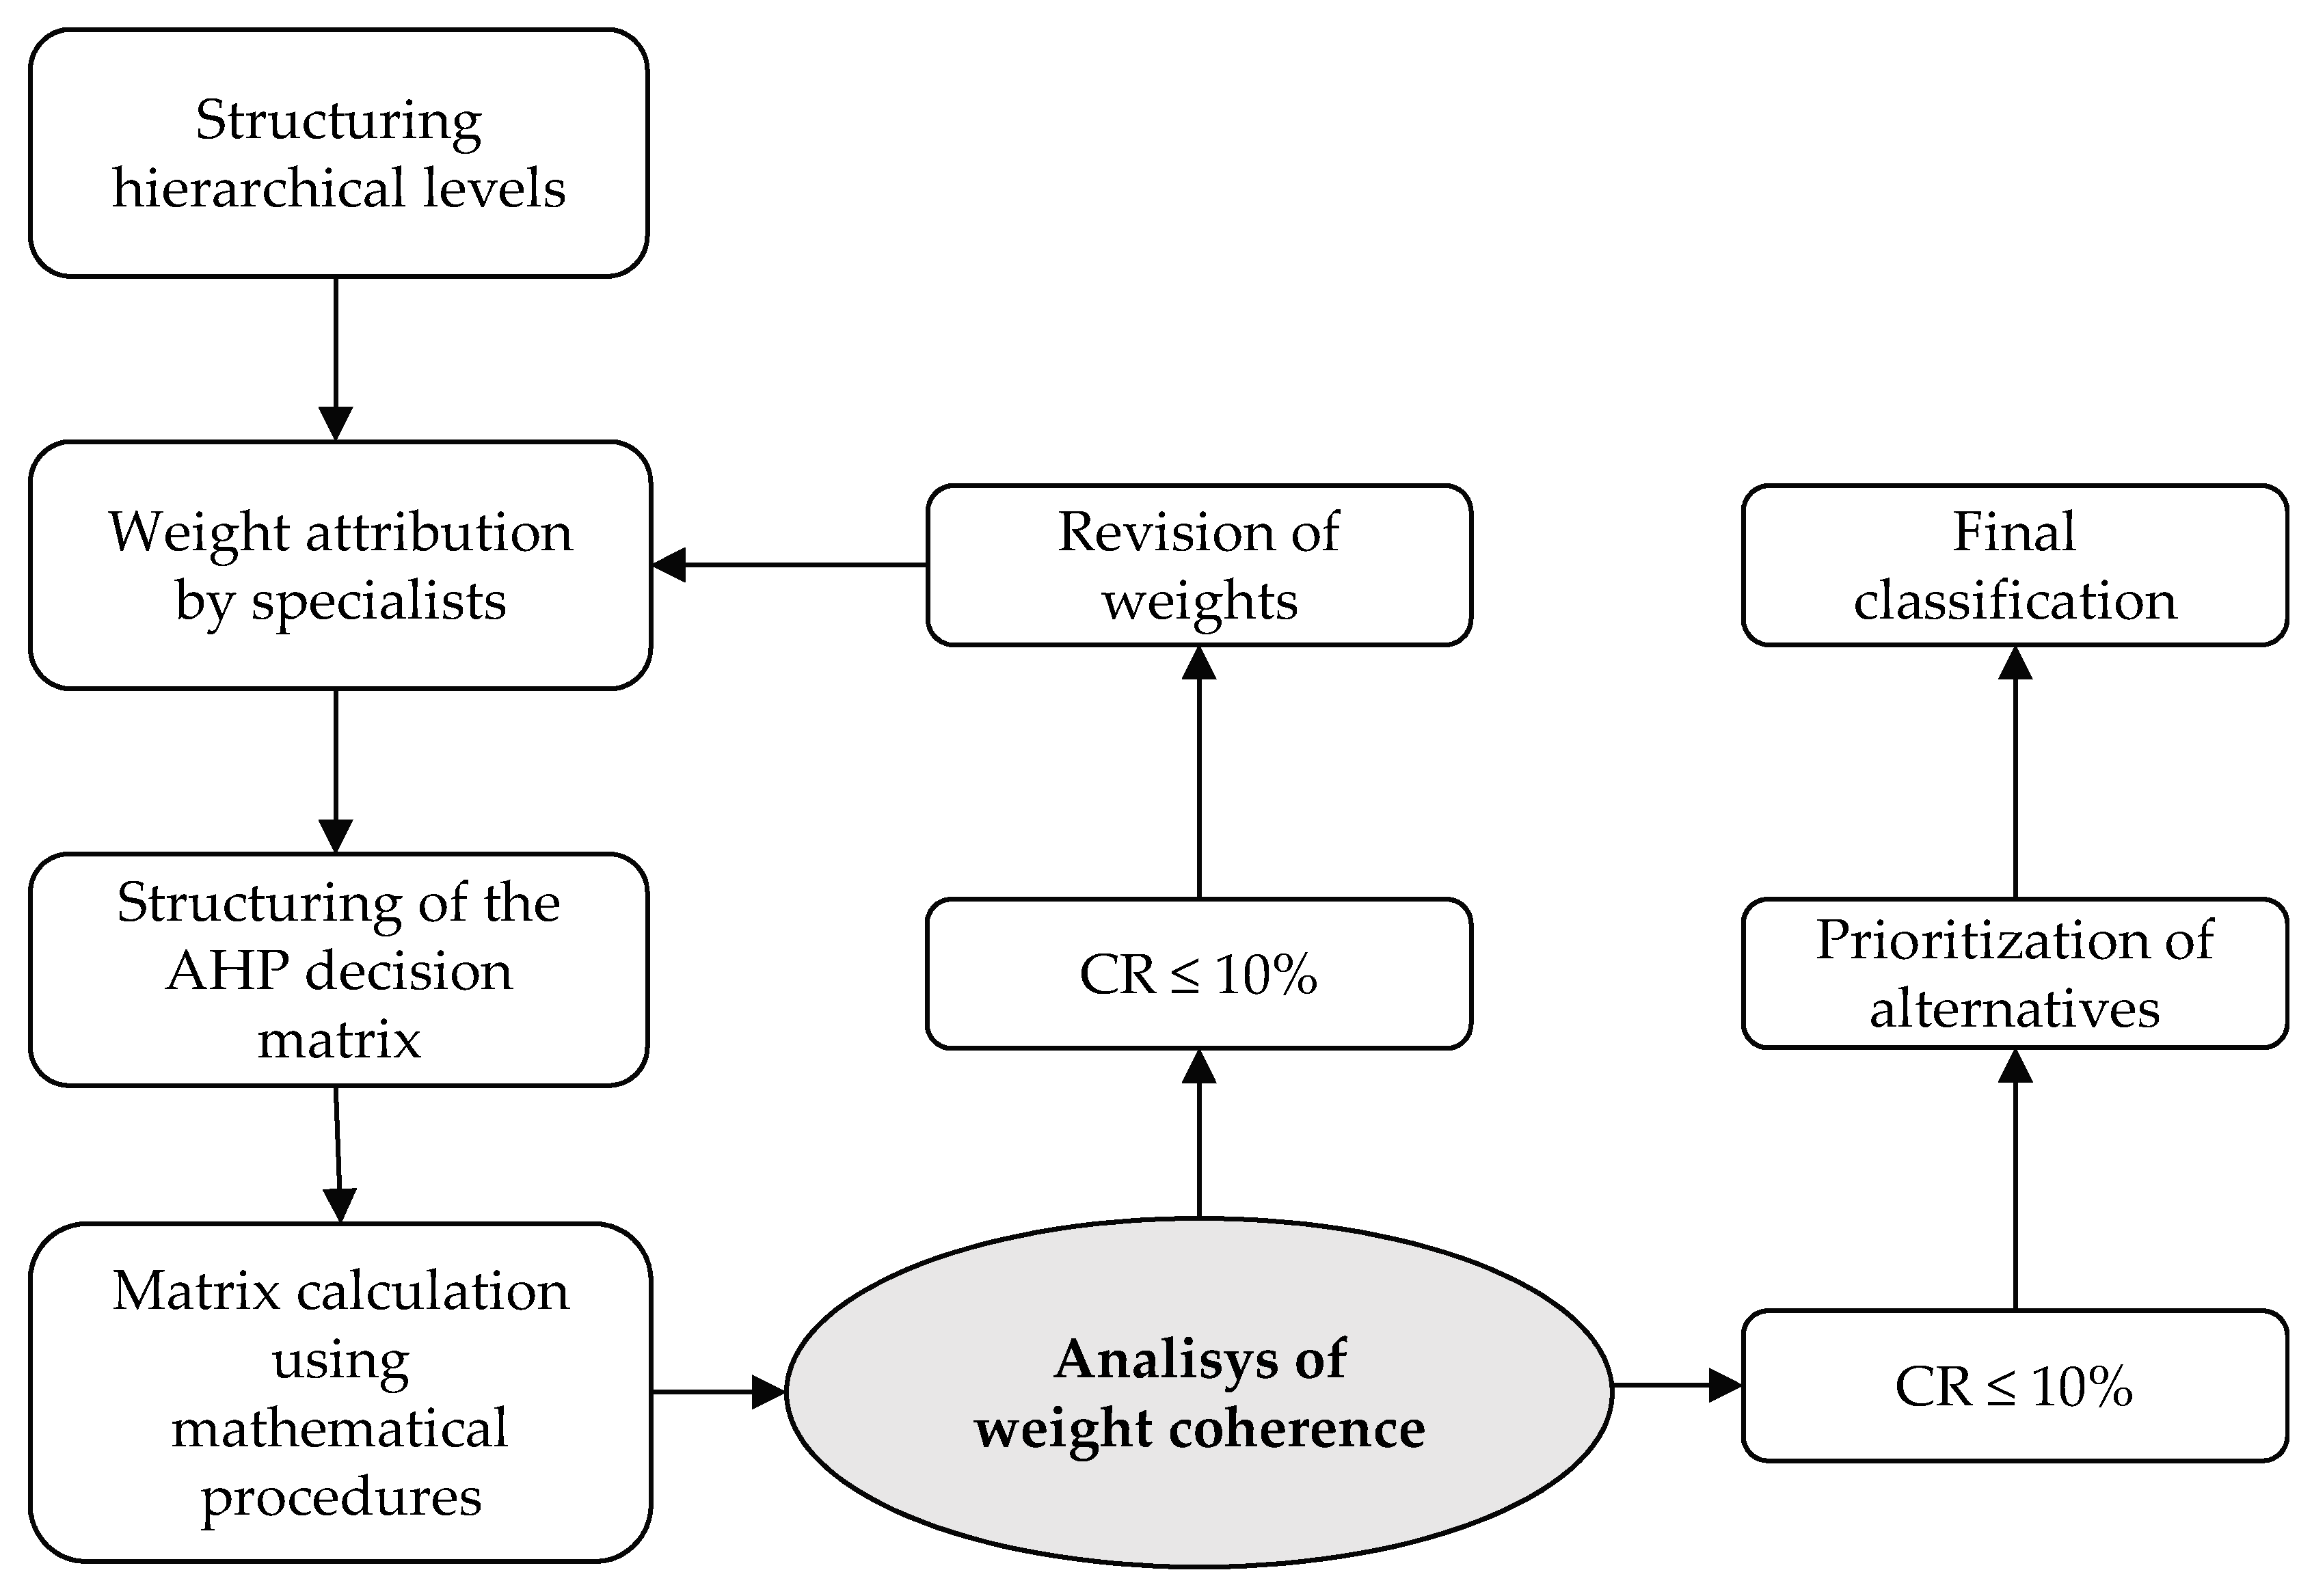
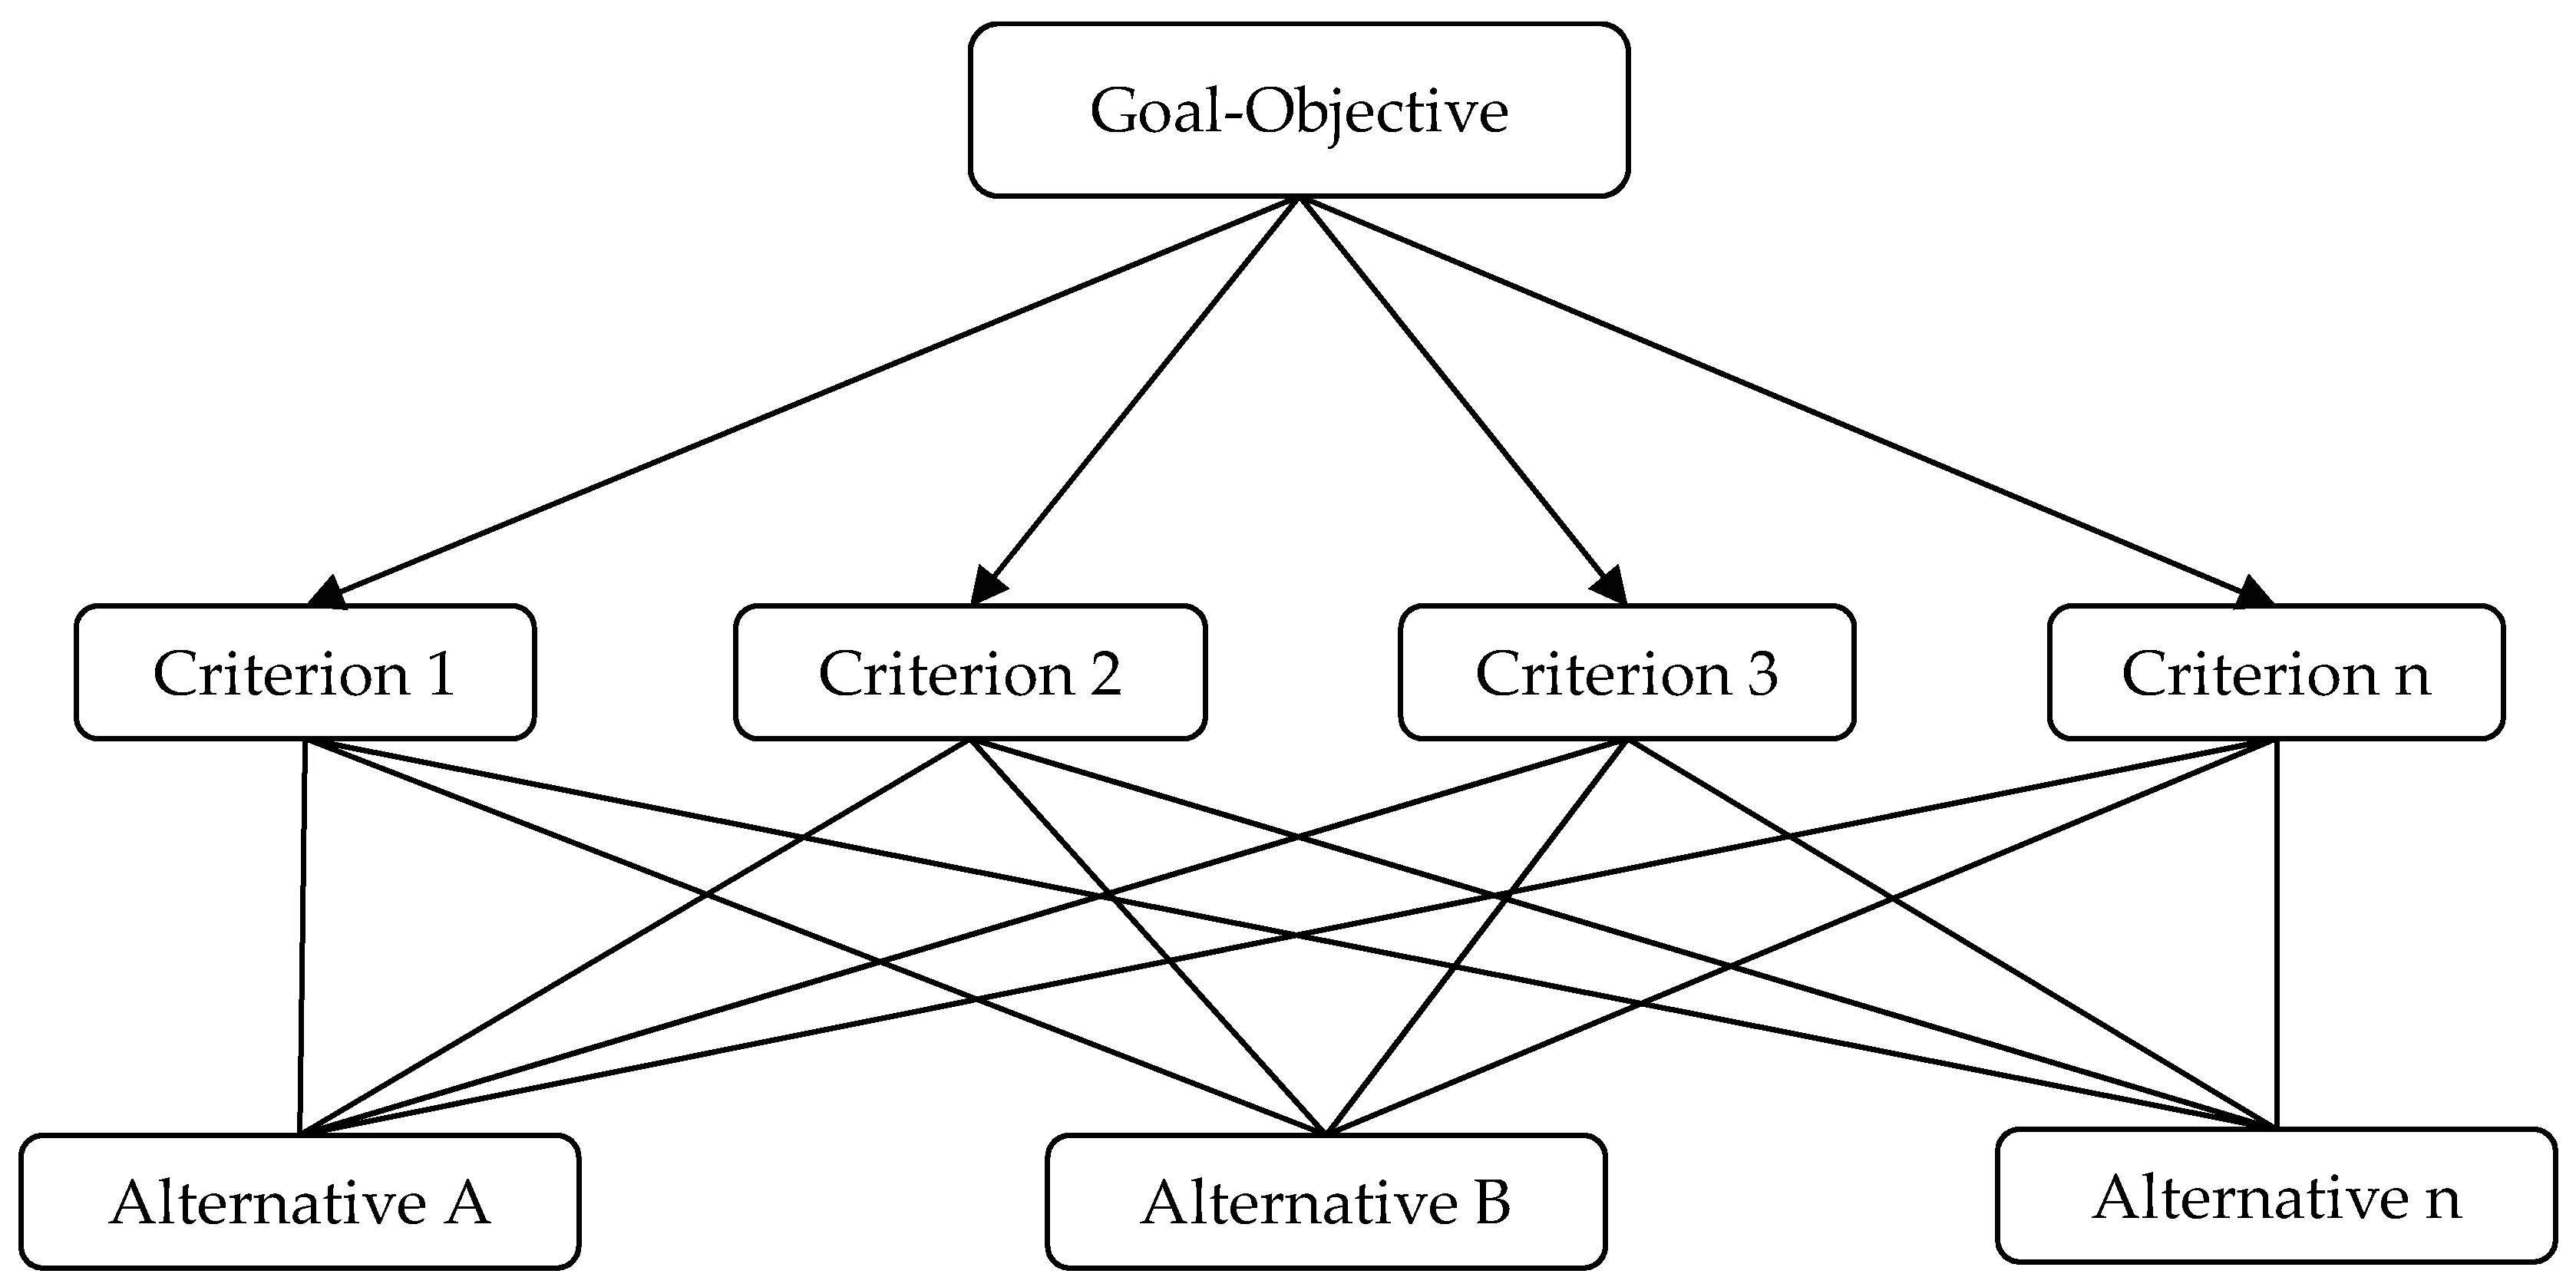
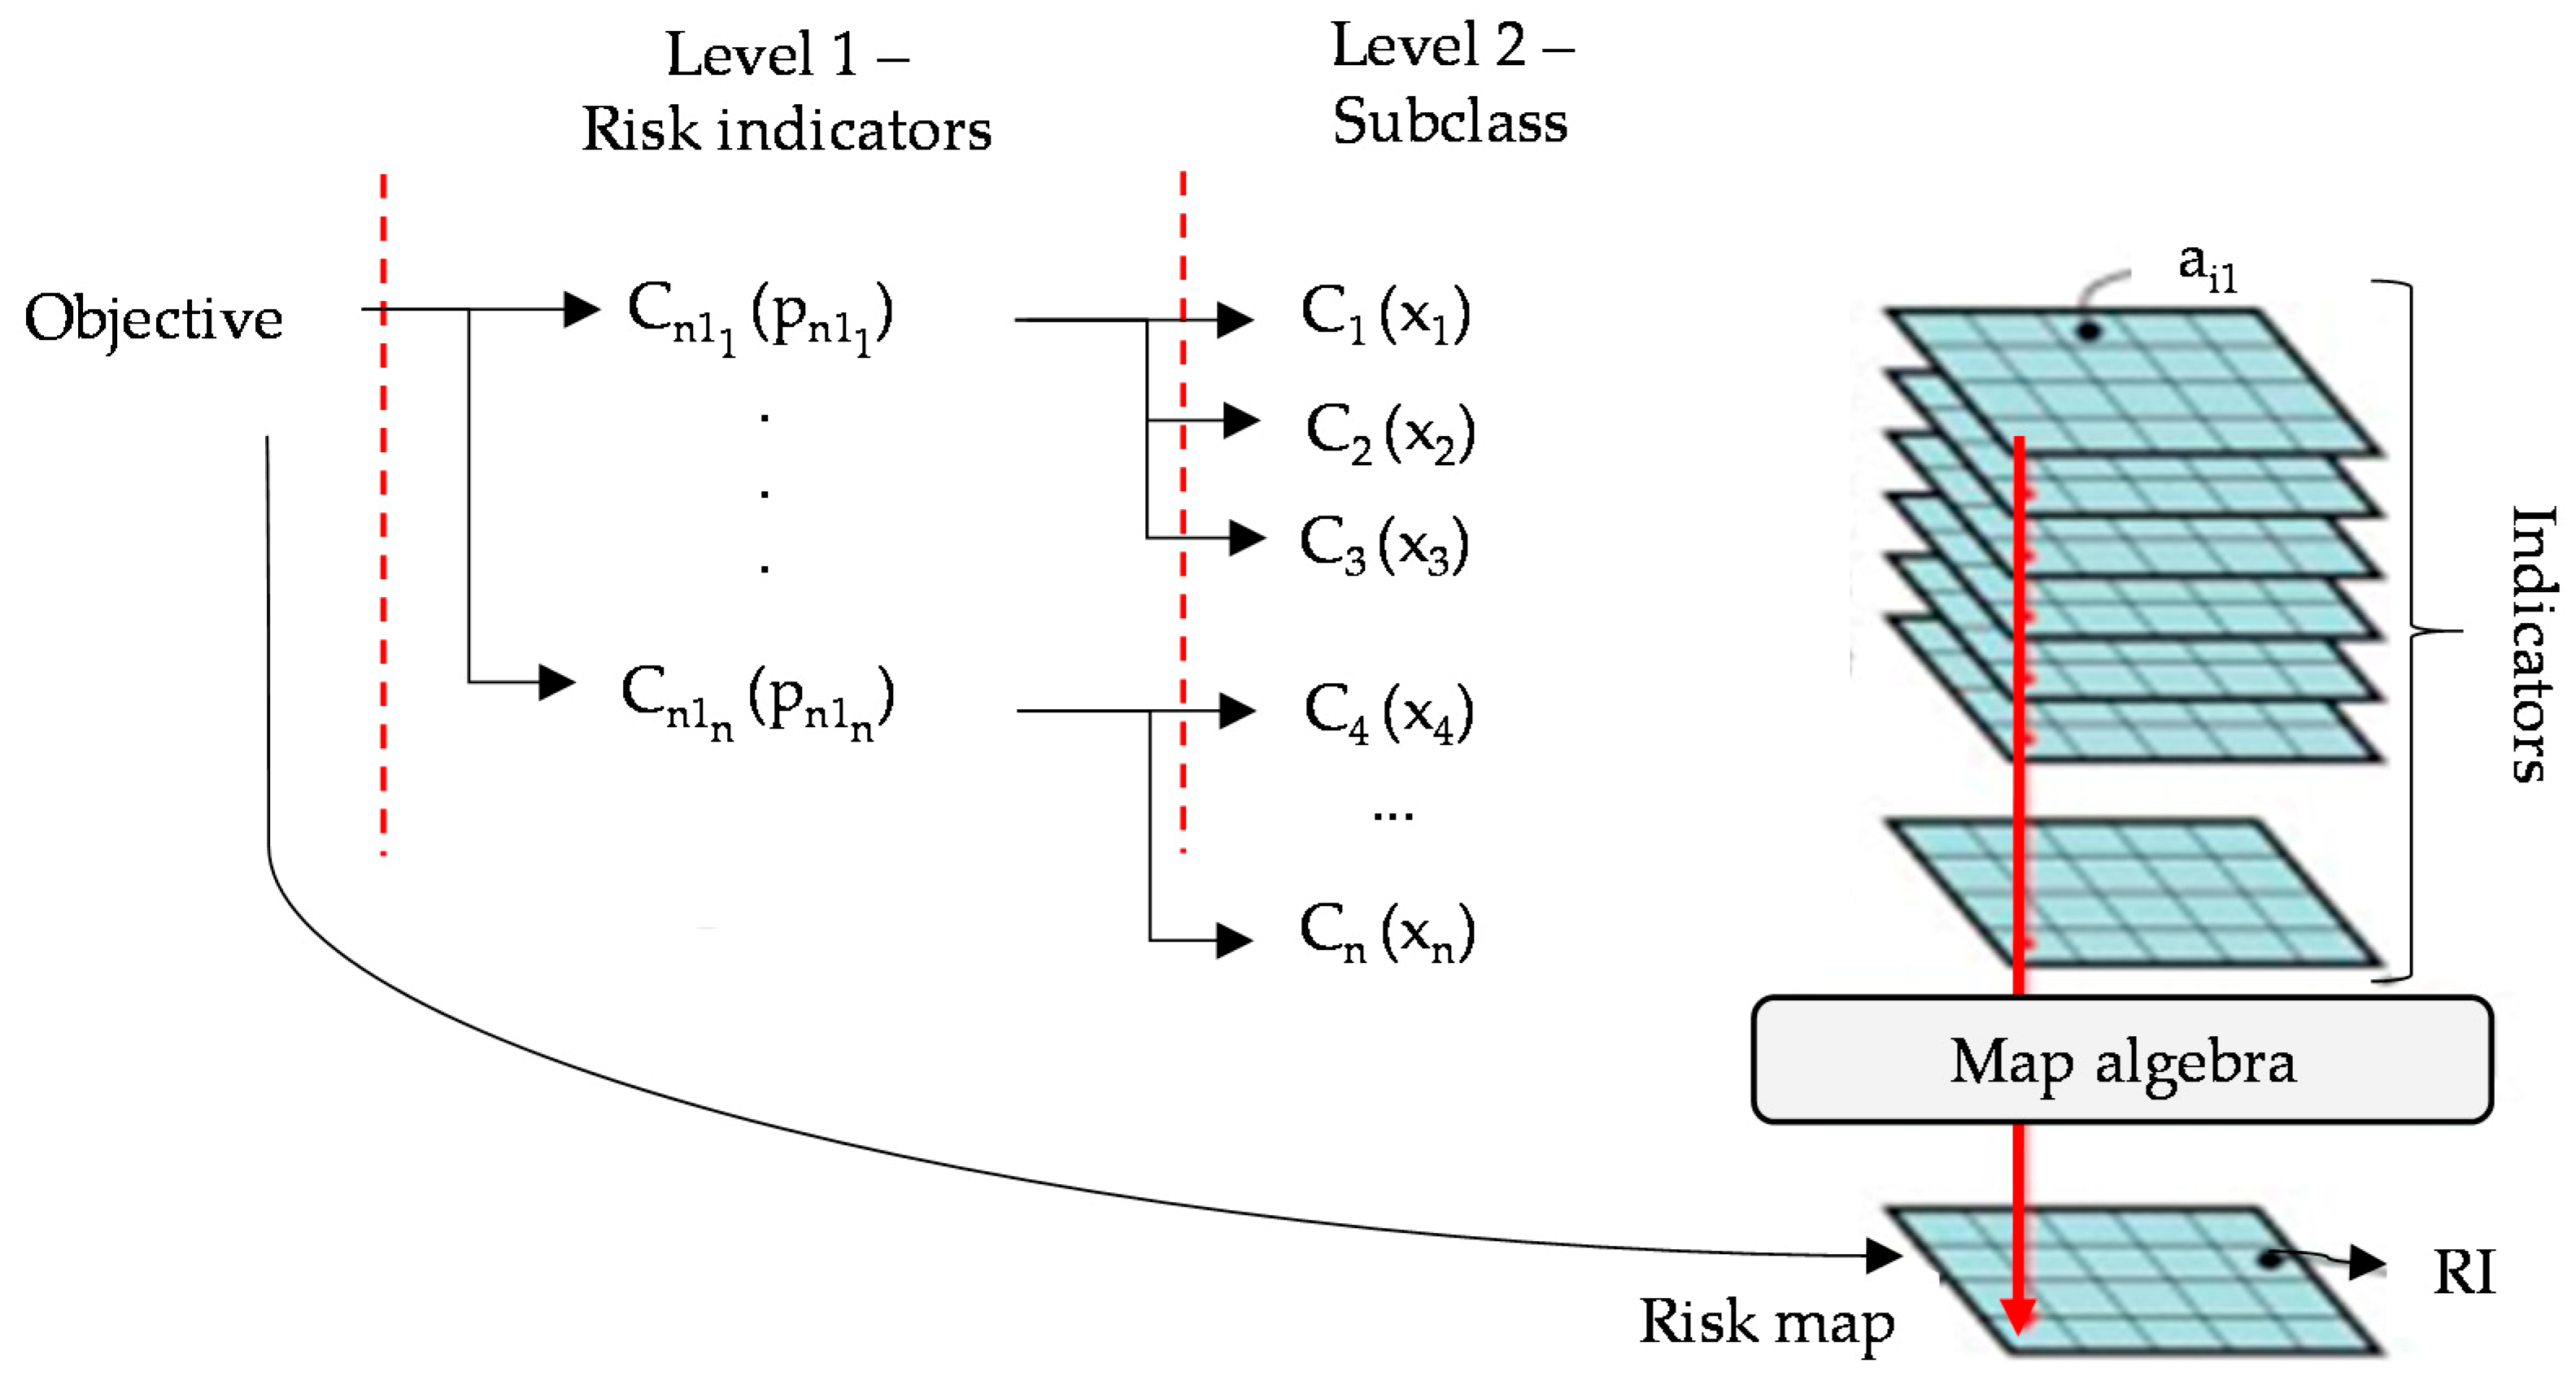
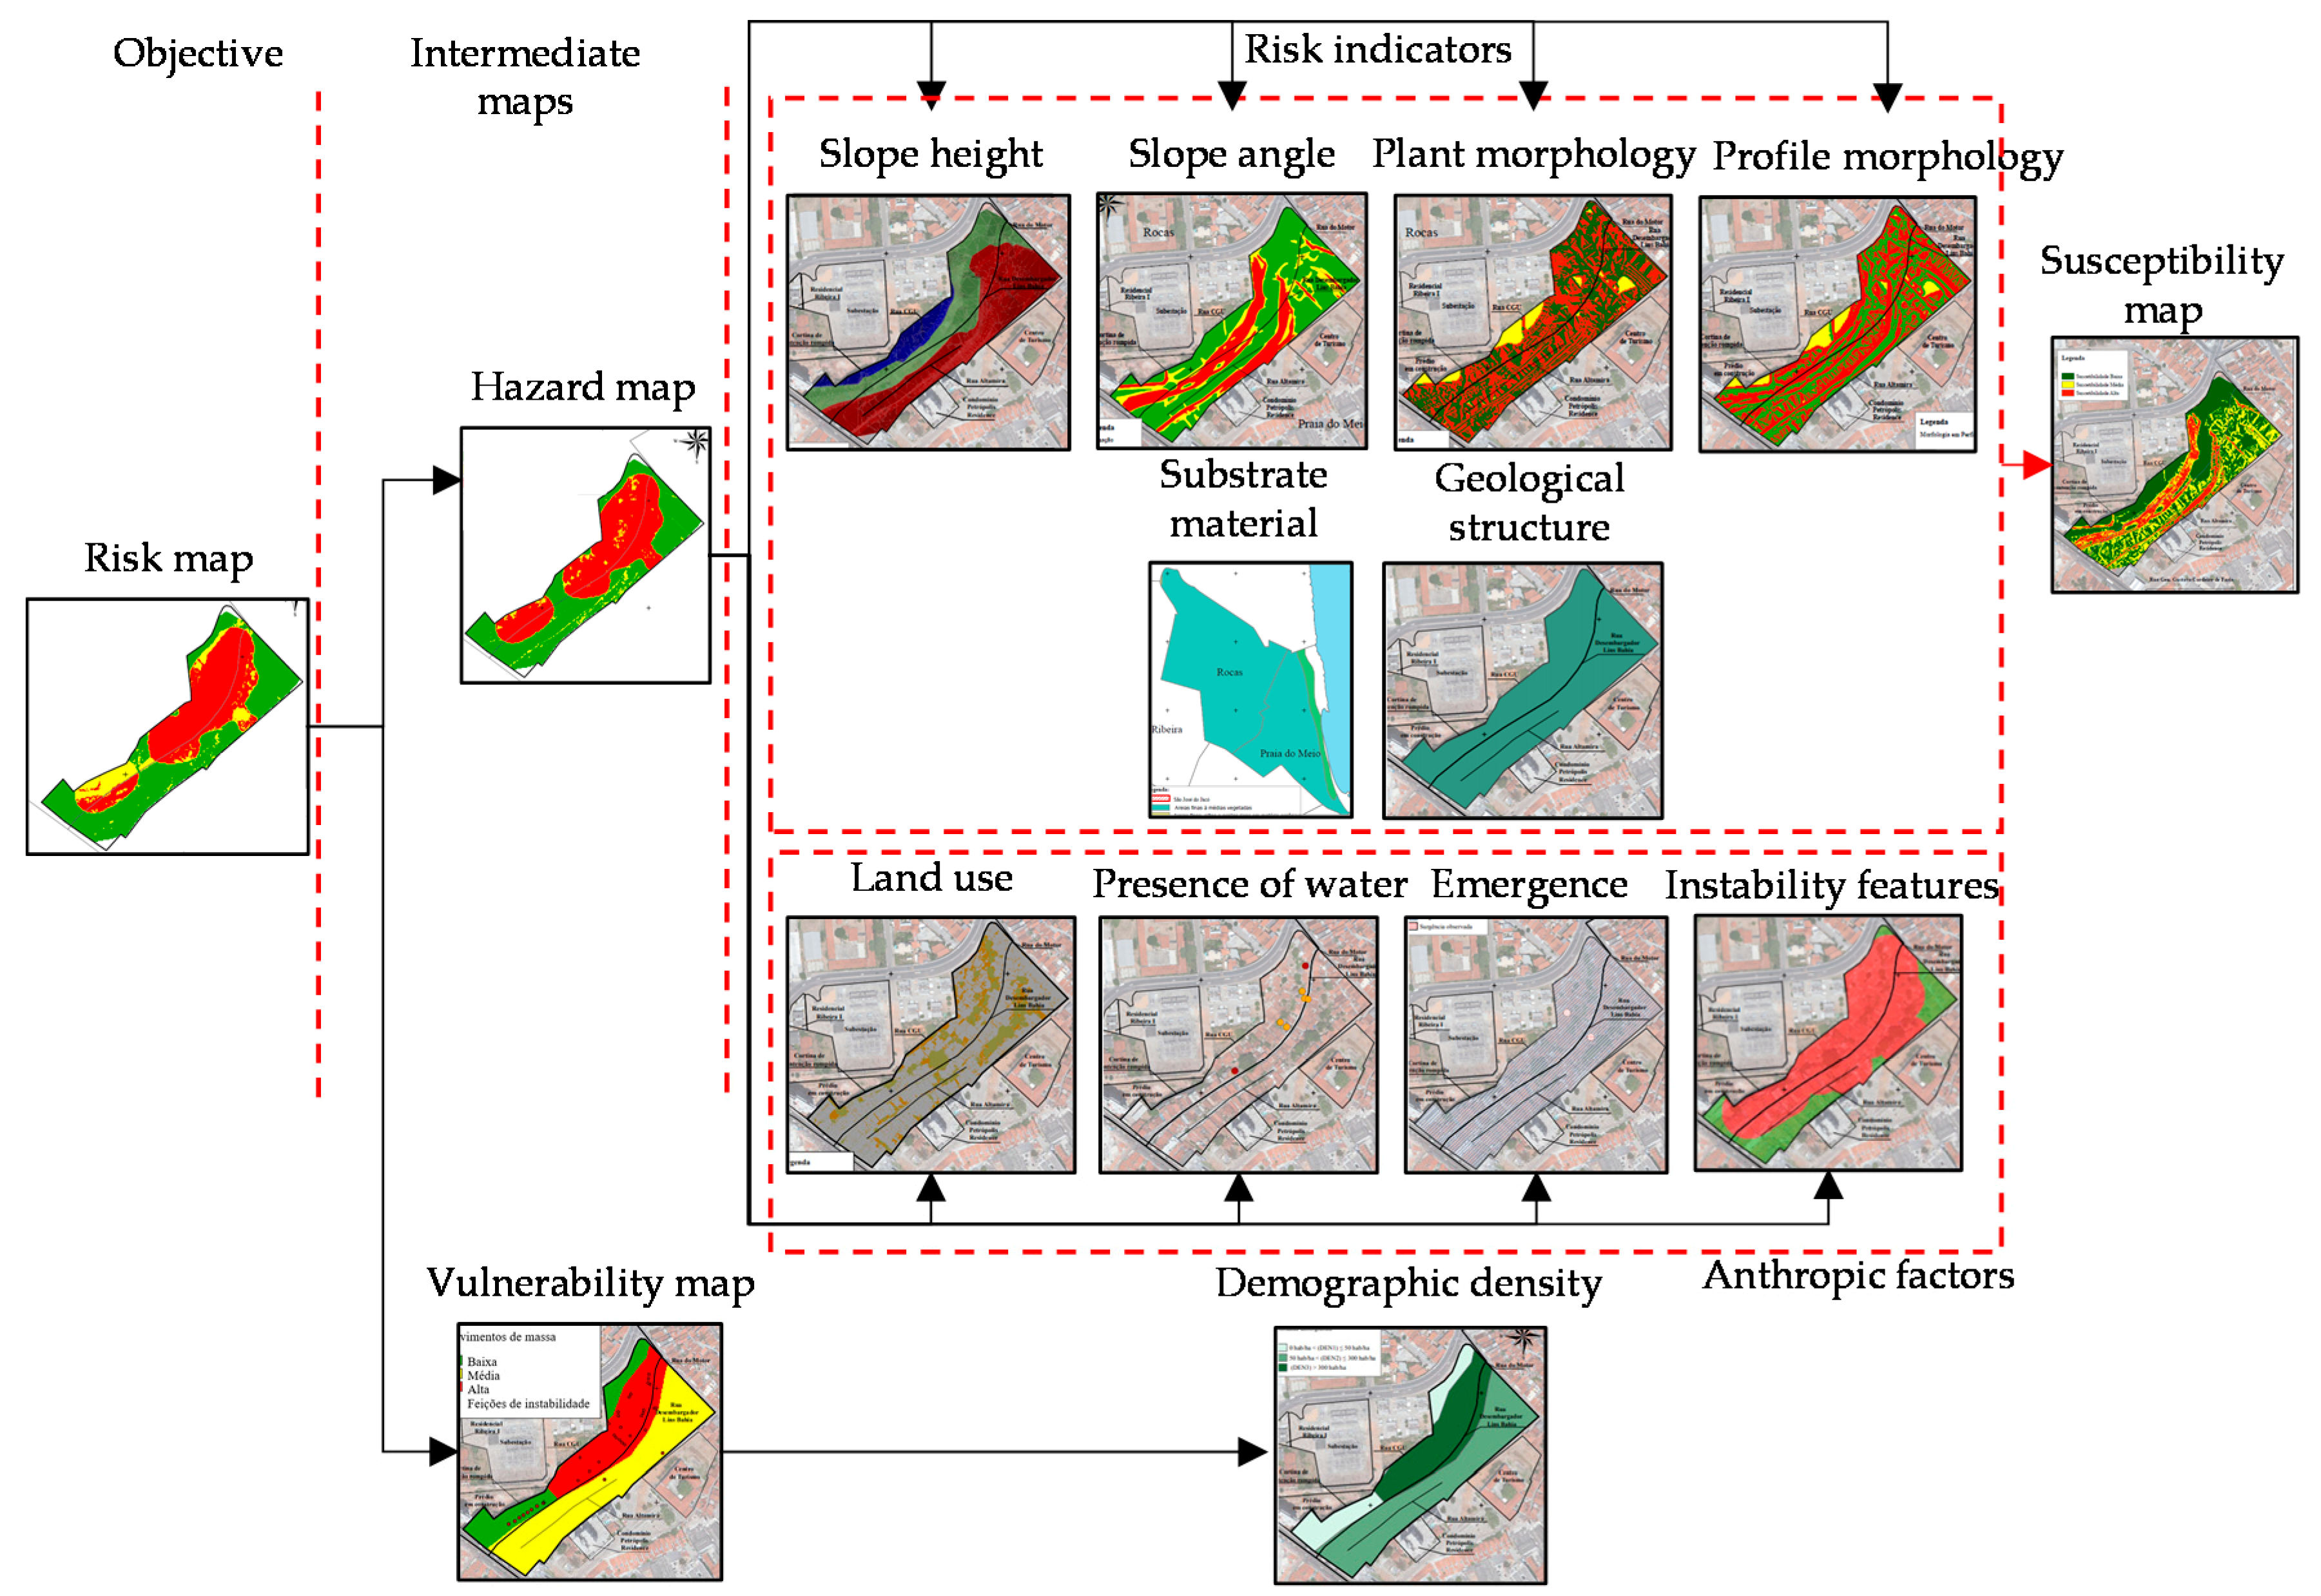
2.1. Quali-Quantitative Risk Assessment Model Proposed by Faria (2011)
2.2. Research Methodology
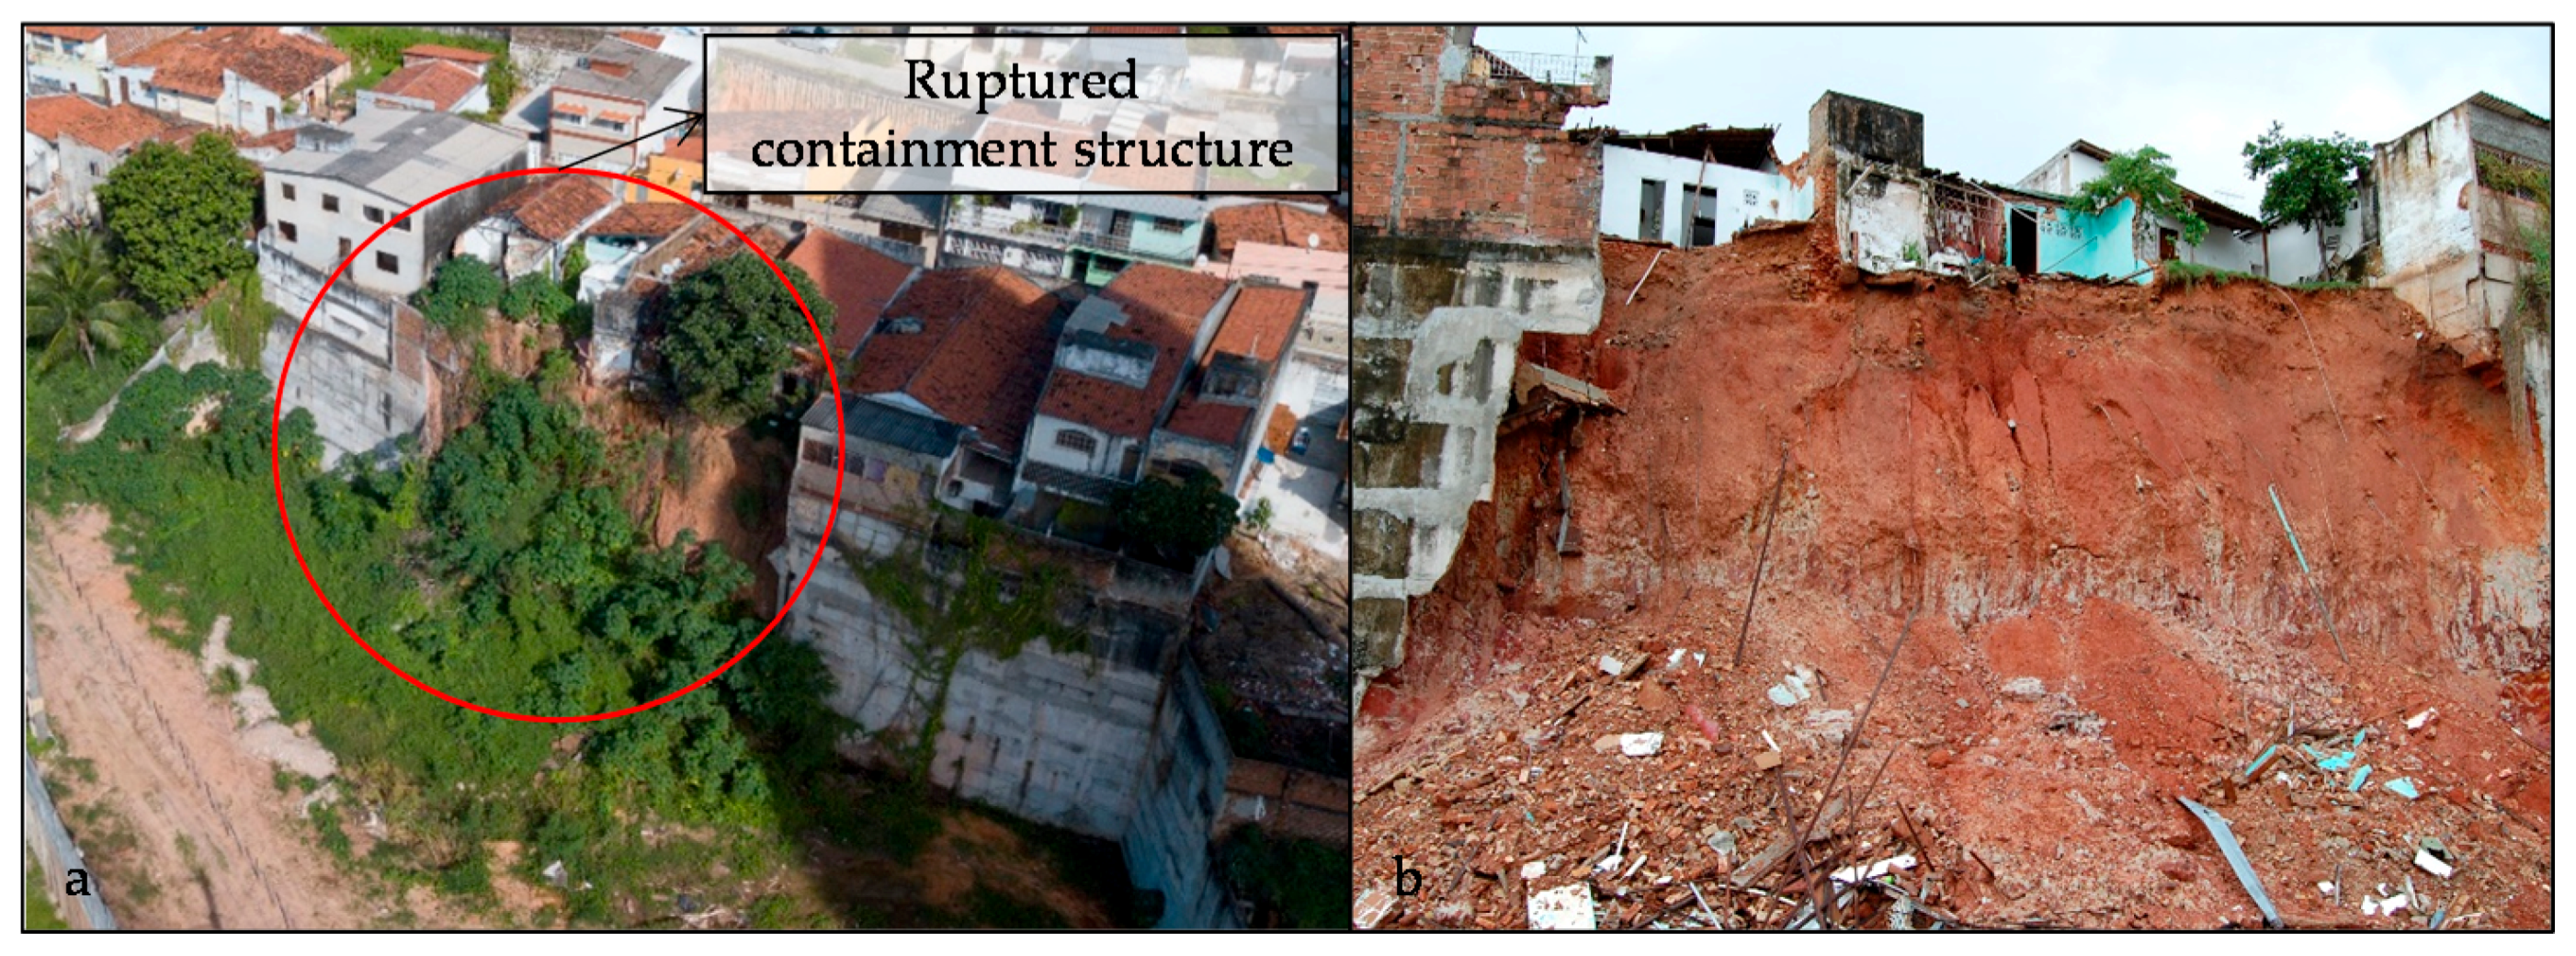
2.3. Site Description
3. Results and Discussion
3.1. Weightings Obtained by the AHP Method
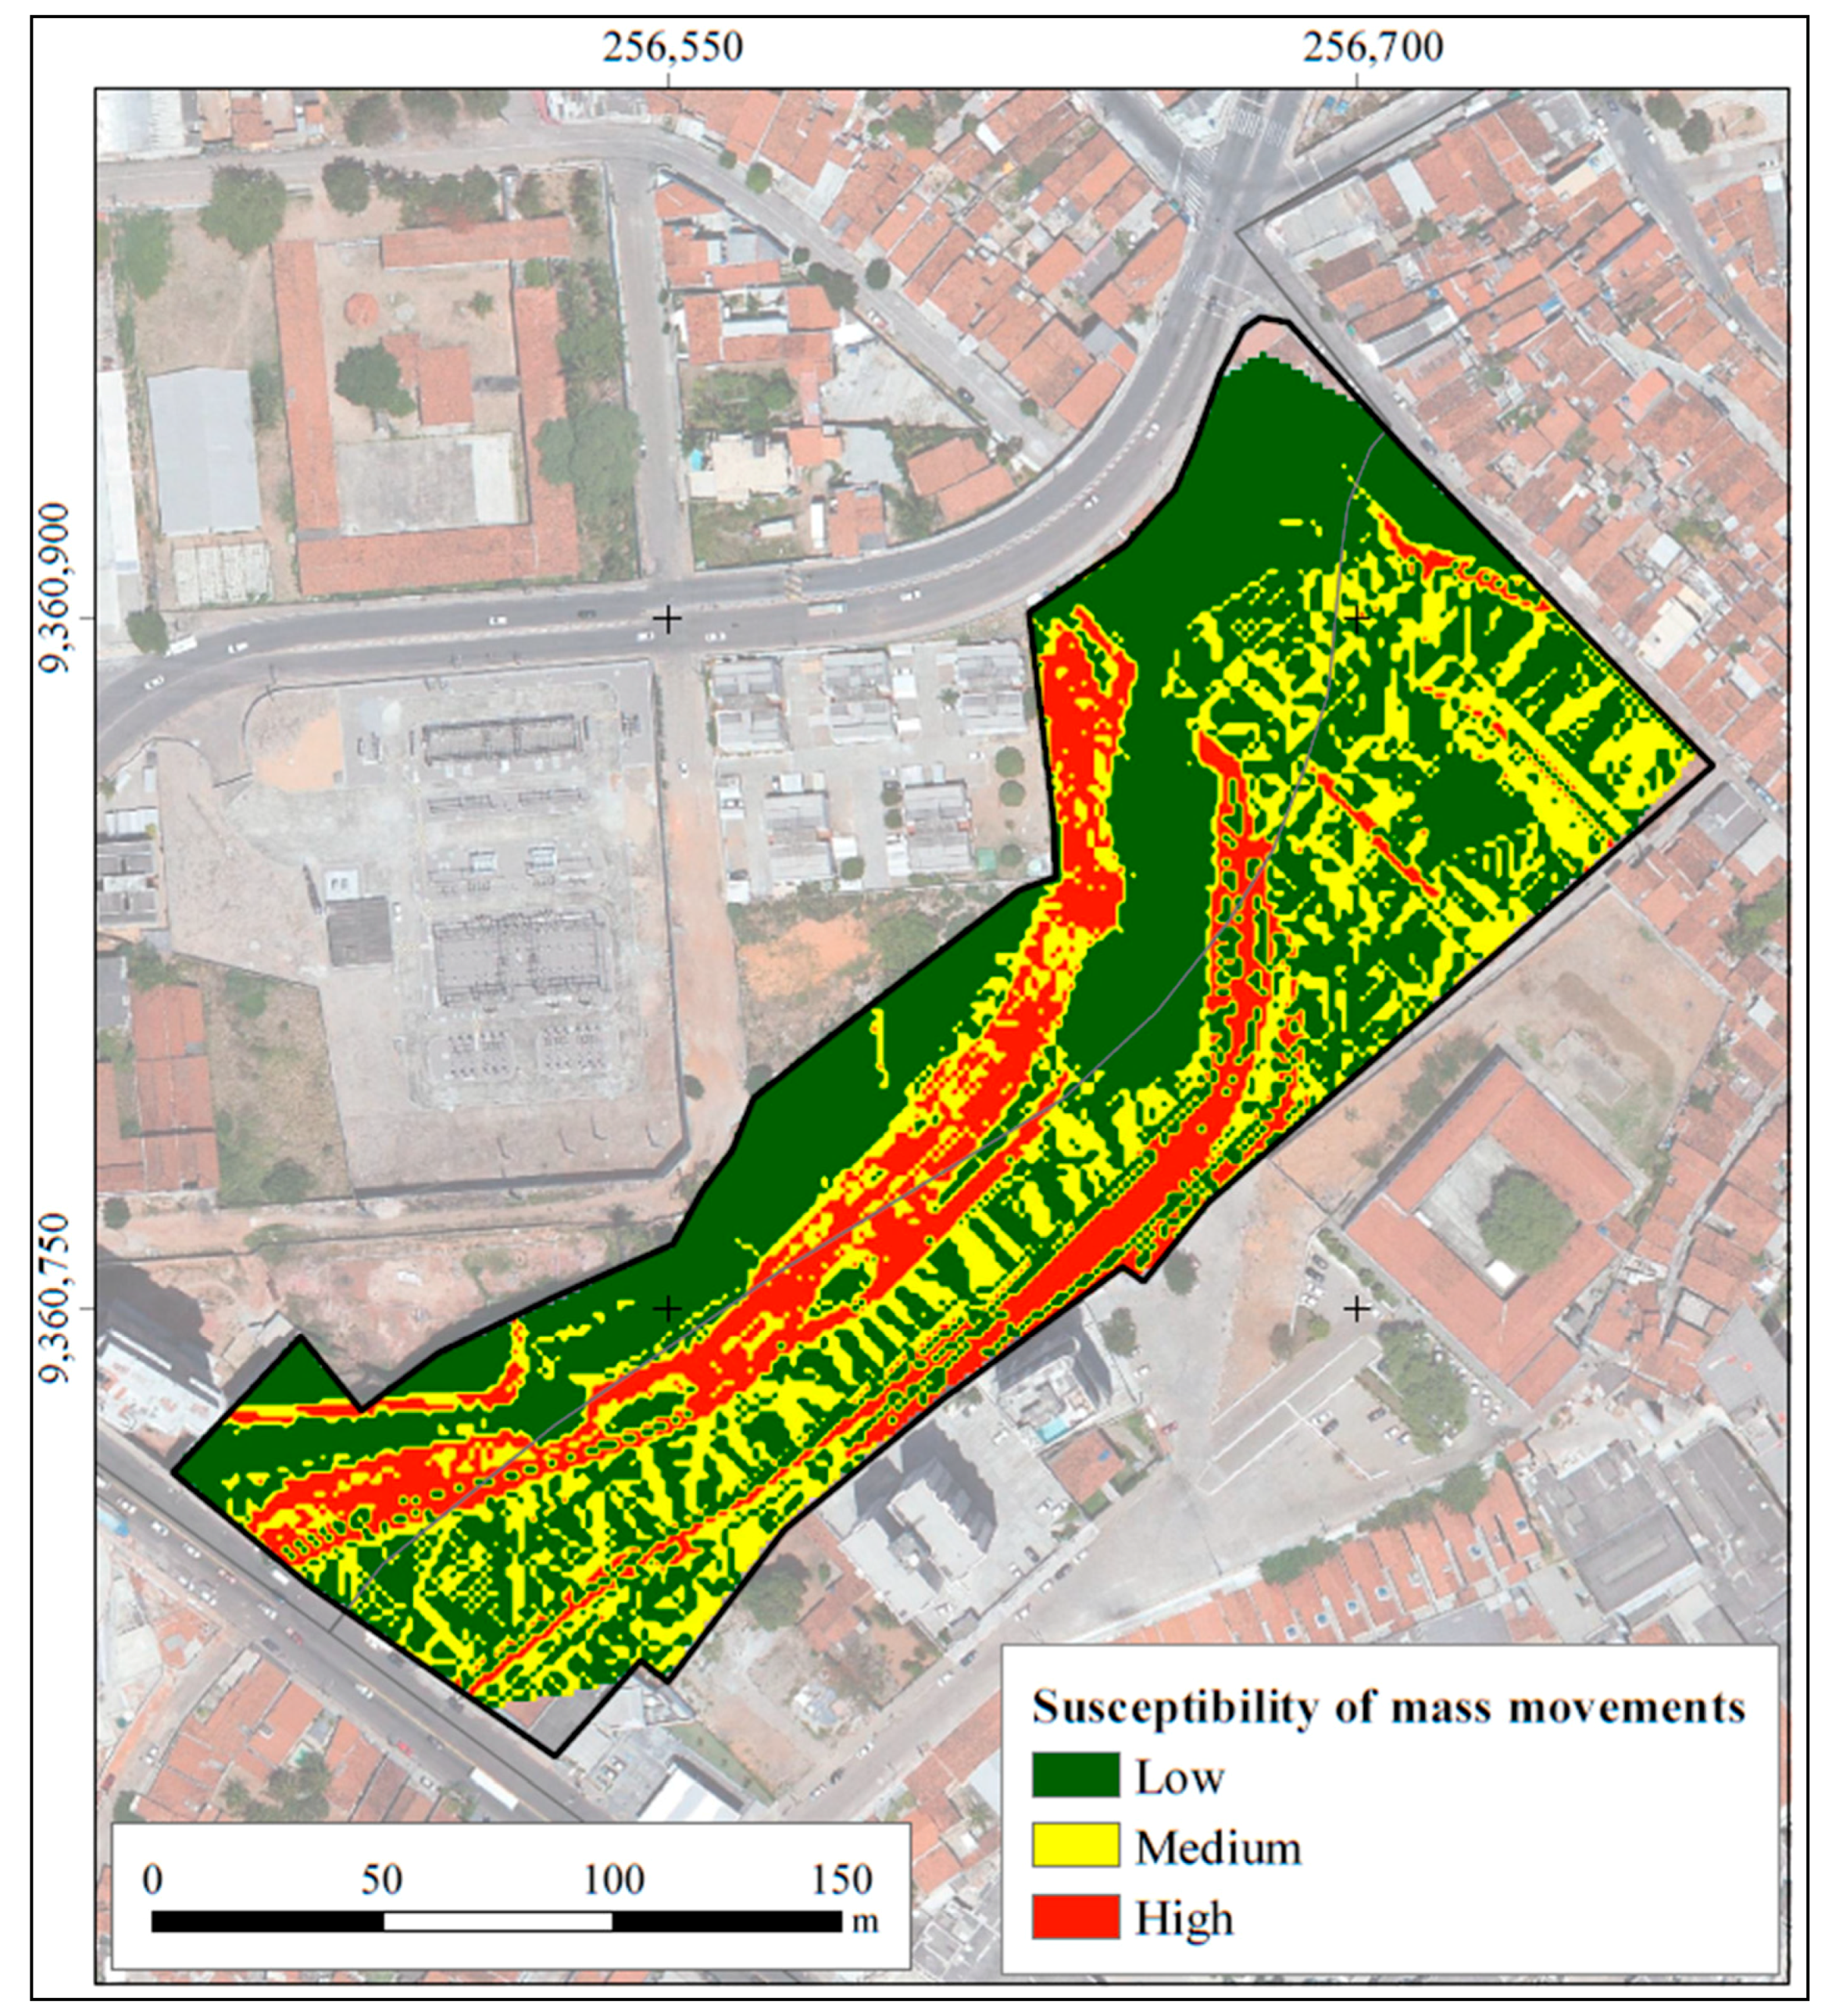
3.2. Risk Mapping
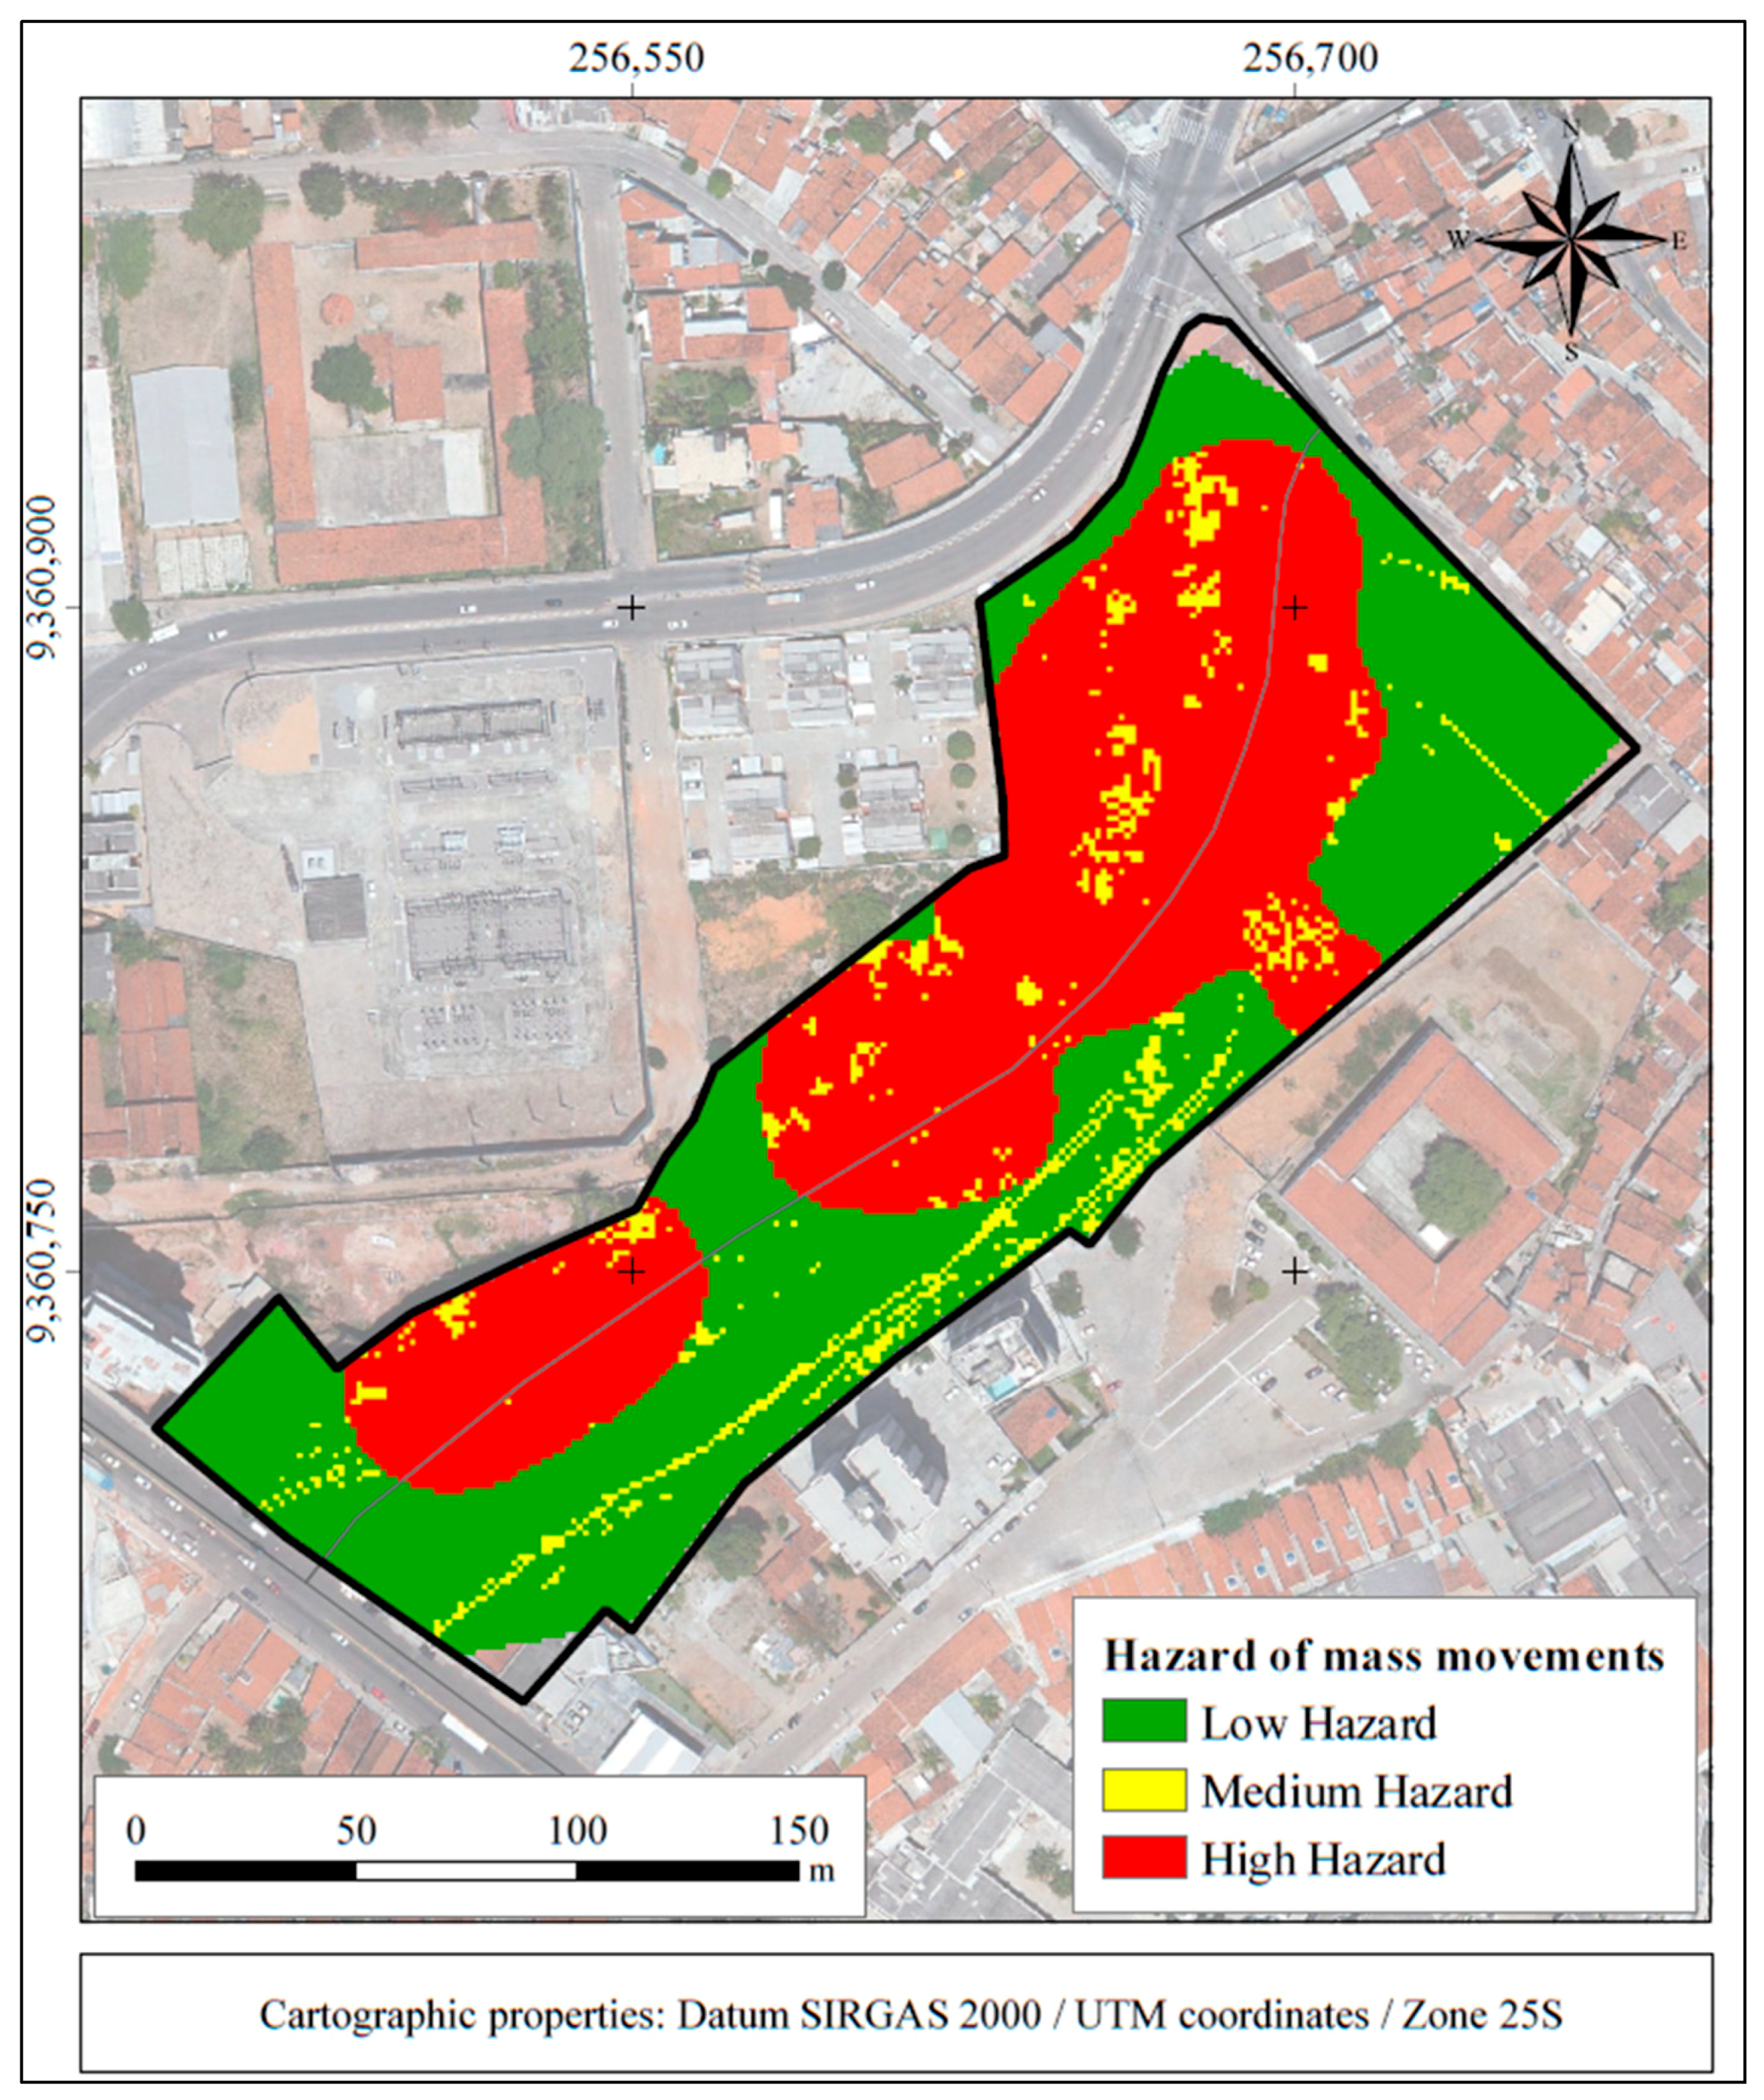
3.2.1. Hazard Map
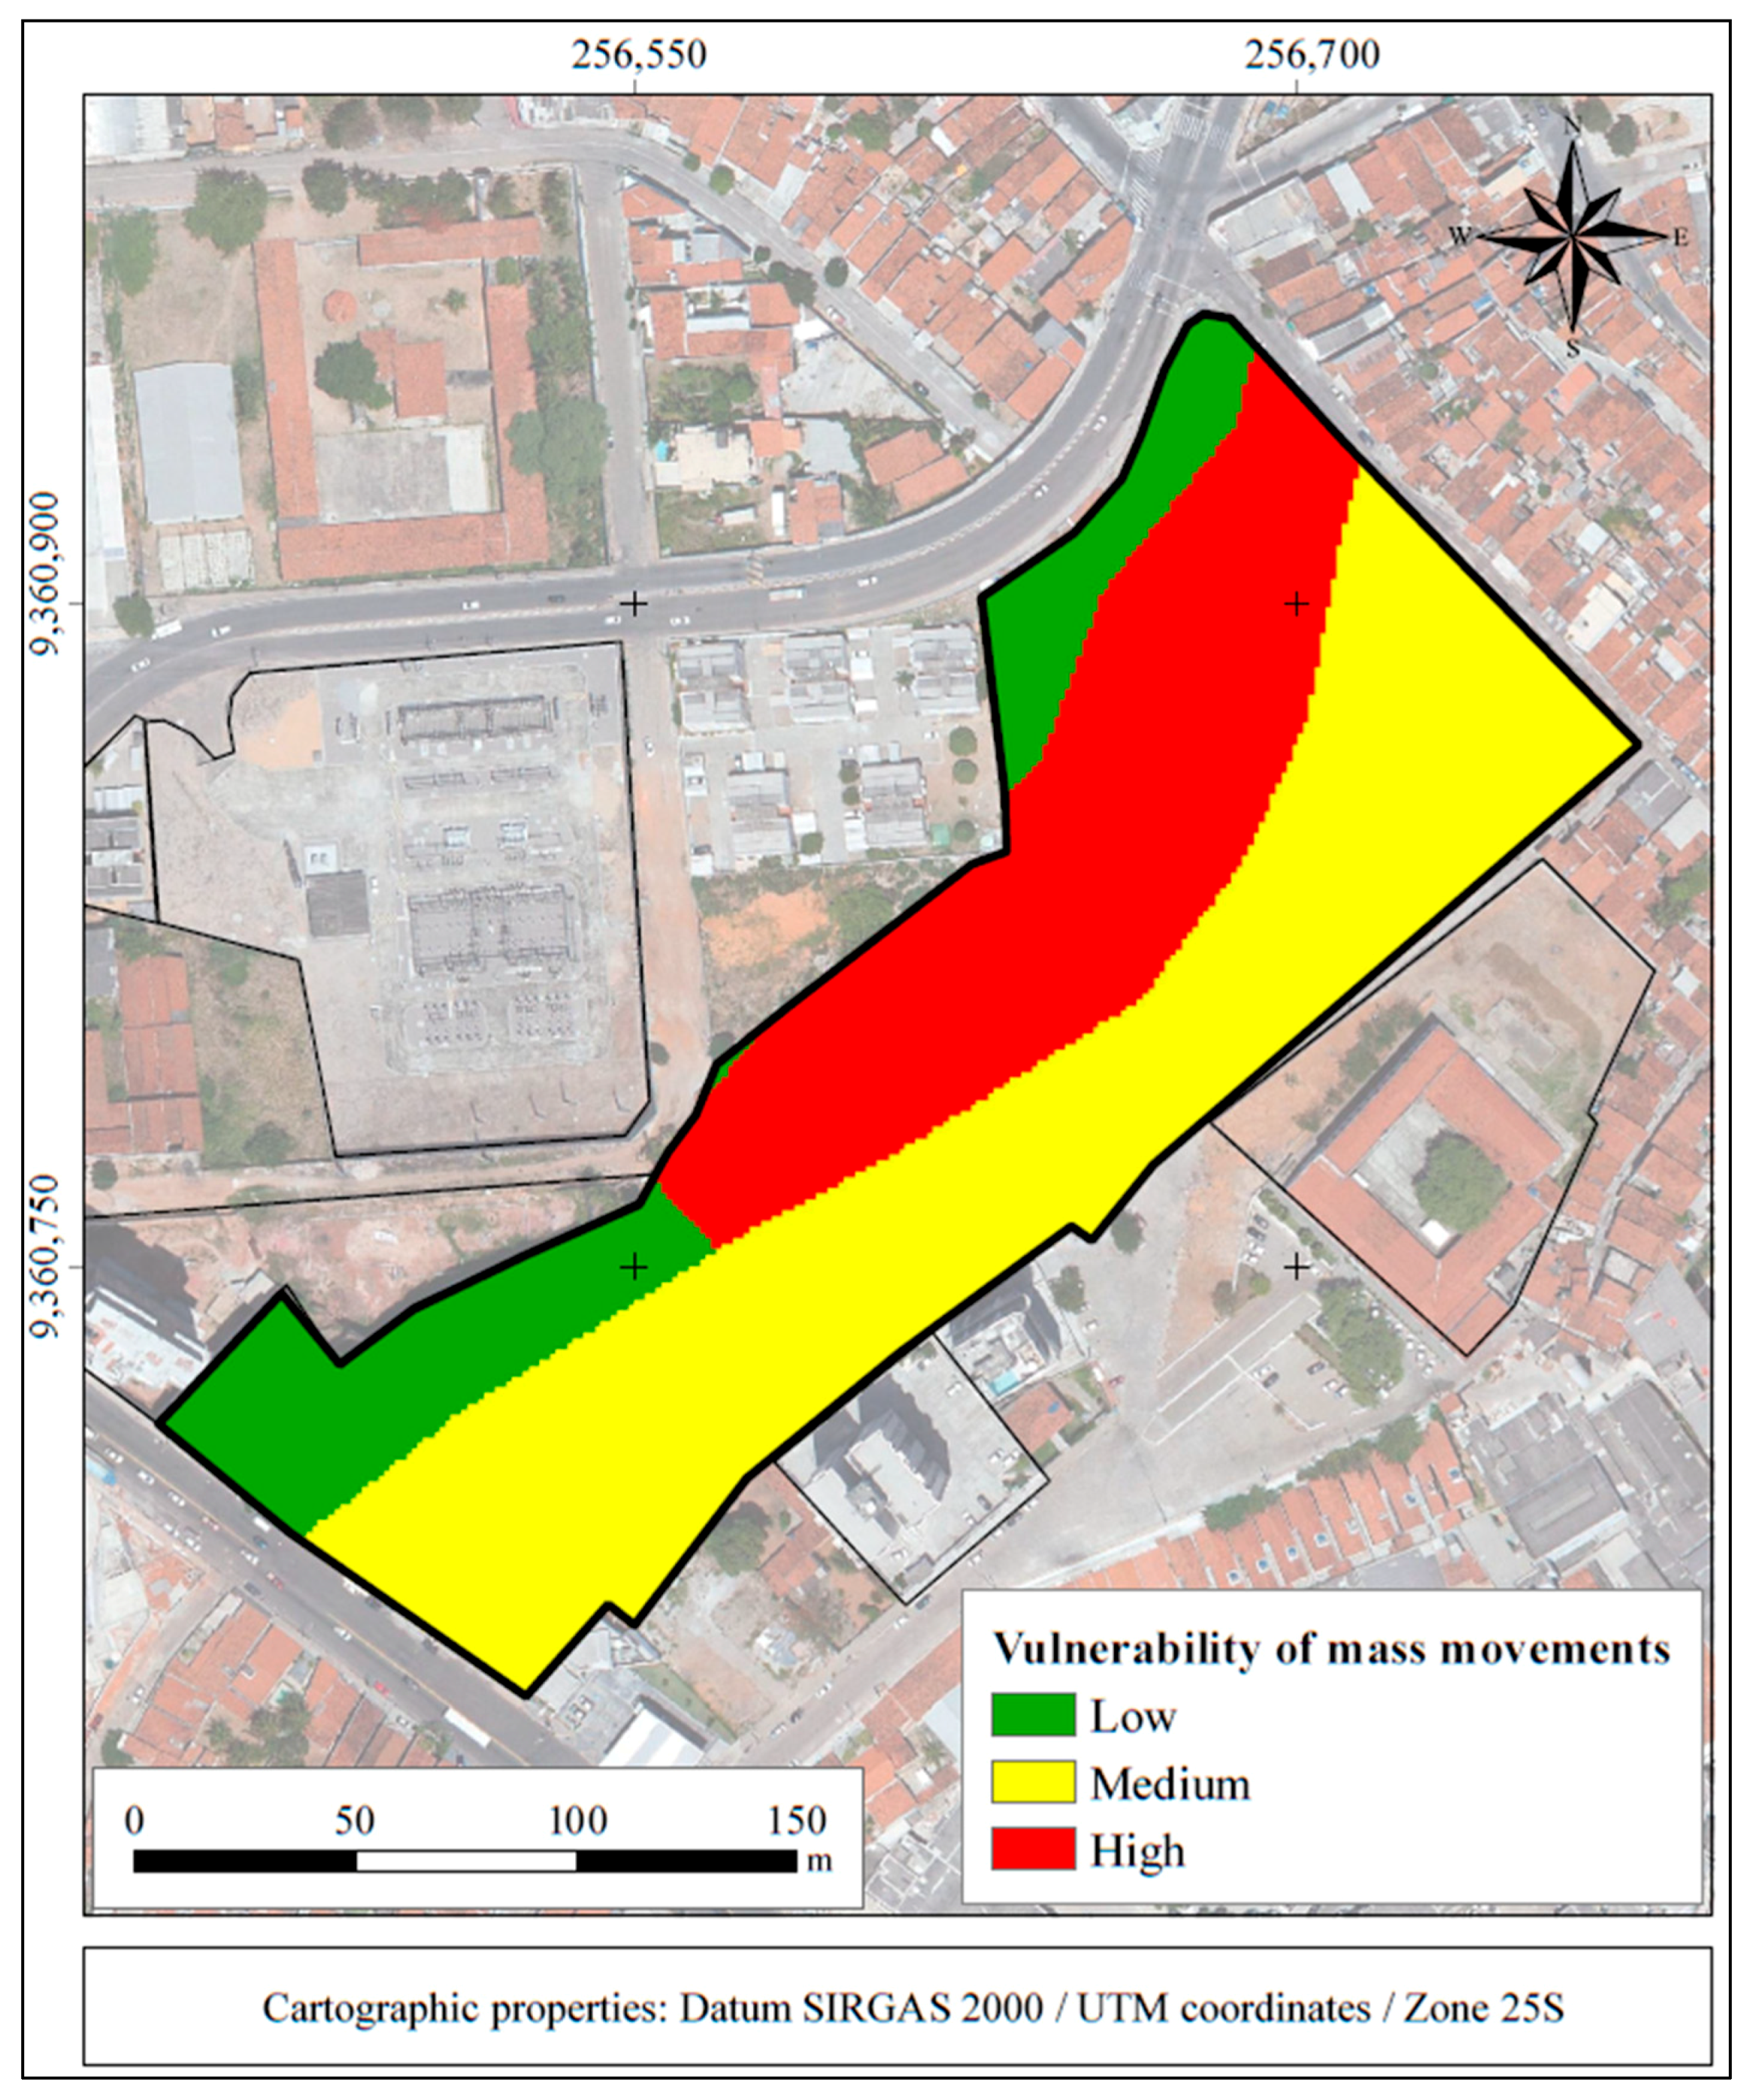
3.2.2. Vulnerability Map
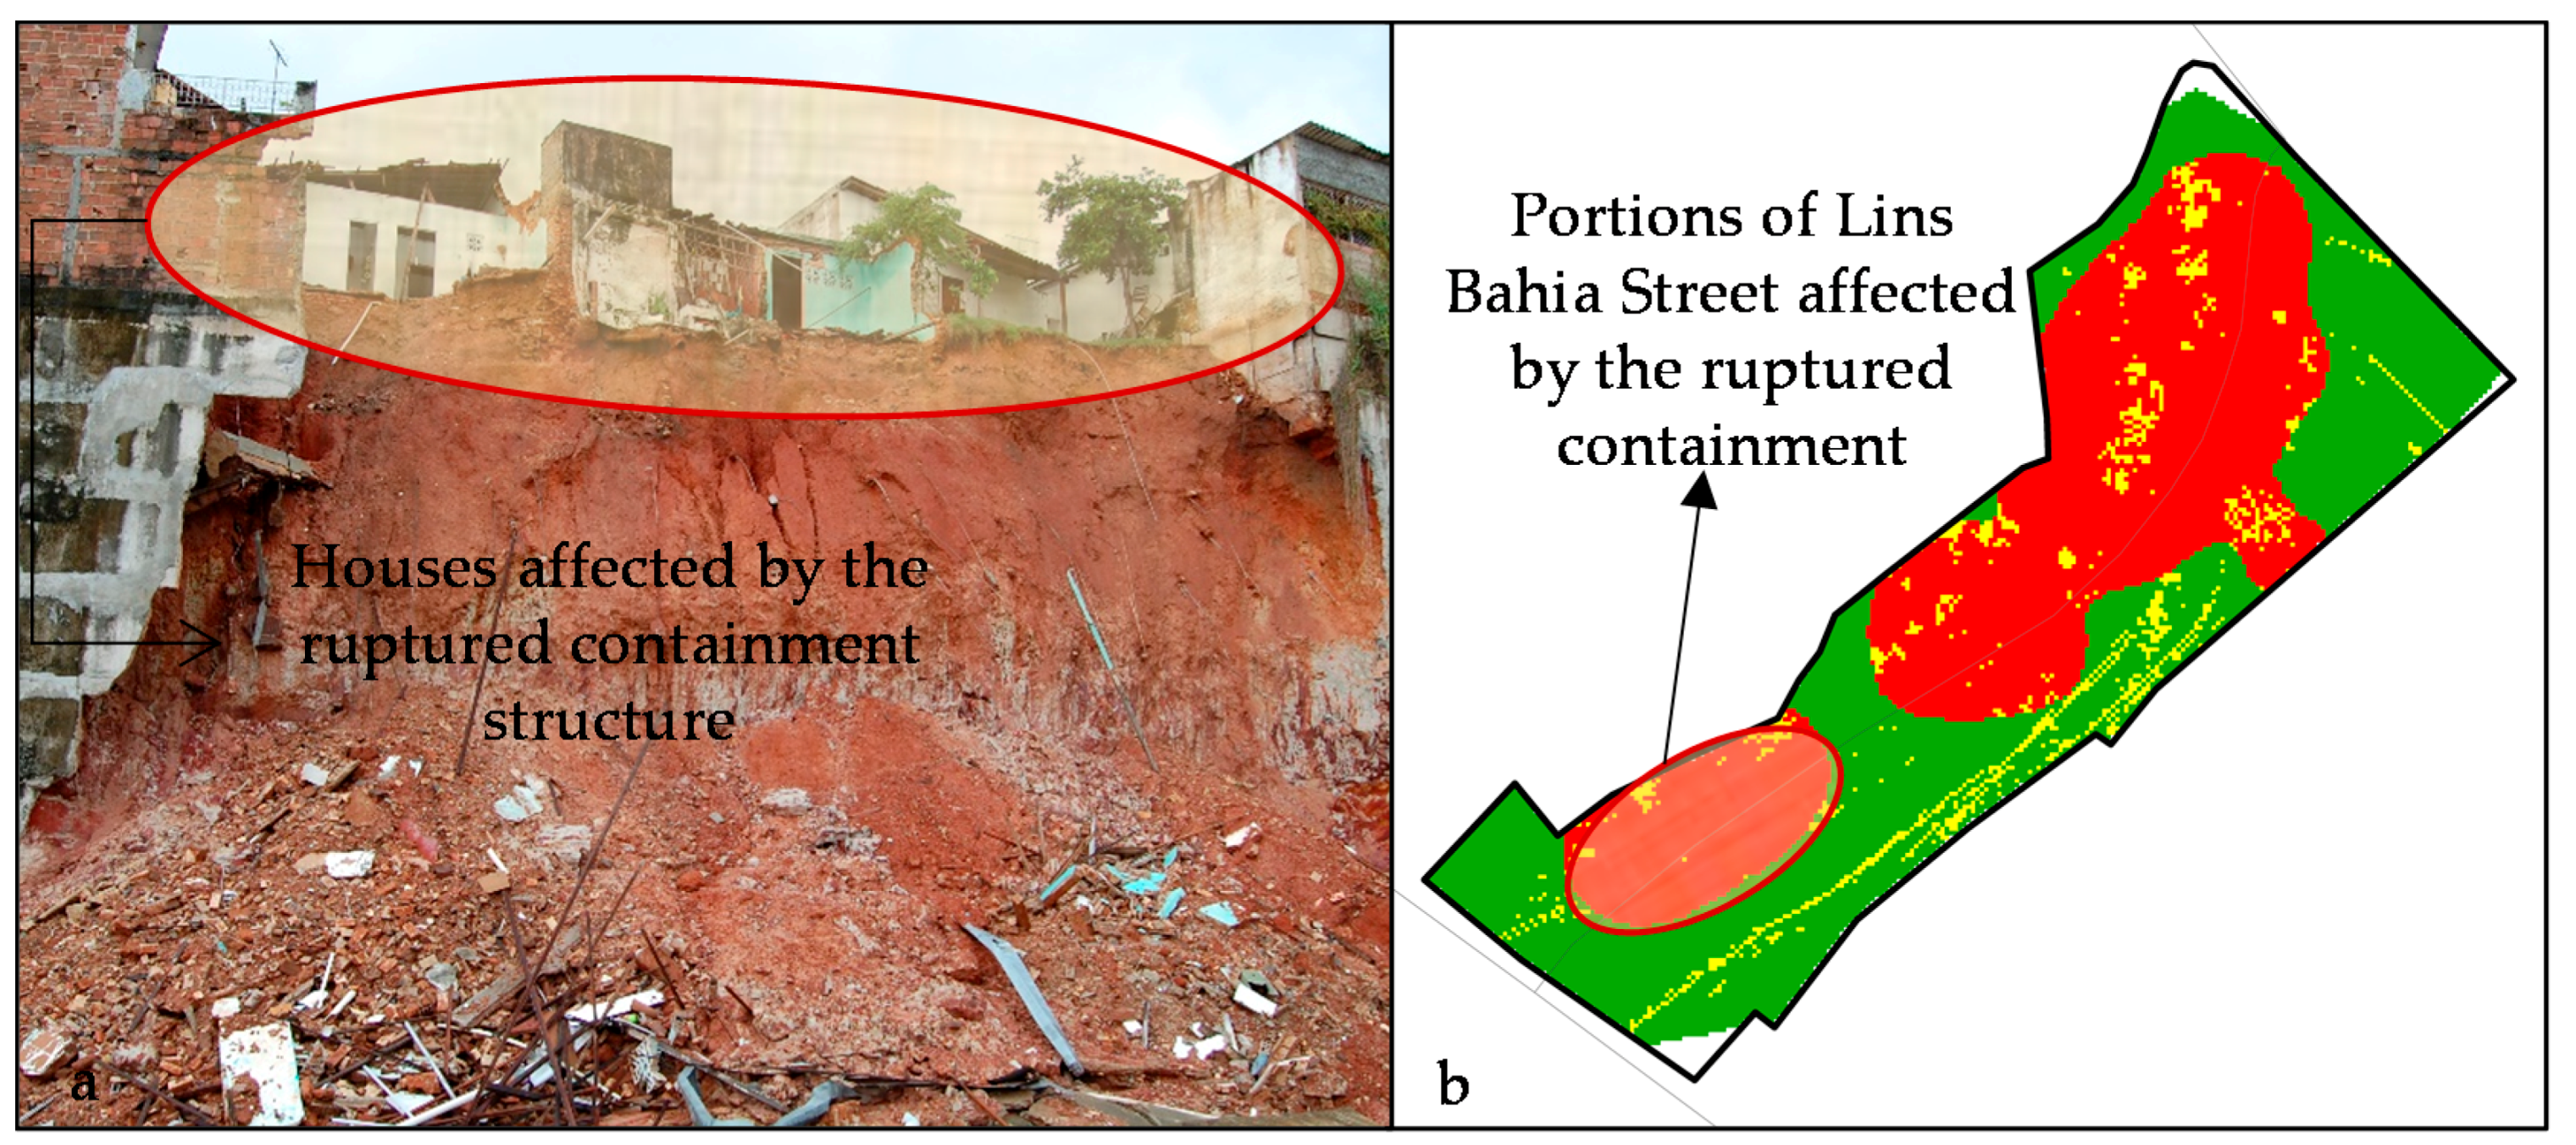
3.2.3. Risk Map
Author Contributions
Funding
Acknowledgments
Conflicts of Interest
References
- International Federation of Red Cross and Red Crescent Societies. World Disasters Report Focus on Urban Risk. 2010. Available online: https://www.ifrc.org/en/publications-and-reports/world-disasters-report/wdr2010// (accessed on 17 September 2020).
- Universidade Federal de Santa Catarina; Centro Universitário de Estudos e Pesquisas sobre Desastres. Atlas Brasileiro de Desastres Naturais: 1991 a 2012, 2nd ed.; CEPED UFSC: Florianópolis, Brazil, 2013. [Google Scholar]
- Tominaga, L.K.; Santoro, J.; Amaral, R. Desastres Naturais: Conhecer Para Prevenir, 1st ed.; Instituto Geológico: São Paulo, Brazil, 2009. [Google Scholar]
- Santos Junior, O.F.; Severo, R.N.F.; Freitas Neto, O. Movimentos de massas em encostas na cidade de Natal/RN. In Willy Lacerda: Doutor no Saber e Na Arte De Viver, 1st ed.; Outras Letras: Rio de Janeiro, Brazil, 2016; Volume 1, pp. 468–478. [Google Scholar]
- Australian Geomechanics Society; Sub-Committee on Landslide Risk Management. Landslide Risk Management Concepts and Guidelines. Aust. Geomech. J. News Aust. Geomech. Soci. 2002, 37, 1–44. [Google Scholar]
- Van Westen, C.J.; Van Asch, T.W.J.; Soeters, R. Landslide hazard and risk zonation—Why is it still so difficult? Bull. Eng. Geol. Environ. 2005, 65, 167–184. [Google Scholar] [CrossRef]
- Fell, R.; Ho, K.K.S.; Lacasse, S.; Leroi, E. State of the Art: A framework for landslide risk assessment and management. In Landslide Risk Management; Hungr, O., Feel, R., Couture, R., Eberhardt, E., Eds.; Taylor and Francis Group: London, UK, 2005; pp. 3–26. [Google Scholar]
- Abella, E.A.C.; Van Westen, C.J. Generation of a landslide risk index map for Cuba using spatial multi-criteria evaluation. Landslides 2007, 4, 311–325. [Google Scholar] [CrossRef]
- Faria, D.G.M. Mapeamento de Perigo de Escorregamentos em Áreas Urbanas Precárias Brasileiras Com a Incorporação do Processo de Análise Hierárquica (AHP). Ph.D. Thesis, University of São Paulo, São Paulo, Brazil, 2011. [Google Scholar]
- Faria, D.G.M.; Augusto Filho, O. Aplicação do Processo de Análise Hierárquica (AHP) no Mapeamento de Perigo de Escorregamentos em Áreas Urbanas. Rev. Inst. Geol. 2013, 34, 23–44. [Google Scholar] [CrossRef]
- Franek, J.; Kresta, A. Judgment Scales and Consistency Measure in AHP. Procedia Econ. Financ. 2014, 12, 164–173. [Google Scholar] [CrossRef]
- Ministério das Cidades. Instituto de Pesquisas Tecnológicas—IPT. Mapeamento de Riscos em Encostas e Margem de Rios; Ministério das Cidades: Brasilia, Brazil; Instituto de Pesquisas Tecnológicas—IPT: Brasília, Brazil, 2007. [Google Scholar]
- Saaty, T.L. How to Make a Decision: The Analytic Hierarchy Process. Eur. J. Oper. Res. 1990, 48, 9–26. [Google Scholar] [CrossRef]
- Saaty, T.L. Decision making with the analytic hierarchy process. Int. J. Serv. Sci. 2008, 1, 83–98. [Google Scholar] [CrossRef]
- Saaty, R.W. The analytic hierarchy process—What it is and how it is used. Math. Model. 1987, 9, 161–176. [Google Scholar] [CrossRef]
- Sobrinha, M.D.P.B.; Duarte, M.C.S.; Lélis, R.L.S.; Wanderley, M.U. Vivências, troca de saberes e formação cidadã para o direito à cidade: Experiências do Projeto Motyrum—UFRN, de educação popular em direitos humanos, na Comunidade do Jacó, em Natal/RN. In Proceedings of the Anais XVIII ENANPUR 2019, Encontro Nacional da Associação Nacional de Pós-Graduação e Pesquisa em Planjemanento Urbano e Regional, Natal, Brazil, 27–31 May 2019. [Google Scholar]
- Saaty, T.L. A scaling method for priorities in hierarchical structures. J. Math. Psychol. 1977, 15, 234–281. [Google Scholar] [CrossRef]
- Instituto Brasileiro de Geografia e Estatística—IBGE. Características da População e dos Domicílios: Resultados do Universo; IBGE: Rio de Janeiro, Brazil, 2011. [Google Scholar]
- Wiggers, M.M. Zoneamento das Áreas de Risco a Movimentos de Massa no Perímetro Urbano do Município de Caxias do Sul (RS). Master’s Thesis, Federal University of Rio Grande do Sul, Porto Alegre, Brazil, 2013. [Google Scholar]
- Alheiros, M.M.; Souza, M.A.A.; Bitoun, J.; Medeiros, S.M.G.M.; Amorim Júnior, W.M. Manual de Ocupação dos Morros da Região Metropolitana do Recife; FIDEM: Recife, Brazil, 2003. [Google Scholar]
- Lee, S. Current and Future Status of GIS-based Landslide Susceptibility Mapping: A Literature Review. Korean J. Remote Sens. 2019, 35, 179–193. [Google Scholar] [CrossRef]
- Shano, L.; Raghuvanshi, T.K.; Meten, M. Landslide susceptibility evaluation and hazard zonation techniques—A review. Geoenviron. Disasters 2020, 7, 1–19. [Google Scholar] [CrossRef]
- Cascini, L. Applicability of landslide susceptibility and hazard zoning at different scales. Eng. Geol. 2008, 102, 164–177. [Google Scholar] [CrossRef]
- Santos, O.F., Jr.; Jesus, A.P.; Macêdo, C.M.H.; Amaral, R.F. Mapeamento de Áreas de Risco de Movimentos de Massas em Encostas Formadas por Dunas na Cidade de Natal. In Proceedings of the Anais XI Congresso Brasileiro de Mecânica dos Solos e Engenharia Geotécnica, Brasília, Brazil, 6–10 November 1998; pp. 521–527. [Google Scholar]
- Barbosa, N.; Taquez, D.; Santos, O., Jr.; Freitas Neto, O.; Scudelari, A. The Effect of Basal Erosion on Sea Cliff Stability. J. Coast. Res. 2020, 95, 362–366. [Google Scholar] [CrossRef]
- Silva, B.M.F.; Santos , O.F., Jr.; Neto, O.F.; Scudelari, A.C. Erosão em Falésias Costeiras e Movimentos de Massa no Rio Grande do Norte, Nordeste do Brasil. Geociências 2020, 39, 447–461. [Google Scholar] [CrossRef]
- Souza, P.L., Jr.; Santos, O.F., Jr.; Fontoura, T.B.; Freitas Neto, O. Drained and Undrained Behavior of an Aeolian Sand from Natal, Brazil. Soils Rocks 2020, 43, 263–270. [Google Scholar] [CrossRef]
- Lorentz, J.F.; Calijuri, M.L.; Marques, E.G.; Baptista, A.C. Multicriteria analysis applied to landslide susceptibility mapping. Nat. Hazard 2016, 83, 41–52. [Google Scholar] [CrossRef]
- El Jazouli, A.; Barakat, A.; Khellouk, R. GIS-multicriteria evaluation using AHP for landslide susceptibility mapping in Oum Er Rbia high basin (Morocco). Geoenviron. Disasters 2019, 6, 3. [Google Scholar] [CrossRef]
- Prefeitura do Natal; Secretaria Municipal de Meio Ambiente e Urbanismo—SEMURB. Plano Municipal de Gerenciamento de Riscos: Relatório Final—Volume 1; Acquatool Consultoria: Natal, Brazil, 2008. [Google Scholar]
- Silva, E.E.S.; Almeida, L.Q.; Macedo, Y.M. Uso de metodologia analítica para mapeamento de exposição ao risco de deslizamento na comunidade de São José do Jacó Natal—RN. Rev. Geociênc. Nordeste 2016, 1, 58–73. [Google Scholar]
- Bezerra, L.T.V. Mapeamento de Risco/perigo de Movimentos de Massa e Avaliação da Estabilidade das Encostas na Comunidade São José do Jacó, em Natal/RN. Bachelor’s Thesis, Federal University of Rio Grande do Norte, Natal, Brazil, 2016. [Google Scholar]
- Zhou, S.; Chen, G.; Fang, L.; Nie, Y. GIS-Based Integration of Subjective and Objective Weighting Methods for Regional Landslides Susceptibility Mapping. Sustainability 2016, 8, 334. [Google Scholar] [CrossRef]


| Risk Index (RI) | (DR) |
|---|---|
| Low | |
| Medium | |
| High |
| Risk Indicators | Weights (%) | Classes | Weights (%) |
|---|---|---|---|
| Slope height | 3.21% | H ≤ 10 m | 8.82% |
| 10 m < H < 20 m | 24.31% | ||
| H ≥ 20 m | 66.87% | ||
| Slope angle | 5.79% | A ≤ 10° | 8.33% |
| 10° < A < 20° | 19.32% | ||
| A ≥ 20° | 72.35% | ||
| Plant morphology | 2.11% | Convex | 12.01% |
| Rectilinear | 13.43% | ||
| Concave | 74.56% | ||
| Profile morphology | 2.15% | Convex | 20.00% |
| Rectilinear | 20.00% | ||
| Concave | 60.00% | ||
| Land use/cover | 8.63% | Arboreal | 6.38% |
| Field/crop | 6.71% | ||
| Urban cover | 30.77% | ||
| Exposed soil | 56.15% | ||
| Presence of surface water | 2.22% | None/Low concentration | 10.62% |
| Medium concentration | 26.05% | ||
| High concentration/Seepage line visible | 63.33% | ||
| Water emergence in the hillside profile | 11.69% | Observed | 87.50% |
| Not observed | 12.50% | ||
| Instability features | 19.90% | Observed | 87.50% |
| Not observed | 12.50% | ||
| Substrate material | 11.51% | Coastal plant eolian deposits | 7.39% |
| Coastal non-plant eolian deposits | 46.56% | ||
| Sandy and sandy-clay deposits | 19.58% | ||
| Fluvial-marine deposits | 14.42% | ||
| Barrier group | 12.06% | ||
| Geological structure | 12.16% | Favorable to stability | 8.82% |
| Unfavorable | 66.87% | ||
| Not observed | 24.31% | ||
| Demographic density | 20.64% | Inhabited area | 4.17% |
| 0 inhab/ha < (DEN) ≤ 50 inhab/hectare | 13.30% | ||
| 50 inhab/ha < (DEN) ≤ 300 inhab/hectare | 26.76% | ||
| (DEN) > 300 inhab/hectare | 55.77% |
| Sensitivity Analysis | |
|---|---|
| Matrix order | 11.00 |
| λmax 1 | 12.09 |
| CI 2 | 0.1086 |
| CR 3 | 7.10% |
Publisher’s Note: MDPI stays neutral with regard to jurisdictional claims in published maps and institutional affiliations. |
© 2020 by the authors. Licensee MDPI, Basel, Switzerland. This article is an open access article distributed under the terms and conditions of the Creative Commons Attribution (CC BY) license (http://creativecommons.org/licenses/by/4.0/).
Share and Cite
Bezerra, L.; Neto, O.d.F.; Santos, O., Jr.; Mickovski, S. Landslide Risk Mapping in an Urban Area of the City of Natal, Brazil. Sustainability 2020, 12, 9601. https://doi.org/10.3390/su12229601
Bezerra L, Neto OdF, Santos O Jr., Mickovski S. Landslide Risk Mapping in an Urban Area of the City of Natal, Brazil. Sustainability. 2020; 12(22):9601. https://doi.org/10.3390/su12229601
Chicago/Turabian StyleBezerra, Laddyla, Osvaldo de Freitas Neto, Olavo Santos, Jr., and Slobodan Mickovski. 2020. "Landslide Risk Mapping in an Urban Area of the City of Natal, Brazil" Sustainability 12, no. 22: 9601. https://doi.org/10.3390/su12229601
APA StyleBezerra, L., Neto, O. d. F., Santos, O., Jr., & Mickovski, S. (2020). Landslide Risk Mapping in an Urban Area of the City of Natal, Brazil. Sustainability, 12(22), 9601. https://doi.org/10.3390/su12229601