Article

Standardized Recipes and Their Influence on the Environmental Impact Assessment of Mixed Dishes: A Case Study on Pizza

by
Katerina S. Stylianou
1,*,
Emily McDonald
1,
Victor L. Fulgoni III
2 and
Olivier Jolliet
1
1
Department of Environmental Health Sciences, School of Public Health, University of Michigan, Ann Arbor, MI 48109, USA
2
Nutrition Impact, LLC, 9725 D Drive North, Battle Creek, MI 49014, USA
*
Author to whom correspondence should be addressed.
Sustainability 2020, 12(22), 9466; https://doi.org/10.3390/su12229466
Submission received: 20 October 2020 / Revised: 9 November 2020 / Accepted: 9 November 2020 / Published: 13 November 2020
(This article belongs to the Special Issue Drivers of Environmental Impacts from Agricultural Production Systems)

Abstract

:
Food and diet life cycle assessment (LCA) studies offer insights on the environmental performance and improvement potential of food systems and dietary patterns. However, the influence of ingredient resolution in food-LCAs is often overlooked. To address this, four distinct decomposition methods were used to determine ingredients for mixed dishes and characterize their environmental impacts, using the carbon footprint of the U.S. daily pizza intake as a case study. Pizza-specific and daily pizza intake carbon footprints varied substantially between decomposition methods. The carbon footprint for vegetarian pizza was 0.18–0.45 kg CO2eq/serving, for meat pizza was 0.56–0.73 kg CO2eq/serving, and for currently consumed pizzas in the U.S. (26.3 g/person/day; 75 pizzas types) was 0.072–0.098 kg CO2eq/person/day. These ranges could be explained by differences in pizza coverage, ingredient resolution, availability of ingredient environmental information, and ingredient adjustability for losses between decomposition methods. From the approaches considered, the USDA National Nutrient Database for Standard Reference, which reports standardized food recipes in relative weights, appears to offer the most appropriate and useful food decompositions for food-LCAs. The influence and limitations of sources of reference flows should be better evaluated and acknowledged in food and diet LCAs.

1. Introduction

Food production and consumption have a significant contribution to environmental impacts that compromise the quality of air, soil, and water [1]. As environmental changes due to anthropogenic causes become more severe, there is an increased need to better characterize the contribution of food systems in order to identify solutions that reduce this contribution [2]. For more than 30 years, life cycle assessment (LCA) has been used to study food systems and evaluate the environmental performance of foods and diets [3]. Despite significant progress in food LCA [4], there is limited availability of necessary environmental data, such as life cycle inventories (LCIs), to evaluate meals or mixed dishes. Mixed dishes are defined as a mixture of ingredients with varying proportions (multi-ingredient) and are currently providing a large portion of calories in modern diets [5]. Due to the lack of mixed dishes LCIs, the environmental impacts of mixed dishes are understudied and possibly under- or over-estimated in the limited number of studies available in the literature, since they rely on LCIs of main agricultural commodities and simplified assumptions [6,7].
Studies that characterize the environmental impacts of mixed dishes typically focus on a limited number of foods and have to employ different approaches to determine their ingredient composition [8,9,10,11]. Methods of decomposing mixed dishes into individual ingredients include food-specific recipes obtained from labels [12] and manufacturers [13], meal-kits [14], modelled/scenario recipes [9,15], and typical recipes [16]. While these methods are useful when studying a single food or small number of foods, investigating the environmental impacts of diverse mixed dishes on a larger-scale requires consistent information that is time-consuming to collect and often might not be easily accessible. Furthermore, the use of different food decomposition approaches can lead to incomparable estimates of environmental impacts. There is therefore a need for harmonizing the environmental evaluations of mixed dishes, starting with how reference flows are determined.
Standardized food recipe databases are developed by national agencies, such as the U.S. Department of Agriculture (USDA), to assess the nutritional quality of diets. Recently, two such databases have been utilized in evaluating the environmental impacts of the U.S. diet by decomposing dietary patterns to ingredient-commodities. More specifically, Heller et al. (2018) used the Food Commodity Intake Database (FCID) to estimate the environmental impacts of dietary patterns reported in the National Health and Nutrition Examination Survey (NHANES) [17]. Conrad et al. (2018) used the same database to investigate diet-level nutritional and environmental trade-offs associated with food losses in the U.S. [18]. Tichenor Blackstone et al. (2018) used the Food Intakes Converted to Retail Commodities Database (FICRCD) to quantify the environmental impacts associated with different healthy dietary patterns recommended in Dietary Guidelines for Americans (DGA) [19]. While these databases offer a consistent source of standardized food recipes that could be used in determining reference flows for both single-ingredient and mixed dishes, they have never been used to evaluate food-specific environmental impacts associated with mixed dishes.
As the influence of food recipes (e.g., ingredient composition) as a methodological limitation in food LCA is often overlooked, the aim of this paper was to investigate and compare the potential of available standardized food recipe databases as a source intermediary flows for mixed dishes. More specifically, this analysis aims to assess and compare the respective environmental impact estimated obtained using four such databases as decomposition methods for mixed dishes and demonstrate them using a case study on the carbon footprint associated with the average pizza consumption in the U.S. diet, also differentiating between meat and vegetarian pizzas.

2. Materials and Methods

The cradle-to-gate carbon footprint of the type-specific (meat vs. vegetarian) and daily consumption of pizzas in the U.S. diet were estimated and compared using four different decomposition methods to evaluate their applicability potential in LCA. The following sections describe the methodology, data, and the assumptions used in this analysis.

2.1. Pizza in the U.S. Diet

The average consumption of pizza in the U.S. diet was determined using the NHANES 2011–2016 database [5]. NHANES is a nationally representative, cross-sectional survey administered every two years to U.S. citizens that records daily food intakes. The population average of the daily pizza intake was determined by the day 1 reported intake in three survey cycles (2011–2012, 2013–2014, and 2015–2016) for participants older than 25 years old, excluding pregnant and lactating women (N = 13,332). Pregnant and lactating women were excluded from this analysis due to the special diet that they typically follow that is likely not to be representative of the average population, especially in the case for pizza that often contains processed meat—a food item that is often avoided during pregnancy and lactation [20,21]. Furthermore, this analysis focused on the diets of adults >25 years old in alignment with dietary risk factors by the Global Burden of Disease reports [22], which is critical for the evaluation of healthy and sustainable foods [23,24,25,26]. All the consumed pizza types in the database were identified by food descriptions, which included the word “pizza.” From the 77 foods identified, two items described as “pizza toppings” were excluded from the analysis as they represented individual ingredients (see Supplementary Materials Table S1).

2.2. Life Cycle Assessment Framework

For the pizza-specific analysis of the meat and vegetarian pizzas, a functional unit (FU) of pizza serving size (140 g) was retained. The pizza serving size was determined based on the reference amounts customarily consumed (RACC) servings defined by the U.S. Food and Drug Administration [27]. For the average consumption analysis, the FU was defined as the average daily pizza intake in the U.S. The system boundary for the life cycle assessments were cradle-to-farm gate or cradle-to-processing facility gate.

2.3. Environmental Assessment

2.3.1. Food Decomposition

Four publicly available databases were identified that report standardized food recipes for the foods in the NHANES database. Serving as a decomposition (or deconstruction) approach, each database was used to determine the intermediary flows for individual pizzas by identifying pizza ingredients and their quantities in g per serving size of pizza.
The four decomposition methods varied in ingredient resolution and loss/waste coverage. First, the Food Patterns Equivalents Database 2015–2016 (FPED) deconstructs foods into 37 consumption-level food patterns that are measured in serving equivalents such as cups, tablespoons, ounces, drinks, and grams [28]. Second, the Food Intakes Converted to Retail Commodities Databases 2003–2008 (FICRCD) separates foods into 65 retail-level commodities [29]. Third, the Food Commodity Intake Database 2005–2010 (FCID) breaks down foods into ~500 consumption-level food commodities [30]. Finally, the USDA National Nutrient Database for Standard Reference, Release 28 (SR) is a food composition database that contains ~3200 consumption-level food items [31]. For the purpose of this analysis, all database components are referred to as ingredients.
While FICRCD can directly determine the ingredient composition of pizzas in mass amounts, additional steps were required for the use of the FPED, SR, and FCID databases. In particular, food patterns in FPED that were originally reported in serving equivalents were converted into mass amounts in g. Fruits, vegetables, and dairy were converted from cup equivalents to g using the average weight of one cup of food within the respective pattern. In addition, grain and protein food groups were converted from ounce equivalents to amounts in g based on the database’s definitions. Added sugar teaspoons were converted into g based on a weight equivalent of 4.2. A summary of all the weights of serving equivalents used in this analysis are available in supporting information (Supplementary Materials, Table S2). For the SR, previous versions of the database were employed to further decompose processed and prepared food items reported in the latest version of the database. For example, the newest pizza compositions in the SR include multi-ingredient food items such as “fast food, pizza chain, 14” pizza, cheese topping, regular crust” along with pizza toppings that are typically single-ingredient items. In some occasions where previous versions of SR did not allow for deconstruction of multi-ingredient food items, information from similar items in SR or foods in NHANES was used based on their description (Table S3). Finally, information from FPED was used to determine dairy ingredients in FCID. More specifically, FCID reports the total dairy in foods using “Milk, water”, “Milk, nonfat solids”, and “Milk, fat”, which is impractical in determining dairy ingredients. Therefore, the total dairy in the food according to the FCID was reallocated into dairy-specific ingredients (e.g., milk, yogurt, cheese) using the dairy repartition in FPED. Specifically for this analysis, the total amount of dairy in pizzas according to the FCID decomposition was assumed to be cheese (unspecified type).
All consumption-level ingredient amounts determined from the FPED, FCID, and SR decompositions were converted into retail-level amounts for consistency and comparability with the estimates from the FICRCD database. To do that, consumption-to-retail conversion factors were used as reported in the FICRCD database. These factors account for ingredient-specific mass loss or gain during preparation, cooking, and processing, as well as non-edible parts. For FCID and SR, these conversion factors were matched directly with ingredients. For FPED, conversion factors were first classified into food groups and then aggregated to estimate food group averages (Supplementary Materials, Table S2). These classifications were generic and were not adapted for this case study.
Detailed descriptions of the four methods are summarized in Table 1. The underlying decompositions of individual pizzas used in this analysis for SR (Tables S3 and S4), FPED (Table S5), FCID (Table S6), and FICRCD (Table S7) are available in supplementary materials.

2.3.2. Life Cycle Inventory

All ingredients identified by the four decomposition methods were linked with environmental life cycle inventory (LCI) datasets. LCIs quantify the inputs and outputs of a given product system throughout its life cycle [32]. These datasets were used to quantify food production related life cycle greenhouse gases emissions (e.g., CO2, CH4, etc.).
Ingredients were matched with available LCIs based on similarity. To maximize the coverage of LCIs in our analysis three databases were employed. Listed in the order of priority, LCIs were obtained from ecoinvent v3.2 [33], the World Food LCA Database v3.1 [34], and the ESU World Food LCA database [35]. Since LCIs are typically region-specific, representing the region of production, U.S.-specific LCIs were prioritized, followed by Canada, and “rest of the world” (RoW) or global (GLO) LCIs. Averages or proxy LCIs were used when direct match between an ingredient and a LCI was not possible, e.g., for “ingredients” that represented food groups such as fruits or for ingredients that a LCI was not available. Proxies were selected based on production system similarities.
Overall, to test the ability of each method for high throughput decomposition food-specific knowledge was not considered in matching ingredients with LCIs, meaning that matching was not adapted to be specific to well-known pizza ingredients. For example, when cheese (unspecified type) was identified as an ingredient it was matched with the average of available cheese-LCIs and not adapted to match with a mozzarella-LCI, which is specific to pizzas.

2.3.3. Environmental Life Cycle Impact Assessment

Carbon footprints were estimated using Impact World+ v1.4 [36] at the midpoint level, representing the shorter-term global warming potential over the first 100 years after emission (GWP100).

3. Results

3.1. Pizza-Specific Analysis

3.1.1. Pizza-Specific Decomposition

The decomposition of vegetarian (‘Pizza with cheese and extra vegetables, medium crust’) and meat (‘Pizza with extra meat, medium crust’) pizzas are summarized in Table 2 (for detailed ingredients see Table S8). The vegetarian pizza chosen was representative of “extra vegetable” pizzas that are topped with double the amount of vegetables compared to all other pizzas, while the meat pizza chosen was representative of the “extra meat” pizzas that typically contain three times the meat of all other pizzas. Each decomposition method appeared to identify similar ingredient categories for the pizzas (except for meat) but the number of ingredients and the quantity of certain ingredients differed substantially between methods. The SR and FCID methods generated similar retail-level quantities for both pizza types that ranged between 143–148 g per serving and ingredient composition had a 100% coverage of the pizzas. While the FCID identified the highest number of ingredients (vegetarian: 44; meat: 48), the SR decomposition allowed for the most direct matching between ingredients and LCIs as well as loss conversion factors (vegetarian and meat: 17). The FPED and FICRCD methods generated higher total retail-level amounts at 200–2019 g per pizza serving, primarily driven from higher quantities of dairy and vegetables. For FPED, the higher dairy estimate was the result of the consumption-level decomposition whereas the higher vegetable estimate was obtained after adjusting for losses. At consumption-level, the FPED decomposition covered 95% and 99% of the consumed vegetarian and meat pizzas, respectively. The FPED (vegetarian: 7; meat: 9) and FICRCD (vegetarian: 7; meat: 8) decompositions generated the lowest ingredient resolution and primarily required the use of average and proxy LCIs and conversion factors (for FPED only).
The main ingredients for the vegetarian pizza were vegetables, grains, and dairy. According to the SR and FCID, vegetables made up ~50% of the consumed vegetarian pizza at retail level. The corresponding estimate from FPED and FICRCD was ~65%. This difference can be explained by the different way that tomato ingredients are captured in each approach. More specifically, the SR and FCID identify canned tomatoes and tomato puree as ingredients whereas in FPED and FICRCD tomato ingredients are ultimately reported as fresh tomatoes after adjusting for losses. Furthermore, the SR and FCID decompositions reported about 20 g of dairy per serving of vegetarian pizza at retail level, while FPED (42 gdairy/serving) and FICRCD (34 gdairy/serving) reported substantially higher amounts. Even though all methods identified cheese as the only dairy ingredient, only the SR approach reported which type of cheese was used (e.g., mozzarella). The retail-level grain ingredients varied substantially between methods and ranged from 17 to 34 g per serving of vegetarian pizza consumed. FPED produced the lowest estimate due to an average loss factor of 0.52 refined grains (e.g., flour, pasta, and rice). Using this average loss factor might underestimate grain estimates in pizzas but it highlight the limitations of low ingredient resolution decompositions methods. The four decomposition approaches also differed in the types and amounts of oils and fats, with FPED reporting more than two times higher estimates.
The main ingredients for the meat pizza were vegetables, meat, grains, and dairy. The decomposition differences between methods that were observed in the vegetarian pizza were also observed for the meat pizza, with the exception of grains and meat. For example, the SR and FCID methods reported 35–40 g vegetables and 21–24 g of dairy per serving of meat pizza at retail, with the FPED (95 gvegetables/serving and 42 gdairy/serving) and FICRCD (107 gvegetables/serving and 44 gdairy/serving) reporting estimated that were two and almost three times higher, respectively. The total amount of grain ingredients determined by the four decomposition methods were similar to those from the vegetarian pizza decomposition, except for the FCID approach reported a higher estimate at 38 g of grains per serving of meat pizza. For this food, an important decomposition difference between methods was observed for meats. All methods reported a total of 28–36 g of meat per serving of meat pizza at retail level. Both the FCID and the FICRCD approaches attribute this meat amount solely to red meat (beef and pork) whereas the SR and FPED allocate this amount between red meat, poultry, and cured meat. For the latter decompositions, the poultry and cured meat estimates are similar between methods. However, the SR reported a red meat estimate that was two times higher than the FPED.

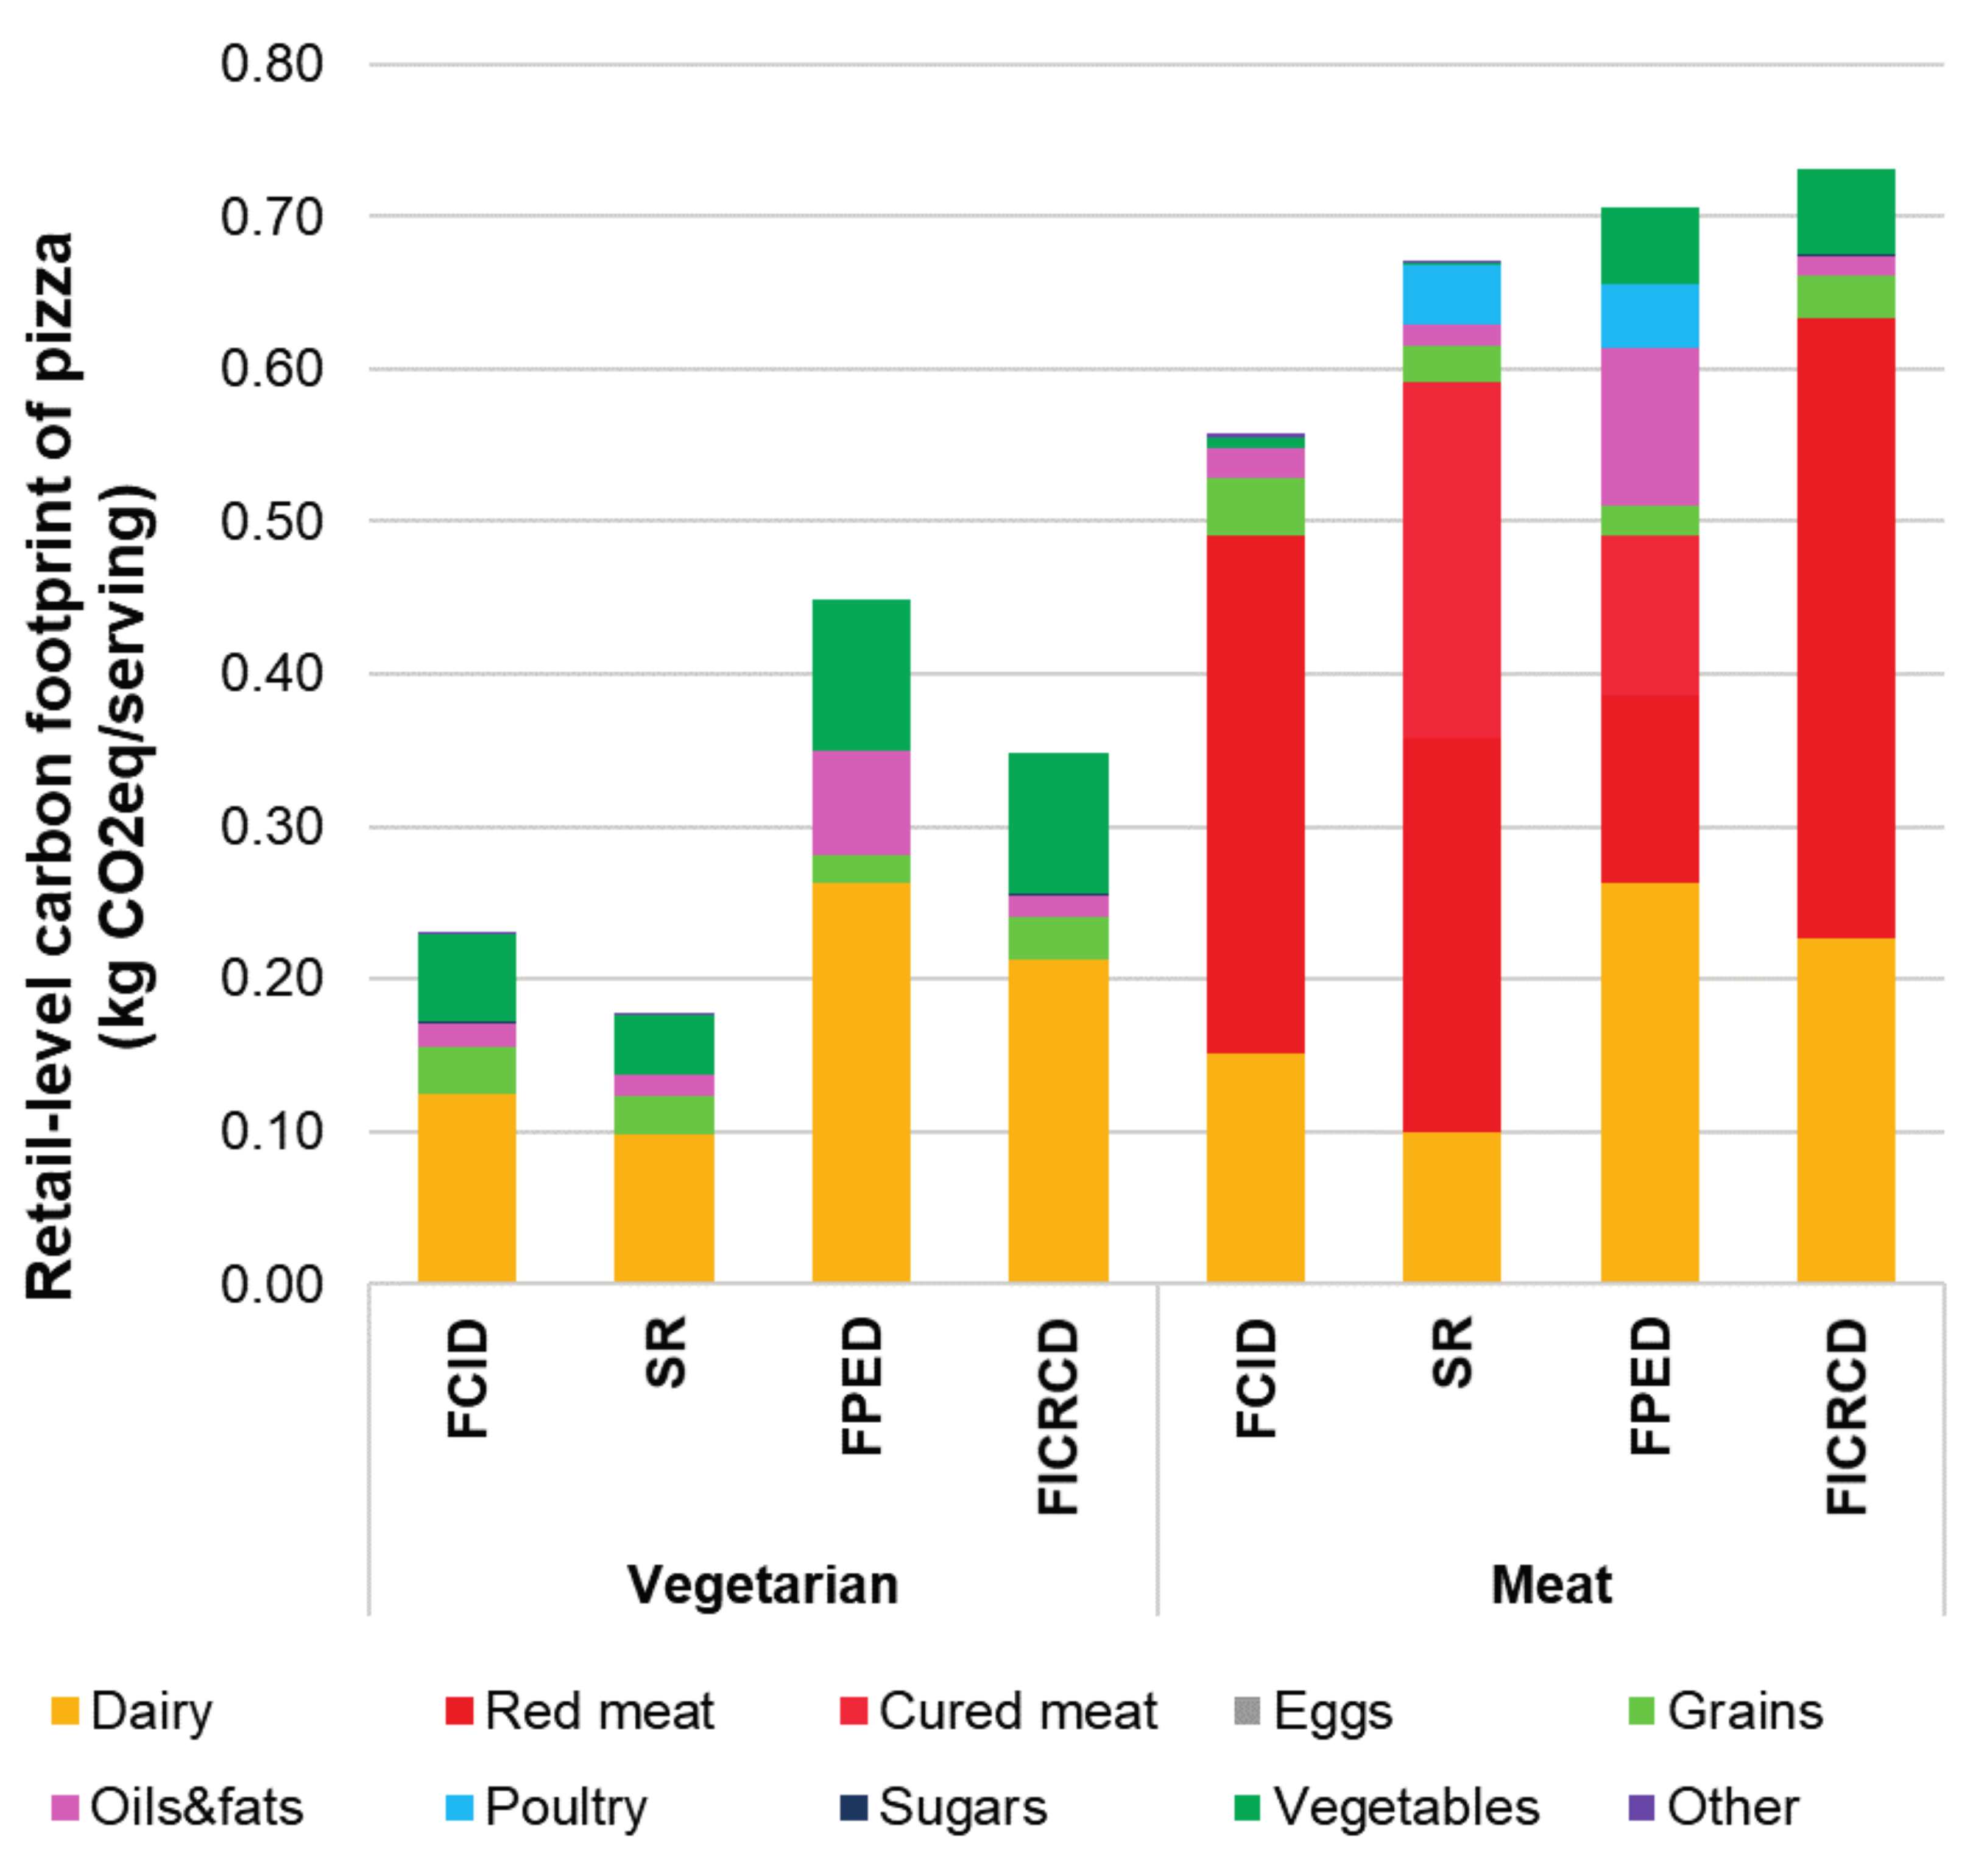
3.1.2. Pizza-Specific Carbon Footprint

The carbon footprints of both the vegetarian and the meat pizzas varied considerably between decomposition methods (Figure 1). The carbon footprint of vegetarian pizza serving was estimated at 0.18 kg CO2eq for SR, 0.23 kg CO2eq for FCID, 0.35 kg CO2eq for FICRCD, and 0.45 kg CO2eq for FPED. The impact was predominantly driven by dairy (54–61%) followed by vegetables (22–27%) in all methods. The lowest carbon footprint of dairy was generated using the SR (0.10 kg CO2eq/serving) due to a lower total dairy amount determined combined with lower greenhouse gas emissions for the ingredients identified. More specifically, the majority of the dairy identified in SR was mozzarella, which has a carbon footprint estimate (3.8 kg CO2eq/kg) that was about two times lower than the carbon footprint of “average cheese” that was used in the other three methods (6.3 kg CO2eq/kg). The modest contribution to carbon footprint from the vegetables varied in absolute terms between decomposition methods. However, it should be mentioned that the footprint of the large vegetable quantities reported in the FPED and FICRCD were partly balanced out by the use of average LCIs and the identification of relatively high-footprint vegetable components by the SR and FCID decompositions (e.g., peppers, onions, and mushrooms). Solid fats (oils and fats) had a noticeable contribution according to the FPED decomposition. Interestingly, only the SR and FCID decompositions reported water as an ingredient but it had negligible contributions to carbon footprints. Decomposition differences for the rest of the components (grains, sugars, other) had little influence on the carbon footprint of vegetarian pizza.
For the two pizzas analyzed, all methods produced higher carbon footprint estimates for the meat compared to the vegetarian pizza, with results varying by decomposition method: 0.56 kg CO2eq/serving for FCID, 0.67 kg CO2eq/serving for SR, 0.71 kg CO2eq/serving for FPED, and 0.73 kg CO2eq/serving for FICRCD. Furthermore, each decomposition recognized dissimilar components as the major impact contributors chiefly due differences in the type and amounts of ingredients identified. For the highest (FICRCD) and the lowest (FCID) carbon footprint estimated, red meat was the main contributor at 55% and 61%, respectively, followed by dairy (27–31%). For SR, cured meat (35%) and red meat (39%) were the dominant contributors to carbon footprint, followed by dairy (15%). In contrast, the highest contributor for the FPED decomposition was dairy at 35%, which was similar to the corresponding carbon footprint estimate from FICRCD in absolute terms. Furthermore, red meat, cured meat, and oils and fats contributed almost equally to the impact at around 15%. It should be mentioned that the FPED decomposition reported the lowest meat contribution to impact (total of 37% that corresponded to 0.27 kg CO2eq/serving of meat pizza), even though it identified a similar meat-ingredient decomposition with SR. The discrepancy observed at the impact level between these methods was mainly due to differences in ingredient resolution and consequently the ability to match ingredients with available LCIs. Due to a higher resolution, the SR decompositions enabled a more direct matching between these ingredients and LCIs, which reported higher greenhouse gas emissions than the average LCIs used in the low resolution FPED. Finally, the vegetable contribution to the carbon footprint was higher in FPED and FICRCD that was exclusively associated with tomato ingredients. As mentioned in the decomposition section, the single vegetable component in meat pizza according to both methods was tomato, which due to the low resolution of these methods, represented a food group and reported the ultimately reported the ingredient as fresh tomato after adjusting for losses. Thus, ingredient amount was higher than the corresponding ingredients reported in SR and FCID (primarily tomato puree) and was matched with the average of fresh tomato LCIs (0.52 kg CO2eq/kg), which was almost 50 times higher than the carbon footprint of tomato puree (0.011 kg CO2eq/kg). When combined, these decomposition differences generated considerable discrepancies in the vegetable contributions to the carbon footprints of meat pizza consumed between methods.

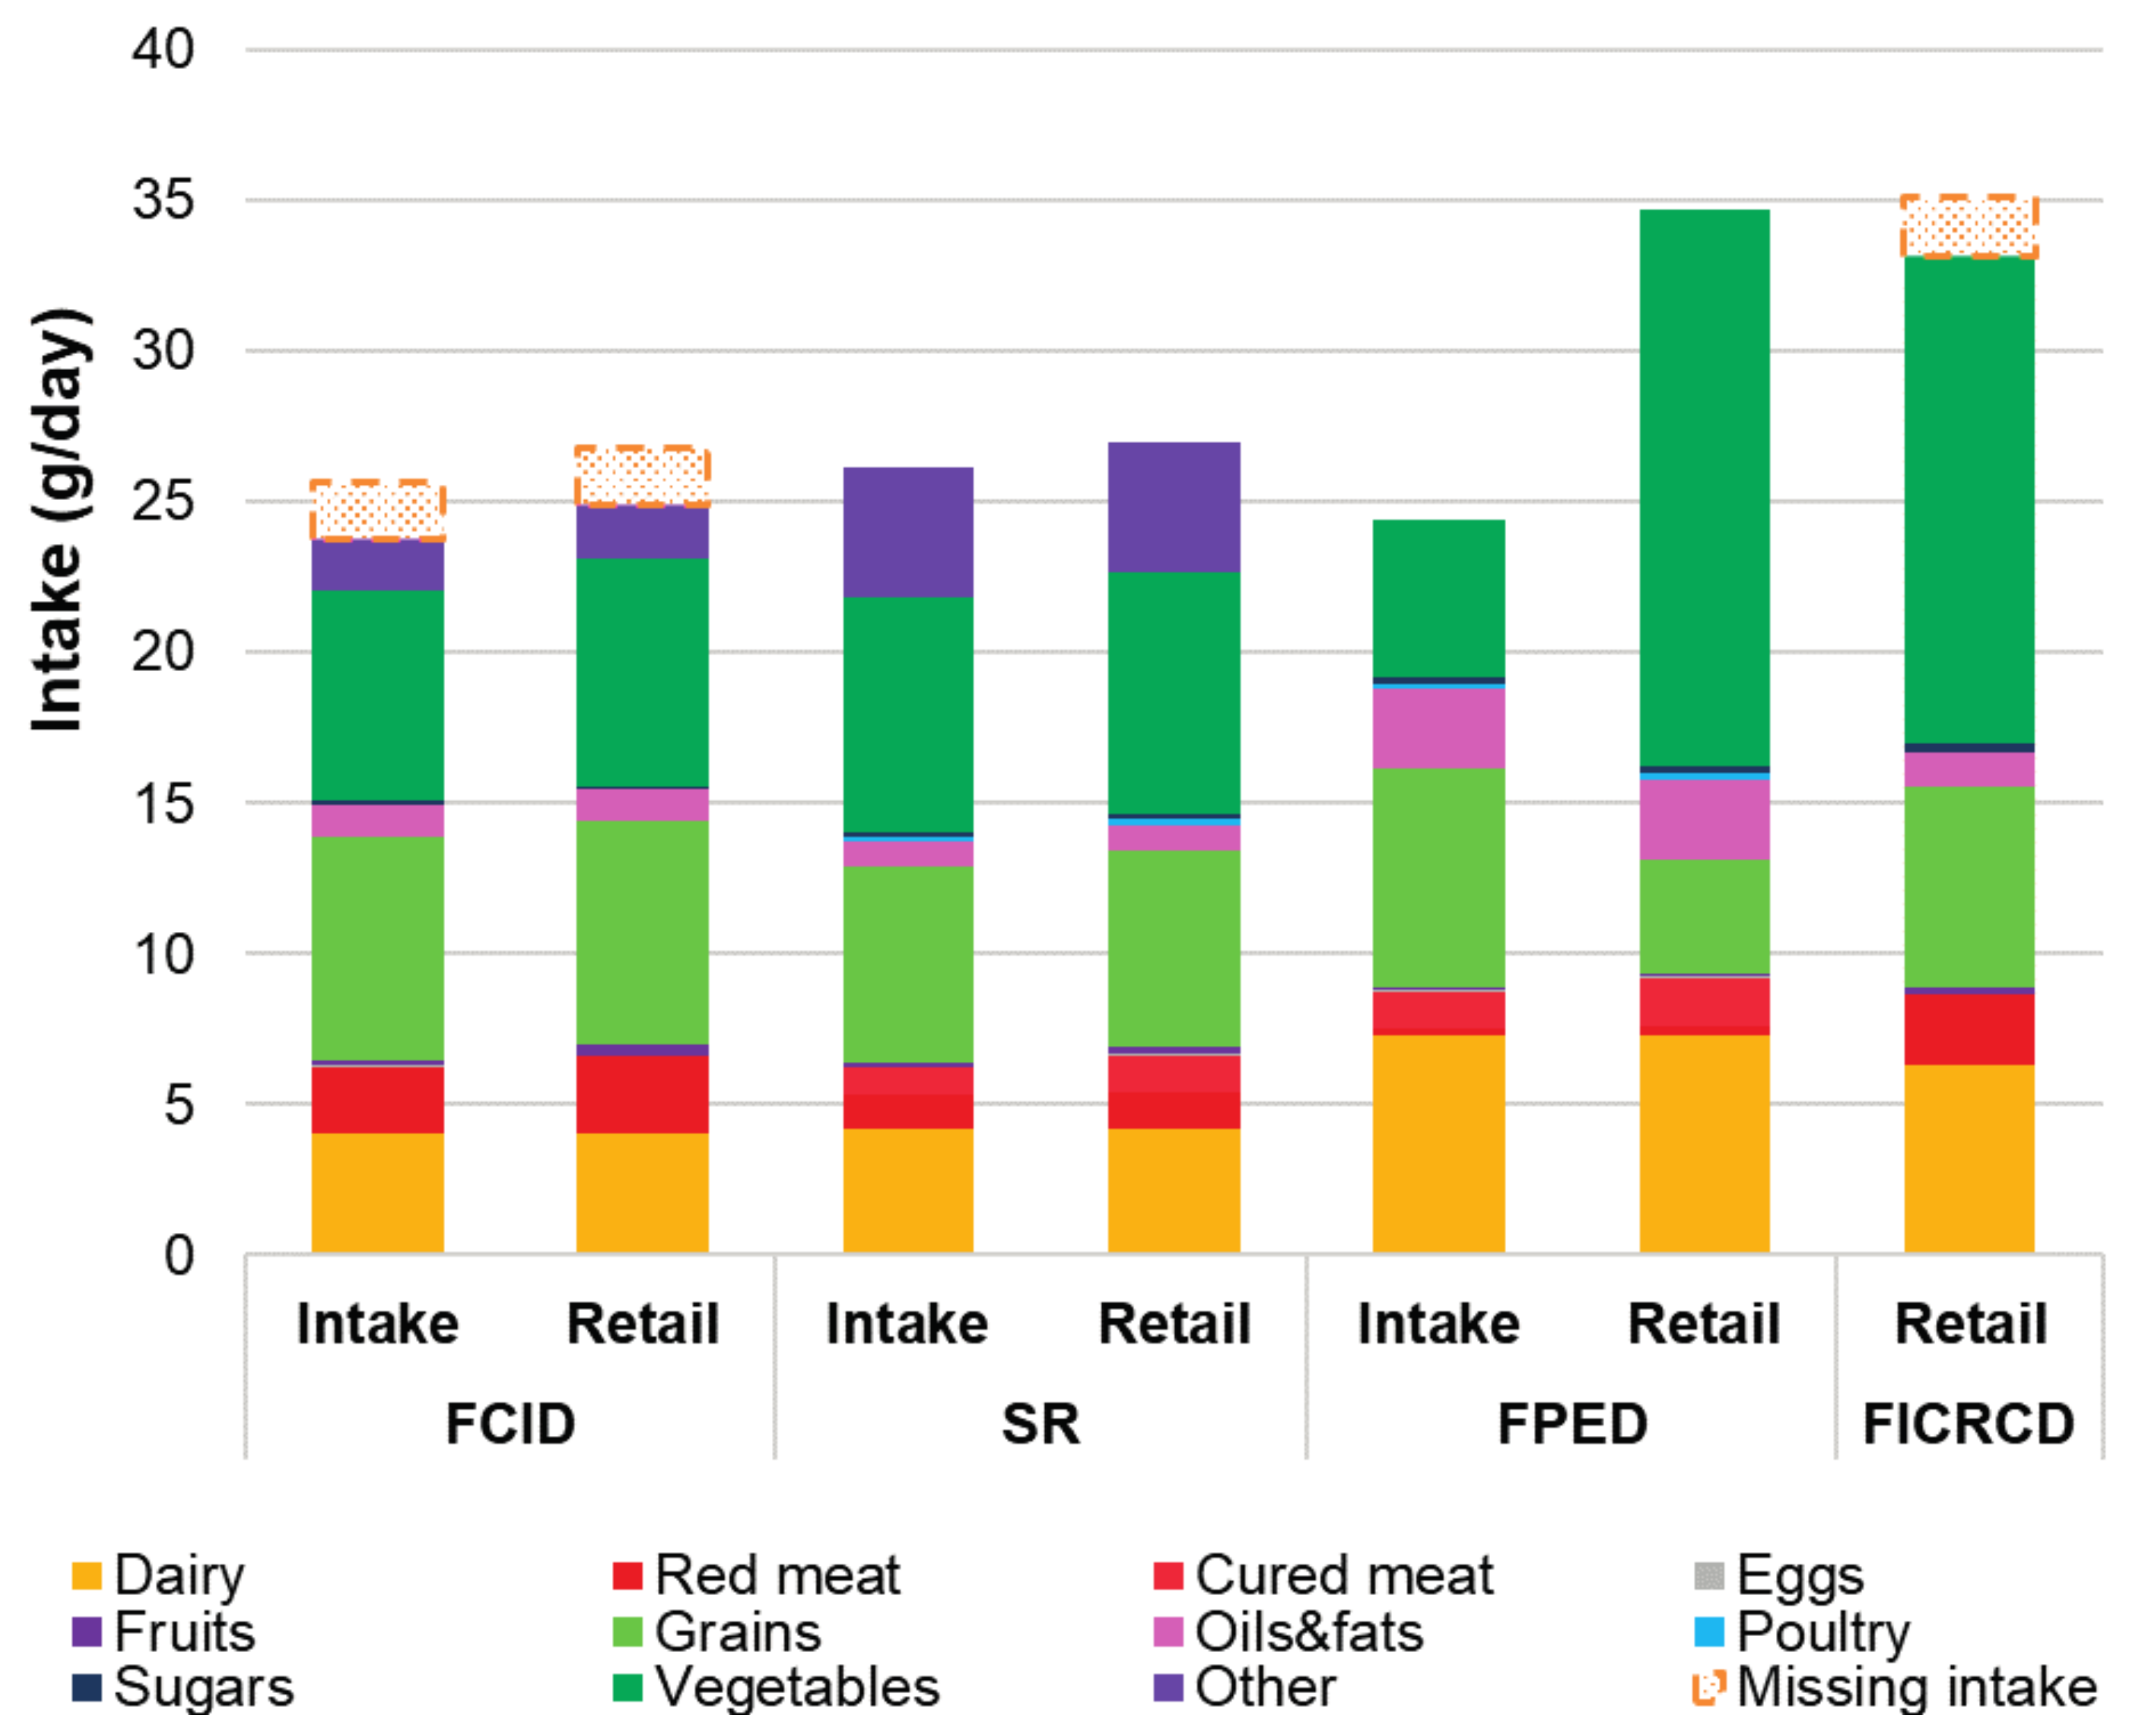
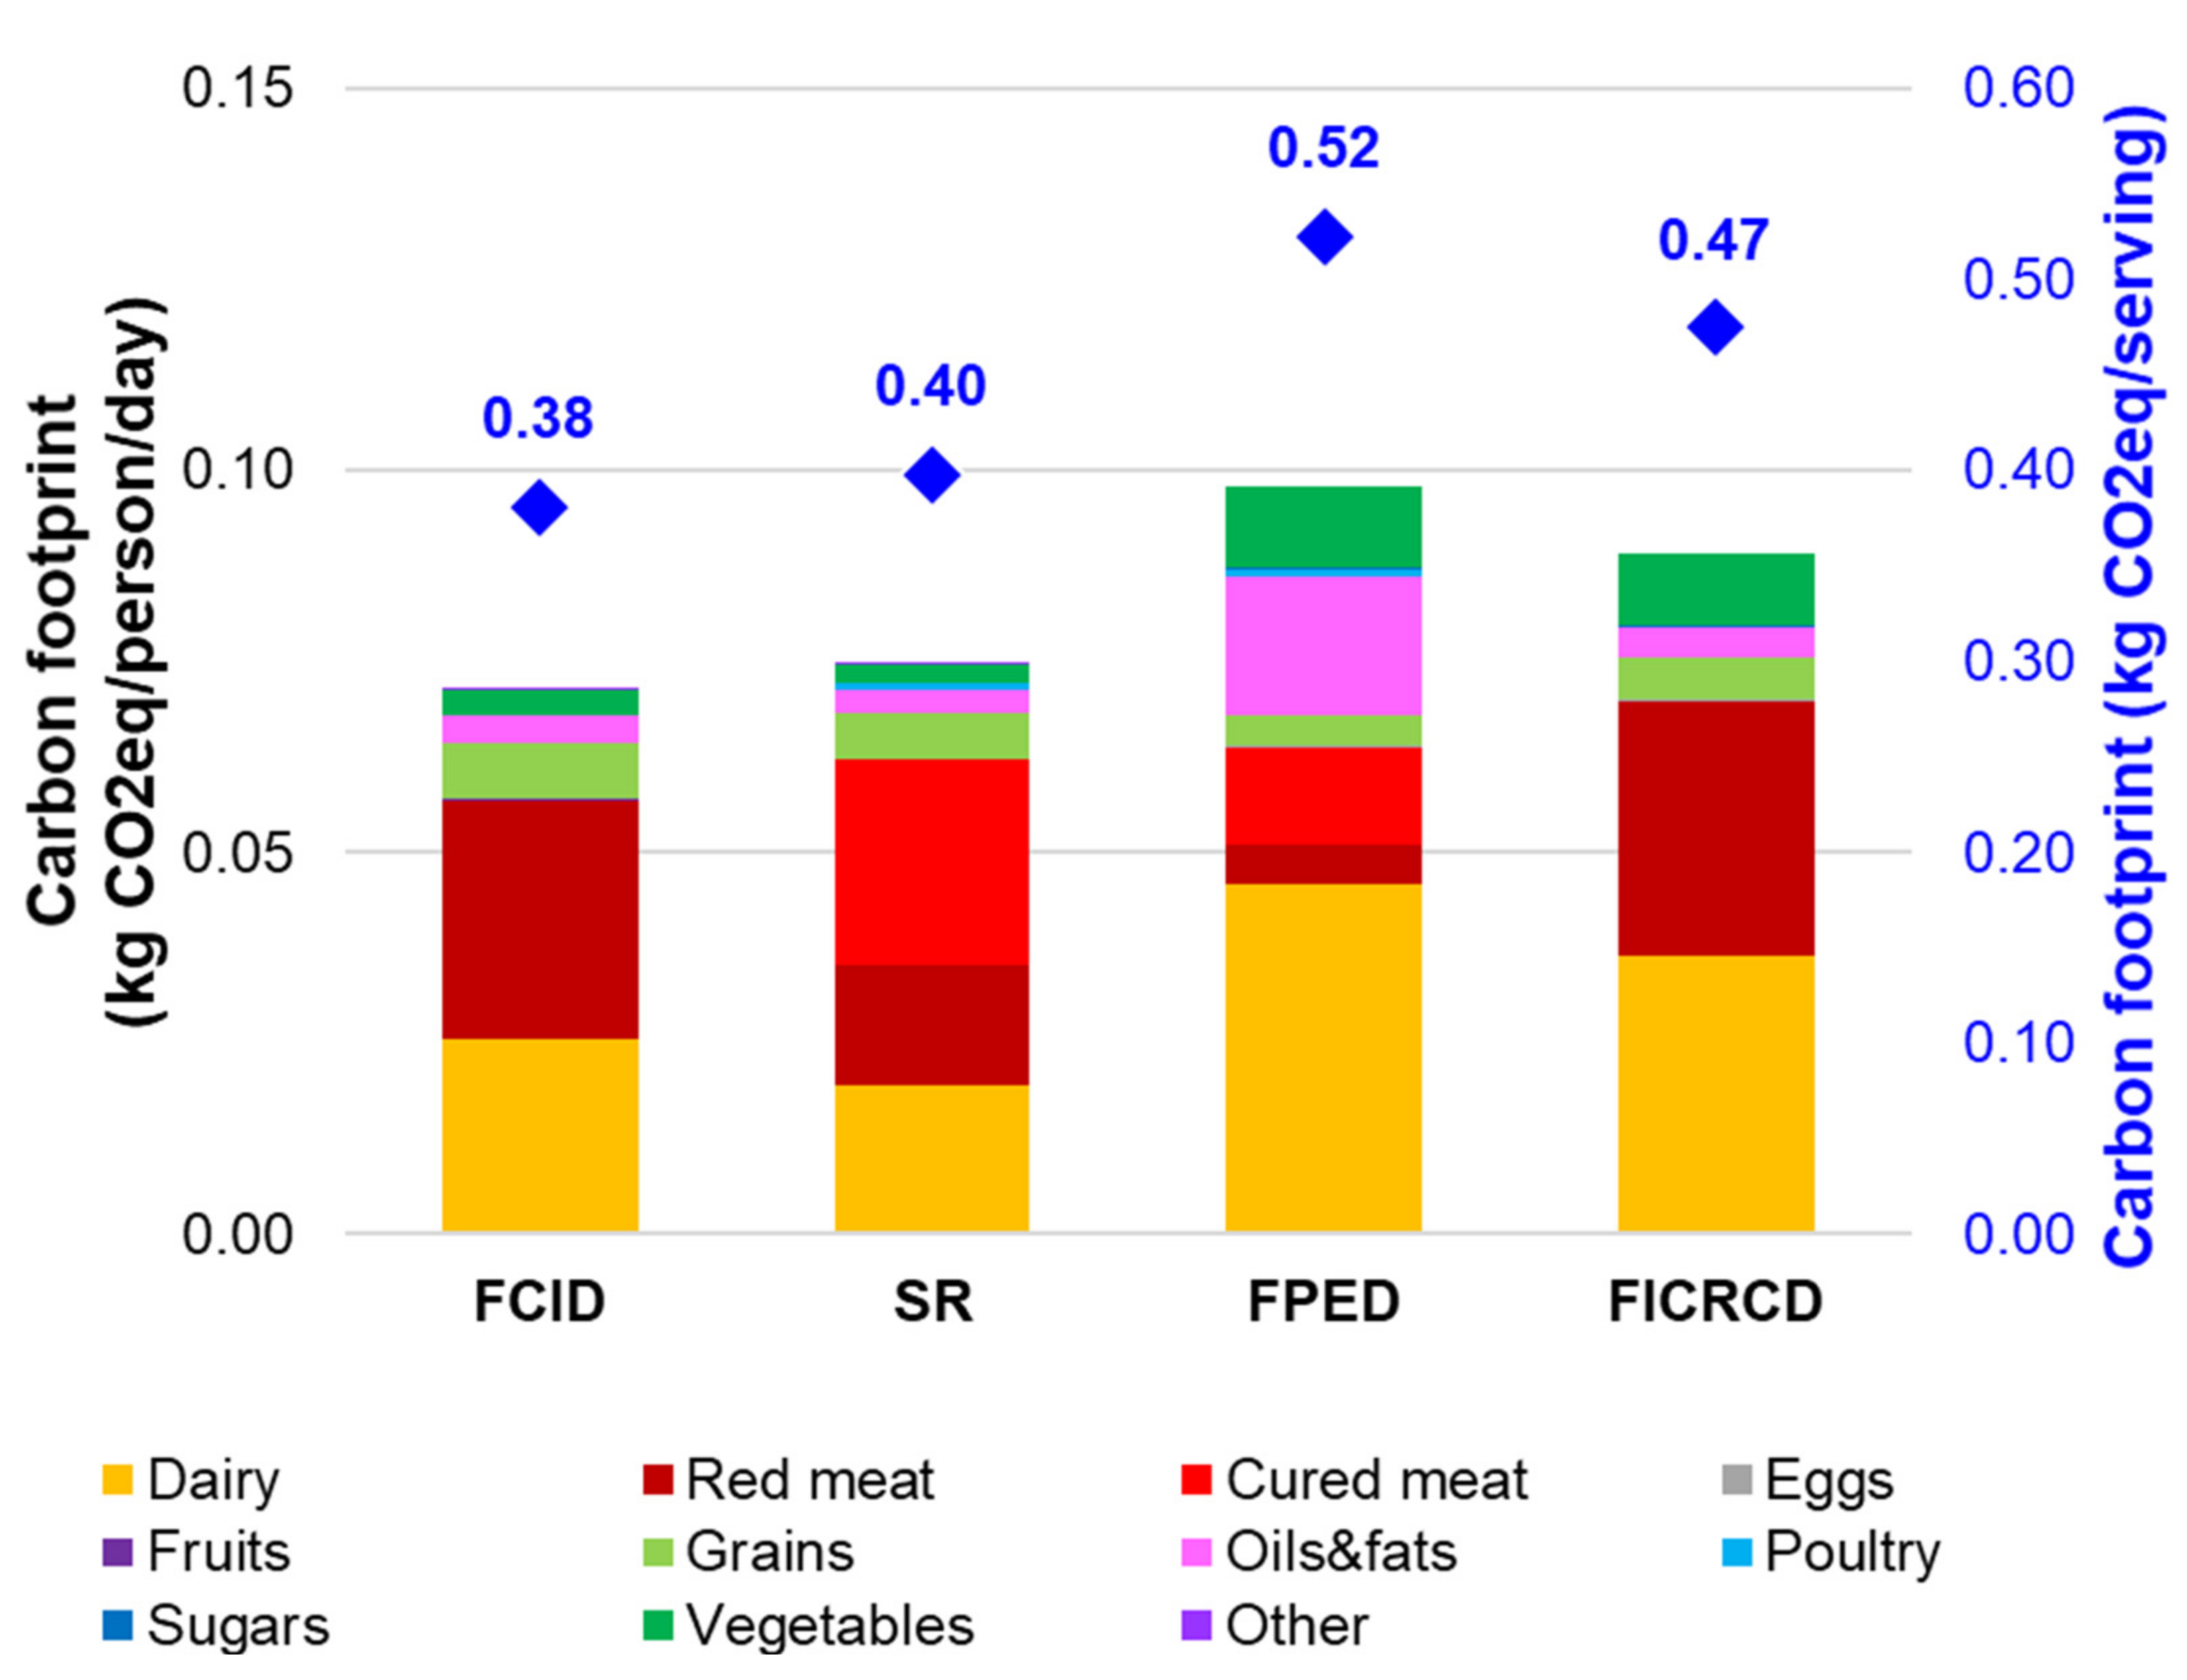
3.2. Daily Pizza Intake in the U.S.

The average daily consumption of pizza in the U.S. diet of adults was estimated at 26.3 g/pers/d based on the reported consumption of 75 distinct pizzas. Large discrepancies were observed in the total number of ingredients, ingredient composition, and carbon footprint generated by each decomposition method. Figure 2 illustrates the repartition of consumed (intake) and retail-level daily pizza intake according to the four decomposition methods investigated in this analysis. Figure 3 presents the retail-level carbon footprint a of daily pizza consumption in the U.S. Estimates ranged from 71.5 g CO2eq/pers/d for FCID up to 98.0 g CO2eq/pers/d for FPED, which corresponded to 0.38–0.52 kg CO2eq/serving pizza (140 g/serving). Overall, these findings show the influence of decomposition method on the environmental impacts of foods in LCA.
Only the SR approach was able to provide a complete coverage of all consumed pizzas using 57 ingredients, which corresponded to 27 g/pers/d of daily pizza intake at retail level. According to this decomposition methodology at retail level, 30% of the daily pizza was vegetables, 24% grains, while dairy and milk (other) accounted for 16% each. However, the main contributors to carbon footprint at retail (77.6 g CO2eq/pers/d) were cured meat (35%), red meat (25%), and dairy (25%). Using this decomposition approach, the average carbon footprint of a pizza serving was estimated at 0.40 kg CO2eq.
The FPED approach identified 16 ingredients that covered all 75 pizzas, underestimating pizza consumption at 24.4 g/pers/d and estimating a retail-level pizza intake at 34.7 g/pers/d. At retail, about half of the daily pizza intake was made out of vegetables, followed by dairy (21%) and fats (11%). The quantities for these components were about 2–3 times higher than the corresponding estimates from the SR. However, FPED reported half the grain of the SR (Figure 2), which resulted from the use of aggregated estimates of weights of cup equivalents and loss conversion factors due to the low ingredient resolution of the approach. Using such aggregated estimates might over- or under-estimate consumed (e.g., dairy and vegetables) and retail-level quantities (e.g., vegetables and grains). This decomposition approach resulted in the highest carbon footprint for the daily pizza intake of 98 g CO2eq/pers/d at retail (0.52 kg CO2eq/serving), which was about 30% higher and had a substantially different repartition than the SR method (Figure 3). More specifically, the leading contributors of carbon footprint according to FPED were dairy (47%), oils and fats (18%), cured meat (13%), and vegetables (11%). The ingredient-specific carbon footprint estimates from FPED were two (dairy) to seven (oils and fats) times higher than the SR, except for cured meat (50% lower), red meat (about four times lower), and grains (30% lower). Unlike the SR, the FPED does not contain water as a decomposition component, which explains the quantity difference observed in components categorized as ‘other.’ Even though water is not anticipated to have substantial contribution from an environmental perspective, when evaluating decomposition methods on a mass basis, the lack of water as a component that is typically used in larger amounts might hide overestimated quantities of other components.
The FCID approach covered only 51 pizzas (68%) that were decomposed into 57 ingredients and corresponded to a daily pizza intake of 24.9 g/pers/d at retail (23.8 g consumed/pers/d). Since this approach is not regularly updated, 30% of the pizza types reported to be consumed were missing from the analysis, corresponding to 1.9 g/pers/d of the daily pizza intake. This approach generated a retail-level carbon footprint slightly lower than the SR at 71.5 g CO2eq/pers/d, corresponding to 0.38 kg CO2eq/serving. Both the FCID and SR produced similar retail-level decompositions (Figure 2) and ingredient contributions to the carbon footprint (Figure 3), with the exception that FCID did not distinguish between red and cured meat. In particular, the FCID approach only identified the meat protein (e.g., pork and beef), while the SR meat components were more descriptive in regards to processing and preparation, which allowed for better matching with available LCIs. For example, part of the cured meats identified in the SR were described as a mix of beef and pork that generate 15% lower carbon footprint per kg compared to beef meat identified in FCID. Interestingly, the FCID approach offers a less than ideal decomposition of dairy products as it was intended to capture pesticide residue that is linked to fat content in ingredients. Hence, dairy is reported as ‘Milk, fat’, ‘Milk, nonfat solids’, and ‘Milk, water’. While in this case study it was assumed that the sum of these dairy ingredients corresponded to cheese (unspecified type for generalizability), such an assumption would not be possible for the evaluation of multi-ingredient foods such as pasta, pastries, and desserts that contain different types of dairy ingredients such as cheese, milk, and yogurt.
Only 70% of the pizzas types consumed were evaluated using the FICRCD approach, corresponding to 24.3 g pizza/pers/d. Since this approach is not updated regularly, it does not contain information on new foods introduced in NHANES. This approach generated an overall 17-ingredient composition of the daily pizza intake in the U.S that at retail amounted to 33.2 g/pers/d and was similar to FPED. More specifically, according to FICRCD, daily pizza intake was mainly comprised of vegetables (50%), grains (20%), and dairy (20%). The FICRCD approach produced a carbon footprint at 89.0 g CO2eq/pers/d (0.47 kg CO2eq/serving), 20% higher than the SR approach. This impact was driven by dairy (41%) and red meat (38%). The dairy and vegetable ingredients generated carbon footprint estimates that were two to three times higher than the corresponding estimated from the SR, reflecting the underlying retail quantity differences between approaches. The same trend was observed for red meat. However, the difference was due to the underlying quantities of meat types in each approach; sausages that are a mixture of beef and pork and have a lower footprint than beef make up 74% of the meat in SR, whereas in FICRCD 63% of the meat is beef.

4. Discussion

In this paper, four public databases were evaluated as sources of standardized recipes that can be used in the environmental impact assessment of mixed dishes. The case study on pizza in the U.S. in this analysis illustrated that the carbon footprint of pizzas is highly driven by composition and in particular the amount of meat present. The pizza type-specific estimates presented in this analysis are indicative of “extra meat” and “extra vegetable” pizzas impacts, with the latter generating a substantially lower carbon footprint. While this finding is in agreement with previous estimates for pizzas [37] and other mixed dishes [9,10,14,38,39], it should be noted that ingredient composition might vary greatly within pizza types that may considerably influence the impact of individual foods. This analysis also showed that the choice of the decomposition method has a noteworthy influence on the carbon footprint of individual foods and daily food intake. It is expected that this influence could be also found in the overall environmental impact assessment of foods, and consequently diets, since carbon footprint of foods is correlated with most environmental indicators considered in LCA [26].
To provide better guidance on the use of the four databases investigated in this analysis as decomposition approaches, their performance was summarized based on three criteria that can potentially influence the environmental impacts of foods (Table 3): Ingredient quantity accuracy and resolution, ingredient matching with LCIs, and database update frequency. Ingredient resolution is of particular importance due to the large variation of the carbon footprint between food commodities [1,4,17], especially meat. Low- (FPED) and moderate-resolution (FICRCD) decomposition methods often require the use of aggregated LCIs and loss adjustment factors that fail to capture impact variability and might over- or underestimate environmental impacts as components represent food groups. Aggregated estimates were generic and not specific to pizzas to enable the evaluation the ability of the four methods for high-throughput food decompositions. For example, average cheese estimates were used when the type of cheese was not specified. In addition, FPED originally reports component quantities in serving equivalents that need to be converted into mass, an attribute that can be challenging when the weight of serving equivalents varies considerably within a food group. Consequently, FPED consistently reported the highest dairy quantity, which was based on the average weight of a cup of cheese (54 g). In a sensitivity study, pizza-specific estimates were used for the average weight of a cup of mozzarella (45 g) and mozzarella-LCI, the cheese typically used in pizzas and a the carbon footprint of daily pizza intake with FPED was reduced by ~20% to 75.1 g CO2eq/pers/d, a result compatible with the SR. The FPED approach also seemed to favor oils and fats in pizzas, a component with sizable environmental footprint. Overall, it was determined that the approach has poor ingredient resolution and offers the lowest ability to estimate accurately ingredient quantity and to match ingredients with LCIs, but it has a good update frequency.
The FICRCD and FCID approaches offer a fair ingredient resolution and matching with LCIs. In addition to a low ingredient resolution, the FICRCD method only provides component amounts at retail that might be appropriate only for certain LCAs [19,40]. Compared to the SR, the approach seemed to overestimate dairy, sugars, and vegetables and it does not consider water as an ingredient. The FCID, which has been used before as a food decomposition method [17,18,41,42], offers a satisfactory ingredient resolution and matching with LCIs, except for dairy. An important limitation of this approach is that it is unable to distinguish between dairy ingredients (e.g., milk, cheese, and yogurt) in the food [17]. As many food contain multiple dairy ingredients and the environmental footprints of dairy products vary considerably [43], using FCID to decompose foods into ingredients is problematic for many food and diet evaluations. Another limitation of the FCID and FICRCD databases is that they have not been updated for nearly 10 years [41]. Consequently, the two approaches cannot be used in the evaluation of foods introduced in the newer cycles of NHANES, as evident from the 20+ pizzas missing from our analysis using these approaches. Furthermore, these decomposition methods fail to capture food composition changes over time as the food sector evolves.
Overall, the SR method seems to offer the most useful and appropriate food decomposition in the U.S. for LCA. It quantified the consumed amounts of components accurately and showed the highest resolution that enables the differentiation of components with varying loss rates and environmental impacts. The SR ingredient resolution is currently higher than the commodity resolution covered by the available LCIs, therefore it requires the use of proxies. However, proxies are typically needed for ingredients consumed at lower amounts and that have relatively low environmental footprints [17]. The SR method also contains multi-ingredient components that need decomposition. As shown in this analysis, this limitation can be addressed using either foodcode proxies or previous versions of the database. In addition to good ingredient resolution and matching with LCIs, the SR is frequently updated along with the NHANES cycles (typically every two years). SR decompositions can be complemented with information from the other approaches such as the retail-to-intake loss conversion factors from the FICRCD and the component cooking and processing methods from the FCID.
This analysis provides new insights on how food decomposition methods may influence the environmental impact assessment of foods. While the underlying decomposition databases investigated in this analysis have been developed and primarily used to evaluate the nutritional quality [44] and dietary exposure to metal [45], they enable a high throughput evaluation of the environmental impacts associated with the thousands of foods in the NHANES database. However, several limitations should be acknowledged that most food LCAs also suffer from. First, our analysis suffered from data gaps related to ingredient coverage and representativeness. Three LCI databases (ecoinvent v3.2, WFLDB v3.1, and ESU World food LCA database) were used to improve coverage. To improve representativeness, ingredients were matched with the most appropriate LCIs available, often utilizing proxy assignments and averages. When LCIs for the same ingredient were available from multiple production systems or regions, processed representing conventional production were selected and regions were prioritized favoring U.S., Canada, and major import countries when information was available. However, it is well understood that resource use and emissions data of foods mainly cover raw and semi-processed ingredients [7,46]. These estimates can vary substantially between commodities [46,47], within and between countries [1,48], and between production systems [1,49]. Furthermore, using multiple sources of LCIs might introduce inconsistencies between data related to underlying assumptions, life cycle stage coverage, system boundaries, and allocation methods [46], whereas the three databases applied are all ecoinvent-based approach, mostly using similar background data for main energy and materials inputs. Consequently, the availability and choice of the most appropriate LCI for each ingredient is critical in the environmental impact assessment of foods. However, most standardized recipe databases in the U.S. lack such information, primarily because their scope is focused on nutrition evaluation.
The carbon footprint estimates in our analysis are limited in covering impacts associated with “cradle to farm gate” or “cradle to processor gate” processes, accounting for retail to consumption losses. Therefore, the post farm/processor gate impact of pizza, such as manufacturing, packaging, distribution, retail storage (refrigeration and freezing), preparation, cooking, and waste have not been considered for this comparison-focused analysis. Previous studies evaluating the performance of a small number of mixed dishes collected information for these stages and showed that the contribution and importance of these stages to food specific impacts differs substantially between dishes and environmental indicators [13,14,15,50,51,52]. However, such an approach would be challenging to implement on a large-scale. Recently, Kim et al. [53] developed a methodology to characterize the environmental impacts associated with the “farm to grave” stages by food group that covers the U.S food system. In particular, they coupled up-to-retail gate information from an environmentally extended input–output model (EIO-LCA) with an LCA model for the retail and consumer phases. The study found that these stages are important contributors to the carbon footprint of vegetables, grains, and seafood (40–50%), fruits and juices (~30%), and dairy (~20%). Other studies have estimated that that these “farm to grave” processes can increase the carbon footprint of food systems by 15–18% [1,17,54].

5. Conclusions

This study investigates the use of standardized recipes as decomposition methods that determine ingredient composition of foods and enable the characterization of food-specific environmental impacts, a methodological limitation that is often overlooked. Using a case study on pizzas in the U.S. diet, a popular food group in modern diets with a complex composition, this analysis showed that four distinct decomposition methods produced considerably different carbon footprint estimates. Consequently, while the environmental impacts of individual foods are driven by meat composition, decomposition methods can also substantially influence the performance and comparison of foods and diets. Differences observed between methods stemmed from ingredient resolution, ingredient quantity units, and the ability to adjust for losses and to match ingredients with available LCIs. Therefore, consumption-centered results established with different decomposition methods might not be comparable and could lead to misleading conclusions and recommendations. While all approaches generated several challenges, our analysis suggests that the SR approach offers the most appropriate and useful decomposition for foods in the U.S. In addition, it is recommended that LCA practitioners start considering and evaluating, when possible, the influence and limitations of decomposition methods in food and diet LCAs.

Supplementary Materials

The following are available online at https://www.mdpi.com/2071-1050/12/22/9466/s1, Table S1: Average daily pizza intake in the U.S. from 2011–2016 and coverage by decomposition method. Table S2: Average weight of unit of measure by FPED component in grams per serving equivalent. Table S3: Decomposition of 100 g of multi-ingredient SR components at consumption level. Estimates were obtained from matching components with food items. Table S4: SR decomposition per 100 g of individual pizzas at consumption level. Table S5: FPED decomposition per 100 g of individual pizzas at consumption level. Table S6: FCID decomposition per 100 g of individual pizzas at consumption level. Table S7: FICRCD decomposition per 100 g of individual pizzas at retail level. Table S8: One serving (140 g) decomposition and carbon footprint of vegetarian and meat pizza by decomposition method. Table S9: Aggregated SR decomposition of daily pizza intake. Table S10: Aggregated FPED decomposition of daily pizza intake. Table S11: Aggregated FCID decomposition of daily pizza intake. Table S12: Aggregated FICRCD decomposition of daily pizza intake.

Author Contributions

Conceptualization: K.S.S., V.L.F.III, and O.J.; methodology: K.S.S. and O.J.; formal analysis: K.S.S.; data curation: K.S.S., V.L.F.III, and E.M.; writing—original draft preparation: K.S.S.; writing—review and editing: K.S.S., V.L.F.III, E.M., and O.J.; visualization: K.S.S. All authors have read and agreed to the published version of the manuscript.

Funding

This work has been funded by an unrestricted grant from the Dairy Research Institute (DRI), part of Dairy Management Inc. (DMI) and the Dow Sustainability Fellows Program at the University of Michigan.

Conflicts of Interest

The funders had no role in the design of the study; in the collection, analyses, or interpretation of data; in the writing of the manuscript, and in the decision to publish the results. K.S.S., E.M., and O.J. have no conflicts of interest to declare. V.L.F.III consult for and/or have received research grants from various food, beverage, and dietary supplement companies.

References

  1. Poore, J.; Nemecek, T. Reducing food’s environmental impacts through producers and consumers. Science 2018, 992, 987–992. [Google Scholar] [CrossRef] [PubMed] [Green Version]
  2. Sala, S.; Anton, A.; McLaren, S.J.; Notarnicola, B.; Saouter, E.; Sonesson, U. In quest of reducing the environmental impacts of food production and consumption. J. Clean. Prod. 2017, 140, 387–398. [Google Scholar] [CrossRef]
  3. Nemecek, T.; Jungbluth, N.; Canals, L.M.I.; Schenck, R. Environmental impacts of food consumption and nutrition: Where are we and what is next? Int. J. Life Cycle Assess. 2016, 21, 607–620. [Google Scholar] [CrossRef] [Green Version]
  4. Roy, P.; Nei, D.; Orikasa, T.; Xu, Q.; Okadome, H.; Nakamura, N.; Shiina, T. A review of life cycle assessment (LCA) on some food products. J. Food Eng. 2009, 90, 1–10. [Google Scholar] [CrossRef]
  5. National Center for Health Statistics. National Health and Nutrition Examination Survey (NHANES). Available online: https://www.cdc.gov/nchs/nhanes/index.htm (accessed on 6 August 2018).
  6. Davis, J.; Sonesson, U. Life cycle assessment of integrated food chains—A Swedish case study of two chicken meals. Int. J. Life Cycle Assess. 2008, 13, 574–584. [Google Scholar] [CrossRef]
  7. Pernollet, F.; Coelho, C.R.V.; van der Werf, H.M.G. Methods to simplify diet and food life cycle inventories: Accuracy versus data-collection resources. J. Clean. Prod. 2017, 140, 410–420. [Google Scholar] [CrossRef]
  8. Berlin, J.; Sund, V. Environmental Life Cycle Assessment (LCA) of Ready Meals: LCA of Two Meals; Pork and Chicken & Screening Assessments of Six Ready Meals; The Swedish Institute for Food and Biotechnology (SIK): Gothenburg, Sweden, 2010; Available online: https://www.upphandlingsmyndigheten.se/globalassets/upphandling/hallbarhet/environmental-life-cycle-assessment-lca-of-ready-meals-sik-2010804.pdf (accessed on 12 November 2020).
  9. Davis, J.; Sonesson, U.; Baumgartner, D.U.; Nemecek, T. Environmental impact of four meals with different protein sources: Case studies in Spain and Sweden. Food Res. Int. 2010, 43, 1874–1884. [Google Scholar] [CrossRef]
  10. Calderón, L.A.; Iglesias, L.; Laca, A.; Herrero, M.; Díaz, M. The utility of Life Cycle Assessment in the ready meal food industry. Resour. Conserv. Recycl. 2010, 54, 1196–1207. [Google Scholar] [CrossRef]
  11. Calderón, L.A.; Herrero, M.; Laca, A.; Díaz, M. Environmental impact of a traditional cooked dish at four different manufacturing scales: From ready meal industry and catering company to traditional restaurant and homemade. Int. J. Life Cycle Assess. 2018, 23, 811–823. [Google Scholar] [CrossRef]
  12. Schmidt Rivera, X.C.; Azapagic, A. Life cycle environmental impacts of ready-made meals considering different cuisines and recipes. Sci. Total Environ. 2019, 660, 1168–1181. [Google Scholar] [CrossRef]
  13. Konstantas, A.; Jeswani, H.K.; Stamford, L.; Azapagic, A. Environmental impacts of chocolate production and consumption in the UK. Food Res. Int. 2018, 106, 1012–1025. [Google Scholar] [CrossRef] [PubMed] [Green Version]
  14. Heard, B.R.; Bandekar, M.; Vassar, B.; Miller, S.A. Comparison of life cycle environmental impacts from meal kits and grocery store meals. Resour. Conserv. Recycl. 2019, 147, 189–200. [Google Scholar] [CrossRef]
  15. Schmidt Rivera, X.C.; Espinoza Orias, N.; Azapagic, A. Life cycle environmental impacts of convenience food: Comparison of ready and home-made meals. J. Clean. Prod. 2014, 73, 294–309. [Google Scholar] [CrossRef]
  16. Saarinen, M.; Kurppa, S.; Virtanen, Y.; Usva, K.; Mäkelä, J.; Nissinen, A. Life cycle assessment approach to the impact of home-made, ready-to-eat and school lunches on climate and eutrophication. J. Clean. Prod. 2012, 28, 177–186. [Google Scholar] [CrossRef]
  17. Heller, M.C.; Willits-Smith, A.; Meyer, R.; Keoleian, G.A.; Rose, D. Greenhouse gas emissions and energy use associated with production of individual self-selected US diets. Environ. Res. Lett. 2018, 13. [Google Scholar] [CrossRef]
  18. Conrad, Z.; Niles, M.T.; Neher, D.A.; Roy, E.D.; Tichenor, N.E.; Jahns, L. Relationship between food waste, diet quality, and environmental sustainability. PLoS ONE 2018, 13, e0195405. [Google Scholar] [CrossRef]
  19. Tichenor Blackstone, N.; El-Abbadi, N.H.; McCabe, M.S.; Griffin, T.S.; Nelson, M.E. Linking sustainability to the healthy eating patterns of the Dietary Guidelines for Americans: A modelling study. Lancet Planet. Health 2018, 2, e344–e352. [Google Scholar] [CrossRef] [Green Version]
  20. Alves-Santos, N.H.; Eshriqui, I.; Franco-Sena, A.B.; Cocate, P.G.; Freitas-Vilela, A.A.; Benaim, C.; dos Santos Vaz, J.; Castro, M.B.T.; Kac, G. Dietary intake variations from pre-conception to gestational period according to the degree of industrial processing: A Brazilian cohort. Appetite 2016, 105, 164–171. [Google Scholar] [CrossRef]
  21. Brown, K.; von Hurst, P.; Rapson, J.; Conlon, C. Dietary Choices of New Zealand Women during Pregnancy and Lactation. Nutrients 2020, 12, 2692. [Google Scholar] [CrossRef]
  22. Gakidou, E.; Afshin, A.; Abajobir, A.A.; Abate, K.H.; Abbafati, C.; Abbas, K.M.; Abd-Allah, F.; Abdulle, A.M.; Abera, S.F.; Aboyans, V.; et al. Global, regional, and national comparative risk assessment of 84 behavioural, environmental and occupational, and metabolic risks or clusters of risks, 1990–2016: A systematic analysis for the Global Burden of Disease Study 2016. Lancet 2017, 390, 1345–1422. [Google Scholar] [CrossRef] [Green Version]
  23. Stylianou, K.S.; Peter, F.; Jolliet, O. Combined nutritional and environmental life cycle assessment of fruits and vegetables. In Proceedings of the 10th International Conference on Life Cycle Assessment of Food 2016, Dublin, Ireland, 19–21 October 2016; pp. A181–A187. [Google Scholar]
  24. Weidema, B.P.; Stylianou, K.S. Nutrition in the life cycle assessment of foods—Function or impact? Int. J. Life Cycle Assess. 2019, 1–7. [Google Scholar] [CrossRef]
  25. Ernstoff, A.; Stylianou, K.S.; Sahakian, M.; Godin, L.; Dauriat, A.; Humbert, S.; Erkman, S.; Jolliet, O. Towards Win-Win Policies for Healthy and Sustainable Diets in Switzerland. Nutrients 2020, 12, 2745. [Google Scholar] [CrossRef] [PubMed]
  26. Stylianou, K.S.; Fulgoni, V.L., III; Jolliet, O. Identifying healthy and environmentally sustainable foods: Small dietary changes bring large benefits. 2020; Unpublished work. [Google Scholar]
  27. U.S. Food and Drug Administration (FDA). Reference Amounts Customarily Consumed: List of Products for Each Product Category: Guidance for Industry; FDA: Rockville, MD, USA, 2017.
  28. Bowman, S.A.; Clemens, J.C.; Shimizu, M.; Friday, J.E.; Moshfegh, A.J. Food Patterns Equivalents Database 2015–2016: Methodology and User Guide; Food Surveys Researcg Group, Betsville Human Nutrition Research Center, USDA ARS: Beltsville, MD, USA, 2018.
  29. Bowman, S.A.; Martin, C.L.; Carlson, J.L.; Clemens, J.C. Food Intakes Converted to Retail Commodities Databases 2003–08: Methodology and User Guide; USDA, Agriculture Research Service and Economic Research Service, Beltsville Human Nutrition Research Center, Food Surveys Research Group: Beltsville, MD, USA, 2013. Available online: https://www.ars.usda.gov/ARSUserFiles/80400530/pdf/fped/FPED_1516.pdf (accessed on 12 November 2020).
  30. U.S. EPA. What We Eat In America—Food Commodity Intake Database 2005–2010. Available online: https://fcid.foodrisk.org/dbc/ (accessed on 18 August 2020).
  31. U.S. Department of Agriculture (USDA). USDA National Nutrient Database for Standard Reference, Release 28. Available online: http://www.ars.usda.gov/ba/bhnrc/ndl (accessed on 6 August 2018).
  32. International Standard Organization. ISO 14040: Environmental Management-Life Cycle Assessment-Principles and Framework. 2006. Available online: https://www.iso.org/obp/ui/#iso:std:iso:14040:ed-2:v1:en (accessed on 12 November 2020).
  33. Wernet, G.; Bauer, C.; Steubing, B.; Reinhard, J.; Moreno-Ruiz, E.; Weidema, B. The ecoinvent database version 3 (part I): Overview and methodology. Int. J. Life Cycle Assess. 2016, 21, 1218–1230. [Google Scholar] [CrossRef]
  34. Nemecek, T.; Bengoa, X.; Lansche, J.; Mouron, P.; Riedener, E.; Rossi, V.; Humbert, S. World Food LCA Database—Methodological Guidelines for the Life Cycle Inventory of Agricultural Products, Version 3.0. 2015. Available online: https://lcdn.quantis-software.com/PEF/resource/sources/a4ba57e6-c356-4be6-b2f4-f0ad1fbf6041/WFLDB_MethodologicalGuidelines_v3.0.pdf;jsessionid=08A04C10A01A7B5359FB4372C5C0946B?version=01.01.000 (accessed on 12 November 2020).
  35. ESU. World Food LCA Database. Available online: http://esu-services.ch/data/fooddata/ (accessed on 7 February 2017).
  36. Bulle, C.; Margni, M.; Patouillard, L.; Boulay, A.-M.; Bourgault, G.; De Bruille, V.; Cao, V.; Hauschild, M.; Henderson, A.; Humbert, S.; et al. IMPACT World+: A globally regionalized life cycle impact assessment method. Int. J. Life Cycle Assess. 2019, 1–22. [Google Scholar] [CrossRef] [Green Version]
  37. Coelho, C.R.V.; Pernollet, F.; Van Der Werf, H.M.G. Environmental life cycle assessment of diets with improved omega-3 fatty acid profiles. PLoS ONE 2016, 11, e0160397. [Google Scholar] [CrossRef] [Green Version]
  38. Leuenberger, M.; Jungbluth, N.; Büsser, S. Environmental impact of canteen meals: Comparison of vegetarian and meat based recipes. Int. J. Life Cycle Assess 2010, 9, 1–5. [Google Scholar]
  39. Ernstoff, A.; Tu, Q.; Faist, M.; Del Duce, A.; Mandlebaum, S.; Dettling, J. Comparing the Environmental Impacts of Meatless and Meat-Containing Meals in the United States. Sustainability 2019, 11, 6235. [Google Scholar] [CrossRef] [Green Version]
  40. Hitaj, C.; Rehkamp, S.; Canning, P.; Peters, C.J. Greenhouse Gas Emissions in the United States Food System: Current and Healthy Diet Scenarios. Environ. Sci. Technol. 2019, 53, 5493–5503. [Google Scholar] [CrossRef]
  41. Conrad, Z.; Blackstone, N.T.; Roy, E.D. Healthy diets can create environmental trade-offs, depending on how diet quality is measured. Nutr. J. 2020, 19, 1–15. [Google Scholar] [CrossRef]
  42. Bryan, T.; Hicks, A.; Barrett, B.; Middlecamp, C. An environmental impact calculator for 24-h diet recalls. Sustainability 2019, 11, 6866. [Google Scholar] [CrossRef] [Green Version]
  43. Milani, F.X.; Nutter, D.; Thoma, G. Invited review: Environmental impacts of dairy processing and products: A review. J. Dairy Sci. 2011, 94, 4243–4254. [Google Scholar] [CrossRef] [PubMed]
  44. Ahuja, J.K.C.; Moshfegh, A.J.; Holden, J.M.; Harris, E. USDA Food and Nutrient Databases Provide the Infrastructure for Food and Nutrition Research, Policy, and Practice. J. Nutr. 2013, 143, 241S–249S. [Google Scholar] [CrossRef] [PubMed] [Green Version]
  45. Awata, H.; Linder, S.; Mitchell, L.E.; Delclos, G.L. Association of Dietary Intake and Biomarker Levels of Arsenic, Cadmium, Lead, and Mercury among Asian Populations in the United States: NHANES 2011–2012. Environ. Health Perspect. 2017, 125, 314–323. [Google Scholar] [CrossRef] [PubMed] [Green Version]
  46. Heller, M.C.; Keoleian, G.A. Greenhouse Gas Emission Estimates of U.S. Dietary Choices and Food Loss. J. Ind. Ecol. 2015, 19, 391–401. [Google Scholar] [CrossRef]
  47. Meier, T.; Christen, O. Environmental impacts of dietary recommendations and dietary styles: Germany as an example. Environ. Sci. Technol. 2013, 47, 877–888. [Google Scholar] [CrossRef]
  48. Henderson, A.D.; Asselin-Balençon, A.C.; Heller, M.; Lessard, L.; Vionnet, S.; Jolliet, O. Spatial Variability and Uncertainty of Water Use Impacts from U.S. Feed and Milk Production. Environ. Sci. Technol. 2017, 51, 2382–2391. [Google Scholar] [CrossRef]
  49. Clark, M.; Tilman, D. Comparative analysis of environmental impacts of agricultural production systems, agricultural input efficiency, and food choice. Environ. Res. 2017, 12, 064016. [Google Scholar] [CrossRef]
  50. Espinoza-Orias, N.; Azapagic, A. Understanding the impact on climate change of convenience food: Carbon footprint of sandwiches. Sustain. Prod. Consum. 2018, 15, 1–15. [Google Scholar] [CrossRef] [Green Version]
  51. Konstantas, A.; Stamford, L.; Azapagic, A. Environmental impacts of ice cream. J. Clean. Prod. 2019, 209, 259–272. [Google Scholar] [CrossRef]
  52. Konstantas, A.; Stamford, L.; Azapagic, A. Evaluating the environmental sustainability of cakes. Sustain. Prod. Consum. 2019, 19, 169–180. [Google Scholar] [CrossRef]
  53. Kim, D.; Parajuli, R.; Thoma, G.J. Life cycle assessment of dietary patterns in the United States: A full food supply chain perspective. Sustainability 2020, 12, 1586. [Google Scholar] [CrossRef] [Green Version]
  54. Weber, C.L.; Matthews, H.S. Food-miles and the relative climate impacts of food choices in the United States. Environ. Sci. Technol. 2008, 42, 3508–3513. [Google Scholar] [CrossRef] [PubMed] [Green Version]
Figure 1. Retail-level carbon footprint for one serving (140 g) of vegetarian and meat pizzas consumed. FCID = Food Commodity Intake Database; SR = Standard Reference; FPED = Food Patterns Equivalents Database; FICRCD = Food Intakes Converted to Retail Commodities Database.
Sustainability 12 09466 g001
Figure 2. Decomposition of daily pizza intake in the U.S in consumed (intake) and retail amounts. Missing intake at retail level is not adjusted for losses. The underlying data and calculations for these estimates are available in Tables S9–S12 in the supplementary materials. FCID = Food Commodity Intake Database; SR = Standard Reference; FPED = Food Patterns Equivalents Database; FICRCD = Food Intakes Converted to Retail Commodities Database.
Sustainability 12 09466 g002
Figure 3. Carbon footprint of daily pizza consumption (left axis) and pizza serving (140 g; blue diamond; right axis) at the retail level. The underlying data and calculations for these estimates are available in Tables S9–S12 in the supplementary materials. FCID = Food Commodity Intake Database; SR = Standard Reference; FPED = Food Patterns Equivalents Database; FICRCD = Food Intakes Converted to Retail Commodities Database.
Sustainability 12 09466 g003
Table 1. Description of decomposition methods.
Standard Reference
(SR)
Food Patterns Equivalents Database
(FPED)
Food Commodity Intake Database (FCID)Food Intakes Converted to Retail Commodities Database (FICRCD)
Detailed IngredientsFood GroupsCommoditiesPartly Aggregated Commodities
DescriptionCore composition databases in WWEIA/NHANES. It reports the relative weight of ingredients for each consumed food.Reports food pattern in serving equivalents per 100 g of consumed food.Developed to assess dietary exposure to pesticides, the database reports g commodities per 100 g of consumed food.Reports retail-level g per 100 g of consumed food, accounting for masses lost/gained during preparation, cooking, and non-edible parts.
Resolution~3200 single- and multi-ingredient food items37 food groups~500 commodities65 commodities, some of them represent food groups
Database preparationMulti-ingredient items 1 further decomposed using previous database versions or similar itemsServing equivalents (e.g., standardized portion units) converted into g using average weights per serving equivalent (see Table S2). Milk commodities aggregated as single component and assigned to a dairy product based on expert judgement.
Useful attributes- Recommended decomposition method
- Consistent with nutritional decomposition
- Useful to check multi-ingredients components from SR and dairy components of FCID- Complementary component information on cooking processes by food- Retail-to-intake conversion factors that are relevant for LCA
1 Processed and prepared food items comprised of multiple ingredients.
Table 2. Decomposition of one serving size (140 g) of vegetarian and meat pizza at consumption and retail by ingredient groups. Detailed decompositions are available in supplementary material Table S8.
Pizza TypeVegetarianMeat
Decomposition
Method
FCIDSRFPEDFICRCDFCIDSRFPEDFICRCD
# of Ingredients441777481798
ConsumptionCured meat0.00.00.0 0.07.210.0
Dairy19.920.741.8 24.021.041.8
Grains31.027.432.9 38.427.833.4
Oils & fats4.63.79.9 5.73.714.2
Other12.118.70.0 13.819.00.0
Poultry0.00.00.0 0.07.27.1
Red meat0.00.00.0 24.214.46.7
Sugars0.60.30.9 0.70.31.1
Vegetables71.969.247.7 33.139.424.7
Total140.0140.0133.4 140.0140.0139.1
RetailCured meat0.00.00.00.00.010.012.50.0
Dairy19.920.741.833.724.021.041.844.1
Grains31.027.417.334.238.427.817.534.2
Oils & fats4.63.79.93.55.73.714.23.5
Other12.118.70.00.013.819.00.00.0
Poultry0.00.00.00.00.08.99.10.0
Red meat0.00.00.00.028.016.68.627.7
Sugars0.60.30.92.10.70.31.12.1
Vegetables79.472.0133.1130.935.439.795.4107.0
Total147.5142.7203.1204.4146.1146.9200.3218.5
Note: FCID = Food Commodity Intake Database; SR = Standard Reference; FPED = Food Patterns Equivalents Database; FICRCD = Food Intakes Converted to Retail Commodities Database.
Table 3. Evaluation summary of the potential of four database as decomposition methods for mixed dishes in life cycle assessment (LCA).
Standard Reference
(SR)
Food Patterns Equivalents Database (FPED)Food Commodity Intake Database (FCID)Food Intakes Converted to Retail Commodities Database
(FICRCD)
Ingredient quantity accuracy and resolutionGood
- Exact amounts of ingredients in g
- High resolution
- Multi-ingredient items need decomposition
Poor
- Conversion of serving equivalents into g
- Low resolution
- Possible overestimation of grains and fats
- Water content missing
Fair
- Ingredients in g
- Moderate resolution
- Problematic dairy ingredients
- Part-specific ingredients (lipophilicity differences)
- Possible overestimation of oils
Fair
- Retail-level composition
- Ingredients in g
- Low resolution
- Possible overestimation of dairy, sugars, and vegetables
- Water content missing
Ingredient matching with LCIsGood
Detailed ingredient description allows for best possible match with LCIs
Poor
Requires aggregation of LCIs for all ingredients
Fair
Satisfactory ingredient distinction (not detailed for dairy and meat)
Fair
Requires aggregation of LCIs for some ingredients
Update frequencyGood
Updated every two years with each new cycle of NHANES (Latest update: 2018)
Good
Updated every two years with each new cycle of NHANES (Latest update: 2018)
Poor
Not updated frequently. Not applicable for new foods in NHANES
(Latest updated: 2010)
Poor
Not updated frequently. Not applicable for new foods in NHANES
(Latest updated: 2008)
Publisher’s Note: MDPI stays neutral with regard to jurisdictional claims in published maps and institutional affiliations.

