An Open Data and Citizen Science Approach to Building Resilience to Natural Hazards in a Data-Scarce Remote Mountainous Part of Nepal

 , and
, and
Abstract
1. Introduction
2. Materials and Methods
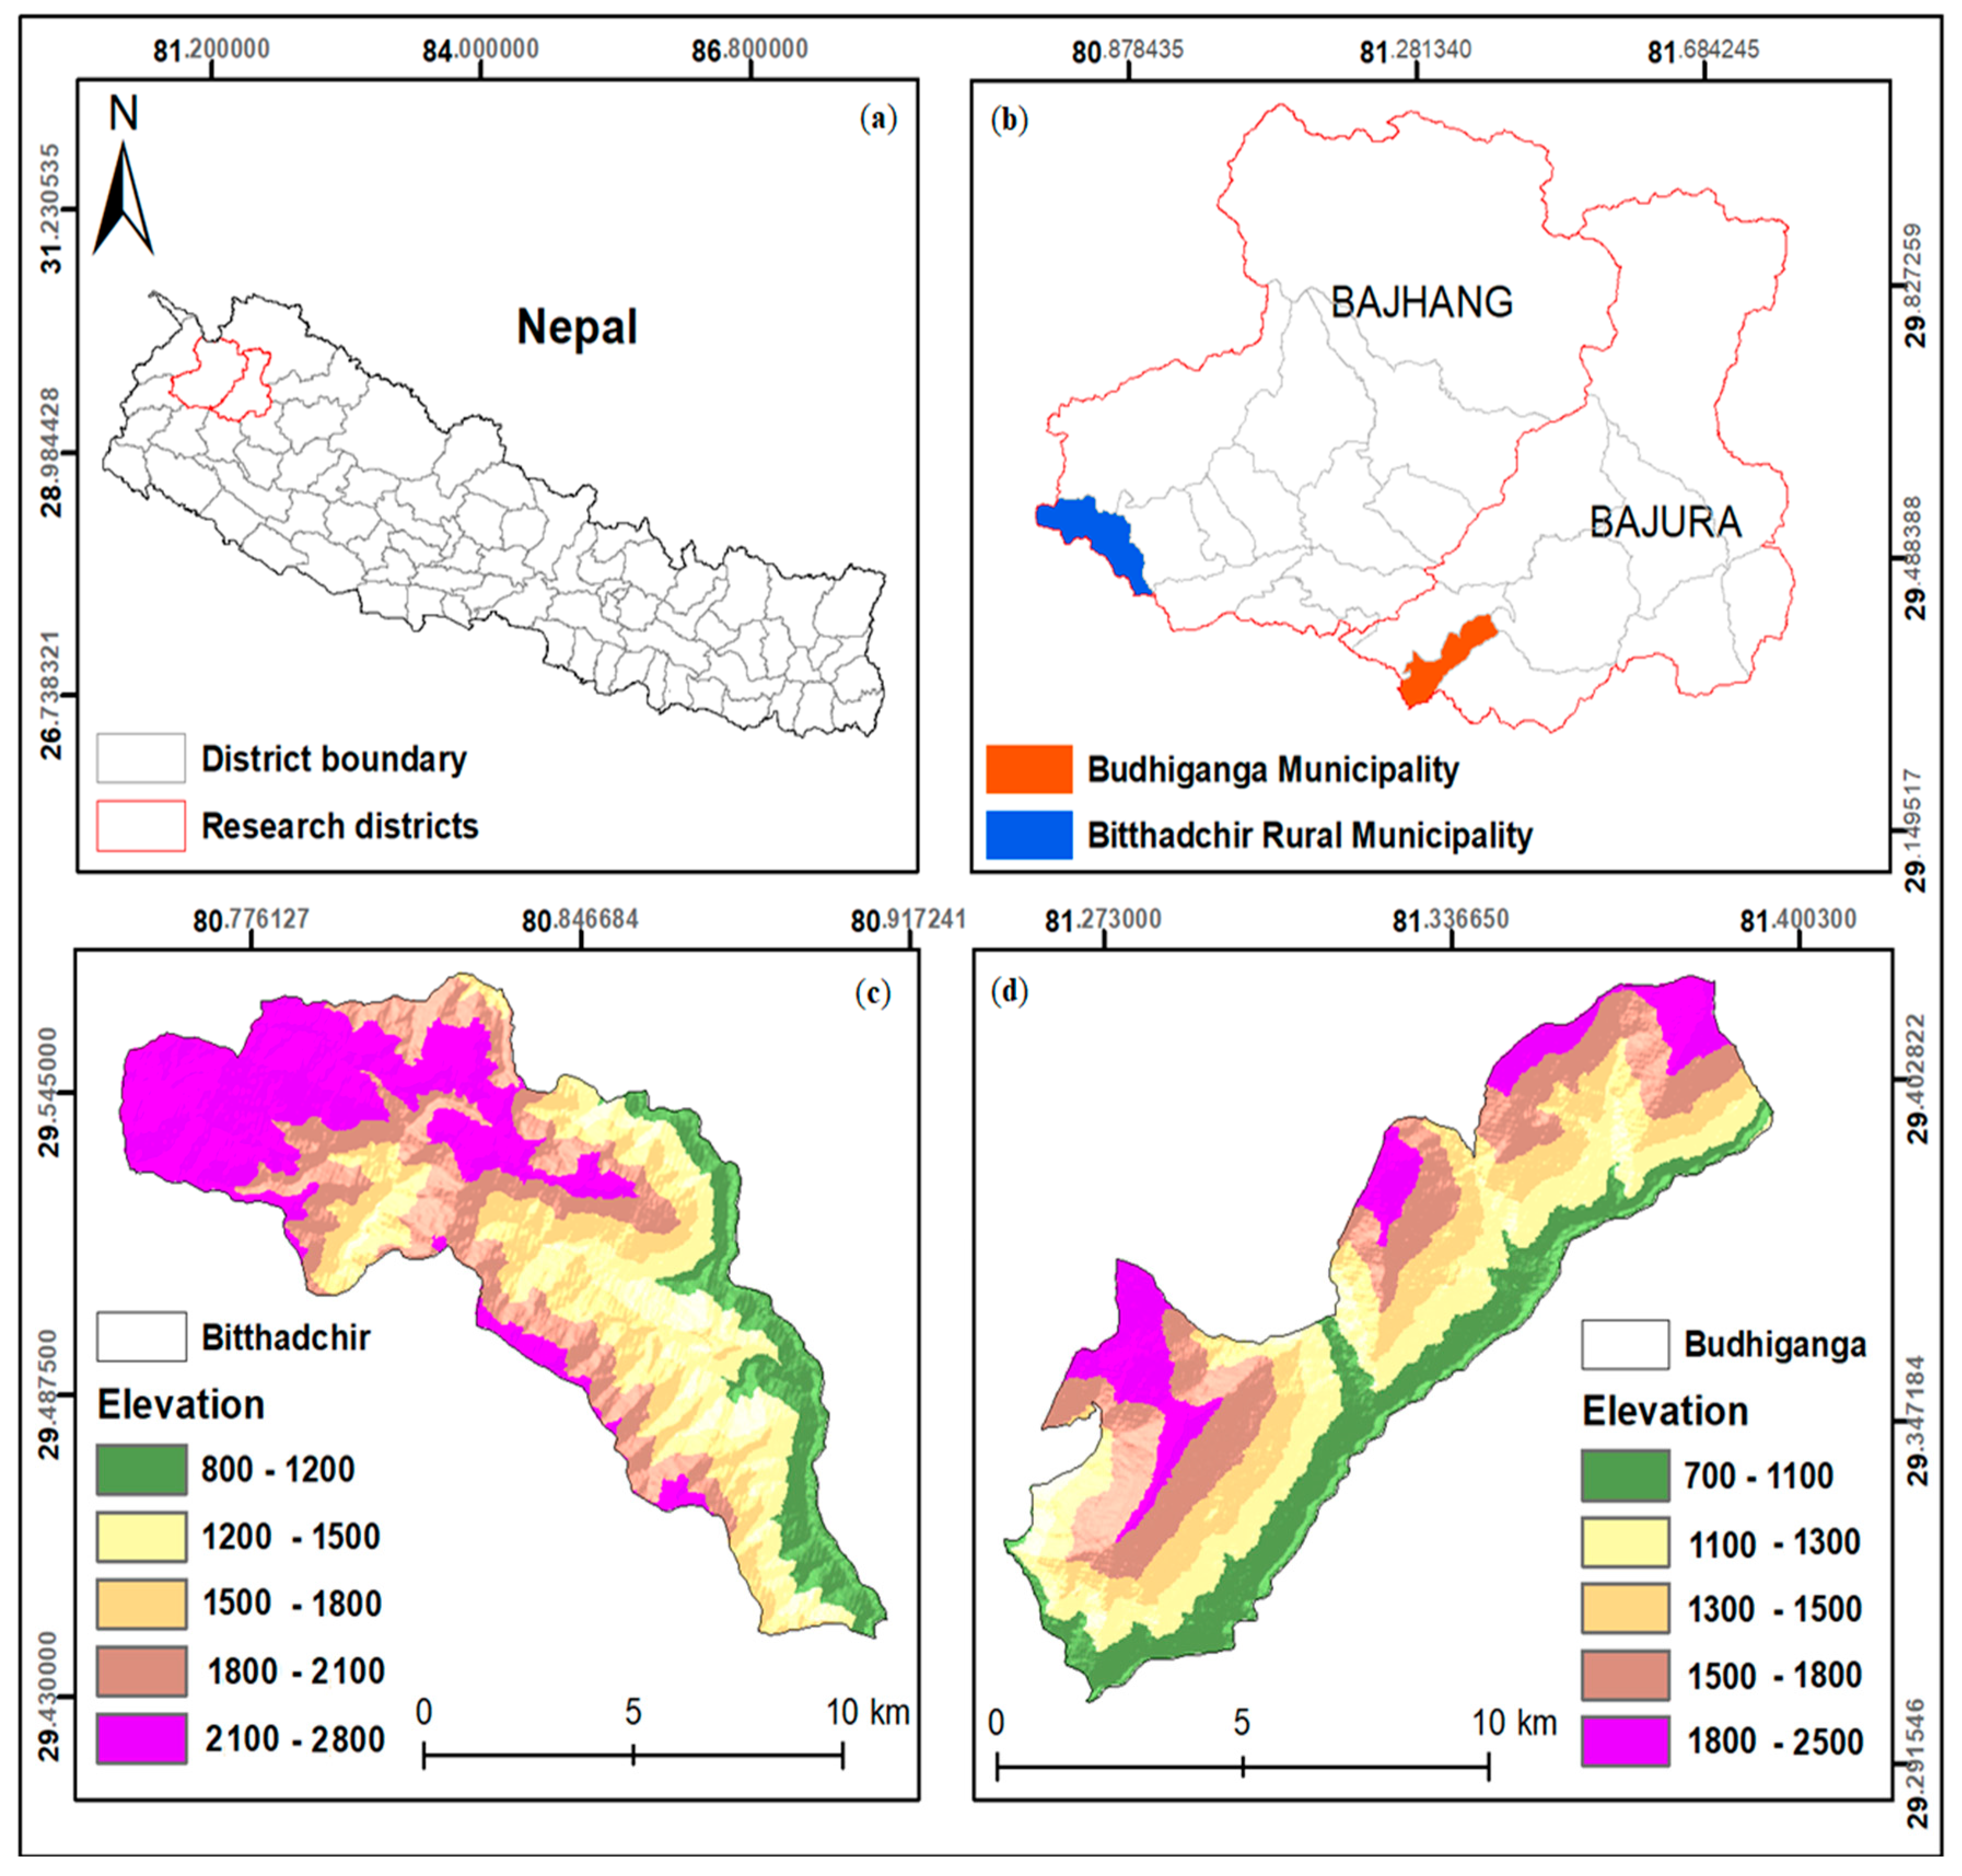
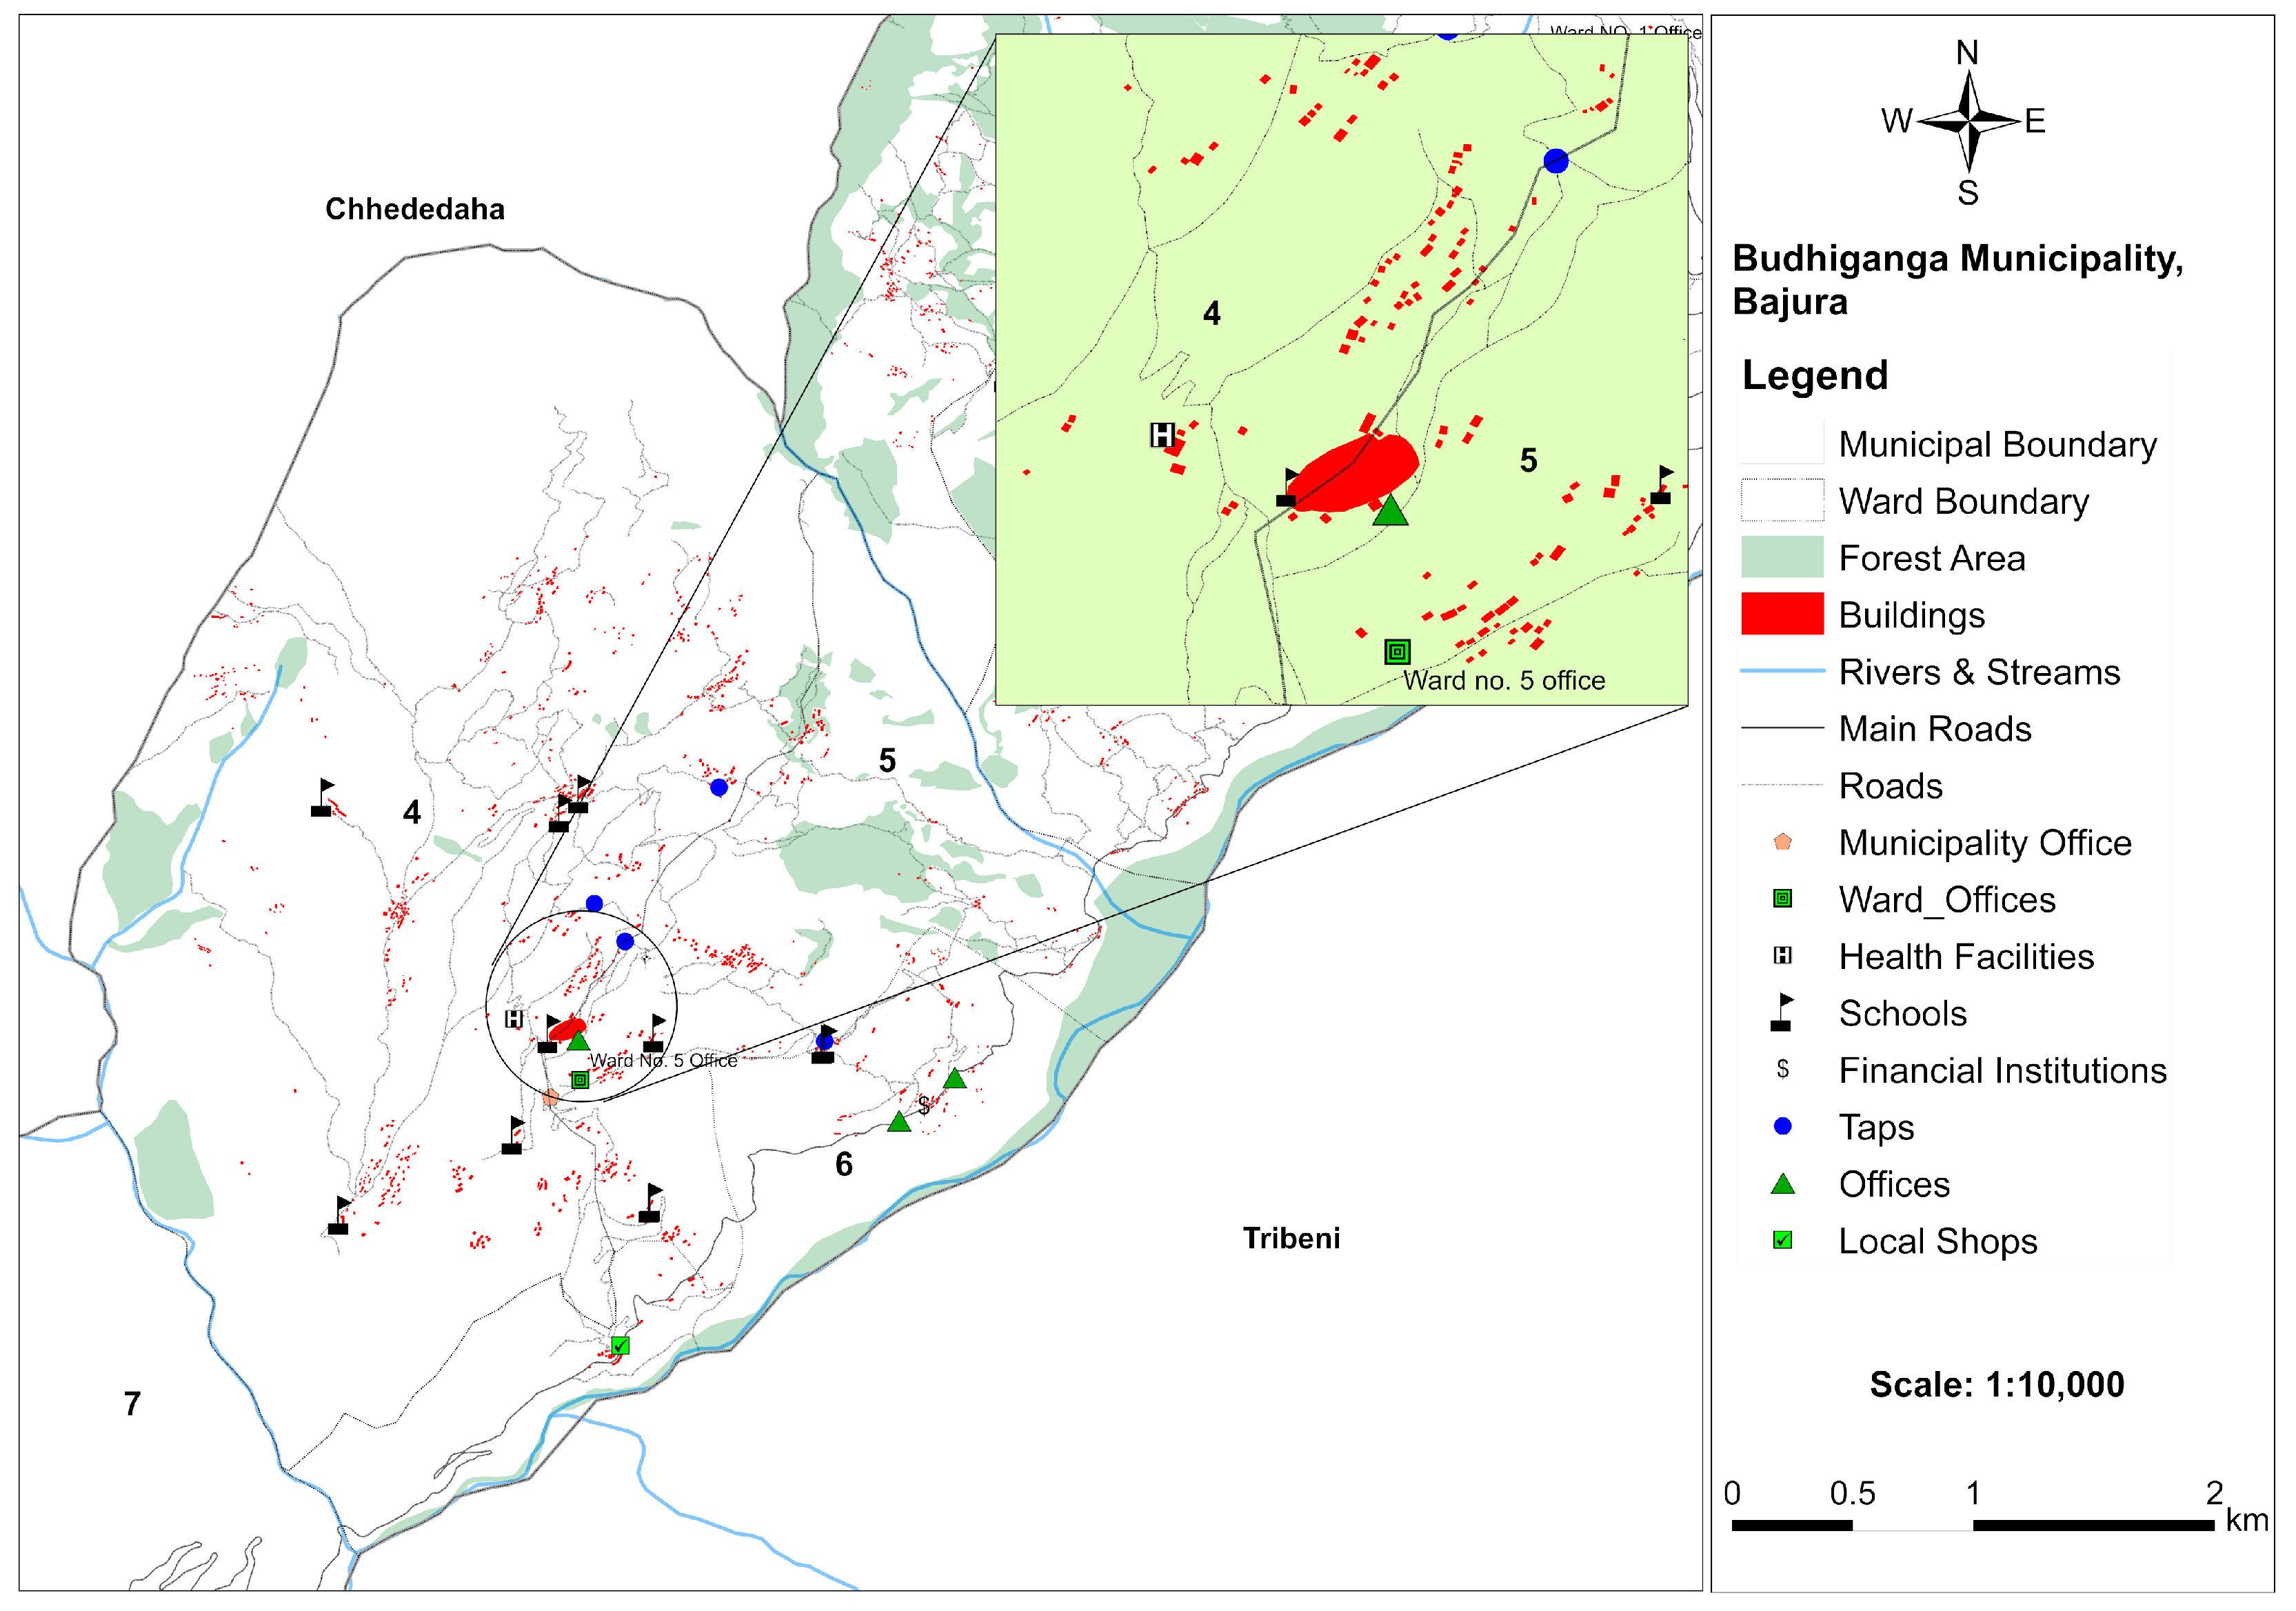
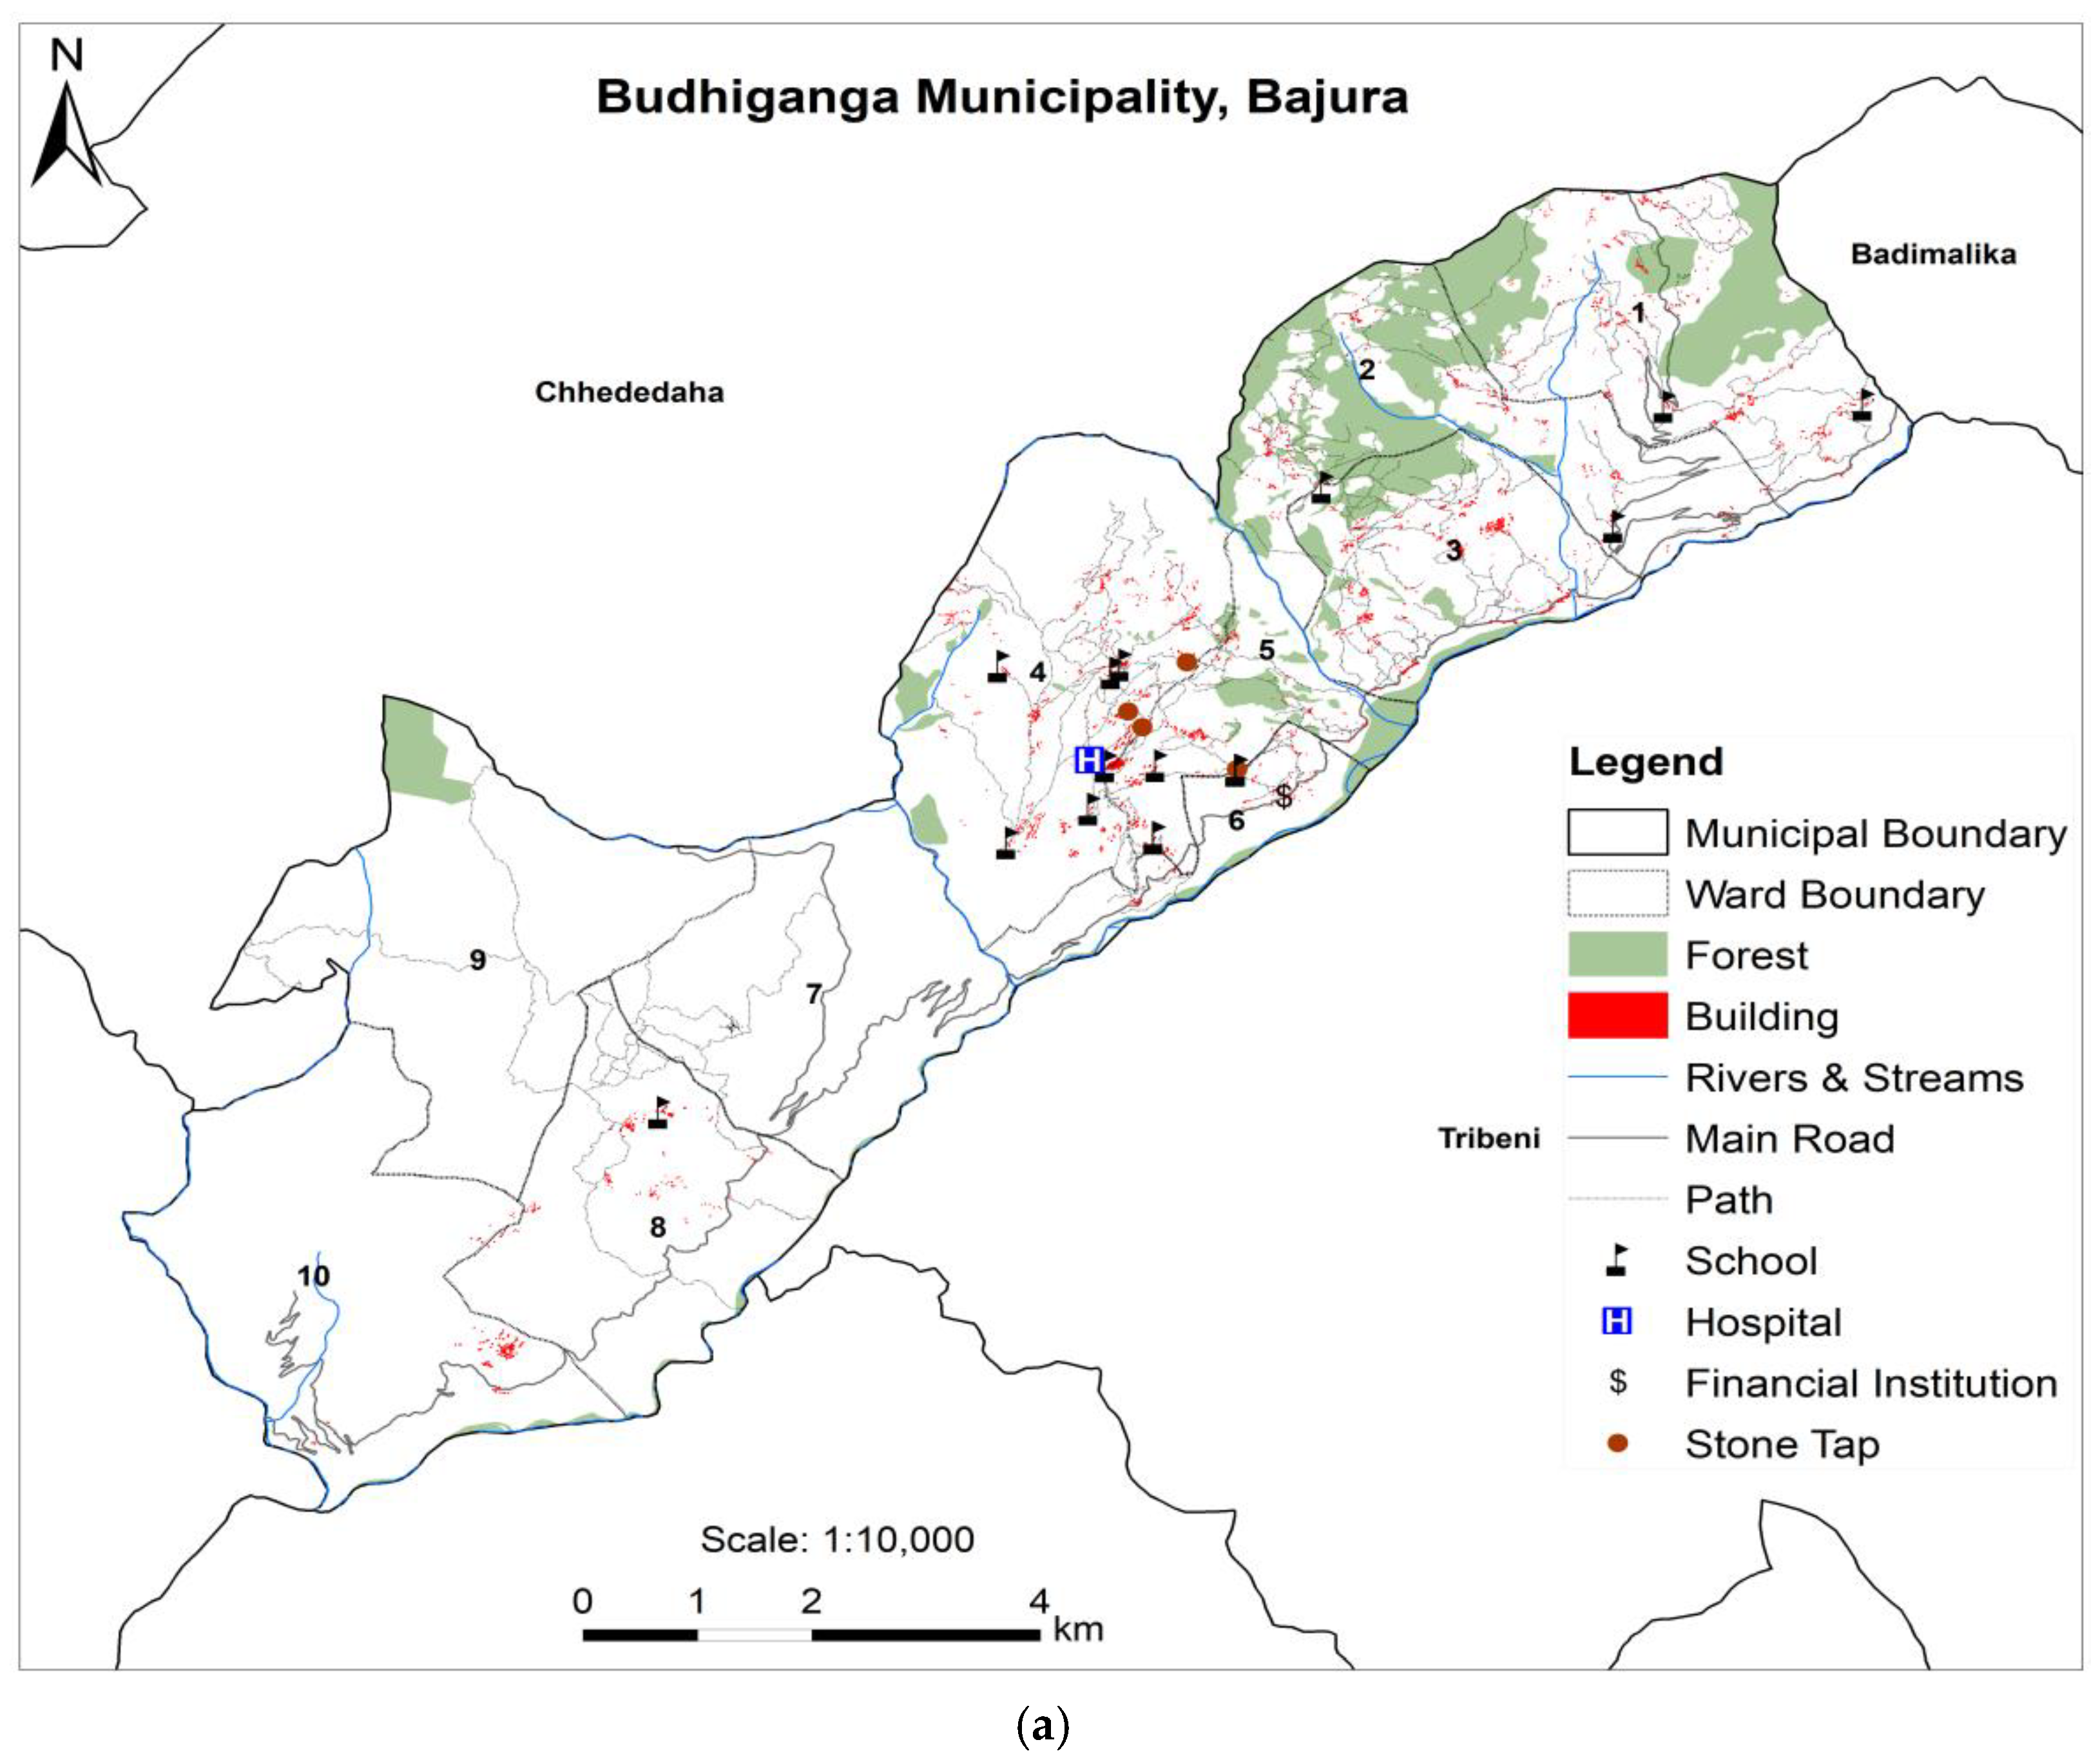
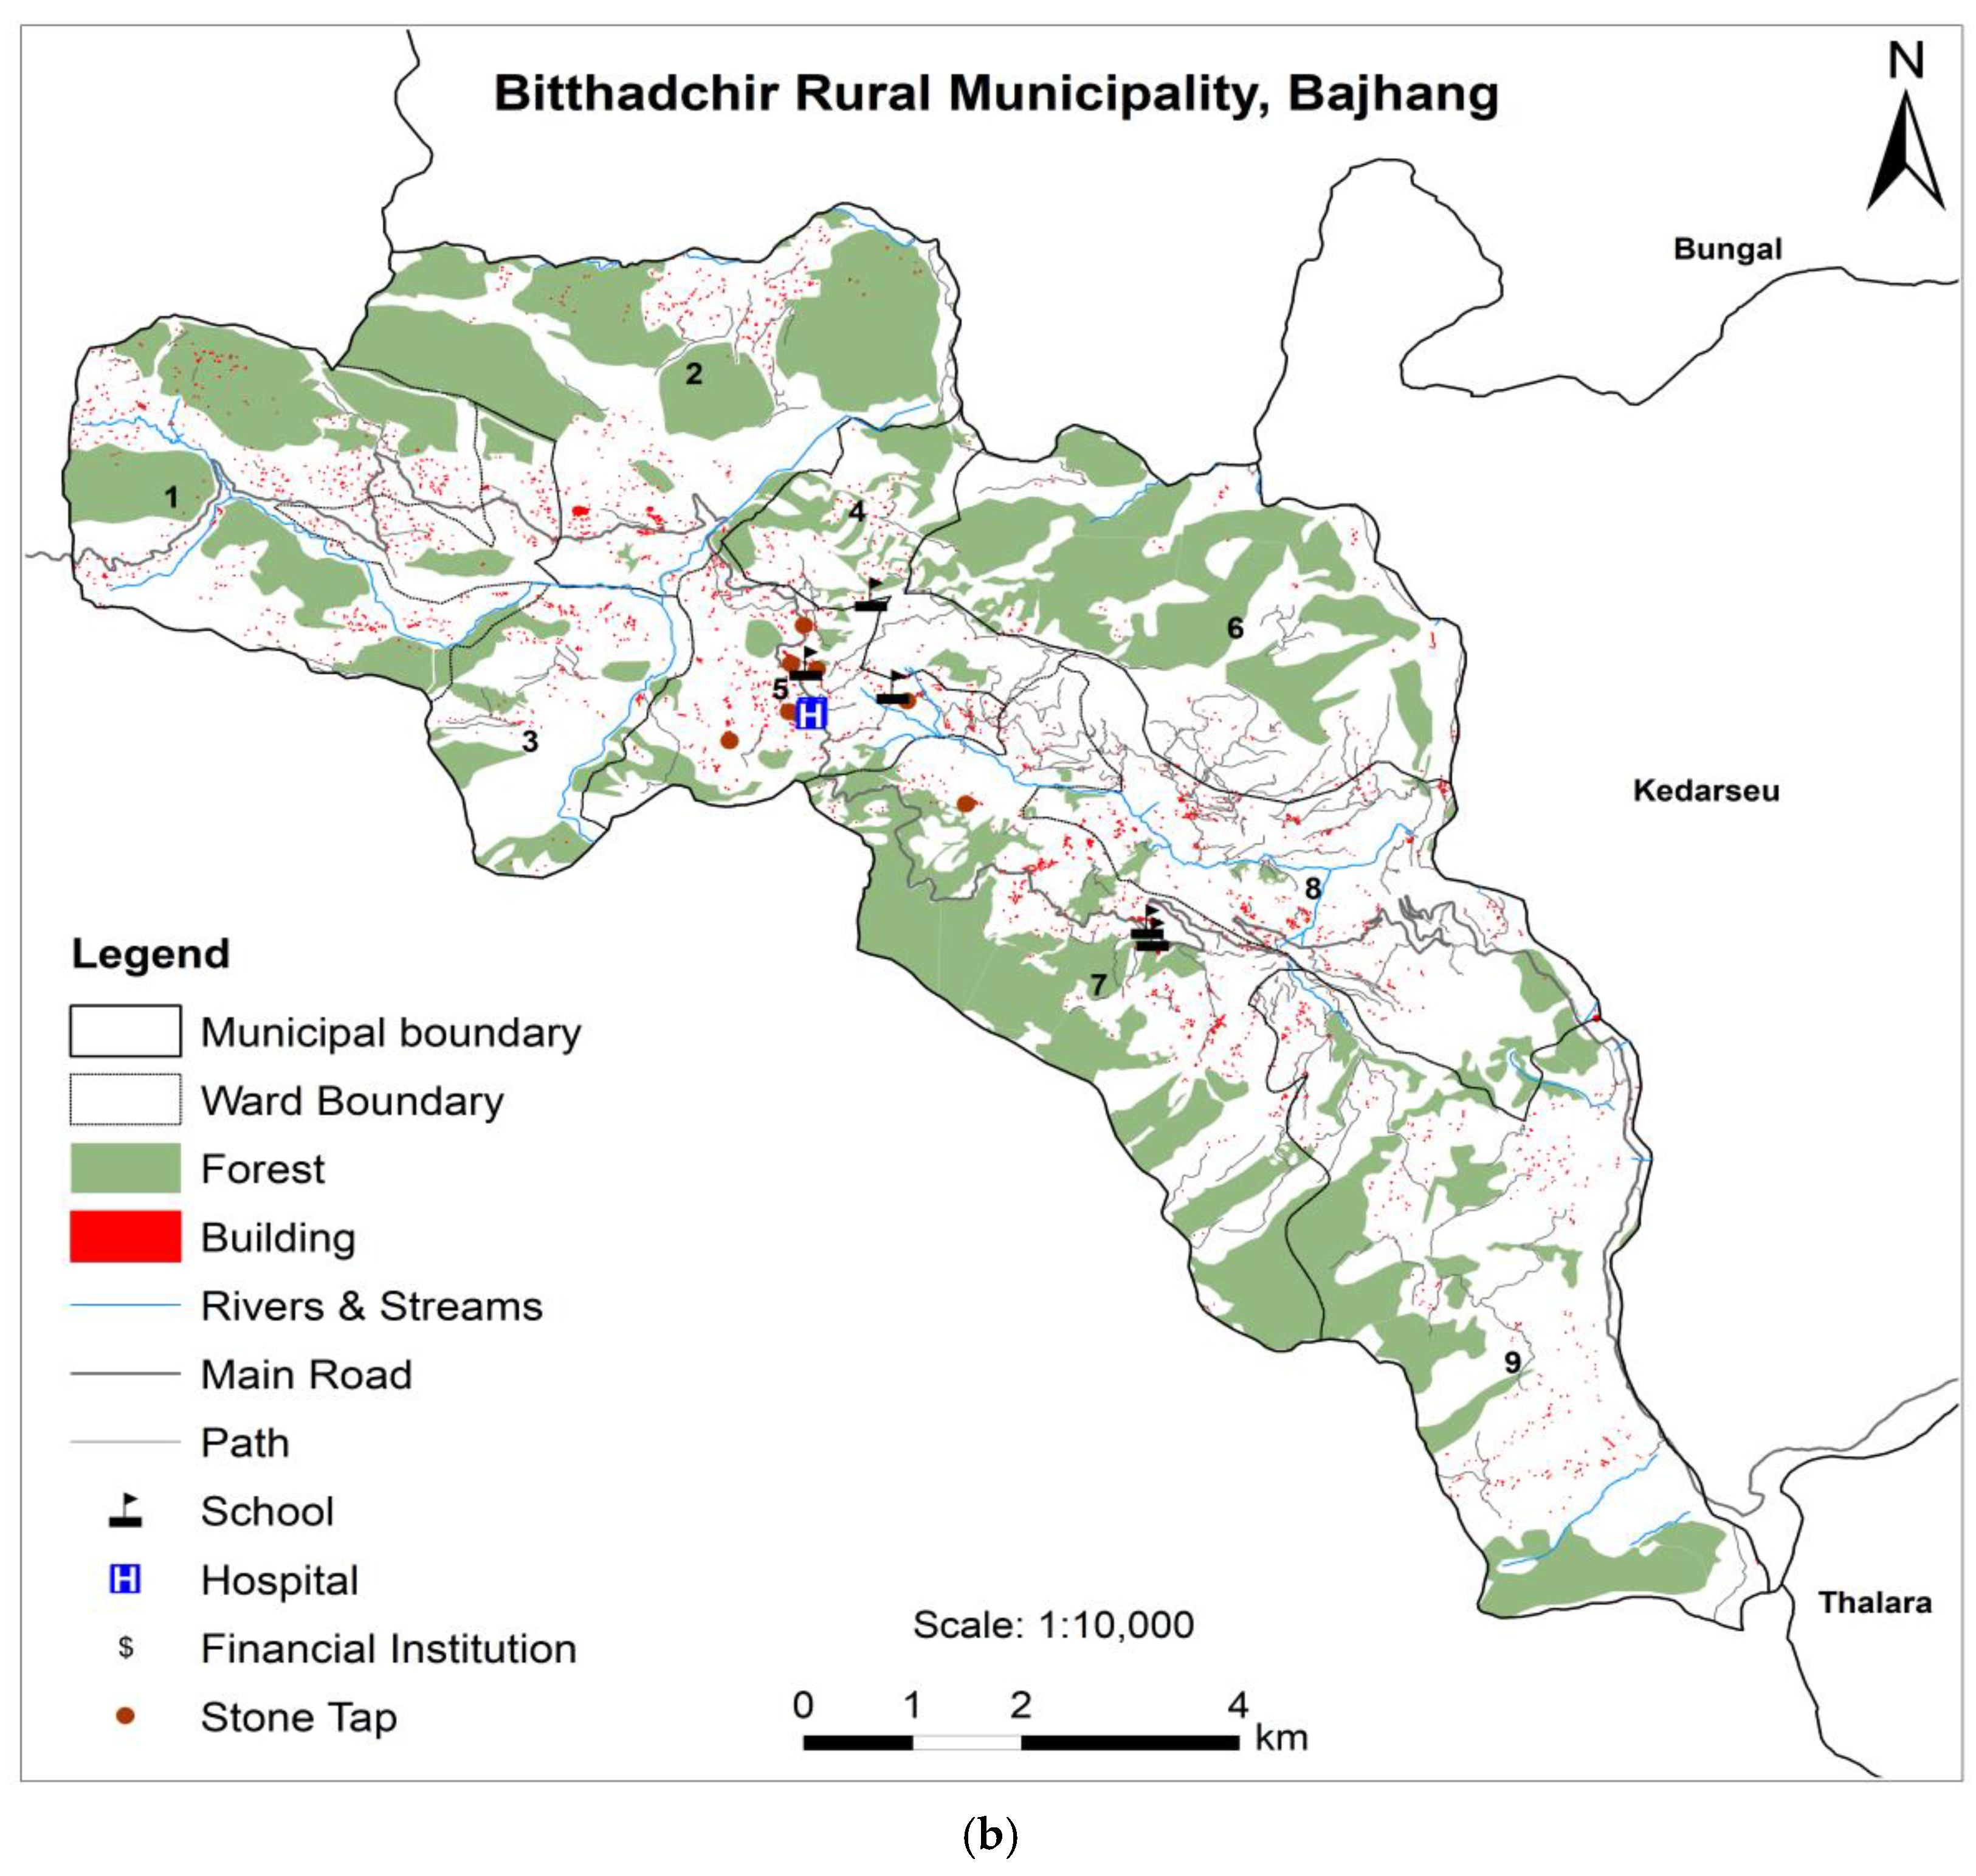
2.1. Study Area
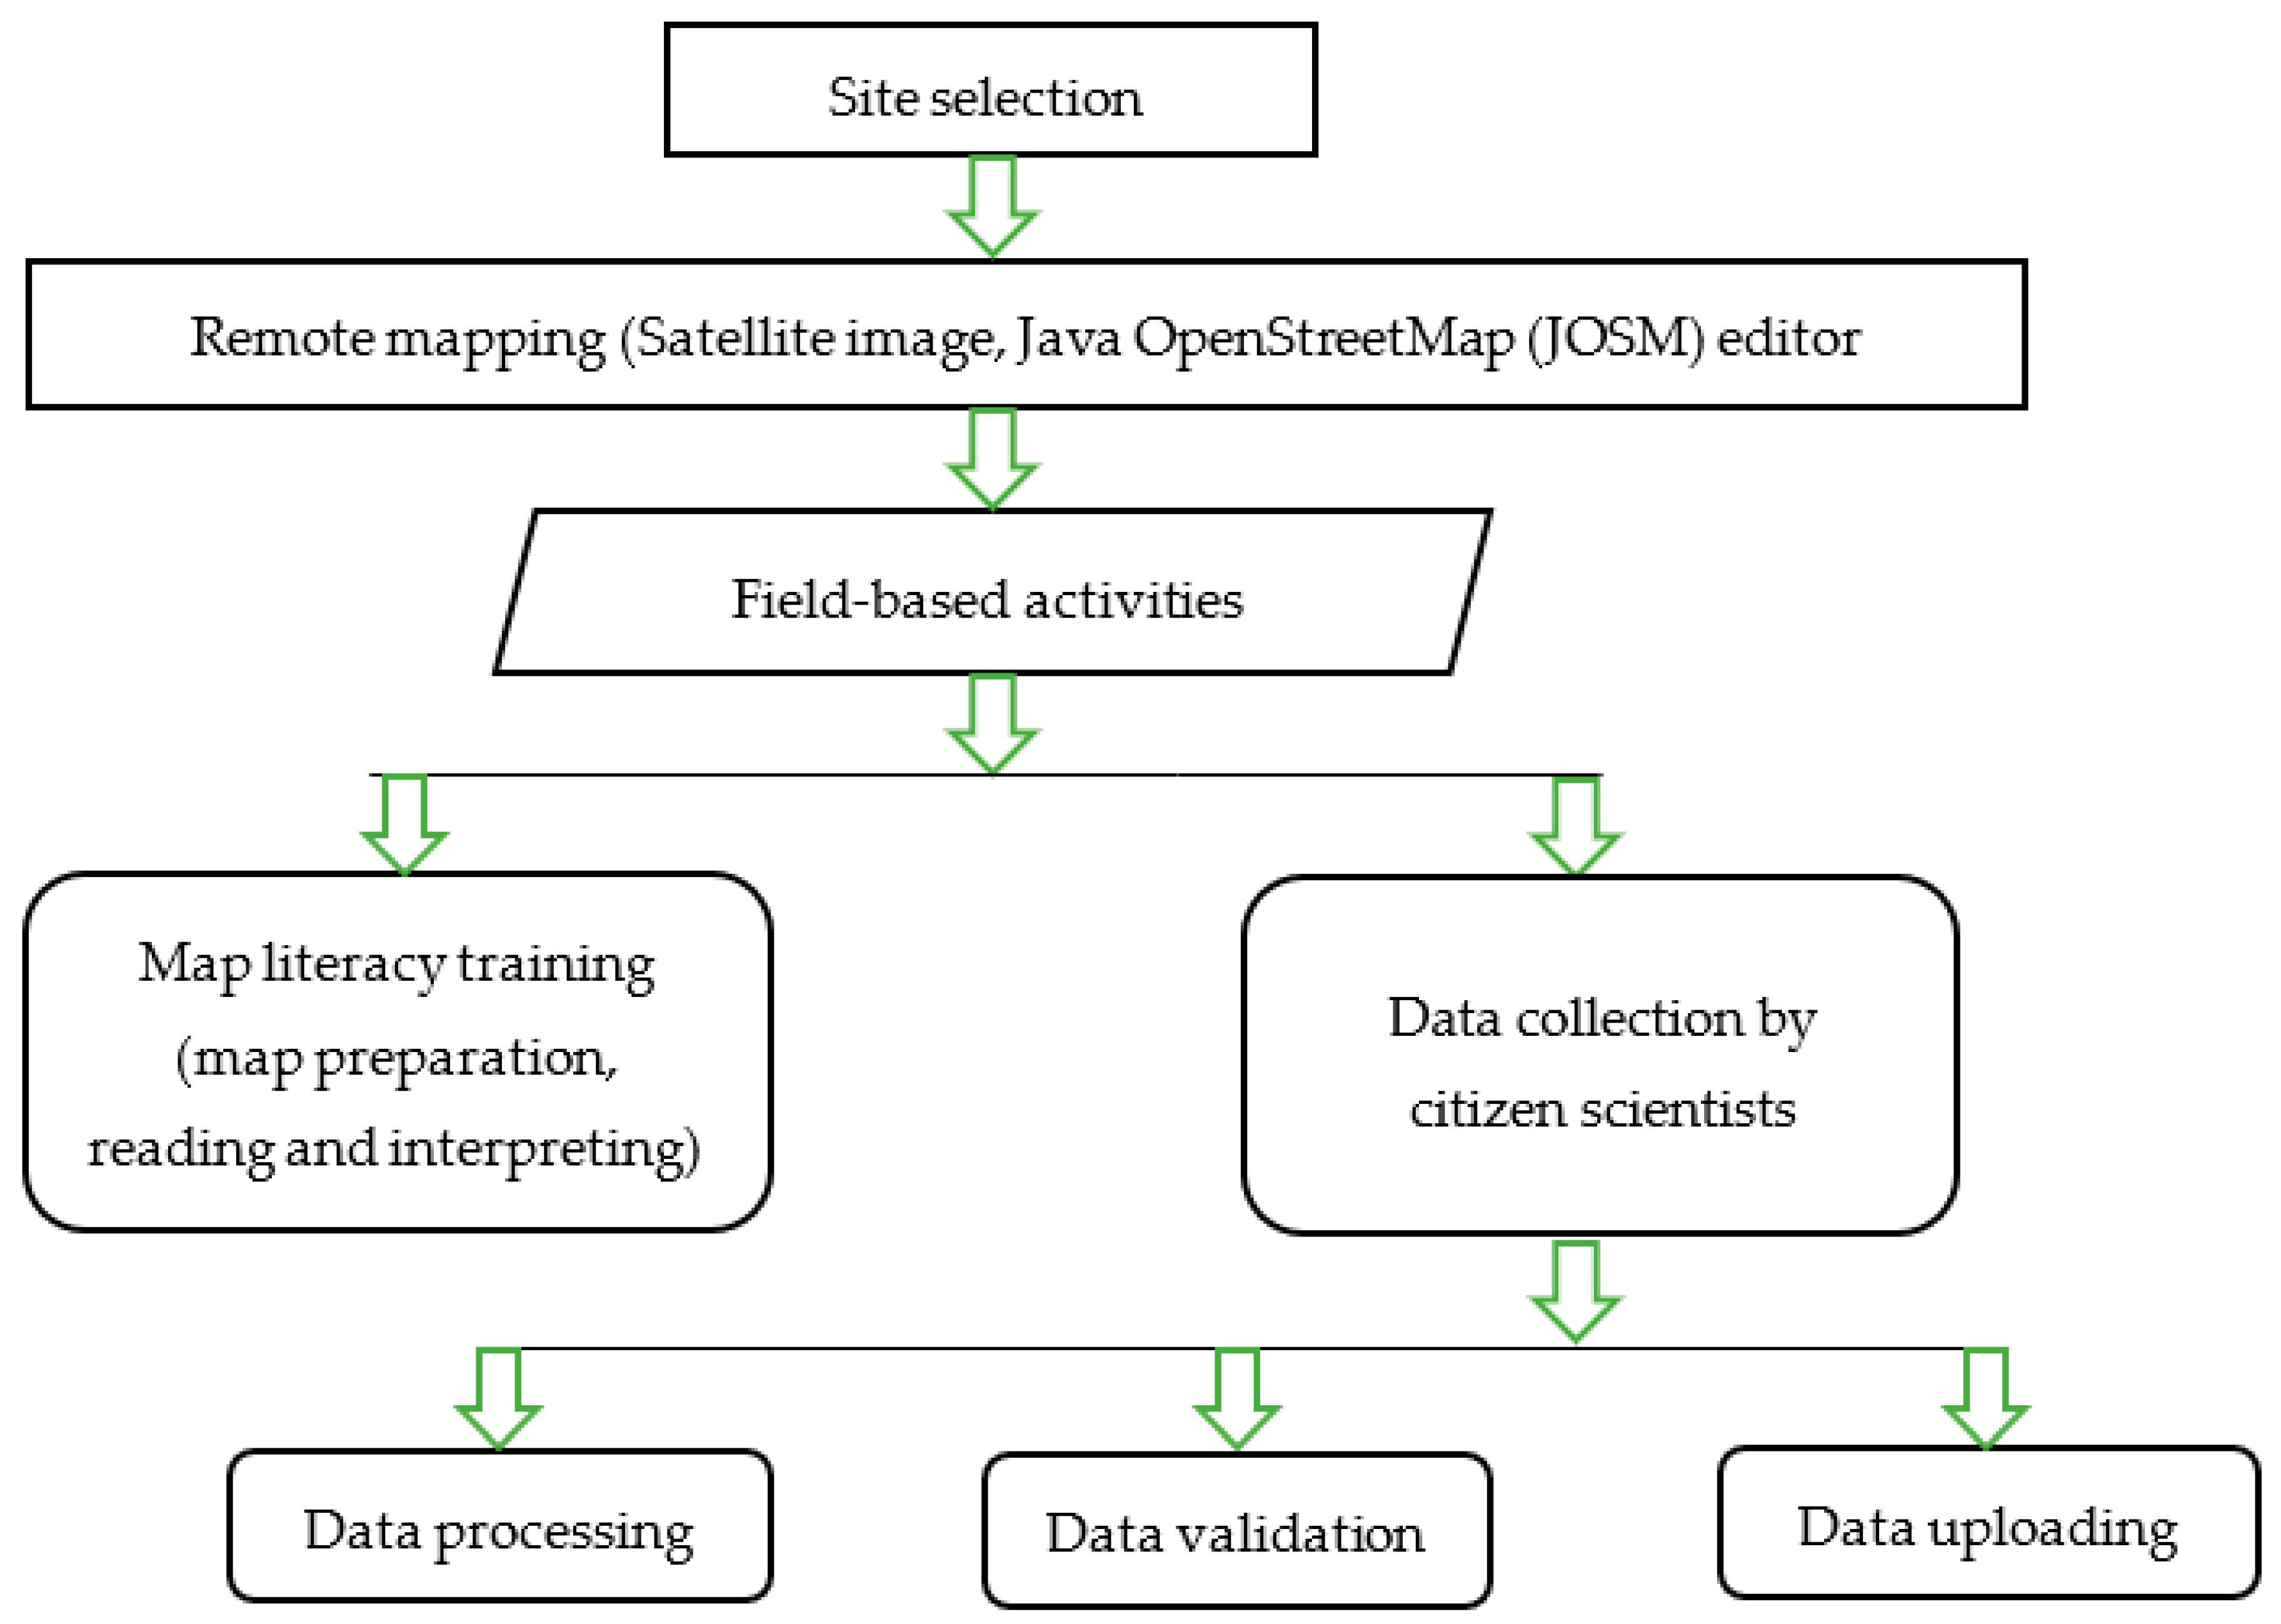
2.2. Methods
2.2.1. Citizen Science for Collaborative Mapping
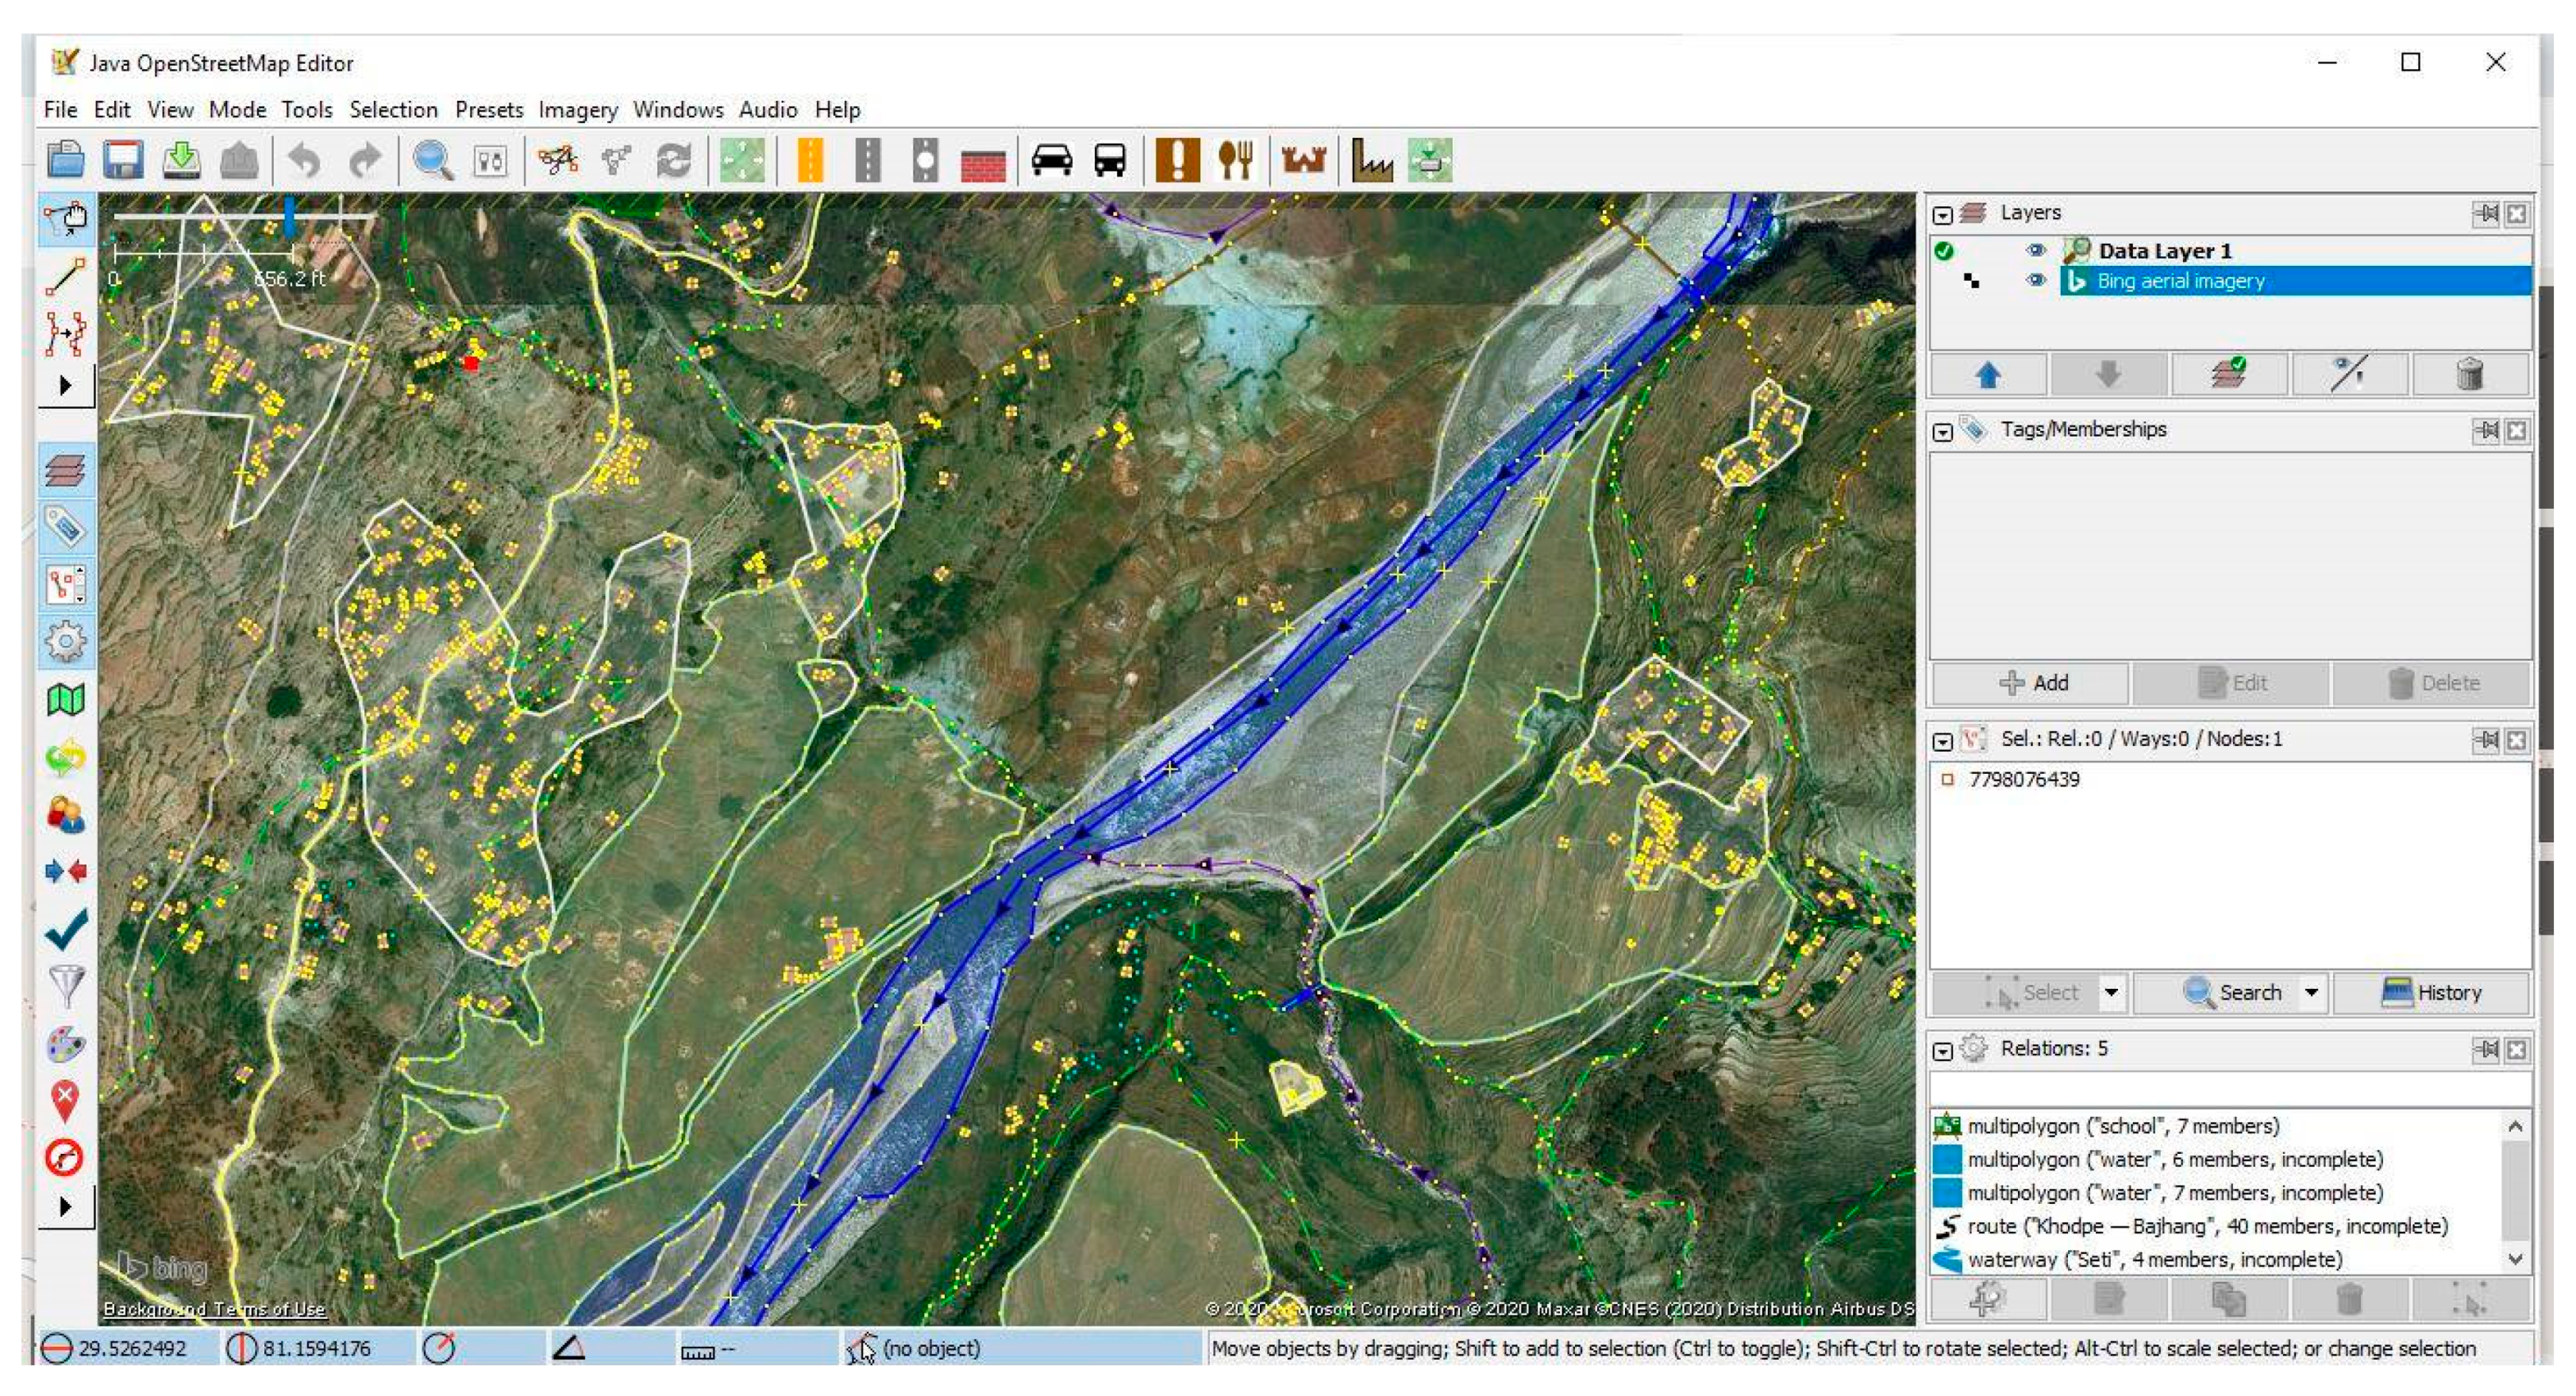
2.2.2. Remote Mapping
2.2.3. Map Literacy and OSM Training
2.2.4. Tools and Software Used
2.2.5. Data Processing, Analysis, Validation, and Uploading
3. Results
3.1. Remote Mapping of Two Districts
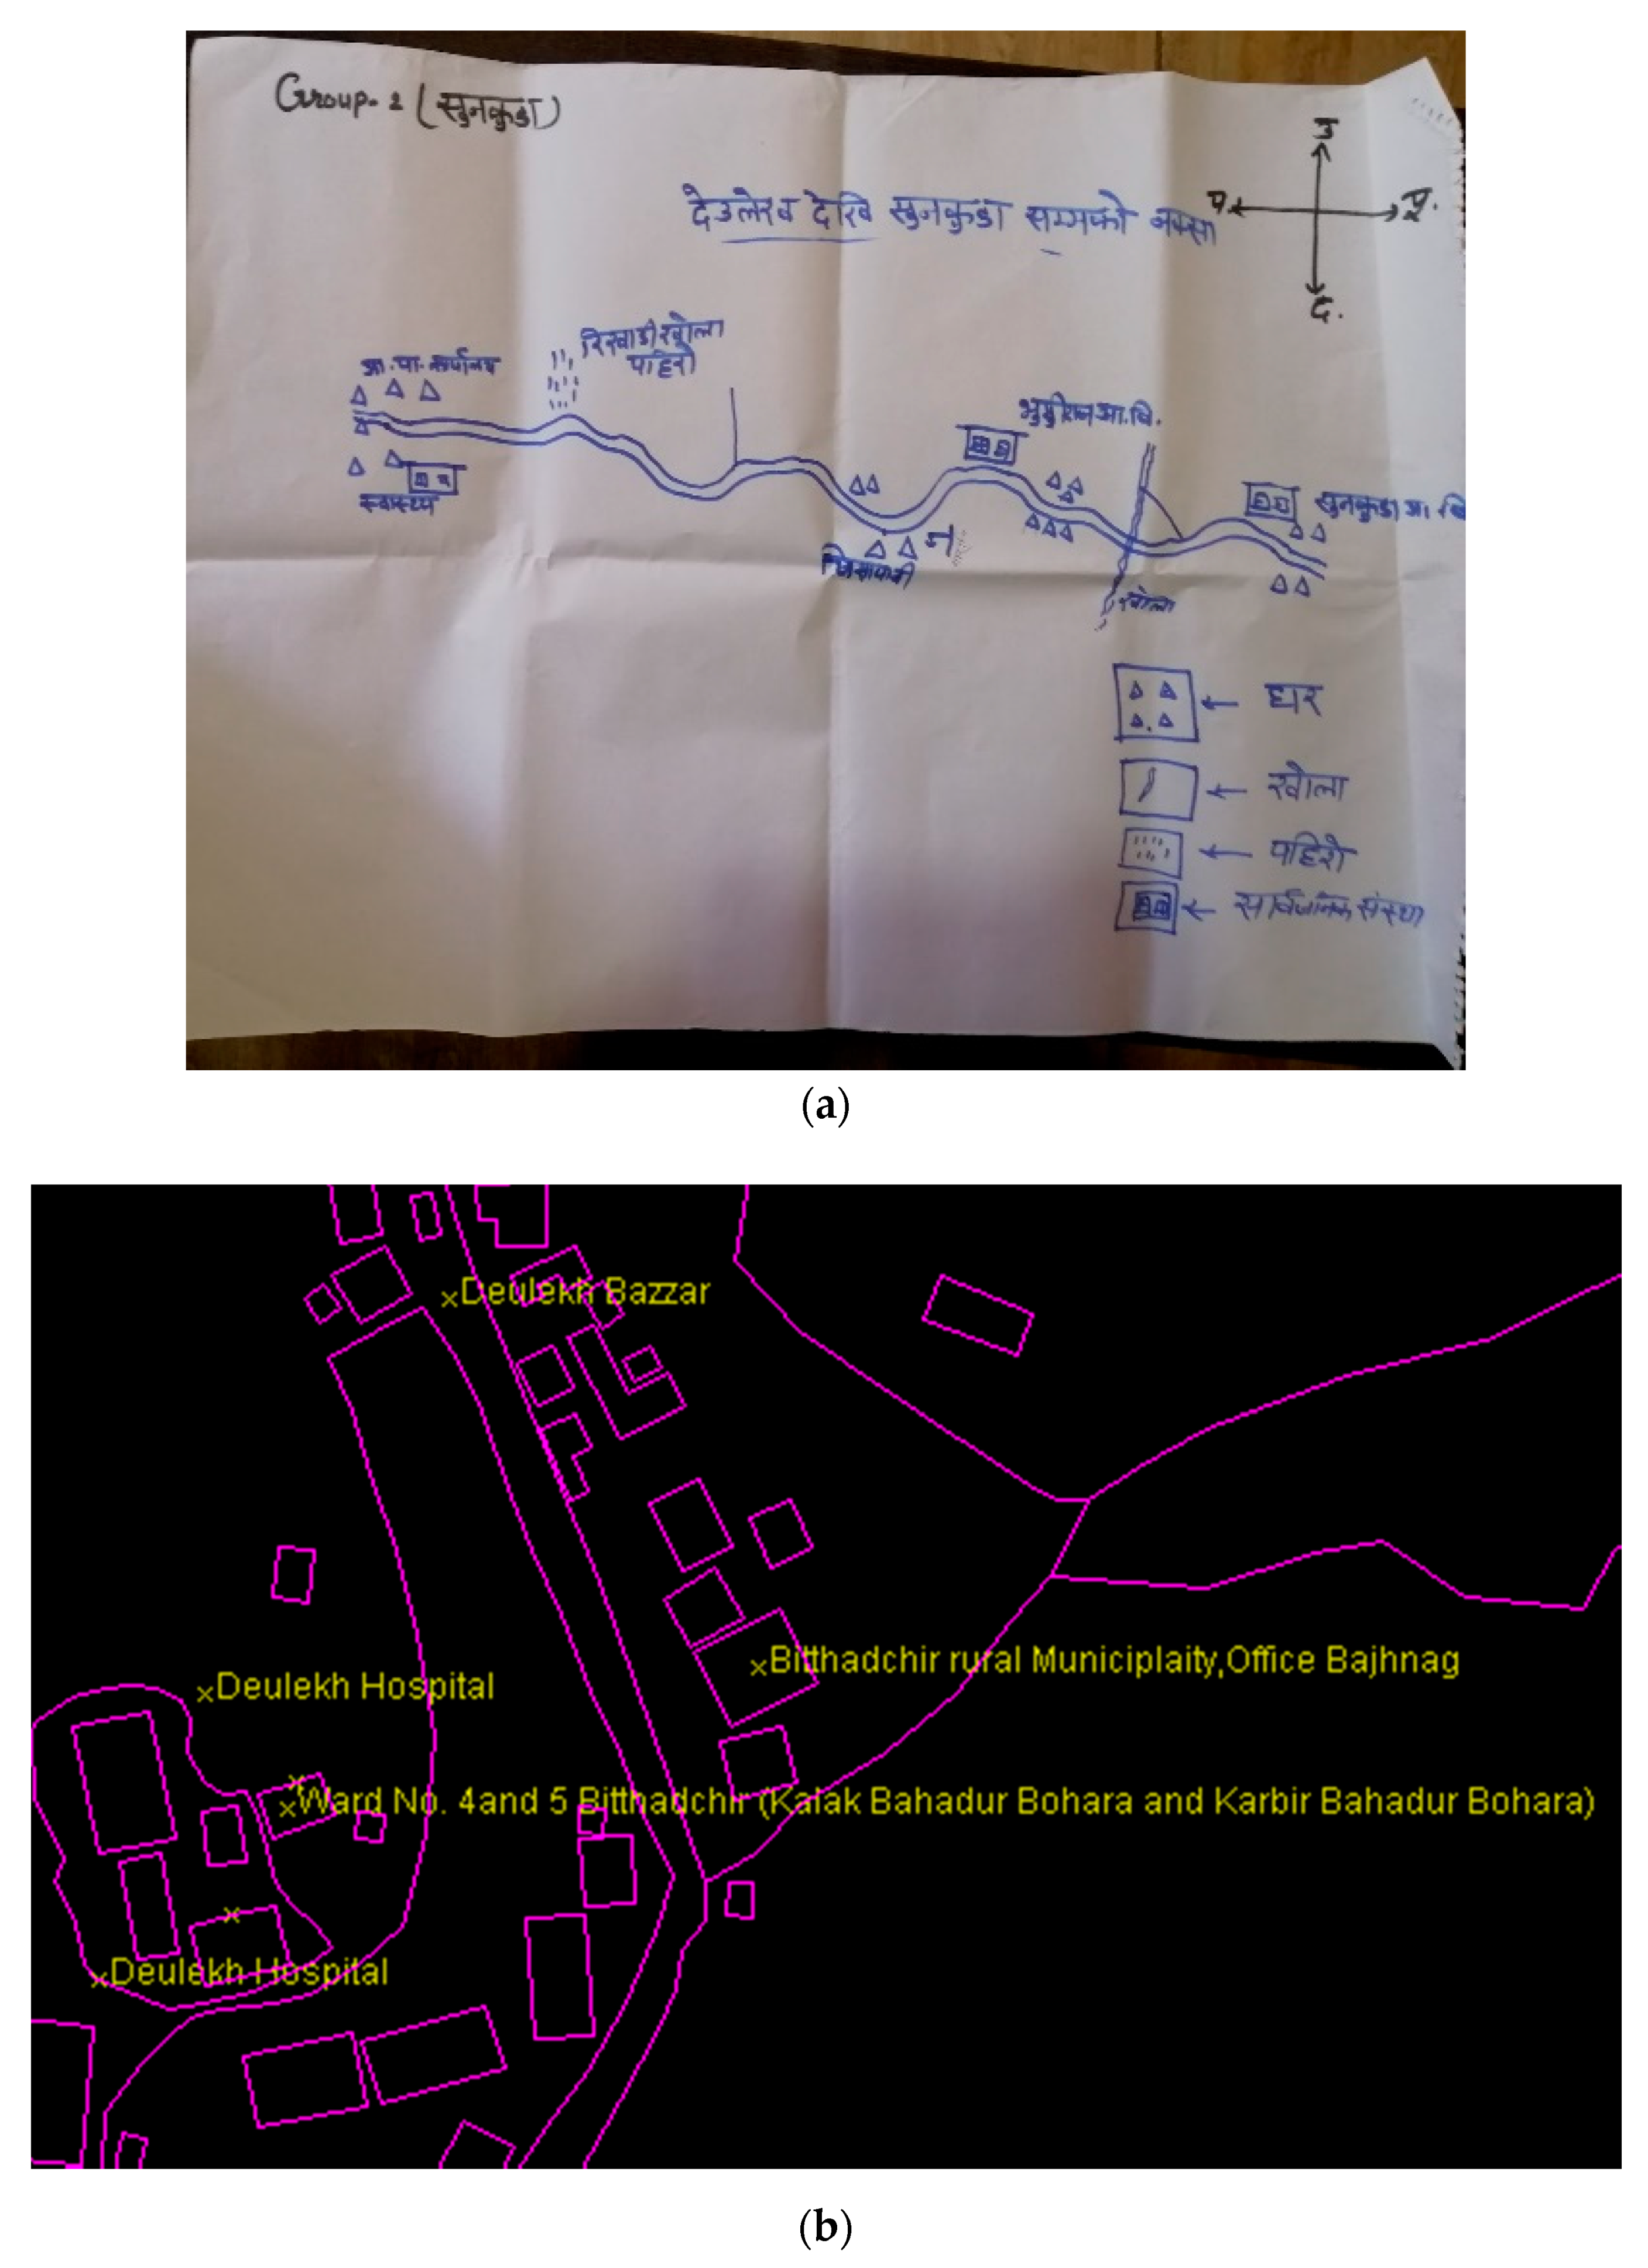
3.2. From Paper-Based Maps to Digital Maps
3.3. Map Literacy and Interest in Digital Mapping
3.4. Technology in Resilience Building
4. Discussion
“Before this training, none of the ward offices in our municipality were mapped. but after going through this training, I was able to map all the ward offices of our municipality along with the respective contact details and upload the data to OSM platform”—Feedback from the IT Officer at Budhiganga Municipality, Bajura.
5. Conclusions
Author Contributions
Funding
Acknowledgments
Conflicts of Interest
References
- Ministry of Home Affairs. Nepal Disaster Report 2017: The Road to Sendai; Government of Nepal: Kathmandu, Nepal, 2017.
- UNDRR. Disaster Risk Reduction in Nepal: Status Report; United Nations Office for Disaster Risk Reduction (UNDRR), Regional Office for Asia and the Pacific: Bangkok, Thailand, 2019. [Google Scholar]
- Aksha, S.K.; Emrich, C.T. Benchmarking Community Disaster Resilience in Nepal. Int. J. Environ. Res. Public Health 2020, 17, 1985. [Google Scholar] [CrossRef]
- Nepal Disaster Management Reference Handbook. Available online: https://reliefweb.int/report/nepal/nepal-disaster-management-reference-handbook-august-2017 (accessed on 15 September 2020).
- Ministry of Home Affairs. Nepal Disaster Report; Government of Nepal: Kathmandu, Nepal, 2019; pp. 1–73.
- Nepal Disaster Risk Reduction Portal. Available online: http://drrportal.gov.np/ (accessed on 10 September 2020).
- Southasia Institute of Advanced Studies. Post-Earthquake Disaster Governance in Nepal: Reflections from Practice and Policy; Nepal South Asia Institute of Advanced Studies: Kathmandu, Nepal, 2016. [Google Scholar]
- Chatterjee, R.; Shiwaku, K.; Das Gupta, R.; Nakano, G.; Shaw, R. Bangkok to Sendai and Beyond: Implications for Disaster Risk Reduction in Asia. IJDRR 2015, 6, 177–188. [Google Scholar] [CrossRef]
- Ospina, A.V. Big Data for Resilience Storybook: Experiences Integrating Big Data into Resilience Programming; Canada International Institute for Sustainable Development: Winnipeg, MB, Canada, 2018. [Google Scholar]
- GFDRR. Open Data for Resilience Initiative: Policy Notes and Principles; World Bank: Washington, DC, USA, 2016. [Google Scholar]
- Nicoson, C.; Uexkull, N.V. Overlapping Vulnerabilities: The Impacts of Climate Change on Humanitarian Needs; Norwegian Red Cross: Oslo, Norway, 2019. [Google Scholar]
- United Nations Office for Disaster Risk Reduction (UNDRR). Available online: https://www.undrr.org/terminology/resilience (accessed on 29 October 2020).
- Data-Pop Alliance. Available online: https://datapopalliance.org/item/dfid-big-data-for-resilience-synthesis-report (accessed on 4 August 2020).
- Corbett, J. Good Practices in Participatory Mapping; International Fund for Agricultural Development: Rome, Italy, 2009. [Google Scholar]
- Liu, W.; Dugar, S.; McCallum, I.; Thapa, G.; See, L.; Khadka, P.; Budhathoki, N.; Brown, S.; Mechler, R.; Fritz, S.; et al. Integrated Participatory and Collaborative Risk Mapping for Enhancing Disaster Resilience. Int. J. GeoInf. 2018, 7, 68. [Google Scholar] [CrossRef]
- Goodchild, M.F. Citizens as sensors: The world of volunteered geography. GeoJournal 2007, 69, 211–221. [Google Scholar] [CrossRef]
- Moor, A.D. Common Agenda Setting through Participatory Collaboration Mapping: A Knowledge Base-Driven Approach. In Proceedings of the 16th CIRN Conference Monash Centre, Prato, Italy, 24–26 October 2018. [Google Scholar]
- Panek, J.; Netek, R. Collaborative Mapping and Digital Participation: A Tool for Local Empowerment in Developing Countries. Information 2019, 10, 255. [Google Scholar] [CrossRef]
- USGS. Available online: https://www.usgs.gov/core-science-systems/ngp/cegis/vgi (accessed on 22 September 2020).
- Haklay, M. Citizen Science and Volunteered Geographic Information—Overview and typology of participation. In Crowdsourcing Geographic Knowledge: Volunteered Geographic Information (VGI) in Theory and Practice; Sui, D.Z., Elwood, S., Goodchild, M.F., Eds.; Springer: Berlin/Heidelberg, Germany, 2013; pp. 105–122. [Google Scholar]
- Dorn, H.; Törnros, T.; Zipf, A. Quality Evaluation of VGI Using Authoritative Data—A Comparison with Land Use Data in Southern Germany. ISPRS Int. J. GeoInf. 2015, 4, 1657–1671. [Google Scholar] [CrossRef]
- Lin, W. Volunteered Geographic Information constructions in a contested terrain: A case of OpenStreetMap in China. Geoforum 2018, 89, 73–82. [Google Scholar] [CrossRef]
- Neis, P.; Zielstra, D. Recent Developments and Future Trends in Volunteered Geographic Information Research: The Case of OpenStreetMap. Future Internet 2014, 6, 76–106. [Google Scholar] [CrossRef]
- Bégin, D.; Devillers, R.; Roche, S. Assessing Volunteered Geographic Information (VGI) Quality Based on Contributors’ Mapping Behaviours. Int. Arch. Photogramm. Remote Sens. Spat. Inf. Sci. 2013, 149–154. [Google Scholar] [CrossRef]
- Haworth, B.T.; Bruce, E.; Whittaker, J.; Read, R. The Good, the Bad, and the Uncertain: Contributions of Volunteered Geographic Information to Community Disaster Resilience. Front. Earth Sci. 2018, 6, 183. [Google Scholar] [CrossRef]
- Kocaman, S.; Anbaroglu, B.; Gokceoglu, C.; Altan, O. A Review on Citizen Science (CITSCI) Applications for Disaster Management. Int. Arch. Photogramm. Remote Sens. Spat. Inf. Sci. 2018, 301–306. [Google Scholar] [CrossRef]
- Yalcin, I.; Kocaman, S.; Gokceoglu, C. A CitSci Approach for Rapid Earthquake Intensity Mapping: A Case Study from Istanbul (Turkey). ISPRS Int. J. GeoInf. 2020, 9, 266. [Google Scholar] [CrossRef]
- Haworth, B. Emergency Management Perspectives on Volunteered Geographic Information: Opportunities, Challenges and Change. Comput. Environ. Urban Syst. 2016, 57, 189–198. [Google Scholar] [CrossRef]
- Aksha, S.K.; Resler, L.M.; Juran, L.; Carstensen, L.W. A geospatial analysis of multi-hazard risk in Dharan, Nepal. Geomat. Nat. Hazards Risk 2020, 11, 88–111. [Google Scholar] [CrossRef]
- Sharma, P.; Guha-Khasnobis, B.; Khanal, D.R. Nepal Human Development Report 2014, Beyond Geography, Unlocking Human Potential; National Planning Commission, Government of Nepal, United Nations Development Programme: Kathmandu, Nepal, 2014.
- Ministry of Home Affairs. Nepal Disaster Report 2015; Government of Nepal, Disaster Preparedness Network-Nepal (DPNet-Nepal): Kathmandu, Nepal, 2017.
- Weyer, D.; Bezerra, J.C.; Vos, A.D. Participatory Mapping in a Developing Country Context: Lessons from South Africa. Land 2020, 8, 134. [Google Scholar] [CrossRef]
- Java OpenStreetMap. Available online: https://josm.openstreetmap.de/ (accessed on 9 September 2020).
- OSM Tracker. Available online: https://play.google.com/store/apps/details?id=net.osmtracker&hl=en (accessed on 9 September 2020).
- Rossi, F.; Rosli, A.; Yip, N. Academic engagement as knowledge co-production and implications for impact: Evidence from Knowledge Transfer Partnerships. J. Bus. Res. 2017, 80, 1–9. [Google Scholar] [CrossRef]
- Wamsler, C. Stakeholder involvement in strategic adaptation planning: Transdisciplinarity and Co-production at Stake? Environ. Sci. Policy 2017, 75, 148–157. [Google Scholar] [CrossRef]
- Hegger, D.; Lamers, M.; Van Zeijl-Rozema, A.; Dieperink, C. Conceptualising joint knowledge production in regional climate change adaptation projects: Success conditions and levers for action. Environ. Sci. Policy 2012, 18, 52–65. [Google Scholar] [CrossRef]
- Lemos, M.C.; Morehouse, B.J. The co-production of science and policy in integrated climate assessments. Glob. Environ. Chang. 2005, 15, 57–68. [Google Scholar] [CrossRef]
- Groot, A.M.E.; Bosch, P.R.; Buijs, S.; Jacobs, C.M.J.; Moors, E.J. Integration in urban climate adaptation: Lessons from Rotterdam on integration between scientific disciplines and integration between scientific and stakeholder knowledge. Build. Environ. 2015, 83, 177–188. [Google Scholar] [CrossRef]
- Edelenbos, J.; van Buuren, A.; van Schie, N. Co-producing knowledge: Joint knowledge production between experts, bureaucrats and stakeholders in Dutch water management projects. Environ. Sci. Policy 2011, 14, 675–684. [Google Scholar] [CrossRef]
- Moreno, J. The role of communities in coping with natural disasters: Lessons from the 2010 Chile Earthquake and Tsunami. Proc. Eng. 2018, 212, 1040–1045. [Google Scholar] [CrossRef]
- Gorddard, R.; Colloff, M.J.; Wise, R.M.; Ware, D.; Dunlop, M. Environmental Science & Policy Values, rules and knowledge: Adaptation as change in the decision context. Environ. Sci. Policy 2016, 57, 60–69. [Google Scholar] [CrossRef]
- Bhanumurthy, V.; Ram Mohan Rao, K.; Jai Sankar, G.; Nagamani, P.V. Spatial data integration for disaster/emergency management: An Indian experience. Spat. Inf. Res. 2017, 25, 303–314. [Google Scholar] [CrossRef]
- Coetzee, S.; Ivánová, I.; Mitasova, H.; Brovelli, M.A. Open geospatial software and data: A review of the current state and a perspective into the future. ISPRS Int. J. GeoInf. 2020, 9, 90. [Google Scholar] [CrossRef]


| Attributes | Edits |
|---|---|
| Building (number) | 24,704 |
| Road (km) | 209.9 |
| Total (number) | 25,899 |
Publisher’s Note: MDPI stays neutral with regard to jurisdictional claims in published maps and institutional affiliations. |
© 2020 by the authors. Licensee MDPI, Basel, Switzerland. This article is an open access article distributed under the terms and conditions of the Creative Commons Attribution (CC BY) license (http://creativecommons.org/licenses/by/4.0/).
Share and Cite
Parajuli, B.P.; Khadka, P.; Baskota, P.; Shakya, P.; Liu, W.; Pudasaini, U.; B.C., R.; Paul, J.D.; Buytaert, W.; Vij, S. An Open Data and Citizen Science Approach to Building Resilience to Natural Hazards in a Data-Scarce Remote Mountainous Part of Nepal. Sustainability 2020, 12, 9448. https://doi.org/10.3390/su12229448
Parajuli BP, Khadka P, Baskota P, Shakya P, Liu W, Pudasaini U, B.C. R, Paul JD, Buytaert W, Vij S. An Open Data and Citizen Science Approach to Building Resilience to Natural Hazards in a Data-Scarce Remote Mountainous Part of Nepal. Sustainability. 2020; 12(22):9448. https://doi.org/10.3390/su12229448
Chicago/Turabian StyleParajuli, Binod Prasad, Prakash Khadka, Preshika Baskota, Puja Shakya, Wei Liu, Uttam Pudasaini, Roniksh B.C., Jonathan D. Paul, Wouter Buytaert, and Sumit Vij. 2020. "An Open Data and Citizen Science Approach to Building Resilience to Natural Hazards in a Data-Scarce Remote Mountainous Part of Nepal" Sustainability 12, no. 22: 9448. https://doi.org/10.3390/su12229448
APA StyleParajuli, B. P., Khadka, P., Baskota, P., Shakya, P., Liu, W., Pudasaini, U., B.C., R., Paul, J. D., Buytaert, W., & Vij, S. (2020). An Open Data and Citizen Science Approach to Building Resilience to Natural Hazards in a Data-Scarce Remote Mountainous Part of Nepal. Sustainability, 12(22), 9448. https://doi.org/10.3390/su12229448