Article

Circularity Evaluation of Alternative Concepts During Early Product Design and Development

by
Julie Kamp Albæk
1,
Sasha Shahbazi
2,*,
Tim C. McAloone
1 and
Daniela C. A. Pigosso
1
1
Department of Mechanical Engineering, Technical University of Denmark, 2800 Kgs. Lyngby, Denmark
2
Department of Method for Product Realization, Researcher at RISE AB, 61, 114 28 Stockholm, Sweden
*
Author to whom correspondence should be addressed.
Sustainability 2020, 12(22), 9353; https://doi.org/10.3390/su12229353
Submission received: 14 September 2020 / Revised: 26 October 2020 / Accepted: 3 November 2020 / Published: 11 November 2020

Abstract

:
Product design and development are essential for a circular transition. Circularity decisions, such as those concerning the type of material, assembly method, and expected lifespan, made during the early design stages will significantly influence a product’s quality, cost, esthetics, sustainability, and circularity performance over the product lifecycle. However, circularity is not often considered in the early stages of product design and development. This paper presents the development of the concept circularity evaluation tool (CCET), which aims to support the evaluation of alternative product concepts in terms of their circularity potential in the early stages of product design and development. The CCET was iteratively developed based on an extensive literature review of the success criteria for tool development, guidelines, and existing tools for circular product design and development and strong collaboration with manufacturing companies. The tool was tested and verified at four manufacturing companies in Nordic countries. The tool has been proven useful for evaluating the circularity of products and supportive in the decision-making process in the early stages of product design and development.

1. Background

In recent years, environmental issues such as global warming, environmental pollution, and plastic in oceans have raised the awareness that the “take, make, dispose” linear economy cannot continue indefinitely. To avoid waste, a more circular economy and a rethinking of the way resources are used are essential [1]. Circular economy can be seen as a mean to reach sustainability, although it is not always true. Nevertheless, many companies have recently attempted to create more circular business models and supply chains to be able to close the loop. However, these attempts cannot be optimum if products are not designed for circular goals.
Circular design is an important aspect of a circular transition [2,3,4,5], as the choices made during the product design greatly define the impacts of the product during its lifetime. Circular product design and development aims to decouple value creation from the consumption of finite resources by enabling multiple lifecycles in which products, components and materials have extended lifespans [1,6]. As a result, not only is the use of natural resources economically optimized, but the value of products, components, and materials is also retained, and natural resources are restored.
It is estimated that approximately 80% of the sustainability performance of a product over its lifecycle is defined in the early stages of the product design and development process [1]. During the early stages of product design and development, decisions regarding environmental and circularity aspects, such as the selection of materials, energy consumption, waste handling strategy, material toxicity and hazardousness, use of renewable natural resources, emissions, and other environmental effects, must be made. Once the product design concept is established, improving environmental and circular performance will lead to time-consuming and excessively uneconomical iterations.
However, the area of product design and development is far from being circular [7], and most of the in-use products have been designed for a single product lifecycle [8,9]. In addition, operational tools and guidelines to advance circular product design and development are missing [10]. Such tools and guidelines should support decision-making processes and broadly pinpoint the circularity improvement potential of product concepts in the very early stages of product design and development, i.e., planning and concept development [11]. The development of such tools and guidelines to evaluate product concept circularity has become even more crucial, as little information and data are available in the early stages of product design and development, and many product specifications are not yet defined.
This paper is within the area of circular product development and aims to present a tool for evaluating the circularity of alternative product concepts. The concept circularity evaluation tool was developed based on an extensive literature review and an analysis of existing tools for circular product design and development. The proposed tool was developed in several steps through the course of a three-year research project and was eventually tested and verified by four manufacturing companies. In the following sections, we present the research methodology (Section 2). The developed theoretical framework for circularity assessment (Section 3) is followed by an overview of the success criteria identified and used for the development of the tool (Section 4). The development steps and final outcome of the concept circularity evaluation tool are described in Section 5, Section 6 and Section 7. A discussion and final remarks are presented in Section 8 and Section 9, respectively.

2. Research Methodology

The work presented in this article is built around the design research methodology (DRM) [12]. Table 1 illustrates these phases, as well as the respective main activities and outcomes in each phase. The phases are not performed as a strict linear process, as some phases are run in parallel or with smaller iterations between them.
The research clarification phase includes a structured literature search, which shapes the theoretical framework and research goal of this study. The research clarification phase aimed to capture the concept of product design and development from a circular economy perspective. The literature search included a keyword search of scientific databases and a qualitative upstream and downstream search of references in the selected articles. In addition to peer-reviewed publications, the literature search extended to cover gray literature and nonacademic resources (e.g., institutional reports). Literature selection was based on a keyword search (such as product design, product development, and combinations of the terms circularity, circular economy, and ecodesign), abstract review, and full-text reading of articles addressing product design and development and the circular economy.
Descriptive Study I included an extended literature review for the research clarification phase and aimed for a deeper understanding of the circularity evaluation of product concepts in the early phases of product design and development. The literature study was specifically narrowed into frameworks, guidelines, and tools addressing the evaluation of product circularity. In addition, this phase included searching and identifying necessary success criteria for a successful evaluation tool (presented in Section 4).
Prescriptive Study I aimed to develop an initial tool (here named the first version of the concept circularity evaluation tool, CCET:v1) for evaluating the circularity of product concepts (presented in Section 5). The initial tool development was mainly based on cocreation through several workshops with two manufacturing companies producing urban furniture and trampolines and taking part in the CIRCit research project (www.circitnord.com). Company selection was based on companies’ interest in circular products, availability, and intention to improve their product design and development in terms of circularity. The companies are located in different Nordic countries, while their products are sold worldwide. The initial tool cocreation and development was inspired by a variety of frameworks, guidelines, and tools studied in the previous two DRM phases. These inspirations, together with the results from workshops, were internally discussed among the authors, and the pros and cons were theoretically considered. There were several iterations between this phase and Descriptive Study I to combine the empirical results from companies and theories from the literature [13].
Descriptive Study II aimed to test CCET:v1 (presented in Section 5) and to compare it with other tools identified in Descriptive Study I (presented in Section 6). The testing was carried out through workshops with the same manufacturing companies that were involved in Prescriptive Study I and through a webinar attended by several other companies and consultancies. During the tests, the applicability, usability, usefulness, and improvement potential of CCET:v1 were discussed. Then, a cross comparison of the initial tool with other tools from the literature was executed in an internal workshop and several follow-up meetings. The cross comparison was based on the success criteria identified in Descriptive Study I (presented in Section 4). This phase also included continuous iterative processes between a literature study (Descriptive Study I) and empiricism [13].
Prescriptive Study II aimed to redesign the CCET:v1 into the second version of the concept circularity evaluation tool (CCET:v2) while covering the cons identified during the previous phase. The redesign process included ideation, mind map, and morphology methods, exploring possible solutions as well as several internal project workshops and follow-up meetings. This phase also included continuous iterative processes between Descriptive Studies I and II [13]. The main adaptations and steps are presented in Section 7.
Descriptive Study III aimed to empirically test and evaluate the CCET:v2, discuss the learning points, and make any necessary improvements. Testing and verification were carried out through interviews and workshops with two manufacturing companies producing urban furniture and plastic components. The basis for company selection was the same as that described in Descriptive Study II. This combined with internal workshops and discussions within the project provided additional input about the usefulness and usability of the tool and the necessary improvements or alterations. This phase also incorporated iterative processes between Descriptive Study I and II and Prescriptive Study II [13].
Based on the outcome of Descriptive Study III, final modifications to the CCET:v2 were made, and the tool was finalized, as discussed in Section 8.

3. Theoretical Frame Work

The literature review included defining circular product design (research clarification) and identifying existing design guidelines for circular product concept development and existing tools for product circularity evaluation (Descriptive Study I). The literature review aimed to capture how the circularity of products can be measured and what success criteria are considered important when evaluating the circularity of product concepts.

3.1. Circular Product Design

Circular product design and development is, in many ways, inspired by existing frameworks such as ecodesign and design for X (DfX). Therefore, similar principles are applicable for circular product design and development, including slowing resource loops (prolonging product lifespans), narrowing resource loops (resource efficiency), and closing the resource loop (recirculating materials) [14].
Ecodesign [15,16,17] is a widely used concept for improving the environmental performance of products and is recognized due to its several potential business benefits [17]. Ecodesign focuses on improving a product’s environmental performance throughout its lifecycle without compromising other essential success criteria such as performance, functionality, esthetics, quality, and cost [18,19]. The main environmental impacts considered in ecodesign are minimizing material and energy use, choosing less impactful materials, and promoting long-lasting products through, e.g., durability, upgrading and repairs [20].
Conversely, design for X [21,22] focuses on some different environmental aspects of product design, such as lifecycle issues, disassemblability, and recyclability, to create products with specific qualities. There are several other frameworks within DfX, including design for sustainability, which aims to create more sustainable products by focusing on product characteristics for preventing obsolescence (e.g., upgrade, repair and refurbish) and on design for closing loops (e.g., design for recycling) [7,23]; design for environment [24,25], which relates to reducing the harmful ecological impacts of products in terms of the toxicity and hazardousness of substances and emissions; design for disassembly [26,27], which mainly relates to reducing the number of components in a product, minimizing disassembly time, and increasing efficiency; design for remanufacturing [28,29], which relates to the nondestructive dismantling and reassembly of components of a product via interchangeability and modular design; and design for recycling [30,31], which relates to facilitating recycling processes, e.g., shredding and sorting via modular design and simple mechanical dismantling. These are highly relevant in the context of circular product design. However, these design frameworks do not systematically cover all possible circular strategies.
Depending on the product, production system, business model, and environmental goals, different circular strategies can be pursued. The circular strategies scanner [32] presents a range of strategies to enable the circular economy. According to [7], the design of circular products needs to ‘fit for purpose’, and it should be based on the chosen business model, selected circular strategy and environmental goal (top-down approach). However, the abovementioned frameworks take their starting point in the product (bottom-up approach). Therefore, circular strategies [32] (i.e., strategies to achieve the circular economy) should be coupled with design approaches to enable circular product design and development.
Circular design guidelines are vital for designing and developing products and concepts in the early product design and development processes to enhance circularity potential [2,3,4]. To fulfill the research aim and within Descriptive Study I, an extensive framework of circular product design guidelines correlating to the circular strategy scanner [32] was developed. The design guidelines were collected from a variety of scientific articles and gray literature (e.g., [8,22,24,33,34]). The guidelines were developed on two levels: General and detailed; the general level is applicable to any industry and product (e.g., “make it easy to inspect the product and components” for design for repair and maintenance), while the detail level differs from one product to another (e.g., “product parts must be standardized to ease conducting the inspection and across different models/products” and “inspection points and testing components should be marked and easily accessed”). The detailed level guidelines can be further technically tailored, added, and/or removed based on, e.g., the type of material, type of industry, and adopted business model.
These design guidelines were first introduced and published in [9] to preliminarily discuss the application of design guidelines in mapping companies’ circular product design initiatives in the early stages of product design and development. The developed guidelines aid companies in how to design and develop products for a specific circular strategy and how to reach the predefined circularity goal. Design guidelines help in understanding what should be considered during product design. It is also important to consider the consequences of implementing each guideline, such as the cost of changes, ease of implementation, and impact. It is not possible to implement all guidelines for all products, but the idea is to be inspired and think outside the box. In this research, the design guidelines were further used in Prescriptive Study I to develop the initial concept of the circularity evaluation tool (presented in Section 5).

3.2. Evaluating Product Circularity

The literature has presented several tools for evaluating product circularity. These tools differ extensively in terms of the level of analysis, type of data, and number of indicators, and there is no general consensus as to how to evaluate product circularity [10]. Some scholars (e.g., [35,36]) find it important that a product circularity evaluation should be built on quantitative data and be reproducible and comparable. Saidani et al. [10] argue that circularity evaluation should be broad and provide information on improvement potential.
Some of the investigated tools are based on quantitative data such as materials and energy flow analysis (e.g., the material circularity indicator (MCI) [37] and the resource duration indicator (RDI) [38]), while others are based on the user’s personal evaluation in a subjective manner (e.g., the circularity potential indicator (CPI) [10], the circular economy toolkit (CET) [39], and the parameter circular economy indicator prototype (CEIP) [40]). Furthermore, many tools focus on a single aspect, such as recycling rate or resource use [41], providing limited information about the overall circularity [35], and do not account for different levels of circularity loops. In addition to lacking a complete picture of circularity performance, there is a lack of tools that can provide suggestions for how circularity can be improved [10,35].
Within ecodesign, Lifecycle assessment (LCA) or other impact assessment methods are often used for evaluating product environmental performance, which represents a well-defined method for measuring impact. Such an approach does not yet exist for product circularity, but many approaches similar to LCA are used to analyze circularity, e.g., see [10,36,41,42,43]. The benefit from assessments similar to LCA is that the analysis will be relatively reproducible, as it is based on quantitative data. However, such approaches set high requirements for data availability and resources for execution (such an extensive amount of data is not available within the domain of product circularity at the concept level), and they cannot differentiate the type of material, product, or component loop. Therefore, using impact-based methods cannot fully evaluate all aspects of circularity [38].
The selection of the type of indicator will highly depend on which role such an indicator or tool should have and the context in which it is applied. For circularity at the product concept level, it is important that the tool has a large focus on the product design and can highlight improvement potential in terms of the design and its compatibility for circular economy goals and strategies. For the context for which this evaluation tool should be used, it is argued that a more subjective basis is necessary, as detailed information is not available at this early point in the development process.
Our literature search identified four circularity evaluation tools that can be used for evaluating product circularity at the concept level or the early development stage:
  • Circular economy indicator prototype (CEIP) [40]: A questionnaire-based tool to score points for different phases of the product lifecycle according to the given answers. The result is shown as a product rating and spider web, which indicate the product score in relation to the total score in different phases of the product lifecycle. This can provide an indication of improvement potential but does not indicate directly what product characteristics should be improved.
  • Circular economy toolkit (CET) [39]: An online questionnaire-based tool concerning the product’s characteristics and its lifecycle. The tool covers a broad range of circularity loops and provides an indication (opportunity and feasibility) of which areas the product/system perform well in terms of circularity.
  • Circularity potential indicator (CPI) [10]: An indicator that uses a top-down approach and evaluates the product circularity based on 20 attributes within four aspects: Circular product design, new business model, reverse cycles, and favorable system conditions. Each attribute can score up to five points, each building block can obtain a score of up to 25, and the total circularity score can reach 100.
  • Circular pathfinder (CP) [44]: An online-based tool to be used during product development to find product strategies for improving circularity. The tool goes through questions relating to product type, product customer interactions, lifetime, and user needs, and eventually, suitable strategies are suggested.
The above tools are all based on a combination of system aspects (e.g., market characteristics) and product aspects (e.g., material and design) and will be further discussed in the following sections.

4. Success Criteria for a Concept Circularity Evaluation Tool

Different criteria for a successful circularity evaluation tool are defined based on the literature review and several discussions within the research group, as presented in Table 2. The criteria are highly related to the usefulness of the tool, which depends on the ability to identify and pinpoint improvement potential within a broad scope of circular strategies. Second, the criteria also relate to the experience of using the tool, which should preferably be both pedagogic and easy to use.

5. The First Version of the Concept Circularity Evaluation Tool (CCET:v1)

The CCET:v1 is the main outcome of Prescriptive Study I and is also partially based on the results obtained from the research clarification (literature review). The tool was developed for use in the early product development process, (i.e., planning and concept development [11]) and aimed to evaluate product concepts in terms of their circularity potential. This tool is designed to be an internal communication support for decision making in the early product development process and with no intention to be used for external communication. The tool was designed to calculate a “total circularity potential score” for at least two alternative product concepts so that they can be compared in terms of their circularity. The tool could also be used for a single concept/product to identify hotspots and circularity improvement potential. The CCET:v1 is an Excel-based tool and was completely developed based on the circular strategy scanner [32] and product design guidelines [9], and inspired by [33] and [45]. Using the tool requires a good overview of the product concept lifecycle, possible environmental effects, and the circularity aspects at each lifecycle stage; (ii) a good understanding of the circular strategy scanner and different circular strategies; and (iii) a good understanding of the design guidelines as a whole.

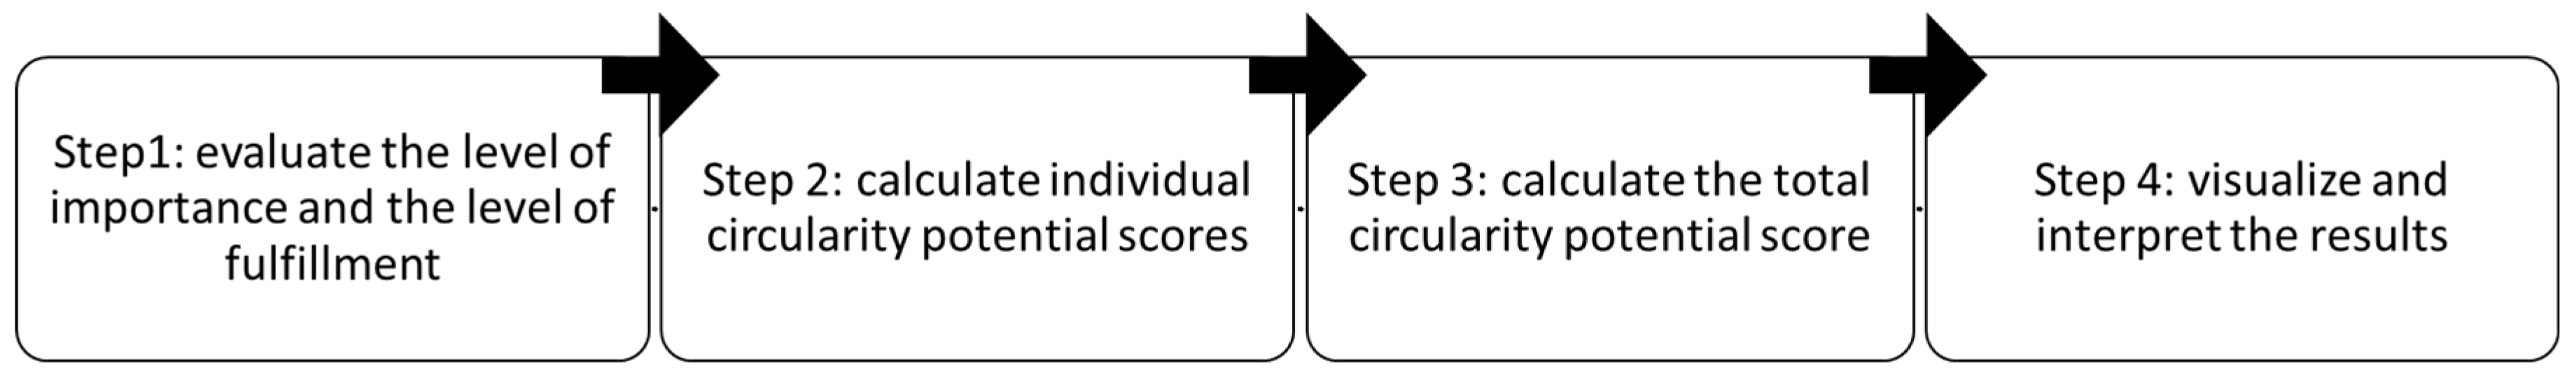
5.1. The Procedure for Applying the CCET:v1

The CCET:v1 calculates a “total circularity potential score” for at least two concepts. The CCET:v1 was developed based on general design guidelines [9]. Each guideline receives a score called a “circularity potential score”. The “total circularity potential score” for each concept is calculated by summing all the “circularity potential scores” of the individual guidelines. Figure 1 presents an overview of the steps of the CCET:v1.
Step 1: Evaluate the concepts by indicating the “level of importance” and “level of fulfillment” for each design guideline.
The “circularity potential scores” for each individual design guideline are calculated by multiplying two main principles: The “level of importance” and the “level of fulfillment”:
  • The level of importance refers to how important the general design guidelines are when designing and developing a specific product; this should be based on the previously selected circular strategies and the determined circularity goals. In this criterion, each general design guideline is given a score from 0 to 3: (3) Really important, (2) moderately important, (1) slightly important, and (0) not important.
  • The level of fulfillment refers to how much the general design guidelines are applied/fulfilled for each of the developed concepts. In this criterion, each general design guideline is given a score: (1) Yes, the guideline has been completely fulfilled by this concept; (3) somehow but can be improved; and (5) no, the guideline has not been fulfilled by this concept and it has to be. The level of fulfillment should not be evaluated for guidelines that were given (0) as the level of importance.
The selection of scores for both principles is qualitative, based on discussions, product brief, product development goals, environmental and circularity goals, and previous experience from existing products on the market, or previous generations. Agreements as to importance and fulfillment should be achieved among all stakeholders, including environmental managers/coordinators, product owners, product designers and developers, research and development professionals, manufacturing representatives, and marketing practitioners.
Step 2: Calculate individual circularity potential scores.
On the basis of the data provided for each concept and the discussion, the general design guidelines are given a score by multiplying “level of importance” and the “level of fulfillment”, resulting in a final score for each individual guideline:
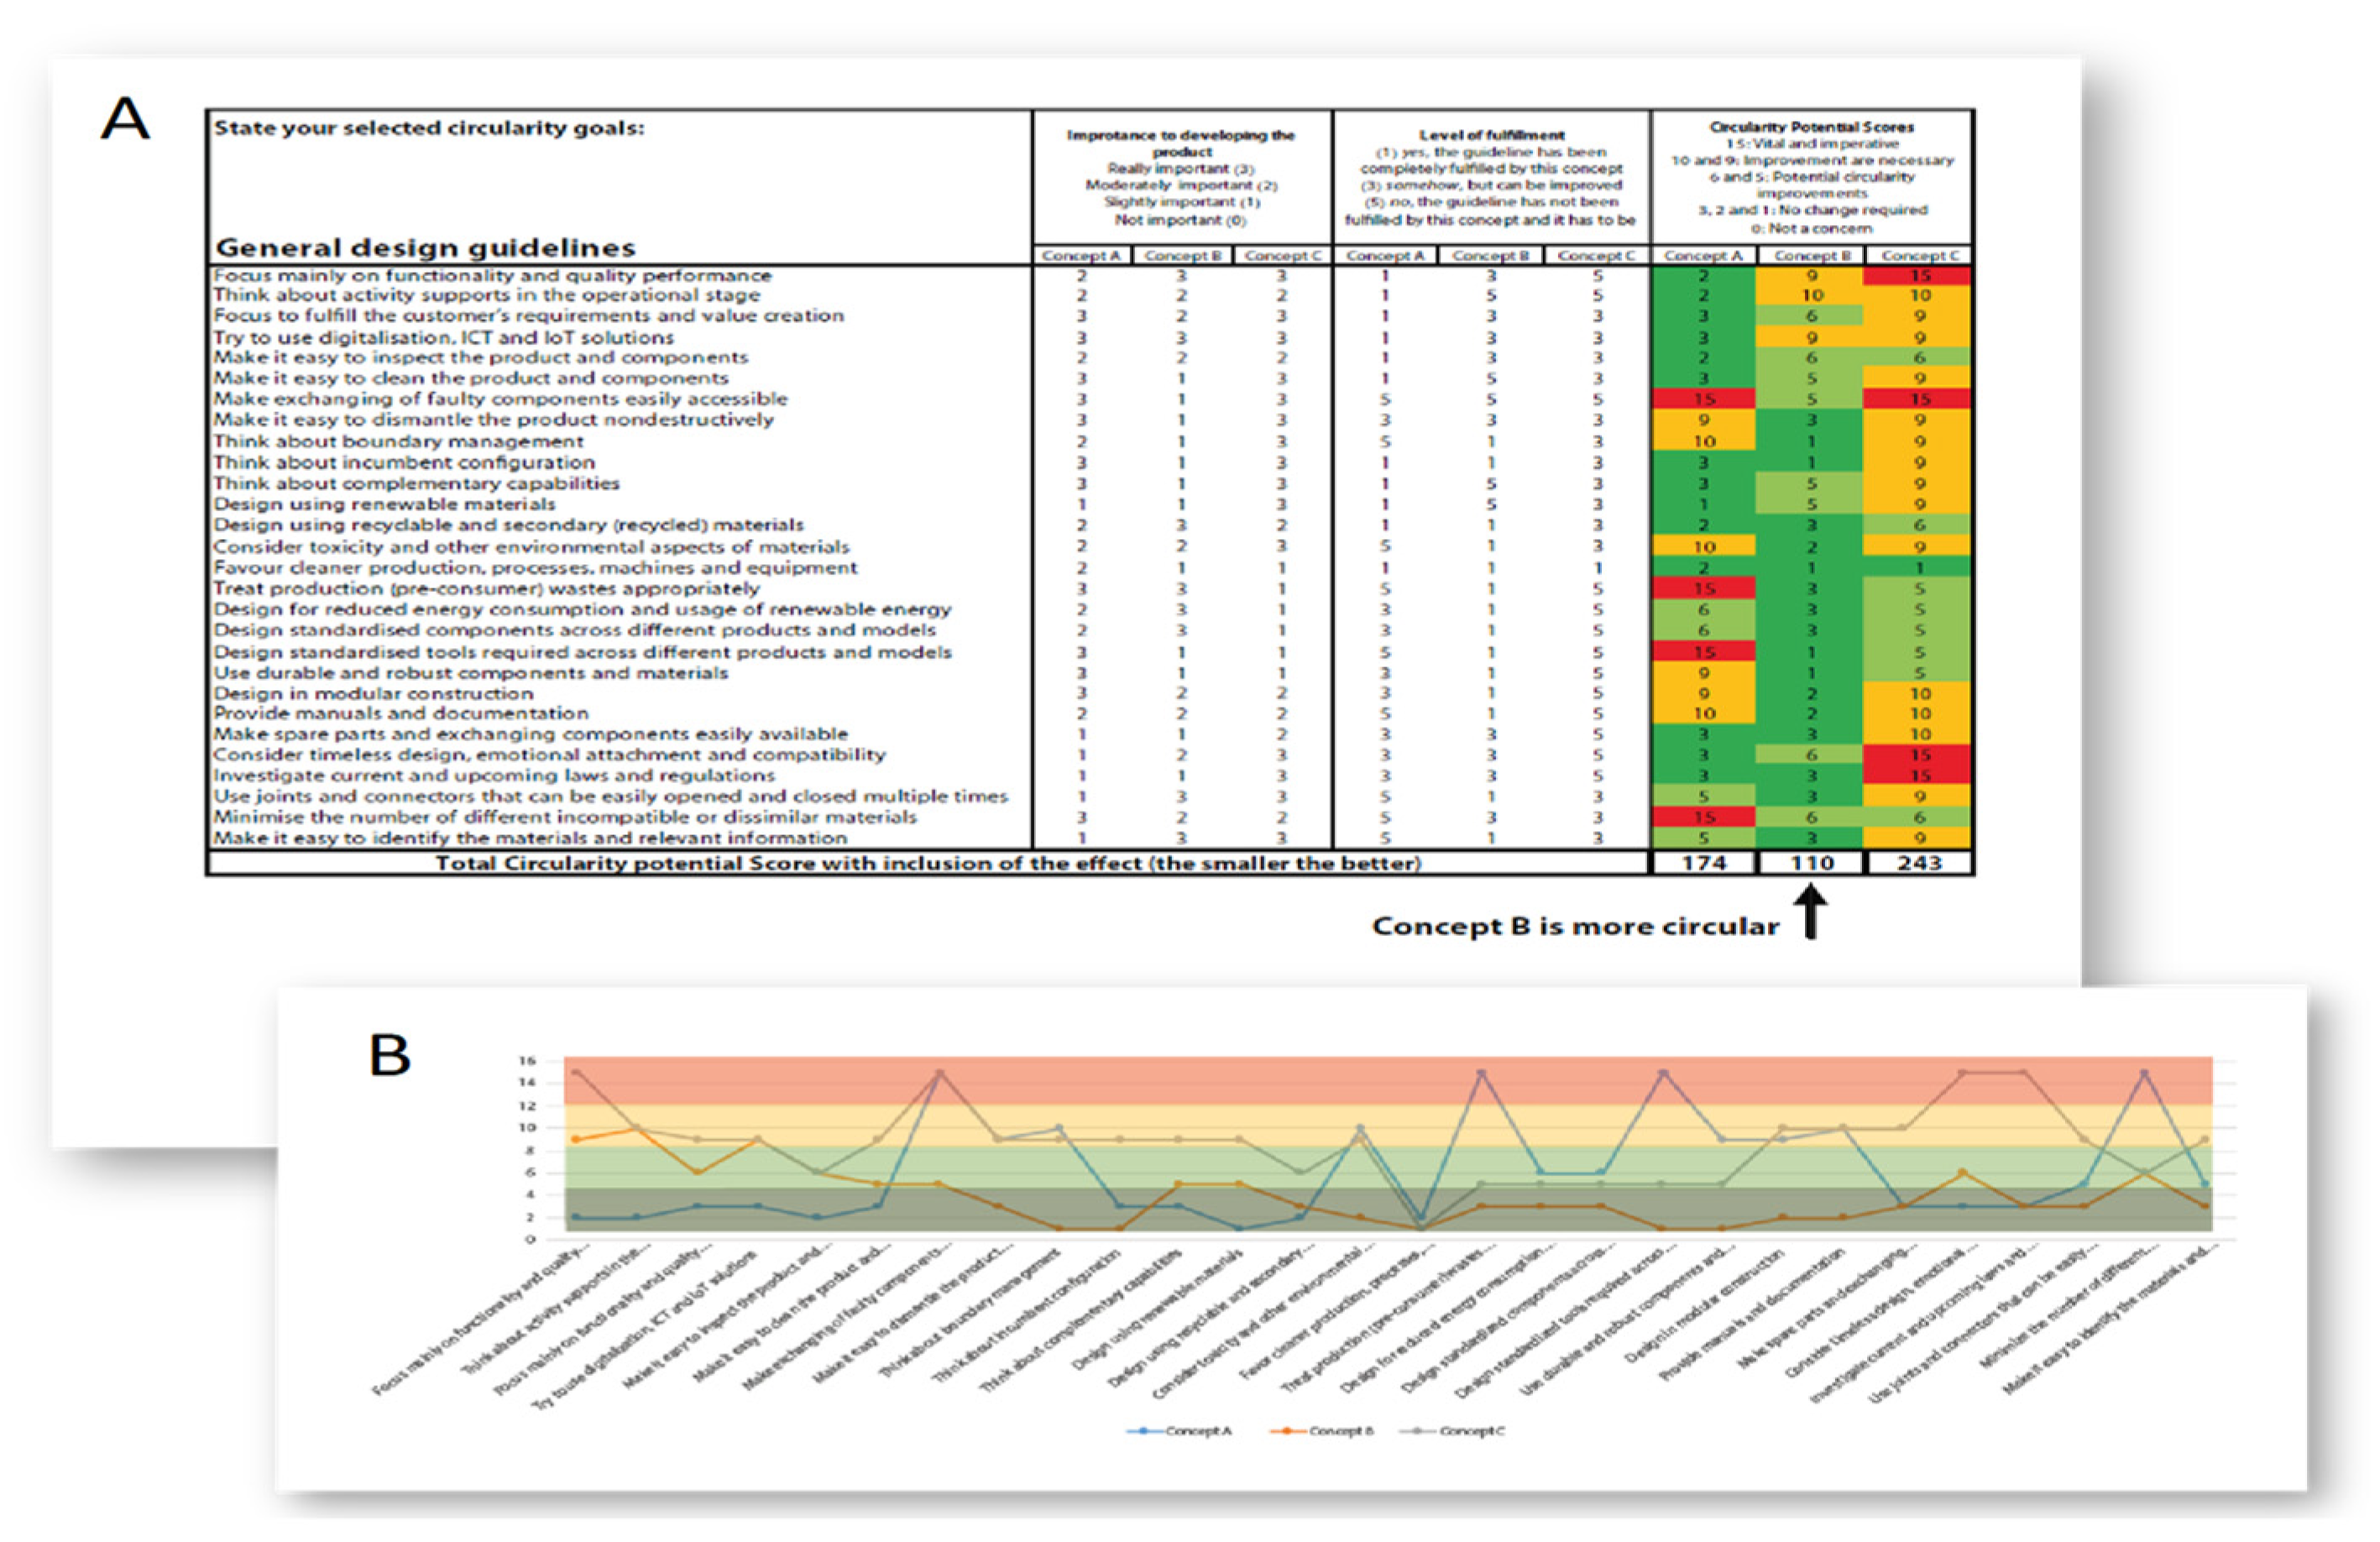
  • (0): Circularity is not a concern.
  • (1–3): Does not require any changes in design and concept.
  • (5–6): There is circularity improvement potential in the current design and concept.
  • (9–10): Circularity improvements are necessary for the current design and concept.
  • (15): Vital and imperative design changes are necessary for circularity.
Step 3: Calculate the total circularity potential score for each concept.
The total circularity potential score for each concept is then calculated by summing all the circularity potential scores of the individual guidelines. The lower the total circularity potential score is, the better the concept in terms of circularity. For example, Concept A obtains a circularity potential score of 170, while Concept B obtains a circularity potential score of 195; in this case, Concept A is more circular than Concept B. Alternatively, it can also be concluded that the circularity improvement potential for Concept B is greater than that for Concept A.
Step 4: Visualize and interpret the results.
The results can be visualized in a graph, which shows the circularity potential scores for the alternative concepts for each of the guidelines. The results can be interpreted in two ways: (1) Identify the circular hotspots and improvement potential for each design concept, and (2) cross-compare the concepts in terms of circularity design guidelines.
Figure 2 illustrates the CCET:v1 in two pictures: (1) Input and scores and (2) results and visualization. Picture A presents the Excel file table for scoring the guidelines on the left column. The second column captures the scores for the “level of importance” of different concepts in relation to the guidelines, and the third column captures the scores for the “level of fulfillment” of different concepts in relation to the guidelines (inputs). The right colored column sums up the scores and presents the most circular concept (output). Picture B illustrates the results from picture A and compares design concepts (colored lines) based on the circularity scores (y axes) on each design guideline (x axes). The red and orange cells (picture A) and graph background (picture B) show hotspots and improvement potential.

5.2. Testing the CCET:v1

The CCET:v1 was tested at two manufacturing companies producing (A) urban furniture and (B) trampolines. The aim was to gain insight into the companies’ perspective, assess the tool’s usability and usefulness, and identify its benefits, drawbacks, and improvement potential. Company A is producing urban furniture, and the tool was used to evaluate its bench. The main functions involved in this company include the product designer and head of strategy and sustainability. Company B is producing trampolines, and the main functions involved include innovation leader and sustainability coordinator.
Direct feedback provided by both companies indicated that the tool was “quite helpful” in understanding the current circularity of their product concepts and understanding the circularity potential of their products. Company A also concluded that the visualization of the results in a stacked line chart with color codes helped them carry on the conversation and focus on critical hotspots. However, both companies shared the same opinion on the applicability of the tool, i.e., that it requires a complete understanding of the circular strategies and guidelines to be able to exploit it. In addition, company B believes that it is difficult to evaluate the level of importance of guidelines for a given product, and the tool in its current form did not help much.
In addition to the two companies, a webinar was carried out to present the CCET:v1 and discuss its applicability, usability, usefulness, and improvement potential. There were 32 participants in the webinar (23 participants from 10 different Nordic manufacturing companies and 9 participants representing consultancy firms from different Nordic countries). The follow-up discussions and questions led to similar results for the companies: Challenges in understanding the guidelines and strategies and difficulty in subjectively scoring “the level of importance”. Furthermore, it was agreed that the CCET:v1 is generic enough to fit into different product design and development processes, especially in the early stages, such as planning and concept development. This is vital, as the product design and development process involves a series of steps to plan, design, manufacture, test, and launch a product on the market. Companies have different product design and development processes based on their product type and category, production system, market plans, marketing strategy, business model, etc. A circularity evaluation tool should be able to fit all different products, companies, and processes.

6. Comparative Analysis of Tools

To understand how the CCET:v1 scored in relation to the defined success criteria (Section 4) and to highlight its improvement potential for further development, a comparative analysis with the previously identified tools (CEIP, CET and CPI—see Section 3.2) was performed (Table 3).
All three tools are based on qualitative information about the product and the system in question. The CPI and CEIP both provide an overall score of the product performance as a percentage of the maximum achievable performance, while the CET highlights performance in terms of different strategies. The CPI and CEIP are both based on questionnaires, which assign scores to the overall circularity assessment, while the CET asks the user to categorize the product on 33 different scales (e.g., 100% biodegradable to a high percentage of technical, nonbiodegradable materials).
From the comparison, it became apparent that the CEIP, CET, and CPI perform somewhat similar on the success criteria, while the CCET:v1 has slightly better performance for the defined context. All four tools provide an overview of product performance in different areas and enable the identification of hotspots. However, the tools provide different levels of detail in hotspot identification. For example, the CET divides the results into seven circular strategy areas, but the level of detail of the results is limited to low, medium, and high, which makes it difficult to understand how to improve these results. The CCET:v1, conversely, provides more detailed information about what exactly should be improved to increase concepts’ circularity.
All four tools can be used to compare more than one product concept. The CET, CEIP, and CPI, however, do not have this as an incorporated feature, although the evaluation and comparison of multiple concepts are possible. In addition, the detail level of evaluation for the CET is quite low, which can be problematic when comparing similar concepts. The CCET:v1 is the only tool that presents the possibility of comparing concepts directly in the tool and creating an overview of the results, which makes it more suited for this task specifically.
It can also be seen that all tools have a broad understanding of the term circular economy, which means that they cover a broad range of the circular strategies described by [32]. This is a highly important success criterion, as it helps avoid burden shifting from the circular economy aspect to the other. None of the compared tools include a clear hierarchy of recirculation strategies, indicating that not all strategies have the same circularity potential. However, the CPI and the CEIP have different weights of the questions in the questionnaire, where these considerations might have been taken into account. For the CCET:v1, it is up to the users to include this hierarchy through their evaluation of the level of importance.
The CET, CPI, and CEIP are all quite generic tools, which can in principle compare a toaster to a car in terms of circularity. Thus, the tools do not present a customized evaluation depending on the type and characteristics of products. The CCET:v1 to some extent considers such a feature and asks the user to evaluate the importance of the guidelines. However, this puts many requirements on users’ experience and mindset, which might lead to a more subjective evaluation. Furthermore, none of the tools scored high with regard to being pedagogic to users and being informative as to how to design for circularity. This issue has been partially addressed by the CCET:v1 through introducing guidelines and circular strategies.
The last success criterion is related to the usability of the tool. It is highly important that the user can easily understand and apply the tool. It is always more likely that the user applies the tool repeatedly when there is less confusion and when the user experience is smooth. The CET, CPI, and CEIP are easy to understand and use, mainly due to their questionnaire formats and guides through the processes. The CCET:v1 is, conversely, slightly more detailed and requires a high level of understanding of circular strategies and guidelines (according to the tests presented in Section 5.2).
Overall, the CCET:v1 targets many of the success criteria established for a concept-level evaluation tool and provides a good indication of improvement potential, the possibility of comparing more concepts, a broad scope of strategies, and a customized evaluation. However, some improvements can be made, particularly with regard to its intuitiveness. It would also be beneficial if the tool could account for the fact that not all strategies contribute equally to circularity.

7. The Second Version of the Concept Circularity Evaluation Tool (CCET:v2)

Based on the results from the testing and comparison of the CCET:v1, some adaptions were made to improve its usefulness and usability.

7.1. Adaptions to the CCET:v1

The CCET:v2 uses the same basic structure as that of the CCET:v1 and is still an Excel-based tool. Through ideation methods and based on discussions and workshops in the research group, some major adaptations were implemented as follows:
(1)
Guidance for defining the “level of importance”: This adaptation is supported by two questionnaires that define the importance of a strategy in the calculation of circularity potential.
Questionnaire 1 helps identify circular product-related strategies based on the product type and lifecycle characteristics (adapted from the circular pathfinder [44]);
Questionnaire 2 helps select the most relevant circular strategies for the products under development and define goals (related to the circular strategies) to pursue.
(2)
Shift from using guidelines [9] as evaluation parameters to more general parameters (see Table 4): To minimize the need for detailed knowledge of the guidelines, two evaluation parameters are defined for each strategy for evaluating the concept performance within the given strategy.
(3)
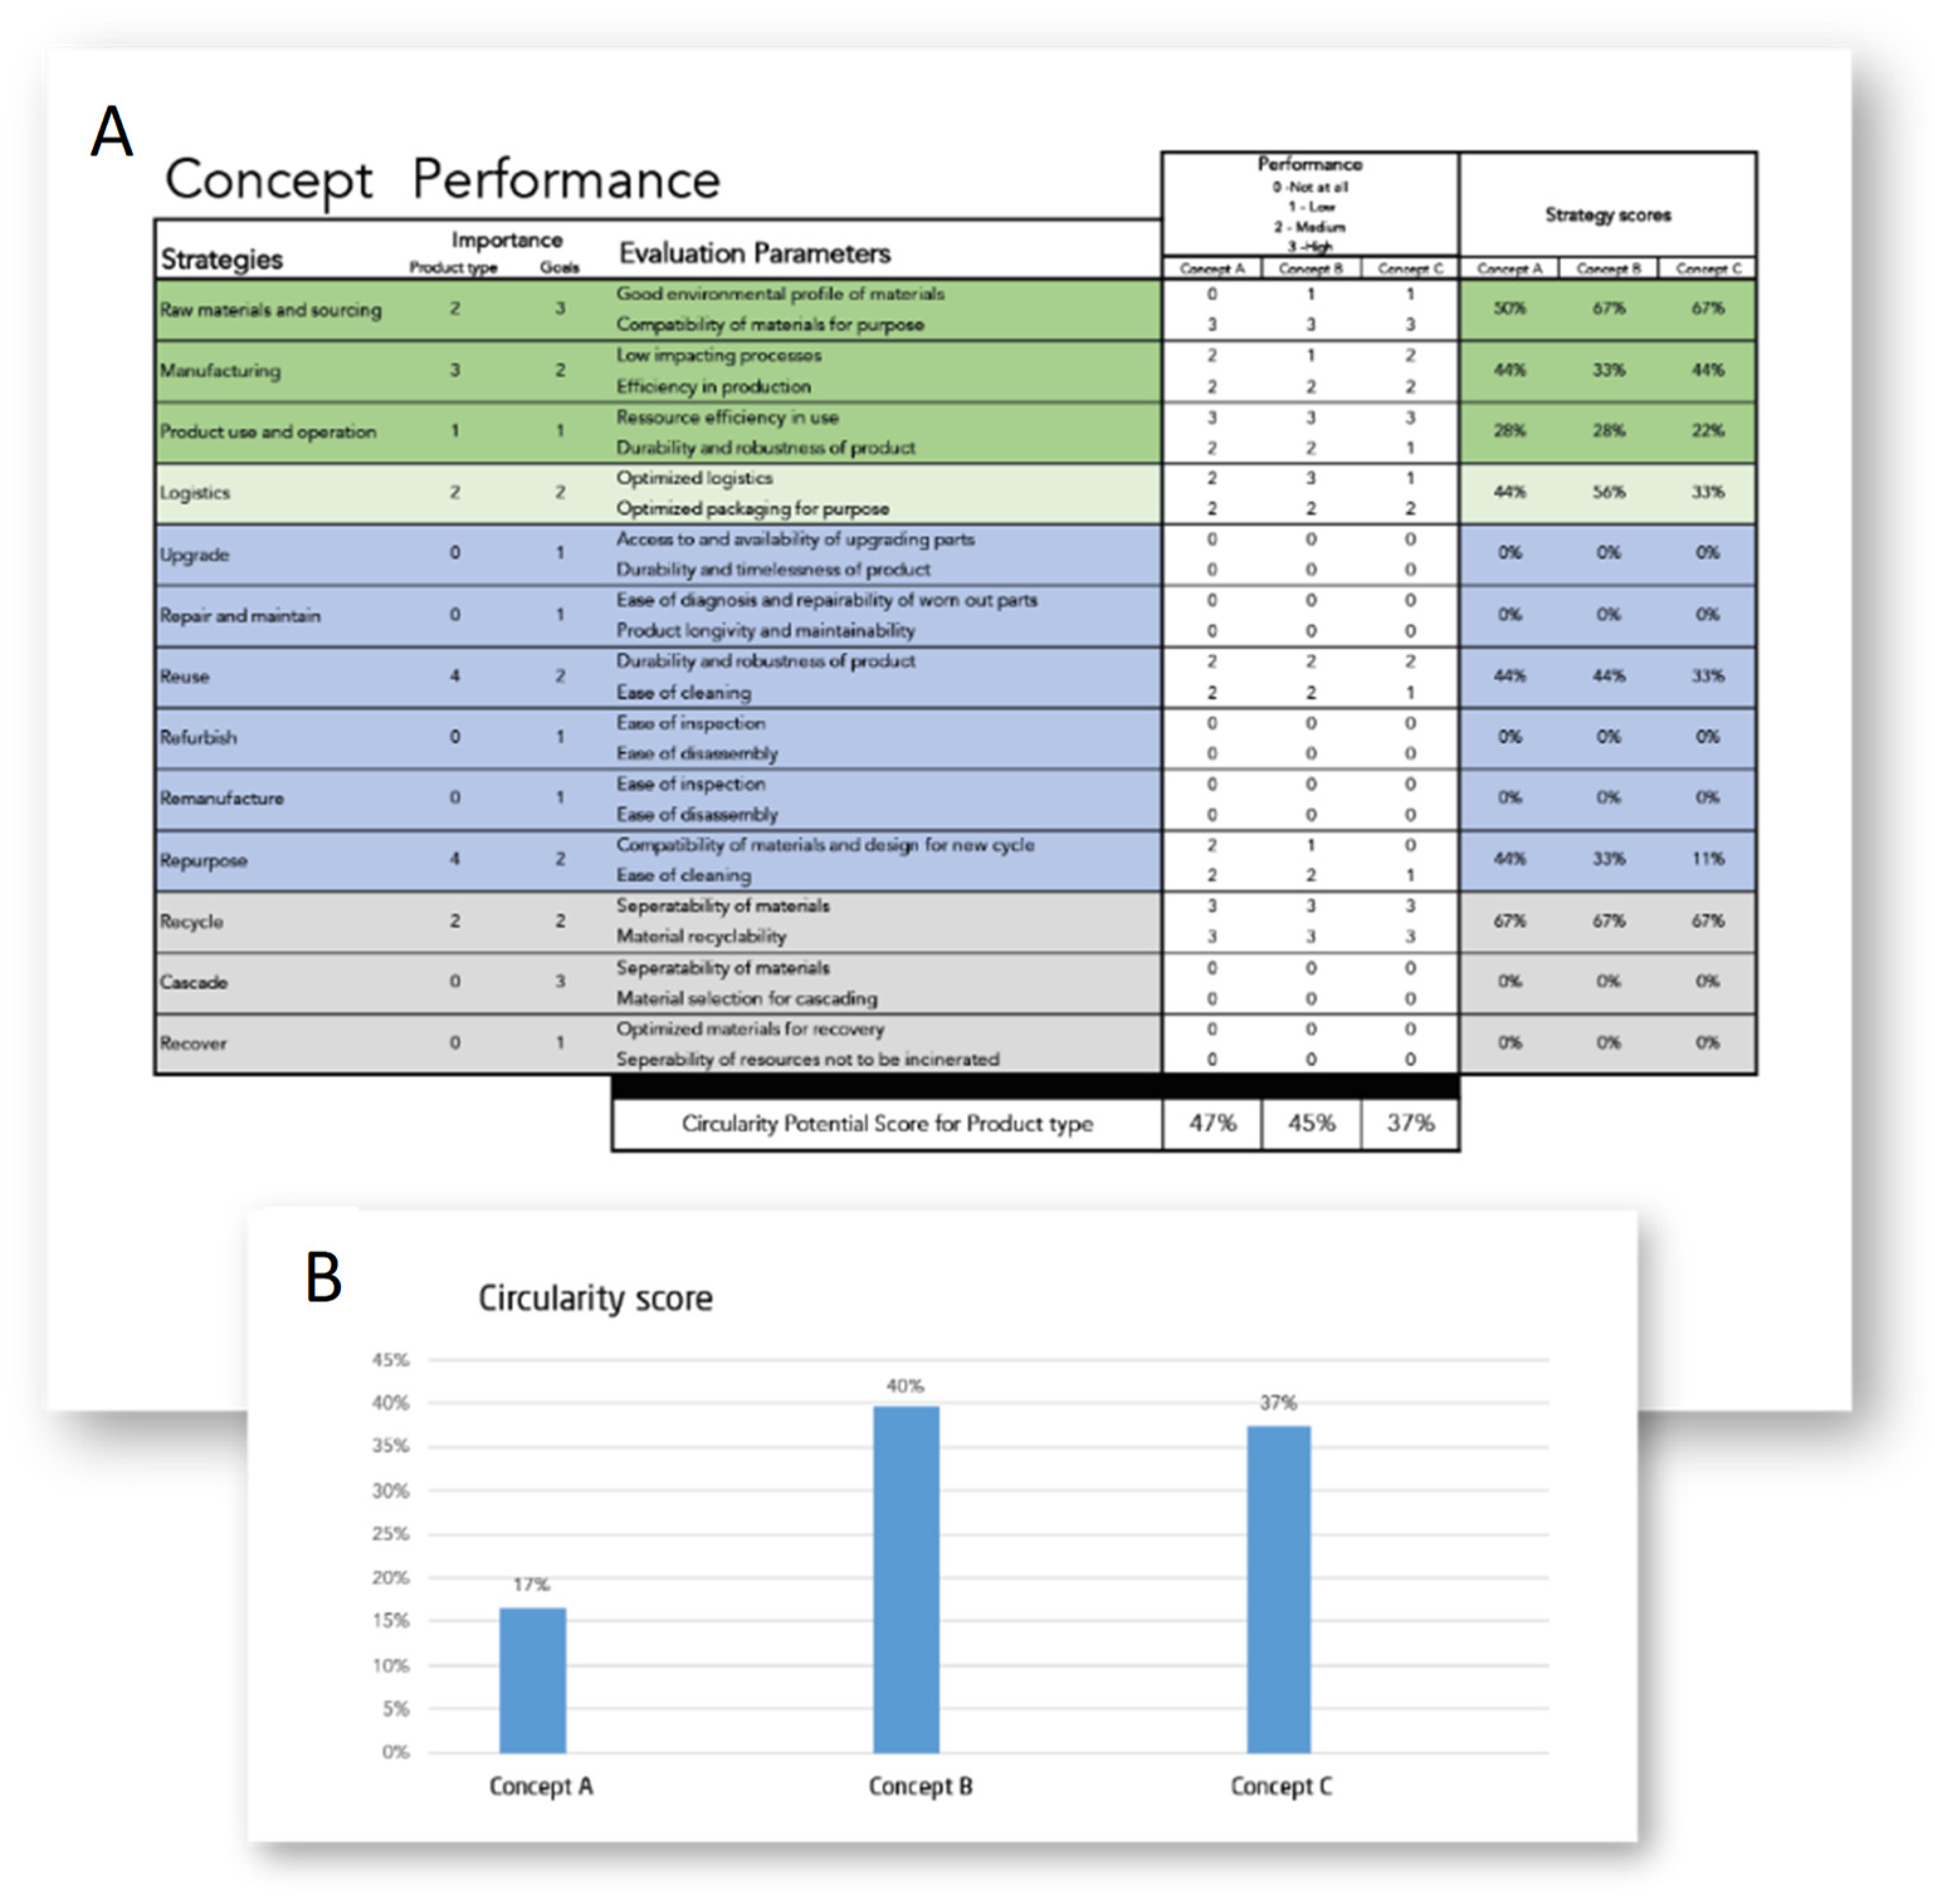
Calculation of circularity scores: Contrary to the CCET:v1, a higher circularity score is better in the CCET:v2, indicating that the product concept performs well on the evaluation parameters. Additionally, the circularity scores are given as percentages, indicating the performance relative to the highest possible circularity.

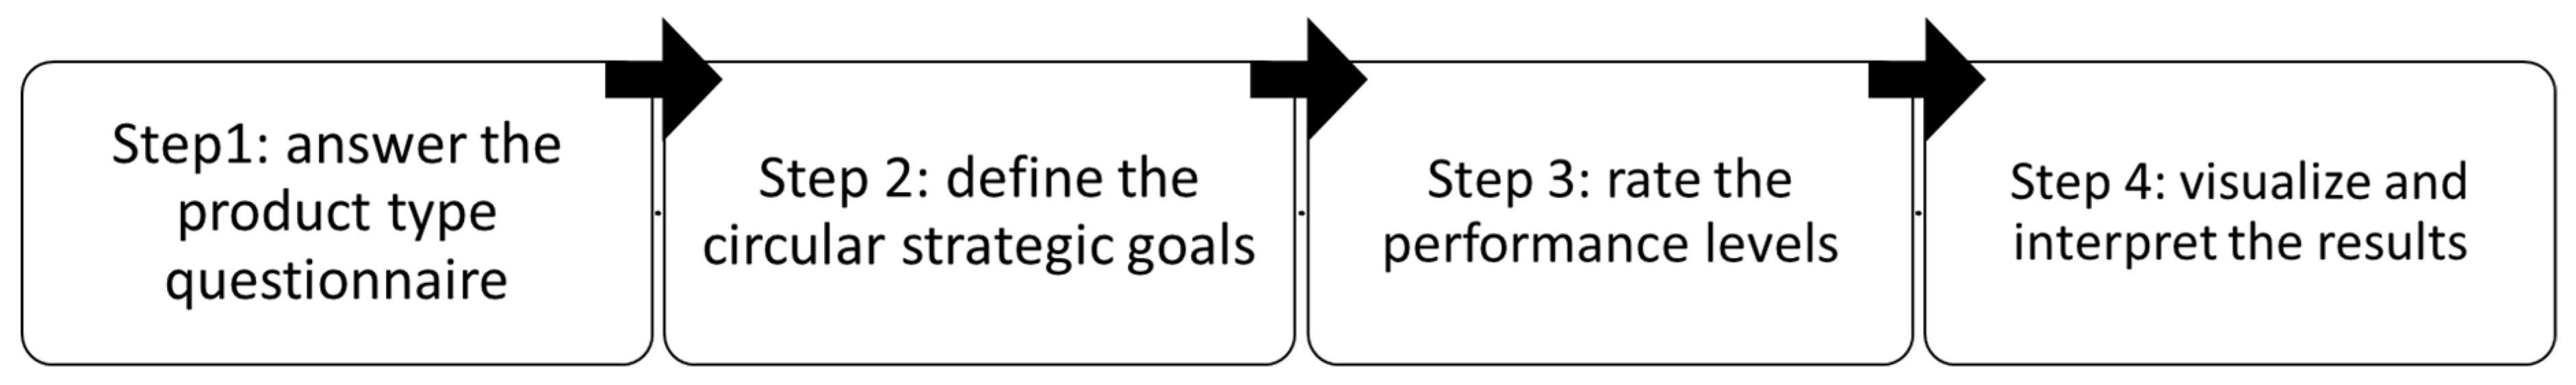
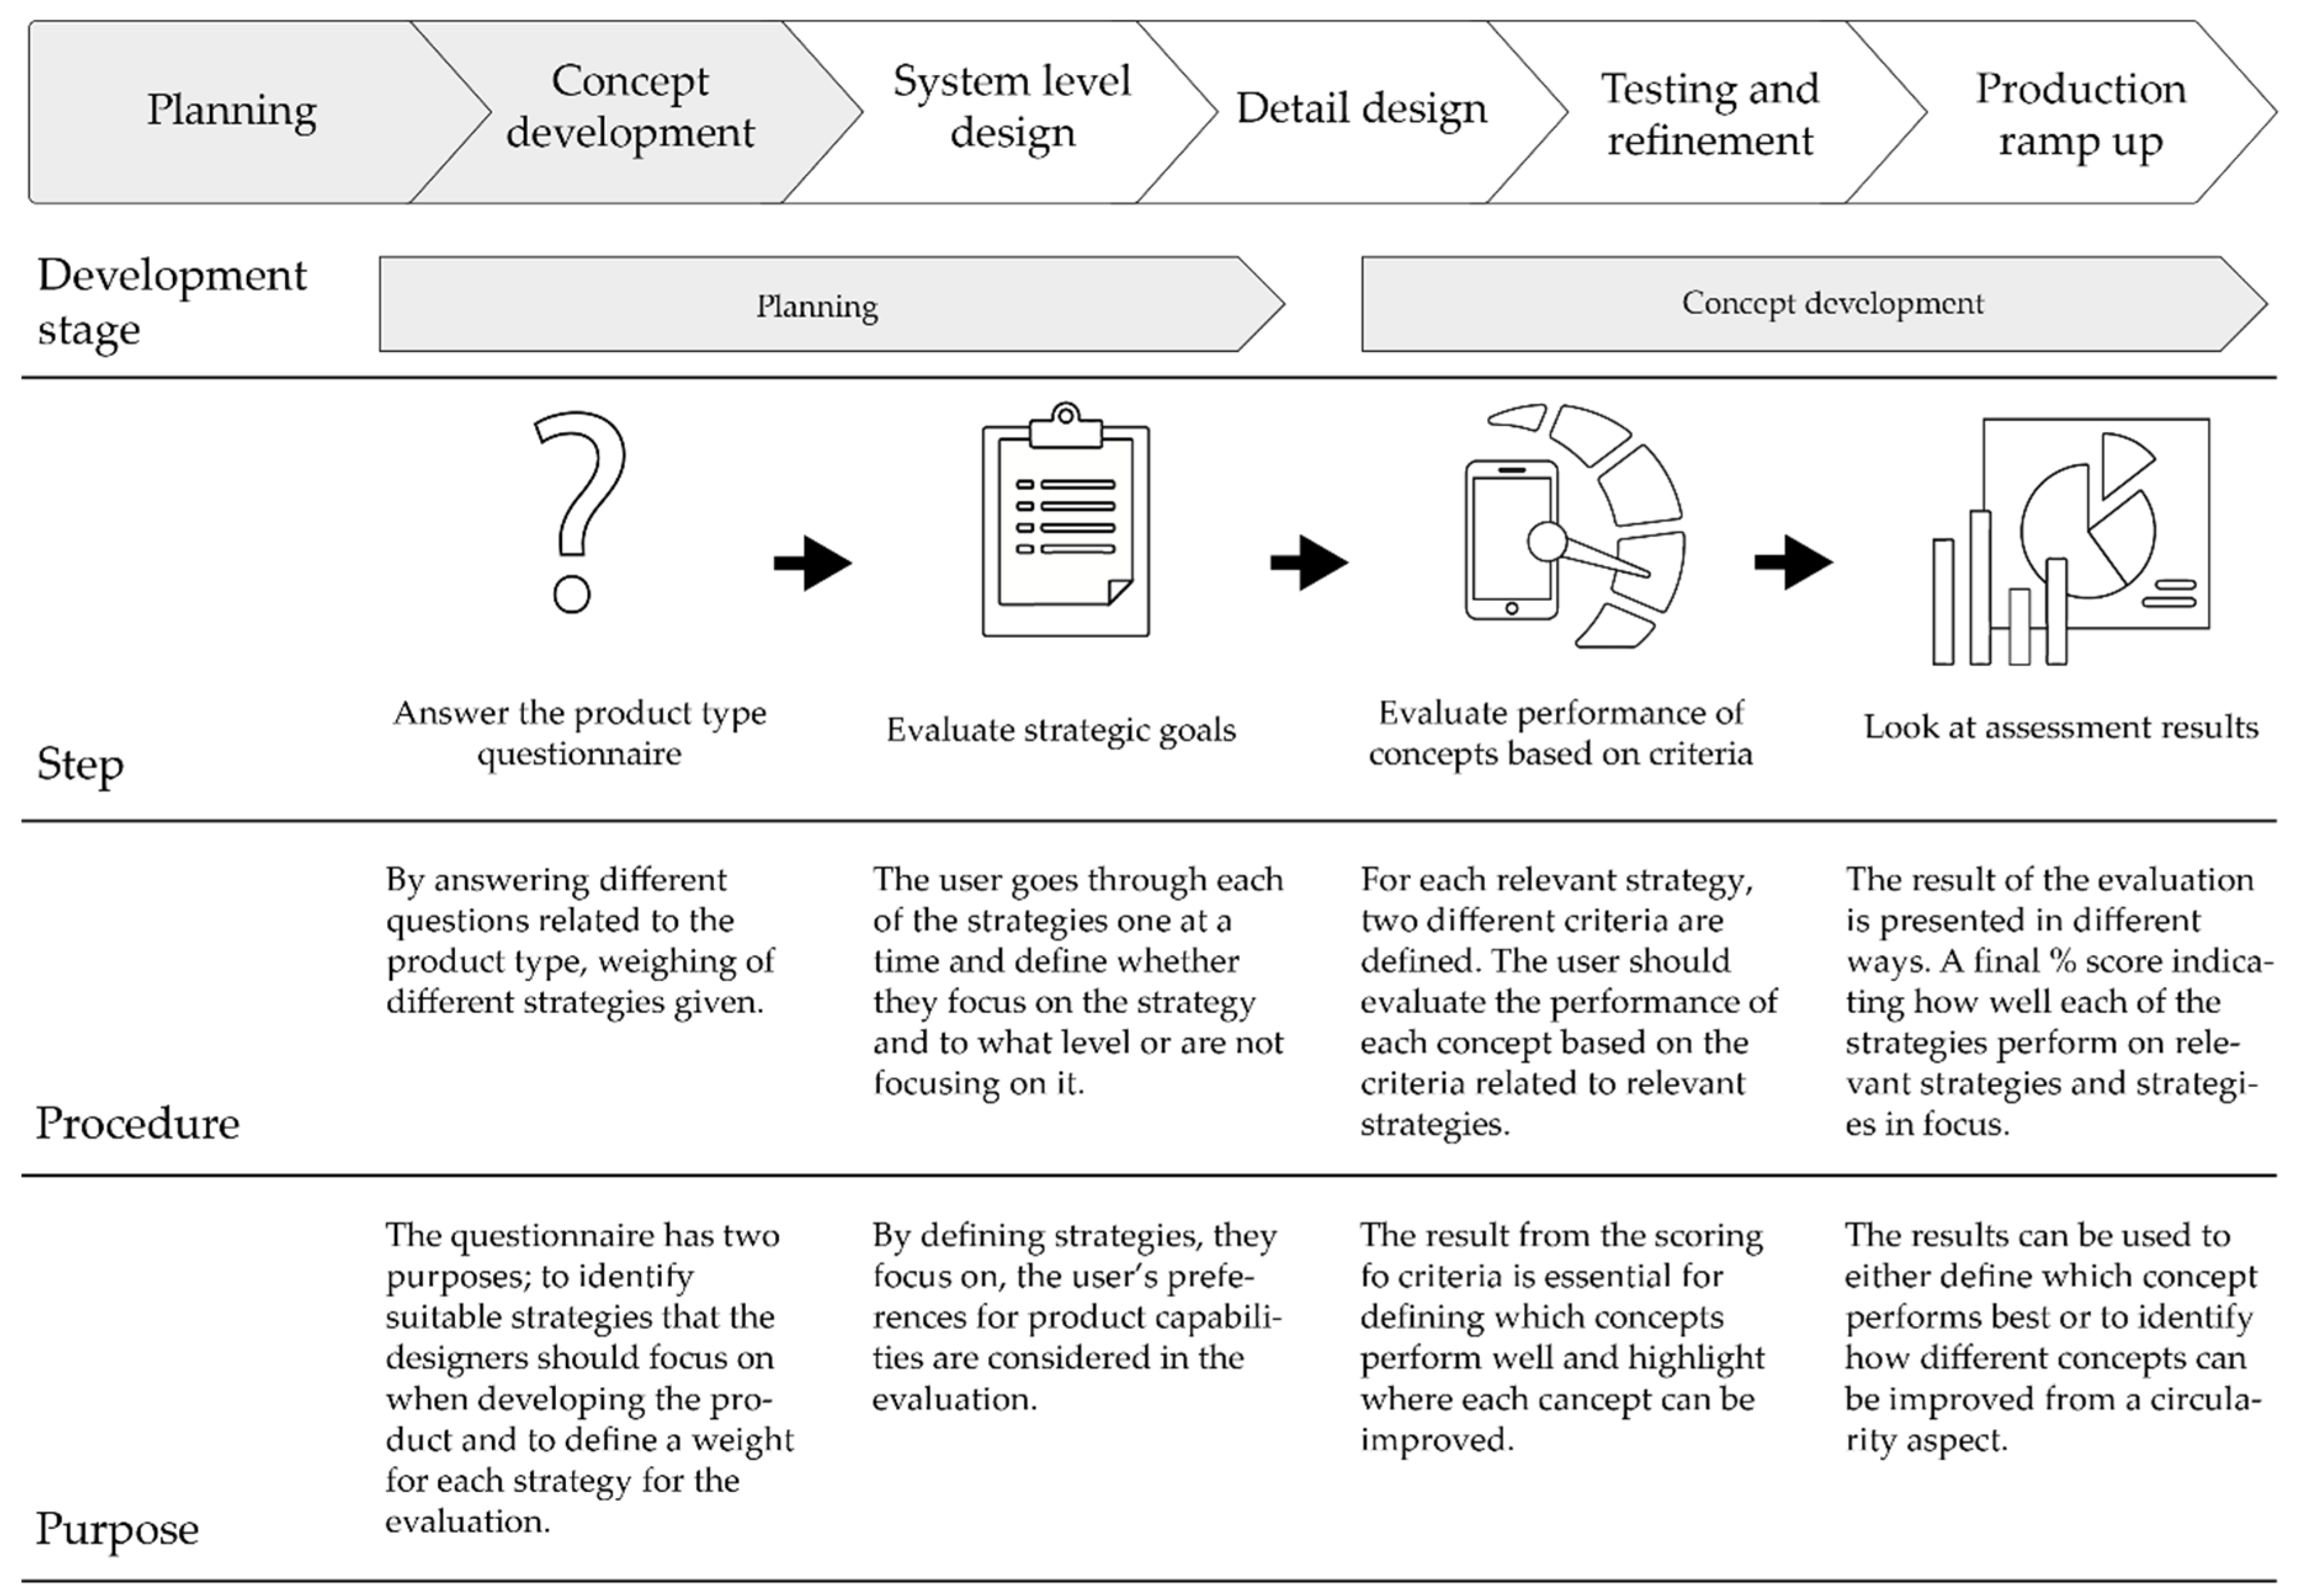
7.2. The Procedure for Applying the CCET:v2

The CCET:v2′s overall steps are illustrated in Figure 3 below. The first two steps (product type questionnaire and circular strategy goal questionnaire) are correlated with the evaluation of importance in the CCET:v1, which defines how much each strategy influences the overall result. The third step is correlated with the evaluation of the level of fulfillment, while the fourth step remains the same.
Step 1: Answer the product type questionnaire.
The first step is to go through the product type questionnaire, which specifies the characteristics of the product concept through 14 multiple choice questions (see Table 5). Based on the given answers, the questionnaire automatically generates scores between 0 and 6 for each of the circular strategies defined by [32] (except for “rethink” and “reinvent” circular strategies, which are business model-related), with 0 being irrelevant and 6 being highly relevant to the product type. The answers to each of the questions assign scores to related circular strategies. For example, the question “What is the primary reason why the user disposes of the product?” helps define which strategies could be relevant for the product. If the product is disposed because the user no longer needs it, then it could show potential for a second use cycle by another user (reuse), or if the product is disposed due to no longer being functional, then there could be a circularity potential in repairing and maintaining the product. One question can influence multiple strategy scores both positively and negatively. The calculation of scores was adapted through multiple rounds of testing with different product types.
The scores depend on product (e.g., material type and technological development) and market characteristics (e.g., second-hand market and recycling options). It is suggested that this step is performed already in the planning phase of the project, as the results can guide one toward setting a clear strategic goal for the product. The calculation of strategy scores considers the hierarchy of the recirculation strategies [32]. This means that the maximum score possible for the most preferred strategies (i.e., upgrade, reuse, repair, and maintenance) is 6, while it decreases gradually according to the hierarchy for less preferred strategies, e.g., recycling can only reach a strategy score of 3, even in a case when recycling is highly relevant.
Step 2: Define the circular strategic goals.
The next step is to define which circular product-related strategies are strategically relevant for the company based on its circular economy and/or sustainability strategies. The development team should evaluate the circularity strategies [32] and define their strategic relevance for the company and circularity goals (very much in focus (3), in focus (2), not in focus but still relevant (1), and not relevant(0)). In the questionnaire, a short description of each strategy is provided, which should help avoid confusion in the definition of strategies. By combining the strategy score (step 2) and the product type (step 1), the relative weight of the circular strategies is defined.
Step 3: Rate the performance levels.
In the third step, the performance level for alternative concepts is individually rated according to circular strategies and their evaluation parameters (for each strategy, two evaluation parameters are defined). The performance level is subjectively evaluated on a scale from 0 to 3 (0–“not at all”, 1–“low”, 2–“medium”, and 3–“high”) for each relevant evaluation parameter. The subjective evaluation is carried out by the development team in a workshop, where they should agree upon the performance of each concept based on the parameters.
The result of the evaluation is a relative circularity score for the product type and is based on the scores from the product type (step 1), the strategic goals (step 2) and the performance evaluation of concepts (step 3). The circularity score is calculated using the following equation:
i = 1 n P t · S g · C p / i = 11 n P t
In the above equation, Pt is the product type score (from step 1), Sg is the strategic goal score (from step 2), and Cp is the concept performance for each criterion (from step 3). The circularity scores are given as percentages indicating the performance relative to the highest possible circularity. The higher the circularity score is, the better the concept is in terms of circularity. Reaching 100% should not be the goal, as it requires targeting all relevant strategies, which is not realistic nor likely to be economically favorable. By targeting the most relevant strategies, high scores should be achieved.
In addition to the overall score, strategy scores are also calculated. The strategy scores are defined based on the circularity focus and the performance score. Strategy scores are useful for highlighting which concepts are most suited for specific strategies that are highly prioritized.
Step 4: Visualize and interpret the results.
The results can be visualized in a graph, which shows the overall overview of circularity scores for different concepts in a bar chart. The higher the circularity score is, the better the concept in terms of circularity. The user can additionally look at the strategy percentage score on the “performance evaluation” sheet to find improvement potentials to each concept in terms of different strategies. Figure 4 depicts the CCET:v2 in two pictures: (A) “performance evaluation” sheet and (B) bar chart visualization.

7.3. Testing of the CCET:v2

The CCET:v2 was tested and verified in four manufacturing companies. The aim was to gain insight into companies’ perspectives, assess the tool’s usability and usefulness for their products/concepts, particularly with regard to improvements and updates, and eventually conclude the learning points and identify the benefits, drawbacks and further improvement potential.
Company A is the same company that tested the CCET:v1 and produces urban furniture. The main functions involved in this company included the product designer and head of strategy and sustainability. Company B produces trampolines and is the same company that tested the CCET:v1; the main involved functions include innovation leader and sustainability coordinator. Company C produces ergonomic mobility aids for people, such as wheelchairs. The main functions involved in Company C are head of project management for product development. Company D is a supplier of plastic components to several companies. The main involved functions include mechanical development engineers.
The test and verification of the CCET:v2 was mainly carried out through online interviews with Companies A, B, and C and through an external workshop at Company D, whereas the improvement potential was concluded through an internal workshop and meetings with project members. The feedback and results from the test and verification are presented in accordance with the overall steps for the CCET:v2 (Figure 3).
  • Step 1: Product type questionnaire: Interviewees had positive feedback with regard to this questionnaire, which supports the evaluation of the level of importance. According to the feedback, the procedure is well guided and intuitive. However, the tool needs to be transparent in how the strategy scores are generated.
  • Step 2: Circular strategic goals: the strategy goal questionnaire was considered one of the most informative and pedagogic parts of the CCET:v2 since it provides overall descriptions of the individual strategies and forces the team to reflect on circular strategic goals for the particular product. However, some confusion regarding definitions and distinguishing among circular strategies, such as reuse, refurbishment, and repurposing, was observed at the workshop with Company D. Therefore, improvements in circular strategy definitions were made to ensure a complete understanding and avoid any further confusion.
  • Step 3: Performance levels: Rating the performance levels was generally considered quite intuitive and instructive to understand. However, a technical issue regarding background calculations was pointed out in the workshop with Company D, which was eradicated afterward.
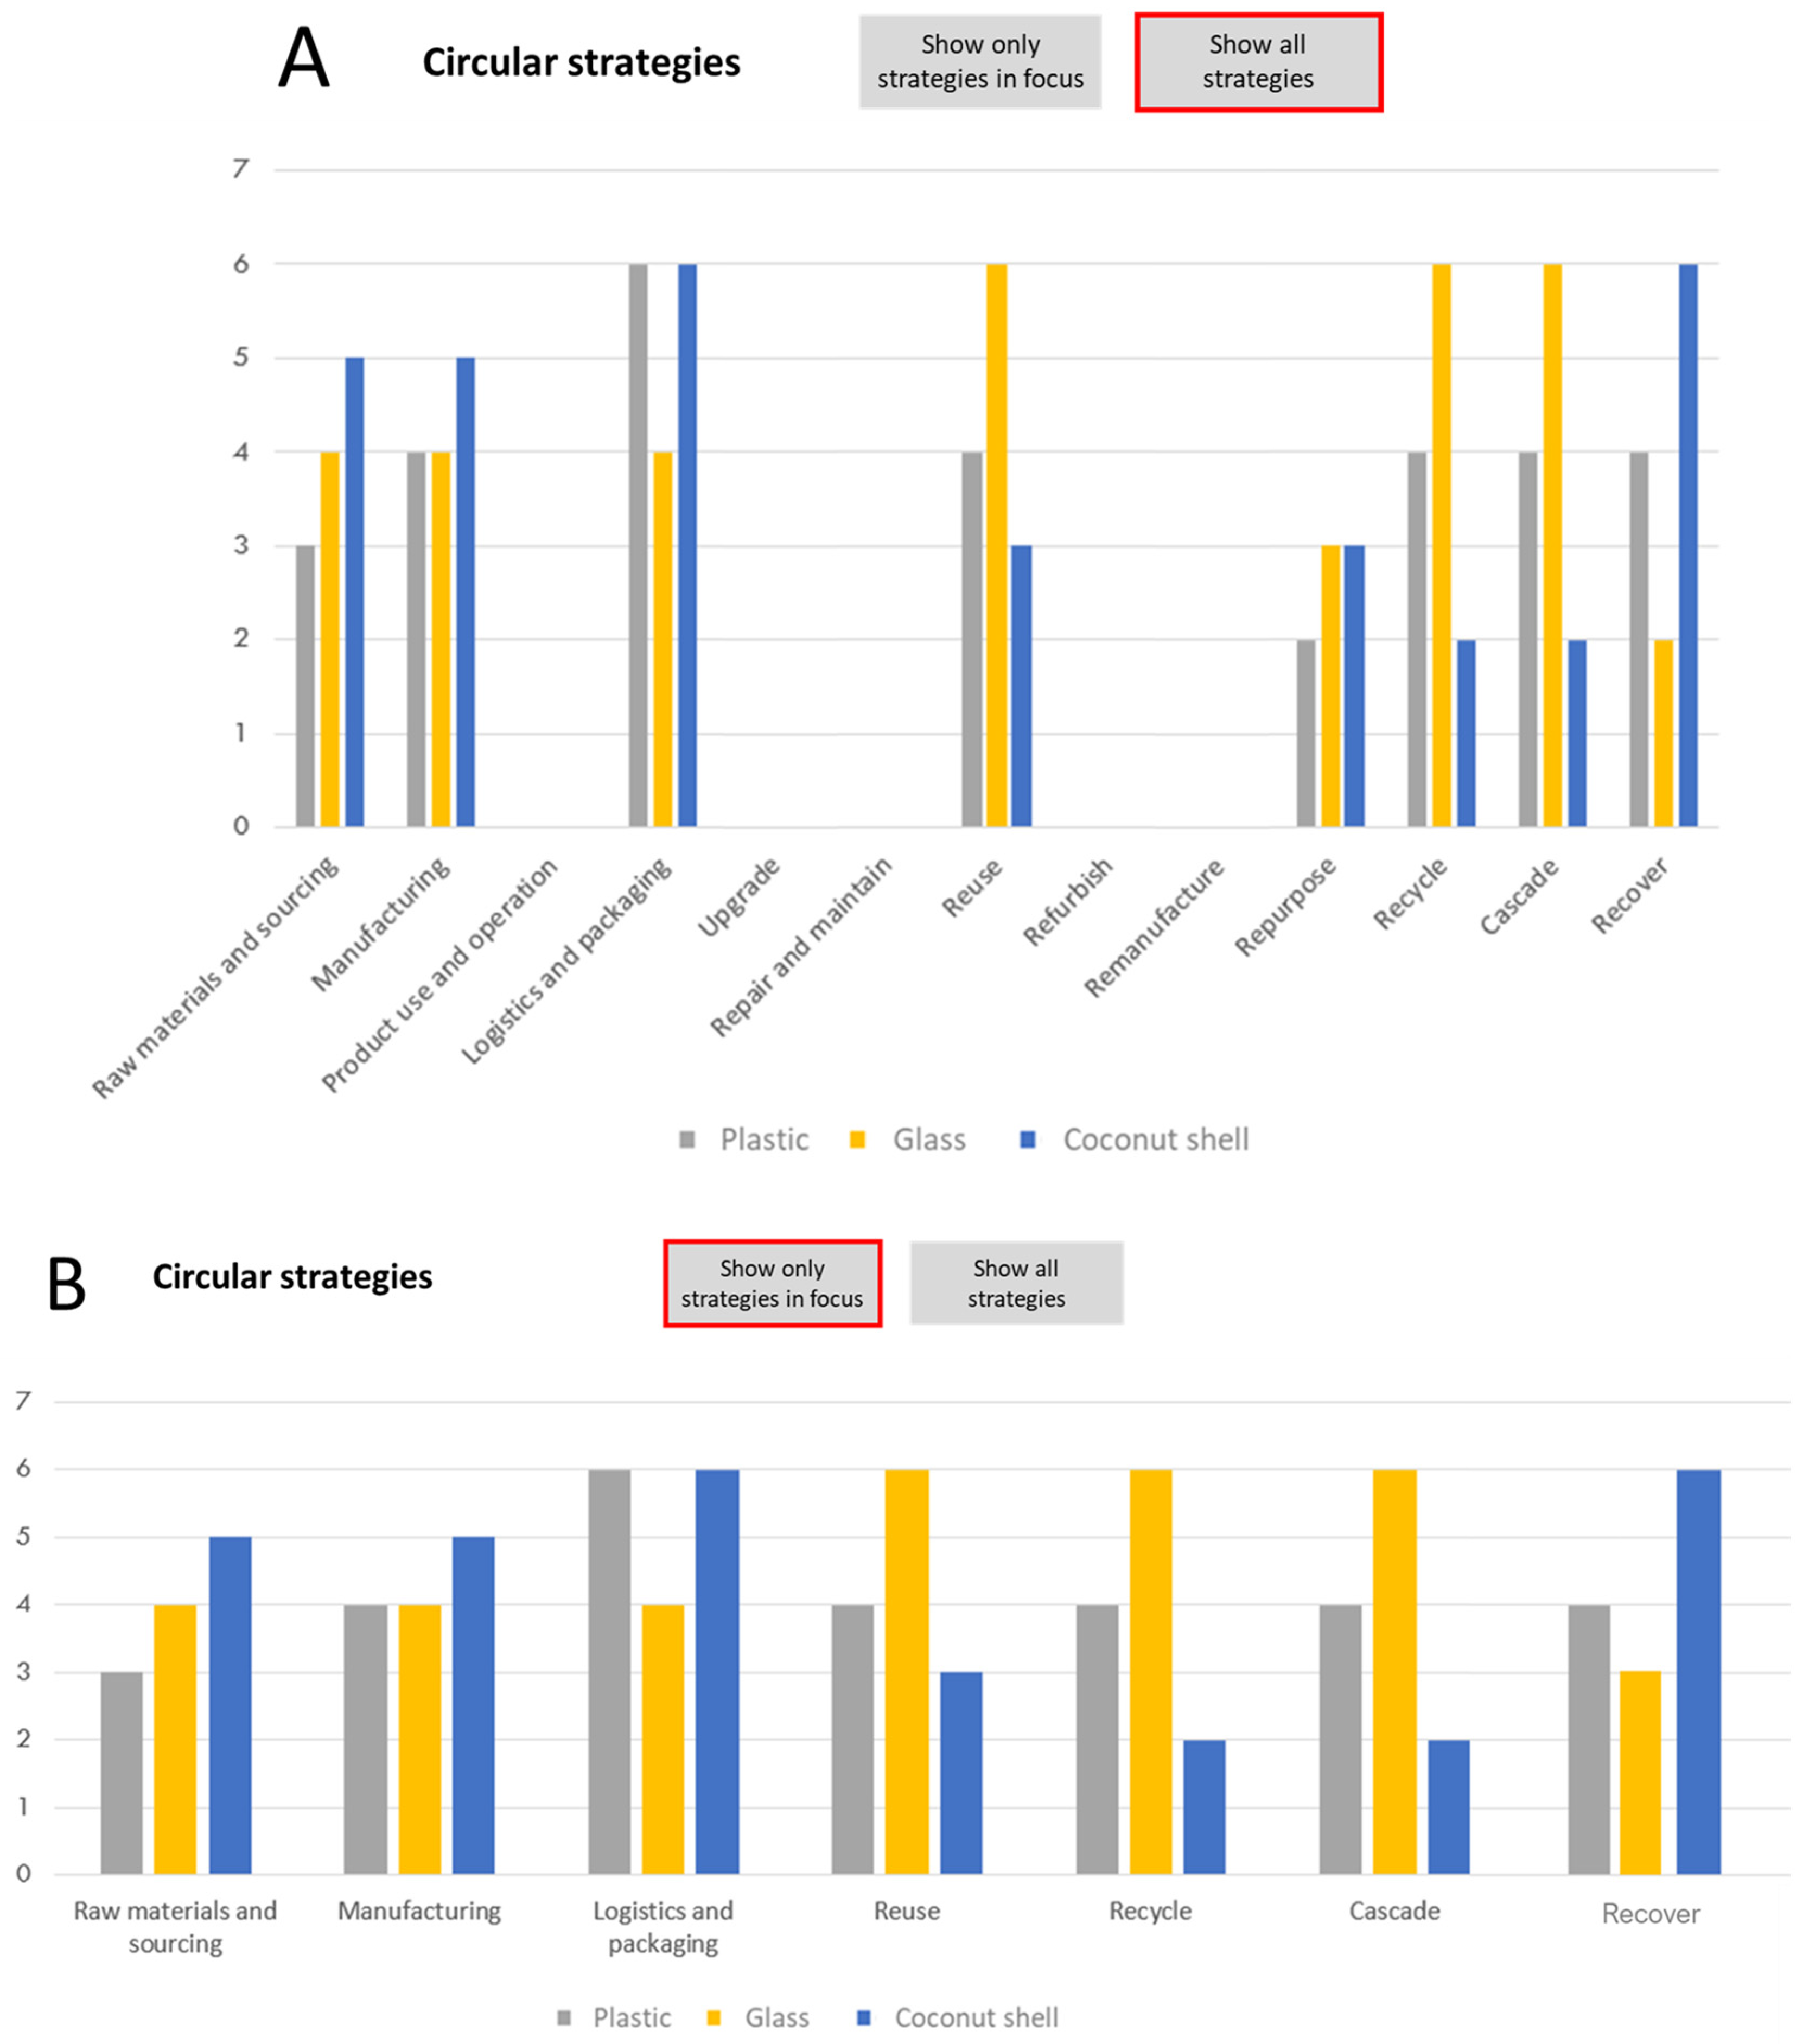
  • Step 4: Visualization of results: In general, interviewees at Companies A, B, and C found the results of the evaluation understandable. A general comment pointed out a better and more detailed visualization of the results, particularly for communication purposes with people who were not a part of the evaluation process.
The feedback in the test and verification of the CCET:v2 indicated the high usefulness of the tool, although some minor improvement opportunities were identified and implemented. The main improvements to the CCET:v2 included more detailed descriptions in the questionnaires as well as explanations of how the strategy scores are allocated. In addition, detailed descriptions of circular strategies were further provided to ensure the intuitiveness and instructiveness of the CCET:v2. Finally, the result page was reformulated to increase the communication potential of the results. This improvement included adding a bar chart (Figure 5) that shows the strategy scores. The bar chart was designed not only to show scores for all strategies (Picture A: show all strategies) but also to filter the relevant strategies that were selected in previous steps (Picture B: show strategies in focus). This feature enables a clear comparison of concept performance of a few specific strategies. In other words, with “show all strategies” mode, all circular strategies and their circularity performance (scores) are shown regardless if a strategy is relevant to the product. However, when selecting “show strategies in focus”, then only the strategies that are relevant to the concepts are shown. The selection of relevant strategies was carried out through steps 1 and 2. Figure 5 illustrates a made-up illustrative example of designing beverage bottles made of different materials (e.g., glass, plastic, and coconut shell) to last longer and be manageable in end-of-use. As shown in Picture A, product use and operation, repair and maintenance, refurbishment and remanufacturing are not relevant to this product type and defined circularity goal, therefore there are no bars for them. However, as shown in Picture B, the relevant strategies and their circularity scores are given for the three concepts made of different materials, which can be easily compared. Whenever needed, trade-off analyses need to be carried out based on the most relevant circular strategies and existing infrastructure, as to support the selection of the most adequate concept (e.g., if there is a take-back system in place for the collection of bottles in the end-of-use phase, the concept with the highest score in “reuse” should be prioritized—in the example, glass bottles).
Both versions of the CCET are accessible as complementary materials.

8. Discussion

The CCET presents a detailed approach to (i) identifying relevant Circular Economy strategies, (ii) establishing the circularity strategic focus, and (iii) evaluating concept performance based on the strategic goals in the early stages of product development (from planning to concept selection).
The CCET is, to a high extent, fulfilling the identified criteria for a successful evaluation tool (Table 3):
  • Identification of hotspots: The hotspot analysis enables the developers to identify weak points in the concept layout and potentially improve these to achieve a higher circularity;
  • Comparison of concepts: The CCET supports the evaluation of the circularity potential of multiple concepts either from a combined circularity point of view or by specific strategies;
  • Broad scope of strategies: The CCET includes a broad set of circular strategies, covering both eco-efficiency and eco-effectiveness strategies;
  • Hierarchy of recirculation strategies: In the calculation of strategy scores, the CCET integrates a hierarchy of the recirculation strategies, which forces the development team to consider the possibilities of targeting strategies with higher circularity potential (e.g., upgrade, repair, and reuse), as these will enable higher circularity scores;
  • Customized evaluation: The tool ensures that concepts are evaluated in a customized way, based on specific product features (e.g., not all products will become more circular by being upgradable);
  • Informative, pedagogic, and instructive: The tool contains multiple elements of being pedagogic to the user, such as the guiding toward the definitions and selection of circular strategies;
  • Simple and intuitive: The user learns more about the circular strategies and designing for these by using the tool. According to the test feedback, it is indicated that the tool is intuitive, as the user is guided through the process, one-step at a time.
The four steps of the final version of the CCET are presented in Figure 6, along with the benefits provided by the corresponding step. See also the Supplementary Materials, which shows the instructions of the tool step-by-step and screenshots from Excel.
The tool should start being used during the planning stage of product development [11]. In this stage, the product type questionnaire acts as a guiding tool toward setting circularity goals for the particular product. The development team uses the product type questionnaire to circularity goals and develops circular concepts with help from circular design guidelines (e.g., [9]). In the concept development stage [11], the evaluation of alternative product concepts can be performed. Since the product type questionnaire is already answered, the user can start from the strategy focus questionnaire and move on to the performance evaluation. The visualization of the results makes it clear and easy to identify the improvement potential of the different concepts.
Although the tool shows promising results from the testing, there might still be further improvement potential. For example, in terms of the questionnaire, further testing and adaptions could be made if more data become available and the CCET is tested in several other companies with different products and product design and development processes.

9. Summary and Conclusions

Product design and development are important aspects in circular transition and circularity decision making, such as the type of material, assembly method, and expected lifespan, and during the early stages, they will significantly influence the product´s circularity and sustainability performance over its lifecycle. However, circularity aspects are seldom considered in decision-making procedures of product design and development in the early stages. Based on an extensive literature review of the guidelines and existing tools for circular product design and development, this paper presents the concept circularity evaluation tool (CCET) to evaluate alternative concepts in terms of circularity in the early stages of the product design and development process.
This paper contributes to the literature and industrial practices in several ways: (a) Providing an overview on existing tools for evaluating product circularity; (b) making a comparative analysis of identified tools from the literature to pinpoint benefits and drawbacks; (c) identifying the success criteria for the development of a concept circularity evaluation tool based on the literature study and several discussions with companies and research groups; (d) cocreating and codeveloping the concept circularity evaluation tool (CCET) together with engaged companies to evaluate alternative concepts in terms of circularity in early stages of product design and development process; (e) empirically testing and verifying the tool at four manufacturing companies within the Nordic countries; (f) helping engage companies to evaluate their current products in terms of circularity, and executing hotspot analysis to highlight improvement potentials; (g) helping these engaged companies compare alternative concepts in terms of circularity; (h) enhancing companies’ understanding of the circular economy and supporting their decision making to develop circular products; and (h) adding value to the literature on the circular economy and product development.
Although the tool has proven to be useful for evaluating the circularity of product concepts and supportive for decision making in the early stages of product design and development, some limitations need to be addressed. Tool testing and verification were carried out at small and medium-sized companies, which usually have a simpler product design and development process and fewer functions involved. Future tool development and tests might focus on larger companies with more complex products, more robust product development processes, and more engaged functions. Although the tool has been developed and tested via a cocreation approach with involved product design and development functions at each company, certain subjectivity still exists when answering the questionnaires and rating performance levels. This subjectivity can be eradicated by replicating the results and performing multiple tests at several companies.

Supplementary Materials

The following are available online at https://www.mdpi.com/2071-1050/12/22/9353/s1.

Author Contributions

S.S. and J.K.A. contributed in data collection and analysis, literature and empirical studies, discussions and conclusion as well as writing. T.C.M. and D.C.A.P. contributed in data analysis, writing and proofreading. All authors have read and agreed to the published version of the manuscript.

Funding

This research was part of the Nordic Green Growth Research and Innovation Programme (grant numbers: 83144) and funded by NordForsk, Nordic Energy Research, and Nordic Innovation. The authors also acknowledge the funding received from the XPRES initiative.

Acknowledgments

This paper is one of the outcomes of the research project CIRCit (Circular Economy Integration in the Nordic Industry for Enhanced Sustainability and Competitiveness), and we would like to thank the companies participating in the CIRCit project and the reviewers whose thoughtful feedback aided the development of this work.

Conflicts of Interest

The authors declare no conflict of interest.

References

  1. Nasr, N.; Russell, J.; Bringezu, S.; Hellweg, S.; Hilton, B.; Kreiss, C.; Von Gries, N. Re-defining Value: The Manufacturing Revolution-Remanufacturing, Refurbishment, Repair and Direct Reuse in the Circular Economy; United Nations Environment Programme: Nairobi, Kenya, 2018. [Google Scholar]
  2. Ellen MacArthur Foundation. Towards the Circular Economy. Economic and Business Rationale for an Accelerated Transitio—Executive Summary; Ellen MacArthur Foundation: Cowes, UK, 2012. [Google Scholar]
  3. Directive 2009/125/EC. Directive 2009/125/EC of the European Parliament and of the Council Establishing a Framework for the Setting of Ecodesign Requirements for Energy-related Products. 2009. Available online: https://eur-lex.europa.eu/LexUriServ/LexUriServ.do?uri=OJ:L:2009:285:0010:0035:en:PDF (accessed on 1 November 2020).
  4. The European Commission. Closing the Loop—An EU Action Plan for the Circular Economy COM/2015/0614. 2015. Available online: https://eur-lex.europa.eu/resource.html?uri=cellar:8a8ef5e8-99a0-11e5-b3b7-01aa75ed71a1.0012.02/DOC_1&format=PDF (accessed on 1 November 2020).
  5. Pigosso, D.; McAloone, T. How can design science contribute to a circular economy? In Proceedings of the International Conference on Engineering Design, Vancouver, BC, Canada, 21–25 August 2017. [Google Scholar]
  6. Rouvin, A.; Zhao, A.; Detrois, C.; Chayadi, J.; Kokkonen, K.; Tascioglu, S.; Fallot, S. Unlocking More Value with Fewer Resources: A Practical Guide to the Circular Economy; World Business Council for Sustainable Development (WBCSD) Leadership Program: Geneva, Swizerland, 2016. [Google Scholar]
  7. Moreno, M.; De los Rios, C.; Rowe, Z.; Charnley, F. A conceptual framework for circular design. Sustainability 2016, 8, 937. [Google Scholar] [CrossRef] [Green Version]
  8. Pozo Arcos, B.; Balkenende, A.R.; Bakker, C.A.; Sundin, E. Product Design for a Circular Economy: Functional Recovery on Focus. In Proceedings of the DS 92: DESIGN 2018 15th International Design Conference, Dubrovnik, Croatia, 21–24 May 2018; pp. 2727–2738. [Google Scholar]
  9. Shahbazi, S.; Jönbrink, A.K. Design Guidelines to Develop Circular Products: Action Research on Nordic Industry. Sustainability 2020, 12, 3679. [Google Scholar] [CrossRef]
  10. Saidani, M.; Yannou, B.; Leroy, Y.; Cluzel, F. How to assess product performance in the circular economy? Proposed requirements for the design of a circularity measurement framework. Recycling 2017, 2, 6. [Google Scholar] [CrossRef] [Green Version]
  11. Ulrich, K.T.; Eppinger, S.D. Product Design and Development; McGraw-Hill Higher Education: New York, NY, USA, 2008. [Google Scholar]
  12. Blessing, L.T.M.; Chakrabarti, A. DRM, a Design Research Methodology; Springer: London, UK, 2009. [Google Scholar]
  13. Dubois, A.; Gadde, L.-E. Systematic combining: An abductive approach to case research. J. Bus. Res. 2002, 55, 553–560. [Google Scholar] [CrossRef]
  14. Bocken, N.M.P.; de Pauw, I.; Bakker, C.; van der Grinten, B. Product design and business model strategies for a circular economy. J. Ind. Prod. Eng. 2016, 33, 308–320. [Google Scholar] [CrossRef] [Green Version]
  15. Boks, C.; McAloone, T.C. Transitions in sustainable product design research. Int. J. Prod. Dev. 2009, 9, 429–449. [Google Scholar] [CrossRef]
  16. Knight, P.; Jenkins, J.O. Adopting and applying eco-design techniques: A practitioners perspective. J. Clean. Prod. 2009, 17, 549–558. [Google Scholar] [CrossRef] [Green Version]
  17. Rodrigues, V.P.; Pigosso, D.C.A.; McAloone, T.C. Measuring the implementation of ecodesign management practices: A review and consolidation of process-oriented performance indicators. J. Clean. Prod. 2017, 156, 293–309. [Google Scholar] [CrossRef] [Green Version]
  18. Pigosso, D.C.A.; McAloone, T.C.; Rozenfeld, H. Systematization of best practices for ecodesign implementation. In Proceedings of the DS 77: DESIGN 2014 13th International Design Conference, Dubrovnik, Croatia, 19–22 May 2014; pp. 1651–1662. [Google Scholar]
  19. Maccioni, L.; Borgianni, Y.; Pigosso, D.C. Can the choice of eco-design principles affect products’ success? Des. Sci. 2019, 5, e25. [Google Scholar] [CrossRef] [Green Version]
  20. Hauschild, M.Z.; Rosenbaum, R.K.; Olsen, S.I. Life Cycle Assessment: Theory and Practice; Springer: Basel, Switzerland, 2017. [Google Scholar]
  21. Kuo, T.-C.; Huang, S.H.; Zhang, H.-C. Design for manufacture and design for ‘X’: Concepts, applications, and perspectives. Comput. Ind. Eng. 2001, 41, 241–260. [Google Scholar] [CrossRef]
  22. Go, T.; Wahab, D.A.; Hishamuddin, H. Multiple generation life-cycles for product sustainability: The way forward. J. Clean. Prod. 2015, 95, 16–29. [Google Scholar] [CrossRef]
  23. Mendoza, J.M.F.; Sharmina, M.; Gallego-Schmid, A.; Heyes, G.; Azapagic, A. Integrating backcasting and eco-design for the circular economy: The BECE framework. J. Ind. Ecol. 2017, 21, 526–544. [Google Scholar] [CrossRef] [Green Version]
  24. Vezzoli, C.; Manzini, E. Design for Environmental Sustainability; Springer: London, UK, 2008. [Google Scholar]
  25. Branowski, B.; Zabłocki, M.; Sydor, M. The Material Indices Method in the Sustainable Engineering Design Process: A Review. Sustainability 2019, 11, 5465. [Google Scholar] [CrossRef] [Green Version]
  26. Battaïa, O.; Dolgui, A.; Heragu, S.S.; Meerkov, S.M.; Tiwari, M.K. Design for Manufacturing and Assembly/Disassembly: Joint Design of Products and Production Systems; Taylor & Francis: Abingdon-on-Thames, UK, 2018. [Google Scholar]
  27. Soh, S.; Ong, S.; Nee, A. Design for assembly and disassembly for remanufacturing. Assem. Autom. 2016, 36, 12–24. [Google Scholar] [CrossRef]
  28. Sundin, E. Product and Process Design for Successful Remanufacturing; Linköping University Electronic Press: Linköping, Sweden, 2004. [Google Scholar]
  29. Lindkvist Haziri, L.; Sundin, E.; Sakao, T. Feedback from Remanufacturing: Its Unexploited Potential to Improve Future Product Design. Sustainability 2019, 11, 4037. [Google Scholar] [CrossRef] [Green Version]
  30. Hultgren, N. Guidelines and Design Strategies for Improved Product Recyclability-How to Increase the Recyclability of Consumer Electronics and Domestic Appliances through Product Design. Available online: http://publications.lib.chalmers.se/records/fulltext/166740.pdf (accessed on 1 November 2020).
  31. Hu, Q.; Peng, Y.; Guo, C.; Cai, D.; Su, P. Dynamic Incentive Mechanism Design for Recycling Construction and Demolition Waste under Dual Information Asymmetry. Sustainability 2019, 11, 2943. [Google Scholar] [CrossRef] [Green Version]
  32. Blomsma, F.; Pieroni, M.; Kravchenko, M.; Pigosso, D.; Hildenbrand, J.; Kristinsdottir, A.R.; Kristoffersen, E.; Shabazi, S.; Nielsen, K.D.; Jönbrink, A.-K.; et al. Developing a circular strategies framework for manufacturing companies to support circular economy oriented innovation. J. Clean. Prod. 2019, 241, 118271. [Google Scholar] [CrossRef]
  33. Bovea, M.D.; Pérez-Belis, V. Identifying design guidelines to meet the circular economy principles: A case study on electric and electronic equipment. J. Environ. Manag. 2018, 228, 483–494. [Google Scholar] [CrossRef]
  34. Ellen MacArthur Foundation. The Circular Design Guide. Available online: https://www.circulardesignguide.com/ (accessed on 1 November 2020).
  35. Elia, V.; Gnoni, M.G.; Tornese, F. Measuring circular economy strategies through index methods: A critical analysis. J. Clean. Prod. 2017, 142, 2741–2751. [Google Scholar] [CrossRef]
  36. Linder, M.; Sarasini, S.; van Loon, P. A metric for quantifying product-level circularity. J. Ind. Ecol. 2017, 21, 545–558. [Google Scholar] [CrossRef] [Green Version]
  37. Ellen MacArthur Foundation. Circularity Indicators: An Approach to Measuring Circularity-Methodology; Ellen MacArthur Foundation: Cowes, UK, 2015. [Google Scholar]
  38. Franklin-Johnson, E.; Figge, F.; Canning, L. Resource duration as a managerial indicator for Circular Economy performance. J. Clean. Prod. 2016, 133, 589–598. [Google Scholar] [CrossRef]
  39. Evans, J.; Bocken, N. Circular Economy Toolkit. Available online: http://circulareconomytoolkit.org/ (accessed on 1 November 2020).
  40. Griffiths, P.; Cayzer, S. Design of indicators for measuring product performance in the circular economy. In Proceedings of the International Conference on Sustainable Design and Manufacturing, Budapest, Hungary, 4–5 July 2019; pp. 307–321. [Google Scholar]
  41. Kravchenko, M.; Pigosso, D.C.A.; McAloone, T.C. Towards the ex-ante sustainability screening of circular economy initiatives in manufacturing companies: Consolidation of leading sustainability-related performance indicators. J. Clean. Prod. 2019, 241, 118318. [Google Scholar] [CrossRef]
  42. Parchomenko, A.; Nelen, D.; Gillabel, J.; Rechberger, H. Measuring the circular economy-A Multiple Correspondence Analysis of 63 metrics. J. Clean. Prod. 2019, 210, 200–216. [Google Scholar] [CrossRef]
  43. Kravchenko, M.; Pigosso, D.C.; McAloone, T.C. A Procedure to Support Systematic Selection of Leading Indicators for Sustainability Performance Measurement of Circular Economy Initiatives. Sustainability 2020, 12, 951. [Google Scholar] [CrossRef] [Green Version]
  44. ResCoM. Available online: https://www.rescoms.eu/ (accessed on 4 April 2020).
  45. Boorsma, N.; Peck, D.; Fischer, S.; Bakker, C.; Balkenende, R. Remanufacturing workshops with professionals to overcome barriers-outcomes of two eu projects. In Proceedings of Concerence Going Green—Care Innovation 2018, Vienna, Austria, 26–29 November 2018. [Google Scholar]
Figure 1. Overview of steps for the first version of the concept circularity evaluation tool (CCET:v1).
Sustainability 12 09353 g001
Figure 2. The input and output screenshot of the CCET:v1.
Sustainability 12 09353 g002
Figure 3. Overview of steps for the second version of the concept circularity evaluation tool (CCET:v2).
Sustainability 12 09353 g003
Figure 4. The final two steps of the CCET:v2.
Sustainability 12 09353 g004
Figure 5. Additional bar charts for strategy scores.
Sustainability 12 09353 g005
Figure 6. Overview of steps for the final version of the concept circularity evaluation tool (CCET), with the development process adapted from Ulrich and Eppinger (2008).
Sustainability 12 09353 g006
Table 1. Overview of the process and method adopted from the design research methodology [12].
Research Clarification (RC)
Main activities
  • Literature review
Main outcome
  • Overview and understanding of a circular product design and development
Descriptive study I (DS I)
Main activities
  • Extended literature review
Main outcome
  • Overview and understanding of existing tools to evaluate product circularity in product design and development
  • Identify the success criteria for a circularity tool
Prescriptive study I (PS I)
Main activities
  • Workshop with companies
  • Internal workshop and meetings
Main outcome
  • Cocreation and development of the first version of the concept circularity evaluation tool (CCET:v1) with manufacturing companies
Descriptive Study II (DS II)
Main activities
  • Workshops with companies
  • Webinar
  • Internal workshop and meetings
Main outcome
  • Testing the CCET:v1 with manufacturing companies
  • Presenting the CCET:v1 to several manufacturing companies and consultancies
  • Cross comparison of (identified) existing tools
Prescriptive Study II (PS II)
Main activities
  • Ideation
  • Internal workshops and meetings
Main outcome
  • Development of the second version of the concept circularity evaluation tool (CCET:v2)
Descriptive Study III (DS III)
Main activities
  • Interviews with companies
  • External workshop
  • Internal workshops and meetings
Main outcome
  • Testing and verification of the CCET:v2 in four manufacturing companies
  • Concluding learnings points and improvement potential from the CCET:v2
Prescriptive Study III (PS III)
Main activities
  • Internal workshop
Main outcome
  • Finalizing the latest version of the concept circularity evaluation tool (CCET)
Table 2. Success criteria for a successful concept circularity evaluation tool.
Success CriteriaBrief Description
Identify hotspotsThe tool should be able to identify circularity hotspots. Hotspots are key areas that highly influence or define the circularity of a concept, both positive and negative aspects. The identification of hotspots is a key feature to implement in the evaluation tool, as it guides the user to improve the evaluated concepts.
Comparison of conceptsSeveral concepts are usually developed and evaluated in the early product design and development process. It is therefore deemed highly useful that the tool can be applicable in a comparative analysis, which can also enable inspiration to be drawn from one concept to another, leading to the improvement of existing concepts and/or development of new concepts.
Broad scope of strategiesThe path toward a circular economy contains multiple strategies [32], and each of these strategies should be included in an evaluation tool. The tool should be able to capture the whole picture of the circular economy including recirculation strategies (e.g., upgrade, repair, reuse, and recycle), resource efficiency strategies (e.g., material sourcing), and business-model-related strategies (e.g., rethink and reinvent), which is exactly the opposite of many existing tools that focus only on single aspects of circularity (e.g., recycling rates).
Hierarchy of recirculation strategiesA tool for evaluating concept circularity should be able to differentiate different recirculation strategies (loops) and address different levels of their contribution to circularity (which is based on value loss). For example, most often, recycling or energy recovery is the least preferred strategy, while repairing and upgrading products is often more beneficial and preferred (see [32] for a complete hierarchy of the recirculation strategies, which include all the circular strategies related to recirculating products, parts, and material, e.g., upgrading, refurbishing and recycling)
Customized evaluationThe evaluation of a product in terms of circularity should be based on the characteristics and features of the product. A product characteristic (e.g., durability) might be relevant to product A but not to product B. In the very early stages of product development, different concepts for a product might not necessarily follow the same characteristics; for instance, concept A might focus on durability with the selection of robust material type and less diversity of materials, while concept B might focus on durability with the exchangeability of components. This highlights the importance of designing to ‘fit the purpose’.
Informative,
pedagogic and
instructive
The main goal of the circularity evaluation tool is to support decision making in the early stages of product design and development, which means finding circularity improvement potential in product concepts. Additionally, being informative, pedagogic, and instructive can be seen as the secondary goal of such a tool for the purpose of helping users understand circularity as a whole, think circular, and learn for future projects.
Simple and intuitiveProduct design and development engages several functions including designers, engineers and manufacturing representatives, research and development professionals, purchase and procurement staff, product owners, sales and marketing, general management, lifecycle assessment experts, and environmental coordinators. Hence, the tool should be simple and intuitive, with no confusion in use, understanding, and communicating the results.
Table 3. Comparative analysis of tools (+ means low, ++ means medium, +++ means high, and 0 means not included).
CriterionCEIPCETCPICCET:v1
Identifying hotspots+++++++
Comparison of concepts++++++
Broad scope of strategies++++++++++
Hierarchy of recirculation strategies0000
Customized evaluation000++
Informative, pedagogic, and instructive000+
Simple and intuitive++++++++++
Table 4. Shift from design guidelines to parameters.
Circular Strategies [32]Guidelines [9]Parameters
Raw materials andsourcing
  • Design using renewable materials
  • Design using recyclable and secondary (recycled) materials
  • Consider toxicity and other environmental aspects of materials
  • Use durable and robust components and materials
  • Minimize the number of different incompatible or dissimilar materials
Good environmental profile of materials
Minimization of materials
Manufacturing
  • Design using recyclable and secondary (recycled) materials
  • Consider toxicity and other environmental aspects of materials
  • Favor cleaner production, processes, machines, and equipment
  • Treat production (preconsumer) wastes appropriately
  • Design for reduced energy consumption and usage of renewable energy
Low-impact processes
Efficiency in production
Product use and operation
  • Think about activity supports in the operational stage
  • Focus on fulfilling the customer’s requirements and value creation
  • Try to use digitalization, ICT and IoT solutions
  • Make it easy to clean the product and components
  • Design using recyclable and secondary (recycled) materials
  • Design for reduced energy consumption and usage of renewable energy
  • Use durable and robust components and materials
Resource efficiency in use
Low-impact energy sourcing
Logistics and packaging
  • Design using renewable materials
  • Design using recyclable and secondary (recycled) materials
  • Consider toxicity and other environmental aspects of materials
  • Design for reduced energy consumption and usage of renewable energy
  • Use durable and robust components and materials
Optimized logistics
Optimized packaging for purpose
Upgrade
  • Focus mainly on functionality and quality performance
  • Focus on fulfilling the customer’s requirements and value creation
  • Try to use digitalization, ICT and IoT solutions
  • Make exchanging of faulty components easily accessible
  • Make it easy to dismantle the product nondestructively
  • Use durable and robust components and materials
  • Design in modular construction
  • Provide manuals and documentation
Access to and availability of upgrading parts
Durability and timelessness of product
Repair and maintenance
  • Try to use digitalization, ICT and IoT solutions
  • Make it easy to inspect the product and components
  • Make exchanging of faulty components easily accessible
  • Make it easy to dismantle the product nondestructively
  • Design standardized components across different products and models
  • Design standardized tools required across different products and models
  • Use durable and robust components and materials
  • Design in modular construction
  • Provide manuals and documentation
  • Make spare parts and exchanging components easily available
  • Use joints and connectors that can be easily opened and closed multiple times
Ease of diagnosis and repair of worn parts
Product longevity and maintainability
Reuse
  • Think about activity supports in the operational stage
  • Try to use digitalization, ICT and IoT solutions
  • Make it easy to inspect the product and components
  • Make it easy to clean the product and components
  • Use durable and robust components and materials
  • Consider timeless design, emotional attachment and compatibility
Durability and robustness of product
Ease of cleaning
Refurbishment
  • Try to use digitalization, ICT and IoT solutions
  • Make it easy to inspect the product and components
  • Make it easy to clean the product and components
  • Make exchanging of faulty components easily accessible
  • Make it easy to dismantle the product nondestructively
  • Design standardized components across different products and models
  • Design standardized tools required across different products and models
  • Use durable and robust components and materials
  • Design in modular construction
  • Provide manuals and documentation
  • Make spare parts and exchanging components easily available
  • Investigate current and upcoming laws and regulations
  • Use joints and connectors that can be easily opened and closed multiple times
Availability and compatibility of spare parts
Reversibility of assembly/disassembly process
Remanufacturing
  • Try to use digitalization, ICT and IoT solutions
  • Make it easy to inspect the product and components
  • Make it easy to clean the product and components
  • Make exchanging of faulty components easily accessible
  • Make it easy to dismantle the product nondestructively
  • Design standardized components across different products and models
  • Design standardized tools required across different products and models
  • Use durable and robust components and materials
  • Design in modular construction
  • Provide manuals and documentation
  • Make spare parts and exchanging components easily available
  • Investigate current and upcoming laws and regulations
  • Use joints and connectors that can be easily opened and closed multiple times
Rework ability of components
Reversibility of assembly/disassembly process
Repurpose
  • Make it easy to dismantle the product nondestructively
  • Use durable and robust components and materials
  • Provide manuals and documentation
Compatibility of design for new cycle
Ease of cleaning
Recycling
  • Make it easy to dismantle the product nondestructively
  • Design using recyclable and secondary (recycled) materials
  • Consider toxicity and other environmental aspects of materials
  • Design in modular construction
  • Provide manuals and documentation
  • Investigate current and upcoming laws and regulations
  • Minimize the number of different incompatible or dissimilar materials
  • Make it easy to identify the materials and relevant information
Separability of materials
Material recyclability
Cascade
  • Make it easy to dismantle the product nondestructively
  • Design using recyclable and secondary (recycled) materials
  • Consider toxicity and other environmental aspects of materials
  • Design in modular construction
  • Provide manuals and documentation
  • Investigate current and upcoming laws and regulations
  • Minimize the number of different incompatible or dissimilar materials
  • Make it easy to identify the materials and relevant information
Separability of materials
Material selection for cascading
Recover
  • Design using renewable materials
  • Consider toxicity and other environmental aspects of materials
  • Investigate current and upcoming laws and regulations
Optimized materials for recovery
Separability of resources not to be incinerated
Table 5. Questions and possible answers to questionnaire.
QuestionsAlternative Answers
What is the approximate lifetime (initial life) of this type of product?Single-use product; short-life product (up to 2 years);
Medium-life product (2–10 years);
Long-life product (more than 10 years)
What is the primary reason that the user disposes of the product?No longer functional;
Outdated (either esthetically or functionally);
Degraded visually or functionally;
No longer needed (including single-use products)
Are there any other reasons that users dispose of the product?No secondary reason: It is no longer functional;
Outdated (either esthetically or functionally);
Degraded visually or functionally;
No longer needed (including single-use products)
After the initial use, is the product still usable or can it be returned to usable condition?Yes, the product is still in very good condition;
Yes, the product can return to good condition by being fixed;
No, many/most components are worn out
Many products that use fuel or electricity have a high impact in the use stage. Additionally, products that require chemicals or energy for cleaning will have an impact in the use stage. Are there large impacts in the use stage for this product type?Yes, the product uses many resources in the use stage;
It uses some resources in the use stage;
No, the product has no significant impact in use
Does energy efficiency or functional capability change significantly across generations of products?Yes, the efficiency of the product change fast;
Yes, new products have significantly new capabilities;
Yes, both efficiency and capability increase;
No, the product does not change efficiency or capability across generations
Could there be a market for second-hand/reused or repaired versions of these products?Yes, many of these products could have or have a second life;
Yes, there could be some interest in reused products;
No, there is not interest in used products
Can the product or its parts be used for something else, which replaces other products or components, after its initial life (not for the same product)?Yes, most of the product can be repurposed;
Some parts can be repurposed;
No parts can be repurposed
Does the product typically contain high-impact, rare materials or toxic materials?Yes, highly;
Yes, to some extent;
No, close to none
Does the production of this type of product often include processes that are high-impact?Yes, generally high-impact;
Neither high- nor low-impact;
No, generally low-impact processes
Could the product lifetime be improved if specific components are replaced (by the same or better performing components)?No, the lifetime cannot be improved in this way;
Yes, exchanging specific components can improve product life;
Yes, but it requires taking most of the product apart and changing multiple parts
Is the product typically heavily packaged and transported?Very little transport and packaging;
Highly packaged but only short transport;
Long transport but little packaging;
Both highly packaged and long transport
For some products, recycling is not a viable option for end of life treatment. This can be due to the contamination of the product during use or resources used for collection and recycling of product. Is the recycling of most of the product possible?No, recycling cannot be made beneficial at all;
Yes, but only recycling to a lower grade is possible (cascading);
Yes, recycling can be beneficial
Is there a risk that some products or parts of the product will be cascaded (recycled to a lower grade) or recovered (incinerated or biodegraded)?No, the whole product is recycled;
Yes, some components or whole product might be cascaded;
Yes, some components or whole product might be used for energy recovery;
Yes, both cascading and recovery might happen
Publisher’s Note: MDPI stays neutral with regard to jurisdictional claims in published maps and institutional affiliations.

