Abstract
Crop pests and diseases are key factors that damage crop production and threaten food security. Remote sensing techniques may provide an objective and effective alternative for automatic detection of crop pests and diseases. However, ground-based spectroscopic or imaging sensors may be limited in practically guiding the precision application and reduction of pesticide. Therefore, this study developed an unmanned aerial vehicle (UAV)-based remote sensing system to detect leaf folder (Cnaphalocrocis medinalis). Rice canopy reflectance spectra were obtained in the booting growth stage by using the UAV-based hyperspectral remote sensor. Newly developed and published multivariate spectral indices were initially calculated to estimate leaf-roll rates. The newly developed two-band spectral index (R490−R470), three-band spectral index (R400−R470)/(R400−R490), and published spectral index photochemical reflectance index (R550−R531)/(R550+R531) showed good applicability for estimating leaf-roll rates. The newly developed UAV-based micro hyperspectral system had potential in detecting rice stress induced by leaf folder. The newly developed spectral index (R490−R470) and (R400−R470)/(R400−R490) might be recommended as an indicator for estimating leaf-roll rates in the study area, and (R550−R531)/(R550+R531) might serve as a universal spectral index for monitoring leaf folder.
1. Introduction
Crop pests and diseases, such as insects, plant pathogens, and weeds, are key factors that damage crop production and threaten food security [1]. It is estimated by the Food and Agriculture Organization (FAO) that crop pests and diseases result in approximately 24% of grain losses globally every year and 40 billion kg of grain reduction in China [2]. To prevent crop damage by pests and diseases, a vast amount of pesticide is applied worldwide. Piao, et al. [3] found that the usage of pesticide grew from 6 million to 13 million tons between 1971 and 2007 in China; however, the pest area increased from 100 million to 345 million hectares in the same period. Pesticide abuse poisons the sustainability of agricultural ecosystem and further results in a phenomenon called “silent spring”.
The accurate and timely monitoring of the location, range, and harm degree of crop pests and diseases is essential to reduce expensive pesticide use in crop protection and to render agriculture more eco-friendly and sustainable. In the past 80 years, acceptable precision assessments of crop pests and diseases have often been achieved by using the recognition of visual symptoms [4]. However, the visual assessment methods are too subjective, time-consuming, and labor intensive, relying on the expertise capability of agronomy surveyors. More importantly, the traditional methods suffer from limitations of spatial-temporal scale and geographical coverage. Therefore, new innovative techniques are required to monitor crop pests and diseases over a vast area cheaply and quickly.
Remote sensing techniques may provide an objective and effective alternative for automatic detection of crop pests and diseases [5,6]. Two approaches are often adopted to detect crop pests and diseases by using remote sensing data. One method employs hyperspectral spectroscopy or imaging to analyze the spectral changes of crop pigment, water content, and canopy structure under the stresses of pests or diseases [5,6,7,8,9,10]. The occurrence of pests and diseases needs appropriate habitat conditions; therefore, another method uses multiple remote sensed data to retrieve habitat information, including land surface temperature, soil water content, and crop growth for further predicting the spatial distribution of pests or diseases [2].
However, these methods may be limited in practically guiding the precision application and reduction of pesticide. By employing ground-based spectroscopic or imaging sensors, previous studies mostly acquired indoor- or field-hyperspectral data to theoretically explore the feasibility, sensitive bands, and useful spectral indices for detecting crop pests and diseases [5,6,7,10]. Spatial analysis using space-borne remote sensed images pursued the spatial mapping and warning of pests and diseases [11,12,13,14]. However, cloud cover and satellite re-entry cycles may cause the lack of suitable remote sensing data in timely crop phenophases. A bridge is thereby needed to overcome the challenges and place promising remote sensing technology into a more applicable tool for detecting pests and diseases.
An unmanned aerial vehicle (UAV) may provide a much more flexible and weather independent platform for carrying remote sensors. UAV-based remote sensing has paved the way for affordably, accurately, and practically, and can be used for surveying agricultural and forestry resources [15]. Various studies have applied UVA-based hyper- or multispectral data to determine the plant area, growth status, and production of forests and crops [16,17,18,19,20]. However, UAV-based remote sensors have rarely been applied in monitoring crop pests or diseases. Therefore, it is necessary to develop a crop pests or diseases detection system by using UAV-based multi- or hyper-spectral remote sensing.
Spectral features of plants physiology and chemistry in visible and near-infrared region are non-specific. Pigments dominate the visible region (400–700 nm) [21], while the near-infrared of 700–1100 nm is mainly influenced by leaf water content and structural traits [22]. Therefore, specific spectral wavelengths or regions of interest are often extracted depending on target physiology and chemistry. Spectral vegetation indices, based on the mathematic combination of a few informative wavelengths, are commonly used to analyze plant parameters such as pigment [23], water content [24], and leaf area index [25]. Moreover, several studies have shown that spectral vegetation indices are feasible in the detection of plant diseases or pests [5,6,7,26]. But no common spectral vegetation index is possible for detecting diseases or pests because each pest or disease influences the spectral features in a characteristic way [5]. Therefore, specific indices and algorithms are required to simplify pest or disease detection by using UVA-based sensors.
As a major food crop, rice (Oryza sativa L.) occupies about 30 million hectares of cultivated area in China. However, the production of rice has been seriously affected by pests and diseases. Rice leaf folder (Cnaphalocrocis medinalis), one of the more serious insect pest in rice, causes a vast amount of yield loss in China, especially in the Yangtze River region and southern regions. The study by Huang et al. [6] has demonstrated the feasibility of laboratory and field hyper-spectroscopy in monitoring rice leaf folder at the booting stage. However, it is necessary to develop a UVA-based sensing system to detect the pests’ level of rice leaf folder in order to further guide quantitative pesticide application.
Considering the importance of monitoring rice pests such as rice leaf folder, this study aimed (1) to evaluate the feasibility of a newly developed UAV-based micro hyperspectral probe in monitoring rice pests; (2) to develop new vegetation spectral indices calculated from the UAV-based hyperspectra for monitoring rice leaf folder; (3) to explore the informative wavelengths of rice leaf folder monitoring to aid the channel design of multispectral sensors. Compared with hyperspectral sensors, the multispectral sensor is much lighter and cheaper, with faster data acquisition. The result of this study is expected to help monitor crop pests and diseases by using UAV-based remote sensing approaches.
2. Materials and Methods
2.1. Experimental Site
The experimental sites (Figure 1) were selected in a typical rice-growing area located at Jianli county (29°26′–30°12′ N, 112°35′–113°19′ E), Jianghan Plain, central part of China. The average annual temperature of Jianli county is 16.6 °C with annual precipitation of approximate 1200 mm. According to the Chinese soil classification system, the soil type of the experimental sites is that of paddy soil. Rice plants in the sites were managed based on local management practices, transplanted in early June, and harvested in mid-October.
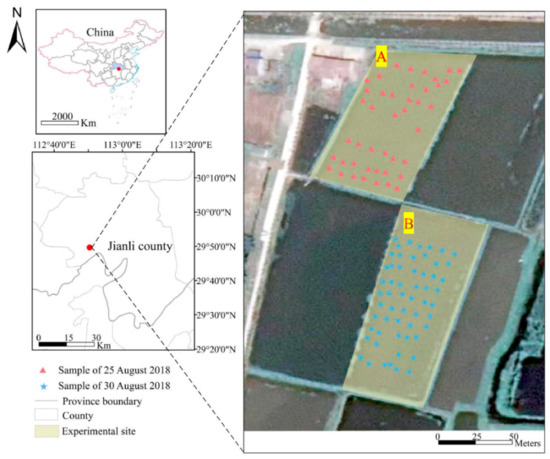
Figure 1.
Location of experimental sites (A,B) and sampling points.
2.2. Unmanned Aerial Vehicle Based Hyperspectral Sensor
A UAV-based hyperspectral remote sensing system (Figure 2a) developed by MCFLY (Beijing MCFLY Technology Co., Ltd., Beijing, China) was used for this research. The UAV platform was based on DJI M210 (Shenzhen DJI Technology Co., Ltd., Shenzhen, China), modified to carry the hyperspectral sensor. DJI M210 consists of an inertial measurement unit, a real-time kinematic GPS unit, a board camera, and a pan-tilt. Its payload is 2.3 kg with a flight endurance of around 27 min. under fitting weather conditions. The hyperspectral sensor (Figure 2b), integrated by MCFLY, is a micro spectroradiometer based on a complementary metal oxide semiconductor. The weight of the sensor is 68 g with a volume of 40 mm × 42 mm × 24 mm. The spectral range is 338–822 nm with a sampling interval of 0.45 nm and a resolution of 1 nm. The field of view angle of the probe is 25°.
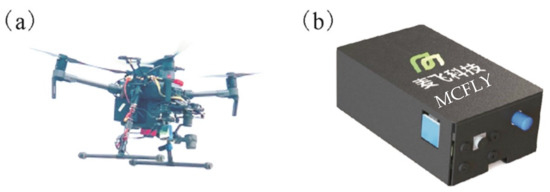
Figure 2.
(a) The vehicle with unmanned aerial vehicle (UAV)-based hyperspectral remote sensing system, (b) the hyperspectal sensor.
2.3. Field Sampling
Field sampling was conducted at the booting stage on 25 August for site A and 30 August for site B in 2018 (Figure 1), because rice is susceptible to rice leaf folder at this stage. Canopy spectra of rice plants were measured by using the UAV-based hyperspectral system at 12:00–14:00 under windless and cloudless weather condition. The geographic locations of canopy spectra were recorded. The flight height of the UAV was 5 m (Figure 3a) and the flight speed was 2 m/s. The UAV flew along the pre-set route, and the hyperspectral sensor recorded spectral samples every two seconds (Figure 3b). Before each flight measurement, the spectroradiometer was standardized by a white BaSO4 calibration panel. Canopy spectra were collected on 25 and 30 August at experimental site A and B, respectively (Figure 3b). After spectral measurement, a total of 95 samples were randomly selected from the experimental sites (Figure 1). The damage severity caused by rice leaf folder (leaf-roll rate) and infestation scale (Table 1) were evaluated and classified by agronomy surveyors according to the national standard of GB/T 15793-2011 [6].
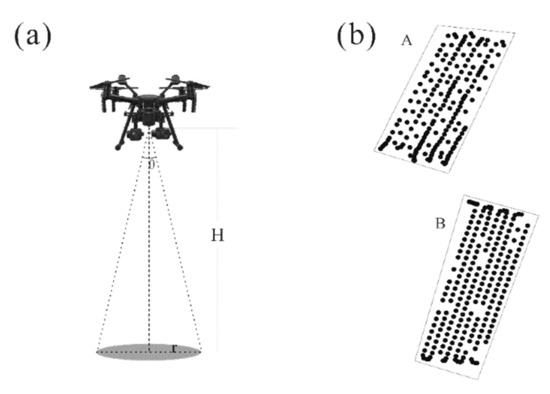
Figure 3.
Geometrics of unmanned aerial vehicle based hyperspectral measurement (a) and locations of canopy spectra in experimental site (b).

Table 1.
Infestation scales of rice leaf folder in booting stage.
2.4. Data Analysis
The reflectance spectral data were reduced to 400–800 nm by eliminating the wavelengths at the edges due to their high noise effects. The reflectance spectra were then smoothed by using the Savitzky-Golay (SG) smoothing method [27] with a 9 nm moving window. Correlation between leaf-roll rate and spectral value at each wavelength from 400 to 800 nm were calculate using the Pearson correlation analysis.
In this research, two-band spectral indices, including (1) ratio spectral index (RSI); (2) difference spectral index (DSI); and (3) normalized difference spectral index (NDSI), were calculated using two random wavebands (Ri and Rj) in the 400–800 nm region; their formulas are shown in Equations (1)–(3). Three-band spectral indices were derived by adding another random waveband (Rk) to the two-band spectral indices as the following formulas: Ri/(RjRk), Ri/(Rj+Rk), (Ri−Rj)/(Ri+Rk), (Ri−Rj)/(Ri−Rk) [28]. Furthermore, various published two- and three-band spectral indices for estimating rice biochemical concentrations or detecting stress were calculated, including photochemical reflectance index (PRI) [29], DVI542-670 (R542−R670) [6], R672/(R550R708) [30], etc.
RSI(Ri, Rj) = Ri/Rj
DSI(Ri, Rj) = Ri − Rj
NDSI(Ri, Rj) = (Ri − Rj)/(Ri + Rj)
A Kennard-Stone algorithm [31] was used to select a spectrally representative dataset for modeling and divide the observation dataset into calibration (n = 63) and validation datasets (n = 32). The calibration dataset was adopted for model development and the validation dataset was used for assessing model performance. The model performance was evaluated using correlation coefficient (r) and the root mean square error (RMSE). The most sensitive model for estimating leaf-roll rate was determined by the maximum r and minimum RMSE values. Finally, the most sensitive models were adopted for predicting the leaf-roll rates from the canopy spectra of experimental sites A and B (Figure 3b). The predicted leaf-roll rate values were then interpolated using the kriging method [32] for mapping rice leaf folder. The formula of kriging is shown in the equation , where is the estimated value at location (xo, yo), which is , and is the weight of the location (xi, yi). The weighted sum of the data of all known locations is used to estimate the value of unknown locations.
3. Results
3.1. Leaf-Roll Rates and Canopy Spectra
The statistics of leaf-roll rates for the calibration and validation datasets, and for the whole dataset, are displayed in Table 2. The leaf-roll rates of the whole dataset range from 0% to 90.67% with mean, median, and standard deviation of 23.11%, 11.46%, and 26.13%, respectively. The calibration and validation datasets have similar characteristic statistics to the whole dataset (Table 2). The results indicated that the Kennard-Stone algorithm was an effective method for selecting representative calibration and validation datasets.
Table 2.
Statistical descriptions of leaf-roll rates (%) for the calibration and validation datasets, and for the whole dataset.
The canopy spectra of rice are displayed in Figure 4. The reflection peak around 550 nm is due to the presence of chlorophyll, and the absorption peak near 480 nm is associated with the strong absorption of pigments. The canopy spectral curve moves up sharply around 730 nm, which is known as the red-edge position. The red-edge position presents a “blue shift” as the leaf-roll rate increases, and Zhu et al. [33] indicated that red-edge position shifted to blue regions with the decreasing of canopy chlorophyll contents under stresses. Moreover, with the increasing of leaf-roll rates, the reflectance decreased in the near-infrared spectral region (760–800).
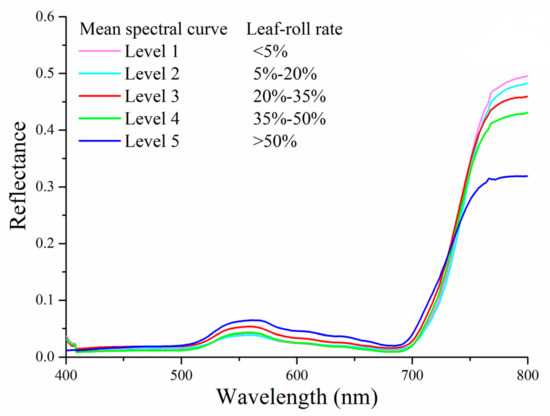
Figure 4.
Mean canopy spectral curves of five infestation scales.
3.2. Regression Models Using Two- and Three-Band Spectral Indices
The contour maps of r values between the leaf-roll rates and two-band spectral indices (RSI, DSI and NDSI) are displayed in Figure 5, and they show the significant peak-wavelengths and useful spectral regions for estimating leaf-roll rates. For RSI (Figure 5a), the significant spectral areas (r > 0.6, p < 0.01) were mainly around the spectral bands of 410, 470, 490, 570, 625, 665, and 720 nm. The contour maps of DSI (Figure 5b) and NDSI (Figure 5c) exhibit a similar distribution patterns as that of RSI. RSI (R696, R664), DSI (R490, R470), and NDSI (R696, R664) performed best in RSI, DSI, and NDSI strategies, with r value of 0.70, 0.74, and 0.71, respectively. By using these spectral indices, regression models were established to estimate leaf-roll rates in the validation dataset (Table 3). DSI (R490, R470) resulted in the best regression model for estimating leaf-roll rates, with an r values of 0.81 at a significant of 0.01, and RMSE of 14.21% (Table 3, Figure 6a).
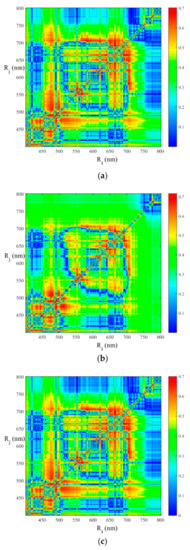
Figure 5.
Contour maps of correlation coefficients (r) between leaf-roll rates and ratio (a), difference (b), and normalized difference (c) spectral indices using two reflectance spectra at i and j nm (n = 63).
Table 3.
Calibration and validation results of regression models for modeling and estimating leaf-roll rates by using optimal two- and three-band spectral indices.
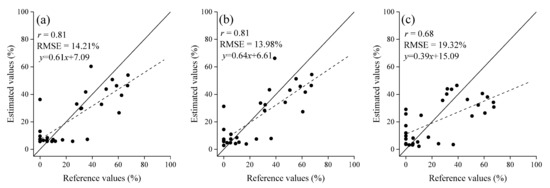
Figure 6.
Scatter plots of reference and estimated leaf-roll rates of the validation dataset based on (a) two-band spectral index (R490−R470), (b) three-band spectral index (R400−R470)/(R400−R490), and (c) published spectral index (R550−R531)/(R550+R531) (n = 32).
For the three-band spectral index of Ri/(RjRk), Ri/(Rj+Rk), (Ri−Rj)/(Ri+Rk), and (Ri−Rj)/(Ri−Rk) strategies, R550/(R405R470), R445/(R405+R470), (R705−R645)/(R705+R725), and (R400−R470)/(R400−R490) performed best in each strategy for estimating leaf-roll rates, with r values of 0.62, 0.69, 0.68, and 0.75 (p < 0.001), respectively (Table 3). Moreover, the spectral index of (R400−R470)/(R400−R490) obtained the best estimation accuracy in the newly developed three-band spectral indices with an r value of 0.81 at a significant of 0.01, and RMSE of 13.98% (Table 3, Figure 6b).
3.3. Regression Models Using Published Spectral Indices
The validated statistics (r and RMSE) for estimating leaf-roll rates by using published spectral indices are shown in Table 4. In these spectral indices, (R550−R531)/(R550+R531)) performed best in estimating leaf-roll rates of the validation dataset with r = 0.68 and RMSE = 19.32% (Figure 6c). The regression model is y = 101.63x2 + 369.98x + 338.57. The published spectral indices, such as PRI ((R531−R570)/(R531+R570)) (r = 0.58, RMSE = 21.55%), DVI542-670 (R542−R670) (r = 0.56, RMSE = 22.02%), R672/(R550R708) (r = 0.59, RMSE = 21.49%), and (R780−R710)/(R780+R680) (r = 0.61, RMSE = 21.03%) resulted in significant correlations (p < 0.001) between estimated and reference values of leaf-roll rates in this study.
Table 4.
Various published spectral indices for estimating leaf-roll rates of validation dataset (n = 32).
3.4. Maps of Leaf-Roll Rates
The regression models of (R490−R470), (R400−R470)/(R400−R490), and (R550−R531)/(R550+R531) were employed to predict leaf-roll rate values from canopy spectra. Consequently, regional maps of leaf-roll rates were produced using the predictive values and the kriging method (Figure 7). The map demonstrates the spatial variability of leaf-roll rates in fields, and maps derived from the regression models of (R490−R470) (Figure 7a) and (R400−R470)/(R400−R490) (Figure 7b) show similar spatial distributions. The bias of the regression models overestimated the low values of leaf-roll rates and underestimated the high values (Figure 6) and finally resulted in the shrinkage of measurements. Even so, the spatial information on leaf-roll rates can be used as a basis for site-specific management practices in precision pesticide application and for further decreasing the consumption of chemical pesticides, to some extent.
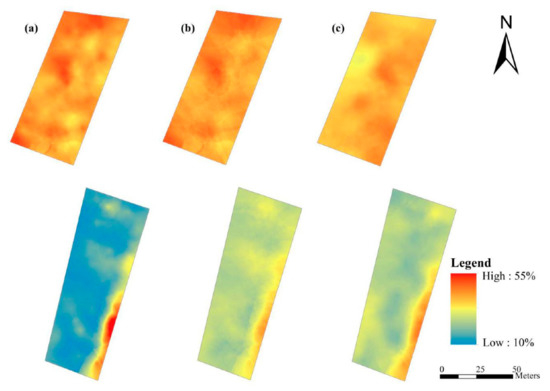
Figure 7.
Maps of leaf-roll rates using the kriging method and predicted values derived from regression models of (a) (R490−R470), (b) (R400−R470)/(R400−R490), and (c) (R550−R531)/(R550+R531).
4. Discussion
Previous studies demonstrated that hyperspectral proximal or remote sensing techniques were able to nondestructively detect the pests or diseases of various crop species such as rice [6], wheat [41,42], sugarcane [43,44], sugar beet [45], potato [46], and cotton [47]. Three scales of proximal- or remote- sensed observations were used for pest and disease detection: (i) the leaf scale, mainly performed in the field or laboratory to test the methodology; (ii) the canopy scale, usually performed in situ and took into account the canopy structural characteristics of the plants; and (iii) the farm scale for precision management applications, which encompassed an entire farm by acquiring airborne data; for example, Zhang et al. [48] detected late blight disease in tomatoes by using airborne visible infrared imaging spectrometer (AVIRIS) image and Hillnhütter et al. [49] adopted hyperspectral mapper (Hymap) data to detect plant stress caused by heterodera schachtii and rhizoctonia solani in sugar beet. However, the expensive costs of AVIRIS and Hymap usually limit their application. Therefore, this research employed a small and inexpensive UAV-based hyperspectral sensor for crop pest and disease monitoring at the farm scale. The results indicated that it was feasible to detect rice stress induced by rice leaf folder (Cnaphalocrocis medinalis), and that the maps of leaf-roll rates could guide precision usage of pesticide.
Generally speaking, pushbroom and snapshot are two of the most frequently used imaging methods for UAV based hyperspectral imagers [50]. The accuracies of pushbroom scanned hypersepctral data depend on the attitude stability of the UAV platform. For instance, UAV based pushbroom instruments, such as Headwall Nano-Hyperspec, always require the stability of the UAV platform to keep its movements uniform in a straight line in order to record the accurate attitude and position information of the UAV for image processing. Due to its shorter data acquisition time, snapshot imaging owns a more rigid image geometry. However, snapshot imager usually acquires lower spatial and spectral accuracies than that of pushbroom scanning because of the tradeoff between the spectral channels and spatial pixels. In this study, a UAV based hyperspectral probe sensor was developed. Compared to UAV based pushbroom and snapshot imagers, this system is cheaper and lighter, more flexible in controlling the stable attitude of the UAV platform, and requires no geometric correction in processing hyperspectral data. The target parameter retrieved from hyperspectral data could further produce spatial maps using the kriging method. This technical procedure may satisfy some similar application scenarios in agriculture.
The results of the study indicated that rice canopy spectra at the booting stage was related to leaf-roll rates and, in general, spectral bands near 410, 470, 490, 570, 625, 665, and 720 nm were sensitive regions for detecting leaf folder. Meanwhile, the spectral band in the range of 747–754 nm was identified as a sensitive region by Huang et al. [6] for leaf folder detection by using rice canopy spectra. The difference might be caused by the different experimental environment. The study by Huang et al. [6] was conducted under a controlled experimental field using an ASD FieldSpec Hand Held Spectroradiometer (Analytical Spectral Devices, Inc., Boulder, CO, USA) with a much higher signal-to-noise ratio. In addition, Yang et al. [51] found that rice spectra at the tillering and heading stages had negative correlation with leaf-roll rates, and the most negative correlation coefficient value was located at 757 nm in the active tillering stage but shifted to 445 nm in the heading stage. The results indicated that the sensitive spectral regions varied in the tillering, booting, and heading stages for detecting leaf-roll rates.
Previous studies indicated that the spectral bands near 410, 470, 490, 570, 625, 665, and 720 nm might be significantly correlated with leaf area index and chlorophyll density. For example, Wu et al. [52] found that the spectral region of 400–700 nm was highly correlated with canopy chlorophyll density due to the strong absorption of chlorophyll a and b. Moreover, Liu et al. [53] demonstrated that the leaf area index of rice had significant correlation with canopy reflectance near 400, 500, 630, 680, and 720 nm. Therefore, the leaf-roll rates may indirectly relate these sensitive bands through the leaf area index and chlorophyll density of the rice canopy due to the decrease of the leaf area index and chlorophyll density caused by leaf folder. Moreover, the sensitive bands might aid the channel design of multispectral sensors.
Canopy hyperspectral reflectance can provide information on the growth status of rice plants. However, various factors, such as soil background and canopy structure, can affect the performance of canopy spectra in estimating the biochemical properties of plants [54]. Spectral indices were usually adopted to overcome these restrictions. Therefore, in the present study, multiple two- and three-band spectral indices were employed to estimate leaf-roll rates. Gitelson [55] demonstrated that two-band spectral indices, such as NDSI, approached saturation asymptotically with the above-ground biomass, increasing moderate to high, which reduced its sensitivity to the high biochemical contents of plants; a three-band spectral index was proposed to overcome the saturation problems and improve the estimation of biochemical properties. However, this study found that two- and three-band spectral indices resulted in similar accuracy for estimating leaf-roll rates. Such result might be due to the biomass decreasing caused by leaf folders, which weaken the saturation phenomenon of two-band spectral indices. Moreover, in the present study, (R550−R531)/(R550+R531) obtained acceptable estimation accuracy for leaf-roll rates; this result was consisted with the study by Huang et al. [6] who found that PRI was significantly correlated with the leaf-roll rates. These results suggested that rice leaf folders would change the photosynthetic efficiency of rice plants [6].
This study, combined with other research [6,51], demonstrated that rice canopy hyperspectral reflectance was feasible for the detection of rice leaf folder damage. However, some limitations should be taken into consideration, such as the crop species, growing stage, pest or disease species, and so on, when this technique is applied to other areas. Moreover, some factors, such as lack of water or fertilizer, may cause similar change in the spectral indices, which should also be considered. In further studies, it would be meaningful to examine the usefulness of UVA-based hyperspectral data to detect other pest or diseases species. Moreover, it is a challenge to detect pests or diseases before the crop plants are seriously damaged. Therefore, UVA-based hyperspectral or multiple-spectral imaging sensors with a higher signal-to-noise ratio and machine vision technologies could be further applied in detecting crop pests or diseases.
5. Conclusions
This study employed UAV-based hyperspectral data to detect rice stress induced by leaf folder during their booting stage. The principal results and conclusions obtained can be summarized as follows:
- (1)
- The newly developed UAV-based micro hyperspectral system had potential in detecting rice stress induced by leaf folder.
- (2)
- The newly developed two-band spectral index (R490−R470) and three-band spectral index (R400−R470)/(R400−R490) showed good applicability for estimating leaf-roll rates.
- (3)
- The published vegetation indices (R550−R531)/(R550+R531) performed well in estimating leaf-roll rates. This result indicated that this index might serve as a universal spectral index for monitoring leaf folder.
- (4)
- Spectral bands near 410, 470, 490, 570, 625, 665, and 720 nm were sensitive regions for detecting leaf folder. The spectral regions might provide reference for the channel design of UAV-based multispectral sensors.
Author Contributions
Conceptualization, T.L. and T.S.; methodology, C.W.; software, C.W.; validation, T.L., T.S., and C.W.; formal analysis, T.L.; investigation, T.L.; resources, T.S. and C.W.; data curation, C.W.; writing—original draft preparation, T.L.; writing—review and editing, T.L. and H.Z.; visualization, C.W.; supervision, T.S.; funding acquisition, T.L., T.S., and C.W. All authors have read and agreed to the published version of the manuscript.
Funding
This research was funded by National Natural Science Foundation of China (Nos. 41801376, 4170010438, 41901248, and 41901326), China Postdoctoral Science Foundation (No. 2020M682293), the National Special Research Fund for Non-Profit Sector (Agriculture) (No. 201303099); the Basic Research Program of Shenzhen Science and Technology Innovation Committee (No. JCYJ20170302144323219), and the Natural Science Foundation of Jiangsu Province (BK20190742), the Natural Science Research of Jiangsu Higher Education Institutions of China (19KJB170009), and Key Research Projects of Henan Higher Education Institutions (19A420004).
Conflicts of Interest
The authors declare no conflict of interest.
References
- Strange, R.N.; Scott, P.R. Plant disease: A threat to global food security. Annu. Rev. Phytopathol. 2005, 43, 83–116. [Google Scholar] [CrossRef] [PubMed]
- Huang, W.J.; Zhang, J.C.; Shi, Y.; Dong, Y.Y.; Liu, L.Y. Progress in monitoring and forecasting of crop pests and diseases by remote sensing. J. Nanjing Univ. Inf. Sci. Technol. (Nat. Sci. Ed.) 2018, 10, 30–43. [Google Scholar]
- Piao, S.L.; Ciais, P.; Huang, Y.; Shen, Z.H.; Peng, S.S.; Li, J.S.; Zhou, L.P.; Liu, H.Y.; Ma, Y.C.; Ding, Y.H.; et al. The impacts of climate change on water resources and agriculture in China. Nature 2010, 467, 43–51. [Google Scholar] [CrossRef] [PubMed]
- Martinelli, F.; Scalenghe, R.; Davino, S.; Panno, S.; Scuderi, G.; Ruisi, P.; Villa, P.; Stroppiana, D.; Boschetti, M.; Goulart, L.R.; et al. Advanced methods of plant disease detection. A review. Agron. Sustain. Dev. 2015, 35, 1–25. [Google Scholar] [CrossRef]
- Mahlein, A.K.; Rumpf, T.; Welke, P.; Dehne, H.-W.; Plumer, L.; Steiner, U.; Oerke, E.-C. Development of spectral indices for detecting and identifying plant diseases. Remote Sens. Environ. 2013, 128, 21–30. [Google Scholar] [CrossRef]
- Huang, J.R.; Liao, H.J.; Zhu, Y.B.; Sun, J.Y.; Sun, Q.H.; Liu, X.D. Hyperspectral detection of rice damaged by rice leaf folder (Cnaphalocrocis medinalis). Comput. Electron. Agric. 2012, 82, 100–107. [Google Scholar] [CrossRef]
- Calderon, R.; Navas-Cortes, J.A.; Lucena, C.; Zarco-Tejada, P.J. High-resolution airborne hyperspectral and thermal imagery for early detection of Verticillium wilt of olive using fluorescence, temperature and narrow-band spectral indices. Remote Sens. Environ. 2013, 139, 231–245. [Google Scholar] [CrossRef]
- Ghyar, B.S.; Birajdar, G.K. Computer vision based approach to detect rice leaf diseases using texture and color descriptors. In Proceedings of the International Conference on Inventive Computing and Informatics (ICICI 2017), Coimbatore, India, 23–24 November 2017. [Google Scholar]
- Hossain, M.S.; Mou, R.M.; Hasan, M.M.; Chakraborty, S.; Razzak, M.A. Recognition and detection of tea leaf’s diseases using support vector machine. In Proceedings of the 2018 IEEE 14th International Colloquium on Signal Processing & Its Applications (CSPA 2018), Penang, Malaysia, 9–10 March 2018. [Google Scholar]
- Huang, W.J.; Guan, Q.S.; Luo, J.H.; Zhang, J.C.; Zhao, J.L.; Liang, D.; Huang, L.S.; Zhang, D.Y. New optimized spectral indices for identifying and monitoring winter wheat diseases. IEEE J. Sel. Top. Appl. Earth Obs. Remote Sens. 2014, 7, 2516–2524. [Google Scholar] [CrossRef]
- Zhang, J.C.; Huang, Y.B.; Yuan, L.; Yang, G.J.; Chen, L.P.; Zhao, C.J. Using satellite multispectral imagery for damage mapping of armyworm (Spodoptera frugiperda) in maize at a regional scale. Pest. Manag. Sci. 2015, 72, 335–348. [Google Scholar] [CrossRef]
- Apan, A.; Held, A.; Phinn, S.; Markley, J. Detecting sugarcane ‘orange rust’ disease using EO-1 hyperion hyperspectral imagery. Int. J. Remote Sens. 2004, 25, 489–498. [Google Scholar] [CrossRef]
- Lenthe, J.-H.; Oerke, E.-C.; Dehne, H.-W. Digital infrared thermography for monitoring canopy health of wheat. Precis. Agric. 2007, 8, 15–26. [Google Scholar] [CrossRef]
- Leucker, M.; Mahlein, A.K.; Steiner, U.; Oerke, E.-C. Improvement of lesion phenotyping in Cercospora beticola-sugar beet interaction by hyperspectral imaging. Phytopathology 2016, 106, 177–184. [Google Scholar] [CrossRef] [PubMed]
- Grenzdorffer, G.J.; Engel, A.; Teichert, B. The photogrammetric potential of low-cost UAVs in forestry and agriculture. In The International Archives of the Photogrammetry, Remote Sensing and Spatial Information Sciences; ISPRS Archives: Beijing, China, 2008. [Google Scholar]
- Feng, Q.; Liu, J.; Gong, J. UAV remote sensing for urban vegetation mapping using random forest and texture analysis. Remote Sens. 2015, 7, 1074–1094. [Google Scholar] [CrossRef]
- Zarco-Tejada, P.J.; Berni, J.A.J.; Suarez, L.; Fereres, E. A new era in remote sensing of crops with unmanned robots. SPIE Newroom 2008, 2–4. [Google Scholar] [CrossRef]
- Zarco-Tejada, P.J.; Gonzalez-Dugo, V.; Berni, J.A. Fluorescence, temperature and narrow-band indices acquired from a UAV for water stress detection using a hyperspectral imager and a thermal camera. Remote Sens. Environ. 2012, 117, 322–337. [Google Scholar] [CrossRef]
- Gomez-Candon, D.; De Castro, A.I.; Lopez-Granados, F. Assessing the accuracy of mosaics from unmanned aerial vehicle (UAV) imagery for precision agriculture purposes in wheat. Precis. Agric. 2014, 15, 44–56. [Google Scholar] [CrossRef]
- Zhou, X.; Zheng, H.B.; Xu, X.Q.; He, J.Y.; Ge, X.K.; Yao, X.; Cheng, T.; Zhu, Y.; Gao, W.X.; Tian, Y.C. Predicting grain yield in rice using multi-temporal vegetation indices from UAV-based multispectral and digital imagery. ISPRS J. Photogramm. Remote Sens. 2017, 130, 246–255. [Google Scholar] [CrossRef]
- Gitelson, A.A.; Kaufman, Y.J.; Stark, R.; Rundquist, D. Novel algorithms for remote estimation of vegetation fraction. Remote Sens. Environ. 2012, 80, 76–87. [Google Scholar] [CrossRef]
- Jacquemoud, S.; Baret, F. Prospect: A model of leaf optical properties spectra. Remote Sens. Environ. 1990, 34, 75–91. [Google Scholar] [CrossRef]
- Blackburn, G.A. Spectral indices for estimating photosynthetic pigment concentrations: A test using senescent tree leaves. Int. J. Remote Sens. 1998, 19, 657–675. [Google Scholar] [CrossRef]
- Penuelas, J.; Filella, I.; Biel, C.; Serrano, L.; Save, R. The reflectance at the 950–970 nm region as an indicator of plant water status. Int. J. Remote Sens. 1993, 14, 1887–1905. [Google Scholar] [CrossRef]
- Broge, N.H.; Leblanc, E. Comparing prediction power and stability of broadband and hyperspectral vegetation indices for estimation of green leaf area index and canopy chlorophyll density. Remote Sens. Environ. 2001, 76, 156–172. [Google Scholar] [CrossRef]
- Hatfield, J.L.; Gitelson, A.A.; Schepers, J.S.; Walthall, C.L. Application of spectral remote sensing for agronomic decisions. Agron. J. 2008, 100, 117–131. [Google Scholar] [CrossRef]
- Savitzky, A.; Golay, M.J.E. Smoothing and differentiation data by simplified least square procedure. Anal. Chem. 1964, 36, 1627–1638. [Google Scholar] [CrossRef]
- Inoue, Y.; Penuelas, J.; Miyata, A.; Mano, M. Normalized difference spectral indices for estimating photosynthetic efficiency and capacity at a canopy scale derived from hyperspectral and CO2 flux measurements in rice. Remote Sens. Environ. 2008, 112, 156–172. [Google Scholar] [CrossRef]
- Peñuelas, J.; Filella, I.; Gamon, J.A. Assessment of photosynthetic radiation-use efficiency with spectral reflectance. New Phytol. 1995, 131, 291–296. [Google Scholar]
- Datt, B. Remote sensing of chlorophyll a, chlorophyll b, chlorophyll a + b, and total carotenoid content in Eucalyptus leaves. Remote Sens. Environ. 1998, 66, 111–121. [Google Scholar] [CrossRef]
- Kennard, R.W.; Stone, L.A. Computer aided design of experiments. Technometrics 1969, 11, 137–148. [Google Scholar] [CrossRef]
- Oliver, M.A.; Webster, R. Kriging: A method of interpolation for geographical information systems. Int. J. Geogr. Inf. Syst. 1990, 4, 313–332. [Google Scholar] [CrossRef]
- Zhu, Z.Y.; Liu, S.M.; Wu, Y.; Li, Y.; Zhang, J.; Hu, J. Phytoplankton Dynamics and Its Further Implication for Particulate Organic Carbon in Surface Waters of a Tropical/Subtropical Estuary. Estuaries Coasts 2015, 38, 905–916. [Google Scholar] [CrossRef]
- Hansen, P.M.; Schjoerring, J.K. Reflectance measurement of canopy biomassand nitrogen status in wheat crops using normalized difference vegetation indices and partial least squares regression. Remote Sens. Environ. 2003, 86, 542–553. [Google Scholar] [CrossRef]
- Gamon, J.A.; Penuelas, J.; Field, C.B. A narrow-waveband spectral index that tracks diurnal changes in photosynthetic efficiency. Remote Sens. Environ. 1992, 41, 35–44. [Google Scholar] [CrossRef]
- Buschman, C.; Nagel, E. In vivo spectroscopy and internal optics of leaves as a basis for remote sensing of vegetation. Int. J. Remote Sens. 1993, 14, 711–722. [Google Scholar] [CrossRef]
- Sims, D.A.; Gamon, J.A. Relationships between leaf pigment content and spectral reflectance across a wide range of species, leaf structures and developmental stages. Remote Sens. Environ. 2002, 81, 331–354. [Google Scholar] [CrossRef]
- Datt, B. Visible/near infrared reflectance and chlorophyll content in Eucalyptus leaves. Int. J. Remote Sens. 1999, 20, 2741–2759. [Google Scholar] [CrossRef]
- Chappelle, E.W.; Kim, M.S.; McMurtrey, J.E. Ratio analysis of reflectance spectra (PARS): An algorithm for the remote estimation of the concentrations of chlorophyll a, chlorophyll b, and carotenoids in soybean leaves. Remote Sens. Environ. 1992, 39, 239–247. [Google Scholar] [CrossRef]
- Maccioni, A.; Agati, G.; Mazzinghi, P. New vegetation indices for remote measurement of chlorophylls based on leaf directional reflectance spectra Photochem. J. Photobiol. B 2001, 61, 52–61. [Google Scholar] [CrossRef]
- Stilwell, A.R.; Hein, G.L.; Zygielbaum, A.I.; Rundquist, D.C. Proximal sensing to detect symptoms associated with wheat curl mitevectored viruses. Int. J. Remote Sens. 2013, 34, 4951–4966. [Google Scholar] [CrossRef]
- Yuan, L.; Huang, Y.; Loraamm, R.W.; Nie, C.; Wang, J.; Zhang, J. Spectral analysis of winter wheat leaves for detection and differentiation of diseases and insects. Field Crop Res. 2014, 156, 199–207. [Google Scholar] [CrossRef]
- Purcell, D.E.; O’Shea, M.G.; Johnson, R.A.; Kokot, S. Near-infrared spectroscopy for the prediction of disease ratings for Fiji leaf gall in sugarcane clones. Appl. Spectrosc. 2009, 63, 450–457. [Google Scholar] [CrossRef]
- Grisham, M.P.; Johnson, R.M.; Zimba, P.V. Detecting sugarcane yellow leaf virus infection in asymptomatic leaves with hyperspectral remote sensing and associated leaf pigment changes. J. Virol. Method 2010, 167, 140–145. [Google Scholar] [CrossRef] [PubMed]
- Rumpf, T.; Mahlein, A.K.; Steiner, U.; Oerke, E.C.; Dehne, H.W.; Plümer, L. Early detection and classification of plant diseases with support vector machines based on hyperspectral reflectance. Comput. Electron. Agric. 2010, 74, 91–99. [Google Scholar] [CrossRef]
- Johnson, D.A.; Alldredge, J.R.; Hamm, P.B.; Frazier, B.E. Aerial photography used for spatial pattern analysis of late blight infection in irrigated potato circles. Phytopathology 2003, 93, 805–812. [Google Scholar] [CrossRef] [PubMed][Green Version]
- Prabhakar, M.; Prasad, Y.G.; Thirupathi, M.; Sreedevi, G.; Dharajothi, B.; Venkateswarlu, B. Use of ground based hyperspectral remote sensing for detection of stress in cotton caused by leafhopper (Hemiptera: Cicadellidae). Comput. Electron. Agric. 2011, 79, 189–198. [Google Scholar] [CrossRef]
- Zhang, M.; Qin, Z.; Liu, X.; Ustin, S.L. Detection of stress in tomatoesinduced by late blight disease in California, USA, using hyperspectral remote sensing. Int. J. Appl. Earth Obs. Geoinf. 2003, 4, 295–310. [Google Scholar] [CrossRef]
- Hillnhütter, C.; Mahlein, A.K.; Sikora, R.A.; Oerke, E.C. Remote sensingto detect plant stress induced by Heterodera schachtii and Rhizoctonia solani in sugar beet fields. Field Crop Res. 2011, 122, 70–77. [Google Scholar] [CrossRef]
- Zhong, Y.; Wang, X.; Xu, Y.; Wang, S.; Jia, T.; Hu, X. Mini-uav-borne hyperspectral remote sensing: From observation and processing to applications. IEEE Geosci. Remote Sens. Mag. 2018, 6, 46–62. [Google Scholar] [CrossRef]
- Yang, C.M.; Cheng, C.H.; Chen, R.K. Changes in spectral characteristics of rice canopy infested with brown planthopper and leaffolder. Crop Sci. 2007, 47, 329–335. [Google Scholar] [CrossRef]
- Wu, C.S.; Tong, Q.X.; Zheng, L.F.; Liu, W.D. Correlation analysis between spectral data and chlorophyll of rice and maize. J. Basic Sci. Eng. 2000, 8, 31–36. (In Chinese) [Google Scholar]
- Liu, W.D.; Xiang, Y.Q.; Zheng, L.F.; Tong, Q.X.; Wu, C.S. Relationships between rice LAI, CH.D and hyperspectra data. J. Remote Sens. 2000, 4, 279–283. (In Chinese) [Google Scholar]
- Darvishzadeh, R.A.K.; Skidmore, A.; Atzberger, C.; Van Wieren, S.E. Estimation of vegetation LAI from hyperspectral reflectance data: Effects of soil type and plant architecture. Int. J. Appl. Earth Obs. Geoinf. 2008, 10, 358–373. [Google Scholar] [CrossRef]
- Gitelson, A.A. Wide dynamic range vegetation index for remote quantification of biophysical characteristics of vegetation. J. Plant Physiol. 2004, 161, 165–173. [Google Scholar] [CrossRef] [PubMed]
Publisher’s Note: MDPI stays neutral with regard to jurisdictional claims in published maps and institutional affiliations. |
© 2020 by the authors. Licensee MDPI, Basel, Switzerland. This article is an open access article distributed under the terms and conditions of the Creative Commons Attribution (CC BY) license (http://creativecommons.org/licenses/by/4.0/).