Article

Effects of Different Ages of Robinia pseudoacacia Plantations on Soil Physiochemical Properties and Microbial Communities

1
State Key Laboratory of Soil Erosion and Dryland Farming on the Loess Plateau, Institute of Soil and Water Conservation, Chinese Academy of Sciences and Ministry of Water Resources, Yangling 712100, China
2
College of Advanced Agricultural Sciences, University of Chinese Academy of Sciences, Beijing 100049, China
3
School of Ecology and Environment, Anhui Normal University, Wuhu 241002, China
*
Authors to whom correspondence should be addressed.
C.L. and B.Z. contributed equally to this work.
Sustainability 2020, 12(21), 9161; https://doi.org/10.3390/su12219161
Submission received: 24 September 2020 / Revised: 31 October 2020 / Accepted: 1 November 2020 / Published: 4 November 2020

Abstract

:
Robinia pseudoacacia is widely planted on the Loess Plateau as a strong drought-tolerant and salt-tolerant species for vegetation restoration. However, this mode of pure plantation has triggered great concern over the soil ecosystem. The aim of this study was to explore the effects of the plantation on soil physiochemical properties, soil microorganisms, and the relationship between them in Robinia pseudoacacia plantations of different ages. Four different ages of Robinia pseudoacacia stands, including 10-year-old, 15-year-old, 25-year-old, and 40-year-old (abbreviated as Y10, Y15, Y25, and Y40, respectively) were selected, and 20 soil physicochemical and biological indicators were determined. The variation in soil microbial biomass was influenced by sampling depth, and consistent with the variations in TN (soil total nitrogen) and SOC (soil organic carbon) during 25 years’ artificial forestation. Soil moisture increased significantly at Y15 and then decreased at Y40 but other soil properties remained relatively stable. The contents of phosphor lipid fatty acid (PLFA) of different microbial groups followed the order of B (Bacteria) > G (Gram-negative) > G+ (Gram-positive) > A (Actinomycetes) > F (Fungi). The ratios of F/B (Fungi to Bacteria) and Sat/Mono (Saturated PLFAs to Monosaturated PLFAs) of different ages of plantations showed a similar trend, i.e., declined first, then rose, and declined again. The ratios of Cy/Pre (Cyclopropyl PLFAs to Precursor PLFAs) and G+/G (Gram-positive to Gram-negative) of the soil of all ages of plantations showed a trend of slow growth and a trend of rapid growth, respectively. Redundancy analysis showed that the contents of individual PLFAs and total PLFA were positively correlated with SOC and TN, but variations of soil PLFA ratios mostly depended on other soil properties. After artificial forestation, the ratios of F/B and Sat/Mono were lower than before forestation, while the ratio of Cy/Pre varied with different soil layers. The ratio of G+/G increased with the increase in afforestation time, peaking at the 25th year. The contents of individual PLFAs and total PLFA may be sensitive indicators of SOC and TN within 25 years’ plantation. Lower ratio of F/B and higher G+/G suggest that the sustainability of the ecosystem is weaker and the fertility of the soil is lower after plantation of Robinia pseudoacacia.

1. Introduction

Robinia pseudoacacia has a good growth performance under a wide variety of soil conditions, and it has strong drought tolerance and salt tolerance [1]. Thus, R. pseudoacacia has been considered a promising tree species for restoring vegetation, especially in arid and semi-arid area [2]. In the 1950s, R. pseudoacacia was first planted for ecological restoration on the Chinese Loess Plateau [3]. During the last few decades, R. pseudoacacia has been widely planted in this region. R. pseudoacacia plantations have also been extensively constructed in Yan’an, where they have significantly improved the ecosystem health and functions, and alleviated soil deterioration, while the primary function of R. pseudoacacia plantations is reducing soil erosion in this region. In recent years, numerous studies have been carried out to investigate the effects of R. pseudoacacia plantations on the vegetation structure, soil properties and microbial biomass and activity [4,5,6]. It has been reported that R. pseudoacacia plantations significantly increased the availability of soil nutrients and reduced soil bacteria richness, and the diversity and richness of understory vegetation community decreased with restoration stage [7]. However, it remains unclear how soil microbial communities respond to changes in vegetation structure and soil environments after R. pseudoacacia afforestation along a chronosequence.
Reforestation affects soil microbial community (SMC) structure [8], and microorganisms drive biogeochemical cycles and regulate the function of ecosystems [9,10]. Unlike agricultural systems, forests have to depend on microbial-mediated processes rather than external available nutrient inputs to sustain the primary productivity [11]. Soil microbes are the most active components of the soil ecosystem, they provide vital ecosystem services (e.g., food provision), actively participate in transformation of soil organic matter, affect soil quality and alter ecosystem productivity [12]. The influencing factors of soil microorganisms are complex and changeable, but the composition of soil microbial community is mainly influenced by plants and soil properties [13]. Vegetation constitutes a key impact factor, mainly because of the differences in the environment brought about by plants for soil microbes. Plants provide root exudates and litters that can be nutrient substrate for soil microbes [14,15]. Afforestation can impact both fungal and bacterial community in soil, either directly or indirectly [16]. Artificial plantation exerted greater influence on soil fungal community than natural restoration [17]. Generally speaking, fungi are K-strategists (oligotrophic categories), while bacteria are r-strategists (copiotrophic categories) [18,19,20]. Meanwhile, soil microbial communities in forests respond to changes in environments (e.g., it causes synergistic or antagonistic effects on plants), but the types of microorganisms and their specific responses differ among forest ecosystems of different stand ages [16,21]. The effects of plant-soil interactions can shift the nutrient cycling and energy flow of forest soils of different stand ages. With the increase of forest age, litter and root exudates will impact the physicochemical properties of the soil, in which the microorganisms are located, thus affecting the SMC [22,23]. Hence, soil microorganisms are regarded as sensitive indicators of soil ecosystem assessments [24].
In this research, soil samples were collected from areas with a chronosequence of 10, 15, 25 and 40 years’ Robinia pseudoacacia stands. It was hypothesized that the changes in chronosequence would affect soil properties and SMC, including soil microbial biomass and community. Therefore, we aimed to (i) illustrate the evolution of SMC along the chronosequence, and (ii) study the relationships among SMC, soil properties, and soil microorganisms.

2. Materials and Methods

2.1. Research Area and Soil Sampling

The experiment was conducted in Yan’an City, which has a continental monsoon climate with an annual temperature of 7.7–10.6 °C, an average annual rainfall of 550 mm, and 170 annual frost-free days. There is serious soil and water losses in this area. The stands selected for this study have an average elevation of 1327 m above sea level (Table 1). The soil of the selected stands is a typical loess soil, which contains 63–73% silt and 17–20% clay. R. pseudoacacia, Pinus tabuliformis Carrière, and Platycladus orientalis (L.) Franco plantations are widespread in this area, and have contributed to a notable increase in the vegetation coverage since the “Grain for Green” project which was launched in March 2000. R. pseudoacacia is the predominant species for alleviating the soil deterioration in this region.
Sampling sites were set in the 10-year-old, 15-year-old, 25-year-old, and 40-year-old R. pseudoacacia plantations (Y10, Y15, Y25, and Y40), and the farmland (FL) was treated as the control in the study. Maize (Zea mays) was grown in the farmland, and organic manure (cattle slurry) was applied at 120 t/hm2 according to the local farming regime. Details of the sites are presented in Table 1. At each site, four 50 m × 50 m sampling plots were established in June 2016. Six 1 m × 1 m (grass community) and 5 m × 5 m (shrub community) quadrats were randomly set up in each plot to measure the vegetation characteristics. Vegetation coverage, aboveground biomass, and maximum/mean height were measured for each species separately. Soil samples of the 0–100 cm depth were collected at 10-cm intervals. Since soil microbial abundance tends to be stable in the range of 40–100 cm, we only discuss the physical and chemical properties of soil in the range of 0–40 cm. There were four repeating plots for each site. The litter layer was removed before sampling. Seven cores of the same depth from each plot were mixed as one composite sample. Visible roots in the soil samples were removed immediately after the soil was sampled. A small part of each soil sample was stored at 4 °C for no longer than two weeks before PLFA analysis, and the subsamples left were air dried and kept at room temperature for physicochemical analysis. Meanwhile, soil samples used for determination of bulk density were collected using the cutting ring method.

2.2. Measurements of Soil Physiochemical Properties

A handheld time-domain reflectometer (TDR, TRIME-PICO-IPH, Germany) was used to collect soil moisture data from the quadrat. An automatic titrator (PHS-3C, INESA, Shanghai, China) was employed to detect the pH of soil (soil: water (w:v) = 1:2.5). Soil organic carbon (SOC) was determined with the wet digestion method. The semi-micro Kjeldahl method, in which a Kjeltec 8400 (FOSS, Denmark) is utilized, was used for total nitrogen (TN) measurement. In detail, about 0.700 g air-dried soil and 1.85 g mixed catalyst (K2SO4:CuSO4:Se = 100:10:1) were digested in and 5 mL H2SO4 at 385 °C for 45 min, and then titrated with 0.02 M HCL. Ammonium nitrogen (NH4+-N) and nitrate nitrogen (NO3--N) were tested by a Seal Auto Analyser. Total phosphorus (TP) was detected using melt-molybdenum, antimony, and scandium colorimetry, and available phosphorus (AP) was measured by the Olsen method. For measurement of TP, 0.25 g air-dried soil was digested in 2 mL HCLO4 and 3 mL H2SO4 at 120–130 °C for 60 min, and then diluted with deionized water to a final volume of 50 mL. After overnight stratification of the digestion liquid, 5 mL of the supernatant was taken, then 5 mL molybdenum antimony reagent was added, and deionized water was added to make a final volume of 50 mL. Phosphorus concentration in the solution was determined at 700 nm on an ultraviolet spectrophotometer (Hitachi UV2300). For determination of AP, 2.500 g air-dried soil with 50 mL 0.5 M NaHCO3 and one spoon of non-phosphorus active carbon was shaken for 30 min at 25 °C and filtered, then 10 mL of the filtrate was taken and 5 mL molybdenum antimony reagent was added, and diluted with deionized water to 25 mL. Phosphorus concentration in the solution was measured at 700 nm on an ultraviolet spectrophotometer.

2.3. PLFA Analysis

The modified Bligh–Dyer method was employed to extract soil microbial PLFAs [25,26]. Esterified C19:0 was used as the internal standard. The total lipids were extracted from 5g soil oscillated with a mixture of chloroform, methanol and citric acid buffer (1:2:0.8, v:v:v). An SPE silica gel column (500 mg, 3 mL) was used to separate the lipids. An Agilent 7890N gas chromatographer was used to analyze the PLFA composition after alkaline esterification. The PLFA profile was used for statistical analysis of the types and quantities of soil microbes. The chromatographic conditions were as follows: HP-5 capillary column (25 m × 200 μm × 0.33 μm); sample volume, 2 μL; split ratio, 30:1; carrier gas, H2 (30 mL·min−1); makeup gas (30 mL·min−1). MIDI Sherlock Microbial Identification System (MIDI, Inc., Newark, NJ, USA) was used to analyze the PLFA contents of the fractions.
In this study, we used the formula (i/a/cyc)X: YωZ(c/t), with “X” standing for carbon atoms in the main chain, “Y” standing for the number of unsaturated olefinic bonds, “ω” standing for the distance between the olefinic bond and the carboxyl group, “Z” standing for the position of the olefinic bond or cyclopropane chain, “i” standing for the isomeric methyl branch, “a” standing for the former isomeric methyl branch, “cy” standing for the cyclopropyl group, and suffixes “c” and “t” standing for cis and trans isomers, respectively [27]. “Me” denotes methyl branches. The sum of PLFA characteristics of bacteria (B), Gram-negative bacteria (G), Gram-positive bacteria (G+), fungi (F), actinomycetes (A), the saturated PLFAs (sat), the monosaturated PLFAs (mono), the cyclopropyl PLFAs (cy) and the precursor PLFAs (pre) were explored as broad taxonomic microbial groupings (Table 2). The ratio of saturated (sat) to monounsaturated (mono) PLFAs were utilized in combination with the ratios of the sum of cyclopropyl PLFAs to the sum of their monoenoic precursors (cy17:0 + cy19:0)/(16:1ω7 + 18:1ω7; abbreviated as cy/pre) to indicate physiological or nutritional stress in bacterial communities (Table 2).
The contents of total and individual PLFAs were figured out according to the molar amount of the internal standard C19:0. The absolute content of PLFAs (C/nmol·g−1) was calculated as: C = Aims/(As·m), with Ai standing for the peak area of the i-th PLFA fraction, As standing for the peak area of the internal standard, ms standing for the mass of the internal standard, and m standing for the mass of the soil sample. The relative percentage of PLFAs was calculated as the percentage of the peak area of the i-th PLFA to the total peak area.

2.4. Statistical Analysis

Excel 2007 and SPSS 20 for Windows (SPSS Inc, Chicago, IL, USA) were used to process, statistically analyze and plot the data. A one-way analysis of variation (ANOVA) and a least significant difference (LSD) multiple comparison (p < 0.05) were employed to assess how successional age affected soil properties, microbial composition and diversity. To identify the most notable factors shaping PLFAs and SMC, redundancy analysis (RDA) was utilized following Hellinger transformation of the PLFAs data and standardization of environmental factor data using the Vegan package in R.

3. Results

3.1. Soil Chemical Properties

SOC, TN, and AP increased substantially with increasing vegetation restoration years, especially in Y40, and such positive effect of vegetation restoration gradually decreased with increasing soil depth (Table 3). However, NH4+-N, NO3--N, and C/N in soils of FL (farmland) were significantly higher than those in soils of forests at all depths (p < 0.05), except for C/N in 20–30 cm. SOC, TN, and AP contents were significantly higher in soils of 40-year-old R. pseudoacacia plantations than in soils of other forests at all depths (p < 0.05), but NH4+-N, NO3-N, and TP were not different among different forest plantations (p < 0.05). SOC, TN, NH4+-N, NO3-N, and TP contents were also abundant in soils of the 25-year-old R. pseudoacacia plantations. SOC, TN, NH4+-N and NO3-N contents decreased with increasing soil depth. The pH of the soil at five different sites varied slightly around alkalinity (8.52—8.84). In all soil layers, soil moisture exhibited the highest value in the 15-year-old R. pseudoacacia plantations at all depths except for at 30–40 cm. However, no apparent differences were observed for soil bulk density (1.09–1.31 g.cm−3) and TP (0.50–0.66 g.kg−1).

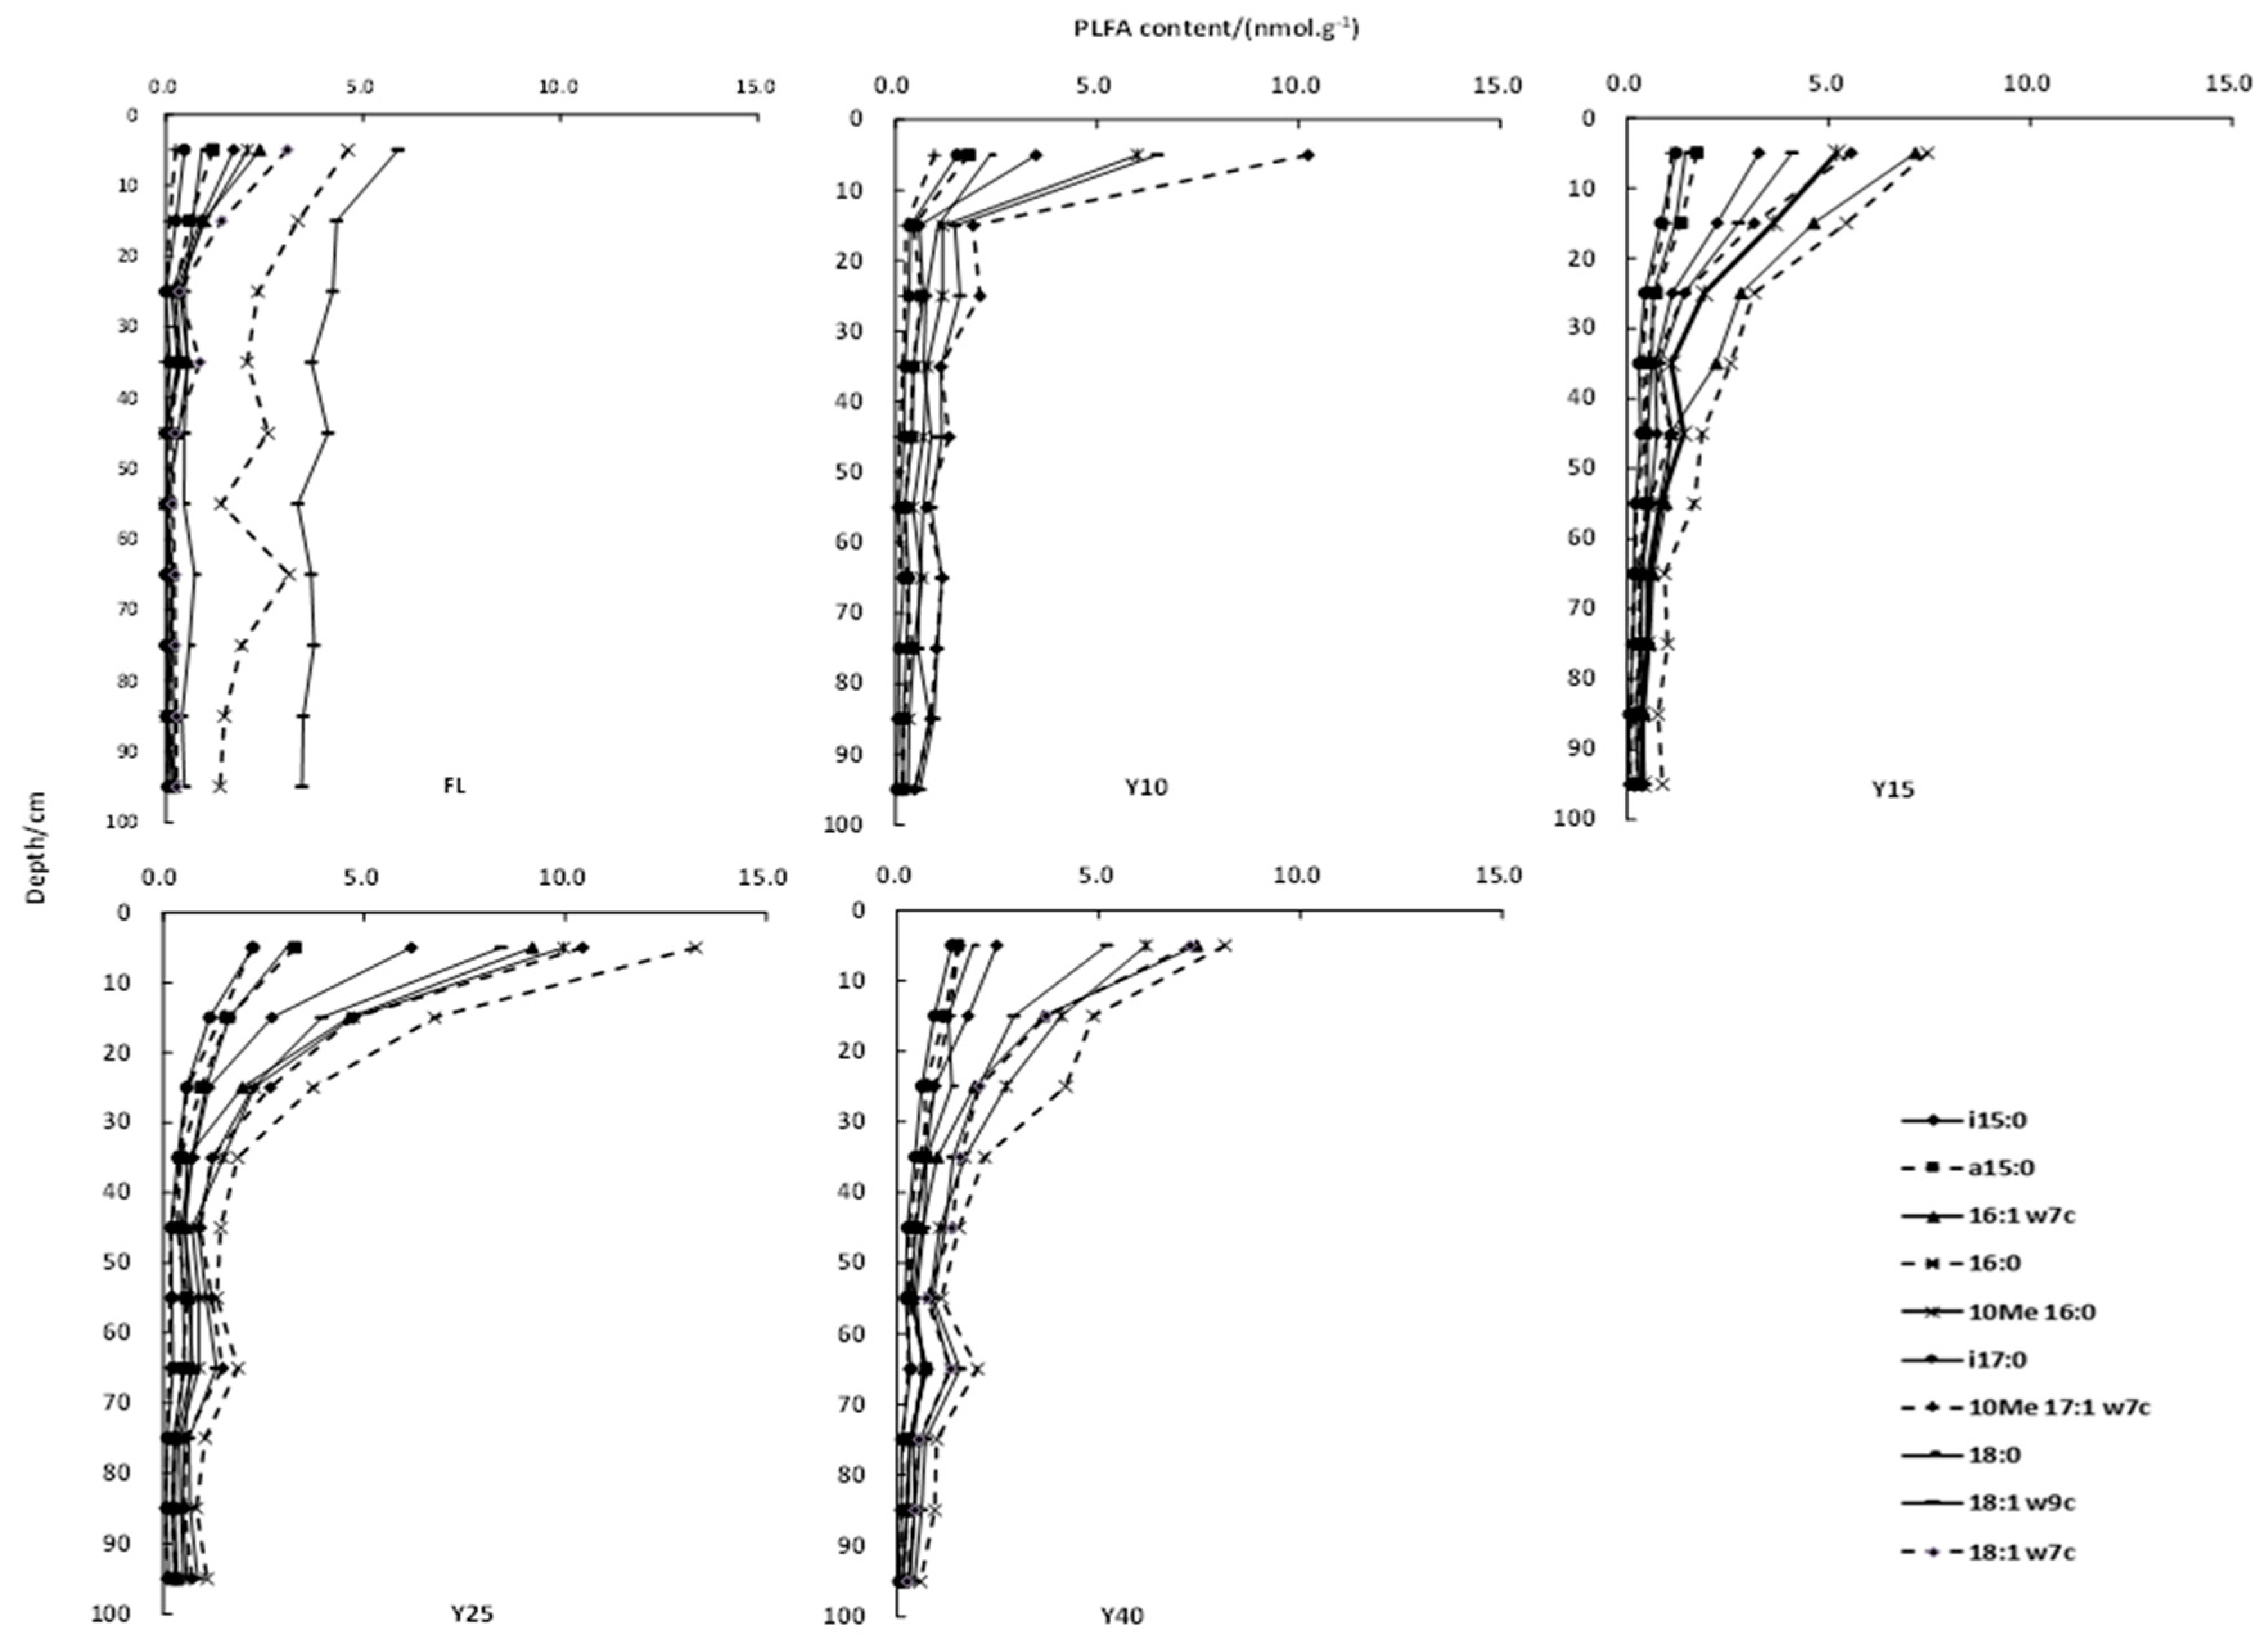
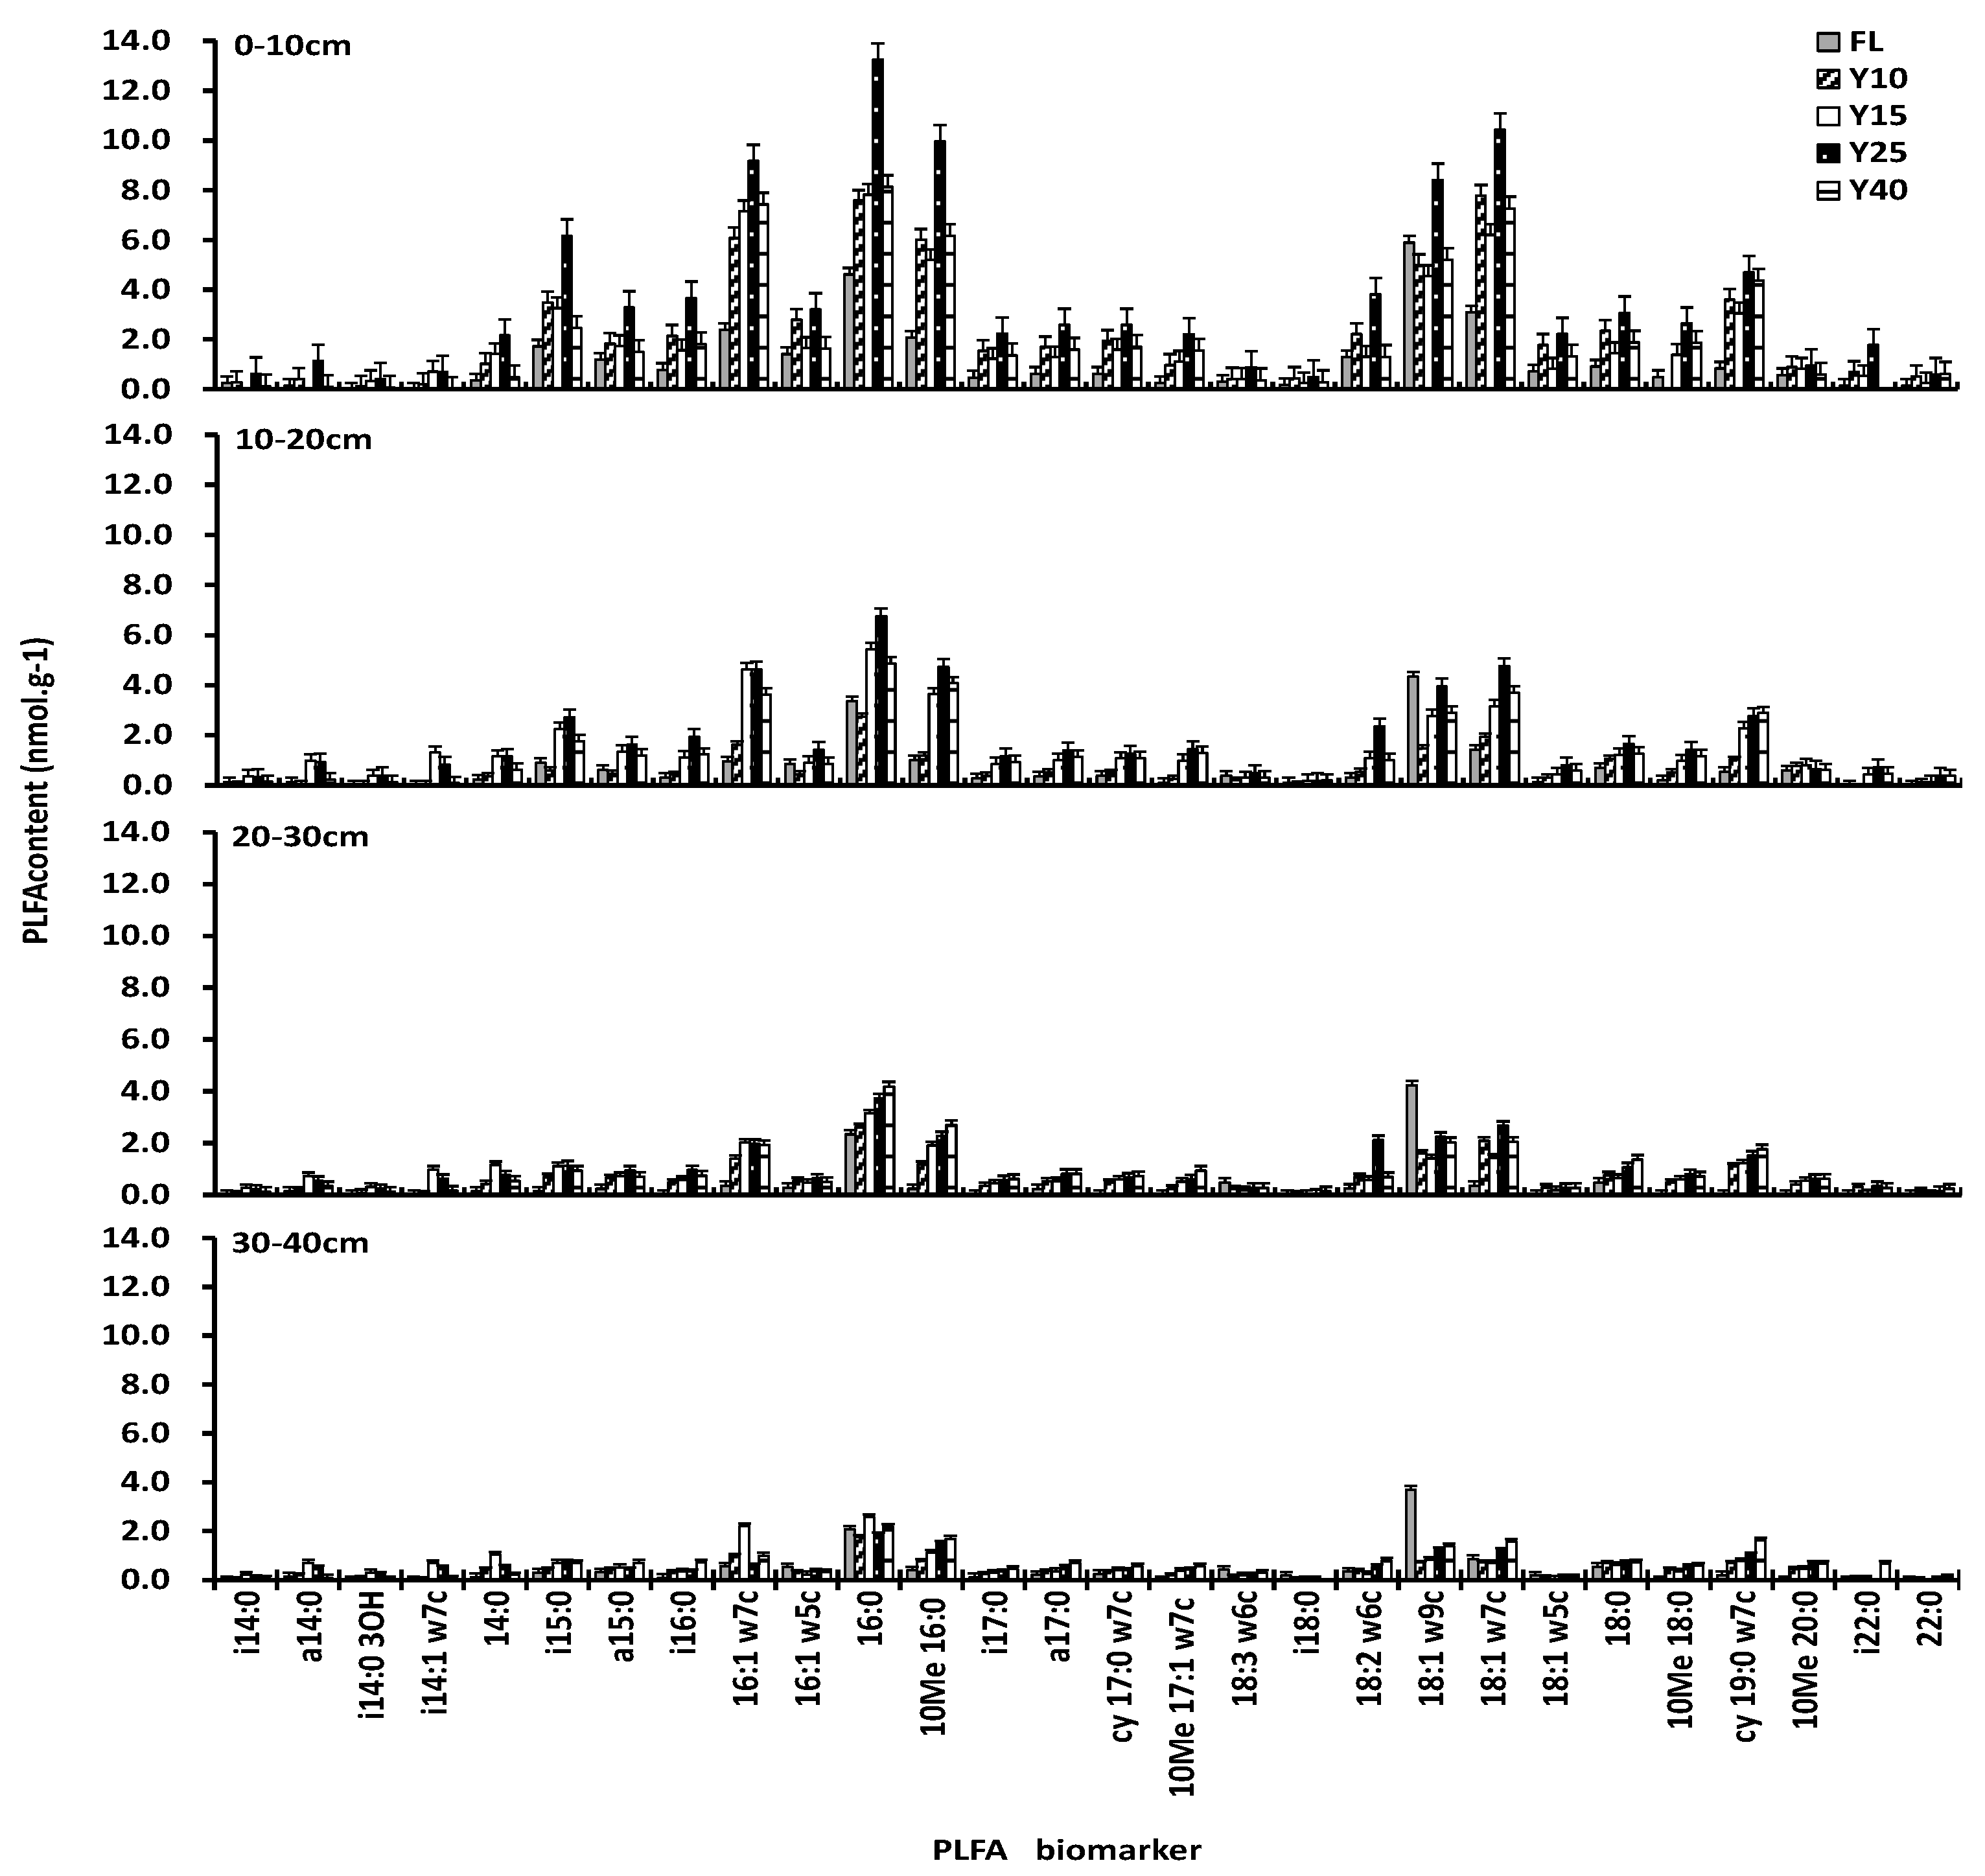
3.2. Soil PLFAs Contents

Differences in microbial PLFAs contents have been found between the surface and subsurface soils due to their various environments, that is, microbial diversity changed with vegetation restoration years (Figure 1). Higher microbial diversity at the top layer could be due to better aeration and greater nutrients availability, while the subsoil is depleted of oxygen and low substrate availability. Individual PLFAs decreased markedly in the superficial layers (0–40 cm), whereas individual PLFAs tended to be stable in deeper layers (40–100 cm). However, the microbial PLFAs contents of 16:0 and 18:1ω9c maintained a relatively high level with increasing soil depth in the FL. In general, the contents of microbial PLFAs mainly concentrated at 0–40 cm. Therefore, we focused on analyzing changes in the contents of PLFAs within the 0–40 cm soil layers.
Altogether, 97 PLFAs were spotted in the soils of R. pseudoacacia plantations of different ages and at different depths. Specifically, 77, 72, 83, 85, and 57 PLFAs were discovered in soils of the 10-year-old, 15-year-old, 25-year-old, and 40-year-old plantations and FL, respectively, including saturated straight fatty acids, saturated branched fatty acids, cyclopropyl fatty acids, monounsaturated fatty acids, and polyunsaturated fatty acids. The content of 16:0 was the greatest, together with 18:1ω7c, 10Me16:0, 16:1ω7c, 18:1ω9c, cy19:0 and i15:0, and the content of 16:0 constituted 12.76–14.01% of the total PLFA contents (Figure 2). The contents of individual PLFAs varied dynamically and presented certain regularity. In the 0–20 cm soil layers, the contents of different PLFAs stayed the highest for the 25-year-old plantation, while no significant differences were found in the individual contents of PLFAs among the remaining plots of other ages and FL. However, the contents of different PLFAs were relatively low for FL. In the 20–40 cm soil layers, the contents of different PLFAs were relatively high for the 25-year-old and 40-year-old plantations, but the content of 18:1ω9c was significantly higher in FL than in forest sites. Furthermore, it seemed that the amounts of different PLFAs consistently decreased with increasing soil depth, and the contents of individual PLFAs of different ages of plantations were various at the same depth (Figure 2).

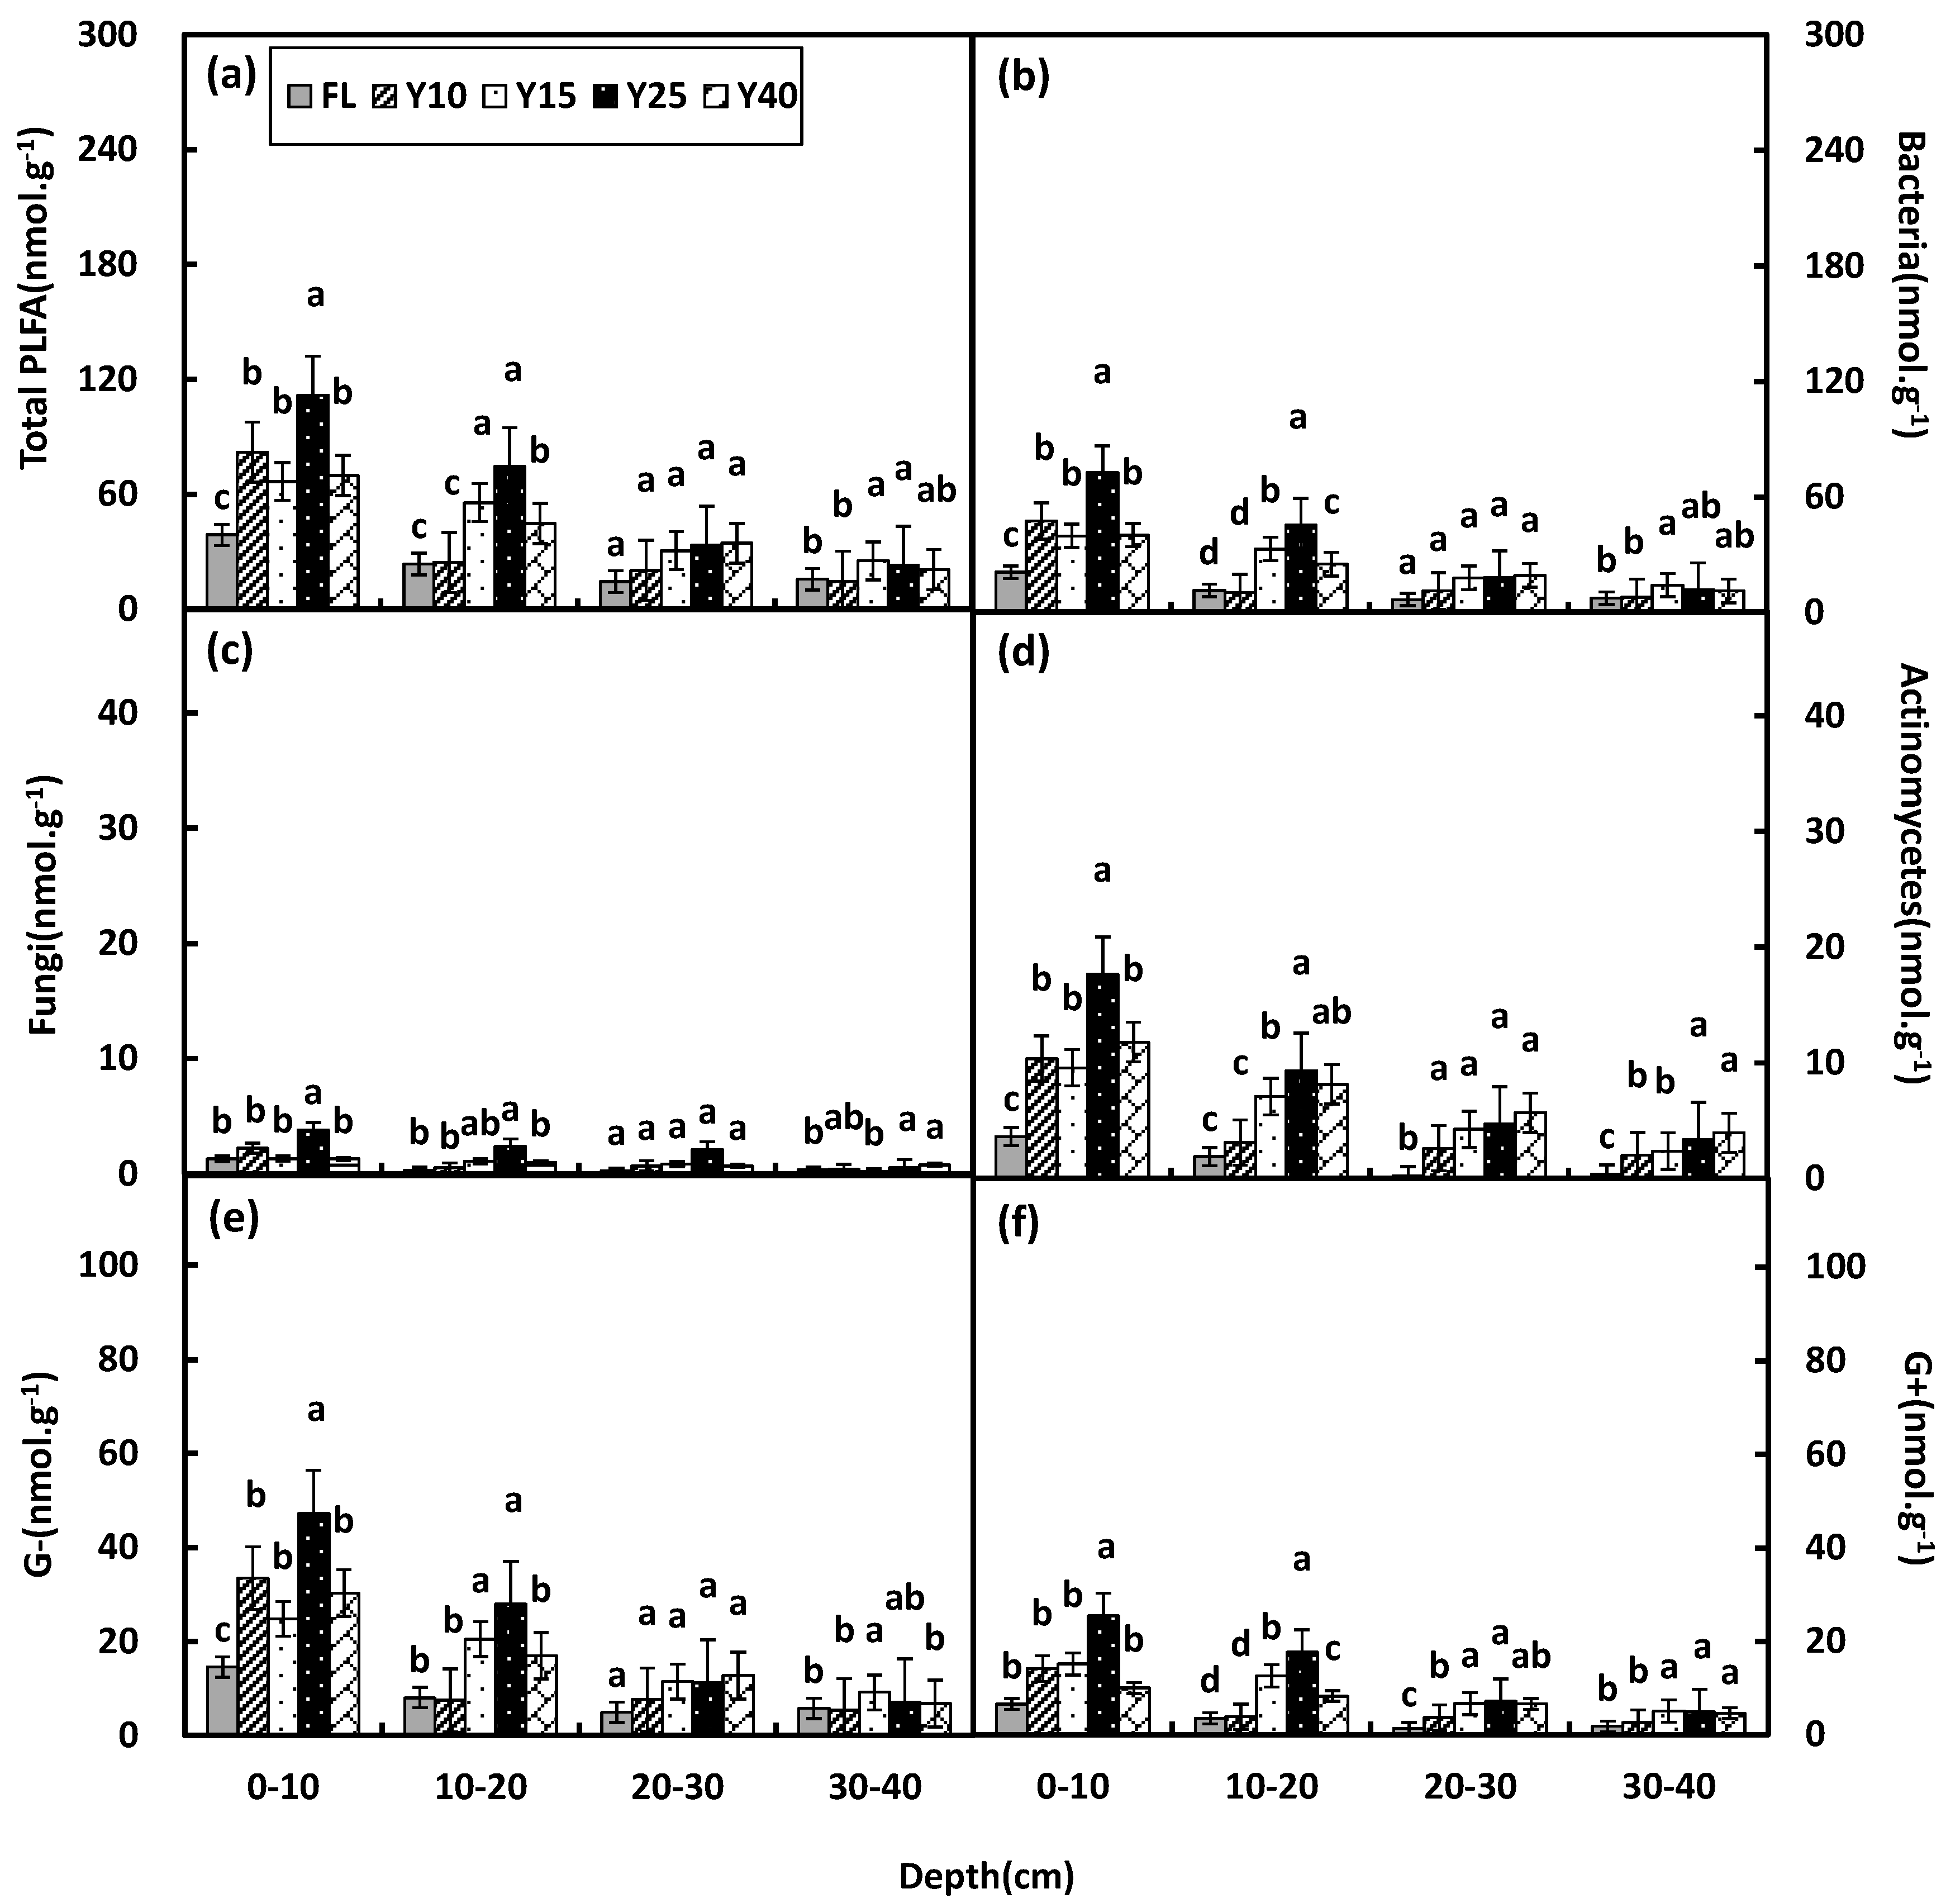
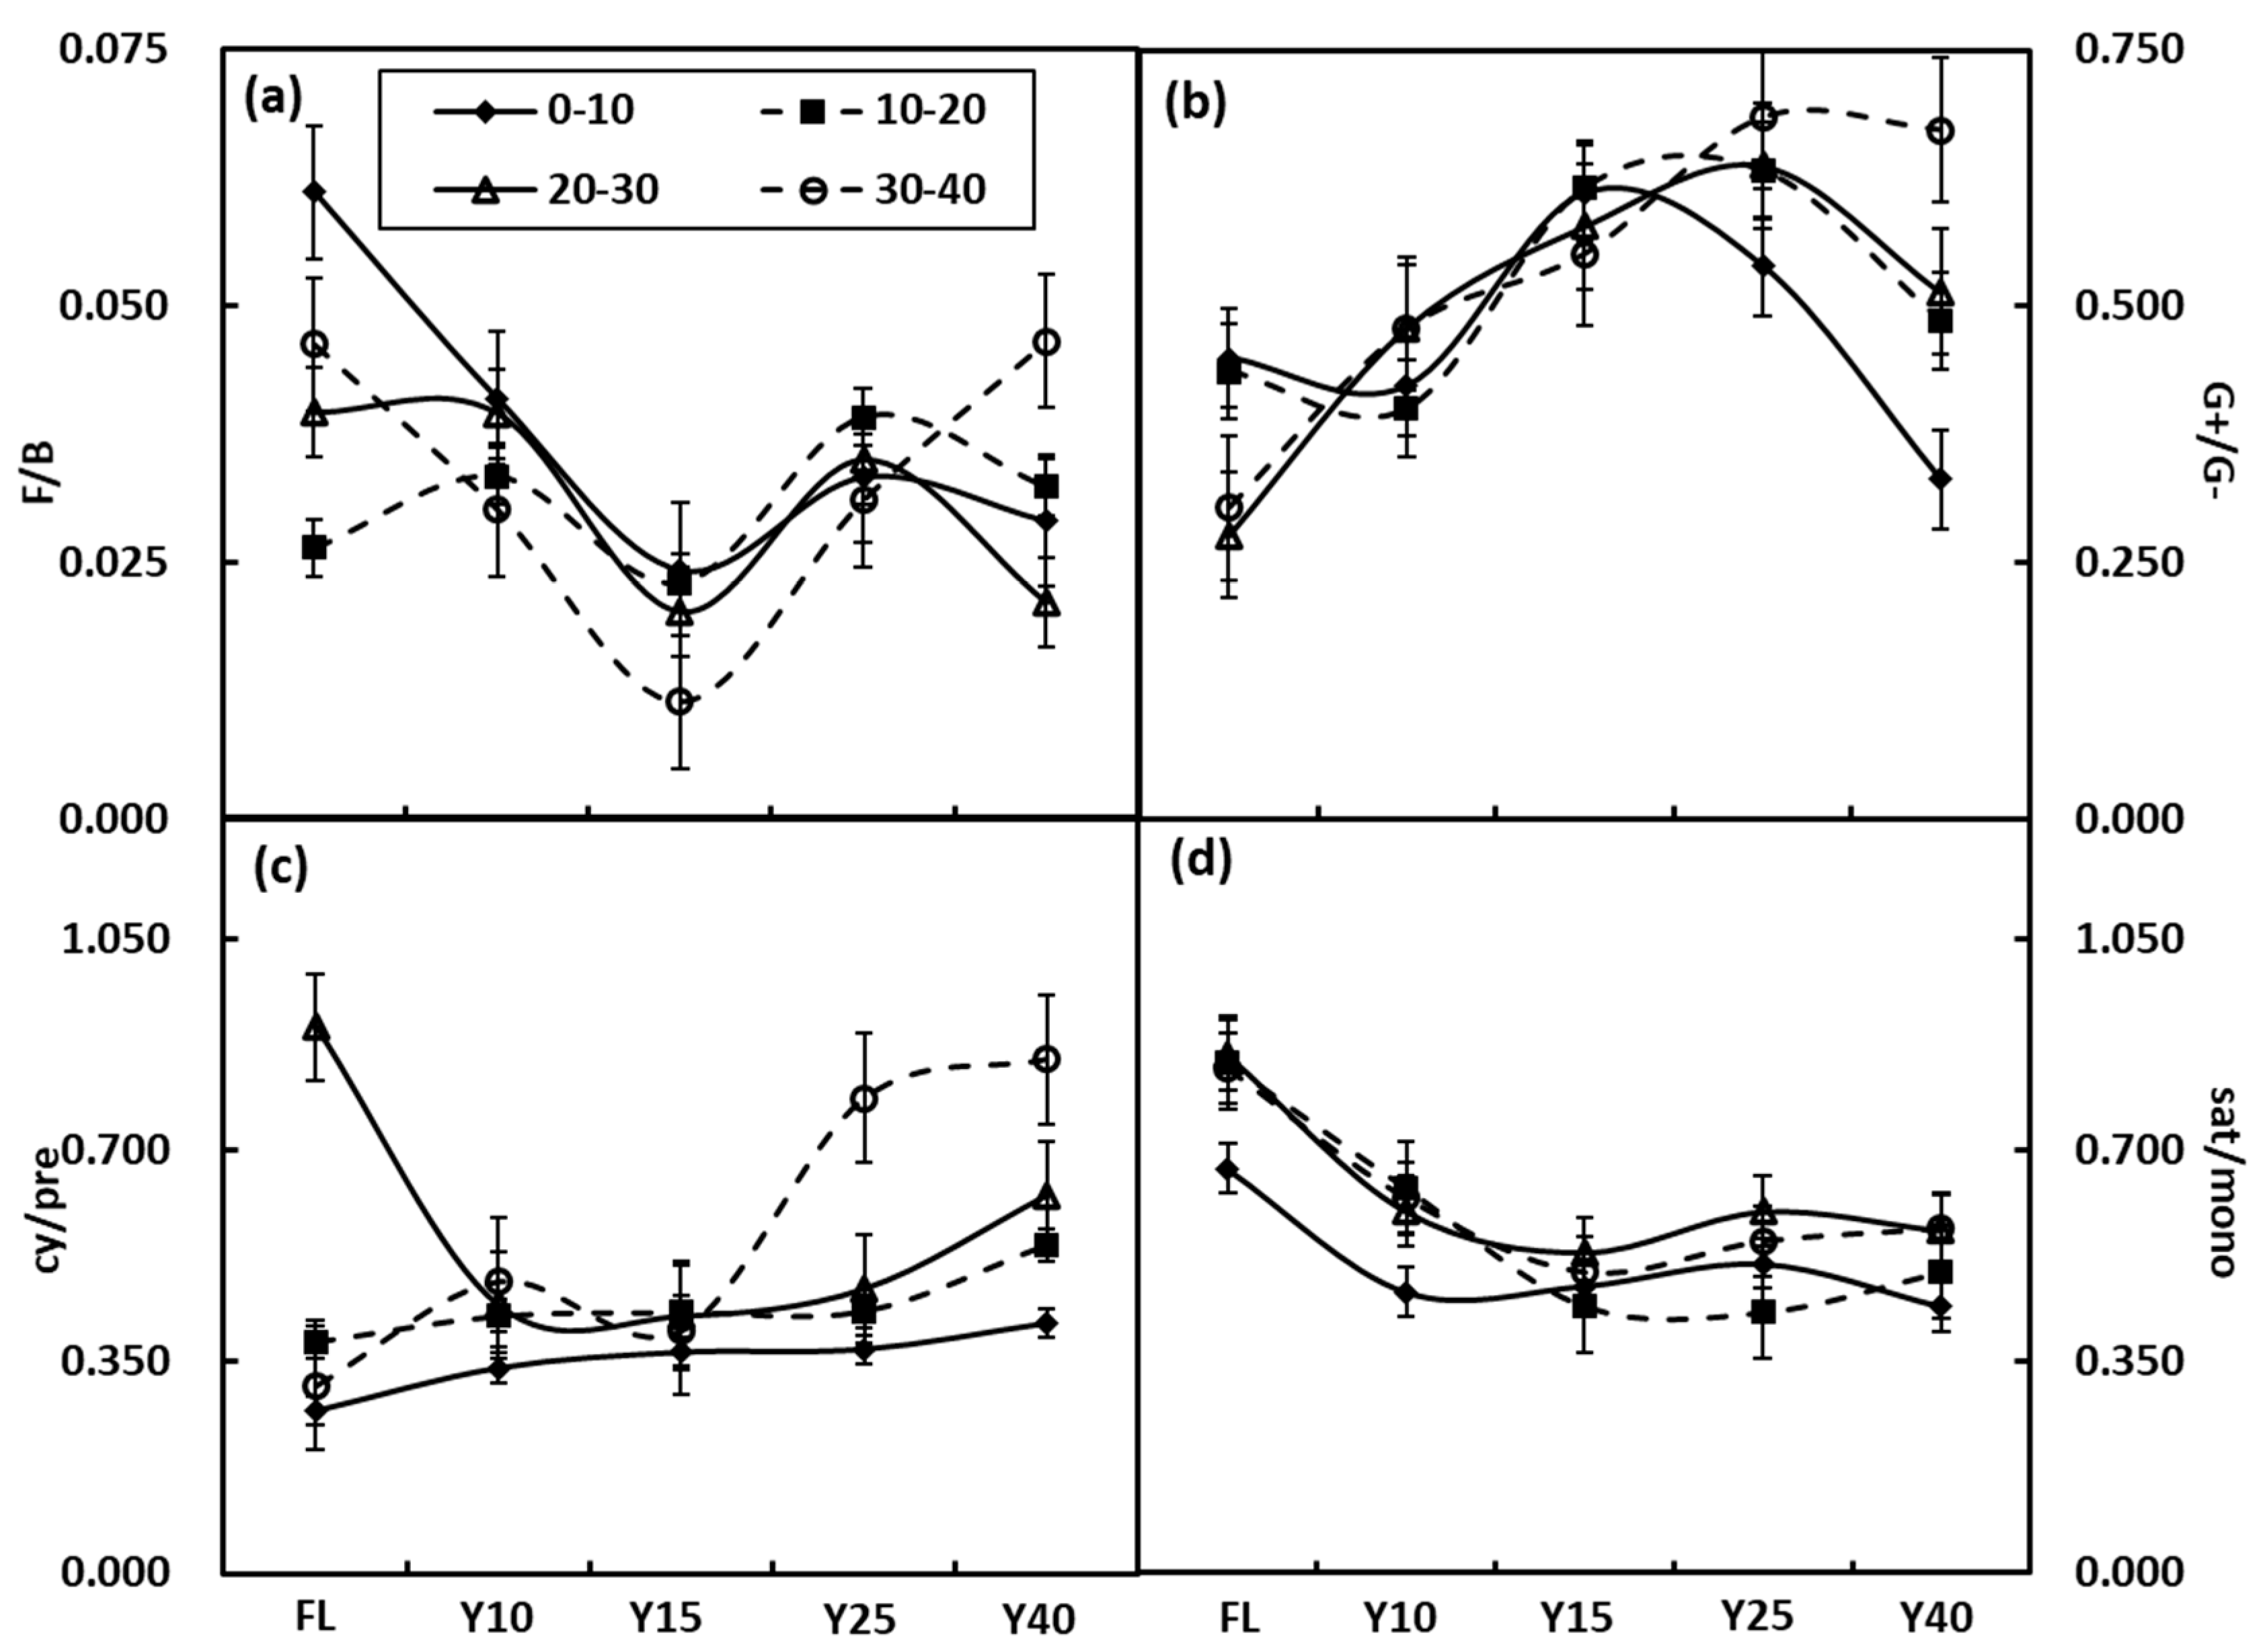
3.3. Soil Microbial Community Structure

The biomass of various microbial groups and the total microbial biomass in soils of R. pseudoacacia plantations varied significantly among different stand ages, but the degree of variations tended to decrease with increasing soil depth (Figure 3). As indicated in Figure 3a, in the 0–10 cm and 10–20 cm soil layers, the contents of total PLFAs in the R. pseudoacacia plantations increased initially and then decreased, with the highest values in 25-year-old plantation and the lowest values in FL. In the soil layers of 20–30 cm and 30–40 cm, the content of total PLFA showed the same trend, and there was no insignificant difference among different stand ages and FL (p > 0.05). The content of total PLFAs shifted with depth and followed the order of 0–10 cm > 10–20 cm > 20–30 cm > 30–40 cm, and the changes were consistent with the changes in individual PLFA contents with soil depth. A comparison of Figure 3b–f with Figure 3a revealed that the PLFA contents of various microbial groups, including F, B, A, G+, and G, general exhibited the same trends as the content of total PLFAs in the soils. In the soil layers of 0–10 cm and 10–20 cm, the PLFA contents of Y25 were significantly different from other artificial afforestation years (p < 0.05). This significant difference decreases as the soil layer deepens. Moreover, the contents of B and G+ PLFAs of all soil layers also differed significantly among stand ages (p < 0.05). The PLFA contents of microbial groups varied in the same soil layer and generally followed the order of B > G > G+ > A > F.
We compared the F/B, sat/mono, cy/pre, and G+/G (Figure 4) for the belowground soil microbial community to provide greater insight into the physiological characteristics of the soil microbes. At the same depth, there was a similar trend of microbial PLFA compositions among the stands of different ages, except for cy/pre at 30–40 cm. The F/B varied markedly among stands of various ages (p < 0.05) and displayed a “decrease–increase–decrease” trend with stand age, this ratio was relatively high in the FL and 25-year-old plantations. The sat/mono ratio initially decreased before levelling off with the change in stand age; this ratio was the highest in the FL, and showed significant differences among sites (p < 0.05). The cy/pre ratio exhibited a trend contrary to that of the sat/mono ratio, with the highest value appearing in the 40-year-old plantation; a striking difference was detected in the cy/pre ratio between the FL and restoration stages (p < 0.05). G+/G ratio increased in the first 25 years and then decreased drastically, peaking at 25-year-old plantations (Figure 4a).

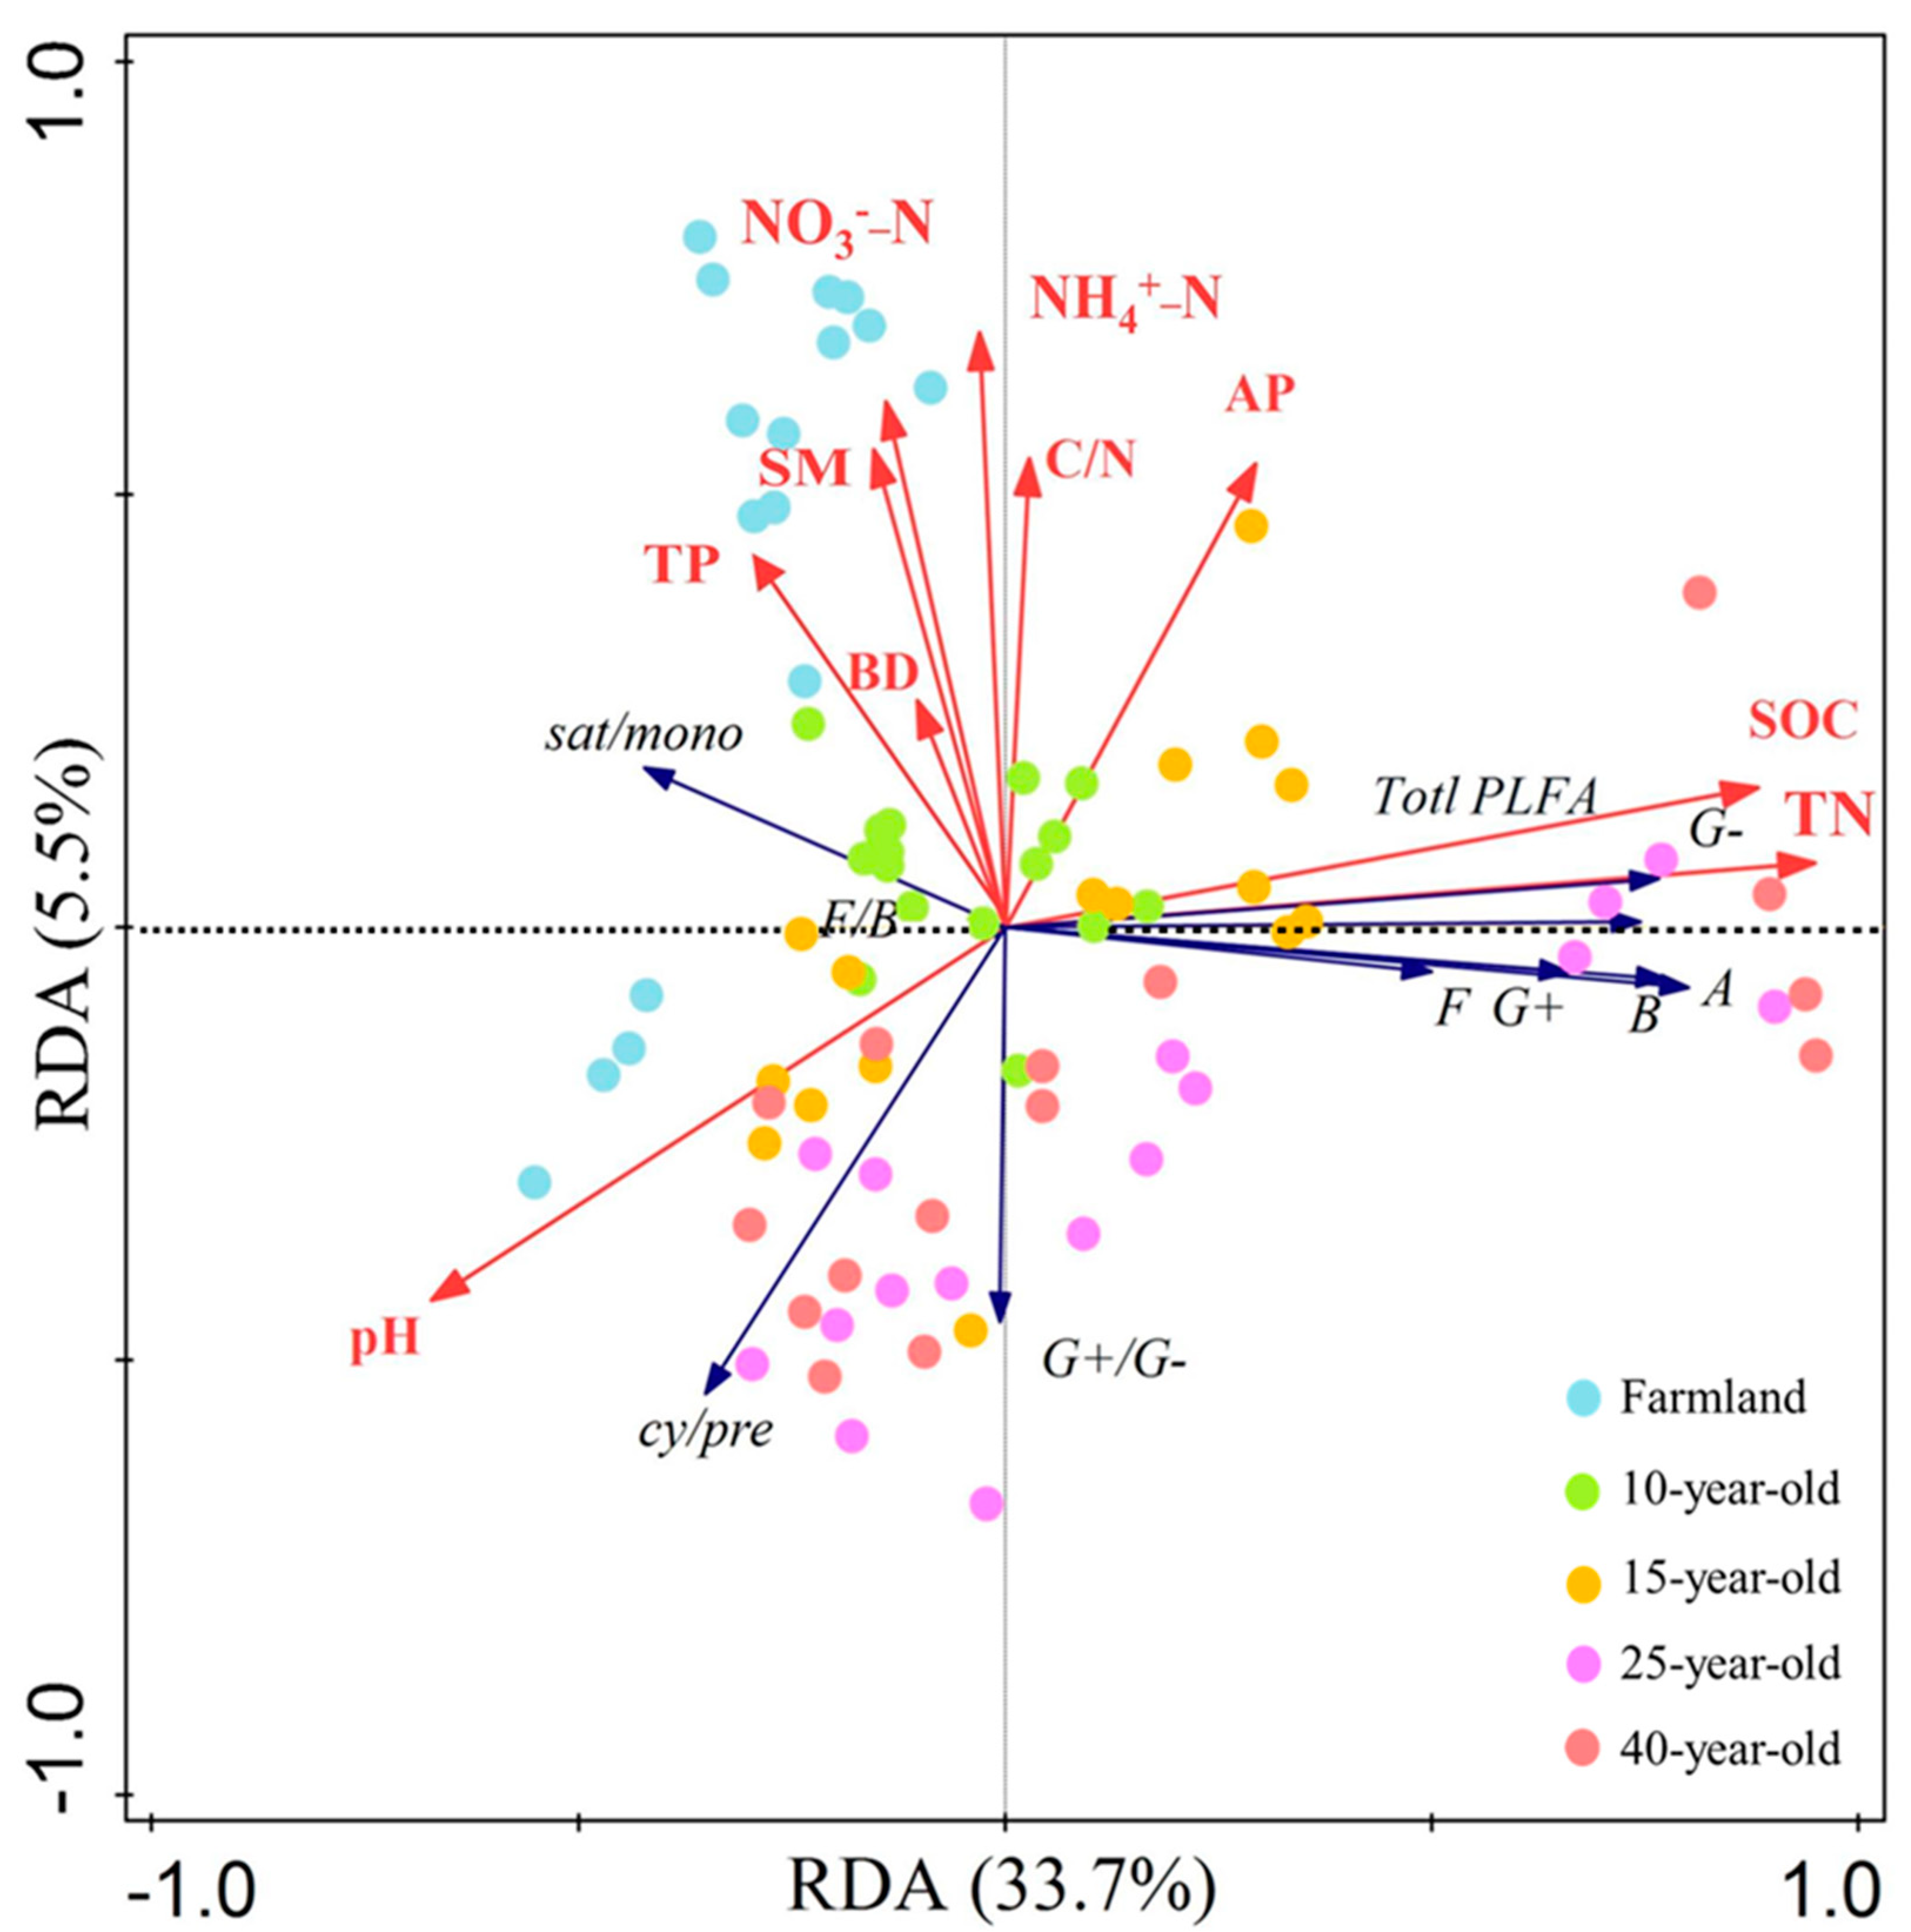
3.4. Redundancy Analysis

The RDA biplot (Figure 5) indicated the connection between the soil PLFA contents and the environmental variables. The first ordination RDA Axis (horizontal) was mainly linked with pH, TN, and SOC contents, and contributed to 33.7% of the total variability of the PLFA. SOC and TN showed a positive correlation with Axis 1, while pH was negatively linked with Axis 1. The second ordination Axis (vertical), which was strongly associated with TP, BD (bulk density), SM (soil moisture), AP, NH4+-N, NO3-N, and C/N, explained 5.5% of the total variability. Simple term effects suggested that all soil nutrient parameters demonstrated the changes in soil PLFA contents (Table 4). Forward selection of soil nutrient variables revealed that SOC statistically contributed to 30.6% of the changes, and the inclusion of TP and NO3--N could explain 4.1% and 3.4% of the changes, respectively. Therefore, the TN content was responsible for almost half of the variations in soil PLFA contents. The ratio of cy/pre was positively correlated with pH and negatively correlated with other environmental variables. The ratio of sat/mono and F/B was positively associated with TP, BD, SM, NO3-N, NH4+-N, and C/N but negatively correlated with TN and SOC. The ratio of G+/G was positively associated with pH and negatively correlated with SM, BD, and all soil nutrient variables. The contents of Gram-positive bacteria PLFA biomarkers, Gram-negative bacteria PLFA biomarkers, bacterial PLFA biomarkers, fungal PLFA biomarkers, actinomycetes PLFA biomarkers, and total PLFA biomarkers were positively correlated with SOC, AP, and TN.

4. Discussion

4.1. The Effects of Afforestation on Soil Physicochemical Properties

Our results showed that vegetation restoration deeply affected soil physical and chemical properties, except for pH, BD, and TP, which exhibited no notable difference in the soil layers of 0–10 and 10–20 cm. Forty years’ restoration resulted in lower NO3-N, NH4+-N, and C/N but higher SOC, TN, and AP. For higher SM in Y15, R. pseudoacacia had developed root systems which could decrease BD and improve soil aeration, thus resulting in increased SM. The high canopy density in Y15 might reduce the net solar radiation on the soil surface, thus reducing evaporation and maintaining SM [34]. SOC and TN accumulated with longer restoration years, consistent with the findings of other studies [35,36]. The SOC and TN increased with the chronosequence of R. pseudoacacia plantations, most like due to the following reasons. Firstly, more litter and root biomass were accumulated after the establishment of R. pseudoacacia plantations, in which soil clay content increased and soil erosion occurs easily [37]. Improved anti-erodibility of soils would in turn increase the potential for soil organic carbon accumulation. Secondly, nitrogen accumulation due to fixation of atmospheric N by R. pseudoacacia, which could be even more than N deposition from the atmosphere [38]. Thirdly, the C/N value shows the rate of organic C decomposition and N mineralization, and these are strongly interrelated or even promote each other [39]. In this study, the ratios of C/N in the R. pseudoacacia plantations were significantly lower than those of the farmland sites, so 40 years after the restoration of the R. pseudoacacia plantations on the farmland sites, the new ecosystems of R.pseudoacacia might restore N-cycle involved ecological equilibrium [40]. The NO3--N and NH4+-N concentrations had a sharp drop from the FL to Y10 site, due to the termination of fertilizer input and the consumption of nutrients by plants and soil microorganisms. However, the NO3-N and NH4+-N concentrations at the Y40 sites reached similar levels to that of Y10, likely due to the fact that initially TN in soil was low [41] and the rate of litter decomposition was accelerated at a later stage of the restoration [42]. It may also be affected by higher root density as a result of high tree density. Phosphorus has a slow diffusion rate and can be easily fixed in soils. The coordination of plant adaptations in root morphology and root physiology can increase soil phosphorus bioavailability [43], and explain why TP, rather than AP, in soils were stable with different restoration years. The contents of NH4+-N and NO3-N in soil of Y40 increased to the value of Y10, the content of AP was significantly higher at Y40 site than at Y10 site, probably because of the fact that, with the extension of the recovery time, plant growth slowed down and the demand for nutrients decreased.

4.2. Positive Effects of Afforestation on Soil Microbial Communities and Their Influencing Factors

The total PLFAs of different ages of R. pseudoacacia plantations followed the order of Y40 > Y25 > Y10 > Y15 > FL. The individual PLFA signatures did not change appreciably as species of soil microorganisms in 40-year-old R. pseudoacacia plantation, indicating that the diversity of soil microbial communities might be species-saturated. After analyzing the changes of ten PLFA biomarkers with soil depth, we founded that the contents of different PLFAs mainly concentrated in the soil depth of 0–40 cm, then a sharp decrease occurred at the depth of 40–100 cm (Figure 1), similar to the results of Fierer’s study [44]. The PLFA contents of different microbial groups followed the order of B > G > G+ > A > F. It has been reported that high soil fertility could be conducive to microbial growth in forest soils [45]. Nevertheless, afforestation years is clearly a problem that cannot be ignored. The R. pseudoacacia plantation matures around 30 years old, and then the density and canopy cover declined [4]. Vegetation degradation was an important factor for the reduction in microbial biomass in alpine grasslands, due to a decrease in vegetation cover and biomass [46]. The reduction in understory vegetation types and coverage indicates a slight degradation of vegetation, which might result in a reduction in soil microbial biomass at Y40. The negative effects of vegetation degradation decreased with increasing soil depth. We considered 25 years as the best time of artificial afforestation, because the contents of individual PLFAs and total PLFAs in surface soil were the highest in the 25-year-old plantation.
Soil resource quality and quantity, soil pH, and soil moisture can influence the microbial composition [18,47,48]. It is reported that fungi are more responsive to adding soil C into biomass than bacteria, and the C turnover gets slower in fungal-dominated ecosystems, so that fungal PLFA 18:2ω6c might explain high SOC in the forest stands we studied [49,50]. Soil fungi community was the result of long-term co-regulation by plant and soil traits [51,52]. In previous studies, the fungal community composition has been shown to be highly correlated with soil pH in forests [53,54]. Besides, soil fungi are more strongly associated with soil nutrient content than pH in southeastern U.S. [55]. Soil pH may be regarded as one of the main drivers for soil fungal community [17]. Fungi play an important role in breaking down the insoluble organic matter and supplying available nutrients to roots in terrestrial ecosystems following vegetation restoration [56]. In the present study, the fungal PLFA was not connected with C/N ratio, but was negative correlated with pH, and the contents were nearly constant in the forests of different ages. The fungal PLFA 18:2ω6c has the highest concentration at pH 6, and the concentration declined with increasing pH [57].
In our study, the fungal PLFA was closely associated with SOC, which was also affected by TN. Our results also showed that total PLFA and bacterial PLFA were significantly different among sampling sites. Total PLFA and bacterial PLFA were significantly higher in the 25-year-old R. pseudoacacia plantation, and lower in other plantations. However, the significant difference in fungal PLFA was found in the 0–10 cm and 10–20 cm soil layers among treatments. There are studies showing that pH, nitrogen availability, and soil organic carbon are important environmental factors affecting soil bacterial community [58,59,60]. In the present study, total PLFA, fungi PLFA and bacterial PLFA did not significantly correlate with NO3-N or NH4+-N. Higher biomass of Gram-positive bacteria and actinomycetes in the 25-year-old R. pseudoacacia plantation was related to higher SOC and TN, while lower biomass Gram-positive bacteria and actinomycetes in the 10-year-old R. pseudoacacia plantation was related to lower SOC and TN, indicating that variation of Gram-positive bacteria and actinomycetes might be explained by SOC and TN. The two higher PLFA ratios, i.e., cy/pre and sat/mono, represented more environmental stress and greater nutrients demand for soil microbial growth, respectively [44,61]. The ratios of sat/mono remained relatively stable at different planting ages and soil depths (Figure 4), indicating that the nutrients requirement of microbes might be impacted by land use more greatly than by the soil depth and plantation age. Similarly, the ratios of cy/pre increased with increasing restoration stages, especially in the 30–40 cm soil layer, suggesting that the environmental stress of microorganisms could be affected by soil available nutrients, and the redundancy analysis results could also support the speculation. Artificial afforestation improved the nutrient limitation of soil microorganisms in the 0–30 cm soil layer, and the environmental stress of soil microbial community was weakened after afforestation.

4.3. Possible Negative Effects of Afforestation on Soil Ecosystem

Earlier studies have shown that R. pseudoacacia can cause adverse effects on the soil ecosystem [62], native plant community [63], and soil microbial community [64], because N-enrichment can cause soil degradation through strong nitrification, leaching, and acidification [65], and the negative effect will get worse with increasing plantation ages. The ratio of F/B depends on the relative abundance of fungi and bacteria in soil [54]. Low ratios of F/B showed higher C mineralization than high ratios of F/B in agricultural soils, because this SMC can be efficiently used in glucose-C [66]. Our study showed more SOC with decreasing ratio of F/B in soil microbial communities. In addition, the low ratios of F/B showed that the litter recalcitrance of R. pseudoacacia was low in the initial stage, because the ability of fungi to degrade lignin is far better than bacteria in soil [67,68]. The ratio of F/B may be a sensitive indicator for a more sustainable agricultural system (de Vries et al., 2006). However, the sustainability might be weaker after the establishment of R. pseudoacacia plantations. The ratios of F/B in the soil after artificial forestation were lower than FL, indicating that the negative effects of artificial afforestation on soil microbial community would continue until the 25th year after artificial afforestation. G+ and G are prevalent in poor and rich readily available substrate soils, respectively [20,69]. The ratio of G+/G bacteria PLFA indicates carbon availability in organic soils, and G- are more dependent on simple C compounds derived from plants than G+, so increasing G+:G ratio may indicate decreasing ecosystem productivity [70]. A low ratio of G+/G may be due to G dominate soils with more easily decomposable substrates [71], while high the ratios of G+/G bacteria PLFA are often reported in soils with low-fertility. High ratios of G+/G in the 25-year-old R. pseudoacacia plantations indicated the negative effects of artificial plantation on soil ecosystem continued until the 25th year. Meanwhile, the effects gradually decreased with the increase in soil depth.

5. Conclusions

On the time scale, we found that the contents of different PLFAs increased, with restoration going on until the 25th year. On the depth scale, it was demonstrated that the contents of different PLFAs mainly concentrated at the soil depth of 0–40 cm, then a sharp decrease occurred at the soil depth of 40–100 cm. Following 25 years’ vegetation restoration, the contents of different PLFAs reached the peak. At the same time, the changes of F/B and G+/G might show the decrease in soil ecosystem productivity/sustainability. The contents of different individual PLFAs and total PLFAs were positively correlated with SOC and TN. However, variations of soil PLFA ratios mostly depended on other soil properties. Soil nutrient status and other soil eco-environmental stress factors should be taken into consideration in 10-year-old to 25-year-old (particularly ~15-year-old) and more than 25-year-old plots for the management of R. pseudoacacia plantations, in order to prevent forest soil degradation and improve forest stand quality, and guarantee better soil and water conservation and environmental improvement in R. pseudoacacia plantations. In conclusion, we propose forest management in the 25th year of R. pseudoacacia plantations when soil microbial biomass is the highest, thus maximizing the ecological effect of afforestation on the Loess Plateau. These findings may serve as a reference for future studies on the restoration of vegetation on the Chinese Loess Plateau.

Author Contributions

Conceptualization, C.L. and B.Z.; methodology, C.L. and J.L.; software, C.L.; validation, C.L, J.L., F.H., and; J.Z.; writing—original draft, C.L. and B.Z.; review and editing, C.L., B.Z., J.L., X.W., F.H. and J.Z.; supervision, F.H. and J.Z. All authors have read and agreed to the published version of the manuscript.

Funding

This research was funded by the National Key R&D Program of China (2017YFC0504504, 2016YFA0600801), the West Light Foundation of the Chinese Academy of Science (XAB2016A04), the National Natural Science Foundation of China (41471437) and the fund of State Key Laboratory of Soil Erosion and Dryland Farming on the Loess Plateau (A314021402-1914).

Acknowledgments

The authors thank the AJE and Honghua He for assistance with the English.

Conflicts of Interest

The authors declare no conflict of interest.

References

  1. Baath, E.; Anderson, T.H. Comparison of soil fungal/bacterial ratios in a pH gradient using physiological and PLFA-based techniques. Soil Biol. Biochem. 2003, 35, 955–963. [Google Scholar] [CrossRef]
  2. Belin, B.J.; Busset, N.; Giraud, E.; Molinaro, A.; Silipo, A.; Newman, D.K. Hopanoid lipids: From membranes to plant-bacteria interactions. Nat. Rev. Microbiol. 2018, 16, 304–315. [Google Scholar] [CrossRef] [PubMed] [Green Version]
  3. Berthold, D. Soil Chemical and Biological Changes through the N2 Fixation of Black Locust (Robinia pseudoacacia L.)-A Contribution to the Research of Tree Neophytes. Ph.D. Thesis, Institute of Soil Science and Forest Nutrition of the Georg-August University of Göttingen, Göttingen, Germany, 2005; p. 186. Available online: http://hdl.handle.net/11858/11800-11735-10000-10006-B11850E11854-11856 (accessed on 14 July 2015).
  4. Bligh, E.G.; Dyer, W.J. A rapid method of total lipid extraction and purification. Can. J. Biochem. Physiol. 1959, 37, 911–917. [Google Scholar] [CrossRef] [PubMed] [Green Version]
  5. Bossio, D.A.; Scow, K.M. Impacts of carbon and flooding on soil microbial communities: Phospholipid fatty acid profiles and substrate utilization patterns. Microb. Ecol. 1998, 35, 265–278. [Google Scholar] [CrossRef]
  6. Bünemann, E.K.; Bongiorno, G.; Bai, Z.; Creamer, R.E.; De Deyn, G.; de Goede, R.; Fleskens, L.; Geissen, V.; Kuyper, T.W.; Mäder, P.; et al. Soil quality—A critical review. Soil Biol. Biochem. 2018, 120, 105–125. [Google Scholar] [CrossRef]
  7. Buzhdygan, O.Y.; Rudenko, S.S.; Kazanci, C.; Patten, B.C. Effect of invasive black locust (Robinia pseudoacacia L.) on nitrogen cycle in floodplain ecosystem. Ecol. Model. 2016, 319, 170–177. [Google Scholar] [CrossRef]
  8. Cao, Y.S.; Fu, S.L.; Zou, X.M.; Cao, H.L.; Shao, Y.H.; Zhou, L.X. Soil microbial community composition under Eucalyptus plantations of different age in subtropical China. Eur. J. Soil Biol. 2010, 46, 128–135. [Google Scholar] [CrossRef]
  9. Cederlund, H.; Wessen, E.; Enwall, K.; Jones, C.M.; Juhanson, J.; Pell, M.; Philippot, L.; Hallin, S. Soil carbon quality and nitrogen fertilization structure bacterial communities with predictable responses of major bacterial phyla. Appl. Soil Ecol. 2014, 84, 62–68. [Google Scholar] [CrossRef]
  10. Chang, E.H.; Chiu, C.Y. Changes in soil microbial community structure and activity in a cedar plantation invaded by moso bamboo. Appl. Soil Ecol. 2015, 91, 1–7. [Google Scholar] [CrossRef]
  11. Chen, Y.L.; Chen, L.Y.; Peng, Y.F.; Ding, J.Z.; Li, F.; Yang, G.B.; Kou, D.; Liu, L.; Fang, K.; Zhang, B.B.; et al. Linking microbial C:N:P stoichiometry to microbial community and abiotic factors along a 3500-km grassland transect on the Tibetan Plateau. Glob. Ecol. Biogeogr. 2016, 25, 1416–1427. [Google Scholar] [CrossRef]
  12. De Boer, W.; Folman, L.B.; Summerbell, R.C.; Boddy, L. Living in a fungal world: Impact of fungi on soil bacterial niche development. FEMS Microbiol. Rev. 2005, 29, 795–811. [Google Scholar] [CrossRef] [Green Version]
  13. De Marco, A.; Arena, C.; Giordano, M.; De Santo, A. Impact of the invasive tree black locust on soil properties of Mediterranean stone pine-holm oak forests. Plant Soil 2013, 372, 473–486. [Google Scholar] [CrossRef]
  14. De Vries, F.T.; Hoffland, E.; van Eekeren, N.; Brussaard, L.; Bloem, J. Fungal/bacterial ratios in grasslands with contrasting nitrogen management. Soil Biol. Biochem. 2006, 38, 2092–2103. [Google Scholar] [CrossRef] [Green Version]
  15. Deng, L.; Shangguan, Z.P. Afforestation Drives Soil Carbon and Nitrogen Changes in China. Land Degrad. Dev. 2017, 28, 151–165. [Google Scholar] [CrossRef] [Green Version]
  16. Du, B.G.; Pang, J.Z.; Hu, B.; Allen, D.E.; Bell, T.L.; Pfautsch, S.; Netzer, F.; Dannenmann, M.; Zhang, S.X.; Rennenberg, H. N-2-fixing black locust intercropping improves ecosystem nutrition at the vulnerable semi-arid Loess Plateau region, China. Sci. Total Environ. 2019, 688, 333–345. [Google Scholar] [CrossRef] [PubMed]
  17. Duru, M.; Cruz, P.; Ansquer, P.; Navas, M.L. Standing herbage mass: An integrated indicator of management practices for examining how fertility and defoliation regime shape the functional structure of species-rich grasslands. Ecol. Indic. 2014, 36, 152–159. [Google Scholar] [CrossRef]
  18. Fanin, N.; Kardol, P.; Farrell, M.; Nilsson, M.-C.; Gundale, M.J.; Wardle, D.A. The ratio of Gram-positive to Gram-negative bacterial PLFA markers as an indicator of carbon availability in organic soils. Soil Biol. Biochem. 2019, 128, 111–114. [Google Scholar] [CrossRef]
  19. Federle, T.W.; Dobbins, D.C.; Thortonmanning, J.R.; Jones, D.D. Microbial biomass, activity, and community structure in subsurface soils. Ground Water 1986, 24, 365–374. [Google Scholar] [CrossRef]
  20. Fierer, N. Embracing the unknown: Disentangling the complexities of the soil microbiome. Nat. Rev. Microbiol. 2017, 15, 579–590. [Google Scholar] [CrossRef] [PubMed]
  21. Fierer, N.; Schimel, J.P.; Holden, P.A. Variations in microbial community composition through two soil depth profiles. Soil Biol. Biochem. 2003, 35, 167–176. [Google Scholar] [CrossRef]
  22. Frostegard, A.; Baath, E. The use of phospholipid fatty acid analysis to estimate bacterial and fungal biomass in soil. Biol. Fert. Soils 1996, 22, 59–65. [Google Scholar] [CrossRef]
  23. Frostegård, A.; Bååth, E.; Tunlid, A. Shifts in the structure of soil microbial communities in limed forests as revealed by PLFA analysis. Soil Biol. Biochem. 1993, 25, 723–730. [Google Scholar] [CrossRef]
  24. Frostegård, A.; Tunlid, A.; Bååth, E. Microbial biomass measured as total lipid phosphate in soils of different organic content. J. Microbiol. Meth. 1991, 14, 151–163. [Google Scholar] [CrossRef]
  25. Fu, X.L.; Yang, F.T.; Wang, J.L.; Di, Y.B.; Dai, X.Q.; Zhang, X.Y.; Wang, H.M. Understory vegetation leads to changes in soil acidity and in microbial communities 27 years after reforestation. Sci. Total Environ. 2015, 502, 280–286. [Google Scholar] [CrossRef] [PubMed]
  26. Hannula, S.E.; Trager, S. Soil fungal guilds as important drivers of the plant richness-productivity relationship. New Phytol. 2020, 226, 947–949. [Google Scholar] [CrossRef] [Green Version]
  27. Hogberg, M.N.; Hogberg, P.; Myrold, D.D. Is microbial community composition in boreal forest soils determined by pH, C-to-N ratio, the trees, or all three? Oecologia 2007, 150, 590–601. [Google Scholar] [CrossRef]
  28. Hyvonen, R.; Persson, T.; Andersson, S.; Olsson, B.; Agren, G.I.; Linder, S. Impact of long-term nitrogen addition on carbon stocks in trees and soils in northern Europe. Biogeochemistry 2008, 89, 121–137. [Google Scholar] [CrossRef]
  29. Jansson, J.K.; Hofmockel, K.S. Soil microbiomes and climate change. Nat. Rev. Microbiol. 2020, 18, 35–46. [Google Scholar] [CrossRef]
  30. Jastrow, J.D.; Amonette, J.E.; Bailey, V.L. Mechanisms controlling soil carbon turnover and their potential application for enhancing carbon sequestration. Clim. Chang. 2007, 80, 5–23. [Google Scholar] [CrossRef]
  31. Jian, S.Q.; Zhao, C.Y.; Fang, S.M.; Yu, K. Effects of different vegetation restoration on soil water storage and water balance in the Chinese Loess Plateau. Agric. For. Meteorol. 2015, 206, 85–96. [Google Scholar] [CrossRef]
  32. Jiao, J.; Zhang, Z.; Bai, W.; Jia, Y.; Wang, N. Assessing the Ecological Success of Restoration by Afforestation on the Chinese Loess Plateau. Restor. Ecol. 2012, 20, 240–249. [Google Scholar] [CrossRef]
  33. Kieft, T.L.; Wilch, E.; Oconnor, K.; Ringelberg, D.B.; White, D.C. Survival and phospholipid fatty acid profiles of surface and subsurface bacteria in natural sediment microcosms. Appl. Environ. Microb. 1997, 63, 1531–1542. [Google Scholar] [CrossRef] [PubMed] [Green Version]
  34. Kou, M.; Garcia-Fayos, P.; Hu, S.; Jiao, J.Y. The effect of Robinia pseudoacacia afforestation on soil and vegetation properties in the Loess Plateau (China): A chronosequence approach. For. Ecol. Manag. 2016, 375, 146–158. [Google Scholar] [CrossRef]
  35. Kramer, C.; Gleixner, G. Soil organic matter in soil depth profiles: Distinct carbon preferences of microbial groups during carbon transformation. Soil Biol. Biochem. 2008, 40, 425–433. [Google Scholar] [CrossRef]
  36. Lauber, C.L.; Strickland, M.S.; Bradford, M.A.; Fierer, N. The influence of soil properties on the structure of bacterial and fungal communities across land-use types. Soil Biol. Biochem. 2008, 40, 2407–2415. [Google Scholar] [CrossRef]
  37. Lazzaro, L.; Mazza, G.; d’Errico, G.; Fabiani, A.; Giuliani, C.; Inghilesi, A.F.; Lagomarsino, A.; Landi, S.; Lastrucci, L.; Pastorelli, R.; et al. How ecosystems change following invasion by Robinia pseudoacacia: Insights from soil chemical properties and soil microbial, nematode, microarthropod and plant communities. Sci. Total Environ. 2018, 622, 1509–1518. [Google Scholar] [CrossRef]
  38. Li, X.G.; Jousset, A.; de Boer, W.; Carrion, V.J.; Zhang, T.L.; Wang, X.X.; Kuramae, E.E. Legacy of land use history determines reprogramming of plant physiology by soil microbiome. ISME J. 2019, 13, 738–751. [Google Scholar] [CrossRef] [Green Version]
  39. Liu, J.; Yang, Z.; Dang, P.; Zhu, H.; Gao, Y.; Ha, V.N.; Zhao, Z. Response of soil microbial community dynamics to Robinia pseudoacacia L. afforestation in the loess plateau: A chronosequence approach. Plant Soil 2017, 423, 327–338. [Google Scholar] [CrossRef]
  40. Liu, Z.S.; Hu, B.; Bell, T.L.; Flemetakis, E.; Rennenberg, H. Significance of mycorrhizal associations for the performance of N-2-fixing Black Locust (Robinia pseudoacacia L.). Soil Biol. Biochem. 2020, 145, 107776. [Google Scholar] [CrossRef]
  41. Macdonald, C.A.; Thomas, N.; Robinson, L.; Tate, K.R.; Ross, D.J.; Dando, J.; Singh, B.K. Physiological, biochemical and molecular responses of the soil microbial community after afforestation of pastures with Pinus radiata. Soil Biol. Biochem. 2009, 41, 1642–1651. [Google Scholar] [CrossRef]
  42. Malcolm, G.M.; Bush, D.S.; Rice, S.K. Soil nitrogen conditions approach preinvasion levels following restoration of nitrogen-fixing black locust (Robinia pseudoacacia) stands in a pine-oak ecosystem. Restor. Ecol. 2008, 16, 70–78. [Google Scholar] [CrossRef]
  43. Mendhama, D.S.; Sankaranb, K.V.; O’Connella, A.M.; Grove, T.S. Eucalyptus globulus harvest residue management effects on soil carbon and microbial biomass at 1 and 5 years after plantation establishment. Soil Biol. Biochem. 2002, 34, 1903–1912. [Google Scholar] [CrossRef]
  44. Moore-Kucera, J.; Dick, R.P. PLFA profiling of microbial community structure and seasonal shifts in soils of a Douglas-fir chronosequence. Microb. Ecol. 2008, 55, 500–511. [Google Scholar] [CrossRef]
  45. OLeary, M.H. Carbon isotopes in photosynthesis. BioScience 1988, 38, 328–336. [Google Scholar] [CrossRef]
  46. Papaioannou, A.; Chatzistathis, T.; Papaioannou, E.; Papadopoulos, G. Robinia pseudoacacia as a valuable invasive species for the restoration of degraded croplands. Catena 2016, 137, 310–317. [Google Scholar] [CrossRef]
  47. Poschner, J.; Kroppenstedt, R.M.; Fischer, A.; Stackebrandt, E. DNA-DNA Reassociation and Chemotaxonomic Studies on Actinomadura, Microbispora, Microtetraspora, Micropolyspora and Nocardiopsis. Syst. Appl. Microbiol. 1985, 6, 264–270. [Google Scholar] [CrossRef]
  48. Priha, O.; Grayston, S.J.; Pennanen, T.; Smolander, A. Microbial activities related to C and N cycling and microbial community structure in the rhizospheres of Pinus sylvestris, Picea abies and Betula pendula seedlings in an organic and mineral soil. FEMS Microbiol. Ecol. 1999, 30, 187–199. [Google Scholar] [CrossRef]
  49. Rousk, J.; Brookes, P.C.; Bååth, E. The microbial PLFA composition as affected by pH in an arable soil. Soil Biol. Biochem. 2010, 42, 516–520. [Google Scholar] [CrossRef]
  50. Shaw, E.A.; Denef, K.; Cotrufo, M.F.; Wall, D.H. Tracing Carbon Flow through the Soil Nematode Food Web: Do Long-Term Burning Practices Affect Carbon Trophic Dynamics in the Tallgrass Prairie? J. Nematol. 2012, 44, 490–491. [Google Scholar]
  51. Shen, J.B.; Yuan, L.X.; Zhang, J.L.; Li, H.G.; Bai, Z.H.; Chen, X.P.; Zhang, W.F.; Zhang, F.S. Phosphorus Dynamics: From Soil to Plant. Plant Physiol. 2011, 156, 997–1005. [Google Scholar] [CrossRef] [Green Version]
  52. Sitzia, T.; Campagnaro, T.; Dainese, M.; Cierjacks, A. Plant species diversity in alien black locust stands: A paired comparison with native stands across a north-Mediterranean range expansion. For. Ecol. Manag. 2012, 285, 85–91. [Google Scholar] [CrossRef]
  53. Six, J.; Frey, S.D.; Thiet, R.K.; Batten, K.M. Bacterial and fungal contributions to carbon sequestration in agroecosystems. Soil Sci. Soc. Am. J. 2006, 70, 555–569. [Google Scholar] [CrossRef]
  54. Spohn, M. Element cycling as driven by stoichiometric homeostasis of soil microorganisms. Basic Appl. Ecol. 2016, 17, 471–478. [Google Scholar] [CrossRef]
  55. Sul, W.J.; Asuming-Brempong, S.; Wang, Q.; Tourlousse, D.M.; Penton, C.R.; Deng, Y.; Rodrigues, J.L.M.; Adiku, S.G.K.; Jones, J.W.; Zhou, J.Z.; et al. Tropical agricultural land management influences on soil microbial communities through its effect on soil organic carbon. Soil Biol. Biochem. 2013, 65, 33–38. [Google Scholar] [CrossRef] [Green Version]
  56. Taniguchi, T.; Kanzaki, N.; Tamai, S.; Yamanaka, N.; Futai, K. Does ectomycorrhizal fungal community structure vary along a Japanese black pine (Pinus thunbergii) to black locust (Robinia pseudoacacia) gradient? New Phytol. 2007, 173, 322–334. [Google Scholar] [CrossRef] [Green Version]
  57. Tateno, R.; Tokuchi, N.; Yamanaka, N.; Du, S.; Otsuki, K.; Shimamura, T.; Xue, Z.D.; Wang, S.Q.; Hou, Q.C. Comparison of litterfall production and leaf litter decomposition between an exotic black locust plantation and an indigenous oak forest near Yan’an on the Loess Plateau, China. For. Ecol. Manag. 2007, 241, 84–90. [Google Scholar] [CrossRef]
  58. Thiet, R.K.; Frey, S.D.; Six, J. Do growth yield efficiencies differ between soil microbial communities differing in fungal: Bacterial ratios? Reality check and methodological issues. Soil Biol. Biochem. 2006, 38, 837–844. [Google Scholar] [CrossRef]
  59. Uselman, S.M.; Qualls, R.G.; Thomas, R.B. A test of a potential short cut in the nitrogen cycle: The role of exudation of symbiotically fixed nitrogen from the roots of a N-fixing tree and the effects of increased atmospheric CO2 and temperature. Plant Soil 1999, 210, 21–32. [Google Scholar] [CrossRef]
  60. Van der Heijen, M.G.A. The unseen majority: Soil microbes as drivers of plant diversity and productivity in terrestrial ecosystems. Ecol. Lett. 2008, 11, 296–310. [Google Scholar] [CrossRef]
  61. Vasquez-Dean, J.; Maza, F.; Morel, I.; Pulgar, R.; Gonzalez, M. Microbial communities from arid environments on a global scale. A systematic review. Biol. Res. 2020, 53, 1–12. [Google Scholar] [CrossRef]
  62. Vitkova, M.; Muellerova, J.; Sadlo, J.; Pergl, J.; Pysek, P. Black locust (Robinia pseudoacacia) beloved and despised: A story of an invasive tree in Central Europe. For. Ecol. Manag. 2017, 384, 287–302. [Google Scholar] [CrossRef] [PubMed]
  63. Vitkova, M.; Tonika, J.; Mullerova, J. Black locust-Successful invader of a wide range of soil conditions. Sci. Total Environ. 2015, 505, 315–328. [Google Scholar] [CrossRef]
  64. Wang, B.; Liu, G.B.; Xue, S. Effect of black locust (Robinia pseudoacacia) on soil chemical and microbiological properties in the eroded hilly area of China’s Loess Plateau. Environ. Earth Sci. 2012, 65, 597–607. [Google Scholar] [CrossRef]
  65. Williard, K.W.J.; Dewalle, D.R.; Edwards, P.J. Influence of bedrock geology and tree species composition on stream nitrate concentrations in mid-Appalachian forested watersheds. Water Air Soil Pollut. 2005, 160, 55–76. [Google Scholar] [CrossRef]
  66. Wu, X.; Xu, H.; Tuo, D.F.; Wang, C.; Fu, B.J.; Lv, Y.H.; Liu, G.H. Land use change and stand age regulate soil respiration by influencing soil substrate supply and microbial community. Geoderma 2020, 359, 113991. [Google Scholar] [CrossRef]
  67. Wu, Y.P.; Ma, B.; Zhou, L.; Wang, H.Z.; Xu, J.M.; Kemmitt, S.; Brookes, P.C. Changes in the soil microbial community structure with latitude in eastern China, based on phospholipid fatty acid analysis. Appl. Soil Ecol. 2009, 43, 234–240. [Google Scholar] [CrossRef]
  68. Xu, X.F.; Schimel, J.P.; Janssens, I.A.; Song, X.; Song, C.C.; Yu, G.R.; Sinsabaugh, R.L.; Tang, D.D.; Zhang, X.C.; Thornton, P.E. Global pattern and controls of soil microbial metabolic quotient. Ecol. Monogr. 2017, 87, 429–441. [Google Scholar] [CrossRef] [Green Version]
  69. Yang, Y.; Cheng, H.; Dou, Y.X.; An, S.S. Plant and soil traits driving soil fungal community due to tree plantation on the Loess Plateau. Sci. Total Environ. 2020, 708, 134560. [Google Scholar] [CrossRef]
  70. Zechmeister-Boltenstern, S.; Keiblinger, K.M.; Mooshammer, M.; Penuelas, J.; Richter, A.; Sardans, J.; Wanek, W. The application of ecological stoichiometry to plant-microbial-soil organic matter transformations. Ecol. Monogr. 2015, 85, 133–155. [Google Scholar] [CrossRef] [Green Version]
  71. Zhang, R.; Bai, Y.F.; Zhang, T.; Henkin, Z.; Degen, A.A.; Jia, T.H.; Guo, C.C.; Long, R.J.; Shang, Z.H. Driving Factors That Reduce Soil Carbon, Sugar, and Microbial Biomass in Degraded Alpine Grasslands. Rangel. Ecol. Manag. 2019, 72, 396–404. [Google Scholar] [CrossRef]
Figure 1. Soil PLFA content profiles of Robinia pseudoacacia plantations of different ages. Ten individual PLFAs with relatively high levels in the 1-m soil profile were selected, and all of them were abundant at all sites.
Sustainability 12 09161 g001
Figure 2. Distribution of different PLFAs at different soil depths in Robinia pseudoacacia plantations of different ages. Error bars show standard errors (n = 4).
Sustainability 12 09161 g002
Figure 3. Microbial PLFA contents at different soil depths in Robinia pseudoacacia plantations of different ages and FL. (a) The variation of total PLFA contents with soil depth; (b) The variation of bacterial PLFA contents with soil depth; (c) The variation of fungi PLFA contents with soil depth; (d) The variation of actinomycete PLFA contents with soil depth; (e) The variation of Gram-negative bacteria PLFA contents with soil depth; (f) The variation of Gram-positive bacteria PLFA contents with soil depth. Error bars show standard errors (n = 4). Significant differences (p < 0.05) among stand ages, when present, are indicated by different letters, the effects of soil depth were significant for all forest stands.
Sustainability 12 09161 g003
Figure 4. Ratios among different microbial PLFAs in the soil of Robinia pseudoacacia plantations of different ages. (a) The variation of F/B with plantation age; (b) The variation of G+/G with plantation age; (c) The variation of cy/pre with plantation age; (d) The variation of sat/mono with plantation age; Noticeable differences (p < 0.05) among treatments are shown by different letters. Error bars show standard errors (n = 4).
Sustainability 12 09161 g004
Figure 5. Redundancy analysis (RDA) results of PLFA profiles in the soil samples and environmental variables. PLFA profiles and environmental variables are indicated by dashed arrows: bacterial PLFAs (B); Gram-positive bacterial PLFAs (G+); Gram-negative bacterial PLFAs (G); fungal PLFAs (F); actinomycetes PLFAs (A); saturated PLFAs (sat); monosaturated PLFAs (mono); cyclopropyl PLFAs (cy); precursor PLFAs (pre), environmental variables by solid arrows: total soil organic carbon (SOC); total soil nitrogen (TN); ammonia nitrogen (NH4+-N); nitrate nitrogen (NO3-N); total soil phosphorus (TP); available soil phosphorus (AP); soil moisture (SM); bulk density (BD); C/N, the ratio of soil organic carbon to soil total nitrogen.
Sustainability 12 09161 g005
Table 1. Location and aboveground characteristics of the Robinia pseudoacacia plantations.
Forest Age (a)SlopeAltitude (m)Density (pl hm−2)Height (m)Diameter at Breast Height (cm)Undergrowth VegetationVegetation Coverage (%)
0 (FL a)N bE74°1205NA cNANANANA
10E20°127616006.9 ± 0.46.4 ± 0.5Thalictrum aquilegiifolium, Clematis ochotensis, Lespedeza davurica, Periploca sepium55
15W18°133828007.3 ± 0.26.9 ± 0.3Stipa bungeana, Clematis ochotensis, Melica scabrosa, Artemisia sacrorum, Artemisia capillaris, Periploca sepium65
25SW16°135215009.8 ± 0.915.3 ± 1.6Melica scabrosa, Stipa bungeana, Potentilla bifurca, Artemisia indica, Rosa xanthina, Ostryopsis davidiana, Syringa oblate, Cotinus coggygria85
40W18°1342130010.7 ± 0.317.3 ± 0.2Heteropappus altaicus, Stipa bungeana, Artemisia indica, Buxus sinica, Cotoneaster acuminatus, Rosa hugonis, Lonicera hispida80
a: FL represents farmland. b: S: south, E: east, W: west, N: north. c: NA: not applicable. The scientific names of plant species need present in italics.
Table 2. PLFA biomarkers for calculating soil microbial biomass.
Microbe TypePLFA BiomarkerReference
Bacteriaa14:0, i14:0, i15:0, a15:0, a16:0, i16:0, 16:1ω7c, 16:1ω9c, i17:0, a17:0, cy17:0, 17:1ω9c, i18:0, a18:0, 18:1ω5c, 18:1ω7c, 18:1ω9c, cy19:0, i22:0[28]
Actinomycetes10Me16:0, 10Me17:1ω7c, 10Me18:1ω7c, 10Me18:0, 10Me20:0[29]
Gram-positivei14:0, i15:0, a15:0, i16:0, a16:0, i17:0, a17:0, i18:0, i22:0[30]
Gram-negative16:1ω7c, 16:1ω9c, 17:1ω9c, 18:1ω5c, 18:1ω7c, 18:1ω9c, cy17:0, cy19:0[30]
Fungi18:2ω6c, 18:2ω9c[28,31]
Saturated PLFAs12:0, 13:0, 14:0, 15:0, 16:0, 17:0, 18:0, 20:0[32]
Monosaturated PLFAsi16:1, 16:1ω11c, 16:1ω7c, 16:1ω5c, 17:1ω9c, a17:1, 17:1ω8c, 18:1ω9c, 18:1ω7c, 18:1ω5c, 11Me18:1ω7c[32]
Cyclopropyl PLFAscy17:0, cy19:0[33]
Precursor PLFAs16:1ω7c, 18:1ω7c[33]
Table 3. Physiochemical properties in soils of Robinia pseudoacacia plantations of different ages and at different depths (means ± standard error).
Depth (cm)Forest StandpHMoisture (%)Bulk Density (g.cm−3)SOC d (g.kg−1)TN (g.kg−1)NO3-N (mg.kg−1)NH4+-N (mg.kg−1)TP (g.kg−1)AP (mg.kg−1)C/N
0–10FL8.63 ± 0.05ns11.8 ± 0.85 b1.31 ± 0.05ns7.81 ± 0.31 c0.61 ± 0.02 c6.83 ± 0.04 a3.75 ± 0.44 a0.77 ± 0.01ns5.97 ± 0.52 a10.53 ± 0.47 a
Y10 a8.75 ± 0.05 bns10.79 ± 0.60 b,c1.16 ± 0.09ns5.94 ± 0.48 c0.75 ± 0.15 c2.21 ± 0.40 b0.52 ± 0.09 b0.53 ± 0.11ns2.27 ± 0.72 b,c9.18 ± 0.65 c
Y158.60 ± 0.06ns14.15 ± 1.40 a1.09 ± 0.09ns6.89 ± 0.24 c0.67 ± 0.13 c1.47 ± 0.51 b0.52 ± 0.18 b0.66 ± 0.20ns2.04 ± 0.78 c9.02 ± 0.10 c
Y258.52 ± 0.06ns10.05 ± 1.12 b1.29 ± 0.10ns13.86 ± 0.35 b1.27 ± 0.32 b1.92 ± 1.28 b0.72 ± 0.18 b0.61 ± 0.02ns3.88 ± 0.85 a,b9.30 ± 0.25 c
Y408.49 ± 0.14ns9.57 ± 0.53 b1.21 ± 0.11ns19.14 ± 0.17 a1.96 ± 0.43 a2.99 ± 1.41 b0.91 ± 0.11 b0.65 ± 0.03ns5.07 ± 0.89 a9.58 ± 0.15 b
10–20FL8.76 ± 0.06ns12.13 ± 0.63 b1.25 ± 0.03ns4.52 ± 0.17 b0.41 ± 0.03 b3.64 ± 0.02 a2.81 ± 0.33 a0.68 ± 0.01ns5.92 ± 0.04 a9.64 ± 0.40 a
Y108.74 ± 0.01ns11.72 ± 1.07 b1.19 ± 0.06ns3.93 ± 0.27 b0.50 ± 0.09 b1.18 ± 0.46 b0.39 ± 0.15 b0.50 ± 0.11ns2.32 ± 0.38 a,b7.12 ± 0.48 c
Y158.73 ± 0.02ns14.23 ± 0.80 a1.21 ± 0.09ns4.24 ± 0.23 b0.62 ± 0.13 b1.24 ± 0.42 b0.35 ± 0.03 b0.57 ± 0.02ns1.47 ± 0.15 b5.59 ± 0.53 d
Y258.71 ± 0.03ns10.03 ± 0.90 bc1.23 ± 0.04ns6.16 ± 0.13 a0.67 ± 0.10 a,b1.17 ± 0.66 b0.60 ± 0.13 b0.57 ± 0.01ns1.68 ± 0.26 b8.26 ± 0.28 b
Y408.67 ± 0.04ns9.75 ± 0.17 c1.11 ± 0.11ns6.85 ± 1.19 a0.95 ± 0.28 a1.37 ± 0.75 b0.60 ± 0.09 b0.59 ± 0.01ns4.84 ± 0.92 a8.93 ± 0.24 b
20–30FL8.79 ± 0.04ns12.85 ± 0.91 a1.27 ± 0.01 a2.92 ± 0.71 b0.34 ± 0.03 a,b2.50 ± 0.01 a1.02 ± 0.12 a0.57 ± 0.01ns2.60 ± 0.01 a7.67 ± 2.08 b
Y108.72 ± 0.01ns11.95 ± 0.79 a1.28 ± 0.04 a3.80 ± 0.62 a0.42 ± 0.06 b0.81 ± 0.42 b0.41 ± 0.16 b0.53 ± 0.06ns1.00 ± 0.06 a,b8.96 ± 0.35 a
Y158.73 ± 0.02ns12.30 ± 0.94 a1.25 ± 0.04 a,b2.68 ± 0.44 b0.34 ± 0.06 a,b0.50 ± 0.14 b0.37 ± 0.10 b0.55 ± 0.02ns0.57 ± 0.20 b7.97 ± 0.09 b
Y258.84 ± 0.03ns9.58 ± 0.95 b1.15 ± 0.05 b,c3.65 ± 0.80 a0.44 ± 0.05 a,b0.30 ± 0.02 b0.42 ± 0.02 b0.55 ± 0.02ns0.94 ± 0.08 b7.72 ± 0.80 b
Y408.69 ± 0.11ns9.08 ± 0.35 b1.13 ± 0.02 c3.77 ± 0.61 a0.59 ± 0.21 a0.72 ± 0.53 b0.45 ± 0.04 b0.56 ± 0.03ns2.12 ± 0.13 a8.47 ± 0.13 a,b
30–40FL8.68 ± 0.11ns13.10 ± 0.45 a1.25 ± 0.05ns1.62 ± 0.76 c0.29 ± 0.01 b,c1.17 ± 0.01 a0.62 ± 0.07 a0.56 ± 0.01ns0.70 ± 0.01 a10.07 ± 2.63 a
Y108.68 ± 0.01ns12.47 ± 0.58 a1.30 ± 0.15ns3.35 ± 0.18 a0.36 ± 0.03 a0.38 ± 0.09 b0.35 ± 0.15 c0.53 ± 0.05ns0.40 ± 0.23 a9.34 ± 0.18 b
Y158.76 ± 0.04ns11.33 ± 0.85 a,b1.28 ± 0.05ns2.32 ± 0.19 b0.28 ± 0.02 c0.32 ± 0.06 b0.32 ± 0.12 c0.54 ± 0.01ns0.62 ± 0.15 a8.72 ± 0.21 c
Y258.84 ± 0.09ns9.94 ± 1.28 b,c1.24 ± 0.01ns2.85 ± 0.37 b0.31 ± 0.05 a,b0.17 ± 0.75 b0.36 ± 0.08 c0.55 ± 0.03ns0.56 ± 0.06 a8.58 ± 0.46 c
Y408.79 ± 0.03ns9.24 ± 0.18 c1.23 ± 0.06ns3.24 ± 0.42 a0.39 ± 0.06 a0.57 ± 0.48 b0.47 ± 0.11 b0.56 ± 0.03ns0.57 ± 0.18 a8.32 ± 0.07 c
0–40FL8.72 ± 0.10ns12.47 ± 0.71 a1.27 ± 0.05ns4.22 ± 2.68 c0.41 ± 0.14 c3.54 ± 2.42 a2.05 ± 1.48 a0.64 ± 0.01 a3.80 ± 2.60 a9.48 ± 1.26 a
Y108.72 ± 0.02ns11.73 ± 0.66 a1.14 ± 0.22ns4.12 ± 0.04 c0.45 ± 0.01 c1.33 ± 0.12 b0.50 ± 0.05 b0.52 ± 0.06 b1.50 ± 0.68 b8.57 ± 0.44 a,b
Y158.71 ± 0.04ns13.03 ± 0.99 a1.21 ± 0.05ns3.94 ± 0.12 c0.48 ± 0.03 c0.88 ± 0.10 b0.45 ± 0.02 b0.58 ± 0.05 a b1.22 ± 0.21 b7.88 ± 0.55 b
Y258.73 ± 0.06ns9.44 ± 0.57 b1.23 ± 0.04ns6.59 ± 0.14 b0.67 ± 0.02 b1.09 ± 0.18 b0.53 ± 0.02 b0.57 ± 0.01 a b1.77 ± 0.55 b8.65 ± 0.20 a,b
Y408.66 ± 0.08ns9.41 ± 0.11 b1.17 ± 0.01ns7.37 ± 0.67 a0.97 ± 0.26 a0.88 ± 0.24 b0.61 ± 0.08 b0.59 ± 0.02 a3.76 ± 0.77 a9.13 ± 0.12 a
a: Y10, Y15, Y25, and Y40 represent 10-year-old, 15-year-old, 25-year-old and 40-year-old R. pseudoacacia plantations, respectively. FL represents farmland. b: Values are means ± standard errors for each sampling plot (n = 4). c: Different letters in the same column suggest a notable difference at p < 0.05; ns indicates no noticeable difference among treatments according to one-way ANOVA. d: SOC, total soil organic carbon; TN, total soil nitrogen; ammonia nitrogen (NH4+-N); nitrate nitrogen (NO3--N); TP, total soil phosphorus; AP, available soil phosphorus; C/N, the ratio of soil organic carbon to soil total nitrogen.
Table 4. Simple term effects and forward selection of environmental variables based on Monte Carlo permutation tests from the redundancy analysis (RDA).
VariableSimple Term EffectsForward Selection Results
Explains (%)PExplains (%)P
TN30.60.00230.60.002
SOC26.60.002//
pH16.60.002//
TP5.10.024.10.006
AP4.80.006//
NH4+-N3.10.062//
NO3-N2.80.0743.40.01
SM2.70.094//
C/N1.90.18//
BD1.30.336//
SOC: soil organic carbon; TN: total nitrogen; TP: total phosphorous; NO3-N: nitrate nitrogen, NH4+-N: ammonium nitrogen, AP: available phosphorous, SM: soil moisture, BD: bulk density.
Publisher’s Note: MDPI stays neutral with regard to jurisdictional claims in published maps and institutional affiliations.

