Article

Following a Step by Step Development of a Resilience Action Plan

by
Maria Adriana Cardoso
1,*,
Maria João Telhado
2,
Maria do Céu Almeida
1,
Rita Salgado Brito
1,
Cristina Pereira
1,
João Barreiro
3 and
Marco Morais
2
1
Urban Water Unit, National Civil Engineering Laboratory, LNEC, Av. Brasil 101, 1700-066 Lisbon, Portugal
2
Lisbon City Council, Câmara Municipal de Lisboa, CML, Praça José Queirós, n.°1–3° piso—Fração 5, 1800-237 Lisbon, Portugal
3
CERIS, Instituto Superior Técnico, University of Lisbon, Av. Rovisco Pais, 1049-001 Lisboa, Portugal
*
Author to whom correspondence should be addressed.
Sustainability 2020, 12(21), 9017; https://doi.org/10.3390/su12219017
Submission received: 5 October 2020 / Revised: 22 October 2020 / Accepted: 23 October 2020 / Published: 30 October 2020
(This article belongs to the Special Issue Urban Resilience in a Context of Climate Change)

Abstract

:
According to the United Nations, by 2030, 60% of the world’s population will live in cities, and 70% by 2050. Both consolidated and fast urbanizing areas face diverse acute shocks from natural disasters and long-term stresses, such as the effects of climate change. Therefore, there is a need for cities to implement plans for increasing resilience and improving preparedness to cope with both acute shocks and long-term stresses. Development of resilience action plans (RAP) constitutes an important process for the cities to plan their resilience enhancement in the long, medium, and short terms. These are key tools for the city, considering the associated complexity, uncertainties, data scarcity, interdependencies among urban services provided in the city, as well as involved stakeholders. Herein, a framework is presented to support city resilience action planning related to climate change through a multisector approach. The framework was applied step by step to three cities—Barcelona, Bristol, and Lisbon—and their RAPs to climate change provide roadmaps for resilience, having the urban water cycle as the core. In these plans, urban services are included, given their interactions and contributions to city’s resilience. Addressed services are water supply, wastewater, storm water, waste, electric energy, and mobility.

1. Introduction

Integrated urban planning and development processes, involving representatives of core areas, of government (local, regional, national) and of interested parties (businesses, civil society organizations, academia, among others) is understood as essential to support progress towards more sustainable and resilient cities [1]. According to the United Nations, by 2030, 60% of the world’s population will live in cities, with estimations of 70% by 2050 [2]. Both consolidated and fast urbanizing areas are facing a variety of acute shocks derived from natural disasters and long-term stresses, such as the effects of climate change (CC) [3]. Projections show that one billion urban residents will be living in low-elevation coastal zones and, consequently at risk of flooding and natural hazards related to climate change [2]. Therefore, there is a need for cities to implement plans for increasing resilience and improving preparedness to cope with both acute shocks and long-term stresses [3].
Planning for resilience in urban areas is an enormous endeavor. Complexity, uncertainties, timescales, spatial scales, and data scarcity are just a few words associated with this subject area. In Sharifi (2019) [4], relevant key questions are enumerated: “resilience (…) of what? Resilience to what? Resilience for what purpose? And resilience during what stage of disaster risk management?” Along the same lines, Meerow et al. (2016) [5] propose adopting conceptual clarity by clearly setting boundaries when applying resilience acknowledging the context by specifying clearly “resilience for whom and to what? When? Where? And why?” Furthermore, resilience assessment within cities requires evaluation of vulnerable services and understanding of how services interact [6,7]. Successful planning must incorporate decision-making and actions both at strategic and the local level. The local level is the closest to the people and local governments are in the best position to apply polices with direct influence on individual communities, through strategies for adaptation that meet the city needs, considering their specific conditions and impacts [8,9].
Since planning for resilience incorporates the characteristics of strategic planning, according to Weihrich (1982) [10] it conceptually analyzes the current and expected future situation, determines the direction where the cities will to achieve and develop the means for achievement. It is a highly complex process demanding a systematic approach for identifying and analyzing factors external to the city and matching them with the city’s strengths [10]. The same author presents an overview of strategic planning and various alternatives for formulating a strategy.
Desouza and Flanery (2013) [6] refer that planning for resilience to the impacts of stressors within cities requires an evaluation of the vulnerable components of cities, an understanding of the key processes, procedures, and interactions of these components, and addressing various components and their interactions to achieve resilience. They propose a framework providing a more holistic approach that includes planning for resilience by including an evaluation of cultural and process dynamics within cities as well as their physical elements. It is based in over 20 case studies on how cities have been impacted due to external or internal shocks and how these cities exhibited resilience or suffered devastating outcomes.
In urban areas, plans for resilience to climate change demand up-to-date and area-wide information on the characteristics and development of the urban system, both regionally and locally [11]. Good city planning practices are, by their nature, also climate smart planning practices. This is because most climate change planning actions are consistent with planners’ responsibilities, including actions such as [12]: minimizing risk and improving land development activities that occur in or near flood, slope, or coastal hazard areas; the improvement of infrastructures for storm water management, waste management, access to safe drinking water, and the movement of goods and people; the protection of ecosystems and environmentally sensitive areas in and around towns and cities and the improvement of disaster risk reduction (particularly weather and climate-related events).
To help integrate climate change planning into current planning and urban development initiatives, and make it easier for urban planners to take action on climate change, UNHabitat (2014) [12] has developed a four step strategic planning approach that incorporates innovative decision-making tools with a participatory and local values-based methodology. Each step addresses one of the following questions “What is happening?”, “What matters most?”, “What can we do about it?” and “are we doing it?” More recently, UNHabitat (2015) [13] further defined that city climate action planning should be ambitious, inclusive, fair, comprehensive and integrated, relevant, actionable, evident-based, and transparent and verifiable. Besides, it should be flexible, dynamic, and iterative. Labaka et al. (2019) [3] describe the state of the art on city resilience frameworks and city resilience dimensions, including incorporating resilience characteristics and priorities into practical or operationalized implementation. The same authors present the Smart Mature Resilience Maturity consisting of a sequence of stages for city’s self-assessment of their resilience level and resilience building policies to be implemented by city’s order promoting their overall resilience level.
The diverse methodologies have in common the acknowledgment of the relevance of stakeholder engagement, vision, and pathway development, as well as adaptiveness by learning how to manage uncertainties [14,15].
Having an action plan put it in place and following a process with steps to improve resilience before a hazardous event strikes increases the ability of a city to face and overcome extreme events, future disasters, to recover quickly, and to potentially reduce the impacts in a way that better prepares for future events, bringing stakeholders together and incorporating resilience into their short- and long-term planning [16]. As most of the cities face financial restrictions, implementation of selected resilience strategies or measures must be prioritized. This process will enable cities to improve their resilience over time in a cost effective way, consistent with their development goals, thus strengthening resilience and improving a city’s ability to continue or timely restore vital services, building back better after damaging events [16].
The aim of this paper is to approach city resilience with focus on water providing a framework to support city resilience assessment, planning, and management related to climate change through a multisector approach. Resilience with focus on water gains from adopting the scope of management of urban water systems and, in parallel, consider interdependencies with other city functions or sectors. The result of the application of the framework is a resilience action plan (RAP) for the city considering the involvement of the relevant stakeholders.

2. Methodology

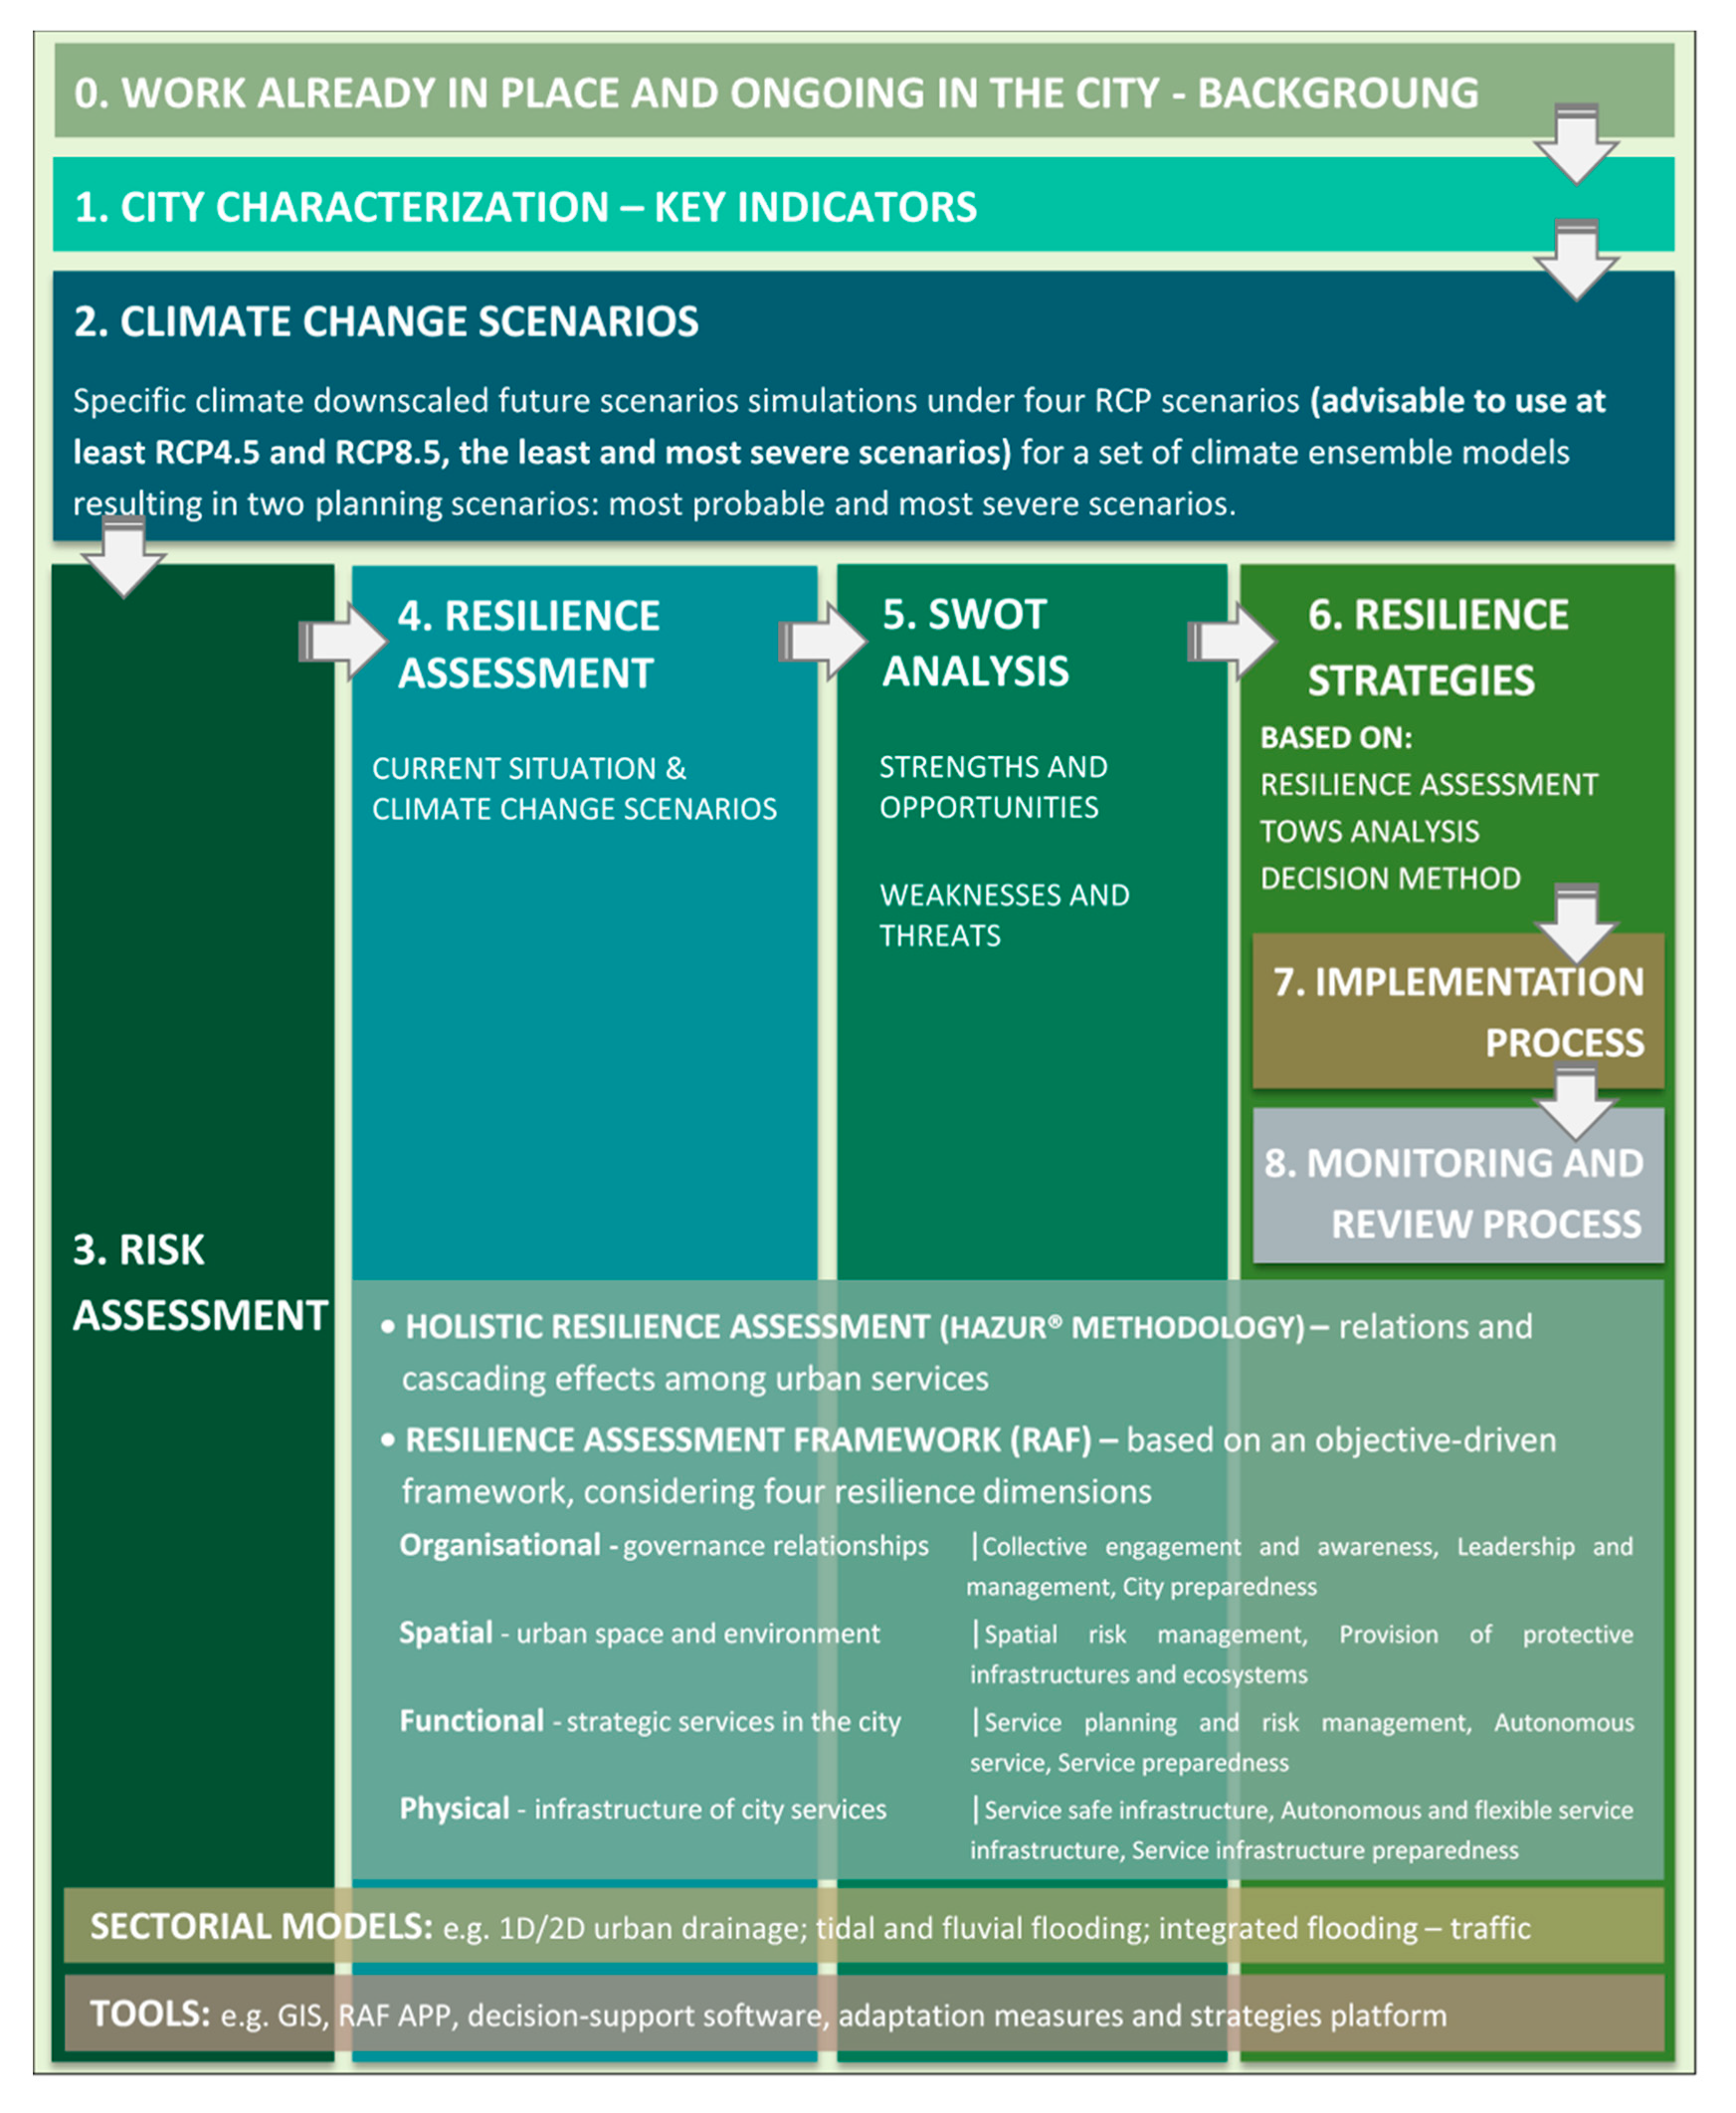
2.1. Planning Process

The planning process, presented in the Figure 1, was defined in this research to provide a roadmap for the development of a city resilience action plan [17]. The most relevant steps are indicated and the methods and tools used need to be clearly identified. The process allows accounting for the work and background already existing in many cities. It is based on the establishment planning scenarios considering climate change, characterization of the city context and hazards, risk and resilience assessments, as well as on the development of strategies that need to be implemented to enhance the resilience of the city to climate change with focus on water.
In Step 0, the RAP needs to recall the work already in place and ongoing in the city and keep the possible alignment, regarding existing background on information and knowledge, strategies, measures or other related plans already implemented, such as City Master Plan or Emergency and Contingency city plans.
It is fundamental to understand each city context, the involved stakeholders, interdependencies between the urban services, and to identify the hazards that threaten the city, focusing on the plan scope, focus, and time horizon. Therefore, Step 1 provides a profile of the city and urban services characterization, including geographical characterization, climate, built and natural environment and infrastructure, existing climate-related hazards in the city, historical relevant events, and the players and stakeholders involved. The characterization of urban services is also detailed.
In Step 2, the hazards to plan for are defined and a characterization of the related climate change scenarios (e.g., RCP4.5, RCP8.5, two Representative Concentration Pathways) for the city is carried out [18,19,20]. Based on this, planning scenarios are established for the hazard variables at the urban spatial and temporal scale, for the city and for the services. A planning scenario corresponds to a hazard condition, described by the characterization of its trigger variables by experts, for comprehensive assessment of the severity, probability of occurrence, and its total impact. As a minimum, cities would ideally define two planning scenarios. The Most Probable relates to a hazardous event that causes disruption, assessed by experts to be the most likely to occur. The Most Severe relates to a hazardous event that causes greater disruption, assessed by experts to be the worst case to plan for (based on [21]).
In Step 3, the risk assessment for the city is addressed, identifying the approach and sectorial models used in the city (2.2). Exposure, vulnerability, and impacts of each urban service are characterized, as are the cascading impacts between different urban services and the effects of multiple hazards in the city, with production of the respective hazard maps.
In Step 4, the resilience assessment of the city is carried out through a structured and objective-driven assessment framework (2.3), both for the current situation and regarding the defined planning scenarios. It is based on the work already existing in the cities and on the previous risk assessment results for the identified hazards and hazardous events, considering the cascading effects.
In Step 5, the diagnosis is undertaken including the integration of the resilience assessment results provided by all sources of analysis (2.4). A SWOT analysis (Strengths, Weakness, Opportunities, and Threats) summarizes this information by identifying the city’s and the service’s internal strengths and weaknesses, as well as the external opportunities and main threats [22].
In Step 6, the identification of strategies (2.5) that reduce the identified city’s threats, overcome weaknesses, and exploit strengths and opportunities was supported by a TOWS analysis [10] (TOWS identifies the strategies that reduce Threats take advantage of the Opportunities, overcome Weaknesses and exploit Strengths), based on information from Step 5. A decision method is then used to support decisions on the measures to consider in the plan. It is fundamental to describe the strategies including their type (e.g., protective infrastructures, citizens and stakeholders, modelling studies, etc.), hazards and climate variables addressed, responsibilities, players, and services involved, costs, resilience measures included, economic, social and environmental co-benefits, implementation time-line, and other relevant information.
A risk assessment is carried out to evaluate the effect of the strategy’s implementation, for the current situation and for planning scenarios, and an identification of the main impacts on the resilience objectives assessed is undertaken. Prioritization of strategies is then established following the prioritization method adopted by the city that needs to be identified in the plan.
Step 7 defines the implementation process resulting from the prioritization of strategies, considering also the available time for their implementation (2.5).
To continuously ensure the city resilience considering the city’s dynamics, the RAP monitoring and review is a crucial step. In order to trace the resilience progress from the implementation of resilience strategies and to identify the gaps and early deviations that may require corrective action, the resilience plan of each city will be monitored and reviewed with a given periodicity. In Step 8, the stages for the RAP monitoring and review are acknowledged and scheduled, identifying the periodicity, responsibility, and activities needed (2.5). It is fundamental to be aware that this planning process is to be a continuous process.

2.2. Risk Assessment

In the risk assessment step, the exposure and vulnerability of the city to the identified hazards is presented. These may be determined based on historical data, modelling, and on spatial analysis. A thorough characterization of the urban services and of their relations with climate related hazards is required, both for current and future scenarios. Risk-related maps for each urban service (hazard, exposure, vulnerability, and risk maps) may be obtained by detailed GIS (Geographic Information System) analysis and modelling of systems behavior (using a wide range of models and tools e.g., SWMM, EPANET, BASEMENT, SUMO). The effects of multiple hazards and of cascading effects between services are very relevant and should also be studied. The application of sectorial models enables the identification with detail of the areas (of the city or the infrastructure in each service) with major challenges due to climate change.
The knowledge of the behavior of the urban systems during extreme climate events in a detailed scale represents a key step of the whole process of the planning process and of the city resilience assessment. In this context, the use of detailed models and tools is essential to analyze the behavior and the response of critical services and infrastructures with respect to specific pressures and drivers related to climate change. They provide temporal and spatial information. Moreover, the outputs of these sectorial models can be used to assess hazard, vulnerability, and risk levels for current and future scenarios [23]. This process requires information, data, technical background, and learned lessons from past experiences, shared among technicians, utility, and city managers in order to focus and improve the analysis. Additionally, a detailed knowledge of each urban service, interdependencies between them, and cascade effects due to failures or extreme climate events is considered in this assessment stage.

2.3. Resilience Assessment

The resilience assessment allows knowing where the city and the urban services stand today, giving support decision on the strategy making, actions, and measures. This will support planning in the long, medium, and short terms, regarding resilience to climate change, and to identify the most critical aspects to be improved, taking into account both the reference situation and the expected impacts of planning scenarios.
It is important to look at the city as a whole and analyze the relations, interdependencies, and cascading effects among critical infrastructures, services, and players during crisis events, with a special focus on the recovery of the normal functioning of the city, services, and infrastructures. For an overall and detailed assessment of the city resilience, the RESCCUE (Resilience to Cope with Climate Change in Urban Areas) resilience assessment framework (RAF) [24,25] is used to provide an objective driven diagnosis of the organizational, spatial, functional, and physical resilience of the city and services.
The objectives considered to assess resilience to climate change in the three cities, including the urban services and their infrastructures are to achieve [24]: city collective engagement and awareness of citizens and communities (O.1), leadership and management (O.2), preparedness for basic conditions, climate change, disaster response and recovery and build back (O.3), for the organizational dimension of the city; spatial risk management (S.1) and provision of protective infrastructure and ecosystems (S.2), for the spatial dimension of the city; services planning and risk management (F.1), autonomy (F.2) and preparedness for climate change, disaster response, and recovery and build back (F.3), for the functional dimension of the city; and safe (P.1), autonomous and flexible (P.2) as well as prepared infrastructures (P.3), for the physical dimension of the city.
The objectives are assessed using metrics. For each RAF metric, the classification is made by associating each answer to a resilience development level classified as incipient (for results that are still non-existent or are at an early stage of development), progressing (for situations where significant steps have already been taken and the city or the service are still developing the specific aspect addressed by the metric), or advanced (for already consolidated results) [24]. The structure used in the RAF allows getting information on the development level for a given objective or, more aggregately, for a given service, resilience dimension, or city.

2.4. SWOT Analysis

The SWOT analysis is a widely used technique for strategic evaluation of the internal and external contexts of an organization [22]. This is a tool for diagnosis allowing integrating all the main issues coming from the different assessments and from the analysis of the context.
The clear identification of the Strengths, Weaknesses, Opportunities, and Threats (SWOT) complements the diagnosis provided by the resilience assessment. It also allows to consider aspects that need improvement, additional to those detected in data collection, models development, cascading and interdependencies analysis that may have not be highlighted in the assessment.
The strengths and weaknesses are the internal aspects of the organization/service/city, which have to manage, change, or improve them.
The opportunities and threats are features external to the organization, which has to handle them, adapt to them, take advantage of them, but they cannot be changed by the organization.
It is fundamental that the SWOT analysis effectively identifies the most relevant problems, preventing the accomplishment of the resilience objectives, and the major opportunities. The identification of this aspects will support the identification of the strategies that will then contribute to improve the resilience objectives developed for the city assessment.
The integration of the resilience assessment results provided by all sources of analysis allows the development of a SWOT analysis, supporting the identification of resilience measures and strategies, to be implemented in the city and services [17].

2.5. Strategies Development and Implementation, Monitoring and Review Processes

2.5.1. Identification of Strategies

There are several approaches and tools to identify strategies coming from the assessment. Since the SWOT analysis was undertaken to integrate the resilience assessment, it facilitates the use of a TOWS analysis [10].
TOWS analysis supports the identification of ways forward. TOWS matches internal factors to external factors, and identifies the strategies that take advantage of the opportunities, reduce threats, overcome weaknesses, and exploit strengths. It allows to concentrate attention in the areas where action is required, providing some indication of the nature of that action, thus supporting identification, generation, comparison, and selection of strategies.
The actions can be grouped regarding the addressed hazards (e.g., flooding, cold waves), the typology of strategies (e.g., data and information, infrastructure construction) or the addressed resilience objectives (e.g., leadership, flexible water service), among other solutions.
Considering all aspects and actions needed identified, a decision method is then used to support the decision on the measures to adopt in order to define the strategies to develop in the plan. The decision can be supported by resources constraints or by the impact of strategies in city resilience being minor than other strategies. Therefore, it is essential to assess the impact of the identified strategies.
Each strategy needs to be briefly described in order to facilitate communication and involvement, particularly regarding the following aspects [17,26,27]:
-
Typology: considering groups of strategies of the same type, such as “Citizens and stakeholders or infrastructural construction and rehabilitation”;
-
TOWS perspective: the combination addressed in the SWOT that supported the strategy definition, e.g., WT strategy, combines identified Weaknesses and Threats;
-
Implementation: describing whether the strategy is in progress or is still planned for the future;
-
Timeline: the horizon or period for implementation;
-
Hazards and climate variables: variables that are addressed in the strategy;
-
Institution, players and services: all stakeholders involved in the implementation;
-
Cost: the financial effort needed or cost range for the strategy;
-
Measures: the set of resilience measures needed to implement the strategy;
-
Co-benefits: benefits of the strategy that are not directly obtained, regarding diverse aspects within economic, social, and environmental categories. They may have a relevant or slight contribution to these aspects and can be immediate or require additional time for them to be evident. Economic co-benefits include aspects such cost savings, job creation, and property values; social co-benefits include, among others, reduced mortality or health impacts and reduced mortality from diseases; and environmental co-benefits include improved air or water quality, reduced aquifer depletion and water pollution or land contamination;
Other resources and relevant information must be included.

2.5.2. Implementation, Monitoring, and Review Processes

The implementation of each strategy involves several types of resources and leads to different benefits. Whenever resources are limited or when different strategies compete for the same resource, they need to be prioritized. Therefore, the city must establish a prioritization procedure and to present the benefits of its implementation. Prioritization may be done for the strategies or for the measures within the strategies.
The prioritization method may include a Cost-Effectiveness Analysis and a Cost-Benefit Analysis. A Multi-Criteria Analysis can be used to rank the social oriented strategies, emphasizing the judgement of the decision-making team, with the ability to prioritize without the provision of monetary values [28].
Planning the chronological order to implement the strategies outlines the pace of the work, to identify overlapping activities and to highlight when resilience improvement is expected. In addition, noting any given milestones and stating dependencies amongst the activities also contributes to a better understanding of the path to follow. The city schedules the strategies to implement and if it decides for a more detailed planning, the schedule can also include the measures.
Monitoring and review of the plan ensure the application of the continuous improvement principle to the resilience process in the city and services. It also provides a periodic reflection on the city and services vision on resilience and the context, as well as progress tracking, and constituting an opportunity to realign the path towards resilience to climate change. It is fundamental to define this process, including responsibilities allocation.
Monitoring is intended to trace the progress both of the resilience strategies implementation and of the resilience changes due to it. Additionally, monitoring allows identifying early deviations to the plan (e.g., occurrences not anticipated in the plan, with impact on its implementation) and that may require corrective action. It is fundamental to define the monitoring periodicity and assign the responsibility to do it.
As the benefit of some strategies may only have effects in a city’s resilience after being completed, it is important that monitoring also includes the assessment of the degree of implementation of each strategy. Considering the implementation plan, the city should periodically check whether it is being carried out as scheduled, or if it is delayed or anticipated.
The plan revision consists of analyzing the monitoring results in order to identify unexpected gaps, their causes, and the improvement actions to bridge those gaps. In addition, the strategies identified in previous versions of the plan that had to be postponed, e.g., due to resources constraints, have to be reconsidered. Since cities are dynamic, the external and internal context also needs to be revisited leading to a revised SWOT analysis and respective links with TOWS. Due to its uncertainty, special attention needs to be paid to updated knowledge on climate dynamics, to decide about the need for a revision of climate change scenarios [17].

3. Results of Barcelona, Bristol, and Lisbon Resilience Action Planning

3.1. Background

The RAPs of Barcelona, Bristol, and Lisbon were developed by the respective cities and associated partners. They followed the planning process previously presented (2). Table 1 summarizes the cities’ main characteristics, major vulnerabilities, existing background, vision, geographical scope, and planning horizon [17,24,29], corresponding to steps 0 and 1 of the planning process.
The following strategic urban services, its interactions, and contributions to city’s resilience are considered in the three plans: wastewater drainage and treatment, stormwater drainage, waste collection and treatment, electric energy supply and mobility. Barcelona and Bristol RAPs also included the water supply service.

3.2. Climate Change and Planning Scenarios

In step 2, the climate change scenarios are selected and the planning scenarios are defined for the relevant planning hazards [17,18,29].
Several hazards may affect the cities, its services, and infrastructures. In this section, the considered climate change scenarios are presented, with projections developed with high confidence levels, using at least RCP4.5 and RCP8.5 scenarios. From the projections, the planning scenarios (2.1) are identified and characterized, so what it is being addressed in the assessment is clearly identified, i.e., which are the relevant variables (e.g., rainfall, temperature) and magnitudes that trigger the hazards (e.g., flooding, drought, or combined sewer overflows).
In Barcelona, the most critical climate-related hazards are coastal and pluvial flooding, drought, heat waves, storm winds, and combined sewer overflows. Therefore, future climate scenarios were studied for sea level rise, cumulative and extreme precipitation, and extreme temperature. The most critical climate-related hazard for Bristol is flooding, where future climate scenarios were studied for sea level rise, heightened river flows, and extreme precipitation for pluvial, fluvial, and tidal river flooding. In Lisbon, the most critical climate-related hazard is flooding induced by both extreme precipitation and sea level rise.
Planning scenarios for the flooding hazard, common to the three cities, are presented in Table 2.

3.3. Risk Assessment

3.3.1. Overall of the Three Cities

For Step 4 (2.1), although a common risk assessment roadmap has been defined (2.2), this process is strongly dependent on the available and provided data and information, as well as its level of detail. For this reason, the three research sites have defined specific risk assessment methodologies based on the available data and models. This step was carried out for the three cities [34,35,36,37,38,39,40,41].
Investigation on detailed cascading effects and quantification of impacts from climate driven hazards may be reported, namely regarding infrastructure or service constraints and failure. In a city where such models are not available, detailed GIS analysis of hazard maps provides valuable information [36,37].

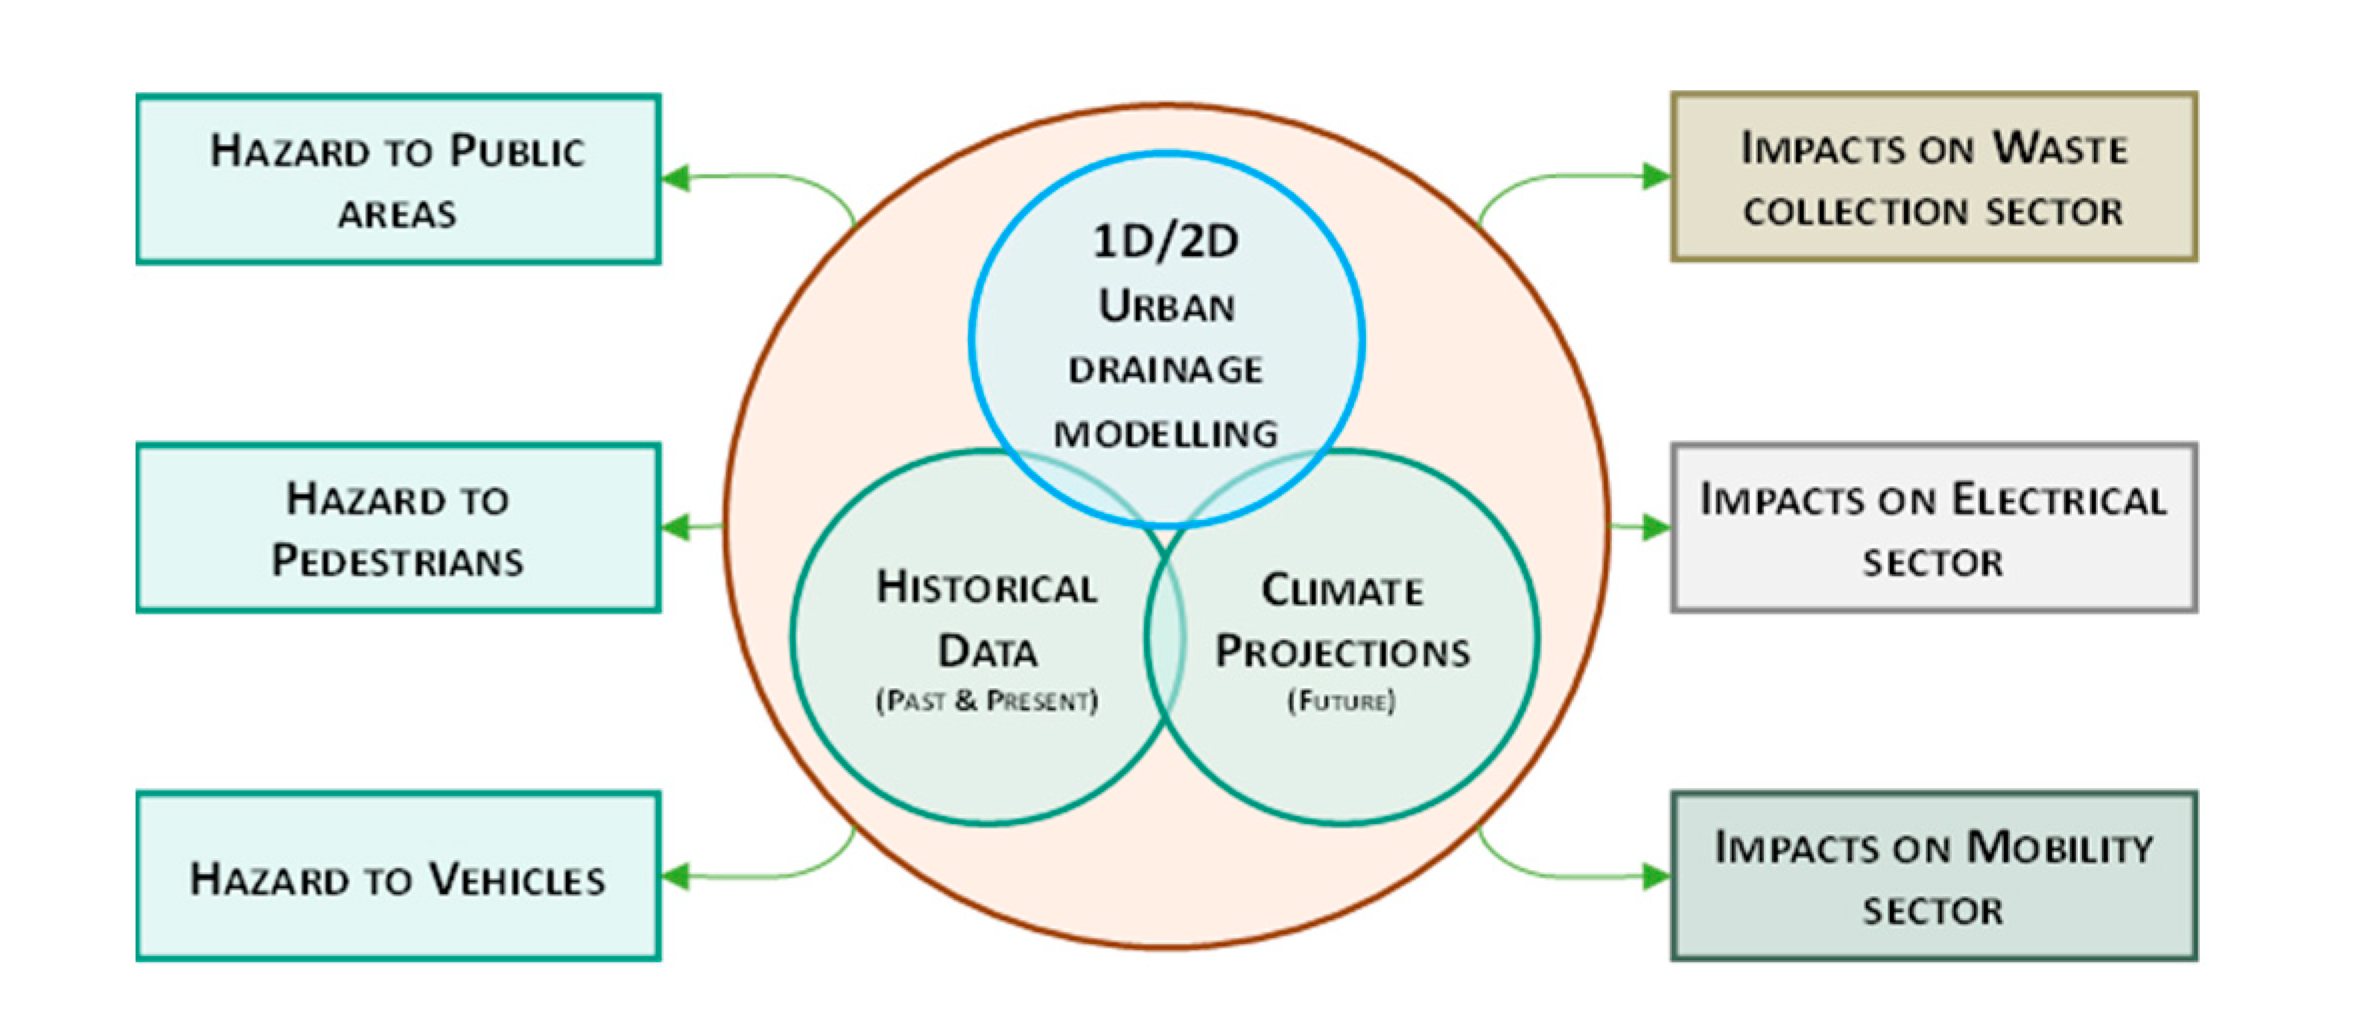
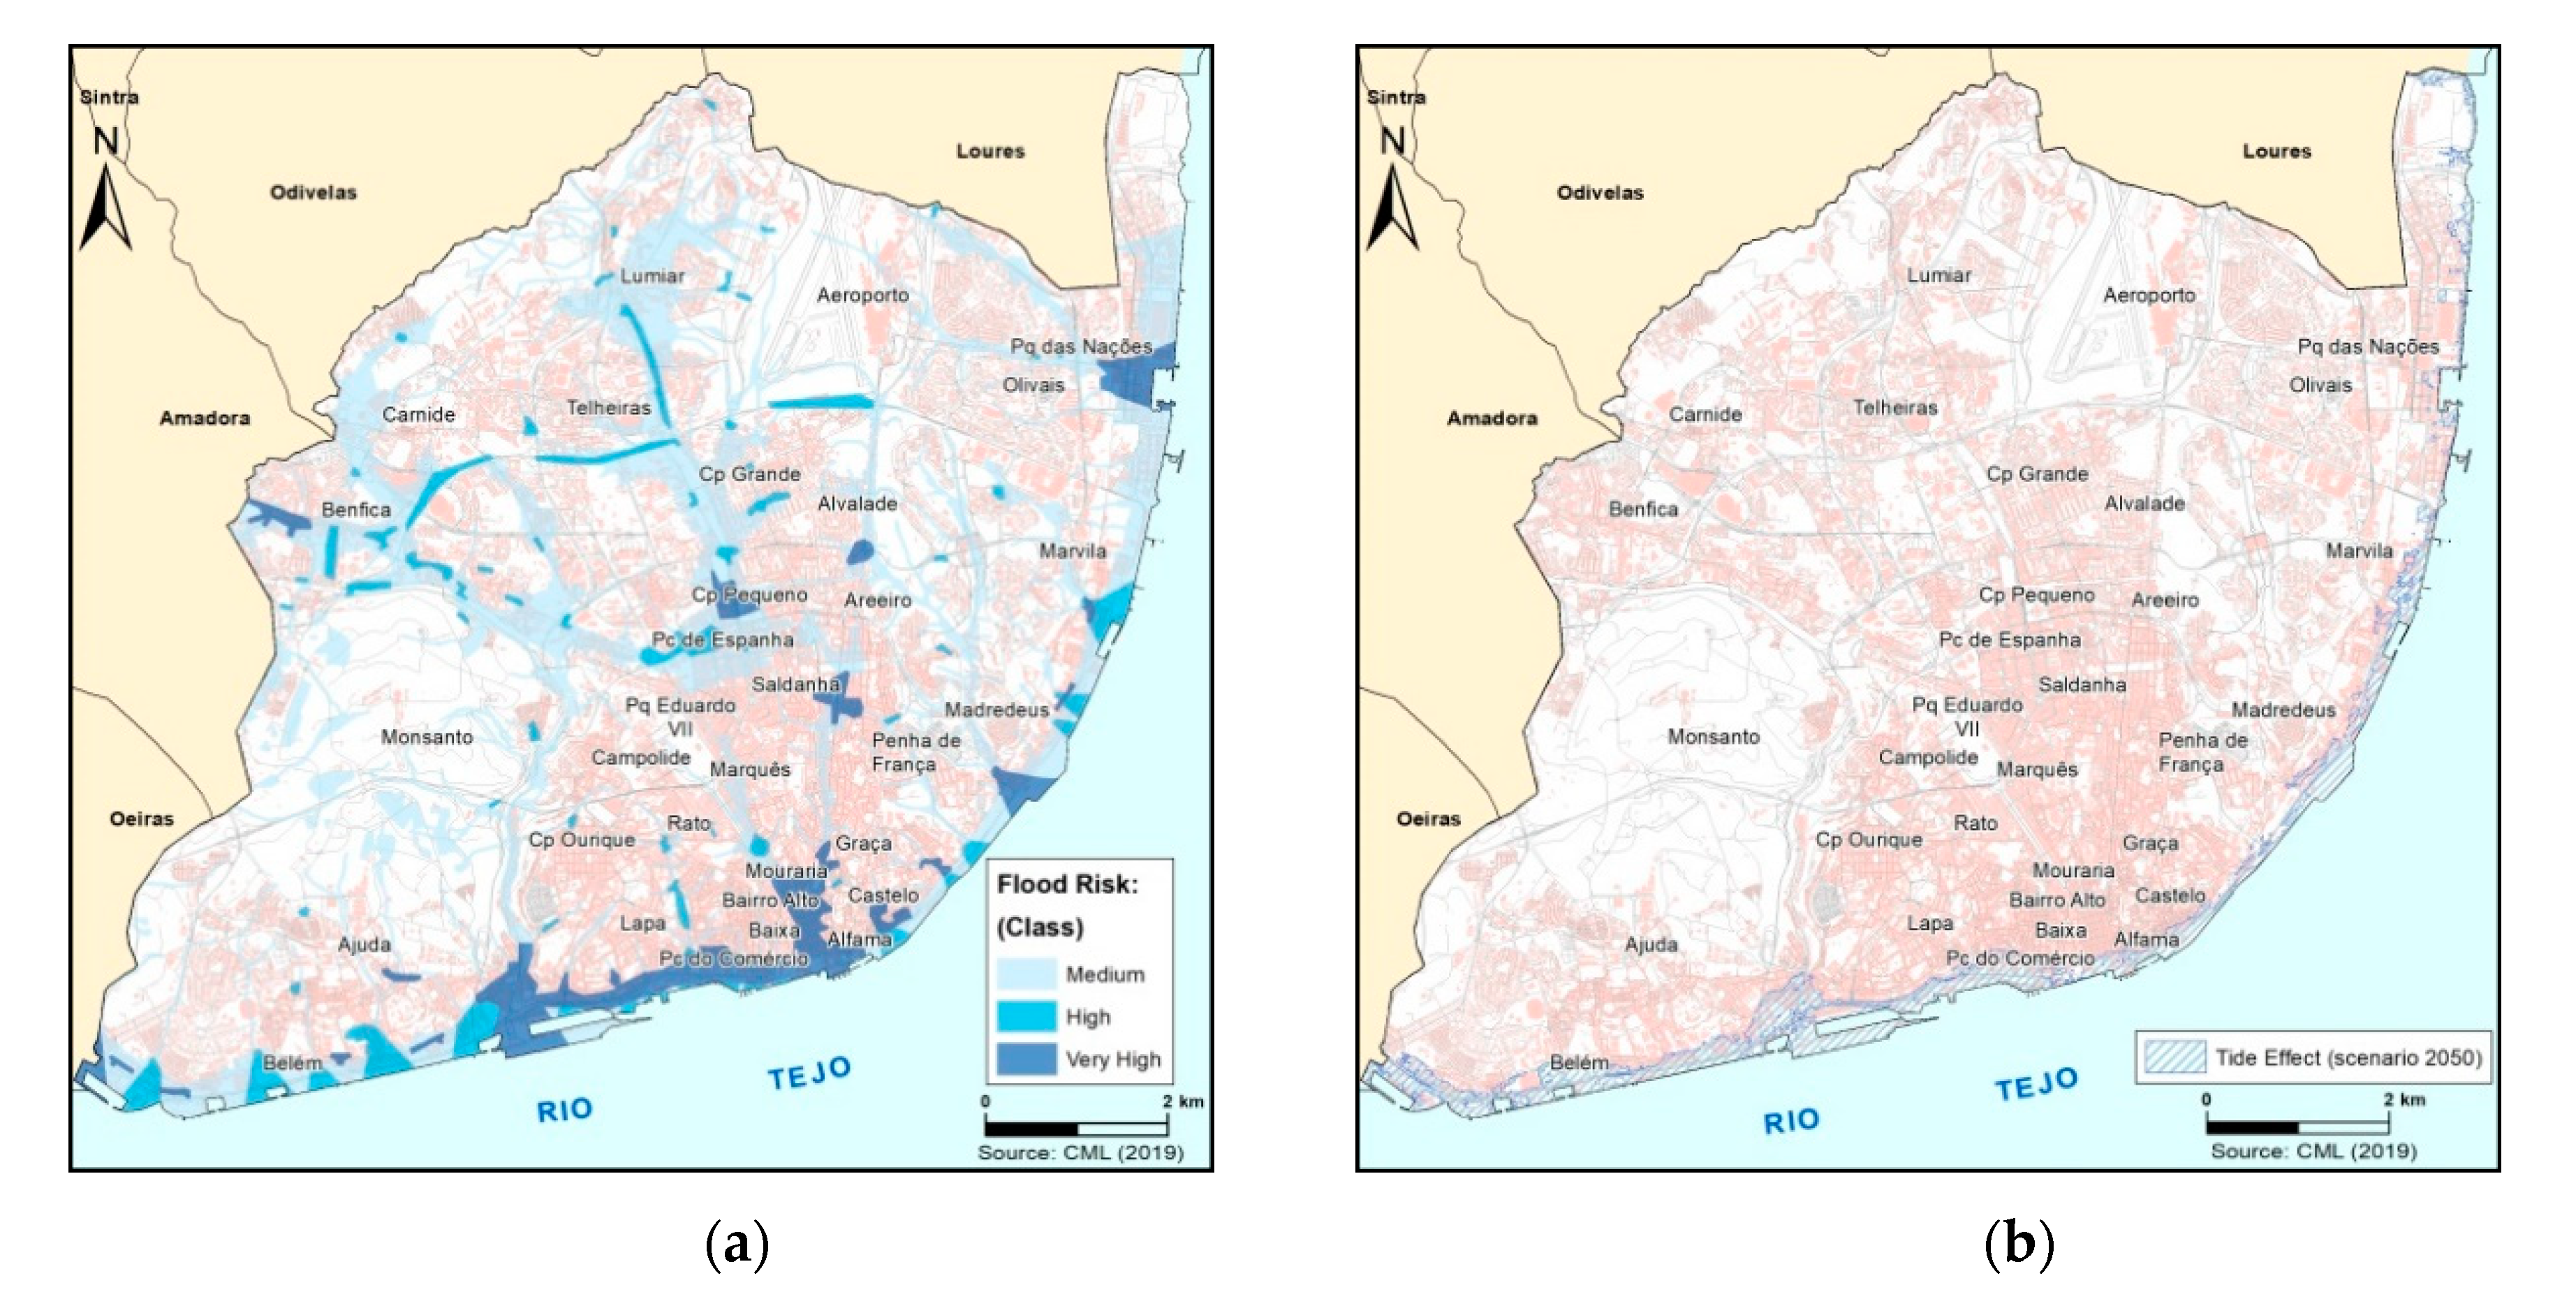
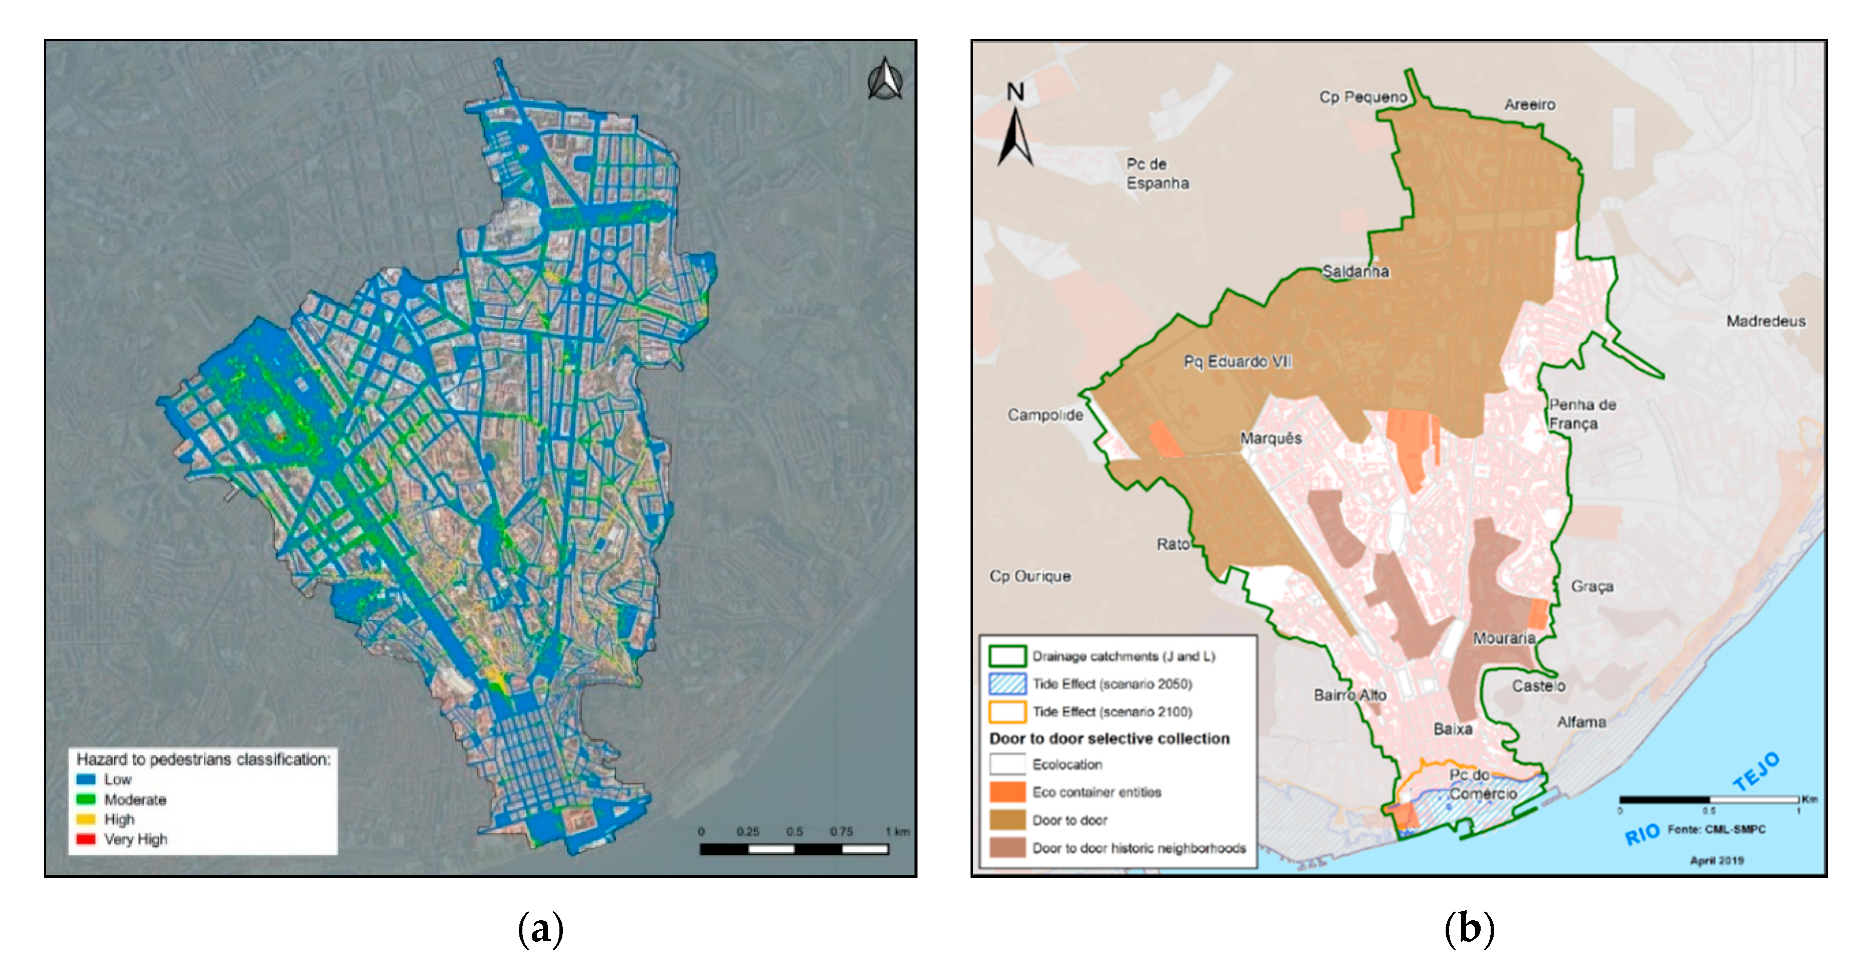
3.3.2. Lisbon Hazard Assessment

In Lisbon, the sectorial models used were based on historical climate data and on projections of future climate scenarios, a thorough characterization of the urban services and of their relations with climate variables, detailed analysis of interdependencies, and production of hazard maps.
The overall methodology proposed to undertake the spatial characterization of the flood related hazards has the following main steps: (i) identification of flood related hazards, risk factors and risks using the selected affected sectors as case studies, namely, electricity supply, urban mobility, and wastes collection; (ii) selection of metrics for hazards characterization and mapping; (iii) selection of representative scenarios to characterize current and future situations; (iv) mapping of hazards and calculation of metrics to support further work on resilience assessment using GIS tools [36].
In terms of urban drainage tools, two types of hydraulic mathematical models were used at different scales: (i) the citywide 1D GIS model, which covers the city as a whole but adopts a simplified hydraulic model and sewer network; (ii) the 1D/2D combined model (SWMM [42] and Basement [43]): applied to the downtown catchments J&L using a more robust hydraulic formulation and including sewerage network as well as overland flow simulation tools [36]. DPlan (Distribution Planning modelling tool) was used in the whole metropolitan area for the energy service. GIS analysis was used for all the other services and city areas.
For different scenarios, considering both the current situation and the future with climate change, flooding exposure, and vulnerability of each urban service were characterized, and the respective hazard maps were produced [44].
The effects of multiple hazards and interdependencies in the city were also studied (Figure 2), namely flooding/mobility, flooding/energy, and flooding/waste [44]. Figure 3 presents the Lisbon flooding hazard maps both for the current situation (and considering climate change for flooding induced by rainfall or estuary tides. Figure 4 presents Lisbon drainage catchments J&L flooding-related hazard maps to pedestrians for flooding induced by rainfall for 2100 and impact on waste sector for flooding induced by sea level rise by 2050 and 2100.

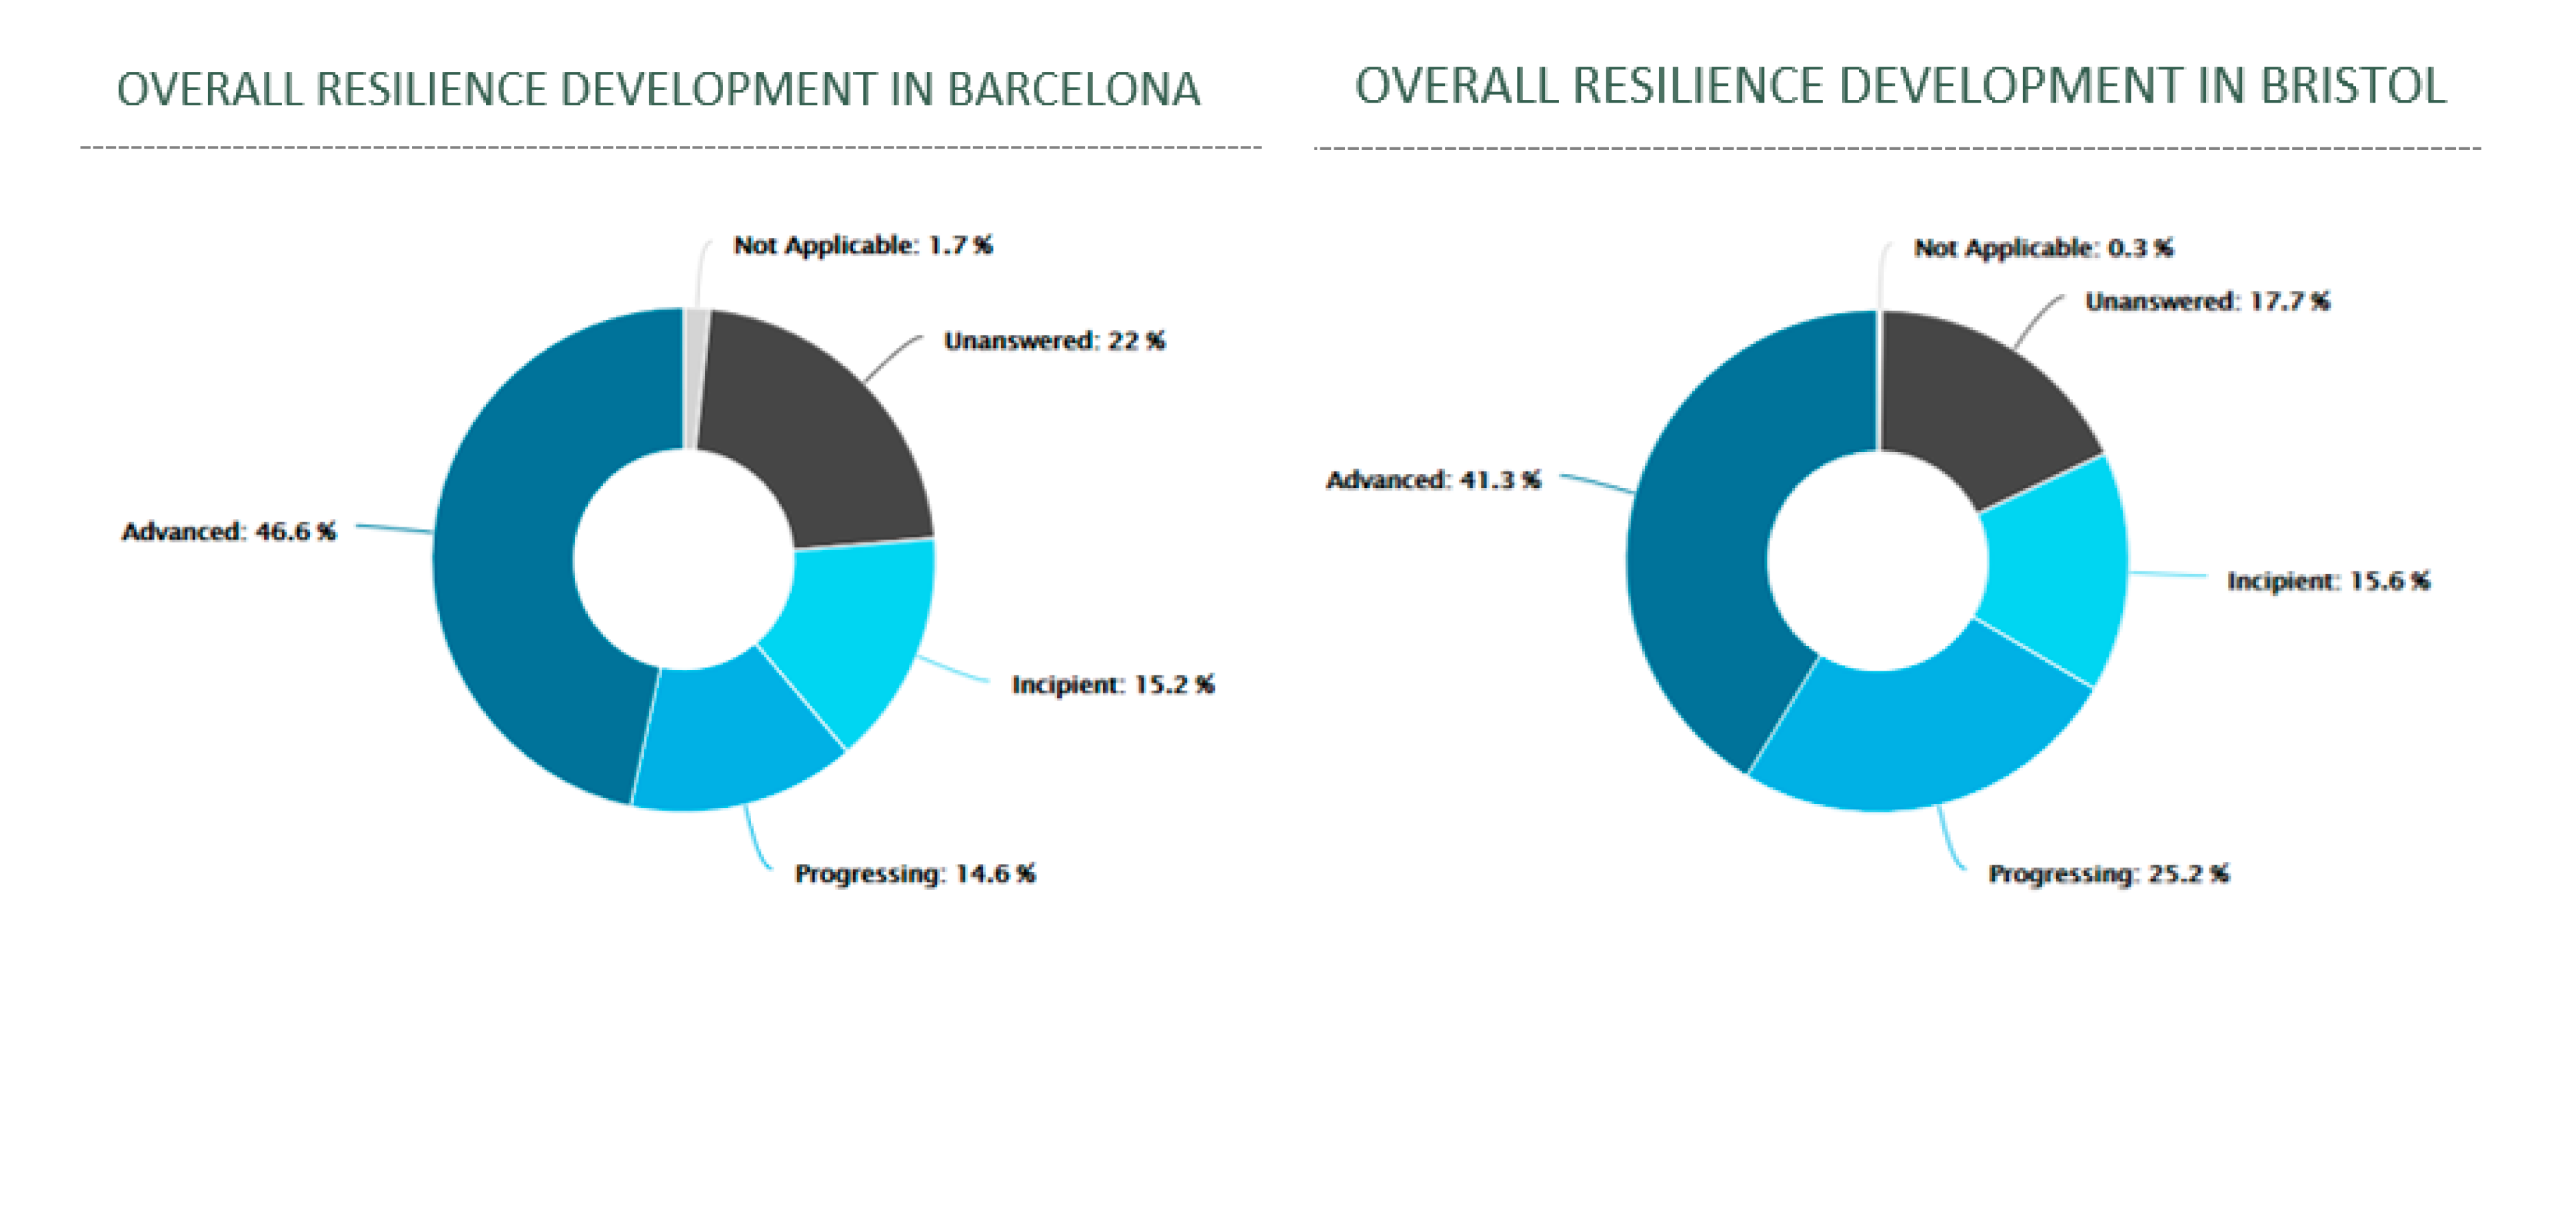
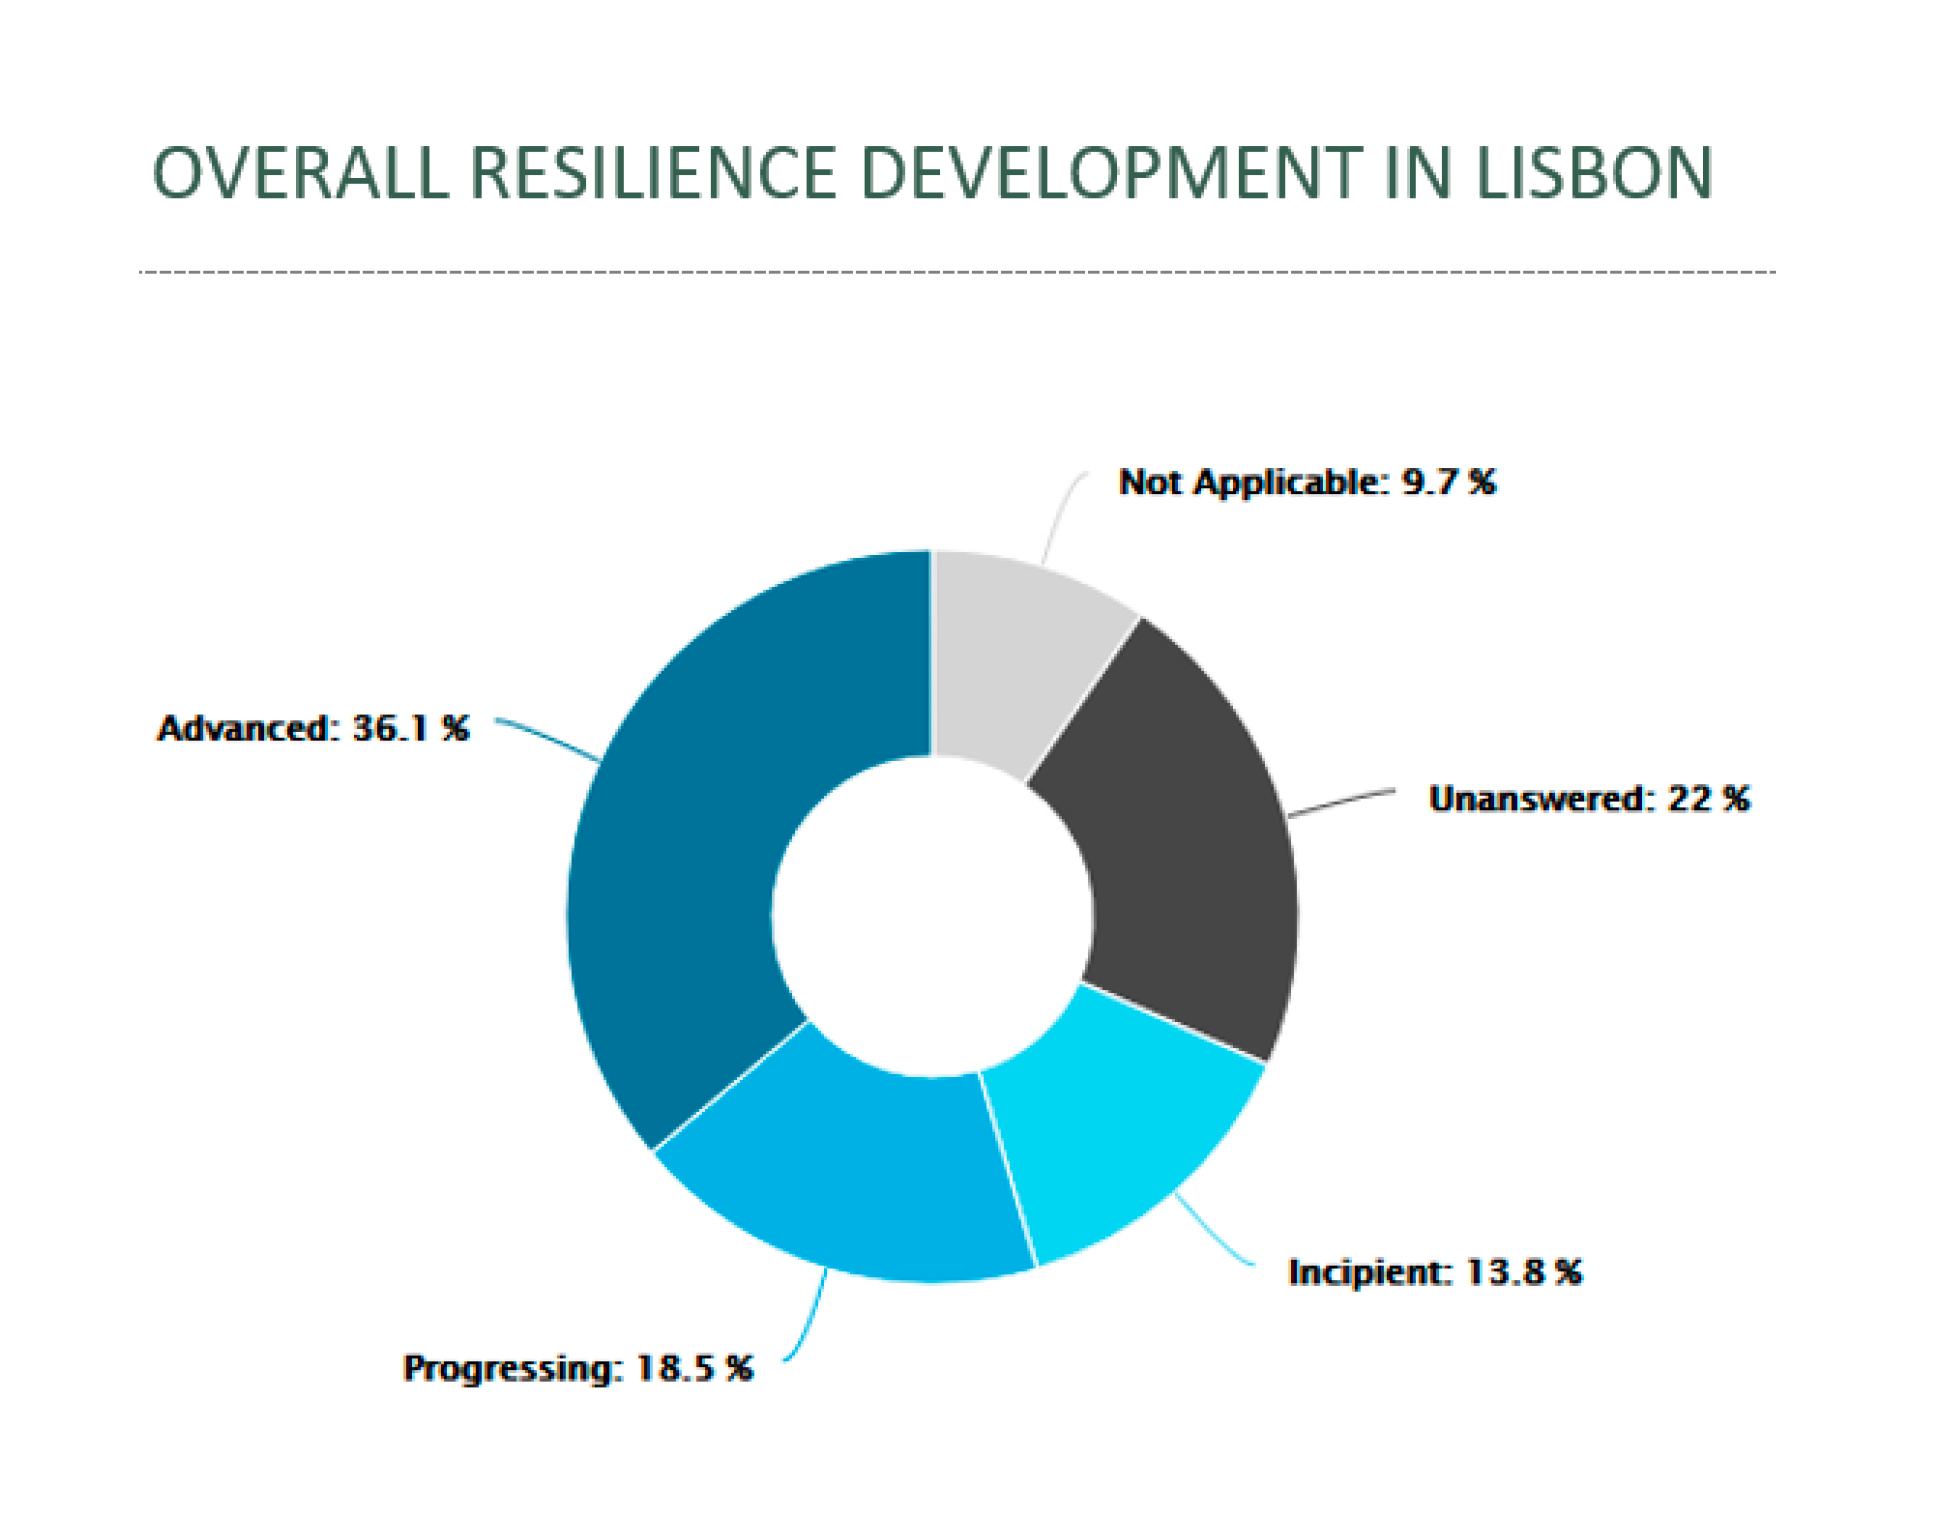
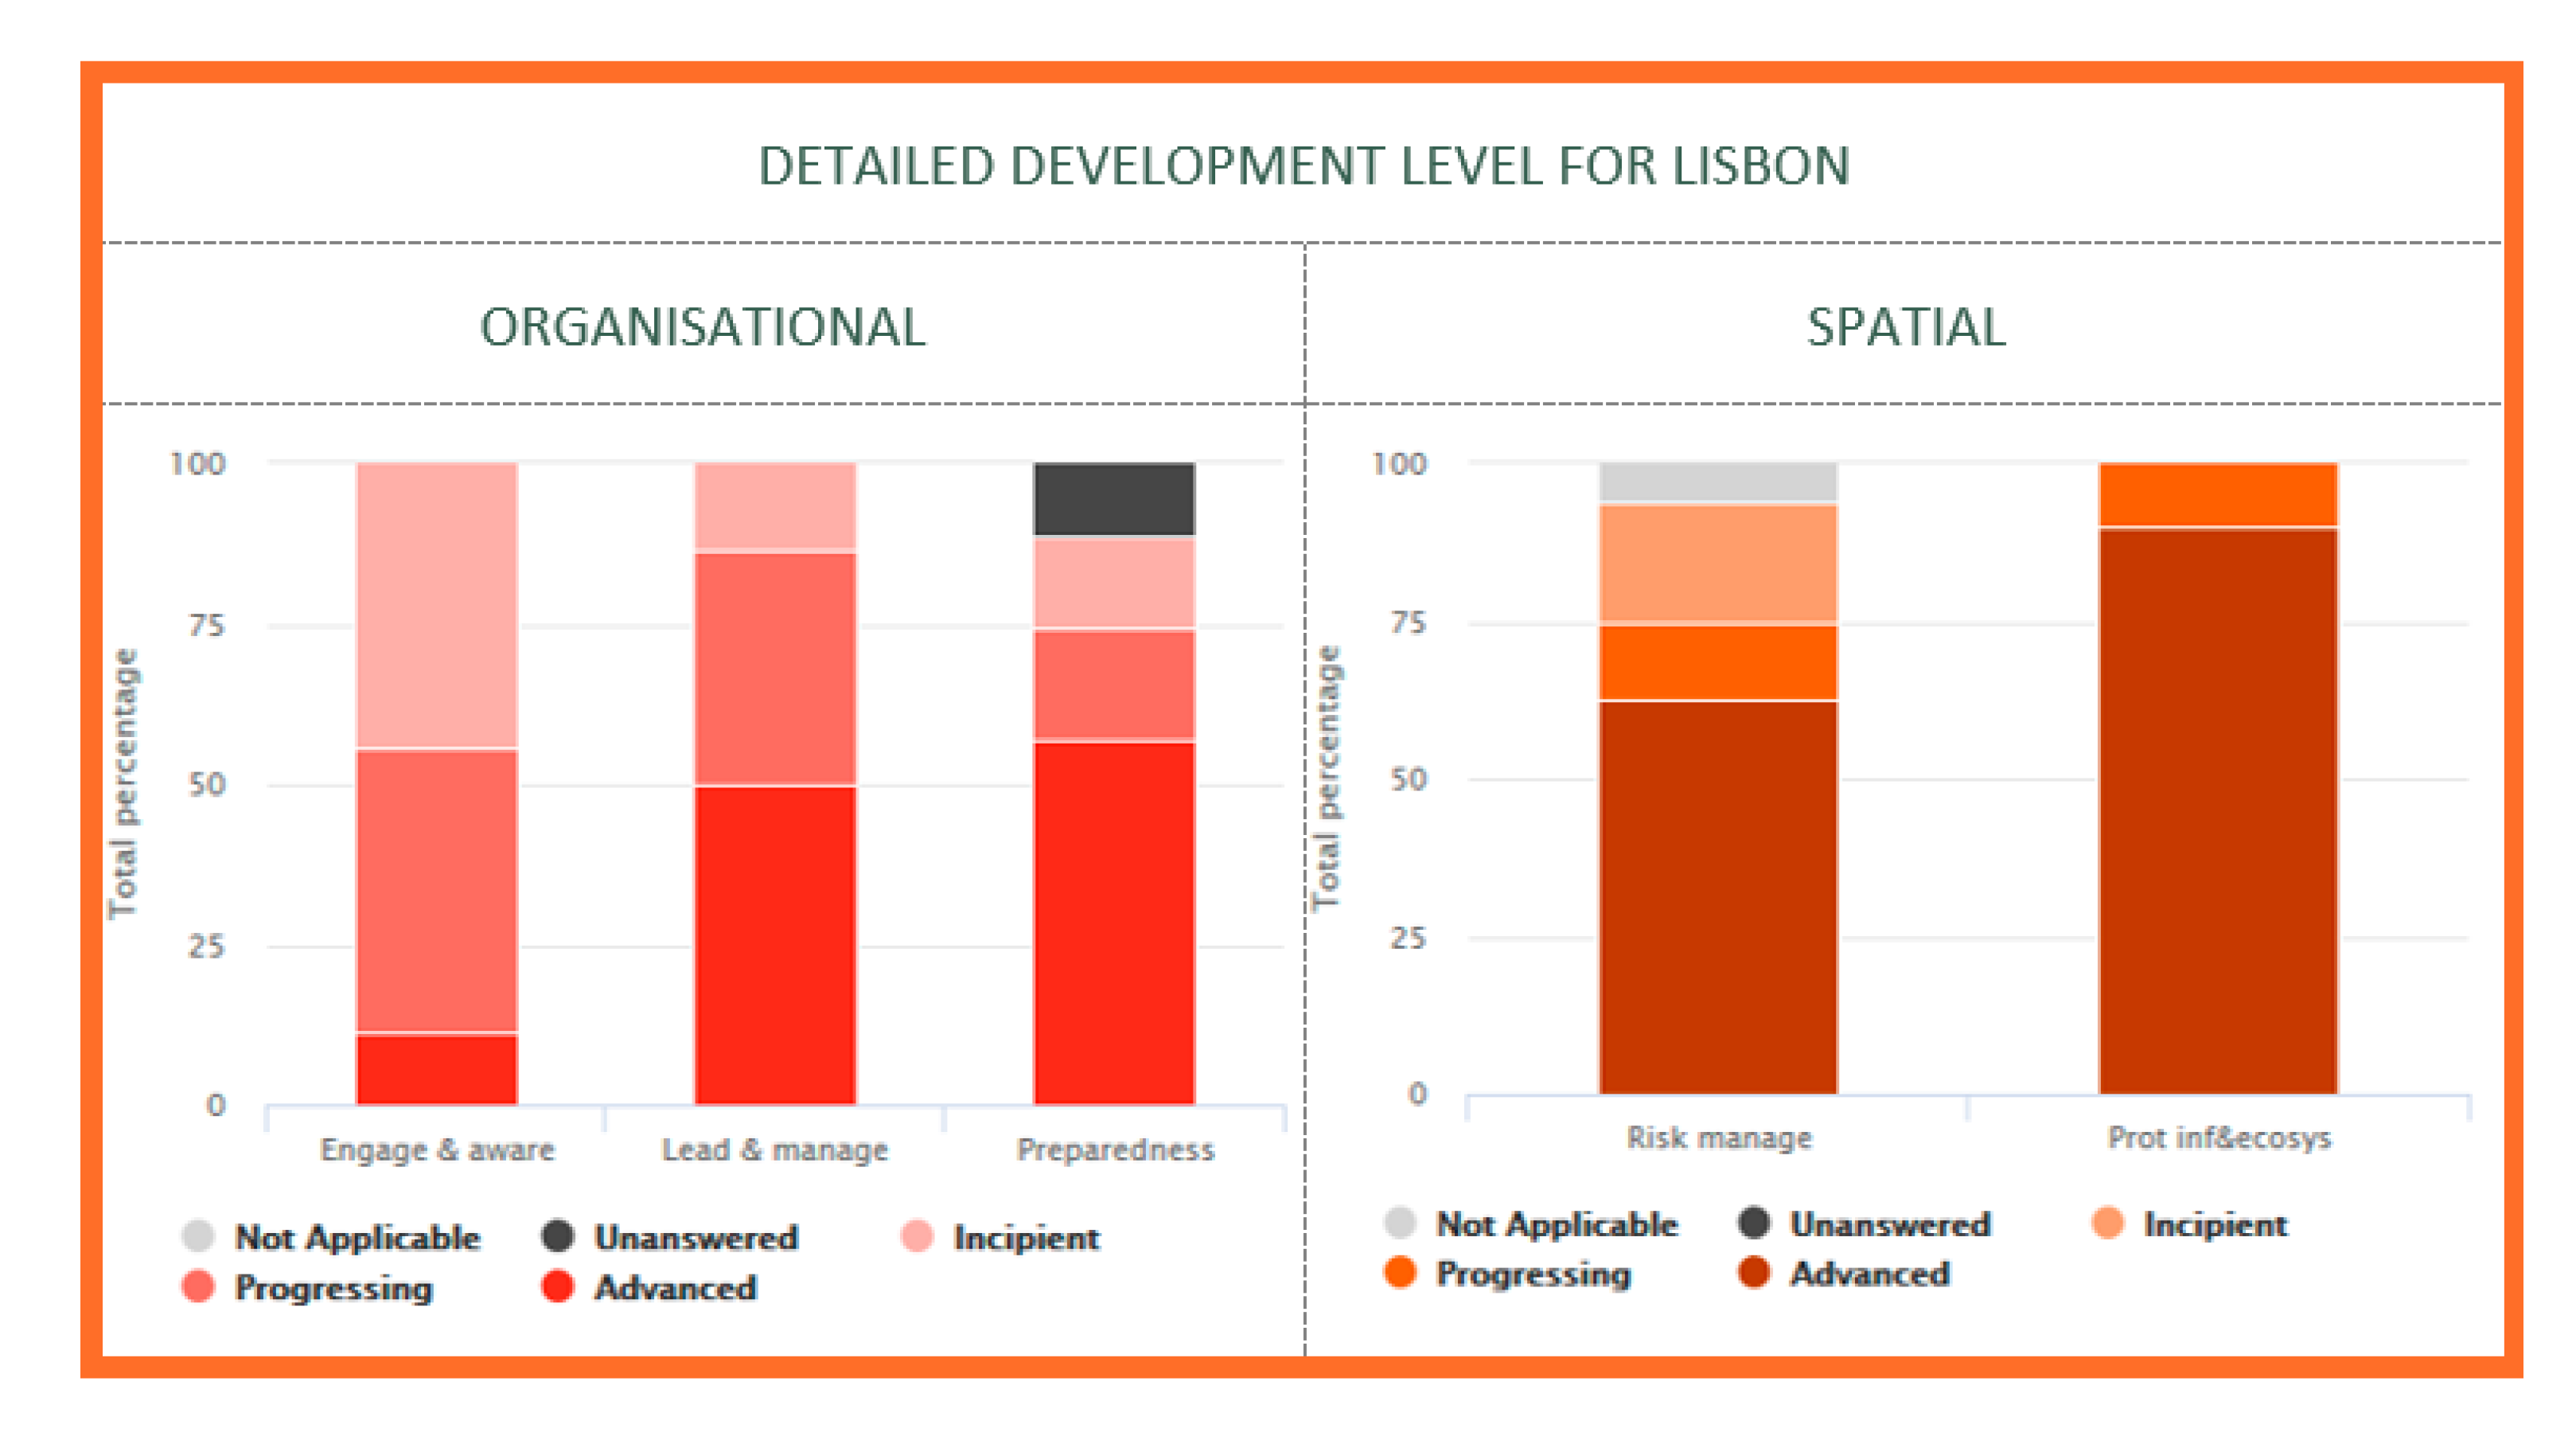
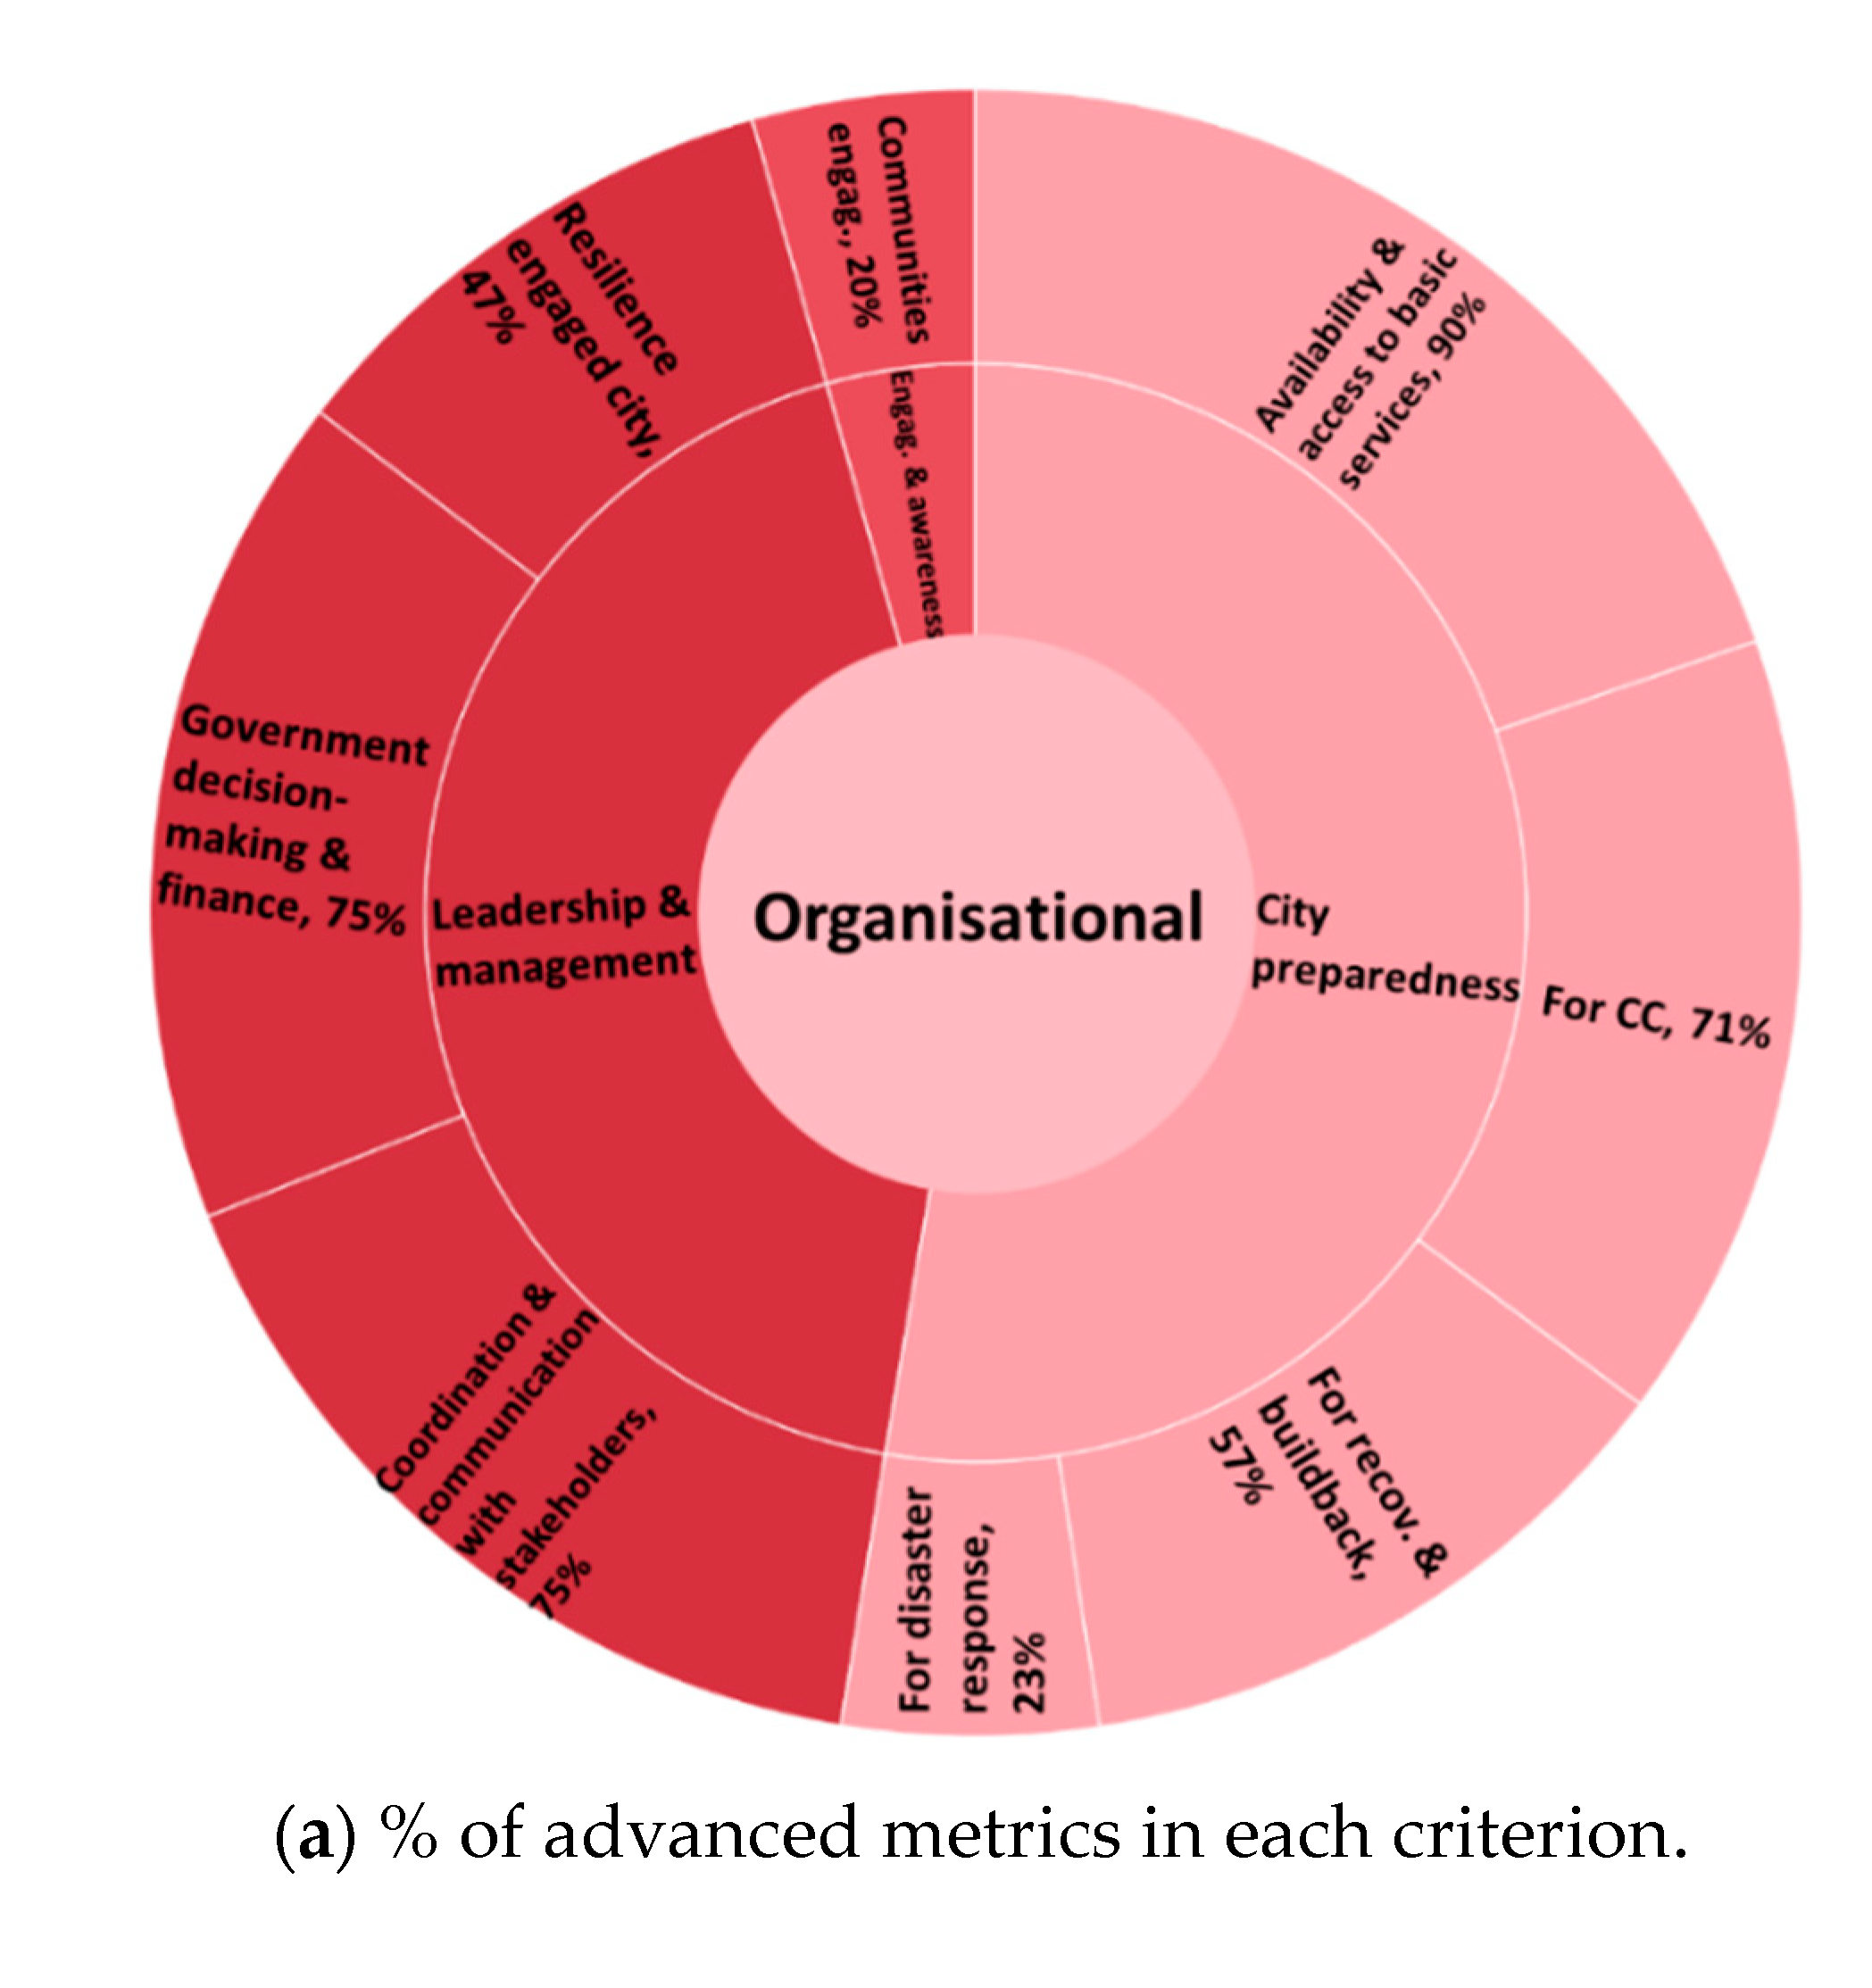
3.4. Resilience Assessment

The Resilience Assessment Framework (RAF) (2.3) was applied by the three cities in this Step 4 [17,24] in order to carry out a structured assessment and support diagnosis and definition of the strategies. Figure 5 presents the overall resilience development level of each city, Barcelona, Bristol, and Lisbon displaying the percentage of all metrics assessed in each development level.
Considering the overall assessment, the tree cities have a relatively similar development level, being the percentage of advanced level metrics the highest, between 36% and 46%, followed by the progressing level between 14% and 25%, and the incipient around 15%. The percentage of unanswered metrics is also similar, 18–22%. Going deeper in the analysis, it is possible to identify the main opportunities for improvement, as follows for the Lisbon case. In Lisbon, overall resilience development in the city is advanced in more than one third of the aspects assessed. Around a fifth are progressing and the reminder incipient, unanswerable, or not applicable. From Figure 6, it is clear that spatial resilience is overall the most advanced resilience dimension, followed by the organizational dimension.
The physical dimension presents the highest percentage of metrics that were not answered, followed by the functional dimension, what may be due to data that is not easily applicable to the metrics provided in the RAF, in some cases, and to lack of information in other cases [33].

3.5. SWOT Analysis

The diagnosis is undertaken including the integration of the resilience assessment results provided by all sources of analysis [17,19,23,29,44,45,46,47,48].
In the SWOT analysis of Barcelona, Bristol, and Lisbon, some aspects regarding Strengths, Weaknesses, Opportunities, and Threats are equal or similar. The significant background on resilience and the leadership and management are some of the strengths on the resilience of these three cities. The existence of coastal areas that may provide conditions for economic development such as tourism and industry development and the financial opportunities in the cities are opportunities that can also be found in the three cities. Some of the similar weaknesses found are in the collective engagement and awareness and data gaps related to the energy infrastructure preparedness.
The coastal area (highly exposed to sea level rise and storm surge, consequences of climate change), the temperature increase by 2050, and sea level rise are examples of threats felt in each city.
In Figure 7, to illustrate the results related to the RAF purpose, an overall assessment for the organizational dimension is presented. Figure 7a presents the main strengths for the organizational dimension (inner circle), identifying the resilience objectives (middle circle) and criteria (outer circle) where are presented the percentage of metrics with an advanced level of development. Lisbon is well developed regarding leadership and management (O.2) and city preparedness (O.3), in this from the points of view of availability and access to basic services, preparedness for climate change and recovery and build back, while also presenting some relevant developments on collective engagement and awareness (O.1). Figure 7b presents the main weaknesses of the organizational dimension, identifying the resilience objectives and criteria with metrics in the incipient level of development. The main opportunities for development are those related to collective engagement and awareness (O.1) as well as city preparedness (O.3) from the points of view of recovery and build back, where there is still a great room for improvement, and disaster response.
Therefore, the SWOT analysis includes the most advanced and incipient objectives and criteria. For Lisbon, some of the identified strengths related with the Organizational dimension are the city preparedness for climate change, the availability and access to basic services, and the coordination and communication with stakeholders. Some weaknesses also identified for this dimension related to the city collective engagement and awareness of citizens and communities and to the city preparedness for disaster response. A complete SWOT analysis for Lisbon from a resilience to climate change perspective is presented in Supplementary Material.

3.6. Strategies Development

3.6.1. Identification of Strategies

The cities intend to achieve the resilience objectives of the assessment, particularly reducing the risk regarding identified hazards, preparing the population and the services for their occurrence, and promoting a better articulation between urban services. To address this, more specifically, each city developed its own set of resilience strategies [27,49]. The planned strategies expected to have greater impact in the three cities and considering the objectives where they may impact are presented in Table 3.
With the planned set of strategies, the cities aim to achieve a significant part of its long-term resilience objectives regarding climate change, with focus on the urban water cycle.

3.6.2. Impact Assessment of Identified Strategies

The impact of the identified strategies in the RAF resilience objectives for the three cities is highly significant. The identified strategies address all the resilience dimensions and objectives as well as all services considered in each city.
In Lisbon, the impact of the strategy “Promoting urban rehabilitation as a tool to increase resilience: sewer systems” is presented in Figure 8, before (a) and after (b) the strategy implementation, for flooding induced by rainfall for 2100. It is evident the improvement regarding the water depth in the downtown area, within the red circle. It will contribute to improve the organizational resilience, namely regarding the leadership and management and the city preparedness objectives. This strategy will also contribute to improve both spatial resilience objectives and is related to all services of functional and physical dimensions.

3.6.3. Strategies Prioritization, Implementation Plan, and Monitoring and Review

In this step, in the case of Lisbon, the city strategies were selected and defined as priority in the domain of urban floods due to their alignment with several sectorial, global, and territorial Municipal Master and emergency Plans, with the Municipal Main Planning Options and respective City Axis.
The implementation plan, presented in Figure 9, was defined articulating several official frameworks already approved and other commitments assumed, mainly following a political decision and prioritization, while depending on the financial capacity.
In order to trace the progress of the resilience strategies implementation, of resilience changes, and to identify early deviations that may require corrective action, Table 4 presents the RAP monitoring and review process planned for Barcelona, Bristol, and Lisbon, including the periodicity, responsible body, and activities to undertake. In Lisbon, an additional activity is foreseen in the review process.
In the Lisbon plan, some of the challenges identified in the SWOT are still to be addressed in the future, namely some threats (windstorms, the socio-economics crises, contribution to new legal diplomas, concepts harmonization, and General Data Protection Regulation obstacles) and weaknesses (related to budget and insurance, data gaps, services resilience planning, wastewater service autonomy, services and infrastructures preparedness for CC, costs of damages in buildings, compatibility between different tools, and structured georeferenced data). Besides, it is fundamental to align digital interactive platforms and establish temporal targets [33].

4. Discussion

The RAPs are thematic plans that contribute to the city’s global planning and are based on the RESCCUE developments as well as on the drivers, opportunities, context and existing background, practices and knowledge of each city. Following the approach developed by the authors [17], each city defined the geographical scope, period, and the relevant critical hazards to plan for, being those associated with urban flooding common to all of them. The development of the RAPs followed an established process common to the three cities, while providing flexibility to accommodate the specificities of each city. For each step of the RAP development, innovative methods and tools were developed to support any city in defining its own resilience enhancement roadmap.
The production of the plan by each city–Barcelona, Bristol, and Lisbon–was based on a template with detailed guidelines, developed as a supporting tool. This application provided opportunities to produce a general template and respective guidelines that can be used by any city to develop its own RAP to climate change, contributing to the city’s global planning [17].
The RAP intends to be concise and it is targeted to a broad audience that includes experts and the general public. Therefore, the methods applied are therein referred to or cited, since they make part of the planning process, but they are not detailed in the plans. These tools have proven to be fundamental to undertake the cities’ diagnoses and to support the identification of future interventions, based on existing and centralized information.

5. Conclusions

A resilience planning process was developed in this research and is herein presented [17]. The implementation of the planning process effectively provided the production of the three RAPs, and allowed identification of the main benefits of the process and future challenges to address, from the cities and services point of view. New tools and approaches were developed to allow effective implementation with contributions from the authors [17,23,24,25,26,27,36,47].
Some of the identified main benefits of the plan implementation are related to deepen the knowledge of city services resilience and their interdependencies, definition of multisectoral goals, indicators and targets, the enhancement of synergies and alignment between local, regional, national, and international strategic plans, frameworks, networks, and instruments and the delivery of public results to citizens, with public participation reinforcement [17].
As future challenges, the plans can be improved and address new data and information to fill data gaps, include other hazards (heat and cold waves, floods, windstorms, mean sea level rise and storm surges, storms, etc.), integrating and updating the knowledge regarding city services climate change related hazards. The plans need to include the collective and individual citizen participation and awareness with respect to a range of hazards and different disruptive events, maintain continuous plan monitoring and review, and continuous engagement and involvement of key stakeholders and decision makers in the technical and scientific process.
In the different phases of the planning process, different roles and contributions from stakeholders emerge. The active engagement throughout the planning process will ensure the success of the strategies development and further implementation. Within this context, communication between stakeholders and public dissemination of results becomes a key factor for a successful implementation process of the adaptation strategies.
Additionally, the lessons learnt from the cities and services’ point of view provided identification of recommendations for RAP development in other cities [17]. These recommendations address mainly the best way to begin the development of the plan (using results and knowledge from other cities), the involvement of a mixed/transversal team made up by different entities and coordinated by the municipality and key sectors of the city that are commonly forgotten (e.g., heritage management). It also includes the allocation of specific budgets for resilience, the use of lessons and experiences from extreme events, even if not weather-related (e.g., COVID-19) to improve and prioritize emergency and response procedures and commit budget priorities to sustainable development giving importance to factors and indicators that are not exclusively economic and taking advantage of cost-benefit analysis (include co-benefits).

Supplementary Materials

The following are available online at https://www.mdpi.com/2071-1050/12/21/9017/s1, Table S1: SWOT analysis for Lisbon from a resilience to climate change perspective, Figure S1: Overall of Lisbon resilience assessment for the Organizational dimension regarding the development level, Figure S2: Overall of Lisbon resilience assessment for the Spatial dimension regarding the development level, Figure S3: Overall of Lisbon resilience assessment for the Functional dimension regarding the development level, Figure S4: Overall of Lisbon resilience assessment for the Physical dimension regarding the development level.

Author Contributions

Conceptualization, M.A.C., M.d.C.A., and R.S.B.; data curation, M.J.T., J.B., and M.M.; formal analysis, M.A.C., M.J.T., M.d.C.A., R.S.B., and C.P.; investigation, M.A.C., M.d.C.A., R.S.B., and J.B.; methodology, M.A.C., M.d.C.A., R.S.B., and C.P.; project administration, M.A.C.; supervision, M.A.C. and M.J.T.; validation, M.A.C., M.d.C.A., R.S.B., C.P., and J.B.; visualization, J.B. and M.M.; writing—original draft, M.A.C. and C.P.; writing—review and editing, M.A.C., M.d.C.A., R.S.B., C.P., and J.B. All authors have read and agreed to the published version of the manuscript.

Funding

This research was funded by EUROPEAN UNION’S HORIZON 2020 RESEARCH AND INNOVATION PROGRAM, under the Grant Agreement number 700174.

Acknowledgments

The work presented was developed within the EU H2020 RESCCUE project—Resilience to Cope with Climate change in Urban areas. Acknowledgment is due to all RESCCUE partners.

Conflicts of Interest

The authors declare no conflict of interest.

References

  1. Yigitcanlar, T.; Teriman, S. Rethinking sustainable urban development: Towards an integrated planning and development process. Int. J. Environ. Sci. Technol. 2015, 12, 341–352. [Google Scholar] [CrossRef] [Green Version]
  2. UN. Global Sustainable Development Report 2019: The Future Is Now—Science for Achieving Sustainable Development. Report of United Nations Independent Group of Scientists Appointed by the Secretary-General. 2019. Available online: https://sustainabledevelopment.un.org/content/documents/24797GSDR_report_2019.pdf (accessed on 21 August 2020).
  3. Labaka, L.; Maraña, P.; Giménez, R.; Hernantes, J. Defining the roadmap towards city resilience. Technol. Forecast. Soc. Chang. 2019, 146, 281–296. [Google Scholar] [CrossRef]
  4. Sharifi, A. Resilient urban forms: A macro-scale analysis. Cities 2019, 85, 1–14. [Google Scholar] [CrossRef]
  5. Meerow, S.; Newell, J.P.; Stults, M. Defining urban resilience: A review. Landsc. Urban Plan. 2016, 147, 38–49. [Google Scholar] [CrossRef]
  6. Desouza, K.C.; Flanery, T.H. Designing, planning, and managing resilient cities: A conceptual framework. Cities 2013, 35, 89–99. [Google Scholar] [CrossRef]
  7. Vallejo, L.; Mullan, M. Climate-Resilient Infrastructure: Getting the Policies Right; OECD Environment Working Papers, No. 121; OECD Publishing: Paris, France, 2017. [Google Scholar] [CrossRef]
  8. ICLEI. Preparing for Climate Change: A Guidebook for Local, Regional, and State Governments; ICLEI—Local Governments for Sustainability: Bonn, Germany, 2007; Available online: https://icleiusa.org/wp-content/uploads/2015/08/PreparingForClimateChange_Sept2007.pdf (accessed on 21 August 2020).
  9. Saavedra, C.; Budd, W.W. Climate change and environmental planning: Working to build community resilience and adaptive capacity in Washington State, USA. Habitat Int. 2009, 33, 246–252. [Google Scholar] [CrossRef]
  10. Weihrich, H. The TOWS matrix—A tool for situational analysis. Long Range Plan. 1982, 15, 54–66. [Google Scholar] [CrossRef]
  11. Santamouris, M.; Cartalis, C.; Synnefa, A. Local urban warming, possible impacts and a resilience plan to climate change for the historical center of Athens, Greece. Sustain. Cities Soc. 2015, 19, 281–291. [Google Scholar] [CrossRef]
  12. UNHabitat. Planning for Climate Change: A Strategic, Values-Based Approach for Urban Planners; Cities and Climate Change Initiative Tool Series; United Nations Human Settlements Programme: Nairobi, Kenya, 2014; Available online: https://unhabitat.org/sites/default/files/download-manager-files/Planning%20for%20Climate%20Change.pdf (accessed on 19 October 2020).
  13. UNHabitat. Guiding Principles for City Climate Action Planning; United Nations Human Settlements Programme: Nairobi, Kenya, 2015; Available online: https://e-lib.iclei.org/wp-content/uploads/2016/02/Guiding-Principles-for-City-Climate-Action-Planning.pdf (accessed on 19 October 2020).
  14. Buijs, J.-M.; Boelens, L.; Bormann, H.; Restemeyer, B.; Terpstra, T.; Van Der Voorn, T. Adaptive planning for flood resilient areas: Dealing with complexity in decision-making about multilayered flood risk management. In Proceedings of the 16th Meeting: Adaptive Planning for Spatial Transformation, Groningen, The Netherlands, 23–25 May 2018; p. 23. Available online: https://www.projectenportfolio.nl/images/archive/e/ea/20180906092418%2120180430_Paper_Aesop_FRAMES.pdf (accessed on 19 October 2020).
  15. Van der Voorn, T.; Quist, J.; Pahl-Wostl, C.; Haasnoot, M. Envisioning robust climate change adaptation futures for coastal regions: A comparative evaluation of cases in three Continents. Mitig. Adapt. Strateg. Glob. Chang. 2017, 22, 519–546. [Google Scholar] [CrossRef]
  16. NIST. Community Resilience Planning Guide for Buildings and Infrastructure Systems; NIST Special Publication 1190; National Institute of Standards and Technology: Gaithersburg, MD, USA, 2016; Volume I. [CrossRef]
  17. Cardoso, M.A.; Brito, R.S.; Pereira, C.; Gabàs, A.; González Gómez, A.; Goodey, P.; Lopes, R.; Martínez, M.; Russo, B.; Telhado, M.J.; et al. Resilience Action Plans of the RESCCUE Cities; D6.2 RESCCUE Project (Public); RESCCUE Project: Barcelona, Spain, 2020. [Google Scholar]
  18. Monjo, R.; Paradinas, C.; Gaitán, E.; Redolat, D.; Prado, C.; Pórtoles, J.; Torres, L.; Russo, B.; Velasco, M.; Ribalaygua, J. Final Climate Scenarios Report; D1.2 RESCCUE Project (Public); RESCCUE Project: Barcelona, Spain, 2017. [Google Scholar]
  19. Monjo, R.; Paradinas, C.; Gaitán, E.; Redolat, D.; Prado, C.; Pórtoles, J.; Torres, L.; Russo, B.; Velasco, M.; Pouget, L.; et al. Report on Extreme Events Prediction; D1.3 RESCCUE Project (Public); RESCCUE Project: Barcelona, Spain, 2018. [Google Scholar]
  20. Canalias, M.; Fontanals, I.; Soler, P.; Vendrell, E. Report from HAZUR® Implementation in Each City; D4.1 RESCCUE Project (Confidential); RESCCUE Project: Barcelona, Spain, 2017. [Google Scholar]
  21. UNIDSR. Disaster Resilience Scorecard for Cities. Preliminary Level Assessment; United Nations Office for Disaster Reduction: Geneva, Switzerland, 2015. [Google Scholar]
  22. McClinton, P. Strategic Management Analysis Tools: A Review of the Literature. Liberty University, Virginia, EUA. Academia.edu. 2015. Available online: http://www.academia.edu/7055342/Strategic_Management_Analysis_Tools (accessed on 21 August 2020).
  23. Russo, B.; Sunyer, D.; Locatelli, L.; Yubero, D.; Vela, S.; Martínez, E.; Martínez, G.; Palau, A.; De Prada, M.; Dominguéz, G.; et al. Multi-Hazards Assessment Related to Water Cycle Extreme Events for Current Scenario (Public Summary); D2.4 RESCCUE Project (Public); RESCCUE Project: Barcelona, Spain, 2018. [Google Scholar]
  24. Cardoso, M.A.; Brito, R.S.; Pereira, C.; Gonzalez, A.; Stevens, J.; Telhado, M.J. RAF Resilience Assessment Framework—A Tool to Support Cities’ Action Planning. Sustainability 2020, 12, 2349. [Google Scholar] [CrossRef] [Green Version]
  25. Cardoso, M.A.; Brito, R.S.; Almeida, M.C. Approach to develop a climate change resilience assessment framework. H2Open J. 2020, 3, 77–88. [Google Scholar] [CrossRef] [Green Version]
  26. Martínez-Gomariz, E.; Vela, S.; García, L.; Mendoza, E.; Martínez, M.; Stevens, J.; Almeida, M.C.; Telhado, M.J.; Morais, M.; Silva, I.C.; et al. Multisectorial Resilience Strategies Framework and Strategies Database Development; D5.1 RESCCUE Project (Public); RESCCUE Project: Barcelona, Spain, 2017. [Google Scholar]
  27. Martínez-Gomariz, E.; Guerrero, M.; Martínez, M.; Stevens, J.; Almeida, M.C.; Pereira, C.; Morais, M.; Telhado, M.J.; Silva, I.C.; Duarte, N.; et al. Report on Methodologies for the Selection of Resilience Strategies; D5.2 RESCCUE Project (Public); RESCCUE Project: Barcelona, Spain, 2019. [Google Scholar]
  28. Guerrero-Hidalga, M.; Martínez-Gomariz, E.; Evans, B.; Webber, J.; Termes-Rifé, M.; Russo, B.; Locatelli, L. Methodology to Prioritize Climate Adaptation Measures in Urban Areas. Barcelona and Bristol Case Studies. Sustainability 2020, 12, 4807. [Google Scholar] [CrossRef]
  29. Pagani, G.; Fournière, H.; Cardoso, M.A.; Brito, R.S. Report with the Resilience Diagnosis for Each City; RESCCUE Project (Confidential); RESCCUE Project: Barcelona, Spain, 2018. [Google Scholar]
  30. UNISDR and CML (Lisbon’s Civil Protection Service). Lisbon’s Resilience Action Plan. 2017. Available online: https://www.preventionweb.net/english/professional/policies/v.php?id=56369 (accessed on 2 October 2020).
  31. González, A.; Gabàs, A.; Cardoso, M.A.; Brito, R.S.; Pereira, C.; Russo, B.; Martínez, M.; Velasco, M.; Domínguez, J.L.; Sánchez-Muñoz, D.; et al. Barcelona Resilience Action Plan. In Resilience Action Plans of the RESCCUE Cities; D6.2 RESCCUE Project (Public); RESCCUE Project: Barcelona, Spain, 2020. [Google Scholar]
  32. Stevens, J.; Goodey, P.; Cardoso, M.A.; Brito, R.S.; Pereira, C.; Henderson, R.; Colclough, G.; Evans, B.; Chen, A.; Gibson, M.; et al. Bristol Resilience Action Plan. In Resilience Action Plans of the RESCCUE Cities; D6.2 RESCCUE Project (Public); RESCCUE Project: Barcelona, Spain, 2020. [Google Scholar]
  33. Telhado, M.J.; Morais, M.; Cardoso, M.A.; Brito, R.S.; Pereira, C.; Lopes, R.; Barreiro, J.; Pimentel, N.; Silva, I.C.; Duarte, N.; et al. Lisbon Resilience Action Plan. In Resilience Action Plans of the RESCCUE Cities; D6.2 RESCCUE Project (Public); RESCCUE Project: Barcelona, Spain, 2020. [Google Scholar]
  34. Martínez-Gomariz, E.; Russo, B.; Gómez, M.; Plumed, A. An approach to the modelling of stability of waste containers during urban flooding. J. Flood Risk Manag. 2019, 13 (Suppl. 1), e12558. [Google Scholar] [CrossRef] [Green Version]
  35. Sánchez-Muñoz, D.; Domínguez-García, J.L.; Martínez-Gomariz, E.; Russo, B.; Stevens, J.; Pardo, M. Electrical Grid Risk Assessment Against Flooding in Barcelona and Bristol Cities. Sustainability 2020, 12, 1527. [Google Scholar] [CrossRef] [Green Version]
  36. Almeida, M.C.; Telhado, M.J.; Morais, M.; Barreiro, J.; Lopes, R. Urban Resilience to Flooding: Triangulation of Methods for Hazard Identification in Urban Areas. Sustainability 2020, 12, 2227. [Google Scholar] [CrossRef] [Green Version]
  37. Evans, B.; Chen, A.S.; Djordjević, S.; Webber, J.; Gómez, A.G.; Stevens, J. Investigating the Effects of Pluvial Flooding and Climate Change on Traffic Flows in Barcelona and Bristol. Sustainability 2020, 12, 2330. [Google Scholar] [CrossRef] [Green Version]
  38. Stevens, J.; Henderson, R.; Webber, J.; Evans, B.; Chen, A.; Djordjević, S.; Sánchez-Muñoz, D.; Domínguez-García, J. Interlinking Bristol Based Models to Build Resilience to Climate Change. Sustainability 2020, 12, 3233. [Google Scholar] [CrossRef] [Green Version]
  39. Locatelli, L.; Guerrero, M.; Russo, B.; Martínez-Gomariz, E.; Sunyer, D.; Martínez, M. Socio-Economic Assessment of Green Infrastructure for Climate Change Adaptation in the Context of Urban Drainage Planning. Sustainability 2020, 12, 3792. [Google Scholar] [CrossRef]
  40. Forero-Ortiz, E.; Martínez-Gomariz, E.; Cañas Porcuna, M.; Locatelli, L.; Russo, B. Flood Risk Assessment in an Underground Railway System under the Impact of Climate Change—A Case Study of the Barcelona Metro. Sustainability 2020, 12, 5291. [Google Scholar] [CrossRef]
  41. Russo, B.; Velasco, M.; Locatelli, L.; Sunyer, D.; Yubero, D.; Monjo, R.; Martínez-Gomariz, E.; Forero-Ortiz, E.; Sánchez-Muñoz, D.; Evans, B.; et al. Assessment of Urban Flood Resilience in Barcelona for Current and Future Scenarios. The RESCCUE Project. Sustainability 2020, 12, 5638. [Google Scholar] [CrossRef]
  42. Huber, W. StormWater Management Model (SWMM) Bibliography; Environmental Research Laboratory, Office of Research and Development: Athens, GA, USA; U.S. Environmental Protection Agency: Washington, DC, USA, 1985.
  43. VAW. BASEMENT—Basic Simulation Environment for Computation of Environmental Flow and Natural Hazard Simulation. Version 2.8; ETH Zurich: Zurich, Switzerland, 2018. [Google Scholar]
  44. Russo, B.; Sunyer, D.; Locatelli, L.; Martínez, E.; Almeida, M.C.; David, L.M.; Telhado, M.; Morais, M.; Duarte, N.; Lopes, R.; et al. Multi-Hazards Assessment Related to Water Cycle Extreme Events for Future Scenarios (Business as Usual); D2.3 RESCCUE Project (Confidential); RESCCUE Project: Barcelona, Spain, 2019. [Google Scholar]
  45. Evans, B.; Djordjevic, S.; Chen, A.S.; Velasco, M.; Russo, B.; Martinez, E.; Daura, E.; Vela, S.; Palau, A.; Dominguez, J.L.; et al. Development of Methodology for Modelling of Cascading Effects and Translating Them into Sectorial Hazards; D3.3 RESCCUE Project (Public); RESCCUE Project: Barcelona, Spain, 2018. [Google Scholar]
  46. Evans, B.; Djordjevic, S.; Chen, A.S.; Gibson, M.; Almeida, M.C.; Telhado, M.; Morais, M.; Silva, I.C.; Duarte, N.; Martínez, E.; et al. Impact Assessments of Multiple Hazards in Case Study Areas; D3.4 RESCCUE Project (Confidential); RESCCUE Project: Barcelona, Spain, 2019. [Google Scholar]
  47. Cardoso, M.A.; Brito, R.S.; Pereira, C.; David, L.; Almeida, M.C. Resilience Assessment Framework RAF—Description and Implementation; D6.4 RESCCUE Project (Public); RESCCUE Project: Barcelona, Spain, 2020. [Google Scholar]
  48. Cardoso, M.A.; Brito, R.S.; Pereira, C. Resilience Assessment Framework Tool—RAF APP; D6.5 RESCCUE Project (Public); RESCCUE Project: Barcelona, Spain, 2020. [Google Scholar]
  49. Evans, B.; Djordjevic, S.; Chen, A.S.; Webber, J.; Russo, B.; Forero Ortiz, E.; Martinez, E.; Guerrero Hidalga, M.; Dominguez, J.L.; Almeida, M.C.; et al. Impact Assessments of Multiple Hazards in Case Study Areas (with Adaptation Strategies); D3.6 RESCCUE Project (Confidential); RESCCUE Project: Barcelona, Spain, 2020. [Google Scholar]
Figure 1. Planning process to develop a resilience action plan [17].
Sustainability 12 09017 g001
Figure 2. Lisbon hazard assessment [33].
Sustainability 12 09017 g002
Figure 3. Lisbon flooding hazard maps. Current situation for flooding induced by rainfall or estuary tides (a) and considering climate change for 2050 (b) for flooding induced by estuary tides [33].
Sustainability 12 09017 g003
Figure 4. Lisbon drainage catchments J&L flooding-related hazard maps. Hazard to pedestrians for flooding induced by rainfall for 2100 (a) and impact on waste sector for flooding induced by sea level rise by 2050 and 2100 (b) [33].
Sustainability 12 09017 g004
Figure 5. Overall resilience development of Barcelona, Bristol, and Lisbon [31,32,33].
Sustainability 12 09017 g005aSustainability 12 09017 g005b
Figure 6. Detailed development level for Lisbon: organizational and spatial resilience dimensions [33].
Sustainability 12 09017 g006
Figure 7. Overall of Lisbon resilience assessment for the Organizational dimension regarding the development level [33].
Sustainability 12 09017 g007aSustainability 12 09017 g007b
Figure 8. Impact on hazard assessment of “Promoting urban rehabilitation as a tool to increase resilience: sewer systems” strategy, before (a) and after (b) strategy implementation [33].
Sustainability 12 09017 g008
Figure 9. Lisbon implementation plan [33].
Sustainability 12 09017 g009
Table 1. Barcelona, Bristol, and Lisbon characterization with focus on resilience [17,24,29].
BarcelonaBristolLisbon
Location
-
Catalonia, Spain
-
Northeast coast of the Iberian Peninsula
-
Plain spanning, bordered by the mountain range of Collserola, the Llobregat river in the southwest and the Besòs river in the north.
-
South-west England
-
Predominantly on a limestone area
-
Most of the urban extent is based around the watercourses and river network, with two major rivers flowing through the city (Avon and Frome rivers).
-
Hilly landscape.
-
Portugal’s largest urban expanse
-
Stretching on both sides of the Tagus River
-
process of rapid urbanization and consequent urban sprawl
Population
-
Second most populous municipality within Spain
-
High population density, highest in Europe
-
Second largest city in the southern region, after London
-
One of the most densely populated parts of the UK
-
Complex system
-
More than 1.0 million citizens living, working, studying, circulating and visiting the city
-
Metropolitan area with 2.8 million inhabitants
Major vulnerabilities
-
Natural and environmental threats
-
Set of socio-economic strains brought by the 2008 financial crisis
-
High-risk flooding areas
-
Combination of contextual environmental threats and contingent impacts of CC
-
Financial crisis
Background
-
Commitment to resilience since 2008.
-
Establishment of Urban Resilience Boards
-
Partnerships with UNISDR—within the Making Cities Resilient campaign’s framework
-
Agreement with UN-Habitat to develop the CRPP and with 100 Resilient Cities, among others
-
Bristol Resilience strategy
-
Bristol Green Capital Partnership established in 2014
-
City work in Core City UK and ICLEI, with 100 Resilient Cities, as well as the 2019 One City Plan
-
Implemented Ashton strategy of identification of high-risk areas by conducting studies involving flood-modelling analysis
-
International partnerships such as the Making Cities Resilient campaign’s framework, from UNISDR, the 100 Resilient Cities, and the C40 Cities Network;
-
Strategic and action plans at local level, such as the Municipal Master Plan and the Municipal Strategy for Climate Change Adaptation.
-
Lisbon’s UNISDR Resilience Action Plan [30]
Vision
-
To be a proactive city that adopts a comprehensive approach to tackling the challenge of CC and assume its responsibility in that regard
-
To be a city that can find opportunities in difficulties and adapt to new climate conditions intelligently, generating co-benefits for people and socio-economic activity
-
Setting pillars of a more sustainable Barcelona
-
To be a flourishing, welcoming, and sustainable city, with low carbon emissions addressing the challenges of CC
-
Infrastructures and services flexibly designed and managed to cope with uncertainty
-
To be one of the best cities of the world to live
-
To be a globally more sustainable city at environmental, economic, social, financial, and political level
-
To have the resources managed to safeguard its identity and increase its resilience and to improve the present situation without jeopardizing future generations
RAP Geographical scope and planning horizon
-
City boundaries, mainly urban and peri-urban areas
-
Medium/long-term horizon of 10 years, from 2020 to 2030
-
Bristol City Council administrative area and metropolitan area
-
Medium-term horizon of five years, from 2020 to 2025
-
City boundaries, mainly urban area
-
Medium/long-term horizon, of 10 years, from 2020 to 2030
Note: CC: climate change; C40: network of the world megacities committed to addressing climate change, initially with 40 cities; CRPP: City Resilience Profiling Programme; ICLEI: Local Governments for Sustainability global network; UNISDR: presently UNDRR, United Nations Office for Disaster Risk Reduction.
Table 2. Planning scenarios for climate change for Barcelona, Bristol, and Lisbon [31,32,33].
BarcelonaBristolLisbon
Most probable planning scenarioIntense precipitation- 1-year return period
- Increase of 9–18% to account for CC
RCP4.5 and 8.5
- Period 2071–2100
- 1–5 years return period
- Aggravation of 40% to account for CC RCP 8.5, 10–20 mm
- Year 2115
- 10 years return period
- Relative change of 1 h rainfall intensity in +17%, to account for CC
- Period 2071–2100
Sea level rise- Expected mean sea level rise: +20 cm
- Increase to account for CC RCP4.5
- Period 2071–2100
- Tide level = 8.5 mAOD (Metres Above Ordnance Datum)
- Aggravation of 1.0 m rise to account for CC RCP 4.5
- Year 2120
- Tide level = 1.95 m
Most severe planning scenarioIntense precipitation- 500 years return period
- Increase of 7–26% to account for CC RCP4.5 and 8.5
- Period 2071–2100
- 100 years return period
- Aggravation of 40% to account for CC, 200 mm in 3 h
RCP 8.5
- Year 2115
- 100 years return period
- Relative change of 1 h rainfall intensity in +19%, to account for CC
- Period 2071–2100
Sea level rise- Expected mean sea level rise: = +30 cm
- Increase to account for CC RCP8.5
- Period 2071–2100
- Tide level = 9.4 mAOD
0.5% AEP (Annual Exceedance Probability)
- Aggravation of 1.0 m rise to account for CC RCP 4.5
- Year 2120
- Tide level = 2.81 m
- Year 2100
Table 3. Planned strategies of Barcelona, Bristol, and Lisbon and their impact on dimensions or resilience objectives.
Strategies (Id)Resilience Objectives Impacted
BarcelonaReduce the impacts of flooding events - Provision of Protective Infrastructure and Ecosystems (S2-Spatial);
- Functional and Physical dimensions of stormwater service
Improve the receiving water bodies - City preparedness (O3–Organizational)
- Physical dimension of wastewater and stormwater services
Use alternative water resources to increase water availability- Functional and Physical dimensions of water service
Guarantee security of services provision - All objectives of Organizational dimension
- Spatial Risk Management (S1)
- Functional and Physical dimensions of all services
BristolDevelop community flood plans- Collective Engagement and Awareness (O1–Organizational)
- Spatial Risk Management (S1)
- Functional dimension of stormwater and energy services of
Keep identification of high-risk areas updated by conducting studies involving flood-modelling analysis- Leadership and Management (O2–Organizational)
- Spatial Risk Management (S1)
- Functional and Physical dimensions of all services
Build riverside flood defense walls- Spatial Risk Management (S1); Provision of Protective Infrastructure and Ecosystems (S2-Spatial);
- Functional and Physical dimensions of all services
Reduce surface water runoff and sewer overload by adding raingardens before sewer inlets.- Provision of Protective Infrastructure and Ecosystems (S2-Spatial);
- Functional and Physical dimensions of stormwater service
LisbonAdaptation of green infrastructure (S005)- City preparedness (O3–Organizational)
- Spatial Risk Management (S1); Provision of Protective Infrastructure and Ecosystems (S2-Spatial)
- Functional and Physical dimensions of stormwater service
- Physical dimension of wastewater service
Promoting urban rehabilitation as a tool to increase resilience: sewer systems (S007)- Leadership and Management (O2–Organizational); City preparedness (O3–Organizational)
- Spatial Risk Management (S1); Provision of Protective Infrastructure and Ecosystems (S2-Spatial)
- Functional and Physical dimensions of all services
Promoting urban rehabilitation as a tool to increase resilience: facing climate change (S008)
Construction of new components in drainage system (S016)
Strengthening collaboration within AML, Parishes and municipality departments (S010)- All objectives of Organizational dimension (O1, O2, O3)
- Spatial Risk Management (S1)
- Functional and Physical dimensions of all services
Lisbon urban drainage monitoring and early-warning system (S017)- Leadership and Management (O2–Organizational); City preparedness (O3–Organizational)
- Spatial Risk Management (S1)
- Functional dimension of all services
Building protections for urban electrical infrastructure, exposed to estuarine flood (S019)- City preparedness (O3–Organizational)
- Spatial Risk Management (S1); Provision of Protective Infrastructure and Ecosystems (S2-Spatial)
- Functional and Physical dimensions of all services
Table 4. RAP monitoring and review for Barcelona, Bristol and Lisbon [31,32,33].
BarcelonaBristolLisbon
MonitoringReviewMonitoringReviewMonitoringReview
Periodicity2 years10 yearsYearlyYearly2 years10 years
Responsible bodyBarcelona City CouncilBristol City CouncilLisbon Municipality
ActivitiesMonitoring:
-
Trace strategies implementation
-
Acknowledge resilience improvements or setbacks
-
Identify unexpected facts with impact on resilience
Review:
-
Analyze monitoring results
-
Re-think SWOT
-
Re-think TOWS
-
Re-think previously identified and postponed strategies
-
Evaluate updated knowledge on climate change
- Evaluate monitoring process
Publisher’s Note: MDPI stays neutral with regard to jurisdictional claims in published maps and institutional affiliations.

