Article

A Research on the Relationship between Environmental Sustainability Management and Human Development

Graduate Institute of International Business Administration, Chinese Culture University, 55, Hwa-Kang Road, Yang-Ming-Shan, Taipei 11114, Taiwan
*
Author to whom correspondence should be addressed.
Sustainability 2020, 12(21), 9001; https://doi.org/10.3390/su12219001
Submission received: 29 September 2020 / Revised: 22 October 2020 / Accepted: 23 October 2020 / Published: 29 October 2020

Abstract

:
The study explores the relationship between environmental performance and human development. A canonical correlation analysis was conducted to discover the maximum correlation between environmental performance and human development with the optimal estimated weights for indicators as constituting the composite indices. The results show that environmental health—being the most decisive—and ecosystem vitality are important indicators for representing the environmental performance. Other important indicators, in declining order, for constituting the human development index are mean years of schooling, expected years of schooling, and life expectancy at birth, with gross national income (GNI) being the last with relatively low weight. The canonical environmental performance index has utmost effect on mean years of schooling, then expected years of schooling, with explanatory power of more than 70% for both. Effect on life expectancy at birth is more than 60%, but only less than 30% on GNI. The canonical human development index has the highest explanatory power with nearly 80% for environmental health, but only 40% for ecosystem vitality. Both canonical composite indices reach a high correlation of 91% and the mutual explanatory power is 83%, confirming that environmental performance and human development are indeed positively and highly correlated.

1. Introduction

In the past decade or two, the problem of environmental pollution has become more and more serious, raising concerns about environmental protection. Mankind has also begun to attach importance to the issues of environmental health and environmental ecology. The performance of environmental protection lies in the control of environmental pollution, the prevention of pollution deterioration, the protection of human beings from environmental pollution, and the auxiliary improvement of healthy environmental quality [1]. Therefore, to understand the extent and effectiveness of global environmental management, the Yale Center for Environmental Law and Policy established an environmental performance index (EPI) in 2006 in order to evaluate the effectiveness of environmental management [2]. In the international standard [3], an environmental performance index was defined as a “specific expression that provides information about an organization’s environmental performance” [4]. A framework was further proposed for managing the environmental aspects of an organization (through the development of formal processes and procedures). EPI is in fact a more complex, more result-oriented quantitative indicator which plays an important role as designed to provide a context for evaluating performance of transnational comparison and can easily be used by policy makers [5]. Environmental performance includes two environmental sub-dimensions, namely, environmental health and ecosystem vitality [6]. The goal is to reduce environmental stress for human health, effectively manage natural resources, and improve ecosystem vitality [6]. The biggest value of the environmental performance index is not to offer a basis for country ranking but to provide in-depth data analysis so as to distinguish between advanced countries and the ones that fall behind, further as a tool to promote environmental progress [7].
With a growing global awareness of environmental protection, researchers have begun to actively explore the related issues. Previous literature on environmental management can be divided into three main topics. First, some studies have tried to assess environmental sustainability for certain urban [8], region [9,10], or industry [11]. The past literature usually adopted the “aggregated” environmental performance index score as the research variables, ignoring the underlying internal relationship between the sub-constructs of environmental performance (i.e., environmental health and ecosystem vitality). Moreover, the previous literature usually considered the “aggregated” index of environmental performance with predetermined weights in the analysis, which is actually too subjective. This leads to the second topic category of studies focusing on the discussion of weights for aggregating environmental performance. Authors had tried to estimate aggregating weights with methodologies such as factor analysis or principal component methods [12,13,14]. Third, scholars have also begun to examine the factors that may be related to the environment [1,15,16], among which economic factors receive the most attention [17]. Economy is one of the aspects of human development and the degree of economic development also means the state of human development [18]. Henceforth, in addition to the relationship between environment and economy, a number of studies have expanded their scope to explore the correlation between environmental management and human development [7,19,20]. The concept and measurement of human development is established in response to sustainable economic growth in order to improve the quality and quantity of people’s living standards, to satisfy people’s needs, and also to understand the situation and process of human development in various countries [21]. Today, the most widely used on the application aspect is the human development index (HDI) proposed by the United Nations Development program (UNDP) in 1990 [22]. UNDP consistently reported ranking and the descriptive statistics of HDI for all countries to reflect the world economic income and the current situation of social development of all countries. In UNDP’s report, it specifically pointed out that the HDI is essentially designed for various countries around the world [23].
As aforementioned, in order to understand the relation between environmental management and human development, many studies in the literature have put in much effort on the subject, however, contradictory results were presented. Generally, the literature tends to suggest that environmental management and human development have a positive relation. For example, Panayotou [19] studied the relationship between environmental degradation and economic development and found that overall environmental degradation (including the combination of resource depletion and pollution) is most severe when per capita income is less than US $1000; as income rises, so does the degree of pollution reduction. Shafik [24] also suggested that for economies with a per capita income of more than $12,240, a 1% increase in per capita income will cause the concentration of sulfur dioxide to drop by more than 1%. Kaufmann et al. [25] found that as per capita GDP was between 3000 and 12,500 USD, the concentration of sulfur dioxide would decrease with the increase of per capita GDP, and the concentration of sulfur dioxide would also increase with the decrease of per capita GDP; that is, per capita GDP was inversely proportional to the concentration of sulfur dioxide. Orlitzky et al. [26] also believed that improving financial and economic performance could turn environmental sustainability into a competitive advantage, and their study also showed a positive correlation between financial/economic performance and environmental sustainability. The US Environmental Protection Agency (EPA) pointed out that environmental pollution can affect the health level of the HDI and cause it to decline [27]. In terms of the overall HDI, it was found that the countries with the highest HDI scores had relatively small changes in environmental performance, and their corresponding rankings in the overall HDI were all in the leading position [18]. In other words, the lower the HDI score is, the worse the environmental performance becomes. The research of Liu et al. [7] also shows that the better a country’s economic situation is, the higher the country’s HDI and EPI scores would be. Therefore, the aforementioned literature generally suggested that there exists a positive relationship between environmental management and human development.
On the other hand, certain arguments exist claiming that environment management and human development are negatively correlated. Studies with negative views believe that economic development will bring more environmental pollution, such as increased concentration and emission of sulfur dioxide [28]. Against this background, we post our research questions as follows.
  • Is environment performance positively or negatively correlated with human development?
  • Are the dimensions of environmental performance (i.e., environmental health and ecosystem vitality)/human development (i.e., life expectancy at birth, expected years of schooling, mean years of schooling, gross national income (GNI)) internally correlated?
  • What would be the most appropriate weights in aggregating environment performance index/human development index?
  • Are there any cross-correlations between the dimensions of environment performance and the ones of human development?
  • To what extent does the individual dimension of HDI affect each facet of environmental performance?
Thus, this study aims to explore the relevance between environmental performance and human development. First, the internal correlation for environmental performance and human development is investigated. Then, we apply the canonical correlation analysis to estimate the optimal composition weights in aggregating environmental performance and human development indices. This methodology can guarantee to achieve maximum correlation between the aggregated environmental management and human development indices with canonical weights. The size of the weights can be used to determine the importance for each indicator in aggregating environmental performance and human development indices and would be further adopted to inspect the inter-correlation between individual measures of environmental management and human development.
Our analysis confirms the essential relevance between environmental performance and human development. The key factor in representing human development is found to be the mean years of schooling, followed by the expected years of schooling, while environmental health is the decisive factor in representing environmental performance. Specifically, through the high correlation between HDI and EPI, we find the most important and direct linkage between environmental health and education (expected years of schooling). Nevertheless, the commonly used economic factor, gross national income (GNI), is relatively weak in explaining environmental management. The result of this study contributes to clarify the controversy in the literature regarding the relevance between environmental management and human development which can be used as an important reference for future decision-making in environmental management and human development.
Our paper proceeds as follows: In Section 2, we provide further background by discussing the limitation in index aggregation and weighting methodologies for environmental performance and human development in the past literature. The controversy for the relevance between these two indices is also discussed. In Section 3, we describe our universal country level data including four variables for HDI and two for EPI. The analytical methodology of index aggregation is stated. In Section 4, we first provide descriptive statistics and correlation for six indicators, then turn to empirically assessing the relationship between the environmental performance and human development using canonical correlation approach. In Section 5, we begin by reporting the overall results then discuss the degree of importance for each indicator in representing the aggregated index. In particular, the high and low cross-correlation between indicators of the environmental performance and human development are further discussed.

2. Literature Review

2.1. Environmental Performance

Pearce [29], in his “Blueprint for a Green Economy”, for the first time incorporated environmental factors into the decision-making of business operation. After years of development, the level of environmental performance evaluation has expanded from enterprises to organizations and then to governments and regions, which means that environmental performance evaluation has developed from the micro level to the macro level. Thoresen [30] proposed that the environmental performance index actually covers the micro level and also the macro level. Therefore, in this study, the concept, construction, and measurement of environmental performance will be explored for global countries at macro level.
In the “Performance Monitoring Indicators Handbook”, Moses and Sontheimer [31] proposed a logical framework and the general concept for developing environmental performance indicators (EPIs) including their linkage to the objectives of environmental projects and also their impact on World Bank’s work. The Second Edition Note further discusses the design and the use of EPIs for assessing the performance of World Bank projects in relation to environmental issues [31]. Thereafter, Segnestam and Washington [32] proposed seven criteria as reference for indicator selection of EPIs: (1) Has a close link to project objective; (2) limitation in indicator number for better effectiveness; (3) clear indicator definition; (4) realistic consideration for development cost regarding indicator collection; (5) identification of appropriate measures with clear causal links; (6) adopting indicators with high credibility; (7) using reliable information to derive indicator; (8) ability to obtain indicator measures at three time points (beginning, during, and ending) of a project for assessment comparison.
On the basis aforementioned, the environmental sustainability index (ESI) was developed and published for four consecutive years from 2002 to 2005. However, the environmental sustainability index covers a wide scope, including economy, environment, and society [33]. Then in 2006 the Yale Center for Environmental Law and Policy in US, Center for International Earth Science Information Network of Columbia University, the World Economic Forum, Joint Research Centre of the European Commission confined the measures involved, mainly within the range of environmental issues centered on the government [1]. They together proposed the environmental performance index (EPI) which evaluates every two years with the evaluation scope at the global level [6]. The environmental performance index can be used as a tool for environmental assessment and improvement with more specific and profound scope as compared to environmental sustainability index. The specific purposes of environmental performance evaluation include: (1) To evaluate the current state of environmental performance; (2) to provide guidance basis for government in policy making. The environmental performance is evaluated in a cycle of two years for further improvement. The indicator selection criteria includes refining indicators which comprise new environmental problems of concern, to adopt the best available proxy which comes from transparent data sources and methods with good quality in order to assess performance. In computing composite indices, these issues also need to be considered: indicator and country selection, missing data treatment, standardization, aggregation and weighting methodologies, and performance testing [1].
This construction of the environmental performance index is basically in line with the suggestion of [1] for EPI which can serve as four reference standards for indicator selection criteria: (1) Relevant to various conditions related to the environment of a country; (2) suitable for assessing performance; (3) transparent data sources and methods which can provide a baseline and be tracked over time; (4) credible data quality.
EPI consists of two dimensions: health and ecosystem vitality. After the countries around the world have precisely defined environmental dimensions, the availability of data has been enhanced, and the evaluating targets for environmental performance have expanded year by year, from 133 countries in 2006 [1] to 149 countries in 2008 [34], 163 countries in 2010 [6], and only 132 countries in 2012 [35]. In 2014, 178 countries [36] increased to 180 countries in 2016 [18].
The indicators of environmental performance index were adjusted continuously with the biennial study. EPI in 2006 had 16 indicators, including child mortality, indoor air pollution, drinking water, adequate sanitation, urban particulates, regional ozone, nitrogen loading, water consumption, wilderness protection, ecoregion protection, timber harvest rate, agricultural subsidies, overfishing, energy efficiency, renewable energy, CO2 per GDP (kg per PPP $ of GDP) [1]. In 2008 EPI increased to 25 indicators with wider and more in-depth measures, including environmental burden of disease, adequate sanitation, drinking water, indoor air pollution, urban particulates, local ozone, regional ozone, sulfur dioxide emissions, water quality index, water stress, conservation risk index, effective conservation, critical habitat protection, marine protected areas, growing stock, marine trophic index, trawling intensity, irrigation stress, agricultural subsidies, intensive cropland, burnt land area, pesticide regulation, emissions per capita, emissions per electricity generation, industrial carbon intensity [34].
In 2010 25 EPI indicators remained, but some indicators were replaced by new ones; some indicators were re-defined and therefore were different from the original ones, including environmental burden of disease, indoor air pollution, outdoor air pollution, access to water, access to sanitation, sulfur dioxide emissions per populated land area, nitrogen oxide emissions per populated land area, non-methane volatile organic compound emissions per populated land area, ecosystem ozone, water quality index, water stress index, water scarcity index, biome protection, marine protection, critical habitat protection, growing stock change, forest cover change, marine trophic index, trawling intensity, agricultural water intensity, agricultural subsidies, pesticide regulation, greenhouse gas emissions per capita (including land use emissions), CO2 emissions per electricity generation, industrial greenhouse gas emissions intensity [6]. In 2012 EPI decreased to 22 indicators, namely child mortality, particulate matter, indoor air pollution, access to sanitation, access to drinking water, sulfur dioxide emissions per capita, sulfur dioxide emissions per GDP, change in water quantity, critical habitat protection, biome protection, marine protected areas, agricultural subsidies, pesticide regulation, forest growing stock, change in forest cover, forest loss, coastal shelf fishing pressure, fishing stocks overexploited, CO2 per capita, CO2 per GDP, CO2 emissions per electricity generation, renewable electricity [35]. In 2014 EPI had a further reduction to 20 indicators, namely child mortality, household air quality, air pollution—average exposure to PM2.5, air pollution—excess PM2.5, access to drinking water, access to sanitation, wastewater treatment, agricultural subsidies, pesticide regulation, change in forest cover, coastal shelf fishing pressure, fish stocks, terrestrial protected areas (national biome weights), terrestrial protected areas (global biome weights), marine protected areas, critical habitat protection, trend in carbon intensity (weighting varies according to GDP), change of trend in carbon intensity (weighting varies according to GDP), change in CO2 emissions from electricity and heat production, access to electricity [36]. In 2016 EPI even further reduced to 19 indicators, including seven for the health dimension and 12 for the ecological system dimension. The seven indicators of the health dimension are environmental risk, indoor air quality, average suspended particle exposure, excess number of suspended particles, average nitrogen dioxide exposure, quality of drinking water, and unsafe environmental hygiene. The indicators of the ecological system dimension [8] are wastewater treatment, nitrogen use efficiency and nitrogen balance, the forest coverage rate change, fish resources, land reserve (biomass proportion), land reserve (global biomass proportion), species protection (country), species protection (global), marine protected areas, change in CO2 emissions from electricity and heat production, carbon intensity.
According to past literature, some scholars reasoned that there exists internal correlation between environmental performance indicators in the same construct. Rapport et al. [37] argued that the ecological system dynamic target can provide ecosystem services for human society, such as drinking water and clean air. A healthy ecosystem has stability and sustainability since it contains all kinds of complementary ecosystem vitality with ability for required adjustment so as to restore damage. Therefore, the environmental performance indicators are relevant to each other. Jerry et al. [38] believed that the ecosystem vitality composed of natural environment and artificial environment is a complete and healthy system. The research pointed out that the conceptual framework of ecosystem vitality includes complete environmental health. Humans need health and society also needs health, hence ecosystem vitality is related to environmental health. Zhang et al. [39] pointed out that ecosystem and environmental health are able to keep humans healthy, make rational use of resources, and provide environmental quality suitable for human survival, which indicates that ecosystem and environmental health are interconnected and therefore interrelated with each other.
However, there are some researchers who believe that there is no internal correlation between environmental performance indicators in the same construct. Wicklum and Davies [40] claimed that ecosystem vitality was a false argument, as it did not involve the concept of health, so that ecosystem vitality and environmental health could not be supported by ecological theory and had no correlation with each other. Therefore, the specific internal correlation between these two dimensions of environmental performance and health and ecosystem vitality needs to be further analyzed and discussed.

2.2. Human Development

The human development index (HDI) was proposed by the report of United Nations Development Program (UNDP) for the first time in 1990. When HDI was first proposed, it only used partial classes of variables and the data quantity is quite limited, because too much data may not necessarily achieve satisfactory results and the focus may also deviate due to too diversified and excessive variables. In order to find out the key variables, UNDP suggested that the human development index should cover two dimensions: (1) The formation of human capabilities such as improved health, knowledge, and skills; (2) the use people make of their acquired capabilities such as engaging in political, cultural, social, and leisure activities [41]. Human development is about increasing human choices by expanding human capabilities [42]. Moreover, human development is concerned with the ability of all human beings to choose, to allow them to live the life they choose, and to provide them with the conditions and opportunities to realize such choices [43]. It can be seen from the above that human development embraced a people-oriented concept as its core, with “choice” and “feasible capacity” as its focus.
Nobel economics prize winner Amartya Sen argued that the indicators of HDI are in a constant state of alteration [44], and the influence to this changing state of the HDI is derived from the purpose to eradicate the obstacles that refer to the barriers to bodily health, literacy, people’s politics and freedom, and lack of resources [45]. UNDP scholars proposed in 1990 [21] that there are three basic human needs, and these three basic needs constitute three dimensions that are the focus of HDI measurement, which are described as follows:
(1)
Health: Health is measured in human life expectancy at birth as a standard. Most of the people around the world hope they can live long because the longer the life is, the more hope and opportunities one can have to implement in their living plan to achieve the expected life goals. Life expectancy also covers the connotation of human health and nutrition intake, which is linked to the perception of health and longevity.
(2)
Education: Education is based on the expected years of education and average years of education is a common measure. The promotion of human education must rely on the progression for universal access to education. The quality of education, education scale, and education level all require establishing goals and plans for the mission of education, which is towards the full development of human beings.
(3)
Living standard: Living standard is measured by GNI, which reflects the living condition of people in all countries and measures the well-being of residents in a country or region. The goal is to enable people to live a decent life and improve their quality of life.
Since the introduction of the HDI over 20 years ago, there have been several revisions, but there have been nearly no changes in the way HDI is measured. UNDP studies and discusses the issues arising from the HDI every year as part of the annual human development report.
Therefore, HDI in continuous adjustment has an influence on human beings and is generally recognized and accepted by many countries. Haq [46], in response to the 1990 human development index report, proposed that economic development should be shifted from targeting national economic income to people-oriented policies. After all, the original design of HDI was to overcome the downside of GNI as a measure, with a belief that HDI should focus on human well-being rather than economic development [47]. Pineda [48] pointed out that HDI is a tool for assessment and analysis that can be used in the government, media, and national society to show the development and differences between various countries. A 2016 human development report pointed out that human development is people-centered, based on and continuously expanding the scope beyond emphasis on having a happy life. In terms of the present stage, the purpose of human development is to improve the quality of life for human beings, to view social values, constraints, and norms, to encourage human beings to take associativity and mutual assistance as the primary point of view, and with justice and good faith to eliminate tension, confrontation, and competition in order to gradually eliminate national crisis and risk. This should promote the capacity of different social groups, since, if a situation is affected by tension, vulnerable countries or ethnic groups will become the main victims, impacting on the development of human progress.
HDI can be used to measure and compare human development in different countries and regions [5,7], promoting the progress of human development and maintaining the well-being of human development. HDI focuses on three dimensions, namely health level, education level, and living standard, while UNDP selects four representative indicators in calculating HDI, including life expectancy at birth, expected years of schooling, mean years of schooling, and GNI [21].
In past literature, scholars have also made different appraisals on the HDI, which are mainly allocated into two aspects. On one hand, they discuss the suitability of human development indicators. Kelly [49] believes that the integration of human development index is too subjective. Srinivasan [50] believed that the HDI adopted too few indicators, which would lead to relatively low efficiency. As some scholars have doubts about the HDI, some studies have attempted to modify and adjust it. For example, Lind [51] proposed revision opinions on the design and methods used for HDI. Ogwang [52] argued that the HDI relied too much on mathematical reasoning and calculation, causing it to lose its essential meaning and the characteristics of human development. Hicks [53] proposed to correct the imbalance of HDI so that it could become a standard reflecting the balanced level and distribution of human development. Sagar and Najam [54] argued that, over the years, the human development index report seems to stand still, repeating the same words, but not necessarily increasing the effectiveness of the HDI. They recommended three simple modifications to be implemented in the index: (1) The components of the HDI must be multiplied rather than averaged; (2) in calculating the standard-of-living, the logarithm of GDP across all global income ranges should be used; (3) inequality on component dimensions must be taken into account as constructing the evaluation performance index.
The study of Hopkins [55] found that the three basic elements of human development are actually a composite index for living standards, however, the HDI could be limited from simply the aspect of economic policy. For example, following the enclosed economic policy, it involves mainly food, health, housing, and education, but after 1978, for the open economy policy, the main thing is to reduce spending on social welfare and to accelerate the economic growth in order to improve living standards. Since the lack of a detailed analysis of the basic needs in the early stage of humans in the human development report, it is suggested that the HDI should be further developed with comprehensive thoughts on human development.
Noorbakhsh [56] further argued that countries at different stages of development have different development conditions. Hence, for developing countries a human development index suitable for these countries should be considered or established specifically. Gustav, et al. [57] adopted the dimensions of human development defined in the past to verify the correlation between several variables with HDI. The results showed that under the age of five, mortality and HDI have high correlation, which revealed that the measurement of human development can effectively reflect the child mortality rate.
Another aspect of research in previous literature focuses on the suitability of weights in combining human development index. Numerous studies used various analytical methods to build a more suitable HDI. For example, Noorbakhsh [13] used the weights from factor analysis to construct HDI. Lai [14] believed that if principal component analysis was used in forming HDI, it could be more meaningful in terms of cross-sectional and longitudinal aspects. Muhammad [58] verified by population-weighted principal component analysis that education in Pakistan had a greater impact on HDI, while GNI had a smaller impact. Antonio [59] proposed a revised algorithm and developed a new calculation method for HDI.
For a deeper understanding of human development and its impact, in past research some scholars further explored internal correlation among human development indicators, or their relationship with other variables. Booysen [12] stated that the three sub-dimensions of HDI may be highly inter-correlated, and the idea that the contribution or influence on HDI from these three constructs may remain the same is too subjective and may mask the discordant phenomenon in HDI. However, Noorbakhsh’s [13] study argued that there is no internal correlation among the three sub-dimensions or four indicators of HDI. Therefore, the specific correlation between internal indicators of human development needs to be further analyzed.

2.3. Environmental Performance and Human Development

At a time when global environmental protection awareness is rising, factors that may be related to the environment, especially the economy, are of great concern. Panayotou [19] studied the relationship between environmental degradation and economic development. The research result indicated that when the per capita income was less than US $1000, the overall environmental degradation (including the combination of resource exhaustion and pollution) was the most serious. With the increase of income, the degree of pollution reduction also increased. Shafik [24] conducted an empirical study on the relationship between economic development and environmental performance with a large number of long-term national samples. Water and sanitation is one of the earliest environmental problems that needs to be addressed because the associated costs are relatively low; the problem of air pollution is solved when a country reaches the middle-income level, because middle-income economies can easily afford the economic costs of air pollution; environmental improvements in most countries require environmental policies and investments to reduce environmental degradation. Hence this research suggests that economic growth can reduce environmental damage. Serghini et al. [60] used principal component analysis to verify the relationship between the HDI and health level, and the study showed that the HDI was highly and positively correlated with health level. Orlitzky [26] also believed that the improvement of financial and economic performance would affect environmental sustainability. Gallego et al. [20] used 149 samples of countries with different geographical regions and concluded in the empirical analysis that socio-economic factors, such as economic wealth, education, and institutional factors, were decisive factors in the analysis of national environmental performance. Therefore, most results from past literature tend to generally support that economy and environment are positively correlated.
In addition to economics, many studies have expanded to explore the relationship between human development and the environment. EPA [61] pointed out that environmental pollution would affect the health level of HDI and reduce the health level. A 2016 environmental performance index report has discussed the relationship between the HDI and EPI in terms of the overall index score. The report mentioned that, for countries with higher HDI scores, their changes in environmental performance are small and, at the same time, these countries are in a leading position for the overall EPI ranking. The lower the HDI scores are, the worse their environmental performance will be [1].
Liu et al. [7] presented a comparative study using Pearson correlation analysis and showed that the index of sustainable development is negatively correlated with HDI, and also negatively correlated with EPI. Although the study did not examine the direct relationship between human development and environmental performance, it may be inferred indirectly that human development could be positively correlated with environmental performance. To sum up, in the past literature there seems to be a positive correlation between human development and environmental performance.
However, some studies have also pointed out that there is not necessarily a correlation between the environment and human development. Kaufmann et al. [25] found that the high per capita GDP in developed countries means more money is being spent on cutting emissions, so sulfur dioxide emissions are falling. However, the reduction of sulfur dioxide emissions does not necessarily mean that the concentration of sulfur dioxide will decrease. Concentrations are reduced by the adoption of policies and technologies that reduce emissions. Hence, environmental policy and the resultant reduction in emissions may be attributed to the spatial intensity of economic activity, instead of the differences in per capita GDP. Ahmad et al. [62] used country data around the world from 2006 to 2010 to examine the relation between human development and environmental performance. The results pointed out that the developed countries with higher HDI do significantly improve their environment, but at the same time developing countries with high HDI fail to do so. Ahmad et al. [62] and Kaufmann et al. [25] also came up with similar conclusions for this part. To sum up, the relationship between human development and environmental performance has shown positive or irrelevant results in previous literature, which also shows that the relationship between human development and environmental performance needs to be studied and analyzed more carefully.

3. Data and Methods

3.1. Variables and Data

The data in this study contain the human development index and environmental performance index of 2016. The HDI data are from UNDP website (http://hdr.undp.org/en/composite/HDI), containing a total of 188 countries and four variables, namely life expectancy at birth, expected years of schooling, mean years of schooling, GNI. EPI data are from the Environmental Performance Index website (http://epi2016.yale.edu/downloads) with a total of 180 countries and two variables: environmental health and ecosystem vitality. For the inspection purpose of correlation relationship between HDI and EPI in this study, any country with EPI or HDI only would be treated as missing and therefore excluded from the analysis to ensure the countries considered in this analysis have data values for all six variables from both categories; four for HDI and two for EPI. Consequently, there were 155 countries considered in the analysis.

3.2. Canonical Correlation Analysis

Canonical correlation analysis (CCA) was proposed by Hotelling [63] for a purpose of describing linear relationship between two sets of multidimensional variables. CCA can be seen as the problem of finding basis vectors for two groups of variables such that the correlation between the projections of the variables onto these basis vectors are mutually maximized. The linear combination of the first and second sets of variables are referred to as canonical variate pair. CCA is to find linear combinations that maximize the correlations between the members of each canonical variate pair. The weights comprising of the basis vectors will be estimated based on the data and hence CCA can be easily motivated in information-based tasks. The size of the canonical correlation coefficient represents the strength of the relationship between each pair of canonical variables, and the larger the correlation is, the stronger the relationship is. Test of canonical function of canonical correlation coefficient can conclude that the correlation between the two linear combinations from each group of variables is statistically significant as p-value of F test is less than a significant level (e.g., 5%). If the canonical correlation coefficient does not reach statistical significance, it is not worth explaining. An analysis of the relationship between linear combinations of independent and dependent variables can explain the relative contribution of canonical variable to the canonical function. The statistical software SPSS23.0 and SAS Enterprise Guide 6.1was used for the data analysis.
Application of CCA here can provide the optimal linear combination of indicators with appropriate weights, in order to objectively evaluate the relationship between two groups of variables; environmental performance and human development. This approach will be in line with the suggestion by [12,13,14] who adopted principal component analysis or factor analysis to obtain a combination of indicators for a more objective integration technique. CCA applies the similar concept as a general regression approach which uses explanatory power to interpret a relationship between two variables, which may not actually represent the causal effect of the independent variable on the dependent variable. However, CCA is adequate to provide sufficient information to validate the correlation between variables and, therefore, in the setting of cross-sectional approach, it is usually adopted to comment on the relationship [64].

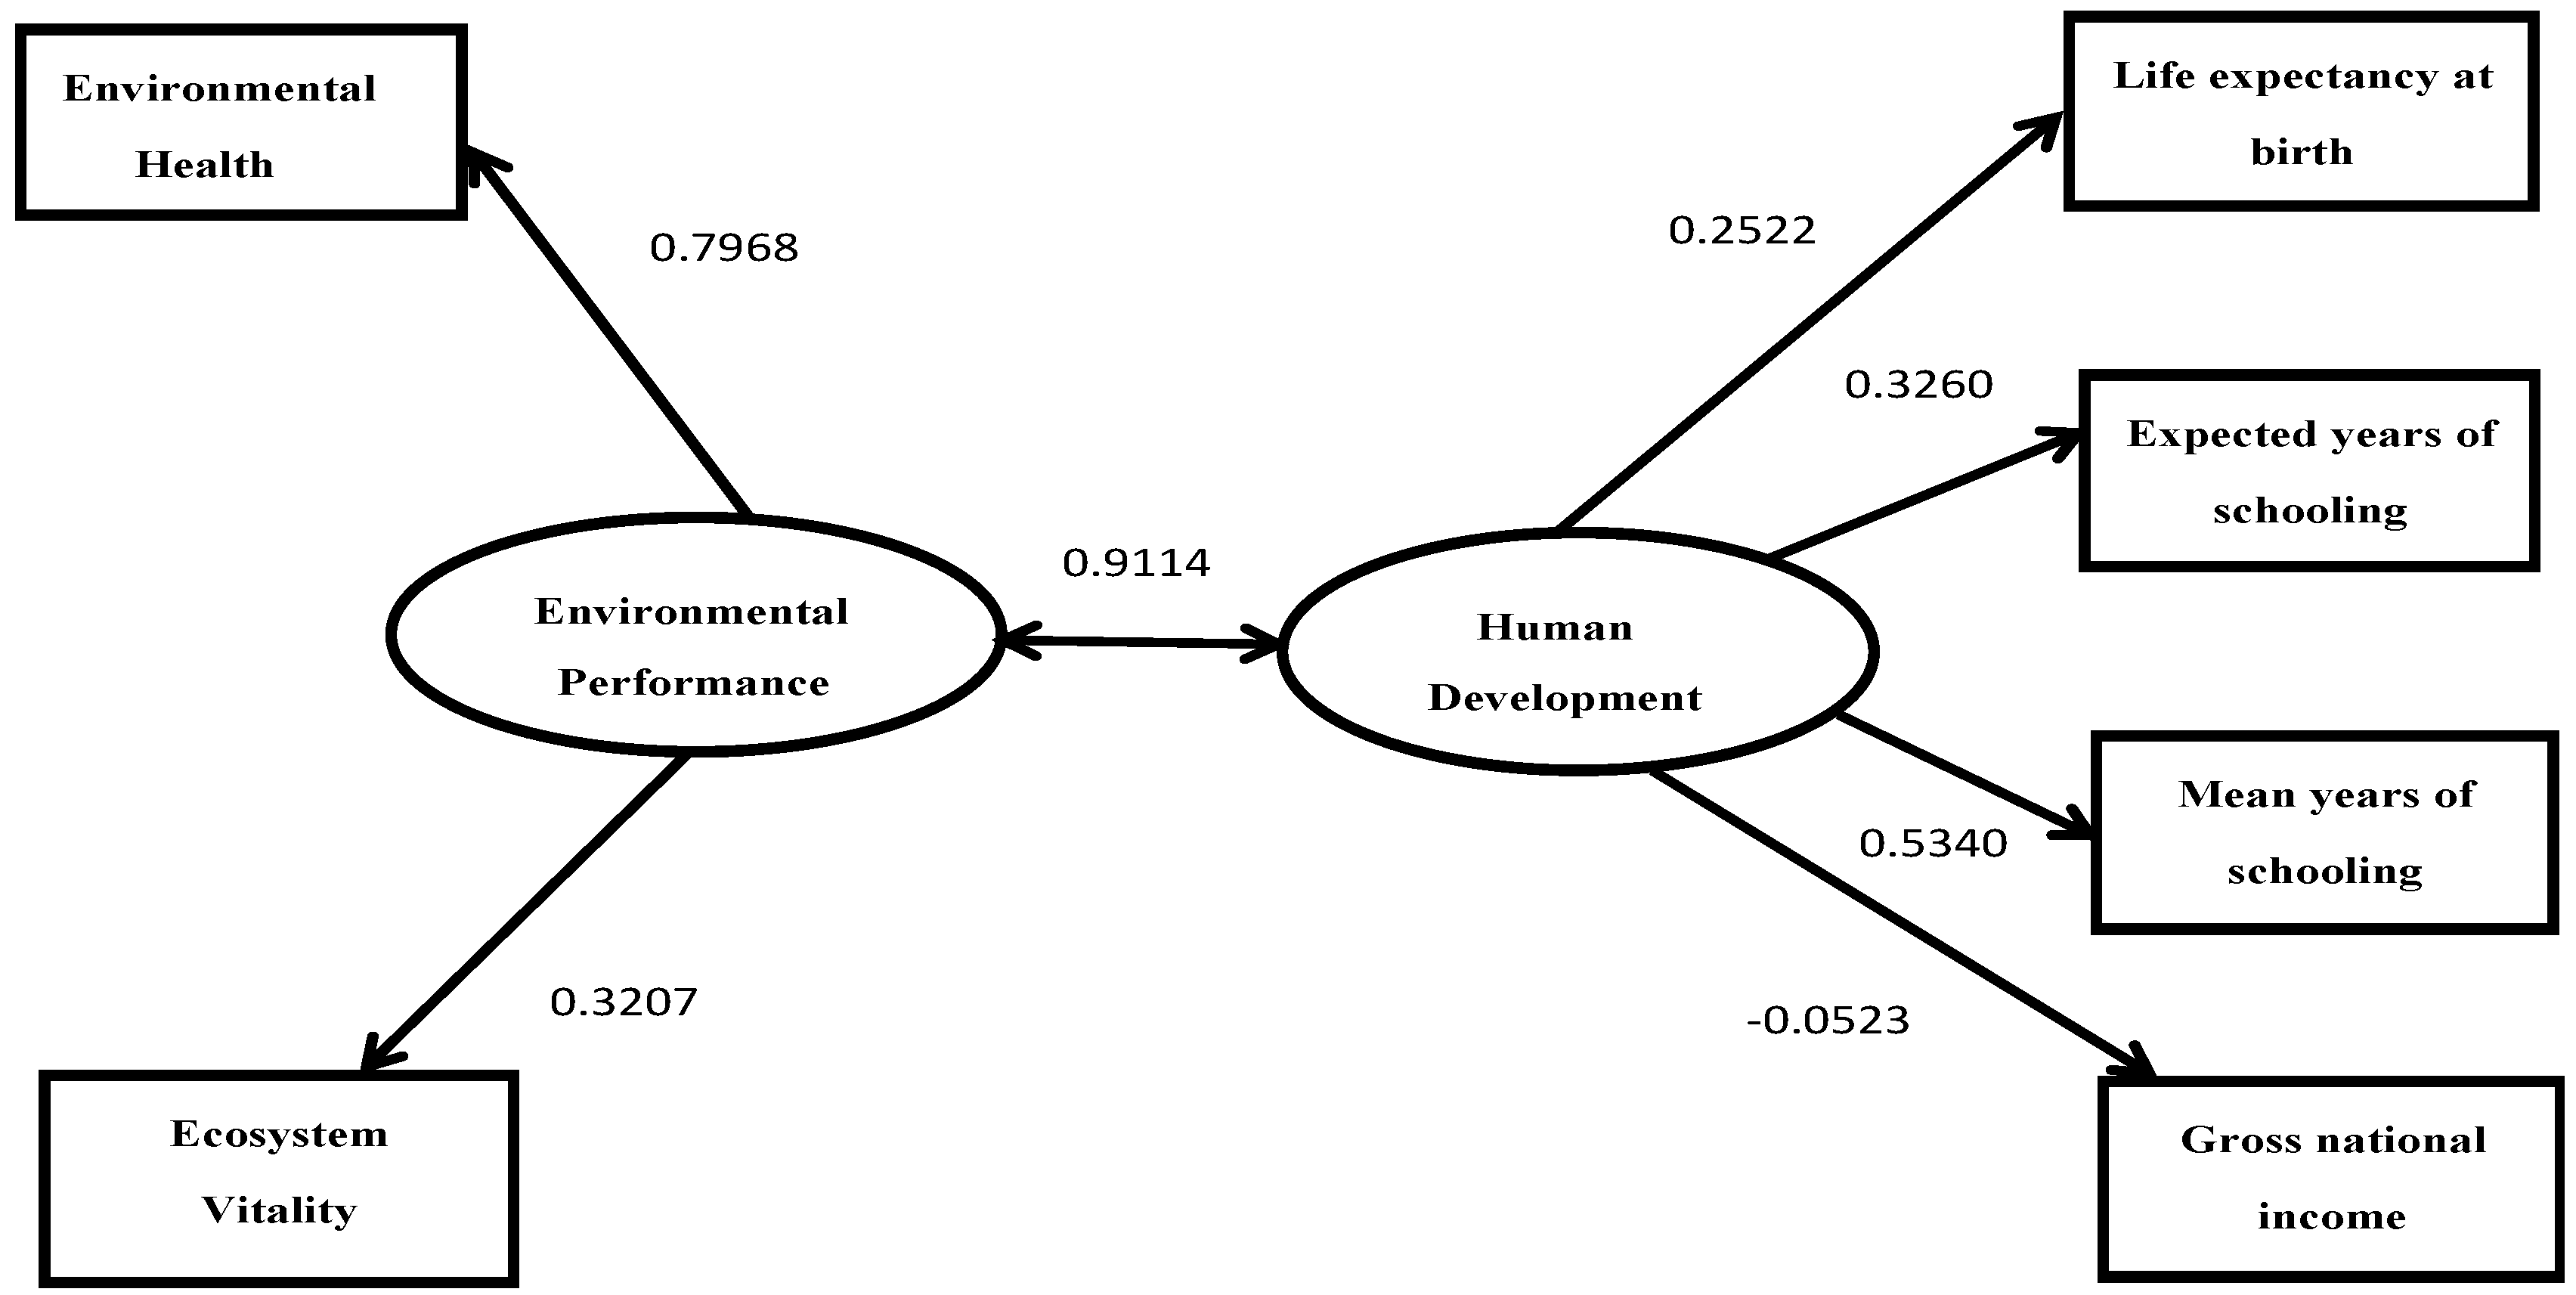
4. Empirical Results

CCA is carried out on two groups of variables, two for EPI and four for HDI, respectively. Table 1 shows the descriptive statistics for these six variables and Table 2 gives the canonical test. As shown in Table 2, the canonical correlation coefficient for the first set of estimated canonical variate pair is 0.9114, and the eigenvalue value is 4.9027. For the second set, the canonical correlation coefficient is 0.2547 and the eigenvalue value is 0.0694. Only the eigenvalue value for the first canonical correlation is greater than 1, indicating simply the first pair estimated canonical variate pair has sufficient explanatory power. Moreover, the correlation of the first set canonical variate pair is significantly higher than that of the second set, and the p-values of Wilks’ lambda, Pillai’s trace, Hotelling-Lawley trace, Roy’s greatest root, and probability ratio and approximate F value are all <0.0001, indicating that the canonical variable EPI of the first set has a significant correlation with the HDI canonical variable. The p-value of the correlation test for the second set canonical variate pair is 0.0178 (greater than α = 0.01), which is considered as insignificant. Furthermore, based on the eigenvalues, it shows that one canonical variable of the first canonical variate pair can explain 98.6% of the variation and information content in another canonical variable of the same set canonical variate pair. By including the second canonical variate pair, the variation explained can only improve the remaining 1.4%, which is considered inefficient. Therefore, this study only selects the first set canonical variate pair for the subsequent analysis and interpretation of the results. From the above, it is found that there is a significant correlation between EPI and HDI canonical variables, which shows very high explanatory power mutually.
The internal correlation among the four indicators of human development canonical variables (Table 3) shows that the linear correlation between expected years of schooling and mean years of schooling is the highest, exceeding 0.8. The correlation coefficients between life expectancy at birth and expected years of schooling, mean years of schooling are all more than 0.7. The correlation coefficients between GNI and life expectancy at birth, expected years of schooling and mean years of schooling are between 0.5 and 0.7. Therefore, the internal correlation among the four indicators of human development in all countries is of medium-to-high positive correlation. Therefore, an increase in any one indicator of HDI will always lead to an increase in the other three indicators.
In the part of environmental performance (Table 4), the correlation coefficient between environmental health and ecosystem vitality is about 0.5, which shows the internal correlation is moderately positive, indicating that the better the environmental health is, the better the ecosystem vitality will be.
For the cross-correlation (in Table 5), the coefficients between environmental health and life expectancy at birth, expected years of schooling, and mean years of schooling of HDI are all more than 0.7, indicating a high positive correlation. However, the correlation with gross national income was slightly lower than 0.5, indicating a moderate positive correlation. The correlation coefficient between ecosystem vitality and four HDI indicators are all around 0.5, which show a moderate and positive correlation. In conclusion, the better human development is, the better environmental performance will be. Environmental health seems to relate to human development a bit more than ecosystem vitality.
Table 6 and Figure 1 shows the estimated canonical coefficients in the composition of the canonical variables. Therefore, the canonical variables for the first canonical variate pair can be expressed as follows:
Canonical environmental performance = 0.7968 environmental health + 0.3207 ecosystem vitality
Canonical human development = 0.2522 life expectancy at birth + 0.3260 expected years of schooling + 0.5340 mean years of schooling − 0.0523 gross national income
In the canonical correlation model, all the coefficients are positive except for gross national income. The coefficient for environmental health is the highest, close to 0.8 which is about 2.5 times the coefficient for ecosystem vitality, which shows environmental health is the most important indicator and has the largest contribution to the composition of the canonical variable of environmental performance. The contribution of ecosystem vitality ranked second, with a coefficient less than 0.5. The mean years of schooling had the highest contribution to the canonical human development, with the standardized coefficient exceeding 0.5, which is about twice the magnitude for the expected length of schooling and life expectancy at birth. The contribution of expected years of schooling was slightly over 0.3, followed by life expectancy at birth with the coefficient a bit lower than 0.3. However, the coefficient for gross national income is negative with a very small value, indicating its contribution to human development is adverse, contrary to other indicators, and also the lowest. Therefore, when gross national income is high, canonical human development score would be low and further leads to poor environmental performance. However, since this coefficient size is relatively low, when discussing the relationship between human development and environmental performance, the representation of gross national income for human development is virtually trivial.
According to the above results, environmental health is the main element of EPI, and the mean years of schooling is the chief component of HDI. Since the correlation between environmental health and mean years of schooling are the strongest, the higher the mean years of schooling are, the better the country’s environmental health will be. On the contrary, the economic factor, i.e., gross national income, cannot be effectively reflected in the overall HDI as compared to the other three indicators of human development; consequently, its relationship with environmental performance is less evident.
For all countries, the proportion that canonical environmental performance explains the original indicators of environmental performance, as shown in Table 7, is close to 73%. In addition, canonical human development can explain 83% of canonical environmental performance, indicating that canonical human development can explain about 60% (i.e., 0.7282 × 0.8306 = 0.6048) of original environmental performance indicators. Similarly, the proportion that canonical human development explains their own original indicators is about 72%, hence, the proportion that canonical environmental performance explains the original human development indicators is close to 60% (i.e., 0.7199 × 0.8306 = 0.5979). Therefore, from the perspective of all countries, the explanatory power of human development and environmental performance to explain mutually is in the medium-to-high level.
As shown in Table 8, both canonical environmental performance and canonical human development have the highest explanatory power for environmental health, slightly less than 80%, but only about 40% for ecosystem vitality. The mean years of schooling in both canonical variables have the highest explanatory power, followed by the expected years of schooling with the explanatory power slightly over 70%, then the life expectancy at birth with power a bit over 60%, and finally, the gross national income with the lowest explanatory power about 30%.

5. Conclusions and Discussion

This study empirically confirms a significant and positive correlation between environmental performance and human development that contributes to an improvement in the current knowledge of environmental sustainability management as well as human development.

5.1. Findings and Implications

A number of important findings and implications are further discussed as follows.
  • Two indicators of the environmental performance (i.e., environmental health and ecosystem vitality) are moderately and positively correlated. This finding empirically confirms the views of Rapport [37], Jerry et al. [38], and Zhang et al. [39] for the existence of internal correlation between dimensions of environmental performance, signifying that the healthier the environment is, the better ecosystem vitality will be. A healthy ecosystem with stability and sustainability can contain all kinds of complementary ecosystem vitality capable of restoring damage and further providing human society with good ecosystem services [37]. Ecosystem vitality exists in a complete and healthy environmental system [38]. Both ecosystem and environmental health can keep humans healthy and provide suitable environmental quality for human survival, which indicates that ecosystem and environmental health are interconnected and therefore interrelated with each other [29]. Correspondingly, this result suggests the policy implication that countries should actively strengthen ecosystem vitality in order to achieve a positive interaction effect on enhancing environmental health.
  • Four dimensions of human development (i.e., life expectancy at birth, expected years of schooling, mean years of schooling, and gross national income) show a medium-to-high level of positive association. Henceforth, this study confirms the existence of internal correlation between indicators of HDI, similar to the view of Booysen [12] in the literature, while differing from the finding of Noorbakhsh [13] who used similar human development variables. This result indeed suggests the implication that the improvement of any aspect of human development will lead to the enhancement of other facets to various degrees. Moreover, the result reveals that mean years of schooling and expected years of schooling are two core indicators of HDI. As Roger [65] proposed, the human group itself is a knowledge base and education will enable people to obtain the ability to survive. By means of education, people attain harmony in body and mind, achieve perfect self-actualization, and further promote the progress and development of human society [66].
  • Different from the important roles played by mean years of schooling and the expected years of schooling in HDI, gross national income per capita is much less representative of human development, which is consistent with the findings of Muhammad [58] based on data from Pakistan. Actually, the original design of the human development index was to overcome the drawback in adopting gross national income as the only dimension of human development with the belief that human development should focus on human well-being rather than economic development [47]. The policy implication is that economic development should aim at people-oriented policy instead of the national economic income. As Haq [46] pointed out in the human development index report of 1990, national economic income is merely one aspect of economic development.
  • The inter-correlation between individual dimensions of environmental performance and those of human development is also positive of medium-to-high level. In particular, canonical environmental performance and canonical human development have explanatory power up to 83%, showing great and significant influence on each other. The underlying linkage for the cross-correlation between human development and environmental performance may be proposed and explained as follows. As our result shows, education is an important aspect for human development. People who live in countries with higher economic development usually have better opportunities and resources to receive better education. When people have a high level of knowledge, they are more likely to attain the concept of environmental health and further develop an awareness and take actions to protect their own health, such as paying attention to environmental hygiene, consuming good quality drinking water, avoiding unsafe environmental hygiene and risk, decreasing suspended particle exposure, etc. All the reasoning above may explain why environmental health can be improved and further boosts the increase of life expectancy at birth. As Wending et al. [67] stated, safe sanitation and clean drinking water would reduce health risks, as well as disease and bacteria. Consequently, the environment affects the health of the human development [8]. Our empirical conclusion supports the same belief of Serghini et al. [60], Gallego et al. [20], and EPA [61].
  • As mentioned above, the key factor in human development is mean years of schooling, followed by expected years of schooling. Environmental health is the decisive factor in environmental management. With the high correlation between HDI and EPI, therefore, it can be extended to the most important linkage between environmental health and expected years of schooling. This result implies the essential relation between environmental health and education, which actually confirms the argument of the following literature. Urie Bronfenbrenner, the author of “Human Development Ecology” in 1979, explained the underlying mechanism that humans as growing organisms are living in the process of mutual adaptation between themselves and the changing environment. Various environmental influences and human development have co-existed with a complementary, mutually beneficial, and interactive relation, which has been built in the early stage of education for children [68]. It is also emphasized that the only setting that serves as a comprehensive context for human development from the early years onward is the children’s institution and the existence of such a context is important from an ecological perspective [68]. Hence, for policy implications it is suggested that, instead of concentrating on psychological outcomes for the individual in most traditional investigations of human development, the structure of the immediate environment, or of the microsystem in which the individual is embedded, in fact deserves more attention in understanding the characteristics of institutional setting for activities, roles, and relations [68].
  • The positive correlation between environmental health and life expectancy at birth is virtually at a high level, showing that promotion of environmental health at all phases is substantially significant to human life expectancy. Nonetheless, ecosystem vitality is only moderately correlated with life expectancy at birth, mean years of schooling, and expected years of schooling. In view of Auster et al. [69], life expectancy depends on environmental variables, such as wealth, education, and security regulations, and infrastructure quality, lifestyle factors, and medical and pharmaceutical expenses. Access to safe drinking water affects life expectancy [70] and, in addition, socioeconomic and environmental factors (e.g., income per capita, ratio of health expenditure to GDP, urbanization rate, and carbon dioxide emission per worker) are generally determinants of life expectancy at birth [71]. This finding implies that more effective strategies and active actions in supporting and maintaining ecosystems in the context of human development are needed to consider for future planning in sustainability management.
  • Gross national income is positively correlated with environmental health and ecosystem vitality, nonetheless, the relation is relatively weak as compared with the other three human development indicators. Actually, there are many sources of pollution at higher levels of economic development. As Panayotou [19] mentioned, the levels of industrial activity, the number of vehicles, and the consumption of electricity are directly related to the stage of economic development and level of income, while generally, the consumption of energy and the generation of emissions rises with the level of development. Each source generates fewer emissions per unit of output. This may be partly due to introduction of new technology, and partly the result of improved economic efficiency. Moreover, as pursuing for higher levels of economic development, countries may move towards export-oriented industrialization. The reduction of protection and realignment of domestic prices with world prices encourages improved efficiency in input and hence waste reductions in output. However, the expansionary effect of export-oriented industrialization means a greater output and possibly greater aggregate level of emissions and wastes than before [19]. All the above means the possible existence of a trade-off relation between economic development and environmental performance. This may also explain why some studies suggest economic growth has a positive correlation with the environment [19,20,26], while some pointed out that it may not effectively improve the environment [20]. A policy implication of this finding suggests that good governance in environment is crucial by ensuring access to clean and modern energy and/or industrialized technologies, which may somewhat reduce the underlying trade-off effect caused by economic development [72,73].
This study contributes to the scant literature on the relevant relationship between environmental performance and human development. Specifically, the methodology applied in this study can avoid the subjective problem which occurred in past literature that EPI and HDI are often aggregated with predetermined weights. In addition, previous studies often discuss the overall relevance between EPI and HDI, but to the best of our knowledge, none have specifically focused on the direct cross relationship among individual dimensions of EPI and HDI. Specifically, our result discovers that education is the key factor for affecting environmental management, shedding light on the importance of education and its inseparable role from HDI in promoting environmental sustainability. Moreover, our finding points out the inaptness in adopting gross national income as a measure of living standards which highlights the imperative necessity of reconsidering other dimensions of human development in connection with environmental management.

5.2. Limitations and Future Research

To fully understand the actual causal relationship between environmental performance and human development, a longitudinal approach may be more appropriate to reveal the effect of HDI on EPI, or vice versa, across time. However, since the dimensions of EPI are adjusted every two years and vary with time, longitudinal data with consistent measures is impossible. The relationship examined is actually correlation, which is the limitation of the study in the context of a cross-sectional approach. As the result shows, gross national income may not be a suitable measure for human development in relation with environmental performance. Future research may consider other proxies for living standards or more people-oriented aspects of human development as exploring the relation between environmental sustainability management and human development.

Author Contributions

Conceptualization, S.L.L. and D.-N.C.; methodology, S.L.L.; validation, S.L.L. and D.-N.C.; formal analysis, D.-N.C.; writing—original draft preparation, S.L.L. and D.-N.C.; writing—review and editing, S.L.L. All authors have read and agreed to the published version of the manuscript.

Funding

This research received no external funding.

Conflicts of Interest

The authors declare no conflict of interest.

References

  1. Esty, D.C.; Levy, M.A.; Srebotnjak, T.; de Sherbinin, A.; Kim, C.H.; Anderson, B. Pilot 2006 Environmental Performance Index; Yale Center for Environmental Law & Policy: New Haven, CT, USA, 2006. [Google Scholar]
  2. Hsu, A.; Johnson, L.A.; Lloyd, A. Measuring Progress: A Practical Guide from the Developers of the Environmental Performance Index (EPI); Yale Center for Environmental Law & Policy: New Haven, CT, USA, 2013. [Google Scholar]
  3. International Organisation for Standardisation. ISO 14031:1999. Environmental management – Environmental Performance Evaluation – Guidelines; ISO: Geneva, Switzerland, 1999; Available online: https://www.iso.org/obp/ui/fr/#iso:std:iso:14031:ed-1:v1:en (accessed on 12 May 2020).
  4. ISO14001. Environmental Management System—Requirements with Guidance for Use; International Organization for Standardization: Geneva, Switzerland, 2004; Available online: https://www.iso.org/obp/ui/#iso:std:iso:14001:ed-2:v1:en (accessed on 25 May 2020).
  5. Popescu, G.H.; Sima, V.; Nica, E.; Gheorghe, I.G. Measuring Sustainable Competitiveness in Contemporary Economies—Insights from European Economy. Sustainability 2017, 9, 1230. [Google Scholar] [CrossRef] [Green Version]
  6. Emerson, J.W.; Esty, D.C.; Levy, M.A.; Kim, C.H.; Mara, V.; de Sherbinin, A.; Srebotnjak, T. 2010 Environmental Performance Index; Yale Center for Environmental Law & Policy: New Haven, CT, USA, 2010. [Google Scholar]
  7. Liu, G.; Brown, M.T.; Casazza, M. Enhancing the Sustainability Narrative through a Deeper Understanding of Sustainable Development Indicators. Sustainability 2017, 9, 1078. [Google Scholar] [CrossRef] [Green Version]
  8. Huang, B.; Wang, J. Big spatial data for urban and environmental sustainability. Geo-Spat. Inf. Sci. 2020, 23, 125–140. [Google Scholar] [CrossRef]
  9. Samuel, O.S.; Fayemi, A.K. Afro-communal virtue ethic as a foundation for environmental sustainability in Africa and beyond. South Afr. J. Philos. 2019, 38, 79–95. [Google Scholar] [CrossRef]
  10. Cabello, J.M.; Navarro-Jurado, E.; Ellul, D.T.; Rodríguez-Díaz, B.; Ruiz, F. Assessing environmental sustainability by the double reference point methodology: The case of the provinces of Andalusia (Spain). Int. J. Sustain. Dev. World Ecol. 2020, 1–14. [Google Scholar] [CrossRef]
  11. Jang, Y.J.; Zheng, T. Assessment of the environmental sustainability of restaurants in the U.S.: The effects of restaurant characteristics on environmental sustainability performance. J. Foodserv. Bus. Res. 2019, 23, 133–148. [Google Scholar] [CrossRef]
  12. Booysen, F. An Overview and Evaluation of Composite Indices of Development. Soc. Indic. Res. 2002, 59, 115–151. [Google Scholar] [CrossRef]
  13. Noorbakhsh, F. The Human Development Index: Some Technical Issues and Alternative Indices. J. Int. Dev. 1998, 10, 589–605. [Google Scholar] [CrossRef]
  14. Lai, D. Temporal Analysis of Human Development Indicators: Principal Component Approach. Soc. Indic. Res. 2000, 51, 331–366. [Google Scholar] [CrossRef]
  15. Opoku, D.-G.J.; Agyekum, K.; Ayarkwa, J. Drivers of environmental sustainability of construction projects: A thematic analysis of verbatim comments from built environment consultants. Int. J. Constr. Manag. 2019, 1–9. [Google Scholar] [CrossRef]
  16. Yildiz, S.; Kivrak, S.; Arslan, G. Factors affecting environmental sustainability of urban renewal projects. Civ. Eng. Environ. Syst. 2017, 34, 264–277. [Google Scholar] [CrossRef]
  17. Van Tran, N.; Van Tran, Q.; Do, L.T.T.; Dinh, L.H.; Do, H.T.T. Trade off between environment, energy consumption and human development: Do levels of economic development matter? Energy 2019, 173, 483–493. [Google Scholar] [CrossRef]
  18. Hsu, A.; Esty, D.C.; de Sherbinin, A.; Levy, M.A. 2016 Environmental Performance Index: Global Metrics for the Environment; Yale Center for Environmental Law & Policy: New Haven, CT, USA, 2016; Available online: https://www.researchgate.net/publication/309417857_2016_Environmental_Performance_Index_EPI (accessed on 24 May 2020).
  19. Panayotou, T. Empirical Tests and Policy Analysis of Environmental Degradation at Different Stages of Economic Development; Working Paper WP238; Technology and Employment Programme. International Labor Office: Geneva, Switzerland, 1993. [Google Scholar]
  20. Gallego-Álvarez, I.; Vicente-Galindo, M.P.; Galindo-Villardón, M.P.; Rodríguez-Rosa, M. Environmental Performance in Countries Worldwide: Determinant Factors and Multivariate Analysis. Sustainability 2014, 6, 7807–7832. [Google Scholar] [CrossRef] [Green Version]
  21. United Nations Development Programme. Human Development Report 2016; UNDP-HDRO: New York, NY, USA, 2016; Available online: http://hdr.undp.org/sites/default/files/2016_human_development_report.pdf (accessed on 23 February 2018).
  22. United Nations Development Programme. Human Development Report 2014; UNDP-HDRO: New York, NY, USA, 2014; Available online: http://hdr.undp.org/sites/default/files/hdr14-report-en-1.pdf (accessed on 14 January 2018).
  23. United Nations Development Programme. Human Development Report 2010; UNDP-HDRO: New York, NY, USA, 2010; Available online: http://hdr.undp.org/sites/default/files/reports/270/hdr_2010_en_complete_reprint.pdf (accessed on 17 March 2018).
  24. Shafik, N. Economic Development and Environmental Quality: An Econometric Analysis. Oxf. Econ. Pap. 1994, 46, 757–773. [Google Scholar] [CrossRef]
  25. Kaufmann, R.K.; Davidsdottir, B.; Garnham, S.; Pauly, P. The determinants of atmospheric SO2 concentrations: Reconsidering the environmental Kuznets curve. Ecol. Econ. 1998, 25, 209–220. [Google Scholar] [CrossRef]
  26. Orlitzky, M.; Siegel, D.S.; Waldman, D.A. Strategic Corporate Social Responsibility and Environmental Sustainability. Bus. Soc. 2011, 50, 6–27. [Google Scholar] [CrossRef]
  27. U.S. EPA. Integrated Science Assessment (ISA) for Sulfur Oxides—Health Criteria (Final Report, Sep 2008); EPA/600/R-08/047F; U.S. Environmental Protection Agency: Washington, DC, USA, 2008. Available online: https://cfpub.epa.gov/ncea/isa/recordisplay.cfm?deid=198843 (accessed on 13 February 2018).
  28. Stern, D.I.; Common, M.S.; Barbier, E.B. Economic growth and environmental degradation: The environmental Kuznets curve and sustainable development. World Dev. 1996, 24, 1151–1160. [Google Scholar] [CrossRef]
  29. Pearce, D. A New Blueprint for a Green Economy. Top Sustain. Books. 1989, 7, 70–76. [Google Scholar]
  30. Thoresen, J. Environmental performance evaluation–a tool for industrial improvement. J. Clean Prod. 1999, 7, 365–370. [Google Scholar] [CrossRef]
  31. Mosse, R.; Sontheimer, L.E. Performance Monitoring Indicators Handbook; The World Bank: Washington, DC, USA, 1996; Available online: https://lib.ugent.be/en/catalog/rug01:000975826 (accessed on 19 April 2020).
  32. Segnestam, L.; Washington, D.C. Environmental performance Indicators; The World Bank: Washington, DC, USA, 1999; Available online: http://documents1.worldbank.org/curated/en/282291468321230375/pdf/multi-page.pdf (accessed on 14 January 2020).
  33. Esty, D.C.; Levy, M.A.; Srebotnjak, T.; de Sherbinin, A. Environmental Sustainability Index: Benchmarking National Environmental Stewardship; Yale Center for Environmental Law & Policy: New Haven, CT, USA, 2005. [Google Scholar]
  34. Esty, D.C.; Levy, M.A.; Srebotnjak, T.; de Sherbinin, A. Environmental Sustainability Index: Benchmarking National Environmental Stewardship; Yale Center for Environmental Law & Policy: New Haven, CT, USA, 2008. [Google Scholar]
  35. Emerson, J.W.; Hsu, A.; Levy, M.A.; de Sherbinin, A.; Mara, V.; Esty, D.C.; Jaiteh, M. Environmental Performance Index and Pilot Trend Environmental Performance Index; Yale Center for Environmental Law & Policy: New Haven, CT, USA, 2012. [Google Scholar]
  36. Hsu, A.; Emerson, J.W.; Levy, M.A.; de Sherbinin, A.; Johnson, L.; Malik, O.A.; Schwartz, J.D.; Jaiteh, M. 2014 Environmental Performance Index; Yale Center for Environmental Law & Policy: New Haven, CT, USA, 2014; Available online: http://www.ciesin.org/documents/2014_epi_report.pdf (accessed on 22 January 2018).
  37. Rapport, D.J. Assessing ecosystem health. Trends Ecol. Evol. 1998, 13, 397–402. [Google Scholar] [CrossRef]
  38. Jerry, M.S.; Mariano, B.; Annalee, Y. Developing ecosystem health indicators in Centro Habana: A community-based approach. Ecosyst. Health. 2001, 7, 15–26. [Google Scholar]
  39. Zhang, Y.; Yang, Z.; Yu, X. Measurement and evaluation of interactions in complex urban ecosystem. Ecol. Model. 2006, 196, 77–89. [Google Scholar] [CrossRef]
  40. Wicklum, D.; Davies, R.W. Ecosystem health and integrity? Can. J. Bot. 1995, 73, 997–1000. [Google Scholar] [CrossRef]
  41. United Nations Development Programme. Human Development Report 1990; UNDP-HDRO: New York, NY, USA; Oxford, UK, 1990; Available online: http://hdr.undp.org/sites/default/files/reports/219/hdr_1990_en_complete_nostats.pdf (accessed on 8 December 2018).
  42. United Nations Development Programme. Human Development Report 2000; UNDP-HDRO: New York, NY, USA; Oxford, UK, 2000; Available online: http://hdr.undp.org/sites/default/files/reports/261/hdr_2000_en.pdf (accessed on 15 November 2018).
  43. United Nations Development Programme (UNDP). Human Development Report 2004; Cultural Liberty in Today’s Diverse World: New York, NY, USA, 2004; Available online: http://hdr.undp.org/en/content/human-development-report-2004” (accessed on 3 November 2018).
  44. Sen, A. Human Rights and Capabilities. J. Hum. Dev. 2005, 6, 151–166. [Google Scholar] [CrossRef]
  45. Robeyns, I. Sen ’s Capability Approach and Gender Inequality: Selecting Relevant Capabilities. Fem. Econ. 2003, 9, 61–92. [Google Scholar] [CrossRef]
  46. Haq, M.U. Reflections on Human Development; Oxford University Press: New York, NY, USA, 1995. [Google Scholar]
  47. Sakiko, F. The Human Development Paradmdigm: Operationalizig Sen’s ideas on Capabilities. Fem. Econ. 2003, 9, 301–317. [Google Scholar]
  48. Pineda, J. Sustainability and Human Development: A Proposal for a Sustainability Adjusted Human Development Index. Theor. Pract. Res. Econ. Fields 2012. [Google Scholar] [CrossRef] [Green Version]
  49. Kelley, A.C. The Human Development Index: “Handle with Care”. Popul. Dev. Rev. 1991, 17, 315. [Google Scholar] [CrossRef]
  50. Srinivasan, T. Data base for development analysis Data base for development analysis: An overview. J. Dev. Econ. 1994, 44, 3–27. [Google Scholar] [CrossRef]
  51. Lind, N.C. Some thoughts on the human development index. Soc. Indic. Res. 1992, 27, 89–101. [Google Scholar] [CrossRef]
  52. Ogwang, T. The choice of principle variables for computing the human development index. World Dev. 1994, 22, 2011–2014. [Google Scholar] [CrossRef]
  53. Hicks, D.A. The inequality-adjusted human development index: A constructive proposal. World Dev. 1997, 25, 1283–1298. [Google Scholar] [CrossRef] [Green Version]
  54. Sagar, A.D.; Najam, A. The Human Development Index, a Critical Review. Ecol. Econ. 1998, 25, 249–264. [Google Scholar] [CrossRef]
  55. Hopkins, M. Human development revisited: A new UNDP report. World Dev. 1991, 19, 1469–1473. [Google Scholar] [CrossRef]
  56. Noorbakhsh, F. Human development and regional disparities in Iran: A policy model. J. Int. Dev. 2002, 14, 927–949. [Google Scholar] [CrossRef]
  57. Ranis, G.; Stewart, F.; Samman, E. Human Development: Beyond the HDI. J. Hum. Dev. 2011, 323–358. Available online: https://www.tandfonline.com/doi/full/10.1080/14649880600815917 (accessed on 7 April 2020).
  58. Qureshi, M.A. Challenging trickle-down approach. Int. J. Soc. Econ. 2008, 35, 269–282. [Google Scholar] [CrossRef]
  59. Herrero, C.; Martínez, R.; Villar, A. A Newer Human Development Index. J. Hum. Dev. Capab. 2012, 13, 247–268. [Google Scholar] [CrossRef]
  60. Bloom, D.E.; Canning, D.; Sevilla, J. The Demographic Dividend: A New Perspective on the Economic Consequences of Population Change; Rand: Santa Monica, CA, USA, 2003; Volume 1, pp. 43–68. Available online: https://www.rand.org/content/dam/rand/pubs/monograph_reports/2007/MR1274.pdf (accessed on 16 May 2020).
  61. EPA. Draft Integrated Science Assessment for Sulfur Oxides-Health Criteria; Environmental Protection Agency: Washington, DC, USA, 2015.
  62. Samimi, A.J.; Kashefi, A.; Salatin, P.; Lashkarizadeh, M. Environmental Performance and HDI: Evidence from Countries Around the world. Middle—East J. Sci. Res. 2011, 10, 294–301. [Google Scholar]
  63. Hotelling, H. The Relationship between Two of Variables; Oxford University Press: Oxford, UK, 1936; Volume 28, pp. 321–377. [Google Scholar]
  64. Hsing, T.; Eubank, R. Theoretical Foundations of Functional Data Analysis, with an Introduction to Linear Operators; Wiley: Hoboken, NJ, USA, 2015. [Google Scholar]
  65. Fouts, R.; Mills, S.T. Mondadori, La Scuola dalle Scimmie: Come ho Insegnato a Parlare a Washoe; Mondadori: Milan, Italy, 1999; p. 155. [Google Scholar]
  66. Vander Zanden, J.W. Human Development, 8th ed.; McGraw-Hill Inc.: Princeton, NJ, USA, 2006. [Google Scholar]
  67. Balezentis, T.; Li, T.; Streimikiene, D.; Baležentis, A. Is the Lithuanian economy approaching the goals of sustainable energy and climate change mitigation? Evidence from DEA-based environmental performance index. J. Clean. Prod. 2016, 116, 23–31. [Google Scholar] [CrossRef]
  68. Urie, B. The Ecology of Human Development: Experiments by Nature and Design; Harvard University Press: Cambridge, MA, USA, 1981; Volume 46. [Google Scholar]
  69. Auster, R.; Leveson, I.; Sarachek, D. The Production of Health, an Exploratory Study. J. Hum. Resour. 1969, 4, 411. [Google Scholar] [CrossRef]
  70. Gulis, G. Life expectancy as an indicator of environmental health. Eur. J. Epidemiol. 2000, 16, 161–165. [Google Scholar] [CrossRef] [PubMed]
  71. Fayissa, B.; Gutema, P.; Department of Economics and Finance. Working Paper Series; 2008; pp. 1–21. Available online: https://ideas.repec.org/p/mts/wpaper/200808.html (accessed on 16 March 2020).
  72. Sarkodie, S.A.; Adams, S. Electricity access, human development index, governance and income inequality in Sub-Saharan Africa. Energy Rep. 2020, 6, 455–466. [Google Scholar] [CrossRef]
  73. Cheng, R.; Li, W. Evaluating environmental sustainability of an urban industrial plan under the three-line environmental governance policy in China. J. Environ. Manag. 2019, 251, 109545. [Google Scholar] [CrossRef]
Figure 1. Canonical correlation analysis of environmental performance and human development.
Sustainability 12 09001 g001
Table 1. Descriptive statistics.
VariableMEANSTDMEDMINMAX
Environmental health74.6316.1778.3932.6998.71
Ecosystem vitality62.7616.2564.0322.0890.09
Life expectancy at birth71.878.0674.1848.9083.70
Expected years of schooling13.242.8013.265.0020.40
Mean years of schooling8.532.958.712.3013.40
Gross national income 18,019.5619,130.3011,502.19587.47129,915.60
NOTE: STD = standard deviation, MED = median, MIN = minimum, MAX = maximum.
Table 2. Canonical correlation test.
Canonical CorrelationSquared
Canonical Correlation
H0: The Canonical Correlations in the Current Row
and All that Follow are Zero
EigenvalueProportionLikelihood
Ratio
Approximate
F Value
Num DFDen
DF
p
Value
1
2
0.91140.83064.90270.98600.158456.348298<0.0001
0.25470.06490.06940.01400.93513.4731500.0178
Multivariate Statistics and F Approximations
StatisticValueF ValueNum DFDen DFPr > F
Wilks’ Lambda0.158456.348298.00<0.0001
Pillai’s Trace0.895530.408300.00<0.0001
Hotelling-Lawley Trace4.972192.248210.54<0.0001
Roy’s Greatest Root4.9027183.854150.00<0.0001
Table 3. Internal correlation coefficients among indicators of human development.
VariableLife Expectancy at BirthExpected Years of SchoolingMean Years of SchoolingGross National Income
Life expectancy at birth10.78470.71680.6027
Expected years of schooling0.784710.82710.5873
Mean years of schooling0.71680.827110.5720
Gross national income0.60270.58730.57201
Table 4. Internal correlation coefficients among indicators of environmental performance.
VariableEnvironmental HealthEcosystem Vitality
Environmental Health1.00000.5130
Ecosystem Vitality0.51301.0000
Table 5. Inter-correlation coefficients between indicators of environmental performance and human development.
VariableEnvironmental HealthEcosystem Vitality
Life expectancy at birth0.77370.5196
Expected years of schooling0.81820.6237
Mean years of schooling0.82340.6667
Gross national income0.48570.4886
Table 6. The canonical coefficients in the composition of the canonical variable.
VariableStandardized Canonical Coefficients for Environmental Performance Indicators
Environmental health0.7968
Ecosystem vitality0.3207
VariableStandardized canonical coefficients for
human development indicators
Life expectancy at birth0.2522
Expected years of schooling0.3260
Mean years of schooling0.5340
Gross national income−0.0523
Table 7. Standardized variances of canonical variables explaining themselves and paired canonical variables.
Canonical Environmental Performance Explains the Standardized Variances of the Original Indicators
Canonical
variable
Canonical
environmental performance
Canonical
R-Square
Canonical
human development
ProportionProportion
Environmental performance 0.72820.83060.6048
Canonical Human Development Explains the Standardized Variances of the Original Indicators
Canonical
variable
Canonical
human development
Canonical
R-Square
Canonical
environmental performance
ProportionProportion
Human development0.71990.83060.5979
Table 8. Squared multiple correlations between indicators and the canonical variables.
Squared Multiple Correlations between the Environmental Performance Indicators with the Canonical variables
IndicatorsCanonical
environmental performance
Canonical
human development
Environmental health0.76770.7726
Ecosystem vitality0.44200.4724
Squared Multiple Correlations between the Human Development Indicators
with the Canonical Variables
IndicatorsCanonical
human development
Canonical
environmental performance
Life expectancy at birth0.61330.6190
Expected years of schooling0.72590.7259
Mean years of schooling0.75680.7590
Gross national income0.29560.3137
Publisher’s Note: MDPI stays neutral with regard to jurisdictional claims in published maps and institutional affiliations.

