Article

Research on Pharmaceutical Product Life Cycle Patterns for Sustainable Growth

1
Graduate School of Technology Management, Ritsumeikan University, Osaka 567-8570, Japan
2
Eli Lilly Japan K.K., Hyogo 651-0086, Japan
3
School of Environment and Society, Tokyo Institute of Technology, Tokyo 152-8550, Japan
4
Faculty of Business Administration, Ritsumeikan University, Osaka 567-8570, Japan
5
Center for Research and Education on Drug Discovery, The Graduate School of Pharmaceutical Sciences in Hokkaido University, Hokkaido 060-0808, Japan
*
Authors to whom correspondence should be addressed.
Sustainability 2020, 12(21), 8938; https://doi.org/10.3390/su12218938
Submission received: 5 October 2020 / Revised: 20 October 2020 / Accepted: 23 October 2020 / Published: 27 October 2020
(This article belongs to the Special Issue Sustainable Public Health, Pharmacy and Environment)

Abstract

:
An important agenda of pharmaceutical companies is the establishment of therapeutic area strategies, drug modality, and geographic strategies for research and development. It is worthwhile to understand the changes in therapeutic area, modality and internationalization of the top-selling pharmaceutical drugs over the past. Hence, the purposes of this study are to investigate changes in therapeutic area, modality and internationalization of the top-selling drugs and to identify their life cycle patterns. We compared the top-selling drugs between 2011 and 2017, and found that the percentages of nichebuster cancer drugs and home region-oriented drugs have increased whereas the proportions of traditional blockbuster cardiovascular drugs and global drugs have decreased. We compared product life cycle patterns via a Kruskal–Wallis test, and identified the features of product life cycle patterns per therapeutic area and modality. We performed a case study on drugs in the same class with the same pharmacological mechanism but found no differences across cases. Our results provide insights into therapeutic area strategies that consider life cycle patterns and geographic strategies that consider the competitive advantages of home region-oriented drugs. Finally, we presented new and simple models of life cycle patterns. This approach may help such enterprises establish and maintain sustainable growth.

1. Introduction

Pharmaceutical companies must first receive regulatory body approval before they can launch and market new drug products, change their specifications or formulation, or add an indication. To these ends, clinical trials meeting stringent requirements must be conducted. Clinical drug development and approval generally take ~8 y and may incur an out-of-pocket cost in the range of 300–600 million USD per new molecule. Nevertheless, the overall rate from drug development to approval is only 10–30% [1,2]. Consequently, pharmaceutical companies cannot run many clinical trials. In other words, they often do not choose the typical way of market expansion, which is to enter new countries with a product already being sold in another country, because it requires clinical trials for the new countries. The fast food industry often alters food product size and flavor to accommodate target country preferences [3]. In contrast, the pharmaceutical industry often does not modify drug product to meet the needs of other countries after launching the drug product in some countries. Based on the above, pharmaceutical companies often run a global clinical trial for multiple countries rather than individual single country clinical trials for each country [4,5,6]. In fiscal year 2018, the rate of global clinical trials in Japan was 50.9% (389/524 plans submitted). In fiscal year 2008, however, it was only 15.7% (82/524 plans submitted) [7]. By leveraging a few global clinical trials, drug companies can simultaneously submit multiple approval applications to several countries. Nevertheless, certain compromises must be made in terms of meeting the needs of each target country. In practice, pharmaceutical companies first identify countries wherein the drug will be launched. Thence, they design global clinical trials to meet the regulatory requirements of all target countries and endeavor to meet those needs as closely as possible. When pharmaceutical companies research and develop a drug in this way, it makes a lot of sense for pharmaceutical companies to aim blockbusters with high sales potential, rather than those with small sales potential. In particular, the larger a company is, the more the inevitability of aiming blockbusters increases in order to maintain a high level of growth for the company. Given the size of sales of blockbusters, blockbusters target a large number of patients in the world with the hyperlipidemia drugs Lipitor® (atrovastatin) and Crestor® (rosuvastatin), and the hypertension drugs Norvasc® (amlodipine) and Diovan® (valsartan). Thus, the large pharmaceutical companies have adopted the blockbuster profit model [8]. However, patient drug expectations and requirements are varying widely across countries. Patients in some countries may need new drugs that are more convenient and patients in some other countries may need those that are more efficacious and safer than the currently available medications. For instance, patients may prefer to transition from once-daily to once-monthly dosing, seek novel drugs replacing those with inadequate therapeutic efficacy, and need drugs to treat rare diseases.
Around 2010, many pharmaceutical companies were facing the issue of patent expiration for their blockbusters (drugs with annual sales ≥1 billion USD) which target many patients in the world. As a result, a debate ensued in the pharmaceutical industry over the weakness of the blockbuster-dependent model. Its commercial success was challenged [9,10,11]. However, these issues have not been debated over the last decade [12] despite patient diversification through advances in scientific knowledge, drug design techniques, genome-level diagnostics, and a broader range of medical needs [13,14,15]. In view of the aforementioned facts, we believe that it is worthwhile to understand the changes in therapeutic area, drug modality, and internationalization of the top-selling pharmaceutical drugs over the past decade to reopen a debate about commercial success in the pharmaceutical industry. The purposes of this study are to identify trends in therapeutic areas, drug modalities and geographic strategies of commercially successful drug products and to identify life cycle characteristics per therapeutic area, drug modality and geographic strategy. Here, we provide an overview of the changes in therapeutic area, drug modality, and geographic strategy of the top-selling pharmaceutical drugs over the past decade. In addition, we provide the results of the macro analysis and case reviews about drug product life cycle patterns per therapeutic area and modality. As the sustainable growth of pharmaceutical companies depends heavily on decision-making in the R&D phase, relative to drug characteristics and geographic strategies, our study will have important implications in the decision-making process.

2. Materials and Methods

2.1. Data

We focused on the top-selling drugs because they will drive the sustainable growth of pharmaceutical companies. Here, top-selling drugs were defined as those whose annual sales surpassed 2 billion USD. The review period was set from 2011 to 2017. Total and geographic sales data for individual drugs were collected for the years 2011–2017. Data sources comprised individual company annual reports, Form 10-K (i.e., a comprehensive report filed annually by a publicly traded company about its financial performance, and it is required by the Securities and Exchange Commission) and Form 20-F (i.e., a form issued by the Securities and Exchange Commission that must be submitted by all foreign private issuers with listed equity shares on exchanges in the United States), and the EvaluatePharm® database. Data for nations outside the United States were converted into USD based on the period-averaged data in the International Financial Statistics database of the International Monetary Fund [16]. Drugs were classified by geographic sale according to the internationalization system of Rugman and Verbeke [17] based on the triad power concept [18]. The triad included the United States, EU, and Japan but was expanded to North America, Europe, Asia-Pacific, and others [17]. The triad members were approximately equal in terms of their geographic sales distributions in the pharmaceutical industry [19]. Hence, the following classification was applied to the pharmaceutical industry [20]: global, ≥20% of all sales in all three regions; bi-regional, ≥20% of all sales in two regions but ≤50% of all sales in the home region; home region-oriented, ≥50% of all sales in the home region; and host region-oriented, ≥50% of all sales in any single region except the home region. The classes and hierarchical classification of the KEGG DRUG database were consulted to determine drug therapeutic areas and modalities [21]. Individual company websites served as sources of supplemental information.
To investigate drug life cycle patterns, 272 drugs reaching annual sales of ≥1 billion USD at least once between 2001 and 2016 were targeted. The data source was EvaluatePharma® database and the data points were years 2001, 2004, 2006, 2009, 2011, 2014, and 2016. Unequally spaced data points were due to the limitation of data availability.

2.2. Analysis

2.2.1. Changes in Top-Selling Drug Therapeutic Area, Drug Modality, and Geographic Strategy

Categories were aggregated by therapeutic area, modality, and geographic sales of the top-selling drugs in 2011 and 2017.

2.2.2. Investigation of Blockbuster Life Cycle Patterns

The four phases of the life cycle of drugs and products of other industries include introduction, growth, maturity, and decline [22]. We tried to keep the comparison simpler by devising an elaborate selection criteria of the study target to estimate the life cycle patterns when the growth process is relatively linear. For the introduction and growth phases, drugs whose sales did not reach 500 million USD in 2001 were considered. In this way, drugs launched before 2001 and approaching the maturity phase were excluded because the sales growth rate slows as the drug nears the maturity phase at which peak sales are attained. In terms of the maturity and decline phases, drugs whose sales peaked and then decreased were investigated. In these cases, the sales shifted from growth to decline from 2001 to 2016. We used a linear regression model to estimate life cycle patterns. For the sales growth rates in the introduction and growth phases, regression lines were computed by the least squares method for the period wherein the sales of individual drugs did not decline [23]. To establish the sales decline rates, regression lines were computed for individual drugs at the time when their sales did not exceed the peak [23].
The product life cycle patterns were compared by therapeutic area or modality via a Kruskal–Wallis test. If statistically significant differences were detected, a multiple comparison was conducted by the Bonferroni method. p < 0.05 was considered statistically significant [24]. Data processing was performed in SPSS v. 26.0 for Windows (IBM Corp., Armonk, NY, USA). Drug life cycle patterns by internationalization were not investigated as there were too few cases at the global and bi-regional level.

2.2.3. Blockbuster Life Cycle Patterns: Case Study

The existence of competing drugs is an external factor affecting drug life cycle. Early launch helps gain commercial advantage for drugs in the same class and with the same pharmacological mechanism [25]. However, first-mover advantage is not the only factor promoting commercial success and competitive advantage in the pharmaceutical industry [26,27]. A study on the competitive advantage of specialty drugs prescribed by specialists reported that efficacy is relatively more important for the first-mover whereas safety is comparatively more important for its followers. [28]. However, first- or early-mover advantage remains inconclusive. Several empirical studies on the pharmaceutical and other industries disclosed that first- or early-movers gain a competitive advantage [29,30,31,32,33,34]. In view of the potential impact of the order of entry of a product on its life cycle pattern, differences in the life cycle patterns among drugs within the same class and with the same pharmacological mechanism were compared. The sales growth rates in the introduction and growth phases, and the sales decline rates in the decline phase were compared for the first- or early-mover and the follower. Where there were multiple followers, their average sales growth or decline rates were compared and their average rates were compared against those of the first- or early-movers.

3. Results

3.1. Changes in Top-Selling Drug Therapeutic Area, Modality, and Geographic Strategy

Table 1 and Table 2 show the changes in top-selling drug classification by therapeutic area, modality, and internationalization over time in 2011 and 2017. In terms of therapeutic area, the drugs prescribed for cardiovascular and central nervous system diseases were the leading blockbusters in 2011 but their proportions declined in 2017. In contrast, the proportions of drugs administered for cancers, endocrine and metabolic diseases, and immune system diseases increased over time and these agents became the new blockbusters. The proportion of drugs prescribed for infectious diseases also increased primarily because antivirals against hepatitis C and HIV became blockbusters. Small-molecule drugs remained the primary modality and were used in a wide range of therapeutic areas. The proportions of antibodies, hormones, proteins, and peptides increased but these modalities had limited therapeutic applications. In terms of internationalization, the results must be interpreted with caution as there was missing geographic sales data. Global drugs decreased from 23.8% in 2011 to 8.2% in 2017 while home region-oriented drugs increased from 47.6% in 2011 to 63.3% in 2017.

3.2. Blockbuster Product Life Cycle Patterns

Table 3 and Table 4 compare blockbuster product life cycle patterns by therapeutic area and modality. We did not include product life cycle patterns for drugs administered for immune system diseases as their maturity and decline phase sample sizes were low (n = 2). For the blockbuster product life cycle patterns by therapeutic area (Table 3), there were statistically significant differences in the sales decline rates across therapeutic areas (p < 0.05). However, there were no statistically significant differences in sales growth rate (p = 0.752) or peak sales (p = 0.065) across therapeutic areas. We used the Bonferroni method to perform a multiple comparison on the decline in sales rates. There were no statistically significant differences between pairs but the rates for the drugs prescribed for cancers and endocrine and metabolic diseases were lower than those for the drugs administered for cardiovascular and infectious diseases.
Regarding the blockbuster product life cycle patterns by modality (Table 4), there were statistically significant differences across modalities for the sales growth and decline rates (p < 0.001 and p < 0.05, respectively). There were no statistically significant differences across modalities for peak sales (p = 0.204). We used the Bonferroni method to perform a multiple comparison on the sales decline rates and found pairs with statistically significant differences (Table 5). Small-molecule drugs and antibodies showed higher sales growth (p < 0.05 and p < 0.01, respectively) and small-molecule drugs showed higher sales decline (p < 0.05) rates than hormones, proteins, or peptides.
Although the standard deviations are large due to the small sample size, we believe that the results can be interpreted because there were statistically significant differences in certain phase(s) under this condition.

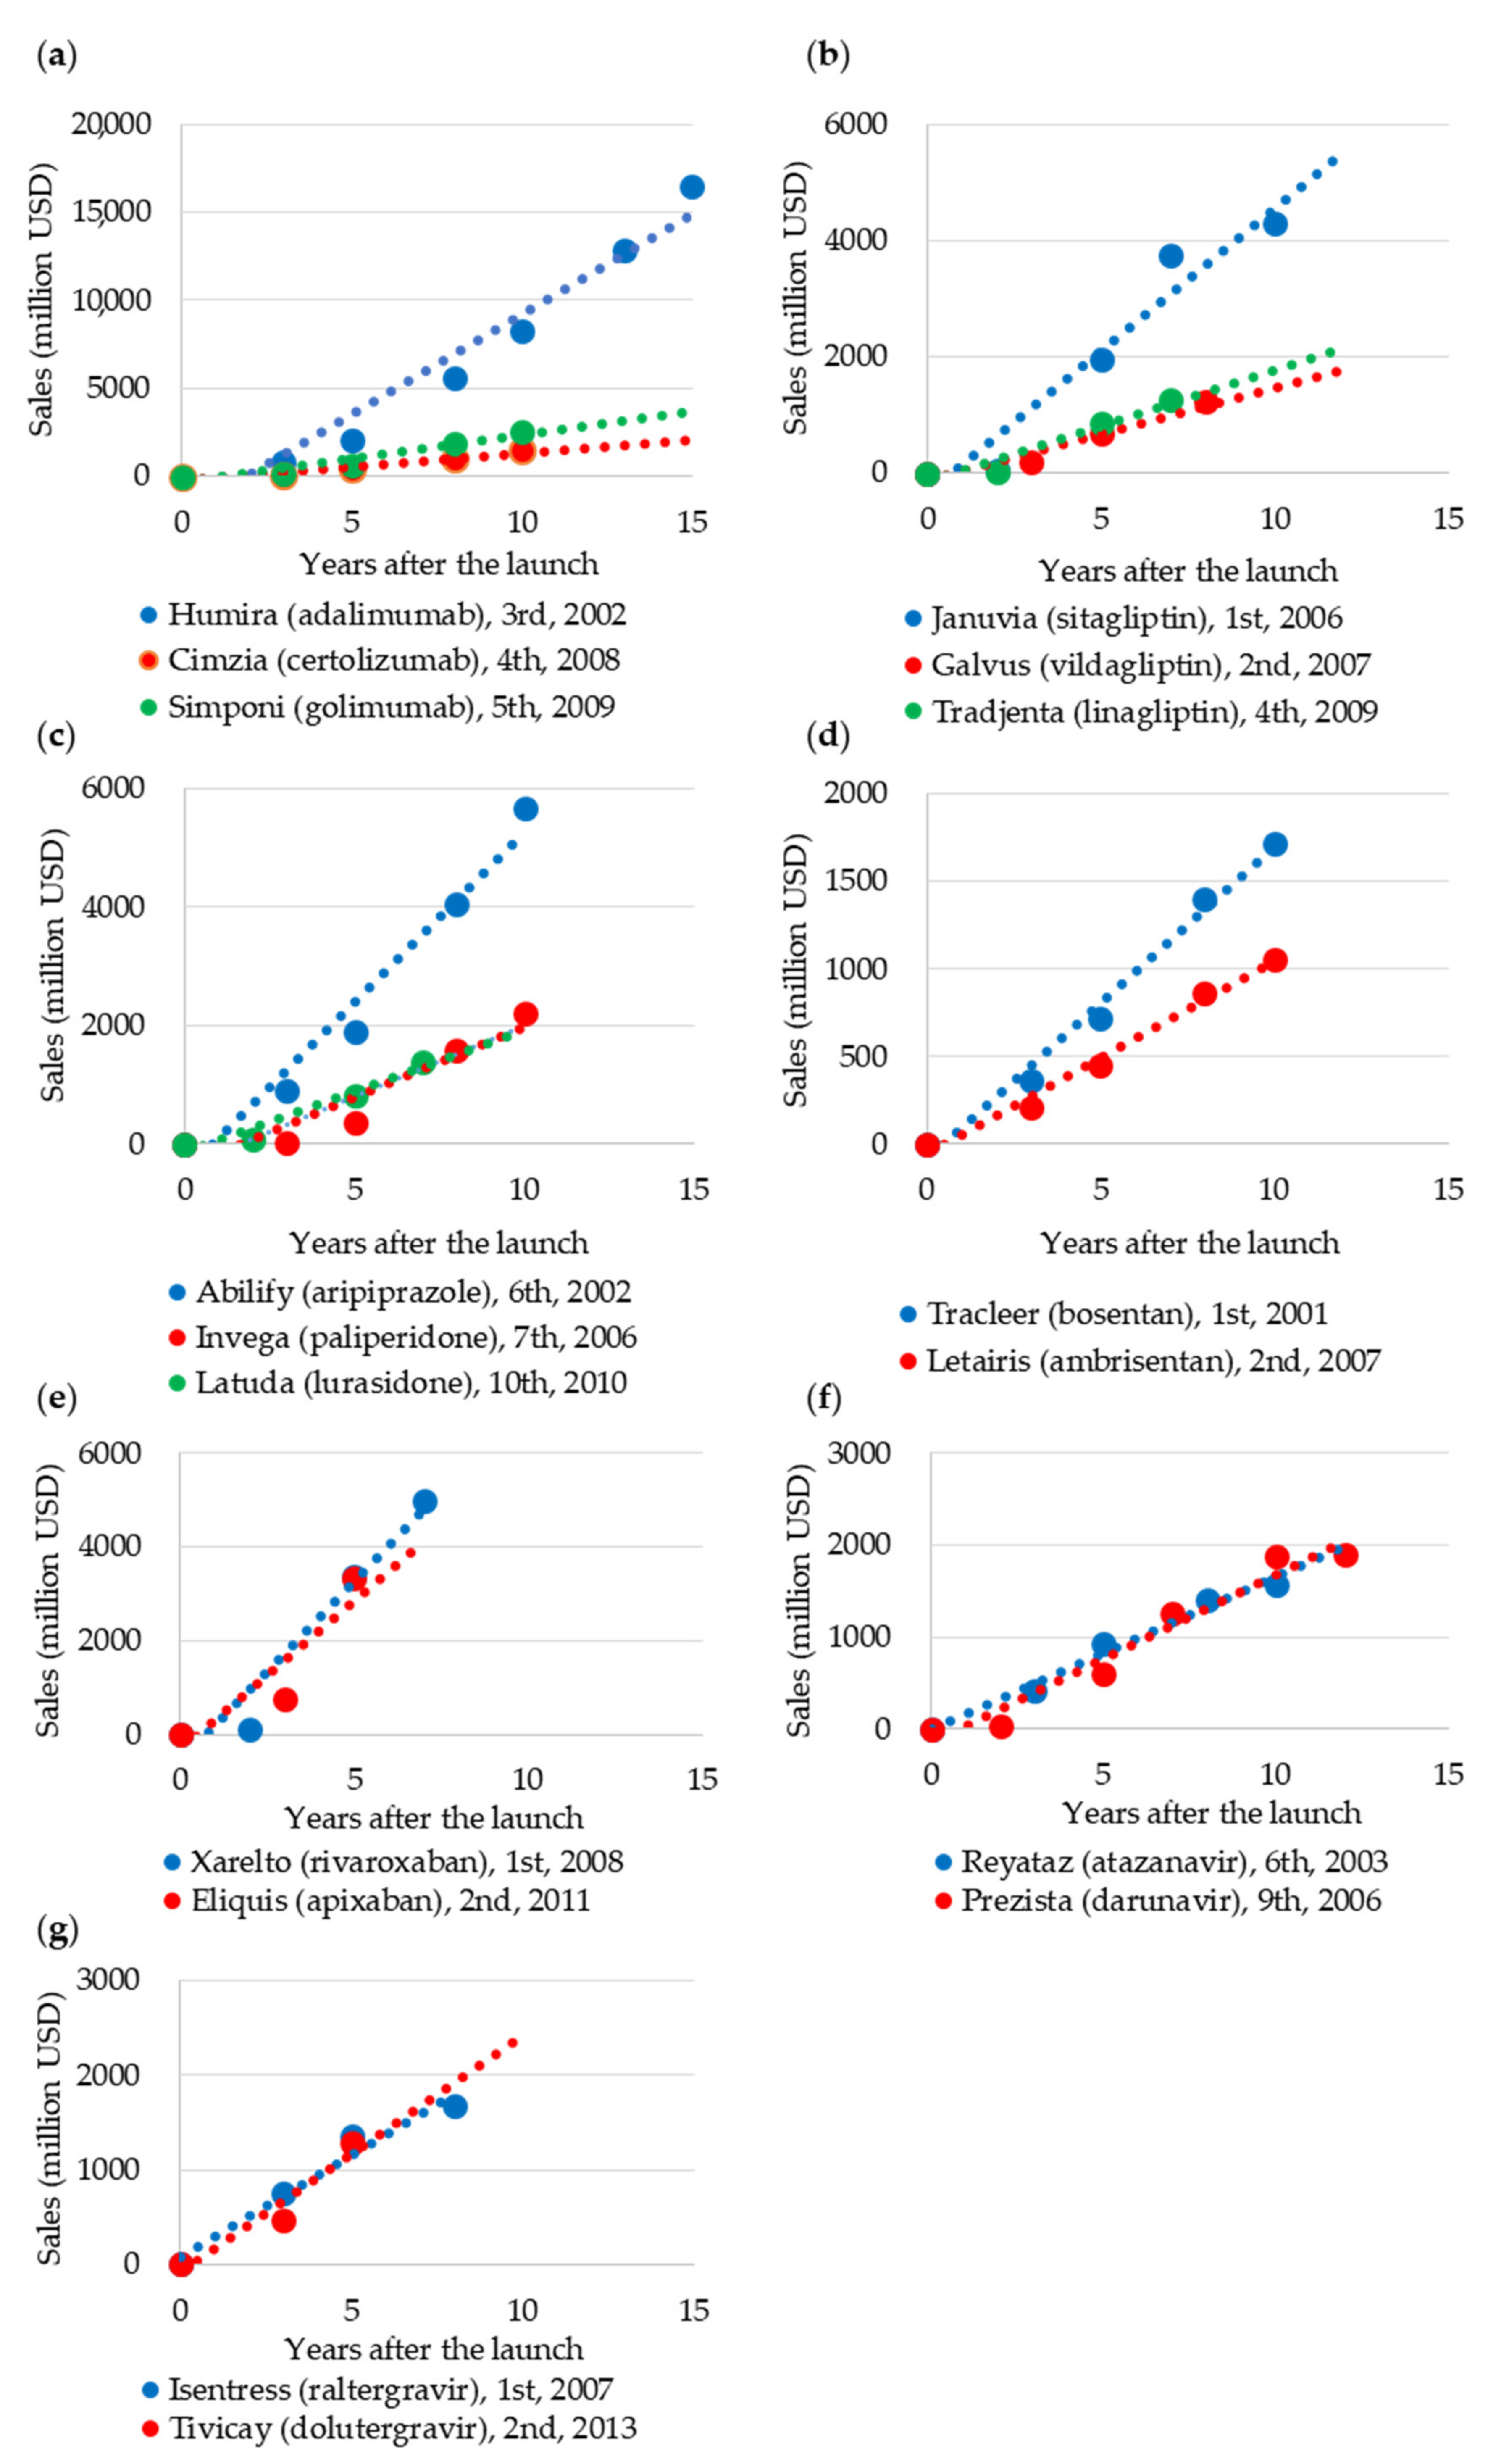
3.3. Case Study of Blockbuster Product Life Cycle Patterns

We conducted a case study to investigate the differences in the life cycle patterns of drugs within the same class and with the same pharmacological mechanism. We considered the potential impact of the order of entry of the product life cycle pattern. We compared the life cycle patterns of seven classes of drugs in the introduction and growth phases and five classes of drugs in the decline phase.
In terms of the introduction and growth phases (Figure 1), the sales growth rates of first- or early-mover drugs were higher than those of the followers in five of seven classes. Hence, most of the first-mover drugs had the advantage. However, in the case of tumor necrosis factor-alpha (TNF-α) antagonists administered for immune system diseases, we compared the early-mover Humira® (adalimumab) [35] with the followers Cimzia® (certolizumumumab) and Simponi® (golimumab) [36,37]. All drugs were administered by subcutaneous injection using pre-filled syringes. Nevertheless, the sales growth rate of the early-mover was ~5.38× higher than those of the followers. For the integrase chain transfer inhibitors prescribed for infectious diseases, we compared the first- mover Isentress® (raltergravir) [38] with the follower Tivicay® (dolutegravir) [39]. Both were orally administered tablets but the sales growth rate of the first-mover was ~0.86× that of the follower.
Concerning the decline phase (Figure 2), the sales decline rates of the first- or early-movers were greater than those of the followers in three of four classes. Thus, most of the first movers had the advantage. The exceptional category was the peroxisome proliferator-activated receptor (PPAR) agonists administered for endocrine and metabolic diseases. We compared the early-mover Avandia® (rosiglitazone) [40] with the follower Actos® (pioglitazone) [41]. Both were orally administered tablets but the early-mover had a sales decline rate ~0.48× that of the follower. We then compared the early- mover Arimidex® (anastrozole) [42] with the follower Femara® (letorozole). These aromatase inhibitors are prescribed for cancers [43]. Both were orally administered tablets but the early-mover had a sales decline rate ~1.23× that of the follower.
Caution must be taken when interpreting these comparisons as they do not consider factors such as marketing strategy that influence the sales growth and decline rates. Hence, they did not consistently confirm first-mover advantage in terms of blockbuster sales growth and decline rates. We wanted to determine whether the order of entry could have an impact on the product life cycle pattern according to therapeutic area or modality. However, we made no comparisons between therapeutic areas and modalities as there were too few cases.

4. Discussion and Implications

Pharmaceutical companies strive for sustainable growth by maintaining a cycle consisting of launching new drugs, gaining market share, making sales, reinvesting profits into research and development (R&D), and launching the next new drugs [44,45]. Decision-making in the R&D phase in terms of therapeutic area, modality, and geographic strategy is critical for achieving sustainable growth.
Through R&D, pharmaceutical companies have made numerous innovations over the past few decades [46,47,48] including efficacious drugs that prevent or control cardiovascular, endocrine, metabolic, and gastrointestinal diseases. This approach comprises the classic blockbuster model in the pharmaceutical industry. However, pharmaceutical companies are now shifting to a new nichebuster model wherein they target emerging, unmet, and local medical needs in specific markets such as immune system diseases, cancers, hepatitis C, and others. It is difficult to provide the reasons for this shift. It might be a result of many pharmaceutical companies experiencing blockbuster patent expiry issues and trying to overcome the vulnerability of the drug industry model that relies on blockbusters. It can also be attributed to the progress in filling the therapeutic areas in which blockbusters excelled and thus failing to create innovative drugs that are beyond them. The present study revealed that nichebusters are producing top-selling drugs in a manner similar to that of classic blockbusters in therapeutic areas with large populations. Thus, nichebusters are gaining a competitive advantage in terms of commercial success. Cancers are often designated as rare diseases. Anticancer agents designated as orphan drugs might garner large sales and profits as they can benefit from expedited regulatory reviews, rapid launch, premium prices, and indications for multiple cancers [49]. Identification of rare diseases is increasing annually thanks to rapid advances in medical technology and genome-level diagnostics [50]. Therefore, nichebusters might create therapeutic opportunities for other diseases besides cancers.
In terms of modality, the proportions of antibodies, hormones, proteins, and peptides have increased. However, small-molecule drugs remain the major modality among top-selling drugs. Antibodies, hormones, proteins, and peptides have the advantage of high target site selectivity and are generally safer than small-molecule drugs. Moreover, they may have greater efficacy in clinical trials than small-molecule drugs [51,52,53]. However, the processes involved in manufacturing antibodies, hormones, proteins, and peptides are complex and specialized. Furthermore, they require numerous in-process control tests on microorganisms and cells in order to establish their safety and efficacy accurately. Consequently, their manufacturing costs are high and they are often expensive [54,55]. It was said that modalities would shift from small-molecule drugs to antibodies, hormones, proteins, and peptides [56]. Nevertheless, this shift has not markedly progressed because of the aforementioned obstacles.
Our study disclosed that the geographic strategy of top-selling drugs may have shifted from global (wide-range medical needs) to home region-oriented (specific local medical needs). Hence, home region orientation provides a competitive advantage for commercial success. This conclusion is consistent with our previous company-level finding [20]. According to dynamic capability-based entrepreneurial theory, if a product is oligopolistic in a particular geographic market, it may be unattractive on a global market scale [57].
The present study revealed that the life cycle pattern of typical nichebuster anticancer drugs consists of a relatively high sales growth rate followed by a low sales decline rate. These trends are commercially interesting for pharmaceutical companies. Unlike drugs administered for cardiovascular diseases, the life cycle pattern of drugs prescribed for endocrine and metabolic diseases comprises high sales growth rate, high peak sales and low sales decline rates. Based on these characteristics, drugs prescribed for endocrine and metabolic diseases are considered alternative cardiovascular drugs. The present study also indicated that drugs administered for cancers and endocrine and metabolic diseases have relatively high affinities for antibodies, hormones, proteins, and peptides. The latter have lower sales decline rates than small-molecule drugs and may provide a competitive advantage for manufacturing technology capability. Therefore, they might enhance sales earnings over the long term. We also found that the life cycle patterns of drugs prescribed for infectious diseases show both high sales growth and decline rates. Thus, drugs administered for infectious diseases may not be conducive to the sustainable growth of pharmaceutical companies despite their high probability of success in clinical trials [51]. Here, we suggest that the drugs prescribed for immune system diseases have a unique life cycle pattern. Nevertheless, interpretation of the data is difficult as the sample size is small. The sales growth rate and peak sales for drugs prescribed for immune system diseases are high (+3.333 billion USD/y (n = 10) and 5.131 billion USD (n = 2), respectively) whereas their sales decline rate is low (−224 million USD (n = 2)). Increasing the sample size is necessary to adjust the life cycle pattern of drugs administered for immune system diseases. However, this drug class could be a growth engine for pharmaceutical companies. With regard to the impact of entry order on life cycle patterns, we found that most of the first-mover or early-mover drugs had the competitive advantage but we detected no consistent results on the advantage by having some exceptions.
Here, we newly created a simple model of product life cycle pattern per therapeutic area and modality (Figure 3 and Figure 4). The samples used to analyze the sales growth and decline rates and peak sales differed but were nonetheless treated as the same sample. The time intervals to peak and zero sales were determined from the sales growth rate and peak sales, and from the sales decline rate, respectively. In terms of therapeutic area, the sales of drugs prescribed for infectious diseases rose rapidly, attained peak sales in ~4.4 y, and declined to zero in ~5.8 y. In contrast, the sales of drugs administered for endocrine and metabolic diseases rose more slowly than those for drugs prescribed for infectious diseases. The former achieved peak sales in ~10.7 y and declined to zero in ~13.8 y. The sales of anticancer drugs reached peak sales in ~7.3 y which was about midway between those for the drugs administered for infectious, endocrine, and metabolic diseases. The anticancer drug sales declined to zero in ~14.2 y. Regarding modality, the sales of small-molecule drugs rose rapidly, attained peak sales in ~7.8 y, and declined to zero in ~8.8 y. In contrast, the sales of drugs prescribed for endocrine and metabolic diseases rose more slowly than those for small-molecule drugs, achieved peak sales in ~11.1 y, and declined to zero in ~14.8 y. Hence, the simple models designed here clearly demonstrated that the drug life cycle patterns per therapeutic area and modality had different properties. Pharmaceutical companies manage a wide range of drugs from the R&D to the sales and marketing phases. Therefore, they must identify the optimal drug combination for rapid return on investment (RoI) and prolonged sales earnings. It is hoped that the results of the present study furnish insight into therapeutic area strategies accounting for life cycle patterns and geographic strategies that factor in the competitive advantages of home region-oriented pharmaceutical companies. We believe that this information will help such enterprises establish and maintain sustainable growth.

5. Conclusions, Limitations, and Future Directions

Here, we reviewed changes in therapeutic area, modality, and internationalization of the top-selling drugs and found that they shifted from classic blockbusters to nichebusters and from global to home region orientation over the past decade. Furthermore, we identified the product lifecycle patterns per therapeutic area and discovered that drugs prescribed for cancers and endocrine and metabolic diseases contributed to the sustainable growth of pharmaceutical companies. We also performed a case study to investigate differences in the product life cycle patterns of drugs in the same class with the same mode of action. However, we detected no consistent results for the first-mover advantage. One limitation of this study is that a sample size was small and another one is that it did not consider competition within the therapeutic area or additional indications and dosage forms as elements of the drug life cycle strategy. Consequently, our understanding of individual drug life cycles is limited. Hence, we recommend conducting a micro-analysis of individual drugs such as examining the relationship between the timing of additional indications and sales growth as well as the relationship between the entry of competitors and sales decline due to overcoming the limitation. In addition, while this study was intended to contribute to decision-making at the product level, studies at the company level are needed to help pharmaceutical companies in optimal decision-making, such as identifying the best combination of products considering individual product life cycle patterns to maximize total sales as a company, which will require larger samples, more case studies and more comparative studies of sigmoid curve-shaped growth curves. Moreover, as our focus was on the top-selling drugs, our findings have to be complemented by the analysis results of the life cycle patterns of other types of drugs. We believe that this research area will continue to evolve as pharmaceutical companies still face challenges in comprehensive decision-making for sustainable growth.

Author Contributions

Conceptualization, F.T.; methodology, F.T.; software, F.T.; validation, F.T.; formal analysis, F.T.; investigation, F.T.; resources, F.T.; data curation, F.T.; writing—original draft preparation, F.T.; writing—review and editing, T.M., Y.L., S.S., T.N. and K.K.; supervision, K.K. All authors have read and agreed to the published version of the manuscript.

Funding

This work was supported by Grants-in-Aid for Challenging Exploratory Research (grant numbers 20K20769, 26301022, and 23730336). The funding sources did not participate in study design, data collection, analysis, interpretation, report writing, or the decision to submit this article for publication.

Acknowledgments

The authors thank the editors and referees for their valuable comments helping us to improve this paper.

Conflicts of Interest

The co-author Fumio Teramae is an employee of Eli Lilly Japan K.K. The co-author Tomohiro Makino is an employee of Daiichi Sankyo Co. Ltd. Neither company had any direct involvement in determining the content of this article.

References

  1. DiMasia, J.A.; Grabowski, H.G. The cost of biopharmaceutical R&D: Is biotech different? Manag. Decis. Econ. 2007, 28, 469–479. [Google Scholar]
  2. Paul, S.M.; Mytelka, D.S.; Dunwiddle, C.T.; Persinger, C.C.; Munos, B.H.; Lindborg, S.R.; Schach t, A.L. How to improve R&D productivity: The pharmaceutical industry’s grand challenge. Nat. Rev. Drug Discov. 2010, 9, 203–214. [Google Scholar] [PubMed]
  3. Farrell, D. Beyond offshoring: Assess your company’s global potential. Harv. Bus. Rev. 2004, 82, 82–90. [Google Scholar] [PubMed]
  4. Glickman, S.W.; McHutchison, J.G.; Peterson, E.D.; Cairns, C.B.; Harrington, R.A.; Califf, R.M.; Schulman, K.A. Ethical and scientific implications of the globalization of clinical research. N. Engl. J. Med. 2009, 360, 816–823. [Google Scholar] [CrossRef]
  5. Jeong, S.; Sohn, M.; Kim, J.H.; Ko, M.; Seo, H.; Song, Y.K.; Choi, B.; Han, N.; Na, H.S.; Lee, J.G.; et al. Current globalization of drug interventional clinical trials: Characteristics and associated factors, 2011–2013. Trials 2017, 18, 288. [Google Scholar] [CrossRef] [Green Version]
  6. Moorkens, E.; Meuwissen, N.; Huys, I.; Declerck, P.; Vulto, A.G.; Simoens, S. The market of biopharmaceutical medicines: A snapshot of a diverse industrial landscape. Front. Pharm. 2017, 8, 314. [Google Scholar] [CrossRef] [Green Version]
  7. Pharmaceuticals and Medical Devices Agency. Annual Reports. Available online: https://www.pmda.go.jp/english/about-pmda/annual-reports/0001.html (accessed on 25 August 2020).
  8. Slywotzky, A.J. The Art of Profitability; Warner Business Books: New York, NY, USA, 2002. [Google Scholar]
  9. Cutler, D. The demise of the blockbuster? New Engl. J. Med. 2007, 356, 1292–1293. [Google Scholar] [CrossRef]
  10. Nickisch, K.; Greuel, J.; Bode-Greuel, K. How can pharmaceutical and biotechnology companies maintain a high profitability? J. Commer. Biotechnol. 2009, 15, 309–323. [Google Scholar] [CrossRef]
  11. Montalban, M.; Sakinç, M.E. Financialization and productive models in the pharmaceutical industry. Ind. Corp. Chang. 2013, 22, 981–1030. [Google Scholar] [CrossRef]
  12. Anusha, K.; Krishna, P.; Kumar, V.P. Pharmaceutical product management. Pharma Innov. J. 2017, 6, 112–114. [Google Scholar]
  13. Vockley, J.G.; Niederhuber, J.E. Diagnosis and treatment of cancer using genomics. Br. Med. J. 2015, 350. Available online: www.jstor.org/stable/26520084 (accessed on 26 September 2020). [CrossRef]
  14. Friedman, A.A.; Letai, A.; Fisher, D.E.; Flaherty, K.T. Precision medicine for cancer with next-generation functional diagnostics. Nat. Rev. Cancer 2015, 15, 747–756. [Google Scholar] [CrossRef] [PubMed]
  15. Bentley, A.R.; Callier, S.; Rotimi, C.N. Diversity and inclusion in genomic research: Why the uneven progress? J. Community Genet. 2017, 8, 255–266. [Google Scholar] [CrossRef] [PubMed] [Green Version]
  16. Exchange Rates. Available online: http://data.imf.org/?sk=4C514D48-B6BA-49ED-8AB9-52B0C1A0179B&sId=1409151240976 (accessed on 27 September 2018).
  17. Rugman, A.M.; Verbeke, A. A perspective of regional and global strategies of multinational enterprises. J. Int. Bus. Stud. 2004, 35, 3–18. [Google Scholar] [CrossRef] [Green Version]
  18. Ohmae, K. Triad Power: The Coming Shape of Global Competition; The Free Press: New York, NY, USA, 1985. [Google Scholar]
  19. Gautam, A.; Pan, X. The changing model of big pharma: Impact of key trends. Drug Discov. Today 2016, 21, 379–384. [Google Scholar] [CrossRef] [Green Version]
  20. Teramae, F.; Makino, T.; Lim, Y.; Sengoku, S.; Kodama, K. International strategy for sustainable growth in multinational pharmaceutical companies. Sustainability 2020, 12, 867. [Google Scholar] [CrossRef] [Green Version]
  21. KEGG DRUG Database. Available online: https://www.kegg.jp/kegg/drug/drug_ja.html (accessed on 26 August 2020).
  22. Anderson, C.R.; Zeithaml, C.P. Stage of the product life cycle, business strategy, and business performance. Acad. Manag. J. 1984, 27, 5–24. [Google Scholar]
  23. Lehner, F. Software life cycle management based on a phase distinction method. Microproc. Microprogr. 1991, 32, 603–608. [Google Scholar] [CrossRef]
  24. Witte, R.S.; Witte, J.S. Statistics, 11th ed.; Wiley: Hoboken, NJ, USA, 2017. [Google Scholar]
  25. Schulze, U.; Ringel, M. What matters most in commercial success: First-in-class or best-in-class? Nat. Rev. Drug Discov. 2013, 12, 419–420. [Google Scholar] [CrossRef]
  26. Lieberman, M.B.; Montgomery, D.B. Conundra and progress: Research on entry order and performance. Long Range Plan. 2013, 46, 312–324. [Google Scholar] [CrossRef]
  27. Zachary, M.A.; Gianiodis, P.T.; Payne, G.T.; Markman, G.D. Entry timing: Enduring lessons and future directions. J. Manag. 2015, 41, 1388–1415. [Google Scholar] [CrossRef]
  28. Gudiksen, M.; Fleming, E.; Furstenthal, L.; Ma, P. What drives success for specialty pharmaceuticals? Nat. Rev. Drug Discov. 2009, 7, 563–567. [Google Scholar] [CrossRef] [PubMed]
  29. Lambkin, M. Order of entry and performance in new markets. Strat. Manag. J. 1988, 9, 127–140. [Google Scholar] [CrossRef]
  30. Lilien, G.; Yoon, E. The timing of competitive market entry. Manag. Sci. 1990, 36, 568–585. [Google Scholar] [CrossRef] [Green Version]
  31. Lambkin, M. Pioneering new markets: A comparison of market share winners and losers. Int. J. Res. Mark. 1992, 9, 5–22. [Google Scholar] [CrossRef]
  32. Gurumurthy, K.; Robinson, W.T.; Urban, G.L. Order of market entry: Established empirical generalizations, emerging empirical generalizations, and future research. Mark. Sci. 1995, 14, 212–221. [Google Scholar]
  33. Jensen, R. Innovative leadership: First mover advantages in new product adoption. Econ. Theory 2003, 21, 97–116. [Google Scholar] [CrossRef]
  34. Ouma, P.; Kilika, J.M. Innovation strategies, first mover advantage and performance in context of the microfinance sector: A review of literature. Int. J. Bus. Manag. 2018, 13, 195–209. [Google Scholar] [CrossRef] [Green Version]
  35. Rau, R. Adalimumab (a fully human anti- tumour necrosis factor alpha monoclonal antibody) in the treatment of active rheumatoid arthritis: The initial results of five trials. Ann. Rheum. Dis. 2002, 61, 70–73. [Google Scholar] [CrossRef] [Green Version]
  36. Goel, N.; Stephens, S. Certolizumab pegol. Mabs 2010, 2, 137–147. [Google Scholar] [CrossRef] [PubMed] [Green Version]
  37. Mazumdar, S.; Greenwald, D. Golimumab. Mabs 2009, 1, 422–431. [Google Scholar] [CrossRef] [Green Version]
  38. Evering, T.H.; Markowitz, M. Raltegravir (MK-0518): An integrase inhibitor for the treatment of HIV-1. Drugs Today 2007, 43, 865–877. [Google Scholar]
  39. Walmsley, S.L.; Antela, A.; Clumeck, N.; Duiculescu, D.; Eberhard, A.; Gutiérrez, F.; Hocqueloux, L.; Maggiolo, F.; Sandkovsky, U.; Granier, C.; et al. Dolutegravir plus abacavir-lamivudine for the treatment of HIV-1 infection. N. Engl. J. Med. 2013, 369, 1807–1818. [Google Scholar] [CrossRef] [Green Version]
  40. Balfour, J.A.B.; Plosker, G.L. Rosiglitazone. Drugs 1999, 57, 921–930. [Google Scholar] [CrossRef] [PubMed]
  41. Gillies, P.S.; Dunn, C.J. Pioglatizone. Drugs 2000, 60, 333–343. [Google Scholar] [CrossRef] [PubMed]
  42. Plourde, P.V.; Dyroff, M.; Dowsett, M.; Demers, L.; Yates, R.; Webster, A. ARIMIDEX: A new oral, once-a-day aromatase inhibitor. J. Steroid Biochem. Mol. Biol. 1995, 53, 175–179. [Google Scholar] [CrossRef]
  43. Trunet, P.F.; Bhatnagar, A.S.; Chaudri, H.A.; Hornberger, U. Letrozole (CGS 20267), a new oral aromatase inhibitor for the treatment of Advanced breast cancer in postmenopausal patients. Acta Oncol. 1996, 35, 15–18. [Google Scholar] [CrossRef] [PubMed] [Green Version]
  44. Booth, B.; Zemmel, R. Prospects for productivity. Nat. Rev. Drug Discov. 2004, 3, 451–456. [Google Scholar] [CrossRef]
  45. Kessel, M. The problems with today’s pharmaceutical business–an outsider’s view. Nat. Biotechnol. 2011, 29, 27–33. [Google Scholar] [CrossRef]
  46. Schuhmacher, A.; Germann, P.G.; Trill, H.; Gassmann, O. Models for open innovation in the pharmaceutical industry. Drug Discov. Today 2013, 18, 1133–1137. [Google Scholar] [CrossRef]
  47. Mazzola, E.; Bruccoleri, M.; Perrone, G. Open innovation and firms’ performance: State of the art and empirical evidences from the bio-pharmaceutical industry. Int. J. Technol. Manag. 2016, 70, 109–134. [Google Scholar] [CrossRef] [Green Version]
  48. Olk, P.; West, J. The relationship of industry structure to open innovation: Cooperative value creation in pharmaceutical consortia. RD Manag. 2020, 50, 116–135. [Google Scholar] [CrossRef]
  49. Attwood, M.M.; Rask-Andersen, M.; Schiöth, H.B. Orphan drugs and their impact on pharmaceutical development. Trends Pharm. Sci. 2018, 39, 525–535. [Google Scholar] [CrossRef]
  50. Kempf, L.; Goldsmith, J.C.; Temple, R. Challenges of developing and conducting clinical trials in rare disorders. Am. J. Med. Genet. 2018, 176, 773–783. [Google Scholar] [CrossRef]
  51. Hay, M.; Thomas, D.W.; Craighead, J.L.; Economides, C.; Rosenthal, J. Clinical development success rates for investigational drugs. Nat. Biotechnol. 2014, 32, 40–51. [Google Scholar] [CrossRef] [PubMed]
  52. Kola, I.; Landis, J. Can the pharmaceutical industry reduce attrition rates? Nat. Rev. 2004, 3, 711–715. [Google Scholar] [CrossRef]
  53. DiMasi, J.A.; Feldman, L.; Seckler, A.; Wilson, A. Trends in risks and associated with new drug development: Success rates for investigational drugs. Clin. Pharm. 2010, 87, 272–277. [Google Scholar] [CrossRef]
  54. Shukla, A.A.; Wolfe, L.S.; Mostafa, S.S.; Norman, C. Evolving trends in mAb production processes. Bioeng. Transl. Med. 2017, 2, 58–69. [Google Scholar] [CrossRef]
  55. Roque, A.C.A.; Lowe, C.R.; Taipa, M.Â. Antibodies and genetically engineered related molecules: Production and purification. Biotechnol. Progr. 2004, 20, 639–654. [Google Scholar] [CrossRef]
  56. Kleinman, M. Pharma Shifts Focus From Small Molecules to Biologics. PearlIRB 2012. Available online: https://www.pearlirb.com/pharma-shifts-focus-from-small-molecules-to-biologics/ (accessed on 6 October 2020).
  57. Teece, D.J. A dynamic capabilities-based entrepreneurial theory of the multinational enterprise. J. Int. Bus. Stud. 2014, 45, 8–37. [Google Scholar] [CrossRef] [Green Version]
Figure 1. Drugs in the introduction and growth phases. Product name (generic name), entry order, approval year. (a) TNF-α antagonist for immune system diseases (5.38× that of the follower); (b) dipeptidyl peptidase-4 inhibitor for endocrine and metabolic diseases (2.79× that of the follower); (c) dopamine D2 receptor antagonist for nervous system diseases (2.42× that of the follower); (d) endothelin receptor antagonist for cardiovascular diseases (1.63× that of the follower); (e) Factor Xa inhibitor for cardiovascular diseases (1.21× that of the follower); (f) protease inhibitor for infectious diseases (0.90× that of the follower); (g) integrase strand transfer inhibitor for infectious diseases (0.86× that of the follower).
Sustainability 12 08938 g001
Figure 2. Drugs in the decline phase. Product name (generic name), entry order, approval year. (a) PPAR agonist for endocrine and metabolic diseases (0.48× the sales decline rate of the follower); (b) selective serotonin reuptake inhibitor for nervous system diseases (0.51× the sales decline rate of the follower); (c) angiotensin II receptor antagonist for cardiovascular diseases (0.94× the sales decline rate of the follower); (d) aromatase inhibitor for cancers (1.23× the sales decline rate of the follower).
Sustainability 12 08938 g002
Figure 3. Simple model of product life cycle pattern per therapeutic area. Red, infectious diseases; Blue, cancers; Yellow, endocrine and metabolic diseases; Green, cardiovascular diseases; Black, central nervous system diseases. (a) introduction and growth phases; (b) decline phase.
Sustainability 12 08938 g003
Figure 4. Simple model of product life cycle pattern per modality. Red, small-molecule drugs; Blue, hormones, proteins, and peptides; Green, antibodies. (a) introduction and growth phases; (b) decline phase.
Sustainability 12 08938 g004
Table 1. Changes in the classifications of top-selling drugs by therapeutic area and modality.
Therapeutic Areas/
Modalities
Cardio-Vascular DiseasesInfectious DiseasesCancersEndocrine and Metabolic DiseasesCentral Nervous System DiseasesImmune System DiseasesOthersTotal
Small molecules20119
(17.6%)
2
(3.9%)
3
(5.9%)
2
(3.9%)
9
(17.6%)
0
(0.0%)
8
(15.7%)
33
(64.7%)
20174
(6.6%)
5
(8.2%)
7
(11.5%)
2
(3.3%)
3
(4.9%)
0
(0.0%)
8
(13.1%)
29
(47.5%)
Antibodies20110
(0.0%)
0
(0.0%)
3
(5.9%)
0
(0.0%)
0
(0.0%)
2
(3.9%)
1
(2.0%)
6
(11.8%)
20170
(0.0%)
0
(0.0%)
6
(9.8%)
0
(0.0%)
0
(0.0%)
5
(8.2%)
4
(6.6%)
15
(24.6%)
Hormones, proteins, and peptides20110
(0.0%)
0
(0.0%)
0
(0.0%)
3
(5.9%)
0
(0.0%)
1
(2.0%)
5
(9.8%)
9
(17.6%)
20170
(0.0%)
0
(0.0%)
0
(0.0%)
6
(9.8%)
0
(0.0%)
2
(3.3%)
6
(9.8%)
14
(23.0%)
Others20111
(2.0%)
1
(2.0%)
0
(0.0%)
0
(0.0%)
0
(0.0%)
0
(0.0%)
1
(2.0%)
3
(5.9%)
20170
(0.0%)
2
(3.3%)
0
(0.0%)
0
(0.0%)
0
(0.0%)
0
(0.0%)
1
(1.6%)
3
(4.9%)
Total201110
(19.6%)
3
(5.9%)
6
(11.8%)
5
(9.8%)
9
(17.6%)
3
(5.9%)
15
(29.4%)
51
(100.0%)
20174
(6.6%)
7
(11.5%)
13
(21.3%)
8
(13.1%)
3
(4.9%)
7
(11.5%)
19
(31.1%)
61
(100.0%)
Table 2. Changes in the classifications of top-selling drugs by internationalization.
Internationalization GlobalBi-RegionalHome Region-OrientedHost Region-OrientedUnknownTotal
Drugs20115
(23.8%)
2
(9.5%)
10
(47.6%)
4
(19.0%)
3051
20174
(8.2%)
1
(2.0%)
31
(63.3%)
13
(26.5%)
1261
Table 3. Blockbuster product life cycle patterns by therapeutic area.
Therapeutic AreasIntroduction and GrowthMaturity (Peak)Decline
Average Million USD/y (SD)npAverage Million USD (SD)npAverage Million USD/y (SD)np
Cardio-vascular diseases+302.386
(211.750)
200.7523239.620
(2766.851)
280.065−348.361
(419.697)
280.040
Infectious diseases+455.033
(678.060)
28 2005.968
(1907.527)
23 −346.970
(648.543)
23
Cancers+325.549
(233.024)
28 2372.785
(1864.003)
21 −166.948
(153.257)
21
Endocrine and metabolic diseases+300.789
(155.375)
10 3216.716
(2105.874)
10 −233.867
(354.692)
10
Central nervous system diseases+239.942
(145.033)
22 2573.470
(1415.890)
29 −295.959
(243.229)
29
Table 4. Blockbuster product life cycle patterns by modality.
ModalitiesIntroduction and GrowthMaturity (Peak)Decline
Average Million USD/y (SD)npAverage Million USD (SD)npAverage Million USD/y (SD)np
Small molecules+330.110
(393.848)
1030.0012578.793
(2007.308)
1220.204−291.860
(385.537)
1220.018
Antibodies+374.857
(258.018)
20 4631.614
(3180.532)
7 −200.940
(177.354)
7
Hormones, proteins, and peptides+212.266
(200.791)
30 2359.080
(1706.421)
26 −159.113
(207.098)
26
Table 5. Multiple comparisons across modalities.
ModalitiesIntroduction and GrowthDecline
Small MoleculesAntibodiesHormones, Proteins, and PeptidesSmall MoleculesAntibodiesHormones, Proteins, and Peptides
Small molecules-=
(p = 0.291)
>
(p < 0.05)
-=
(p = 1.000)
>
(p < 0.05)
Antibodies=
(p = 0.291)
->
(p < 0.01)
=
(p = 1.000)
-=
(p = 1.000)
Hormones, proteins, and peptides<
(p < 0.05)
<
(p < 0.01)
-<
(p < 0.05)
=
(p = 1.000)
-
Publisher’s Note: MDPI stays neutral with regard to jurisdictional claims in published maps and institutional affiliations.

