Abstract
Accurate information about groundwater level prediction is crucial for effective planning and management of groundwater resources. In the present study, the Artificial Neural Network (ANN), optimized with a Genetic Algorithm (GA-ANN), was employed for seasonal groundwater table depth (GWTD) prediction in the area between the Ganga and Hindon rivers located in Uttar Pradesh State, India. A total of 18 models for both seasons (nine for the pre-monsoon and nine for the post-monsoon) have been formulated by using groundwater recharge (GWR), groundwater discharge (GWD), and previous groundwater level data from a 21-year period (1994–2014). The hybrid GA-ANN models’ predictive ability was evaluated against the traditional GA models based on statistical indicators and visual inspection. The results appraisal indicates that the hybrid GA-ANN models outperformed the GA models for predicting the seasonal GWTD in the study region. Overall, the hybrid GA-ANN-8 model with an 8-9-1 structure (i.e., 8: inputs, 9: neurons in the hidden layer, and 1: output) was nominated optimal for predicting the GWTD during pre- and post-monsoon seasons. Additionally, it was noted that the maximum number of input variables in the hybrid GA-ANN approach improved the prediction accuracy. In conclusion, the proposed hybrid GA-ANN model’s findings could be readily transferable or implemented in other parts of the world, specifically those with similar geology and hydrogeology conditions for sustainable planning and groundwater resources management.
Keywords:
artificial intelligence; Ganga; groundwater; Hindon; statistical indicators; Uttar Pradesh 1. Introduction
Groundwater is one of the most vital natural resources. It promotes healthy human life, economic growth, and environmental sustainability. It becomes a reliable source of water in all climatic regions of the world [1]. Due to rapid population growth, industrial development, agricultural activities, and increased domestic use, most of the world’s countries will face a freshwater shortage problem [2]. The spatial-temporal variation, discrepancies of groundwater resources, and increased groundwater dependence have also impacted groundwater levels [3,4]. The physical-based model requires explicit knowledge about the study region’s physical properties (characterization and quantification), boundary conditions, and big dataset; usually, these aspects are very laborious, costly, and time-consuming [1,5]. To overcome these difficulties, the machine learning-based model has proved the ability to solve large complex problems, including rainfall-runoff modeling [6,7,8], hydrometeorological drought prediction [9,10,11], evaporation estimation [12,13,14,15], simulation of evapotranspiration [16,17,18], and prediction of groundwater level [19,20,21,22,23,24,25,26]. Recently, Deb et al. [27] and Den and Kiem [28] explored the contribution of surface water (SW) and groundwater (GW) in a rainfall-runoff relationship simulation in two heterogeneous, semi-arid catchments located in southeast Australia (SEA) under different climatic conditions by using physical-based models. They found highly improved runoff simulation during dry conditions linked with SW–GW in study catchments.
In a related context, extensive application of the Artificial Neural Network (ANN) has been found in water resources engineering, such as modeling of groundwater discharge [29,30,31,32,33,34,35], groundwater quality prediction [36,37,38,39], and aquifer parameter estimation [40,41,42]. Also, the hybrid and straightforward versions of ANN have been widely utilized for modeling groundwater fluctuation in confined aquifers, unconfined aquifers, leaky or semi-confined aquifers, and multi-layered aquifer systems [43,44,45,46,47,48,49,50,51,52]. Furthermore, different machine learning models optimized with nature-inspired algorithms have been proposed for attaining higher reliability in water resource problems [53,54,55].
The genetic algorithm (GA) is a stochastic approach capable of solving complex multi-dimensional problems for finding the optimal global solution. In the last 25 years, GA has been successfully explored in the diverse field of engineering [56,57,58,59,60,61]. Likewise, Dash et al. [62] integrated the ANN with GA (GA-ANN) to predict the groundwater level in the lower Mahanadi river basin of Orissa State, India. The hybrid GA-ANN model results were compared with standalone ANN, optimized with back-propagation, Levenberg–Marquardt, and Bayesian regularization algorithms. They found a better performance with the GA-ANN model of medium and high groundwater level prediction than the other models. Supreetha et al. [63] investigated the GA-ANN model’s capability to forecast the groundwater fluctuation in the Udupi District, Karnataka (India). The monthly rainfall and water level records of 10 years were used as input. The results of the analysis revealed that the GA-ANN model outperformed the ANN model. Hosseini and Nakhaei [64] employed the back-propagation network (BP) coupled with GA (GA-BP) in the Shabestar Plain of Iran to predict monthly groundwater levels using hydrometeorological inputs. They found that the GA-BP method performed superiorly to the simple BP method. However, other studies also support the feasibility of the hybrid GA-ANN model for groundwater management problems [65,66,67].
Consequently, Wibowo et al. [68] proposed hybrid multiple back-propagation neural networks with GA (M-BPNN-GA) to resolve the limitation of a Seasonal Auto-Regressive Integrated Moving Average (SARIMA), Auto-Regressive Integrated Moving Average (ARIMA), Back-Propagation Neural Network (BPNN), and Exogenous Input Nonlinear Auto-Regressive Network (NARX) for predicting the groundwater level in the Dungun River, Malaysia. They found that the M-BPNN-GA improved significantly over the ARIMA/ SARIMA, BPNN, and NARX techniques. Li et al. [69] used the particle swarm optimization (PSO), GA with back-propagation (GA-BP), artificial bee colony with back-propagation (ABC-BP), and BP to project the groundwater level in overexploited arid regions of northwest China. They found a promising performance of the ABC-BP method with double hidden nodes in long-term groundwater fluctuation prediction.
To this end, for socio-economic development in the Gangetic plain of eastern Uttar Pradesh, the groundwater plays a dynamic role. Although agriculture is the primary income source in Uttar Pradesh, farmers are mostly dependent on the groundwater for non-monsoon season irrigation, as stated by the Central Groundwater Board (CGWB) [70]. With the tremendous increase in population growth, this region faces higher freshwater demand, leading to groundwater scarcity during the non-monsoon season. According to the authors’ knowledge and reported literature so far, no study has been conducted to examine the potential of a hybrid machine learning model—that is, a genetic algorithm integrated with an artificial neural network (GA-ANN) for predicting the seasonal groundwater table depth fluctuations in the area between the Ganga and Hindon rivers by using various hydrogeological variables. The outcomes of the hybrid GA-ANN models were compared with the traditional GA models based on eight statistical indicators (coefficient of determination (R2), coefficient of efficiency (CE), correlation coefficient (r), mean absolute deviation (MAD), root mean square error (RMSE), coefficient of variation of error residuals (CVRE), absolute prediction error (APE), and performance index (PI)) and through visual interpretation for optimal utilization of groundwater resources in the study area.
2. Materials and Methods
2.1. Description of the Study Area
The study region is situated between the Hindon River and the Ganga River, consisting of an alluvial cover of the Gangetic plain covering approximately 563,647 hectares with varying elevations from 215 m to 273 m above MSL (mean sea level). The study region lies between the latitude of 28°66′ N and 29°92′ N and longitude of 77°46′ E and 78°02′ E, consisting of 24 blocks: 3 blocks of Saharanpur district (Baliakheri, Nagal, Deoband), 6 blocks of Muzaffarnagar district (Charthawal, Purkaji, Muzaffarnagar, Shahpur, Janpath, Khatauli), 12 blocks of Meerut district (Sardhana, Rohta, Daurala, Mawana, Meerut, Janikurd, Saroorpur, Paricchitgarh, Hastinapur, Rajpura, Kharkhoda, Macchra) and 3 blocks of Ghaziabad district (Muradnagar, Razapur, Bhojpur) of Uttar Pradesh. Figure 1 illustrates the location map study area with all the blocks. The entire study region’s climate is sub-tropical monsoon with annual rainfall ranging from 933 mm to 1204 mm.
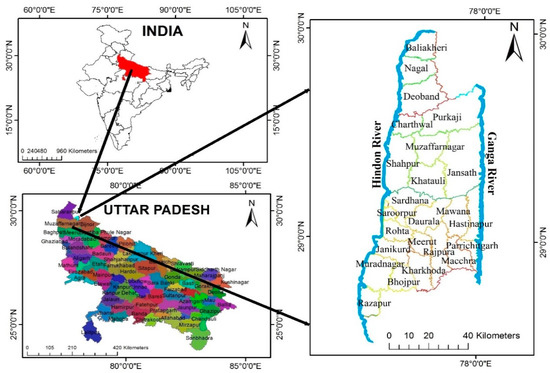
Figure 1.
Location Map of the Study Area.
2.2. Hydrogeology of Study Area and Data Acquisition
The study region covers alluvium plain, consisting of sand, silt, clay, and minerals like sodium carbonate, sodium chloride, and sodium sulfate with calcium and magnesium, and detrital traces in varying proportions. Typically, the deposit of the sand bed contains the groundwater in the area. The abstractions of groundwater are utilized for irrigation, drinking, industrial, and domestic purposes in the study area. The groundwater abstraction rate is 942 m3/h, while the demand is estimated to be between 5069 and 12,672 m3/h [70]. This study location has heterogeneous types of aquifers, which are divided into three categories:
- Aquifer type group I is composed of different types of basalt rocks, like weathered, dense, and vesicular. Groundwater occurs under water table conditions 30 m or lower than ground level. The tube well discharge varies from 97 to 227 m3/h for drawdown between 2.68 m and 0.68 m.
- Aquifer type group II is mainly sandstone, siltstone, limestone, and schist. The piezometric head of the horizontal flowing wells lies between 6.63 and 8.92 m above the groundwater level. In the non-flowing wells, it ranges between 1.55 and 11.34 m below the ground level. Most tube wells constructed in this region register a free flow, ranging from 80 to 210 m3/h. In the non-flowing wells, the discharge head varies from 2 to 8 m.
- Aquifer type group III is composed of gravel, pebbles, grit, sand, clay, etc. Quaternary aquifers belong to this group. Groundwater occurs under unconfined conditions in surface or near-surface aquifers. Water depth varies from 0.2 to 9.7 m.
For this analysis, the daily rainfall data of 21 years (1994–2014) were obtained from the Nazarat district headquarters, while the groundwater table depth (GWTD) data measured at 38 observation wells (Dabthawa, Daurala, Hastinapur, Ganeshpur, Janikurd, Atrada, Kaili, Macchra, Mawana, Pilona, Meerut, Khatki, Paricchitgarh, Sathla, Incholi, Mau Khas, Rajpura, Salawana, Sardhana, Sarrorpur, Surana, Razapur, Charthwal, Kutsera, Jansath, Kakrauli, Barla, Sohanjini, Deoband, Rajupur, Kapoori Govindpur, Nagal, Rohta, Khatauli, Lakhnaur, Amrala, Muradnagar, and Muzaffarnagar) for the pre- and post-monsoon seasons were collected from the Groundwater Department of Uttar Pradesh (India) for the same period. Figure 2 shows the location of observation wells in the study area. The pre-monsoon, post-monsoon, monsoon, and non-monsoon seasons are March–May, October–December, June–September, and January–February, respectively. Figure 3a,b demonstrates the variation of groundwater table depth measured at 38 observation wells during the pre- and post-monsoon seasons. The study region’s statistical data were taken from the corresponding district statistical departments regarding the number of minor irrigation structures, the area taken by minor and major crops, area irrigated by minor irrigation structures, and the human population and livestock.
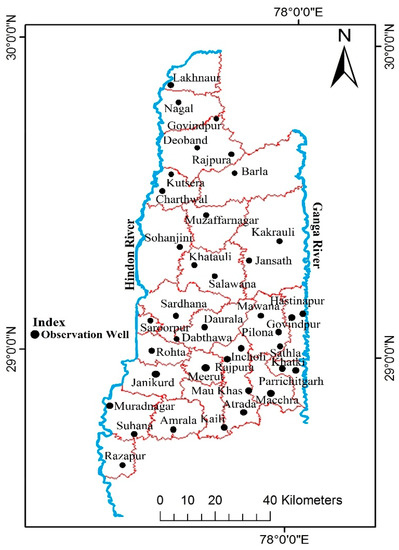
Figure 2.
Study Area with 38 Observation Wells.
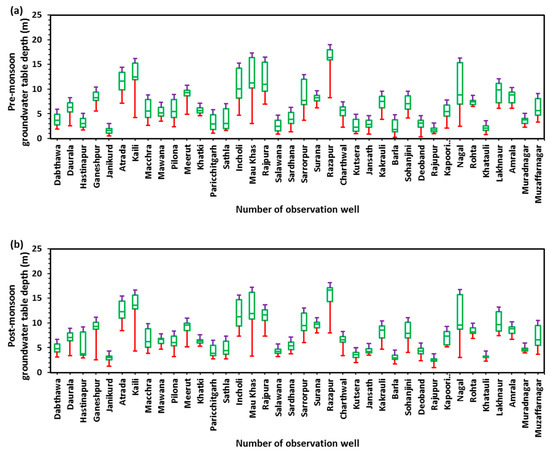
Figure 3.
The Fluctuation of Groundwater Table Depth at 38 Observation Wells in (a) Pre-Monsoon, and (b) Post-Monsoon Seasons, 1994–2014.
2.3. Genetic Algorithm (GA)
The GA is a robust optimization metaheuristic algorithm, driven by natural and biological selection based on Darwin’s survival theory [71,72]. The GA has no hypotheses like linearity, stationary, or uniformity, and does not depend on any specific conceptual phenomenon. It involves chromosomes, population set, fitness function, mutation, and selection steps. This provides a set of solutions, named populations, that are governed by chromosomes. The solutions are taken from one population and used to originate a new population, based on the idea that the newly developed population will be better than the older population.
Furthermore, solutions are chosen to develop new solutions (offspring) as per the fitness function. The above procedure will be repeated until the number of offspring in the final population is the same as that equal to the number of parents in the initial population. Two genetic operators are used in these processes: crossover and mutation. In this study, double point crossover and Gaussian mutation operators were used with a crossover and mutation probability of 0.01. Figure 4 shows the general process chart of the genetic algorithm. The necessary steps of the GA are outlined below:
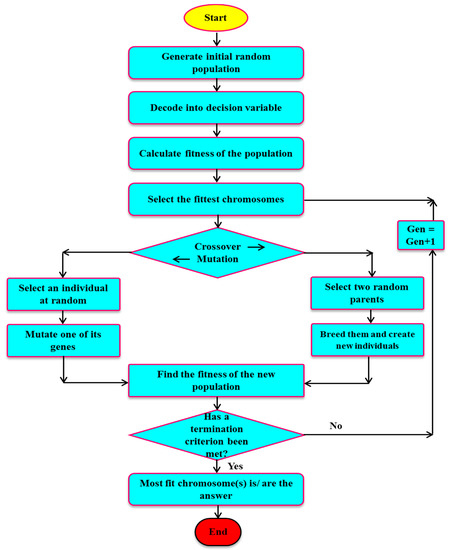
Figure 4.
Flow Chart of the Genetic Algorithm (GA) Model.
- Start: Generate chromosomes by random population.
- Fitness: Determine the fitness function in the populations of every chromosome.
- New Population: Develop the new population by following the steps that follow until completing the new population.
- (a)
- Selection: Based on their fitness, identify two parent chromosomes from a population.
- (b)
- Crossover: Cross the parents to create a new spring (children), with the possibility of a crossover. When there is no crossover, offspring are the exact duplicate of the parents.
- (c)
- Mutation: Mutate new offspring at each locus, with the likelihood of mutation.
- (d)
- Accepting: In the new population, locate new offspring.
- Replace: For the further running of the algorithm, use the newly created population.
- Test: When the ended conditions are encountered, the current population’s best outcome will stop and return.
- Loop: Switch back to Step 2.
2.4. Hybrid Genetic Algorithm-Artificial Neural Network (GA-ANN)
In this research, the Hybrid GA-ANN model was developed by incorporating the ANN into a single topology coupled with the GA. The single ANN model suffers from certain drawbacks, such as getting trapped through local minima and slow learning rates. Therefore, optimization algorithms such as the GA with ANN can significantly improve ANN efficiency [73,74,75] over the aforementioned weaknesses. The integrated GA-ANN strategy fulfills the goal based on two steps:
- The GA technique is used to improve the topology of the ANN and its variables.
- The optimal response is obtained using ANN.
In this study, the GA method was chosen to maximize the optimal number of hidden neurons, weights, and bias values for the ANN models. The GA variables, like crossover likelihood, selection method, mutation rate, size of the population, and the generation numbers, were calculated based on a hit and trial procedure; the details of GA parameters are summarized in Table 1. The flow diagram of the proposed hybrid GA-ANN technique is depicted in Figure 5.

Table 1.
GA parameters for the optimization of the Artificial Neural Network (ANN) model.
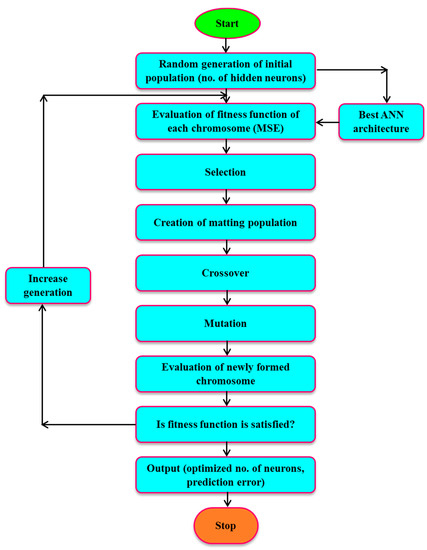
Figure 5.
Flow Chart of the Hybrid GA-ANN Model.
2.5. Determination of the Parameters the ANN Model
Architecture: Sets the relationship between a series of inputs and the desired outputs. The ANN with a single hidden node structure has been used to forecast the seasonal GWTD in the study area.
Training algorithm: Training is a process in which iterative modification and optimization techniques are adjusted to update the ANN model parameters such as connection weights and bias values. After several iterations, the training will stop or converge to a specified minimum error rate. In this study, GA optimization techniques were employed to reduce the error between the target and the predictors.
Activation function: Used to convert the input signal to output. In this study, a linear transfer function in the output layer and a logistic sigmoid transfer function in the hidden node were used for ANN models. The functional limitations of the sigmoid logistic factor range between 0 and 1.
Learning rate: The trained mechanism’s efficiency is highly vulnerable to the selection of the learning rate. A non-conventional GA optimization method was used to evaluate the favorable learning rate.
Hidden neuron optimization: In general, a hit and trial procedure was utilized to determine the neurons’ best-hidden numbers. Few researchers showed the utility of GA for optimizing hidden neurons [76,77]. Hence, in this study, the GA optimization method was utilized to calculate the hidden neurons’ optimum numbers.
Error function: Denoted by E, the means square error used for the optimization of the weights and described by Equation (1):
where is the actual value, is the predicted value, and n is the number of observations.
Weight optimization: In this study, the learning of error correction was used to develop a channel to attain favorable connection weights by reducing the risk of error between the network’s actual performance of a neuron and the response targeted from that neuron. The initial range of weights chosen was from 0 to 1 and was then prioritized using the GA technique.
2.6. Development of GA-ANN and GA Models for GWTD Prediction
In this research, a total of 18 models (9 for pre-monsoon and 9 for post-monsoon) were developed with different input parameters (groundwater discharge, groundwater recharge, and antecedent water table depth), as listed in Table 2, for predicting the seasonal GWTD in the study region. The total available data were separated into two classes: (i) training data included from 1994 to 2008 (70%), and (ii) testing data obtained from 2009 to 2014 (30%). In both the seasons, the number of observations varied from 548 to 570 for the training, and 206 to 228 for the testing. Figure 6 illustrates the length of data utilized for the training and testing of the GA and GA-ANN models. The entire ANN and GA modeling exercises were carried out using the MATLAB R2013a software.

Table 2.
Parameters of nine developed models for pre- and post-monsoon seasons.
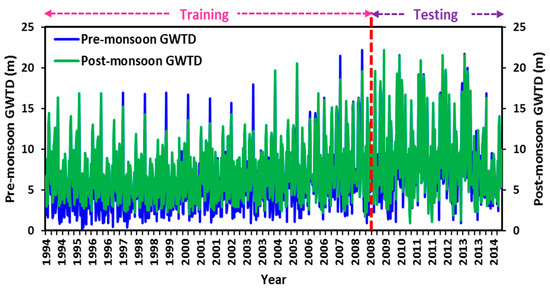
Figure 6.
Time-Series Plot of Pre- and Post-Monsoon GWTD in the Study Region.
In Table 2, the groundwater recharge (GWR) and discharge (GWD) were computed using Equations (2) and (3) given by the Ministry of Water Resources, India (MWRI) [78]:
where is recharge due to rainfall, is recharge due to seepage from canals, is recharge due to return flow of irrigation water, is groundwater inflow into the area, is influent seepage from rivers, is recharge due to seepage from tanks and ponds, is effluent seepage to rivers, is groundwater outflow from the area, is evapotranspiration loss from groundwater reservoir, and is groundwater pumpage through wells. The groundwater recharge due to rainfall was estimated using Equation (3) given by [79]:
In which, is the rainfall penetration (cm), and P is the annual rainfall (cm). The groundwater recharge data due to canal seepage were obtained from the Canal Irrigation Department of Uttar Pradesh’s divisional offices. Recharge due to percolation of irrigation water applied to the field took 35% of the total water applied for irrigation, as suggested by Agricultural Refinance and Development Corporation (ARDC) and CGWB, India [70,80]. Seepage from tanks and ponds was calculated based on the Groundwater Department of Uttar Pradesh’s norms. The year-wise data of the number of minor irrigation structures present in the study area were collected from the districts’ District Statistical Officer. Then, pumpage was determined by multiplying the number of minor irrigation structures by their respective unit drafts [70,80]. In the study region, groundwater withdrawal for industrial habits was taken as 1% of the pumpage through minor irrigation units [70,80]. The groundwater requirement for domestic purposes was taken as 135 L/day/capita. The total groundwater requirement for livestock consumption was assumed to be 10% of the total water requirement, as livestock consumes a significant portion of surface water resources.
2.7. Statistical Indicators
The predictive efficacy of the formulated GA-ANN and GA models was evaluated based on eight statistical measures: coefficient of determination (R2), coefficient of efficiency (CE), correlation coefficient (r), mean absolute deviation (MAD), root mean square error (RMSE), coefficient of variation of error residuals (CVRE), absolute prediction error (APE) and performance index (PI). These R2, CE, r, MAD, RMSE, CVRE, APE, and PI, were computed using Equations (5)–(12) as given by [10,81]:
where is the actual value of GWTD, is the predicted value of GWTD, n is the number of observations, is the average of actual GWTD values, and is the average of predicted GWTD values.
3. Results and Discussion
3.1. Prediction of GWTD Using Traditional GA Method
Firstly, the GA technique was optimized by computing the minimum value of the root mean square error (RMSE) to build the GWTD prediction models. The generation limit values, population size, and the number of binary variables with their lower and upper limits were established by the number of variables in the models. Table 3 shows the GA parameters’ values for the nine pre-monsoon season and nine post-monsoon season models, respectively. It was noted from Table 3 that the minimum RMSE was 2.26 for GA-5 with a population size and generation limit of 150 and 200, respectively, for the pre-monsoon season, while the minimum RMSE was 2.73 for post-monsoon season GA-8, with a population size of 100 and generation limit of 150.

Table 3.
Value of GA model parameters for pre- and post-monsoon seasons.
Table 4 displays the values of performance or statistical indicators in the pre-monsoon season. The values of performance indicators for the GA-5 model were found to be better during the pre-monsoon season. For this model, in the testing period, the maximum values of coefficient of determination (R2), coefficient of efficiency (CE), and correlation coefficient (r) were 0.42, 0.33, and 0.65, respectively, while the minimum values of mean absolute deviation (MAD), root mean square error (RMSE), coefficient of variation of error residuals (CVRE), absolute prediction error (APE), and performance index (PI) were 2.14, 5.11, 0.43, 0.23, and 0.03, respectively. Therefore, GA-5 was selected to forecast the pre-monsoon GWTD in the study area. For the testing data set, the observed and predicted GWTD values by GA-1 to GA-9 models during the pre-monsoon season are illustrated in Figure 7, which shows that the predicted values of GWTD in the pre-monsoon season were not in reasonable consistency with the observed GWTD values. From the 228 (38 × 6 (nodes × years)) expected values of GWTD in the pre-monsoon season, only 113 values were ensured a 10 % variation during the testing period.

Table 4.
Performance indicators of GA models during pre-monsoon season.
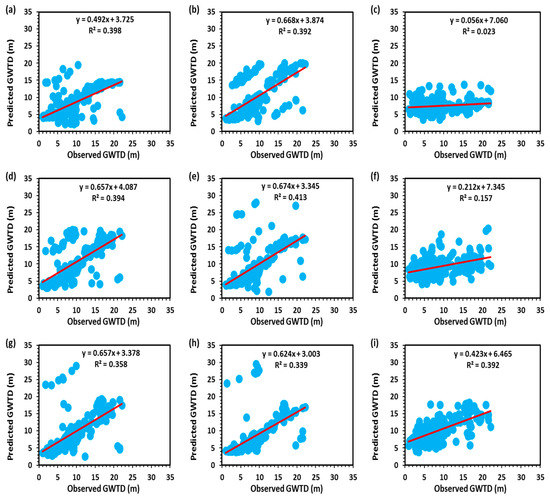
Figure 7.
Scatter plot of observed and predicted GWTD by (a) GA-1, (b) GA-2, (c) GA-3, (d) GA-4, (e) GA-5, (f) GA-6, (g) GA-7, (h) GA-8, and (i) GA-9 models in testing period for pre-monsoon season.
Similarly, the values of performance indicators during the post-monsoon season are given in Table 5. In the post-monsoon season, the GA-8 model produced the highest values of R2, CE, and r at 0.47, 0.68, and 0.31, respectively, while the values of MAD, MSE, CVRE, APE, and PI were the lowest at 1.87, 7.45, 0.47, 0.22 and 0.03, respectively. The GA-8 model was elected best to predict GWTD for the post-monsoon season in the study area. Figure 8 demonstrates the comparison among the observed and predicted values of GWTD in the post-monsoon season with the testing dataset. It can be seen in Figure 8 that the GA-8 model has less scattering than the other models. Based on the assessment, it can be concluded that the GA model had the potential ability to recognize the trend of groundwater table depth data during both seasons. However, GA models were not able to predict the GWTD accurately in the study region during both seasons.

Table 5.
Performance indicators of GA models during post-monsoon season.
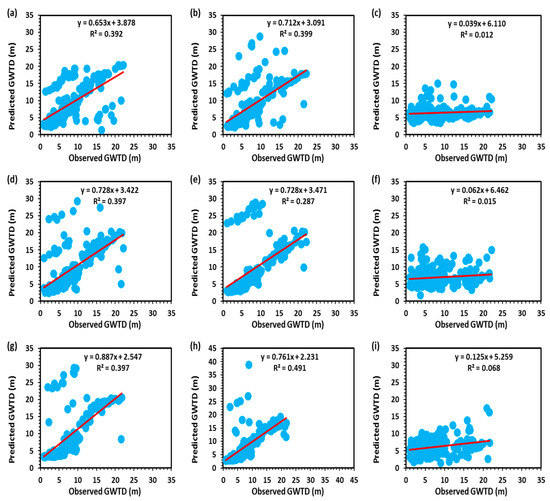
Figure 8.
Scatter diagram of observed and predicted GWTD by (a) GA-1, (b) GA-2, (c) GA-3, (d) GA-4, (e) GA-5, (f) GA-6, (g) GA-7, (h) GA-8, and (i) GA-9 models in testing period for post-monsoon season.
3.2. Prediction of GWTD Using GA-ANN Models
The training and testing results based on the effect of population size on the mean square error (MSE) for the post-monsoon and pre-monsoon seasons of all GA-ANN models are listed in Table 6. It was observed in Table 6 that the minimum MSE values for different GA-ANN models were obtained from a population size of 50 as compared with the MSE from the population sizes of 100 and 200 for all models. Hence, the population size of 50 was selected as optimal for GA-ANN development to predict seasonal GWTD in the study region. The optimal number of generations, optimal population size, and respective MSE values for all GA-ANN models for pre- and post-monsoon seasons are summarized in Table 7. In a single-layered ANN structure, the number of neurons was enhanced for all the developed GA-ANN models using MATLAB R2013a software. The methodology of optimizing the GA was used to maximize the number of neurons per model. The optimal numbers of neurons for each GA-ANN model corresponding to the minimum mean square error (MSE) are given in Table 8.

Table 6.
Effect of population size on GA-ANN models for pre- and post-monsoon seasons.

Table 7.
Optimal population and generation for developed GA-ANN models during pre- and post-monsoon seasons.

Table 8.
Structure of different developed GA-ANN models.
Finally, the value of performance indicators of hybrid GA-ANN models for pre-monsoon season during training and testing periods are listed in Table 9, which indicates that the performance of GA-ANN-8 was better than other GA-ANN models. The values of R2, CE, and r for the GA-ANN-8 were found to be 0.91, 0.91, and 0.96, respectively, in the training period. In testing, the values of these variables were 0.94, 0.94, and 0.97, respectively. The values of MAD, RMSE, CVRE, APE, and PI were 0.45, 0.22, 0.12, 0.01, and 0.03, respectively, during the training period, while in the testing period were 0.48, 0.17, 0.11, 0.03, and 0.02, respectively. The GA-ANN-8 model was chosen as the best to predict the pre-monsoon GWTD in the study area. The observed and predicted values of GWTD in pre-monsoon by the GA-ANN models for the testing dataset are plotted in Figure 9. It was noted from Figure 9 that the expected values of pre-monsoon season GWTD were in better agreement with the measured (observed) values of GWTD during the testing period.

Table 9.
Performance indicators of GA-ANN models in the pre-monsoon season.
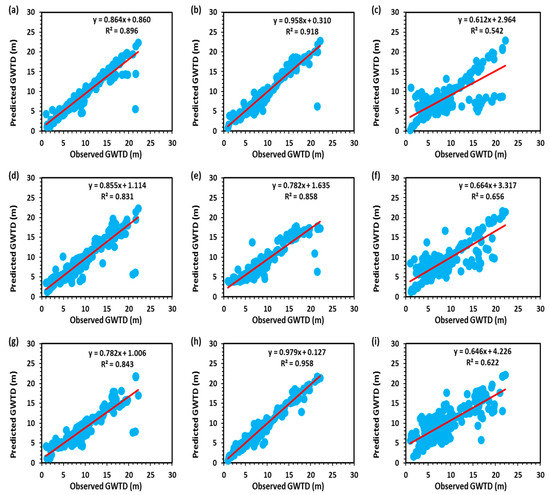
Figure 9.
Scatter diagram of observed and predicted GWTD by (a) GA-ANN-1, (b) GA-ANN-2, (c) GA-ANN-3, (d) GA-ANN-4, (e) GA-ANN-5, (f) GA-ANN-6, (g) GA-ANN-7, (h) GA-ANN-8, and (i) GA-ANN-9 models in the testing period for pre-monsoon season.
Similarly, for the post-monsoon season, the performance indicator values of hybrid GA-ANN models are summarized in Table 10 for both the periods and found that the GA-ANN-8 performed significantly better than other GA-ANN models. The values of R2, CE, and r for the GA-ANN-8 were obtained as 0.89, 0.90, and 0.94, respectively, during the training period and 0.95, 0.96, and 0.97, respectively, during the testing period. While the values of MAD, RMSE, CVRE, APE, and PI for GA-ANN-8 were found to be 0.56, 0.31, 0.15, 0.11, and 0.03, respectively, in the training, and 0.45, 0.42, 0.13, 0.10, and 0.01, respectively, in the testing. The observed and predicted GWTD values yielded by GA-ANN-1 to GA-ANN-9 models for post-monsoon throughout the testing period are illustrated in Figure 10. It was found that the expected value of GWTD in post-monsoon had a better association with the observed values of GWTD in the testing period. The reason for the better performance of the GA-ANN-8 model may be the development of the model using annual data from three years, including the values of previous groundwater table depth for both seasons. However, in the GA-ANN-1 and GA-ANN-5 models, only annual data from one and two years were used. Therefore, the GA-ANN-8 model was nominated as the best model to predict the post-monsoon GWTD in the study area.

Table 10.
Performance indicators of GA-ANN models in the post-monsoon season.
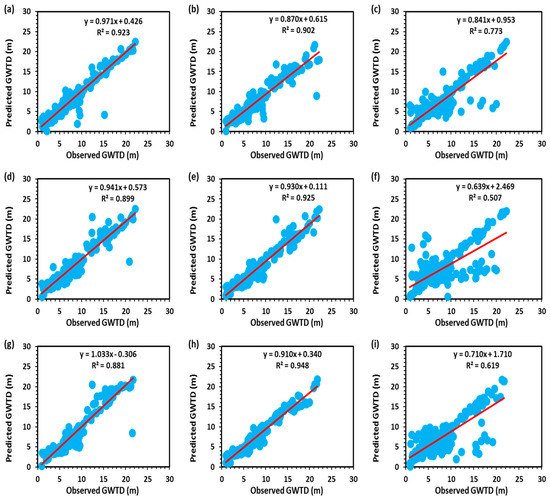
Figure 10.
Scatter diagram of observed and predicted GWTD by (a) GA-ANN-1, (b) GA-ANN-2, (c) GA-ANN-3, (d) GA-ANN-4, (e) GA-ANN-5, (f) GA-ANN-6, (g) GA-ANN-7, (h) GA-ANN-8, and (i) GA-ANN-9 models in the testing period for the post-monsoon season.
This study’s outcomes follow the studies carried out in other parts of the world to predict the groundwater level with slightly different input parameters [44,62,65,68,69,82,83], and found the performance of GAs implemented with ANN promising for the prediction of groundwater table depth in various regions. Shiri et al. [84] predicted groundwater depth (GWD) fluctuations of two coastal aquifers located in Donghae City, Korea, by employing six heuristic models: boosted regression tree (BRT), random forests (RF), multivariate adaptive regression spline (MARS), ANN, support vector machine (SVM), and gene expression programming (GEP). They found the GEP model with tide and rainfall data provided better estimates than the other models. Some findings also showed the potential capability of genetic algorithm in conjunction with other machine learning techniques in various water resources problems [85,86,87].
This study’s overall findings revealed that the hybrid GA-ANN models performed well in seasonal groundwater table prediction with varying input variables in the study area. These models were more reliable, robust, dynamic, and time-saving than the simple one. This study would help the hydrologists and geologists formulate a smart, intelligent system for effective planning and management of groundwater resources for operating the various drives in the study region. Thus, this study proved the feasibility of the hybrid GA-ANN model in predicting the seasonal GWTD in the area between the Ganga and the Hindon rivers in Uttar Pradesh.
4. Conclusions
With climate change and overexploitation situations, groundwater table fluctuations’ accurate predictions are essential for managing groundwater resources. The present study aimed to investigate the comparative potential of the hybrid GA-ANN models against the traditional GA models to predict the seasonal groundwater table depth in the area between the Ganga and the Hindon rivers. The ability of developed models was evaluated by using the statistical indicators (coefficient of determination, coefficient of efficiency, correlation coefficient, mean absolute deviation, root mean square error, coefficient of variation of error residuals, absolute prediction error, and performance index), as well as through visual inspection. The analysis results demonstrate that the GA models recognized the groundwater table depth trend efficiently but failed to predict the groundwater table depth because the maximum coefficient of determination was only 0.47. Simultaneously, the GA-ANN models’ performance was found to be superior to the GA models for GWTD prediction in both the seasons, with the highest coefficient of determination values of 0.94 and 0.95, respectively. It was also concluded that the more significant number of input parameters enhanced the predictive rationality of applied GA-ANN models. Thus, the GA-ANN based models may be successfully functional in the field of groundwater to predict the groundwater table fluctuations with reasonably good accuracy.
The efficient models found in this study confirm promising outcomes and proved to be reliable and time-saving technologies for optimal planning and management of groundwater resources in the study area. Our proposed model could be readily transferable or adapted to other areas, specifically those with similar hydrogeological conditions. The accessibility and quantity of data are challenging. In future research, the authors will project to establish a wireless sensor network for near real-time monitoring of groundwater levels and meteorological data in the study area.
Author Contributions
Conceptualization, K.P. and A.M.; methodology, K.P.; software, K.P.; validation, K.P., A.M., S.K. and A.K.; formal analysis, K.P., and A.M.; investigation, K.P., A.M., S.K. and A.K.; data curation, K.P.; writing—original draft preparation, K.P., A.M., and A.K.; writing—review and editing, K.P., A.M., S.K. and A.K.; visualization, K.P., A.M., S.K. and A.K.; supervision, A.M., S.K. and A.K.; project administration, A.K.; funding acquisition, A.K. All authors have read and agreed to the published version of the manuscript.
Funding
This research received no external funding.
Conflicts of Interest
The authors declare no conflict of interest.
References
- Nunno, F.D.; Granata, F. Groundwater level prediction in Apulia region (Southern Italy) using NARX neural network. Environ. Res. 2020, 190, 110062. [Google Scholar] [PubMed]
- Amarasinghe, U.A.; Smakhtin, V. Global water demand projections: Past, present and future. Int. Water Manag. Inst. (IWMI) Colombo Sri Lanka 2014, 156, 1–24. [Google Scholar]
- Haas, J.C.; Birk, S. Characterizing the spatiotemporal variability of groundwater levels of alluvial aquifers in different settings using drought indices. Hydrol. Earth Syst. Sci. 2017, 21, 2421–2448. [Google Scholar] [CrossRef]
- Yu, H.; Wen, X.; Feng, Q.; Deo, R.C.; Si, J.; Wu, M. Comparative Study of Hybrid-Wavelet Artificial Intelligence Models for Monthly Groundwater Depth Forecasting in Extreme Arid Regions, Northwest China. Water Resour. Manag. 2018, 32, 301–323. [Google Scholar] [CrossRef]
- Goldman, M.; Neubauer, F.M. Groundwater exploration using integrated geophysical techniques. Surv. Geophys. 1994, 15, 331–361. [Google Scholar] [CrossRef]
- Singh, A.; Malik, A.; Kumar, A.; Kisi, O. Rainfall-runoff modeling in hilly watershed using heuristic approaches with gamma test. Arab. J. Geosci. 2018, 11, 1–12. [Google Scholar] [CrossRef]
- Malik, A.; Tikhamarine, Y.; Souag-Gamane, D.; Kisi, O.; Pham, Q.B. Support vector regression optimized by meta-heuristic algorithms for daily streamflow prediction. Stoch. Environ. Res. Risk Assess. 2020. [Google Scholar] [CrossRef]
- Tikhamarine, Y.; Souag-Gamane, D.; Ahmed, A.N.; Sammen, S.S.; Kisi, O.; Huang, Y.F.; El-Shafie, A. Rainfall-runoff modelling using improved machine learning methods: Harris hawks optimizer vs. particle swarm optimization. J. Hydrol. 2020, 589, 125133. [Google Scholar] [CrossRef]
- Malik, A.; Kumar, A.; Singh, R.P. Application of Heuristic Approaches for Prediction of Hydrological Drought Using Multi-scalar Streamflow Drought Index. Water Resour. Manag. 2019, 33, 3985–4006. [Google Scholar] [CrossRef]
- Malik, A.; Kumar, A. Meteorological drought prediction using heuristic approaches based on effective drought index: A case study in Uttarakhand. Arab. J. Geosci. 2020, 13, 1–17. [Google Scholar] [CrossRef]
- Malik, A.; Kumar, A.; Salih, S.Q.; Kim, S.; Kim, N.W.; Yaseen, Z.M.; Singh, V.P. Drought index prediction using advanced fuzzy logic model: Regional case study over Kumaon in India. PLoS ONE 2020, 15, e0233280. [Google Scholar] [CrossRef] [PubMed]
- Malik, A.; Kumar, A.; Kisi, O. Monthly pan-evaporation estimation in Indian central Himalayas using different heuristic approaches and climate based models. Comput. Electron. Agric. 2017, 143, 302–313. [Google Scholar] [CrossRef]
- Malik, A.; Kumar, A.; Kisi, O. Daily Pan Evaporation Estimation Using Heuristic Methods with Gamma Test. J. Irrig. Drain. Eng. 2018, 144, 04018023. [Google Scholar] [CrossRef]
- Malik, A.; Rai, P.; Heddam, S.; Kisi, O.; Sharafati, A.; Salih, S.Q.; Al-Ansari, N.; Yaseen, Z.M. Pan Evaporation Estimation in Uttarakhand and Uttar Pradesh States, India: Validity of an Integrative Data Intelligence Model. Atmosphere 2020, 11, 553. [Google Scholar] [CrossRef]
- Malik, A.; Kumar, A.; Kim, S.; Kashani, M.H.; Karimi, V.; Sharafati, A.; Ghorbani, M.A.; Al-Ansari, N.; Salih, S.Q.; Yaseen, Z.M.; et al. Modeling monthly pan evaporation process over the Indian central Himalayas: Application of multiple learning artificial intelligence model. Eng. Appl. Comput. Fluid Mech. 2020, 14, 323–338. [Google Scholar] [CrossRef]
- Malik, A.; Kumar, A.; Ghorbani, M.A.; Kashani, M.H.; Kisi, O.; Kim, S. The viability of co-active fuzzy inference system model for monthly reference evapotranspiration estimation: Case study of Uttarakhand State. Hydrol. Res. 2019, 50, 1623–1644. [Google Scholar] [CrossRef]
- Tikhamarine, Y.; Malik, A.; Kumar, A.; Souag-Gamane, D.; Kisi, O. Estimation of monthly reference evapotranspiration using novel hybrid machine learning approaches. Hydrol. Sci. J. 2019, 64, 1824–1842. [Google Scholar] [CrossRef]
- Tikhamarine, Y.; Malik, A.; Souag-Gamane, D.; Kisi, O. Artificial intelligence models versus empirical equations for modeling monthly reference evapotranspiration. Environ. Sci. Pollut. Res. 2020, 27, 30001–30019. [Google Scholar] [CrossRef]
- Huang, X.; Gao, L.; Crosbie, R.S.; Zhang, N.; Fu, G.; Doble, R. Groundwater Recharge Prediction Using Linear Regression, Multi-Layer Perception Network, and Deep Learning. Water 2019, 11, 1879. [Google Scholar] [CrossRef]
- Chen, L.-H.; Chen, C.-T.; Pan, Y.-G. Groundwater Level Prediction Using SOM-RBFN Multisite Model. J. Hydrol. Eng. 2010, 15, 624–631. [Google Scholar] [CrossRef]
- Chen, L.-H.; Chen, C.-T.; Lin, D.-W. Application of Integrated Back-Propagation Network and Self-Organizing Map for Groundwater Level Forecasting. J. Water Resour. Plan. Manag. 2011, 137, 352–365. [Google Scholar] [CrossRef]
- Panahi, M.; Sadhasivam, N.; Pourghasemi, H.R.; Rezaie, F.; Lee, S. Spatial prediction of groundwater potential mapping based on convolutional neural network (CNN) and support vector regression (SVR). J. Hydrol. 2020, 588, 125033. [Google Scholar] [CrossRef]
- Gong, Y.; Zhang, Y.; Lan, S.; Wang, H. A Comparative Study of Artificial Neural Networks, Support Vector Machines and Adaptive Neuro Fuzzy Inference System for Forecasting Groundwater Levels near Lake Okeechobee, Florida. Water Resour. Manag. 2016, 30, 375–391. [Google Scholar] [CrossRef]
- Arabameri, A.; Lee, S.; Tiefenbacher, J.P.; Ngo, P.T.T. Novel Ensemble of MCDM-Artificial Intelligence Techniques for Groundwater-Potential Mapping in Arid and Semi-Arid Regions (Iran). Remote Sens. 2020, 12, 490. [Google Scholar] [CrossRef]
- Natarajan, N.; Sudheer, C. Groundwater level forecasting using soft computing techniques. Neural Comput. Appl. 2020, 32, 7691–7708. [Google Scholar] [CrossRef]
- Pradhan, S.; Kumar, S.; Kumar, Y.; Sharma, H.C. Assessment of groundwater utilization status and prediction of water table depth using different heuristic models in an Indian interbasin. Soft Comput. 2019, 23, 10261–10285. [Google Scholar] [CrossRef]
- Deb, P.; Kiem, A.S.; Willgoose, G. A linked surface water-groundwater modelling approach to more realistically simulate rainfall-runoff non-stationarity in semi-arid regions. J. Hydrol. 2019, 575, 273–291. [Google Scholar] [CrossRef]
- Deb, P.; Kiem, A.S. Evaluation of rainfall–runoff model performance under non-stationary hydroclimatic conditions. Hydrol. Sci. J. 2020, 65, 1667–1684. [Google Scholar] [CrossRef]
- Tayyab, M.; Zhou, J.; Zeng, X.; Adnan, R. Discharge Forecasting By Applying Artificial Neural Networks At The Jinsha River Basin, China. Eur. Sci. J. ESJ 2016, 12, 108. [Google Scholar] [CrossRef][Green Version]
- Khan, M.Y.A.; Hasan, F.; Panwar, S.; Chakrapani, G.J. Neural network model for discharge and water-level prediction for Ramganga River catchment of Ganga Basin, India. Hydrol. Sci. J. 2016, 61, 2084–2095. [Google Scholar] [CrossRef]
- Zhou, T.; Wang, F.; Yang, Z. Comparative Analysis of ANN and SVM Models Combined with Wavelet Preprocess for Groundwater Depth Prediction. Water 2017, 9, 781. [Google Scholar] [CrossRef]
- Muhammad, R.; Yuan, X.; Kisi, O.; Yuan, Y. Streamflow Forecasting Using Artificial Neural Network and Support Vector Machine Models. Am. Sci. Res. J. Eng. Technol. Sci. 2017, 29, 286–294. [Google Scholar]
- Gaur, S.; Ch, S.; Graillot, D.; Chahar, B.R.; Kumar, D.N. Application of Artificial Neural Networks and Particle Swarm Optimization for the Management of Groundwater Resources. Water Resour. Manag. 2013, 27, 927–941. [Google Scholar] [CrossRef]
- Alizamir, M.; Sobhanardakani, S. An Artificial Neural Network - Particle Swarm Optimization (ANN- PSO) Approach to Predict Heavy Metals Contamination in Groundwater Resources. Jundishapur J. Health Sci. 2018, 10, e67544. [Google Scholar] [CrossRef]
- Afzaal, H.; Farooque, A.A.; Abbas, F.; Acharya, B.; Esau, T. Groundwater Estimation from Major Physical Hydrology Components Using Artificial Neural Networks and Deep Learning. Water 2019, 12, 5. [Google Scholar] [CrossRef]
- Cho, K.H.; Sthiannopkao, S.; Pachepsky, Y.A.; Kim, K.-W.; Kim, J.H. Prediction of contamination potential of groundwater arsenic in Cambodia, Laos, and Thailand using artificial neural network. Water Res. 2011, 45, 5535–5544. [Google Scholar] [CrossRef] [PubMed]
- Wagh, V.M.; Panaskar, D.B.; Muley, A.A.; Mukate, S.V.; Lolage, Y.P.; Aamalawar, M.L. Prediction of groundwater suitability for irrigation using artificial neural network model: A case study of Nanded tehsil, Maharashtra, India. Model. Earth Syst. Environ. 2016, 2, 1–10. [Google Scholar] [CrossRef]
- Chen, S.; Fang, G.; Huang, X.; Zhang, Y. Water Quality Prediction Model of a Water Diversion Project Based on the Improved Artificial Bee Colony–Backpropagation Neural Network. Water 2018, 10, 806. [Google Scholar] [CrossRef]
- Azimi, S.; Azhdary Moghaddam, M.; Hashemi Monfared, S.A. Prediction of annual drinking water quality reduction based on Groundwater Resource Index using the artificial neural network and fuzzy clustering. J. Contam. Hydrol. 2019, 220, 6–17. [Google Scholar] [CrossRef]
- Das, A.; Maiti, S.; Naidu, S.; Gupta, G. Estimation of spatial variability of aquifer parameters from geophysical methods: A case study of Sindhudurg district, Maharashtra, India. Stoch. Environ. Res. Risk Assess. 2017, 31, 1709–1726. [Google Scholar] [CrossRef]
- Thomas, A.; Eldho, T.I.; Rastogi, A.K.; Majumder, P. A comparative study in aquifer parameter estimation using MFree point collocation method with evolutionary algorithms. J. Hydroinform. 2019, 21, 455–473. [Google Scholar] [CrossRef]
- Delnaz, A.; Rakhshandehroo, G.; Nikoo, M.R. Confined Aquifer’s Hydraulic Parameters Estimation by a Generalized Regression Neural Network. Iran. J. Sci. Technol. Trans. Civ. Eng. 2020, 44, 259–269. [Google Scholar] [CrossRef]
- Mohanty, S.; Jha, M.K.; Kumar, A.; Sudheer, K.P. Artificial Neural Network Modeling for Groundwater Level Forecasting in a River Island of Eastern India. Water Resour. Manag. 2010, 24, 1845–1865. [Google Scholar] [CrossRef]
- Jha, M.K.; Sahoo, S. Efficacy of neural network and genetic algorithm techniques in simulating spatio-temporal fluctuations of groundwater. Hydrol. Process. 2015, 29, 671–691. [Google Scholar] [CrossRef]
- Nourani, V.; Ejlali, R.G.; Alami, M.T. Spatiotemporal Groundwater Level Forecasting in Coastal Aquifers by Hybrid Artificial Neural Network-Geostatistics Model: A Case Study. Environ. Eng. Sci. 2011, 28, 217–228. [Google Scholar] [CrossRef]
- Chitsazan, M.; Rahmani, G.; Neyamadpour, A. Forecasting groundwater level by artificial neural networks as an alternative approach to groundwater modeling. J. Geol. Soc. India 2015, 85, 98–106. [Google Scholar] [CrossRef]
- Van Ty, T.; Van Phat, L.; Van Hiep, H. Groundwater Level Prediction Using Artificial Neural Networks: A Case Study in Tra Noc Industrial Zone, Can Tho City, Vietnam. J. Water Resour. Prot. 2018, 10, 870–883. [Google Scholar] [CrossRef][Green Version]
- Chang, J.; Wang, G.; Mao, T. Simulation and prediction of suprapermafrost groundwater level variation in response to climate change using a neural network model. J. Hydrol. 2015, 529, 1211–1220. [Google Scholar] [CrossRef]
- Banadkooki, F.B.; Ehteram, M.; Ahmed, A.N.; Teo, F.Y.; Fai, C.M.; Afan, H.A.; Sapitang, M.; El-Shafie, A. Enhancement of Groundwater-Level Prediction Using an Integrated Machine Learning Model Optimized by Whale Algorithm. Nat. Resour. Res. 2020, 29, 3233–3252. [Google Scholar] [CrossRef]
- Majumder, P.; Eldho, T.I. Artificial Neural Network and Grey Wolf Optimizer Based Surrogate Simulation-Optimization Model for Groundwater Remediation. Water Resour. Manag. 2020, 34, 763–783. [Google Scholar] [CrossRef]
- Mohanty, S.; Jha, M.K.; Raul, S.K.; Panda, R.K.; Sudheer, K.P. Using Artificial Neural Network Approach for Simultaneous Forecasting of Weekly Groundwater Levels at Multiple Sites. Water Resour. Manag. 2015, 29, 5521–5532. [Google Scholar] [CrossRef]
- Shiri, J.; Kisi, O.; Yoon, H.; Lee, K.-K.; Hossein Nazemi, A. Predicting groundwater level fluctuations with meteorological effect implications—A comparative study among soft computing techniques. Comput. Geosci. 2013, 56, 32–44. [Google Scholar] [CrossRef]
- Kisi, O.; Yaseen, Z.M. The potential of hybrid evolutionary fuzzy intelligence model for suspended sediment concentration prediction. Catena 2019, 174, 11–23. [Google Scholar] [CrossRef]
- Tikhamarine, Y.; Souag-Gamane, D.; Najah Ahmed, A.; Kisi, O.; El-Shafie, A. Improving artificial intelligence models accuracy for monthly streamflow forecasting using grey Wolf optimization (GWO) algorithm. J. Hydrol. 2020, 582, 124435. [Google Scholar] [CrossRef]
- Tikhamarine, Y.; Souag-Gamane, D.; Kisi, O. A new intelligent method for monthly streamflow prediction: Hybrid wavelet support vector regression based on grey wolf optimizer (WSVR–GWO). Arab. J. Geosci. 2019, 12, 540. [Google Scholar] [CrossRef]
- Singh, R.M.; Datta, B. Identification of Groundwater Pollution Sources Using GA-based Linked Simulation Optimization Model. J. Hydrol. Eng. 2006, 11, 101–109. [Google Scholar] [CrossRef]
- Jain, A.; Bhattacharjya, R.K.; Sanaga, S. Optimal Design of Composite Channels Using Genetic Algorithm. J. Irrig. Drain. Eng. 2004, 130, 286–295. [Google Scholar] [CrossRef]
- Şen, Z.; Öztopal, A. Genetic algorithms for the classification and prediction of precipitation occurrence. Hydrol. Sci. J. 2001, 46, 255–267. [Google Scholar] [CrossRef]
- Ni, Q.; Wang, L.; Zheng, B.; Sivakumar, M. Evolutionary Algorithm for Water Storage Forecasting Response to Climate Change with Small Data Sets: The Wolonghu Wetland, China. Environ. Eng. Sci. 2012, 29, 814–820. [Google Scholar] [CrossRef]
- Aytek, A.; Kişi, Ö. A genetic programming approach to suspended sediment modelling. J. Hydrol. 2008, 351, 288–298. [Google Scholar] [CrossRef]
- Jalalkamali, A.; Sedghi, H.; Manshouri, M. Monthly groundwater level prediction using ANN and neuro-fuzzy models: A case study on Kerman plain, Iran. J. Hydroinform. 2011, 13, 867–876. [Google Scholar] [CrossRef]
- Dash, N.B.; Panda, S.N.; Remesan, R.; Sahoo, N. Hybrid neural modeling for groundwater level prediction. Neural Comput. Appl. 2010, 19, 1251–1263. [Google Scholar] [CrossRef]
- Supreetha, B.S.; Prabhakar Nayak, K.; Narayan Shenoy, K. Groundwater level prediction using hybrid artificial neural network with genetic algorithm. Int. J. Earth Sci. Eng. 2015, 8, 2609–2615. [Google Scholar]
- Hosseini, Z.; Nakhaie, M. Estimation of groundwater level using a hybrid genetic algorithm-neural network. Pollution 2015, 1, 9–21. [Google Scholar]
- Jalalkamali, A. Groundwater modeling using hybrid of artificial neural network with genetic algorithm. Afr. J. Agric. Res. 2011, 6, 5775–5784. [Google Scholar] [CrossRef]
- Roshni, T.; Jha, M.K.; Drisya, J. Neural network modeling for groundwater-level forecasting in coastal aquifers. Neural Comput. Appl. 2020, 32, 12737–12754. [Google Scholar] [CrossRef]
- Karamouz, M.; Tabari, M.M.R.; Kerachian, R. Application of Genetic Algorithms and Artificial Neural Networks in Conjunctive Use of Surface and Groundwater Resources. Water Int. 2007, 32, 163–176. [Google Scholar] [CrossRef]
- Wibowo, A.; Arbain, S.H.; Abidin, N.Z. Combined multiple neural networks and genetic algorithm with missing data treatment: Case study of water level forecasting in Dungun River—Malaysia. IAENG Int. J. Comput. Sci. 2018, 45, 1–9. [Google Scholar]
- Li, H.; Lu, Y.; Zheng, C.; Yang, M.; Li, S. Groundwater Level Prediction for the Arid Oasis of Northwest China Based on the Artificial Bee Colony Algorithm and a Back-propagation Neural Network with Double Hidden Layers. Water 2019, 11, 860. [Google Scholar] [CrossRef]
- CGWB. Status Report on Review of Ground Water Resources Estimation Methodology; Central Ground Water Board: Faridabad, India, 2009; pp. 1–66. [Google Scholar]
- Goldberg, D.E. Genetic Algorithms in Search, Optimization, and Machine Learning; Addison Wesley, Reading: Boston, MA, USA, 1989. [Google Scholar]
- Malhotra, R.; Singh, N.; Singh, Y. Genetic Algorithms: Concepts, Design for Optimization of Process Controllers. Comput. Inf. Sci. 2011, 4, 39–54. [Google Scholar] [CrossRef]
- Chang, Y.-T.; Lin, J.; Shieh, J.-S.; Abbod, M.F. Optimization the Initial Weights of Artificial Neural Networks via Genetic Algorithm Applied to Hip Bone Fracture Prediction. Adv. Fuzzy Syst. 2012, 2012, 1–9. [Google Scholar] [CrossRef]
- Tahmasebi, P.; Hezarkhani, A. A hybrid neural networks-fuzzy logic-genetic algorithm for grade estimation. Comput. Geosci. 2012, 42, 18–27. [Google Scholar] [CrossRef]
- Mattioli, F.; Caetano, D.; Cardoso, A.; Naves, E.; Lamounier, E. An Experiment on the Use of Genetic Algorithms for Topology Selection in Deep Learning. J. Electr. Comput. Eng. 2019, 2019, 1–12. [Google Scholar] [CrossRef]
- Castillo, P.A.; Merelo, J.J.; Prieto, A.; Rivas, V.; Romero, G. G-Prop: Global optimization of multilayer perceptrons using GAs. Neurocomputing 2000, 35, 149–163. [Google Scholar] [CrossRef]
- Gerken, W.C.; Purvis, L.K.; Butera, R.J. Genetic algorithm for optimization and specification of a neuron model. Neurocomputing 2006, 69, 1039–1042. [Google Scholar] [CrossRef]
- MWRI. Report of the Ground Water Resource Estimation Committee; Ministry of Water Resources: New Delhi, India, 2009; p. 133.
- Chandra, S. Estimation and measurement of recharge to groundwater from rainfall, irrigation and influent seepage. In Proceedings of the International Seminar on Development and Management of Groundwater Resources, Roorkee, India, 5–20 November 1979; pp. 9–17. [Google Scholar]
- ARDC. Report of Ground Water over Exploitation Committee; Agricultural Refinance and Development Corporation: Mumbai, Indian, 1979; pp. 211–232. [Google Scholar]
- Adnan, R.M.; Malik, A.; Kumar, A.; Parmar, K.S.; Kisi, O. Pan evaporation modeling by three different neuro-fuzzy intelligent systems using climatic inputs. Arab. J. Geosci. 2019, 12, 606. [Google Scholar] [CrossRef]
- Coulibaly, P.; Anctil, F.; Aravena, R.; Bobée, B. Artificial neural network modeling of water table depth fluctuations. Water Resour. Res. 2001, 37, 885–896. [Google Scholar] [CrossRef]
- Das, U.K.; Roy, P.; Ghose, D.K. Modeling water table depth using adaptive Neuro-Fuzzy Inference System. ISH J. Hydraul. Eng. 2019, 25, 291–297. [Google Scholar] [CrossRef]
- Shiri, J.; Kisi, O.; Yoon, H.; Kazemi, M.H.; Shiri, N.; Poorrajabali, M.; Karimi, S. Prediction of groundwater level variations in coastal aquifers with tide and rainfall effects using heuristic data driven models. ISH J. Hydraul. Eng. 2020, 26, 1–11. [Google Scholar] [CrossRef]
- Cai, X.; McKinney, D.C.; Lasdon, L.S. Solving nonlinear water management models using a combined genetic algorithm and linear programming approach. Adv. Water Resour. 2001, 24, 667–676. [Google Scholar] [CrossRef]
- Chiu, Y.-C.; Chang, L.-C.; Chang, F.-J. Using a hybrid genetic algorithm–simulated annealing algorithm for fuzzy programming of reservoir operation. Hydrol. Process. 2007, 21, 3162–3172. [Google Scholar] [CrossRef]
- Sharafati, A.; Tafarojnoruz, A.; Shourian, M.; Yaseen, Z.M. Simulation of the depth scouring downstream sluice gate: The validation of newly developed data-intelligent models. J. Hydro-Environ. Res. 2020, 29, 20–30. [Google Scholar] [CrossRef]
Publisher’s Note: MDPI stays neutral with regard to jurisdictional claims in published maps and institutional affiliations. |
© 2020 by the authors. Licensee MDPI, Basel, Switzerland. This article is an open access article distributed under the terms and conditions of the Creative Commons Attribution (CC BY) license (http://creativecommons.org/licenses/by/4.0/).