Article

Viability of a Single-Stage Unsaturated-Saturated Granular Activated Carbon Biofilter for Greywater Treatment

1
Department of Civil and Environmental Engineering, University of Alberta, Edmonton, AB T6G 1H9, Canada
2
School of Public Health, University of Alberta, Edmonton, AB T6G 2G7, Canada
3
School of Environment, Science & Engineering, Southern Cross University, Lismore NSW 2480, Australia
*
Author to whom correspondence should be addressed.
Sustainability 2020, 12(21), 8847; https://doi.org/10.3390/su12218847
Submission received: 8 September 2020 / Revised: 20 October 2020 / Accepted: 20 October 2020 / Published: 24 October 2020
(This article belongs to the Special Issue Decentralized Wastewater Treatment and Resource Recovery)

Abstract

:
Compared with conventionally collected sewage, source-diverted greywater has a higher potential for on-site treatment and reuse due to its lower contaminant levels and large volume. A new design of granular activated carbon (GAC) biofilters was developed by incorporating unsaturated and saturated zones in a single stage to introduce an efficient, passive, and easy-to-operate technology for greywater on-site treatment at the household scale. The design was customized for its intended application considering various aspects including the reactor’s configuration, packing media, and feeding strategy. With the highest hydraulic and organic loadings of 1.2 m3 m−2 d−1 and 3.5 kg COD m−2 d−1, respectively, and the shortest retention time of 2.4 h, the system maintained an average total chemical oxygen demand removal rate of 94% with almost complete removal of nutrients throughout its 253 days of operation. The system showed a range of reduction efficacy towards five surrogates representing viruses, bacteria, and Cryptosporidium and Giardia (oo)cysts. A well-functioning biofilm was successfully developed, and its mass and activity increased over time with the highest values observed at the top layers. The key microbes within the biofilter were revealed. Feasibility of the proposed technology was investigated, and implications for design and operation were discussed.

Graphical Abstract

1. Introduction

Greywater often has lower contaminant levels compared to other wastewater streams because most of the contaminants’ loadings are excluded (such as faeces and urine); further, greywater typically makes up 50–80% of domestic water consumption [1,2]. These attributes make greywater an attractive source for on-site treatment and reuse for domestic purposes such as toilet flushing and irrigation [3,4,5]. However, greywater, if not treated properly, might have harmful impacts on the environment (e.g., reduced soil wettability due to surfactants [6,7,8,9]) and increased public health concerns due to trace chemical and microbial risk [10,11,12]). Thus, effective treatment technologies are needed to mitigate both the health and environmental risks associated with the reclaimed greywater for safe reuse.
Most of the previous greywater studies have focused on utilizing treatment technologies that have been commonly used in centralized domestic sewage treatment plants. However, this approach ignores a wide range of potential decentralized applications of greywater reclamation. For example, greywater treatment systems developed for the household or neighbourhood applications should have low maintenance requirements, as such systems will be probably operated or even maintained by less-trained people [13]. Although greywater is of relatively better quality compared to combine sewage, it has special characteristics that require unique treatment technologies that are customized to these characteristics.
Passive treatment technologies (such as biofilters [14,15], constructed wetlands [3,16], green/living walls [17,18], and hybrid systems [19]) have been proven to be efficient for on-site greywater treatment while consuming little or no power. In granular activated carbon (GAC) biofilters, greywater percolates through filter media where various mechanisms take place such as GAC adsorption, biofilm sorption, and biological degradation [20,21]. Although GAC can be more expensive compared to other filter media types (e.g., sand and lightweight aggregates), its enhanced physiochemical characteristics make a strong candidate for biofilters. In addition to its high adsorptive properties [22,23,24,25], previous research has shown the capacity of GAC to support biofilm growth, which was found to contribute to the removal of organics from greywater by up to 26% [20]. This contribution can be maximized by using intermittent dosing to allow for the bioregeneration of media [20,21,26].
Two modes of operation have been commonly reported for GAC biofilters: unsaturated and saturated. An unsaturated zone of a biofilter can be defined as the portion of the biofilter media which contains air as well as water in its pores. On the contrary, the interparticle pores of a saturated zone are completely filled with water. Previous research reported the high capacity of unsaturated GAC biofilters in removing organics and nutrients from greywater. The authors of [27] achieved organics and nutrients removal of 97% and >91%, respectively, at a hydraulic loading rate (HLR) of 32 L m−2 d−1 and an organic loading rate (OLR) of 14 g five-day biochemical oxygen demand (BOD5) m−2 d−1. On the other hand, saturated biofilters were reported to be an effective polishing step for greywater treatment and to significantly improve the removal performance of pathogens in addition to acting as a polishing step for organics and nutrients [28]. Therefore, combining both unsaturated and saturated zones in the design of biofilters has a higher potential to produce effluent with improved quality, facilitating its reuse.
In this research, it is proposed to develop an effective, passive, easy-to-operate GAC biofilter for on-site greywater treatment that is customized for application at the scale of a single household, cluster of households, or smaller communities. Previous research efforts have developed our understanding of GAC biofilters, including our previous study that explored the key processes (i.e., adsorption and biodegradation) and their kinetics taking place during greywater treatment using biologically active GAC media [20]. However, other key design and operation factors are dispersed in the literature, leaving a gap in integrating this knowledge into a viable treatment technology. Thus, it is of great importance to incorporate these factors into one comprehensive design that fits the quality of greywater as well as the operational needs.
The main objective of this research was to assess the viability of a single-stage unsaturated-saturated GAC biofilter as a passive technology for on-site greywater treatment. This was achieved by evaluating the system’s capacity in removing major nutrients and pathogen surrogates from synthetic greywater under different loading rates. Biofilm development and activity were also profiled along the biofilter’s depth. Lastly, the key functioning microbes within the biofilter were revealed by analysing the microbial community structure of the biofilter. The results acquired from this study provide insights into the efficacy, functionality, and design of GAC biofilters as a commercially viable treatment technology that can contribute to maximizing water-use efficiency through on-site greywater treatment and reuse.

2. Materials and Methods

2.1. Greywater Formulation

Synthetic greywater was prepared according to the formulation suggested by the National Sanitation Foundation (NSF)/American National Standards Institute (ANSI) Standard 350 [29] to mimic combined bathing and laundry greywater. This included mixing a group of commercial cleaning agents, personal care products, and supplementary chemicals in tap water (Table S1). Characteristics of the synthetic greywater are summarized in Table 1. Synthetic greywater was prepared every two weeks and kept in the fridge at 4 °C until used to feed the biofilter.

2.2. GAC Biofilter Setup

The experiments were performed in a laboratory-scale cylindrical column reactor (Figure 1) with a diameter of 9 cm and an effective height of 60 cm (effective empty volume of 3.8 L). This depth is commonly used for biofilters and was suggested in a previous study to enhance both organics and pathogen removal [19]. The reactor’s effective depth was packed with commercial GAC (MilliporeSigma; reference 242233), which had a mesh particle size of 4–12 (mesh opening size of 1.7–4.8 mm), resulting in an average bed depth to grain size (L/D) ratio of 185. The recommended range of media particle size is 2–10 mm for biofilters, while a range of 2–4 is the most commonly used [19]. The biofilter was composed of two zones: an unsaturated zone at the top (40 cm depth), under-laid by a saturated zone (20 cm depth). The depth of the saturated zone was controlled by the elevation of the effluent outlet port (Figure 1). The term “single stage” implies that the two zones were stacked on top of each other, and there were no multiple stages in series or recirculation of water to reduce the footprint of the system.
Synthetic greywater was pumped from the basin to the inlet at the top of the biofilter using a timer-controlled peristaltic pump (BT100-2 J, LongerPump®, China) and distributed using a network of drippers over a 2-cm-depth layer of epoxy-coated gravel with a particle size of 4–7 mm to ensure an even hydraulic loading of influent synthetic greywater in the active biofilter media underneath. The synthetic greywater then percolated through the GAC media and their covering biofilms. Uniform distribution of the synthetic greywater over the cross-sectional area along the biofilter’s depth was maintained by adding polyester distributing mesh with an opening size of 0.8 mm and an open area of 46% every 10 cm along the biofilter depth. Another identical layer of epoxy-coated gravel was also added below the GAC to minimize dead zones within the GAC media. Treated effluent exited the biofilter at its bottom. The depth of the saturated zone was maintained by connecting the outlet to an elevated port at a height of 20 cm above the biofilter bottom due to the principle of communicating vessels.

2.3. Feeding Strategy and Operation Stages

The reactor was operated as fed-batch where synthetic greywater was periodically fed into the biofilter at one-hour intervals to allow for effective GAC media bioregeneration to occur, as suggested by our previous study [20]. For each cycle, the synthetic greywater was fed over a five-minute interval at the beginning of the cycle. The amount of synthetic greywater fed into the biofilter at each cycle was calculated according to the operation stage and the corresponding HLR. The biofilter was operated under eight operation stages as summarized in Table 2.

2.4. Water Sampling and Analysis

To evaluate the treatment performance of the system and the two zones individually, water samples were collected from the three sampling points: influent (directly from drippers); the interface between the unsaturated and saturated zones; and the final effluent port. Samples were analysed for total chemical oxygen demand (TCOD) according to the standard methods [30] and for ammonia nitrogen (NH3-N), nitrate (NO2-N), total nitrogen (TN), and total phosphate (TP) using Hach kits and a spectrophotometer (Hach Co., Loveland, CO, USA) as per the manufacturer’s instructions. The total organic carbon (TOC) was measured using the TOC-L TOC analyser (Shimadzu Corp., Kyoto, Japan) as per the manufacturer’s instructions. All measurements were performed in triplicate and the average values were reported.

2.5. Biofilm Growth and Biological Activity

To confirm that the filter was biologically active, the biofilm growth and biological activity were assessed along the reactor’s depth. Inoculation of the GAC media was achieved gradually through the microbes present in the secondary effluent as part of the greywater formulation. The biofilm growth was assessed on days 160 and 218 using two methods: (i) imaging of the biofilm formed and attached to the GAC media using scanning electron microscopy (SEM) of the GAC media and (ii) measuring the mass of the volatile solids attached to the GAC media. SEM was performed on a media sample collected from the top 10 cm of the biofilter. Immediately after collection, the sample was fixed and dehydrated using a series of ethanol and hexamethyldisilazane solutions, followed by drying. Dried samples were then imaged using a Zeiss Sigma 300 VP-FE SEM microscope (Zeiss, Oberkochen, Germany) after carbon coating. Volatile solids were measured along the GAC biofilter’s depth following the standard methods [30].
The biological activity of all viable microorganisms was quantitively measured along the depth of the biofilter at 10-cm segments to confirm that the filter was biologically active and to reveal the most active depths. The biological activity was assessed by measuring the adenosine triphosphate (ATP; [31]) concentration in GAC samples in triplicate using the Deposit & Surface Analysis (DSA™) kit (LuminUltra Technologies Ltd., Fredericton, NB, Canada) according to the manufacturer’s protocol.

2.6. Reduction of Microbial Surrogates

2.6.1. Tracer Test

A tracer study was conducted during stage VIII on day 208 using bromide (as sodium bromide). The purpose of this study was to verify the hydraulic retention time (HRT) within the GAC biofilter and, accordingly, make sure that the pathogen surrogates’ measurements were conducted under steady-state conditions. Bromide was selected due to its biological stability and reliability (i.e., remains in the phase in which it was injected; [32]) to eliminate/minimize the loss of tracer mass due to degradation by microorganisms and/or adsorption on GAC. The tracer solution was prepared by dissolving sodium bromide in ultrapure water at a concentration of 50 g L−1 (38.83 g Br- L−1). The tracer solution was then pulse-injected to the biofilter immediately before a feeding cycle started. Since the feeding strategy of the biofilter was intermittent, composite samples were collected from the effluent every hour before feeding for 10 h, representing the average bromide concentration during one operating cycle. Bromide was analysed using a Dionex ICS-2100 ion chromatography (IC) system (Thermo Scientific, Waltham, MA, USA) equipped with a standard bore separator Dionex IonPac AS18 IC column (2 mm × 250 mm), and the breakthrough curve was developed.

2.6.2. Pathogen Surrogate Study Overview

The efficacy of the GAC biofilter in reducing pathogen surrogates was assessed on the last day of stage VII (day 195). A modified feed-water formulation was used during this experiment using a cocktail of pathogen surrogates along with yeast extract in place of the NSF/ANSI Standard 350 formulation to provide the same amount of carbon content as in the (TOC of 58 mg L−1). This adjustment was performed to eliminate antimicrobial effects due to the components of the NSF/ANSI Standard 350 formulation and only assess reduction mechanisms related to the system. The modified formulation was used to feed the reactor three days before spiking with the pathogen surrogates to ensure the washout of microbes sourced from the feed water. Five pathogen surrogates were used to represent four groups of microbial pathogens as described in Table 3. The feed water was spiked with the pathogen surrogates’ mixture, and the biofilter was operated normally. Growth of some of the surrogates was expected due to the high yeast extract concentration, thus, composite influent grab samples were taken at the beginning (0 h) and end (6 h) of the sampling day in order to estimate any background changes in surrogate concentrations. Using these two points, influent surrogate concentrations were estimated and adjusted when doing log reduction calculations. Composite grab samples were taken at the saturated/unsaturated interface and the effluent ports at 2, 4, and 6 h and were combined to estimate log reductions. Table 3 outlines the surrogates used along with the pathogens they represent, their source, and enumeration method.

2.7. DNA Extraction and Microbial Community Analysis

Six GAC samples were collected on day 218 at a vertical interval of 10 cm along the biofilter depth to profile the microbial community structure. Prior to collecting the samples, each 10-cm segment of the GAC media was mixed separately to ensure representability of the sample. DNA was extracted from these samples using a DNeasy PowerSoil Kit (Qiagen Inc., Toronto, ON, Canada) according to the manufacturer’s protocol. The DNA samples were amplified targeting the V3–V4 region of the 16S rRNA gene sequence by the polymerase chain reaction (PCR) using the primer sets with sequencing adaptors 515F (5′-ACA CTG ACG ACA TGG TTC TAC AGT GYC AGC MGC CGC GGT AA-3′) and 806R (5′-TAC GGT AGC AGA GAC TTG GTC TGG ACT CAN VGG GTW TCT AAT -3′) [34,35]. The amplicons were then sent for barcoding and sequencing using an Illumina MiSeq (PE250) platform at McGill University and Génome Québec Innovation Centre (Montréal, QC, Canada). Generated raw data were processed using QIIME 2 (release 2018.8) next-generation microbiome bioinformatics platform [36,37]. The taxonomy was assigned with 99% similarity using the Greengenes 16S rRNA gene database (release gg_13_5) according to [36]. Beta diversity and principal coordinates analysis (PCoA) of Bray–Curtis distance were performed using the “vegan” package [38] in RStudio version 3.4.1.

3. Results and Discussion

3.1. Treatment Performance

The GAC biofilter operated smoothly for 253 days. The biofilter was operated under eight stages (i.e., operating conditions) with incremental increases to the HLR and OLR and reducing the HRT, as shown in Table 2. Figure 2 shows the TCOD concentrations in the influent, unsaturated zone effluent, and final effluent as well as its removal efficiencies within the unsaturated and saturated zones throughout the eight stages of operation. During these stages, the GAC biofilter consistently achieved an average TCOD removal of 98%, ranging between 84% and >99%. Most of the organics in the bathing and laundry synthetic greywater are surfactants sourced from the detergent agents and soaps. The adsorption of surfactants and their aerobic biodegradation were previously researched [39,40,41]. The GAC was efficient in removing surfactants with an efficiency of 98% under optimum conditions. The biodegradation efficiency of surfactants using aerobic processes has been reported to exceed 90% in most cases, and removal efficiency of 99.9% can be achieved [41,42]. The effluent TCOD was 5.3 mg L−1 on average with a few peaks occurring when the HLR and OLR were increased from one stage to another. After stage VI, no sharp TCOD peaks were observed in the effluent; this can be attributed to the maturation of the biofilm grown on the GAC media. This maturation obviously was more significant in the saturated zone since peaks in the unsaturated zone effluent started to show up starting from stage VI.
The lowest HRT achieved was 2.4 h with most of it occurring in the saturated zone, as the retention time in the unsaturated zone was less than 10 min. Despite the shorter HRT in the unsaturated zone, most of the TCOD removal (>95% of the removal on average) in the GAC biofilter occurred in this zone, while <5% was removed in the saturated zones (>95% removal of the residual TCOD). The saturated zone can be considered as a polishing step after the majority of treatment took place in the unsaturated zone. In a similar approach, the authors of [43] used saturated biochar and Filtralite filters as a polishing step after an unsaturated biofilter and observed a TCOD removal efficiency of 82–96% of the residual TCOD after the main treatment step.
No clogging issues were observed throughout the operation period in the unsaturated or saturated zones. However, real greywater is expected to include more suspended and floating materials (e.g., hair and lint; [44]) that might cause clogging to filters, therefore it is recommended to install an upstream retention tank with an intermediate wall baffle, a tee-connection inlet/outlet, and/or a coarse filter. In terms of nutrients, TN and TP in the NSF/ANSI Standard 350 formulation were originally low (Table S1), therefore they did not impose a challenge on the biofilter as complete removal was consistently achieved in the unsaturated and final effluents. Assuming a person equivalent (PE) of 150 L d−1 [45], and given the highest achieved HLR of 1200 L m−2 d−1, a GAC biofilter with a footprint of 1 m2 can sufficiently handle the volumes of greywater generated from eight persons. This technology can potentially be applied on the household or neighbourhood scale.

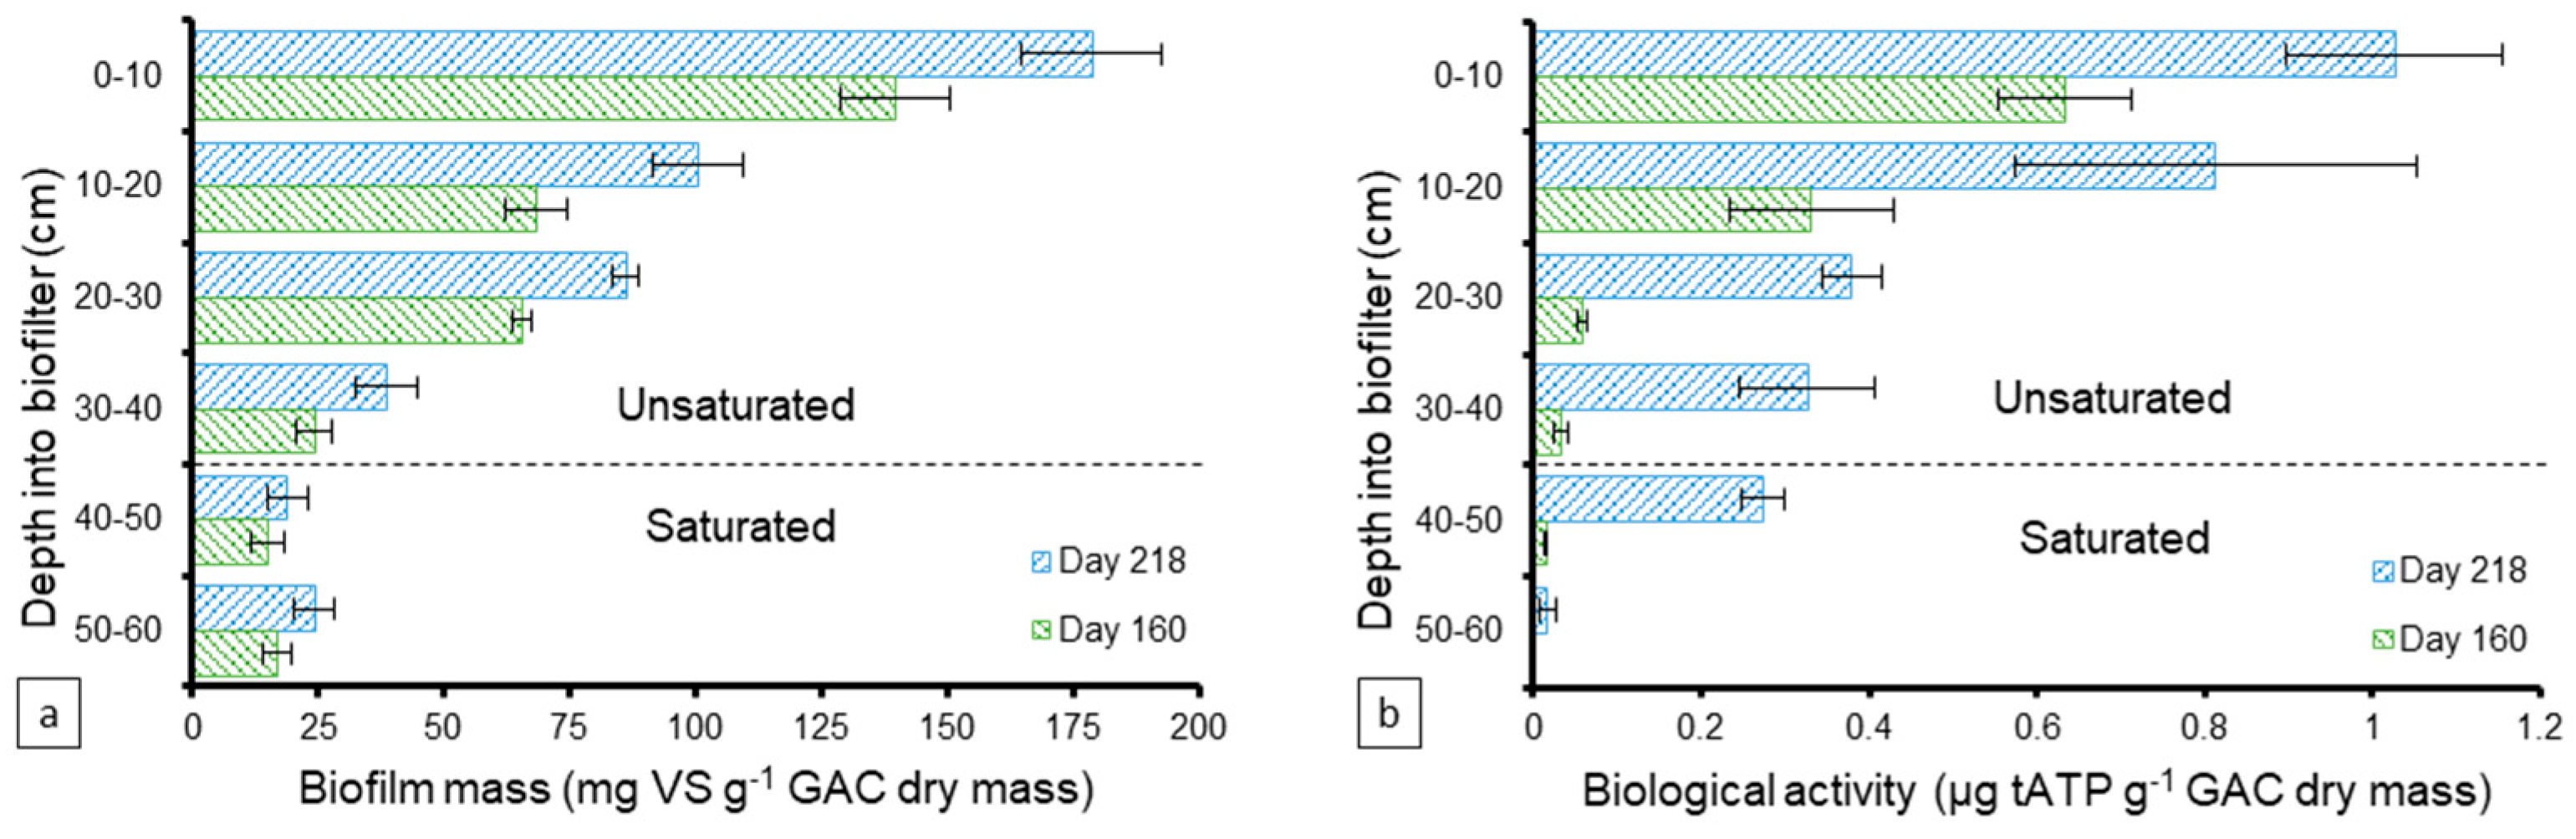
3.2. Biofilm Growth and Biological Activity

Greywater in general and the formulation used in this study, in particular, are composed of agents that can inhibit microbial growth and biofilm formation (e.g., antimicrobial agents); therefore, it was important to assess the biofilm formation using SEM imaging. The SEM images showed that biofilm developed on the surface of the GAC media, and rod-shaped microorganisms were clearly observed (Figure S1). The majority of these microorganisms were identified as the bacterial genus Oleomonas and are described later in Section 3.4. Microorganisms, in general, tend to attach and form biofilm in areas where substrate is available for their uptake [46]. Adsorption of substrate onto the surface of GAC creates an opportunity for the microorganisms to thrive and develop biofilms. Although the SEM imaging only covered the outer surface of the GAC media, microorganisms are also expected to have grown in the inner pores of the media and contribute to the treatment mechanisms [46].
The mass of the biofilm was also quantified as vs. along the GAC biofilter’s depth on days 160 and 218 to assess its development (Figure 3a). In general, the biomass increased over time and existed in higher amounts at the top layers then decreased into the depth of the biofilter. The vs. ranged between 24–140 and 39–179 mg vs. g−1 GAC in the unsaturated zone on days 160 and 218, respectively. Less biomass was developed in the saturated zone with ranges of 15–17 and 19–24 mg vs. g−1 GAC on days 160 and 218, respectively. Figure 3b demonstrates the biological activity level profile of the developed biomass on days 160 and 218 along the biofilter’s depth, measured as the concentration of ATP as the primary energy carrier for all microorganisms. Similar to the biofilm mass, the biological activity was higher at the top layers than the deeper ones and it increased over time, indicating higher levels of biological activity. The ATP in the unsaturated zone ranged between 0.33–1.03 and 0.03–0.63 µg tATP g−1 GAC on days 160 and 218, respectively. The saturated zone had lower activity levels with an average of 0.01 µg tATP g−1 GAC on day 160 and a range of 0.02–0.27 µg tATP g−1 GAC on day 218. The overall decrease in biological growth and activity in the saturated zone compared to the unsaturated zone can be attributed to the depletion of most of the substrate in greywater prior to coming in contact with the saturated zone since > 95% TCOD was removed in the unsaturated zone.

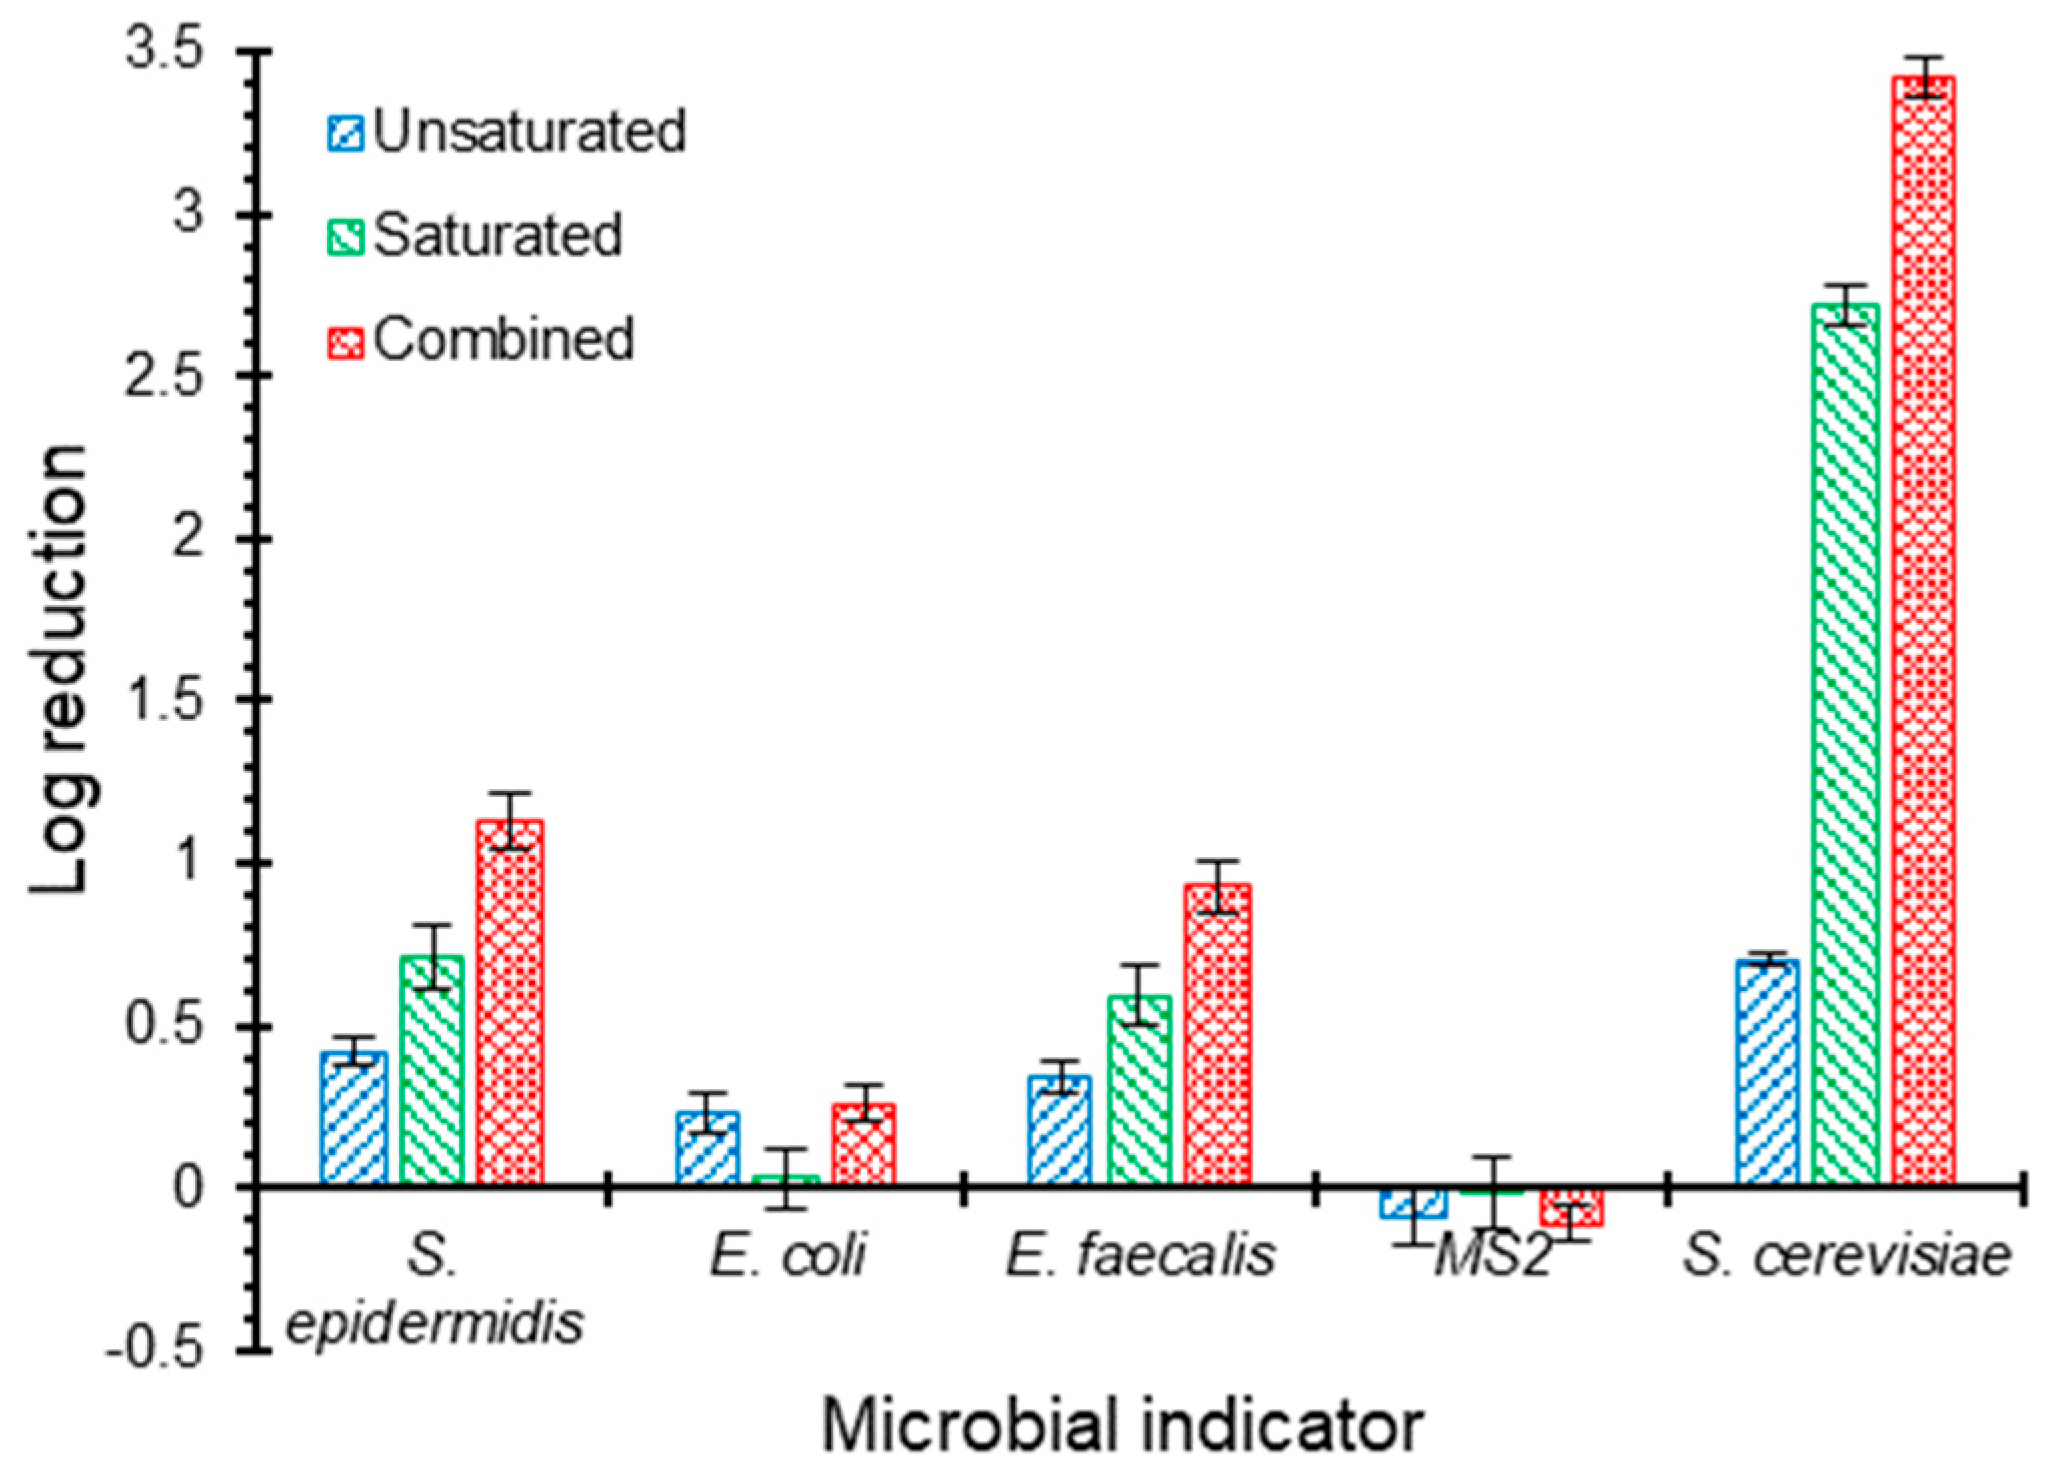
3.3. Reduction of Pathogen Surrogates

Figure S2 demonstrates the bromide tracer breakthrough curve. The tracer began to show up in the effluent after 2 h from injecting the tracer with the influent as a slug. This result is comparable to the theoretically calculated HRT, which is 2.4 h. Since the samples were composite, the tracer concentration appeared as a sudden, flat peak that was observed for three consecutive samples then the concentration reached near zero. This pattern of the breakthrough curve indicates that the hydraulic behaviour of the GAC biofilter is near the plug flow. The results of this tracer test suggest that microbial concentrations throughout the reactor would likely be stable after 3 h of the initial injection.
Figure 4 shows the log reduction of the five pathogen surrogates: S. epidermidis, E. coli, E. faecalis, MS2 bacteriophages, and S. cerevisiae within each of the unsaturated and saturated zones individually and the entire biofilter. The highest reduction occurred with S. cerevisiae (surrogates for Cryptosporidium and Giardia cysts) with an overall log reduction of 3.4 with contributions of 0.7 and 2.7 logs from the unsaturated and saturated zones, respectively. The higher capacity of GAC filters in removing oocysts compared to E. coli and MS2 bacteriophages was also reported by [47], which might be contributed to the larger size of these oocysts. The authors of [47] achieved Cryptosporidium and Giardia (oo)cysts log reductions of 2.7 and 2.1, respectively, from river water using a saturated GAC filter with a depth of 1.35 m operated under an HLR of 5000 L m−2 d−1.
In our study, the removals of S. epidermidis (log reduction of 1.1) and E. faecalis (log reduction of 0.9) were both lower than those for oocysts. It was observed that the unsaturated zone contributed to the log reduction by 0.4 and 0.3, while the saturated zone contributed by 0.7 and 0.6 for S. epidermidis and E. faecalis, respectively. Further, the biofilter had a lower reduction towards E. coli with an overall value of 0.3, most of which occurred in the unsaturated zone. The limited E. coli removal in carbon-based filters was reported in previous studies [47,48]. The authors of [48] reported that the presence of biofilm on carbon-based media in stormwater biofilters significantly reduced E. coli removal, as the case in the current study. This reduction in E. coli log removal can be attributed to the altered surface properties such as roughness and hydrophobicity [48]. Biofilms significantly reduce the surface roughness of GAC media and create smoother deposition surfaces, which makes it less likely for bacteria (i.e., E. coli) to attach onto those smooth surfaces [48,49,50]. In addition, biofilm formation results in a reduced hydrophobic interaction between bacterial cells and biofilm surfaces [31,48], leading to a decreased E. coli log reduction.
No log reduction was observed for MS2 bacteriophages, which is consistent with previous studies that reported no reduction [47] or low reduction [51,52,53] of viruses and bacteriophages using granular activated carbon filters. Many studies suggested that the deposition of microbial particles, such as viruses, is inconsistent with the classical colloid filtration theory (CFT) due to the presence of Derjaguin–Landau–Verwey–Overbeek (DLVO) repulsive interactions [54,55,56], causing different colloidal behaviour and unfavourable conditions for deposition, as the case herein. Mechanisms controlling this behaviour have not been fully understood [54,55,56]. Nonetheless, experimental evidence suggests that anionic surfactants, which form the majority of surfactants in greywater, are capable of masking uncharged or slightly positively charged regions, providing favourable conditions for deposition [54]. This case was not available in this part of the study since greywater was replaced by a modified formulation that does not contain anionic surfactants as described earlier.
Obviously, the longer HRT provided in the saturated zone was effective in improving the overall capacity of the system in reducing several pathogen surrogates. The longer HRT would result in longer residence time of microbes in the biofilter, leading to improved removal performance due to longer exposure to the removal processes, as concluded by [28]. Biofilters support different removal mechanisms for pathogenic organisms [57], including physical and biological mechanisms. Despite the decreased biological activity observed in the saturated zone as compared to the unsaturated zone (Figure 3), various mechanisms can still lead to the improved reduction of pathogen surrogates in the saturated zone such as filtration, attachment, die-off, and predation [58,59].

3.4. Microbial Community Structure

The 16S rRNA gene amplicons of the GAC biofilm were sequenced to identify the most abundant members of the bacterial community along the biofilter depth. At the class level (Figure 5), a clear pattern of niche segregation was observed between the unsaturated and saturated zones. The bacterial communities of the unsaturated zone were predominated by α-Proteobacteria (53–67%), Actinobacteria (2–16%), β-Proteobacteria (4–11%), Chlamydiia (≤8%), γ-Proteobacteria (3–10%), 4C0d-2 (4–7%), δ-Proteobacteria (2–7%), and Bacteroidia (≤1%). On the other hand, the unsaturated zone was predominated by Thermotogae (≤ 29%), β-Proteobacteria (13–18%), α-Proteobacteria (11–13%), δ-Proteobacteria (1–17%), γ-Proteobacteria (7–10%), Clostridia (3–13%), Bacteroidia (3–8%), Bacilli (≤5%), Flavobacteriia (2–5%), Actinobacteria (1–4%), and 4C0d-2 (1–2%). The increases in anaerobic bacteria in the saturated zone (Thermotogae, Clostridia, and Bacteroidia) can be attributed to reduced oxygen availability in the saturated zone.
The microbial community structure at the genus level is shown in Figure 6. The bacterial communities of the unsaturated zone were predominated by the Oleomonas genus, ranging from 29% to 49% for the entire zone. Oleomonas abundance was constant at 29% throughout the depth of the unsaturated zone except for the third segment at a depth of 20–30 cm where its abundance increased to 49%. Oleomonas is a hydrocarbon degrader that belongs to the α-Proteobacteria class [60]. Oleomonas was also present in the saturated zone with a relative abundance of <2%. The bacterial community of an unsaturated GAC biofilter treating greywater was explored in another study which concluded that the bacterial community was predominated by α-Proteobacteria (Rhizobium genus) and γ-Proteobacteria (Pseudomonas and Acinetobacter genera) with the former dominating the top layer and the latter dominating the bottom layer [61]. This study used a greywater formulation with a different composition and higher levels of nutrients, which can be the reason for the different bacterial community structure.
There were several genera that were common between the two zones: Mycobacterium, Sphingobium, Caulobacter, Pseudomonas, and unidentified genera from the families Rhizobiaceae, Comamonadaceae, and the order MLE1-12. These are often reported in aerobic wastewater treatment systems [43,62] with hydrocarbon-degrading functions [63,64,65].
The saturated zone at a depth of 40–50 cm was predominated by the genus S1 (29%) from the family Thermotogaceae, which was previously reported to have predominated the microbial community in a system treating wastewater under anaerobic conditions [66]. At the bottom segment of the biofilter (50–60 cm depth), there was no predominance of a single genus, and a few genera showed similar abundances, Flavobacterium (4.5%), unidentified genera in the order Bacteroidales (4.5%), and family Comamonadaceae (4.4%). Some unique genera with mixed features for oxygen requirements inhabited this layer, including anaerobic bacteria Syntrophus, a genus from Syntrophaceae, aero-tolerant bacteria Lactobacillus [67], and facultative-aerobic Hydrogenophaga [68]. Due to the scarcity of substrates, the microbial community may have been developed by opportunistic microorganisms, lacking in dominant species as compared to other layers.
Oleomonas exhibited some attributes that may explain why this genus predominated the microbial community of a biofilter. Firstly, it had a tendency to cluster in aggregates and produce extracellular polymeric substances (EPSs), which allows its adhesion to support media and biofilm formation [60,69]. The abundance of this genus can be advantageous in the early stages of biofilter operation; ref. [69] reported that Oleomonas predominated the microbial community and initially colonized the media surface due to its characteristic of forming aggregates along with its versatility and broad metabolic flexibility. In addition, Oleomonas has the ability to biodegrade recalcitrant hydrocarbons under limited nitrogen conditions, which is the case with greywater as it is composed mainly of surfactants and limited amounts of nutrients. Moreover, being a Gram-negative bacterial genus [60], Oleomonas possesses an outer membrane that has a natural resistance to detergents due to its structure, which contains lipopolysaccharides [70,71]. This property allows the Oleomonas genus to overcome the high content of surfactants present in the greywater.

3.5. Feasibility and Implications for Design and Operation

Assuming a person equivalent (P.E.) of 100 L d−1 [15,72] and given the highest achieved HLR of 1200 L m−2 d−1, a GAC biofilter with a footprint of 1 m2 can sufficiently handle the volumes of greywater generated from 12 persons, from a hydraulic perspective. Further analysis was conducted to determine the expected lifetime of the media under these loading conditions (details are shown in the Supplementary Materials). Taking a conservative approach, it was assumed that the GAC media used in the current study were to be replaced by the end of stage VIII (after 253 days of continuous operation). Considering the total mass of COD treated throughout the experiment, it was revealed that the GAC media can be used for six months under continuous loading of the highest achieved HLR. This indicates that the media will need to be replaced twice per year. The exhausted media can be regenerated offline [73].
To assess the feasibility of the GAC biofilter for on-site greywater treatment, a preliminary cost-benefit analysis was performed over a period of five years (details are shown in the Supplementary Materials). The costs included capital costs (tank fabrication, GAC media, pump, and fixtures) and running costs (power consumption and GAC replacement), and benefits included monetary savings due to water savings as a result of greywater reuse. The analysis was based on prices that are available in Canada, specifically Alberta. The total cost of establishing and running a GAC biofilter to serve 12 persons over five years was CAD 2531. On the other hand, monetary savings over the same period due to greywater reuse based on water savings ratio of 30%, 40%, and 50% were CAD 2468, CAD 3097, and CAD 3752, respectively. Comparing the two sides, it can be concluded that the system is economically feasible at the lowest proposed recycling rate of 30%, with a potential for further savings at higher rates of recycling. The analysis accounted for benefits for the users, however, other benefits include a wide variety of savings in water resources, treatment facilities, and infrastructure [74,75,76].
The proposed technology is intended to potentially be applied on the household or neighbourhood scale. Although clogging issues were not observed throughout the operation period in the unsaturated or saturated zones of the GAC biofilter, real greywater is expected to include more suspended and floating materials (e.g., hair and lint; [44]) that might cause clogging to filters. Therefore, it is recommended to install an upstream retention tank with an intermediate wall baffle, a tee-connection inlet/outlet, and/or a coarse filter. In addition, the system showed a range of reduction towards pathogen surrogates representing human skin-associated and enteric bacteria, viruses, and protozoan cysts and oocysts. Adding a disinfection/inactivation unit downstream of the biofilter, such as an ultraviolet lamp, would result in a higher reduction of pathogens, providing high-quality effluent that is safe for potential domestic uses or safe discharge into the environment.

4. Conclusions

A single-stage unsaturated-saturated granular activated carbon (GAC) biofilter was developed for on-site greywater treatment. With the highest hydraulic and organic loadings of 1.2 m3 m−2 d−1 and 3.5 kg COD m−2 d−1, respectively, and the shortest retention time of 2.4 h. The system maintained an average TCOD removal of 98% and complete nutrients removal throughout its 253 days of operation. The system showed a range of reduction towards pathogen surrogates representing human skin-associated and enteric bacteria, viruses, and protozoan cysts and oocysts. A well-functioning biofilm developed within the system, and its mass and activity increased over time with the highest values observed at the top layers. The key microbes within the biofilter were revealed, and the bacterial genus Oleomonas predominated the system due to its unique and advantageous attributes. A preliminary cost-benefit analysis revealed that the system is economically feasible.

Supplementary Materials

The following are available online at https://www.mdpi.com/2071-1050/12/21/8847/s1, Table S1: Synthetic greywater formulation adapted from the NSF/ANSI Standard 350 for combined bathing and laundry waters, Table S2: Operation stages and system capacity, Figure S1: Scanning electron microscopy images of the GAC media collected from the GAC biofilter treating greywater, Figure S2: Bromide tracer test breakthrough curve, cost-benefit analysis, and GAC media lifetime calculation.

Author Contributions

Conceptualization, A.S., D.C.S., N.J.A., and Y.L.; methodology, A.S., B.G., D.C.S., N.J.A., and Y.L.; formal analysis, A.S., B.G., and D.C.S.; resources, N.J.A. and Y.L.; data curation, A.S., B.G., and D.C.S.; writing—original draft preparation, A.S.; writing—review and editing, A.S., B.G., D.C.S., and Y.L.; visualization, A.S. and B.G.; supervision, N.J.A. and Y.L.; project administration, A.S. and Y.L.; funding acquisition, N.J.A. and Y.L. All authors have read and agreed to the published version of the manuscript.

Funding

This research was funded by a Natural Sciences and Engineering Research Council of Canada (NSERC) Industrial Research Chair (IRC) Program in Sustainable Urban Water Development (Liu, Y.) through the support by EPCOR Water Services, Canada, EPCOR Drainage Operation, Canada, and Alberta Innovates, Canada, and the Canada Research Chair (CRC) in Future Water Services (Liu, Y.).

Conflicts of Interest

The authors declare no conflict of interest.

References

  1. Chen, Z.; Ngo, H.H.; Guo, W. A Critical Review on the End Uses of Recycled Water. Crit. Rev. Environ. Sci. Technol. 2013, 43, 1446–1516. [Google Scholar] [CrossRef]
  2. Al-Jayyousi, O. Focused environmental assessment of greywater reuse in Jordan. Environ. Eng. Policy 2001, 3, 67–73. [Google Scholar] [CrossRef]
  3. Masi, F.; Rizzo, A.; Regelsberger, M. The role of constructed wetlands in a new circular economy, resource oriented, and ecosystem services paradigm. J. Environ. Manag. 2018, 216, 275–284. [Google Scholar] [CrossRef] [PubMed]
  4. Leong, J.Y.C.; Chong, M.N.; Poh, P.E.; Vieritz, A.; Talei, A.; Chow, M.F. Quantification of mains water savings from decentralised rainwater, greywater, and hybrid rainwater-greywater systems in tropical climatic conditions. J. Clean. Prod. 2018, 176, 946–958. [Google Scholar] [CrossRef]
  5. Ilemobade, A.A.; Olanrewaju, O.O.; Griffioen, M.L. Greywater reuse for toilet flushing at a university academic and residential building. Water SA 2013, 39, 351–360. [Google Scholar] [CrossRef] [Green Version]
  6. Maimon, A.; Tal, A.; Friedler, E.; Gross, A. Safe on-Site Reuse of Greywater for Irrigation—A Critical Review of Current Guidelines. Environ. Sci. Technol. 2010, 44, 3213–3220. [Google Scholar] [CrossRef]
  7. Maimon, A.; Gross, A.; Arye, G. Greywater-induced soil hydrophobicity. Chemosphere 2017, 184, 1012–1019. [Google Scholar] [CrossRef]
  8. Wiel-Shafran, A.; Ronen, Z.; Weisbrod, N.; Adar, E.; Gross, A. Potential changes in soil properties following irrigation with surfactant-rich greywater. Ecol. Eng. 2006, 26, 348–354. [Google Scholar] [CrossRef]
  9. Shafran, A.W.; Gross, A.; Ronen, Z.; Weisbrod, N.; Adar, E. Effects of surfactants originating from reuse of greywater on capillary rise in the soil. Water Sci. Technol. 2005, 52, 157–166. [Google Scholar] [CrossRef]
  10. Shi, K.W.; Wang, C.W.; Jiang, S.C. Quantitative microbial risk assessment of Greywater on-site reuse. Sci. Total Environ. 2018, 635, 1507–1519. [Google Scholar] [CrossRef]
  11. Schoen, M.E.; Ashbolt, N.J.; Jahne, M.A.; Garland, J. Risk-based enteric pathogen reduction targets for non-potable and direct potable use of roof runoff, stormwater, and greywater. Microb. Risk Anal. 2017, 5, 32–43. [Google Scholar] [CrossRef] [PubMed]
  12. Schoen, M.E.; Garland, J. Review of pathogen treatment reductions for onsite non-potable reuse of alternative source waters. Microb. Risk Anal. 2017, 5, 25–31. [Google Scholar] [CrossRef]
  13. Capodaglio, A. Integrated, Decentralized Wastewater Management for Resource Recovery in Rural and Peri-Urban Areas. Resources 2017, 6, 22. [Google Scholar] [CrossRef] [Green Version]
  14. Ghawi, A.H. Development of the greywater domestic treatment unit for irrigation of the garden in rural areas. J. Ecol. Eng. 2019, 20, 46–56. [Google Scholar] [CrossRef]
  15. Moges, M.E.; Todt, D.; Eregno, F.E.; Heistad, A. Performance study of biofilter system for on-site greywater treatment at cottages and small households. Ecol. Eng. 2017, 105, 118–124. [Google Scholar] [CrossRef]
  16. Avery, L.M.; Frazer-Williams, R.A.D.; Winward, G.; Shirley-Smith, C.; Liu, S.; Memon, F.A.; Jefferson, B. Constructed wetlands for grey water treatment. Ecohydrol. Hydrobiol. 2007, 7, 191–200. [Google Scholar] [CrossRef]
  17. Fowdar, H.S.; Hatt, B.E.; Breen, P.; Cook, P.L.M.; Deletic, A. Designing living walls for greywater treatment. Water Res. 2017, 110, 218–232. [Google Scholar] [CrossRef]
  18. Prodanovic, V.; Hatt, B.; McCarthy, D.; Zhang, K.; Deletic, A. Green walls for greywater reuse: Understanding the role of media on pollutant removal. Ecol. Eng. 2017, 102, 625–635. [Google Scholar] [CrossRef]
  19. Jenssen, P.D.; Vråle, L. Greywater Treatment in combined Biofilter/Constructed Wetlands in Cold Climate. In Proceedings of the Second International Conference on Ecological Sanitation, Lübeck, Germany, 7–11 April 2003; pp. 875–881. [Google Scholar]
  20. Sharaf, A.; Liu, Y. Mechanisms and kinetics of greywater treatment using biologically active granular activated carbon. Chemosphere 2021, 263, 128113. [Google Scholar] [CrossRef]
  21. Aktaş, Ö.; Çeçen, F. Bioregeneration of activated carbon: A review. Int. Biodeterior. Biodegrad. 2007, 59, 257–272. [Google Scholar] [CrossRef]
  22. Ahmaruzzaman, M. Adsorption of phenolic compounds on low-cost adsorbents: A review. Adv. Colloid Interface Sci. 2008, 143, 48–67. [Google Scholar] [CrossRef] [PubMed]
  23. Snyder, S.A.; Adham, S.; Redding, A.M.; Cannon, F.S.; DeCarolis, J.; Oppenheimer, J.; Wert, E.C.; Yoon, Y. Role of membranes and activated carbon in the removal of endocrine disruptors and pharmaceuticals. Desalination 2007, 202, 156–181. [Google Scholar] [CrossRef]
  24. Toles, C.A.; Marshall, W.E.; Johns, M.M. Granular activated carbons from nutshells for the uptake of metals and organic compounds. Carbon 1997, 35, 1407–1414. [Google Scholar] [CrossRef]
  25. Ahmed, M.B.; Zhou, J.L.; Ngo, H.H.; Guo, W. Adsorptive removal of antibiotics from water and wastewater: Progress and challenges. Sci. Total Environ. 2015, 532, 112–126. [Google Scholar] [CrossRef]
  26. Heistad, A.; Jenssen, P.D.; Frydenlund, A.S. A new combined distribution and pretreatment unit for wastewater soil infiltration systems. In Proceedings of the On-Site Wastewater Treatment, Fort Worth, TX, USA, 11–14 March 2001; American Society of Agricultural and Biological Engineers: St. Joseph, MI, USA, 2001; pp. 200–206. [Google Scholar]
  27. Dalahmeh, S.S.; Pell, M.; Vinnerås, B.; Hylander, L.D.; Öborn, I.; Jönsson, H. Efficiency of Bark, Activated Charcoal, Foam and Sand Filters in Reducing Pollutants from Greywater. Water Air Soil Pollut. 2012, 223, 3657–3671. [Google Scholar] [CrossRef]
  28. Eregno, F.E.; Heistad, A. On-site treated wastewater disposal systems—The role of stratified filter medias for reducing the risk of pollution. Environ. Int. 2019, 124, 302–311. [Google Scholar] [CrossRef] [PubMed]
  29. NSF International. NSF/ANSI 350: On-Site Residential and Commercial Water Reuse Treatment Systems; NSF International: Ann Arbor, MI, USA, 2012. [Google Scholar]
  30. Bruno, L. Standard Methods for the Examination of Water and Wastewater, 23rd ed.; Rice, E.W., Barid, A.D., Eaton, A.D., Eds.; American Public Health Association: Washington, DC, USA, 2017; Volume 53, ISBN 9780875532875. [Google Scholar]
  31. Velten, S.; Hammes, F.; Boller, M.; Egli, T. Rapid and direct estimation of active biomass on granular activated carbon through adenosine tri-phosphate (ATP) determination. Water Res. 2007, 41, 1973–1983. [Google Scholar] [CrossRef]
  32. Kadlec, R.H.; Wallace, S.D. Treatment Wetlands; CRC Press: Boca Raton, FL, USA, 2009; ISBN 9781566705264. [Google Scholar]
  33. Method 1601: Male-specific (F+) and Somatic Coliphage in Water by Two-Step Enrichment Procedure; United States Environmental Protection Agency: Boston, MA, USA, 2001.
  34. Apprill, A.; Mcnally, S.; Parsons, R.; Weber, L. Minor revision to V4 region SSU rRNA 806R gene primer greatly increases detection of SAR11 bacterioplankton. Aquat. Microb. Ecol. 2015, 75, 129–137. [Google Scholar] [CrossRef] [Green Version]
  35. Parada, A.E.; Needham, D.M.; Fuhrman, J.A. Every base matters: Assessing small subunit rRNA primers for marine microbiomes with mock communities, time series and global field samples. Environ. Microbiol. 2016, 18, 1403–1414. [Google Scholar] [CrossRef] [PubMed]
  36. Werner, J.J.; Koren, O.; Hugenholtz, P.; DeSantis, T.Z.; Walters, W.A.; Caporaso, J.G.; Angenent, L.T.; Knight, R.; Ley, R.E. Impact of training sets on classification of high-throughput bacterial 16s rRNA gene surveys. ISME J. 2012, 6, 94–103. [Google Scholar] [CrossRef] [Green Version]
  37. Callahan, B.J.; McMurdie, P.J.; Rosen, M.J.; Han, A.W.; Johnson, A.J.A.; Holmes, S.P. DADA2: High-resolution sample inference from Illumina amplicon data. Nat. Methods 2016, 13, 581–583. [Google Scholar] [CrossRef] [PubMed] [Green Version]
  38. Oksanen, J.; Blanchet, F.G.; Friendly, M.; Kindt, R.; Legendre, P.; McGlinn, D.; Minchin, P.R.; O’Hara, R.B.; Sompson, G.L.; Solymos, P.; et al. vegan: Community Ecology Package: Ordination Methods, Diversity Analysis and Other Functions for Community and Vegetation Ecologists. 2019. Available online: https://cran.r-project.org/web/packages/vegan/index.html (accessed on 20 February 2020).
  39. González-García, C.M.; González-Martín, M.L.; Denoyel, R.; Gallardo-Moreno, A.M.; Labajos-Broncano, L.; Bruque, J.M. Ionic surfactant adsorption onto activated carbons. J. Colloid Interface Sci. 2004, 278, 257–264. [Google Scholar] [CrossRef] [PubMed]
  40. Wu, S.H.; Pendleton, P. Adsorption of Anionic Surfactant by Activated Carbon: Effect of Surface Chemistry, Ionic Strength, and Hydrophobicity. J. Colloid Interface Sci. 2001, 243, 306–315. [Google Scholar] [CrossRef]
  41. González, S.; Petrovic, M.; Barceló, D. Removal of a broad range of surfactants from municipal wastewater—Comparison between membrane bioreactor and conventional activated sludge treatment. Chemosphere 2007, 67, 335–343. [Google Scholar] [CrossRef]
  42. Mungray, A.K.; Kumar, P. Anionic surfactants in treated sewage and sludges: Risk assessment to aquatic and terrestrial environments. Bioresour. Technol. 2008, 99, 2919–2929. [Google Scholar] [CrossRef]
  43. Moges, M.E.; Eregno, F.E.; Heistad, A. Performance of biochar and filtralite as polishing step for on-site greywater treatment plant. Manag. Environ. Qual. Int. J. 2015, 26, 607–625. [Google Scholar] [CrossRef]
  44. Draft Guidelines for the Reuse of Greywater in Western Australia; Health Department of Western Australia: Perth, Australia, 2002.
  45. Todt, D.; Heistad, A.; Jenssen, P.D. Load and distribution of organic matter and nutrients in a separated household wastewater stream. Environ. Technol. 2015, 36, 1584–1593. [Google Scholar] [CrossRef]
  46. Ha, S.R.; Vinitnantharat, S.; Ozaki, H. Bioregeneration by mixed microorganisms of granular activated carbon loaded with a mixture of phenols. Biotechnol. Lett. 2000, 22, 1093–1096. [Google Scholar] [CrossRef]
  47. Hijnen, W.A.M.; Suylen, G.M.H.; Bahlman, J.A.; Brouwer-Hanzens, A.; Medema, G.J. GAC adsorption filters as barriers for viruses, bacteria and protozoan (oo)cysts in water treatment. Water Res. 2010, 44, 1224–1234. [Google Scholar] [CrossRef]
  48. Afrooz, A.R.M.N.; Boehm, A.B. Escherichia coli Removal in Biochar-Modified Biofilters: Effects of Biofilm. PLoS ONE 2016, 11, e0167489. [Google Scholar] [CrossRef]
  49. Díaz, C.; Cortizo, M.C.; Schilardi, P.L.; de Saravia, S.G.G.; de Mele, M.A.F.L. Influence of the nano-micro structure of the surface on bacterial adhesion. Mater. Res. 2007, 10, 11–14. [Google Scholar] [CrossRef]
  50. Arnold, J.W.; Bailey, G.W. Surface finishes on stainless steel reduce bacterial attachment and early biofilm formation: Scanning electron and atomic force microscopy study. Poult. Sci. 2000, 79, 1839–1845. [Google Scholar] [CrossRef] [PubMed]
  51. Guy, M.D.; McIver, J.D.; Lewis, M.J. The removal of virus by a pilot treatment plant. Water Res. 1977, 11, 421–428. [Google Scholar] [CrossRef]
  52. Scott, T.M.; Sabo, R.C.; Lukasik, J.; Boice, C.; Shaw, K.; Barroso-Giachetti, L.; El-Shall, H.; Farrah, S.R.; Park, C.; Moudgil, B.; et al. Performance and Cost-Effectiveness of Ferric and Aluminum Hydrous Metal Oxide Coating on Filter Media to Enhance Virus Removal. KONA Powder Part. J. 2002, 20, 159–167. [Google Scholar] [CrossRef] [Green Version]
  53. Persson, F.; Långmark, J.; Heinicke, G.; Hedberg, T.; Tobiason, J.; Stenström, T.A.; Hermansson, M. Characterisation of the behaviour of particles in biofilters for pre-treatment of drinking water. Water Res. 2005, 39, 3791–3800. [Google Scholar] [CrossRef]
  54. Tufenkji, N.; Elimelech, M. Breakdown of colloid filtration theory: Role of the secondary energy minimum and surface charge heterogeneities. Langmuir 2005, 21, 841–852. [Google Scholar] [CrossRef]
  55. Tufenkji, N.; Elimelech, M. Deviation from the classical colloid filtration theory in the presence of repulsive DLVO interactions. Langmuir 2004, 20, 10818–10828. [Google Scholar] [CrossRef]
  56. Molnar, I.L.; Johnson, W.P.; Gerhard, J.I.; Willson, C.S.; O’Carroll, D.M. Predicting colloid transport through saturated porous media: A critical review. Water Resour. Res. 2015, 51, 6804–6845. [Google Scholar] [CrossRef] [Green Version]
  57. Peng, J.; Cao, Y.; Rippy, M.; Afrooz, A.; Grant, S.; Peng, J.; Cao, Y.; Rippy, M.A.; Afrooz, A.R.M.N.; Grant, S.B. Indicator and Pathogen Removal by Low Impact Development Best Management Practices. Water 2016, 8, 600. [Google Scholar] [CrossRef]
  58. Zhang, L.; Seagren, E.A.; Davis, A.P.; Karns, J.S. The Capture and Destruction of Escherichia coli from Simulated Urban Runoff Using Conventional Bioretention Media and Iron Oxide-coated Sand. Water Environ. Res. 2010, 82, 701–714. [Google Scholar] [CrossRef]
  59. Zhang, L.; Seagren, E.A.; Davis, A.P. Column Studies on the Capture and Destruction of E. coli from Simulated Urban Stormwater Runoff Using Conventional Bioretention Media and Iron Oxide-Coated Sand. In Proceedings of the World Environmental and Water Resources Congress 2008, Honolulu, HI, USA, 12–16 May 2008; American Society of Civil Engineers: Reston, VA, USA, 2008; pp. 1–7. [Google Scholar]
  60. Kanamori, T.; Rashid, N.; Morikawa, M.; Atomi, H.; Imanaka, T. Oleomonas sagaranensis gen. nov., sp. nov., represents a novel genus in the α- Proteobacteria. FEMS Microbiol. Lett. 2002, 217, 255–261. [Google Scholar] [CrossRef]
  61. Dalahmeh, S.S.; Jönsson, H.; Hylander, L.D.; Hui, N.; Yu, D.; Pell, M. Dynamics and functions of bacterial communities in bark, charcoal and sand filters treating greywater. Water Res. 2014, 54, 21–32. [Google Scholar] [CrossRef] [PubMed]
  62. McIlroy, S.J.; Saunders, A.M.; Albertsen, M.; Nierychlo, M.; McIlroy, B.; Hansen, A.A.; Karst, S.M.; Nielsen, J.L.; Nielsen, P.H. MiDAS: The field guide to the microbes of activated sludge. Database 2015, 2015. [Google Scholar] [CrossRef]
  63. Guo, F.; Zhang, T.; Li, B.; Wang, Z.; Ju, F.; Liang, Y. ting Mycobacterial species and their contribution to cholesterol degradation in wastewater treatment plants. Sci. Rep. 2019, 9, 1–10. [Google Scholar] [CrossRef] [Green Version]
  64. Kertesz, M.A.; Kawasaki, A. Hydrocarbon-Degrading Sphingomonads: Sphingomonas, Sphingobium, Novosphingobium, and Sphingopyxis. In Handbook of Hydrocarbon and Lipid Microbiology; Springer: Berlin, Heidelberg, 2010; pp. 1693–1705. [Google Scholar]
  65. Song, N.; Cai, H.Y.; Yan, Z.S.; Jiang, H.L. Cellulose degradation by one mesophilic strain Caulobacter sp. FMC1 under both aerobic and anaerobic conditions. Bioresour. Technol. 2013, 131, 281–287. [Google Scholar] [CrossRef]
  66. Ye, L.; Zhang, T. Bacterial communities in different sections of a municipal wastewater treatment plant revealed by 16S rDNA 454 pyrosequencing. Appl. Microbiol. Biotechnol. 2013, 97, 2681–2690. [Google Scholar] [CrossRef] [Green Version]
  67. Hammes, W.P.; Vogel, R.F. The genus Lactobacillus. In The Genera of Lactic Acid Bacteria; Wood, B.J.B., Holzapfel, H.F., Eds.; Springer: Boston, MA, USA, 1995; Volume 2, pp. 19–54. [Google Scholar]
  68. Chung, B.S.; Ryu, S.H.; Park, M.; Jeon, Y.; Chung, Y.R.; Jeon, C.O. Hydrogenophaga caeni sp. nov., isolated from activated sludge. Int. J. Syst. Evol. Microbiol. 2007, 57, 1126–1130. [Google Scholar] [CrossRef] [PubMed] [Green Version]
  69. Fernández, N.; Díaz, E.E.; Amils, R.; Sanz, J.L. Analysis of Microbial Community during Biofilm Development in an Anaerobic Wastewater Treatment Reactor. Microb. Ecol. 2008, 56, 121–132. [Google Scholar] [CrossRef] [PubMed]
  70. Anderson, R.C.; Yu, P.-L. Factors affecting the antimicrobial activity of ovine-derived cathelicidins against E. coli 0157:H7. Int. J. Antimicrob. Agents 2005, 25, 205–210. [Google Scholar] [CrossRef] [PubMed]
  71. Saimmai, A.; Rukadee, O.; Onlamool, T.; Sobhon, V.; Maneerat, S. Isolation and functional characterization of a biosurfactant produced by a new and promising strain of Oleomonas sagaranensis AT18. World J. Microbiol. Biotechnol. 2012, 28, 2973–2986. [Google Scholar] [CrossRef] [PubMed]
  72. Ghaitidak, D.M.; Yadav, K.D. Characteristics and treatment of greywater—A review. Environ. Sci. Pollut. Res. 2013, 20, 2795–2809. [Google Scholar] [CrossRef] [PubMed]
  73. Çeçen, F.; Aktaş, O. Activated Carbon for Water and Wastewater Treatment: Integration of Adsorption and Biological Treatment; Wiley-VCH: Weinheim, Germany, 2012; ISBN 9783527324712. [Google Scholar]
  74. Lazarova, V.; Hills, S.; Birks, R. Using recycled water for non-potable, urban uses: A review with particular reference to toilet flushing. Water Sci. Technol. Water Supply 2003, 3, 69–77. [Google Scholar] [CrossRef]
  75. Water Reuse in Alberta: Experience and Impacts on Economic Growth; WaterSMART Solutions Ltd.: Calgary, AB, Canada, 2013; p. 74.
  76. Toze, S. Reuse of effluent water—Benefits and risks. Agric. Water Manag. 2006, 80, 147–159. [Google Scholar] [CrossRef] [Green Version]
Figure 1. Schematic of the laboratory-scale single-stage unsaturated-saturated granular activated carbon (GAC) biofilter for greywater treatment.
Sustainability 12 08847 g001
Figure 2. Concentration of total chemical oxygen demand (TCOD, mg L−1) in the influent, unsaturated effluent, and overall effluent as well as the removal percentage in the two effluents as a function of the GAC biofilter’s operational time (d). The Latin numerals represent the operation stages.
Sustainability 12 08847 g002
Figure 3. Development profile of the (a) attached biofilm mass (mg volatile solids (VS) g−1 GAC) and (b) biological activity (µg tATP g−1 GAC) along the GAC biofilter depth (cm) at 10-cm intervals on days 160 and 218. The columns and error bars represent the average and standard deviation values, respectively, for triplicate measurements.
Sustainability 12 08847 g003
Figure 4. Log reductions of five pathogen surrogates: S. epidermidis, E. coli, E. faecalis, MS2 bacteriophage, and S. cerevisiae within each of the unsaturated and saturated zones individually and the entire biofilter. The columns and error bars represent the average and standard deviation values, respectively, for triplicate measurements.
Sustainability 12 08847 g004
Figure 5. Relative abundances of the predominating bacterial phylotypes (>1.0%) at the class level along the GAC biofilter depth.
Sustainability 12 08847 g005
Figure 6. Heatmap of the genera with >1% relative abundance. Taxa are shown at the genus level or higher (family: f_; order: o_; class: c_; phylum: p_; kingdom: k_) if not identified at the genus level. Hierarchical clusters indicate similarities among families based on their fold changes using the Euclidean distance method.
Sustainability 12 08847 g006
Table 1. Characteristics of the synthetic greywater.
ParameterUnitValueTargeted Range 1
Total chemical oxygen demand (TCOD)mg L−1347 ± 56250–400
Total organic carbon (TOC; as C)mg L−159 ± 250–100
Total Kjeldahl nitrogen (TKN; as N)mg L−13.0 ± 0.23.0–5.0
Total phosphorus (TP; as P)mg L−12.5 ± 0.11.3–3.0
pH-7.2 ± 0.16.5–8.0
1 According to the NSF/ANSI Standard 350 [29].
Table 2. Operating conditions of the biofilter during the different operation stages.
StageTime (d)HLR aOLR bHRT c
StartEndDuration(L m−2 d−1)(cm d−1)(g COD m−2 d−1)(h)
I030307172240.3
II 13157267172440.3
III589335100103528.8
IV9413844150155419.2
V13915516250257811.5
VI15618024600601894.8
VII18119514900903333.2
VIII1962535712001204542.4
1 Addition of secondary effluent to the synthetic greywater started from stage II as per the NSF/ANSI 350 formulation; a HLR: hydraulic loading rate; b OLR: organic loading rate; c HRT: hydraulic retention time.
Table 3. Pathogen surrogates for the microbial reduction study.
Pathogen SurrogatePathogen of InterestSourceEnumeration Method
StaphylococcusepidermidisHuman skin-associated bacteriaATCC a 12228Culturing on mannitol salt agar (MSA)
Escherichia coliHuman enteric bacteriaATCC 25922ColilertTM (IDEXX Canada, ASTM b Method #D6503-99)
EnterococcusfaecalisHuman enteric bacteriaATCC 29212EnterolertTM (IDEXX Canada, ASTM Method #D6503-99)
Bacteriophage MS2Human enteric virusesATCC 15597-B1Double agar (Method 1601, [33])
Saccharomyces cerevisiaeCryptosporidium and Giardia cysts and oocystsBaker’s Yeast (Active Dry, Fleischmann’s Yeast)Culturing on malt extract agar (MEA)
All assays were performed at multiple dilutions and in triplicate. Standard errors were calculated to estimate the variance between sampling times and their assays. a American Type Culture Collection (ATCC); b American Society for Testing and Materials (ASTM).
Publisher’s Note: MDPI stays neutral with regard to jurisdictional claims in published maps and institutional affiliations.

