Identification of Key Carbon Emission Sectors and Analysis of Emission Effects in China

Abstract
1. Introduction
2. Materials and Methods
2.1. Calculation Method of Sector’s Emission Effects
2.2. Data Sources and Processing
3. Results and Discussion
3.1. Identification of Key Carbon Emission Sectors in China
- (1)
- When a sector’s BE is more than the average of BE, and FE is more than the average of FE, this sector can be called the overall key emission sector.
- (2)
- When a sector’s FE is more than the average of FE, but BE is less than the average of BE, it is called the forward-emission-dominant sector.
- (3)
- When a sector’s BE is more than the average of BE, but FE is less than the average of FE, this sector is called a backward-emission-dominant sector.
- (4)
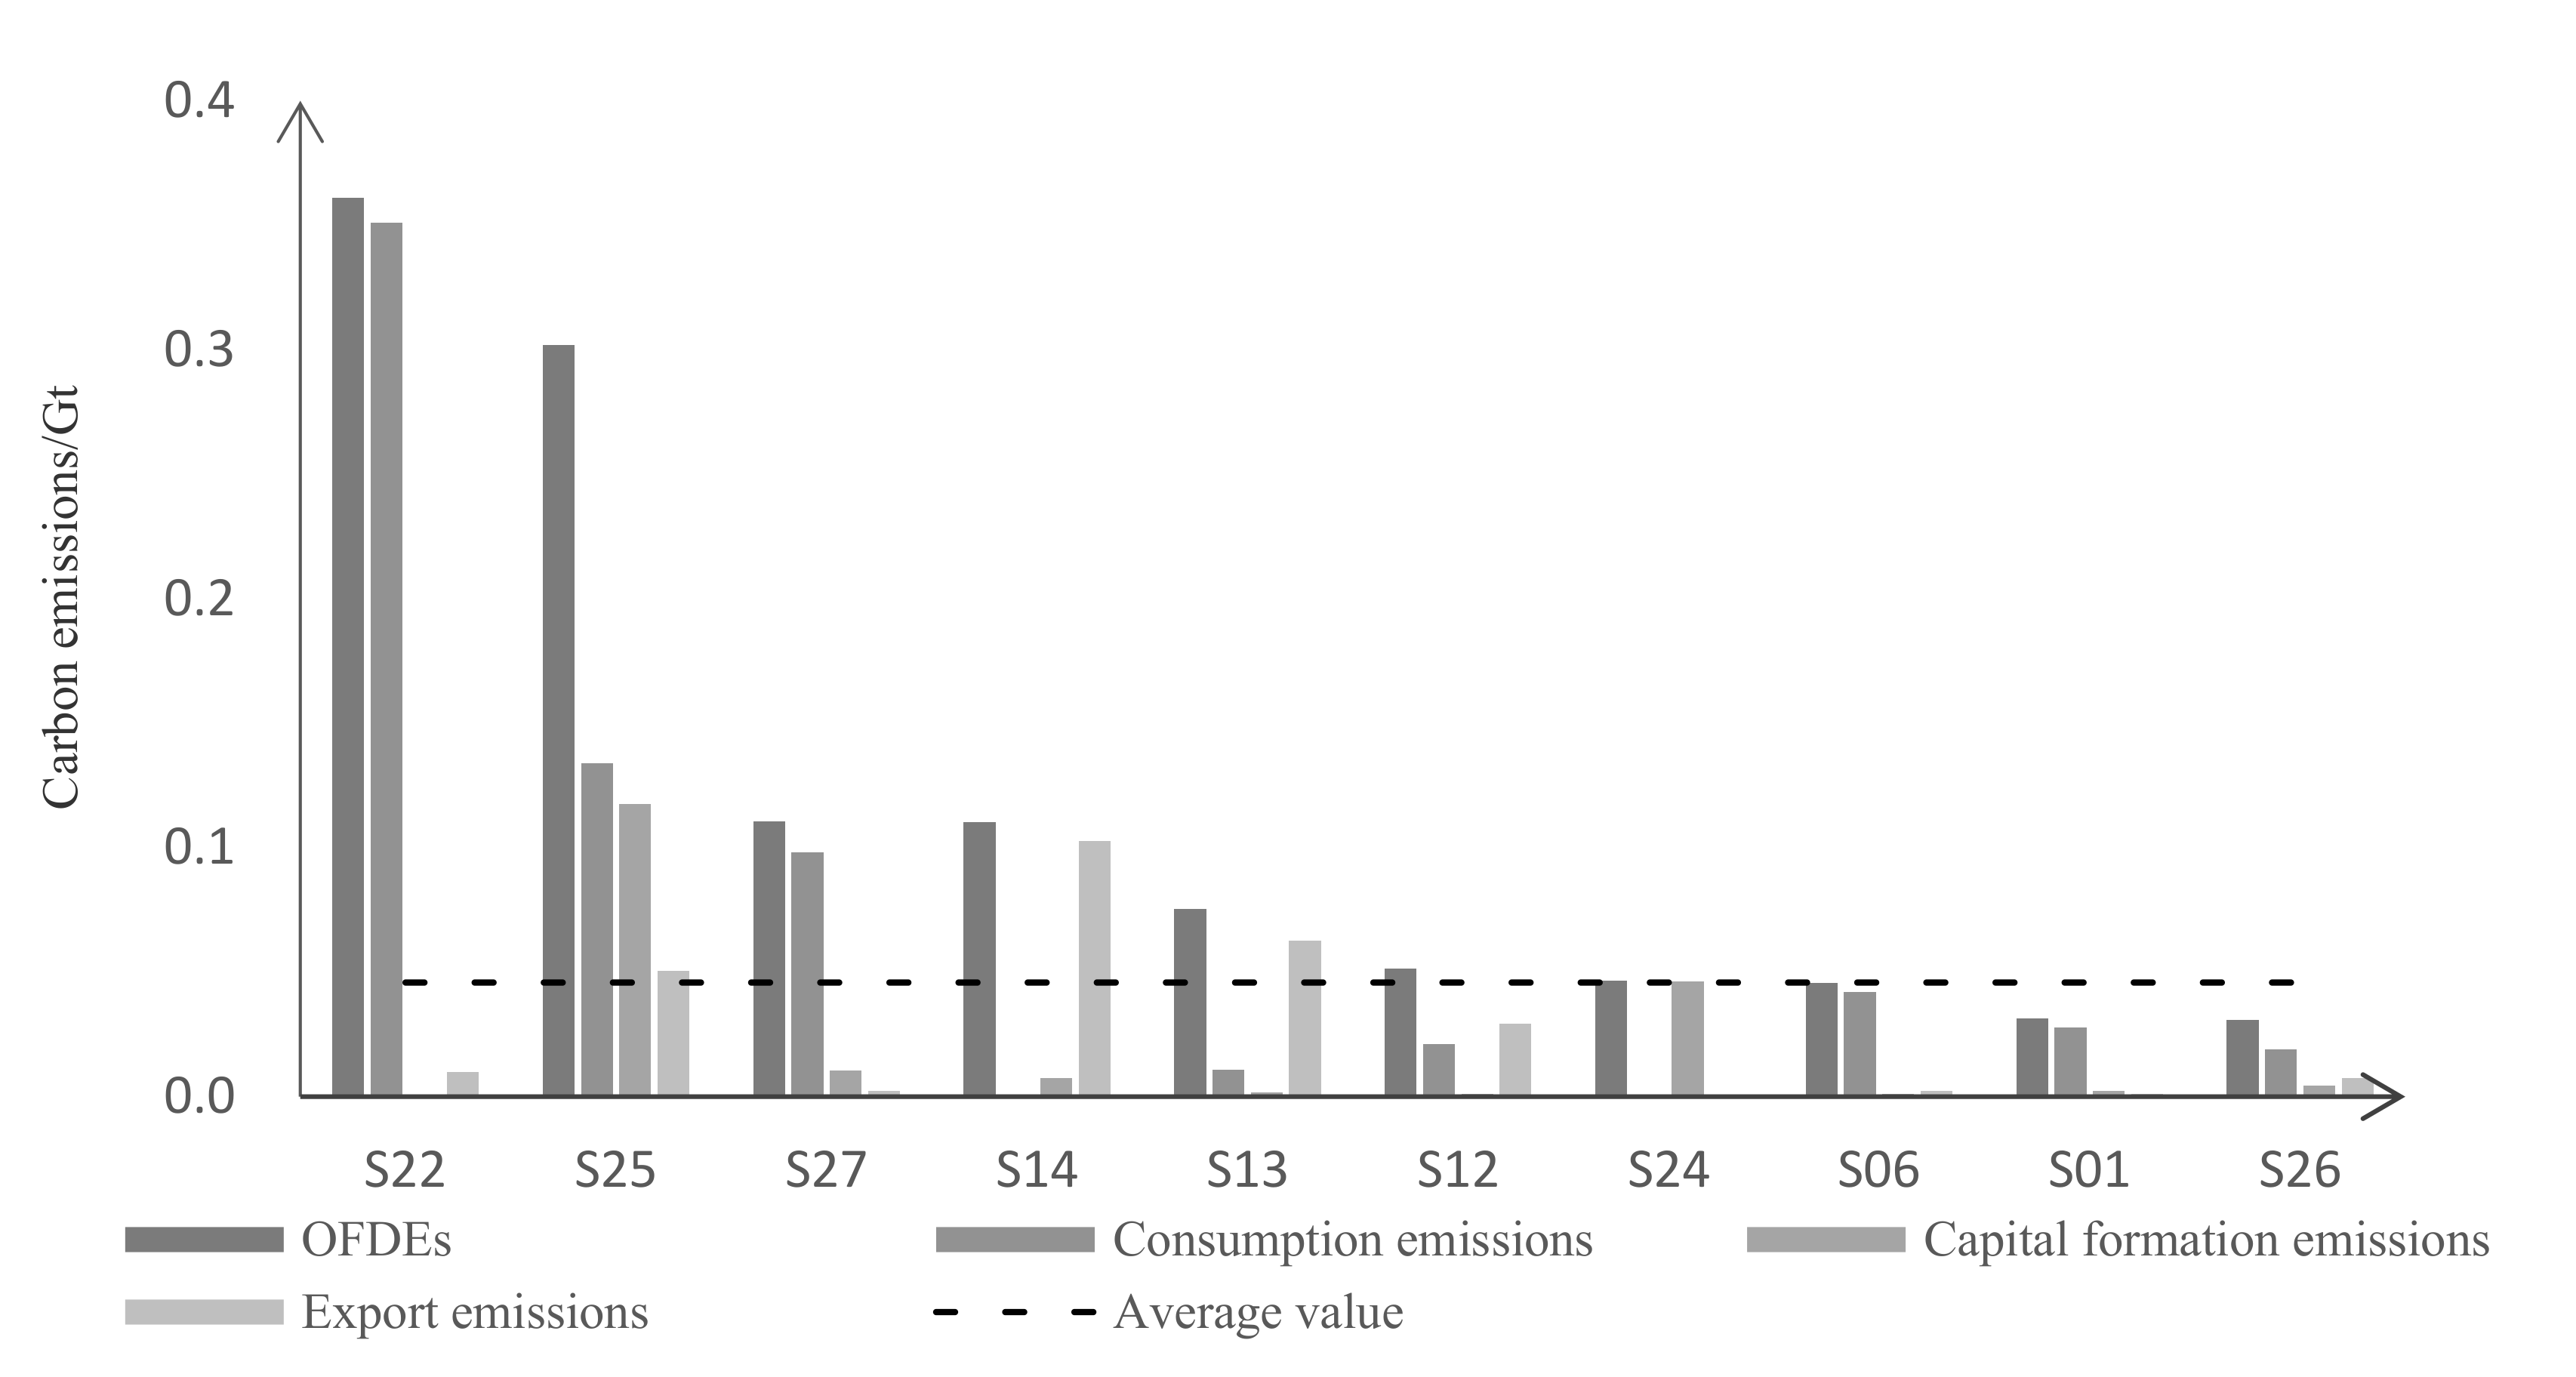
- When OFDE is more than the average of OFDE, these sectors are called the major sectors of own final demand emissions, and the social final demand mainly causes these sectors’ emissions.
3.2. Changes in Sectors’ Emission Effects
3.3. The Driving Relationship of Emissions among Sectors
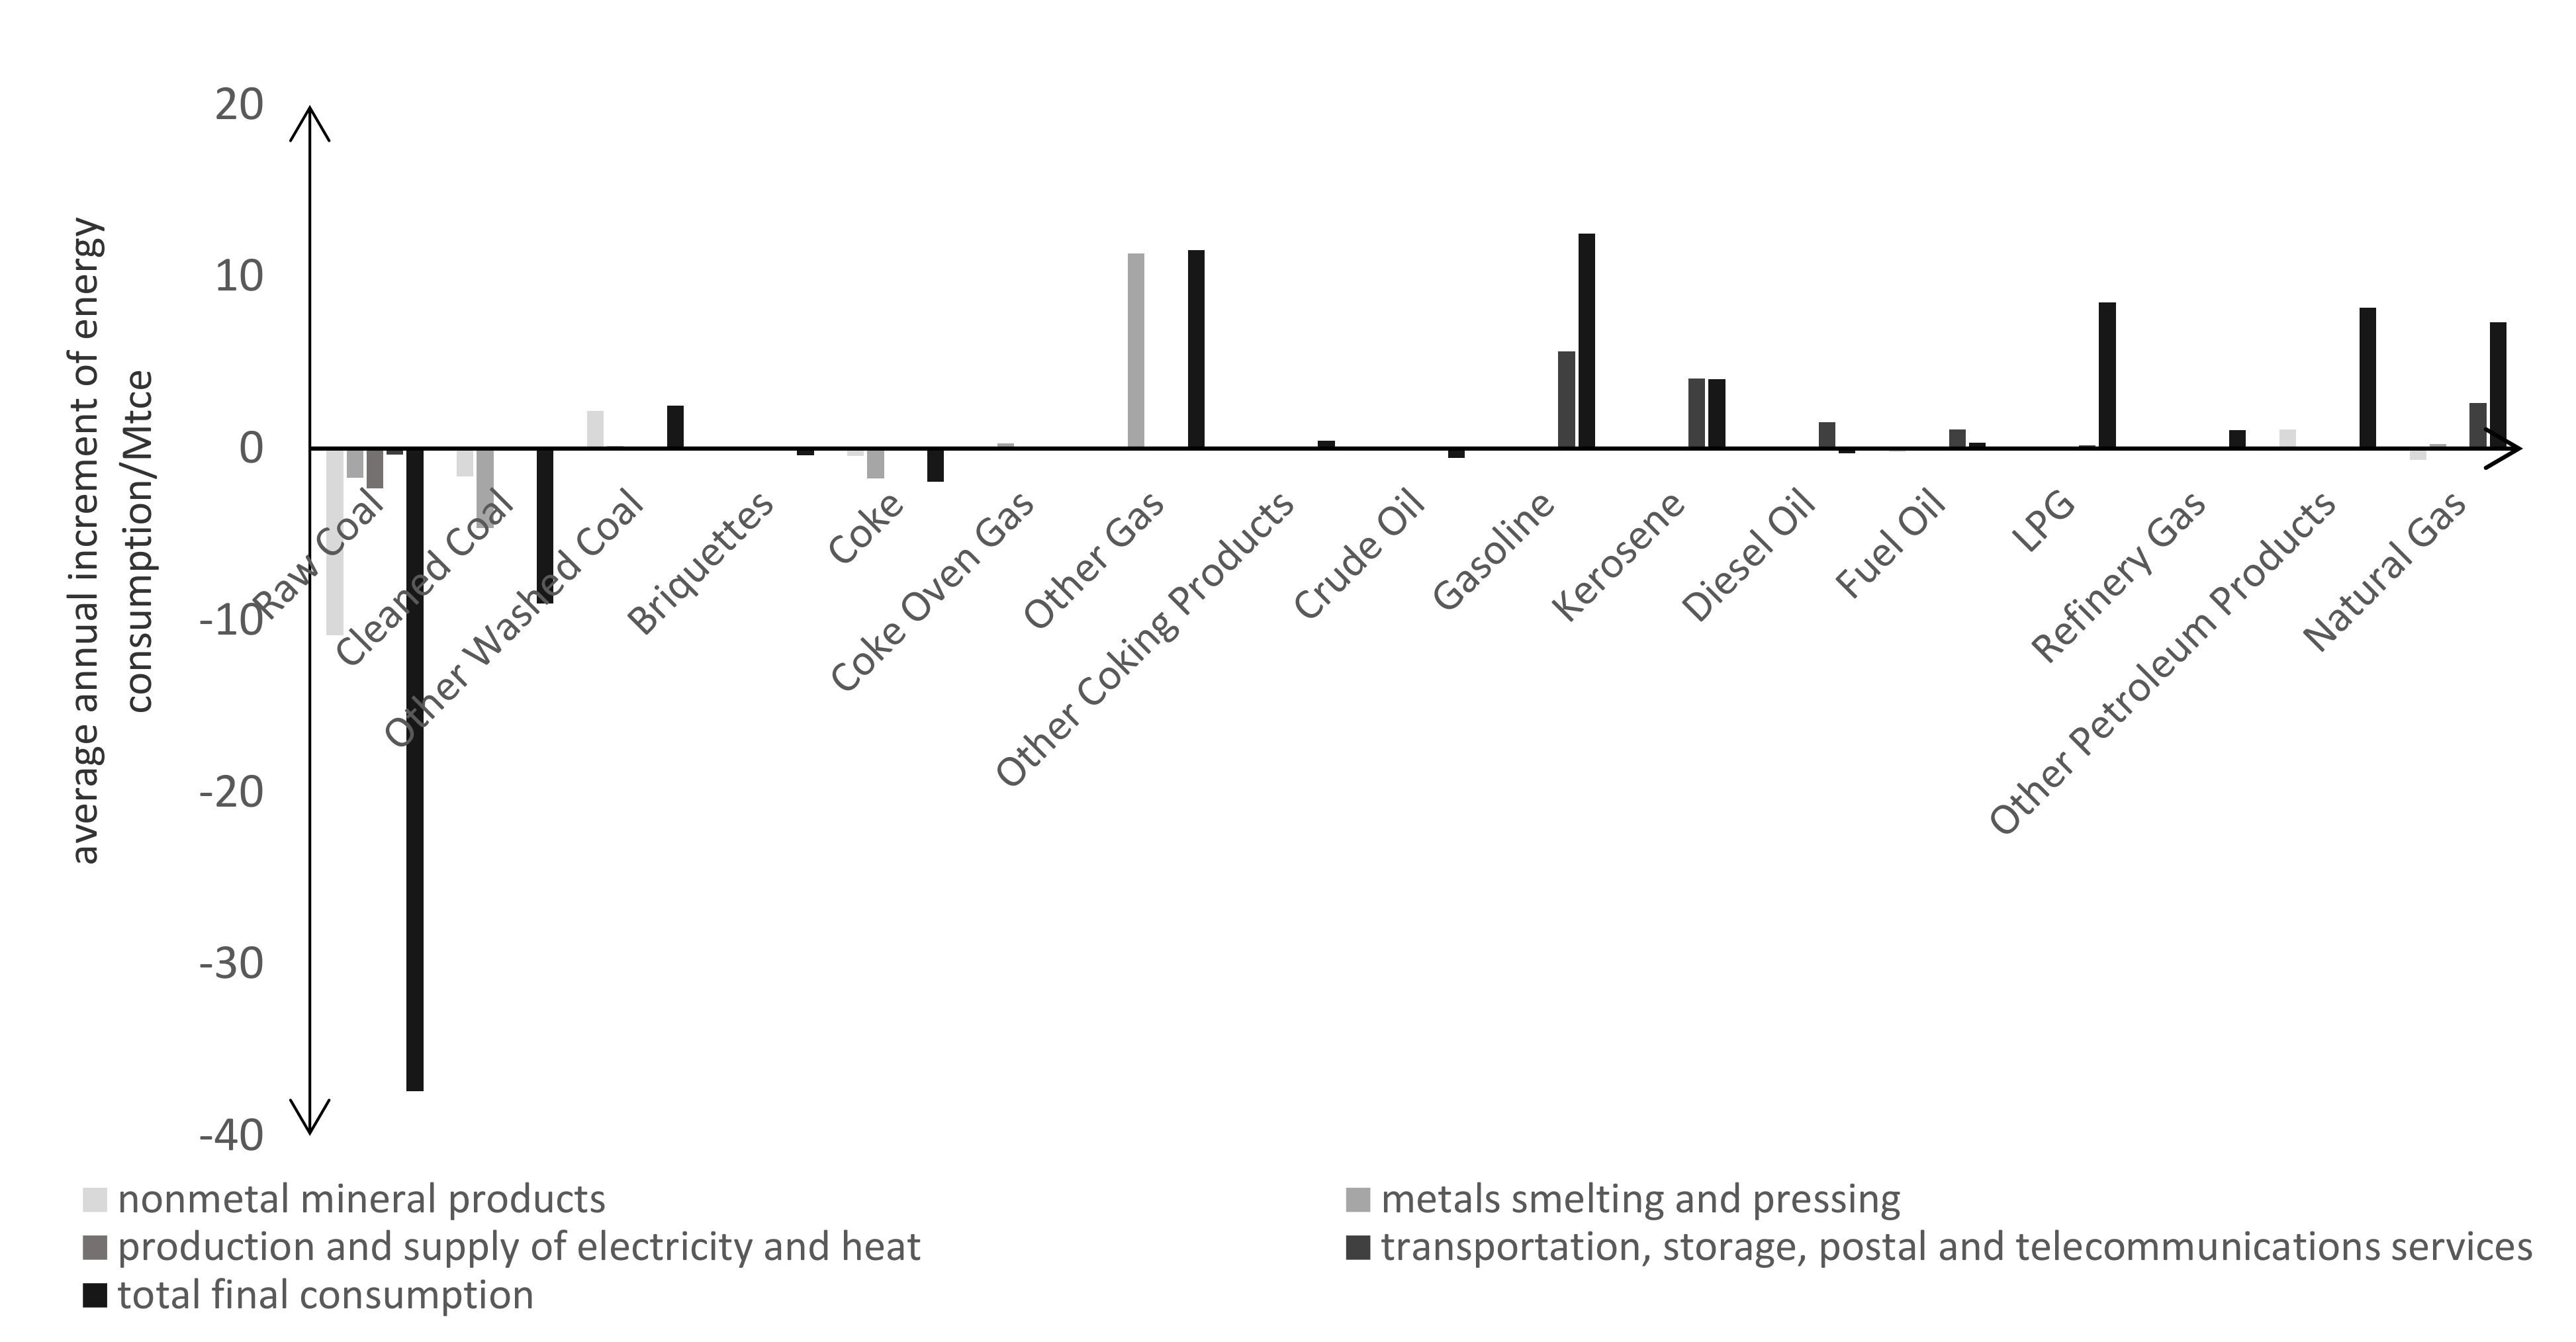
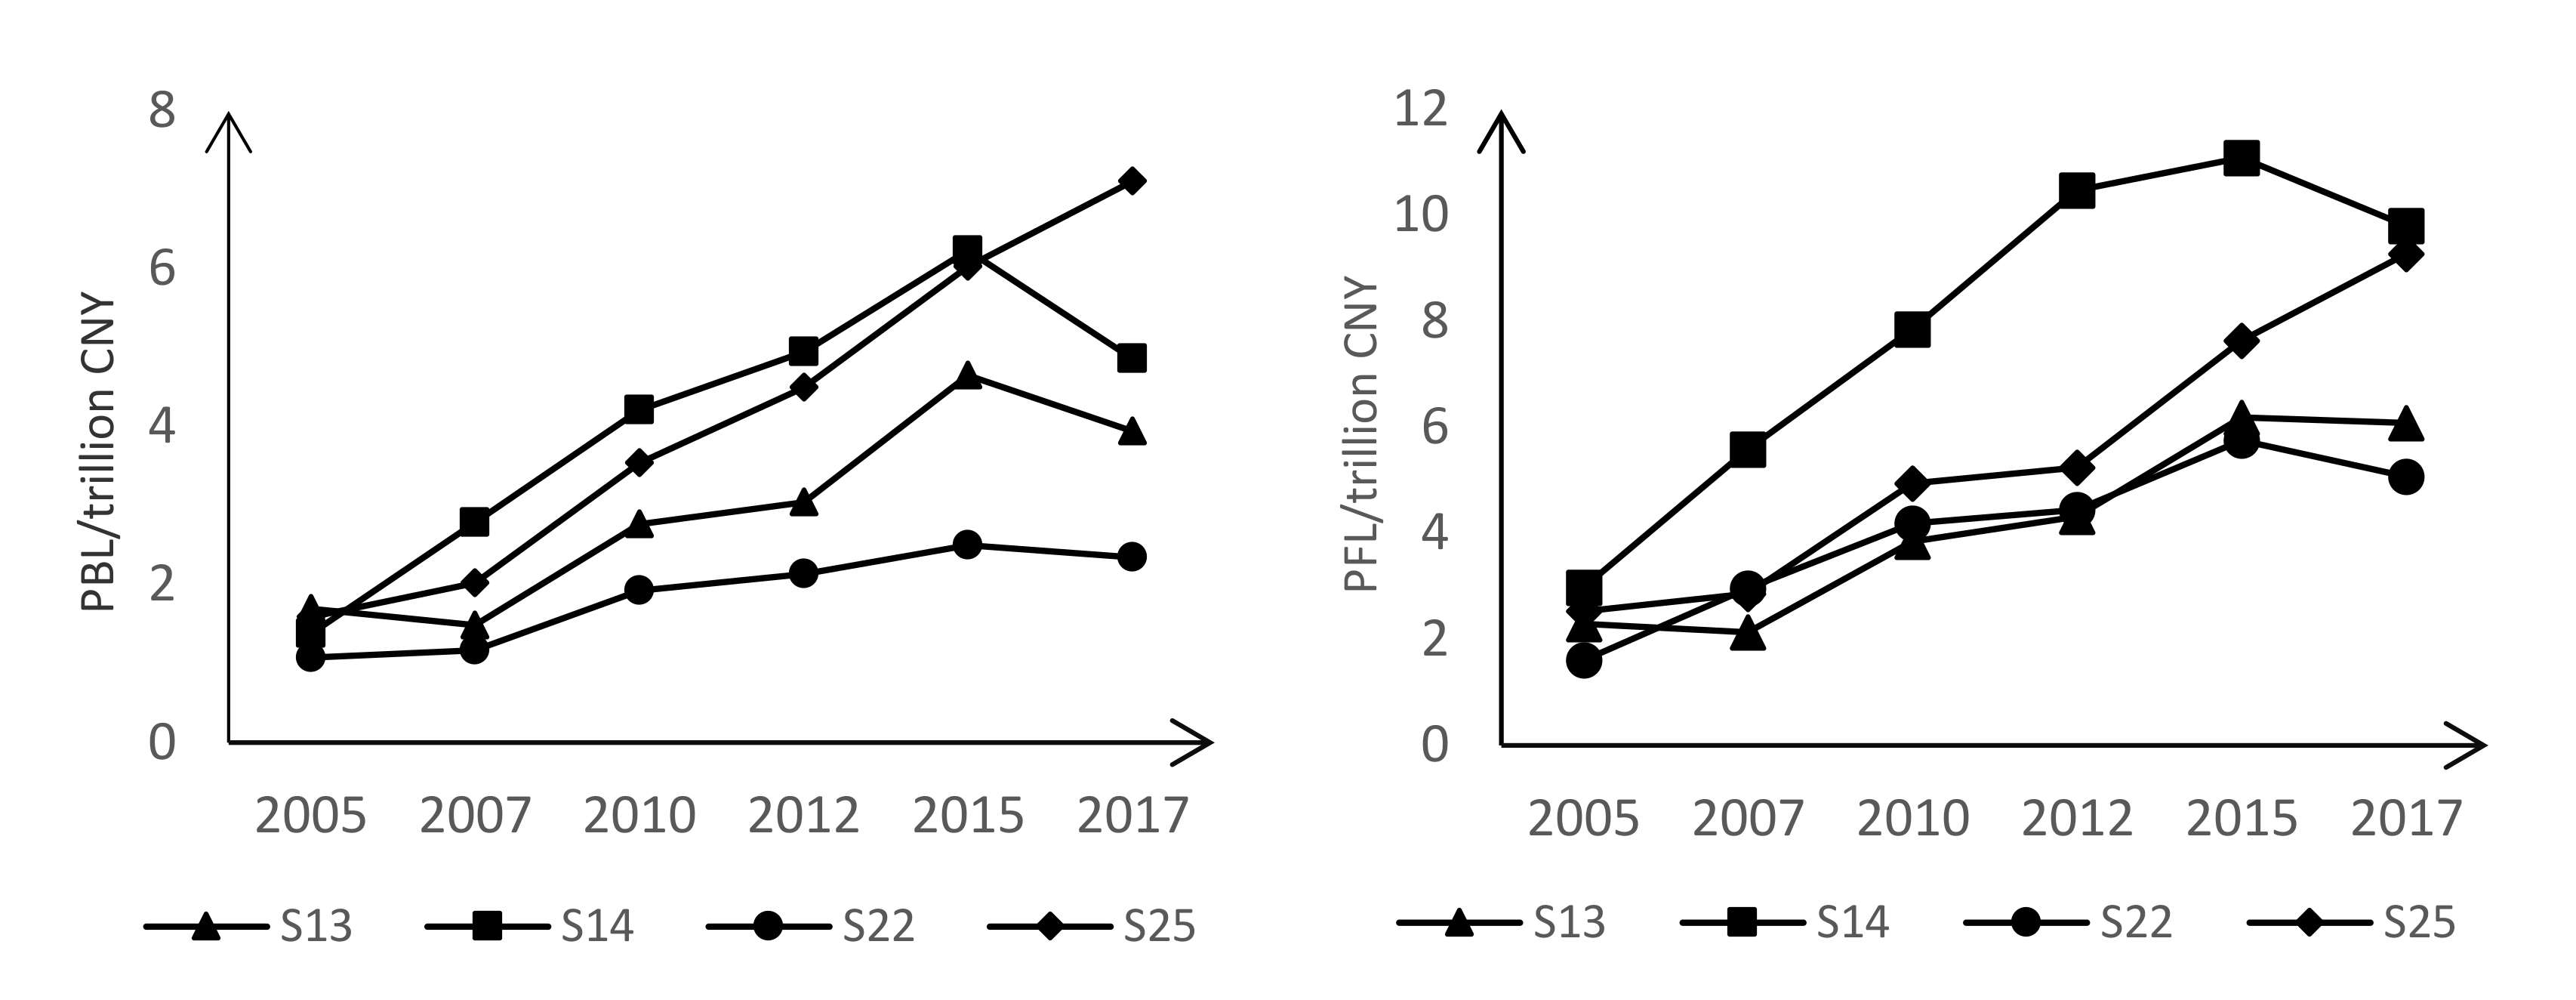
3.4. The Impact of Major Emission Paths’ Changes On the Emissions Per GDP and Energy Mix
3.5. Policy Recommendations
4. Conclusions
Author Contributions
Funding
Acknowledgments
Conflicts of Interest
References
- Liu, Z.; Guan, D.; Wei, W.; Davis, S.J.; Ciais, P.; Bai, J.; Peng, S.; Zhang, Q.; Vogt-Schilb, A.; Marland, G.; et al. Reduced carbon emission estimates from fossil fuel combustion and cement production in China. Nature 2015, 524, 335–338. [Google Scholar] [CrossRef] [PubMed]
- Shan, Y.; Huang, Q.; Guan, D.; Klaus, H. China CO2 emission accounts 2016–2017. Sci. Data 2020, 7, 1–9. [Google Scholar] [CrossRef]
- 2050 China Energy and CO2 Emissions Research Group. 2050 China Energy and CO2 Emissions Report; Science Press: Beijing, China, 2009. [Google Scholar]
- Mu, Y.; Wang, C.; Cai, W. The economic impact of China’s INDC: Distinguishing the roles of the renewable energy quota and the carbon market. Renew. Sustain. Energy Rev. 2018, 81, 2955–2966. [Google Scholar] [CrossRef]
- Xie, X.; Shao, S.; Lin, B. Exploring the driving forces and mitigation pathways of CO2 emissions in China’s petroleum refining and coking industry: 1995–2031. Appl. Energy 2016, 184, 1004–1015. [Google Scholar] [CrossRef]
- Martin, R.; Muûls, M.; Wagner, U.J. The impact of the EU ETS on regulated firms: What is the evidence after ten years? Rev. Environ. Econ. Policy 2016, 10, 129–148. [Google Scholar] [CrossRef]
- Oestreich, A.M.; Tsiakas, I. Carbon emissions and stock returns: Evidence from the EU Emissions Trading Scheme. J. Bank. Financ. 2015, 58, 294–308. [Google Scholar] [CrossRef]
- Liu, Y.; Tan, X.J.; Yu, Y.; Qi, S.Z. Assessment of impacts of Hubei Pilot emission trading schemes in China—A CGE-analysis using Term CO2 model. Appl. Energy 2017, 189, 762–769. [Google Scholar] [CrossRef]
- Xian, Y.; Wang, K.; Wei, Y.-M.; Huang, Z. Would China’s power industry benefit from nationwide carbon emission permit trading? An optimization model-based ex post analysis on abatement cost savings. Appl. Energy 2019, 235, 978–986. [Google Scholar] [CrossRef]
- Lin, B.; Jia, Z. What are the main factors affecting carbon price in Emission Trading Scheme? A case study in China. Sci. Total Environ. 2019, 654, 525–534. [Google Scholar] [CrossRef]
- Lin, B.; Jia, Z. Is emission trading scheme an opportunity for renewable energy in China? A perspective of ETS revenue redistributions. Appl. Energy 2020, 263, 978–986. [Google Scholar] [CrossRef]
- Shen, L.; Lou, Y.; Huang, Y.; Chen, J. A driving–driven perspective on the key carbon emission sectors in China. Nat. Hazards 2018, 93, 349–371. [Google Scholar] [CrossRef]
- Sun, J.; Chen, Z.; Zhao, R.; Huang, X.; Lai, L. Research on carbon emission footprint of China based on input–output model. China Popul. Resour. Environ. 2010, 20, 28–34. (In Chinese) [Google Scholar]
- Zhang, Q.; Nakatani, J.; Moriguchi, Y. Compilation of an Embodied CO2 Emission Inventory for China Using 135-Sector Input–Output Tables. Sustainability 2015, 7, 8223–8239. [Google Scholar] [CrossRef]
- Alcantara, V.; Padilla, E. “Key” sectors in final energy consumption: An input–output application to the Spanish case. Energy Policy 2003, 31, 1673–1678. [Google Scholar] [CrossRef]
- Piaggio, M.; Alcantara, V.; Padilla, E. Greenhouse gas emissions and economic structure in Uruguay. Econ. Syst. Res. 2014, 26, 155–176. [Google Scholar] [CrossRef]
- Guo, J.; Zhang, J.; Zhang, K.-B. The key sectors for energy conservation and carbon emissions reduction in China: Evidence from the input–output method. J. Clean. Prod. 2018, 179, 180–190. [Google Scholar] [CrossRef]
- Alcántara, V.; Padilla, E. An input–output analysis of the “key” sectors in CO2 emissions from a production perspective: An application to the Spanish economy. Work. Pap. 2006, 1, 1–21. [Google Scholar]
- Othman, J.; Jafari, Y. Identification of the key sectors that produce CO2 emissions in Malaysia: Application of input–output analysis. Carbon Manag. 2016, 7, 1–28. [Google Scholar] [CrossRef]
- Heimler, A. Linkages and Vertical Integration in the Chinese Economy. Rev. Econ. Stat. 1991, 73, 261–267. [Google Scholar] [CrossRef]
- Wen, W.; Wang, Q. Identification of key sectors and key provinces at the view of CO2 reduction and economic growth in China: Linkage analyses based on the MRIO model. Ecol. Indic. 2019, 96, 1–15. [Google Scholar] [CrossRef]
- Alcantara, V.; Del Río, P.; Hernández, F. Structural analysis of electricity consumption by productive sectors. The Spanish case. Energy 2010, 35, 2088–2098. [Google Scholar] [CrossRef]
- Qian, M.; Lu, Z.; Wang, J. Analysis of carbon propagation effects of industrial sectors. China Popul. Resour. Environ. 2014, 24, 82–88. (In Chinese) [Google Scholar]
- Alcántara, V.; Padilla, E. Key sectors in greenhouse gas emissions in Spain: An alternative input–output analysis. J. Ind. Ecol. 2019. [Google Scholar] [CrossRef]
- Milana, C. Direct and indirect requirements for gross output in input–output analysis. Metroeconomica 1985, 37, 283–292. [Google Scholar] [CrossRef]
- Miyazawa, K. Internal and external matrix multipliers in the input–output model. Hitotsubashi J. Econ. 1966, 7, 38–55. [Google Scholar]
- National Bureau of Statistics of China (NBS). China Statistical Yearbook. Available online: https://www.stats.gov.cn/english/Statisticaldata/AnnualData/ (accessed on 3 May 2020).
- China Emission Accounts and Datasets (CEADs). Available online: http://www.ceads.net/data/ (accessed on 13 June 2020).
- Hu, Q. Input Output Analysis; Tsinghua University Press: Beijing, China, 2019; p. 42. [Google Scholar]
- Yang, Q.; Zhang, L.; Zou, S.; Zhang, J. Intertemporal optimization of the coal production capacity in China in terms of uncertain demand, economy, environment, and energy security. Energy Policy 2020, 139, 1–12. [Google Scholar] [CrossRef]
- Zuo, W.; Li, Y.; Wang, Y. Research on the optimization of new energy vehicle industry research and development subsidy about generic technology based on the three-way decisions. J. Clean. Prod. 2019, 212, 46–55. [Google Scholar] [CrossRef]
- Sonis, M.; Guilhoto, J.J.M.; Hewings, G.J.; Martins, E.B. Linkages, key sectors, and structural change: Some new perspectives. Dev. Econ. 1995, 33, 243–246. [Google Scholar] [CrossRef]
- Liu, R.; Xiao, H.; Guan, S.; Zhang, J.; Yao, D. Technology and method for applying biochar in building materials to evidently improve the carbon capture ability. J. Clean. Prod. 2020, 273, 1–15. [Google Scholar] [CrossRef]


| Symbol | Sector | Symbol | Sector |
|---|---|---|---|
| S01 | farming, forestry, animal husbandry, fishery, and water conservancy | S15 | metal products |
| S02 | coal mining and dressing | S16 | equipment for general and special purposes |
| S03 | petroleum and natural gas extraction | S17 | transportation equipment |
| S04 | metals mining and dressing | S18 | electric equipment and machinery |
| S05 | nonmetal and other minerals mining and dressing | S19 | electronic and telecommunications equipment |
| S06 | food and tobacco | S20 | instruments, meters, cultural, and office machinery |
| S07 | textile industry | S21 | craft and other manufacturing industry |
| S08 | garments, leather, furs, and related products | S22 | production and supply of electricity and heat |
| S09 | timber processing and furniture manufacturing | S23 | production and supply of gas and water |
| S10 | printing, and cultural, educational, and sports articles | S24 | construction |
| S11 | petroleum processing and coking | S25 | transportation, storage, postal, and telecommunications services |
| S12 | chemical products | S26 | wholesale, retail trade, lodging, and catering services |
| S13 | nonmetal mineral products | S27 | other services |
| S14 | metals smelting and pressing | □ |
| □ | □ | BEs | PCT | FEs | PCT | OFDEs | PCT | Direct Emissions | PCT |
|---|---|---|---|---|---|---|---|---|---|
| Overall key emission sectors | □ | □ | □ | □ | □ | □ | □ | □ | |
| S14 | Metals smelting and pressing | 0.63 | 8.3% | 1.63 | 21.3% | 0.11 | 8.9% | 1.74 | 19.5% |
| S13 | Nonmetal mineral products | 0.43 | 5.6% | 1.10 | 14.3% | 0.08 | 6.1% | 1.17 | 13.2% |
| □ | Total | 1.06 | 13.9% | 2.73 | 35.6% | 0.19 | 15.0% | 2.91 | 32.7% |
| Forward-emission-dominant sectors | □ | □ | □ | □ | □ | □ | □ | □ | |
| S22 | Production and supply of electricity and heat | 0.04 | 0.6% | 3.78 | 49.4% | 0.36 | 29.2% | 4.14 | 46.6% |
| S25 | Transportation, storage, postal and telecommunications services | 0.25 | 3.2% | 0.42 | 5.5% | 0.30 | 24.4% | 0.72 | 8.1% |
| Total | 0.29 | 3.8% | 4.20 | 54.9% | 0.66 | 53.6% | 4.86 | 54.7% | |
| Backward-emission-dominant sectors | □ | □ | □ | □ | □ | □ | □ | □ | |
| S24 | Construction | 1.81 | 23.6% | 0.00 | 0.0% | 0.05 | 3.8% | 0.05 | 0.5% |
| S12 | Chemical products | 0.69 | 9.0% | 0.21 | 2.7% | 0.05 | 4.2% | 0.26 | 2.9% |
| S27 | Other services | 0.56 | 7.4% | 0.06 | 0.8% | 0.11 | 8.9% | 0.17 | 1.9% |
| S15 | Metal products | 0.50 | 6.5% | 0.01 | 0.1% | 0.00 | 0.2% | 0.01 | 0.1% |
| S18 | Electric equipment and machinery | 0.40 | 5.3% | 0.00 | 0.0% | 0.00 | 0.1% | 0.00 | 0.0% |
| S16 | Equipment for general and special purposes | 0.37 | 4.8% | 0.01 | 0.1% | 0.02 | 1.3% | 0.03 | 0.3% |
| Total | 4.33 | 56.5% | 0.29 | 3.7% | 0.23 | 18.5% | 0.53 | 5.8% | |
| Other sectors | □ | □ | □ | □ | □ | □ | □ | □ | |
| □ | Other sectors | 1.98 | 25.9% | 0.44 | 5.8% | 0.16 | 12.9% | 0.60 | 6.8% |
| Year | 2005 | 2007 | 2010 | 2012 | 2015 | 2017 |
|---|---|---|---|---|---|---|
| Sector | □ | □ | □ | □ | □ | □ |
| S01 | ⬜ | ⬜ | ⬜ | ⬜ | ⬜ | ⬜ |
| S02 | ⬜ | ⬜ | ⬜ | ⬜ | ⬜ | ⬜ |
| S03 | ⬜ | ⬜ | ⬜ | ⬜ | ⬜ | ⬜ |
| S04 | ⬜ | ⬜ | ⬜ | ⬜ | ⬜ | ⬜ |
| S05 | ⬜ | ⬜ | ⬜ | ⬜ | ⬜ | ⬜ |
| S06 | ⬜◯ | ⬜◯ | ⬜◯ | ⬜◯ | ⬜◯ | ⬜ |
| S07 | ⬜ | ⬜ | ⬜ | ⬜ | ⬜ | ⬜ |
| S08 | ⬜ | ⬜ | ⬜ | ⬜ | ⬜ | ⬜ |
| S09 | ⬜ | ⬜ | ⬜ | ⬜ | ⬜ | ⬜ |
| S10 | ⬜ | ⬜ | ⬜ | ⬜ | ⬜ | ⬜ |
| S11 | ⬜ | ⬜ | ⬜ | ⬜ | ⬜ | ⬜ |
| S12 | ▲◯ | ⬤◯ | ▲◯ | ▲◯ | ▲◯ | ▲◯ |
| S13 | ⬤◯ | ⬤◯ | ⬤◯ | ⬤◯ | ⬤◯ | ⬤◯ |
| S14 | ⬤◯ | ⬤◯ | ⬤◯ | ⬤◯ | ⬤◯ | ⬤◯ |
| S15 | ▲ | ▲ | ▲ | ▲ | ▲ | ▲ |
| S16 | ▲ | ▲ | ▲ | ▲ | ▲ | ▲ |
| S17 | ⬜ | ⬜ | ▲ | ▲ | ⬜ | ⬜ |
| S18 | ▲ | ▲ | ▲ | ▲ | ▲ | ▲ |
| S19 | ▲ | ⬜ | ⬜ | ⬜ | ⬜ | ⬜ |
| S20 | ⬜ | ⬜ | ⬜ | ⬜ | ⬜ | ⬜ |
| S21 | ⬜ | ⬜ | ⬜ | ⬜ | ⬜ | ⬜ |
| S22 | ⯆◯ | ⯆◯ | ⯆◯ | ⯆◯ | ⯆◯ | ⯆◯ |
| S23 | ⬜ | ⬜ | ⬜ | ⬜ | ⬜ | ⬜ |
| S24 | ▲ | ▲ | ▲ | ▲ | ▲ | ▲◯ |
| S25 | ⯆◯ | ⯆◯ | ⯆◯ | ⯆◯ | ⯆◯ | ⯆◯ |
| S26 | ▲ | ⬜ | ⬜ | ⬜ | ⬜ | ⬜ |
| S27 | ▲◯ | ▲◯ | ▲◯ | ▲◯ | ▲◯ | ▲◯ |
| Year | 2005–2012 | 2012–2017 | ||||
|---|---|---|---|---|---|---|
| Effect Type | BEs | FEs | OFDEs | BEs | FEs | OFDEs |
| Sector | ||||||
| S01 | 7.59 | 1.38 | 0.30 | −2.37 | 3.13 | 0.27 |
| S02 | −1.21 | 8.15 | 0.66 | −7.43 | −11.04 | −0.42 |
| S03 | 1.34 | 2.94 | 0.07 | −9.51 | −0.57 | −0.06 |
| S04 | 14.07 | 1.33 | −0.22 | −10.45 | −1.80 | −0.01 |
| S05 | 4.66 | 0.13 | 0.00 | 1.29 | −1.54 | 0.00 |
| S06 | 10.77 | 2.06 | 1.13 | 5.85 | −2.86 | −2.76 |
| S07 | 4.37 | 0.51 | −1.65 | −3.29 | −2.70 | −1.05 |
| S08 | 1.84 | 0.13 | 0.08 | −0.42 | −0.19 | −0.99 |
| S09 | 4.07 | −0.03 | 0.33 | 0.69 | −0.80 | −0.79 |
| S10 | 9.43 | −4.07 | −0.55 | 0.56 | −2.40 | −1.65 |
| S11 | 11.72 | 7.57 | 1.21 | −7.21 | −1.46 | 0.60 |
| S12 | 56.02 | 12.74 | 3.37 | −9.23 | −6.02 | −1.40 |
| S13 | 14.73 | 73.16 | 0.42 | 5.71 | −12.33 | −5.37 |
| S14 | 56.43 | 109.75 | 4.55 | −12.89 | −4.61 | 1.92 |
| S15 | 31.18 | 0.79 | 0.08 | 10.83 | −1.11 | −0.54 |
| S16 | 20.33 | −0.11 | 1.00 | −22.88 | −0.94 | −3.13 |
| S17 | 20.36 | −0.17 | 1.29 | −3.87 | −0.36 | −1.98 |
| S18 | 27.13 | 0.03 | 0.13 | −5.96 | −0.54 | −0.62 |
| S19 | 1.09 | 0.05 | −0.05 | 8.36 | −0.01 | −0.11 |
| S20 | −0.98 | −0.54 | −1.55 | 0.89 | −0.06 | −0.06 |
| S21 | −0.14 | 0.26 | −0.11 | 0.47 | −0.30 | −0.01 |
| S22 | 1.64 | 234.92 | 18.63 | −5.76 | 52.70 | 3.35 |
| S23 | 1.68 | −0.52 | −0.14 | 1.52 | −0.10 | −0.14 |
| S24 | 154.74 | −0.13 | 1.36 | 27.28 | −0.15 | 1.87 |
| S25 | 4.71 | 13.69 | 17.41 | 14.83 | 14.83 | 14.56 |
| S26 | −1.44 | 1.53 | 1.73 | 12.91 | 1.77 | −1.12 |
| S27 | 13.39 | 3.96 | 4.03 | 31.10 | 0.47 | 2.04 |
| Year | 2005 | 2007 | 2010 | 2012 | 2015 | 2017 |
|---|---|---|---|---|---|---|
| Sector | ||||||
| S01 | 0.00 | 0.00 | 0.00 | 0.00 | 0.00 | 0.00 |
| S02 | 0.01 | 0.01 | 0.02 | 0.01 | 0.01 | 0.01 |
| S03 | 0.00 | 0.00 | 0.00 | 0.00 | 0.00 | 0.00 |
| S04 | 0.00 | 0.00 | 0.00 | 0.00 | 0.00 | 0.00 |
| S05 | 0.01 | 0.01 | 0.01 | 0.01 | 0.01 | 0.01 |
| S06 | 0.00 | 0.00 | 0.00 | 0.00 | 0.00 | 0.00 |
| S07 | 0.00 | 0.00 | 0.00 | 0.00 | 0.00 | 0.00 |
| S08 | 0.00 | 0.00 | 0.00 | 0.00 | 0.00 | 0.00 |
| S09 | 0.00 | 0.00 | 0.00 | 0.00 | 0.00 | 0.00 |
| S10 | 0.00 | 0.00 | 0.00 | 0.00 | 0.00 | 0.00 |
| S11 | 0.00 | 0.00 | 0.01 | 0.01 | 0.01 | 0.01 |
| S12 | 0.03 | 0.01 | 0.01 | 0.01 | 0.02 | 0.01 |
| S13 | 0.00 | 0.00 | 0.00 | 0.00 | 0.00 | 0.00 |
| S14 | 0.02 | 0.01 | 0.03 | 0.02 | 0.03 | 0.04 |
| S15 | 0.00 | 0.00 | 0.00 | 0.00 | 0.00 | 0.00 |
| S16 | 0.00 | 0.00 | 0.00 | 0.00 | 0.00 | 0.00 |
| S17 | 0.00 | 0.00 | 0.00 | 0.00 | 0.00 | 0.00 |
| S18 | 0.00 | 0.00 | 0.00 | 0.00 | 0.00 | 0.00 |
| S19 | 0.00 | 0.00 | 0.00 | 0.00 | 0.00 | 0.00 |
| S20 | 0.00 | 0.00 | 0.00 | 0.00 | 0.00 | 0.00 |
| S21 | 0.00 | 0.00 | 0.00 | 0.00 | 0.00 | 0.00 |
| S22 | 0.20 | 0.18 | 0.27 | 0.31 | 0.30 | 0.34 |
| S23 | 0.00 | 0.00 | 0.00 | 0.00 | 0.00 | 0.00 |
| S24 | 0.00 | 0.00 | 0.00 | 0.00 | 0.00 | 0.00 |
| S25 | 0.02 | 0.01 | 0.01 | 0.01 | 0.02 | 0.01 |
| S26 | 0.00 | 0.00 | 0.00 | 0.00 | 0.00 | 0.00 |
| S27 | 0.00 | 0.00 | 0.00 | 0.00 | 0.00 | 0.00 |
Publisher’s Note: MDPI stays neutral with regard to jurisdictional claims in published maps and institutional affiliations. |
© 2020 by the authors. Licensee MDPI, Basel, Switzerland. This article is an open access article distributed under the terms and conditions of the Creative Commons Attribution (CC BY) license (http://creativecommons.org/licenses/by/4.0/).
Share and Cite
Yuan, Y.; Wang, Y.; Chi, Y.; Jin, F. Identification of Key Carbon Emission Sectors and Analysis of Emission Effects in China. Sustainability 2020, 12, 8673. https://doi.org/10.3390/su12208673
Yuan Y, Wang Y, Chi Y, Jin F. Identification of Key Carbon Emission Sectors and Analysis of Emission Effects in China. Sustainability. 2020; 12(20):8673. https://doi.org/10.3390/su12208673
Chicago/Turabian StyleYuan, Yongke, Yixing Wang, Yuanying Chi, and Feng Jin. 2020. "Identification of Key Carbon Emission Sectors and Analysis of Emission Effects in China" Sustainability 12, no. 20: 8673. https://doi.org/10.3390/su12208673
APA StyleYuan, Y., Wang, Y., Chi, Y., & Jin, F. (2020). Identification of Key Carbon Emission Sectors and Analysis of Emission Effects in China. Sustainability, 12(20), 8673. https://doi.org/10.3390/su12208673