Strengthening Urban-Rural Resource Flow through Regional Circular and Ecological Sphere (R-CES) Approach in Nagpur, India


Abstract
:1. Introduction
2. Literature Review
2.1. Overview of the Urban-Rural Linkages Concept
2.2. Urban–Rural Resource Flows and Assessment Methods
2.3. Concept of Regional Circular and Ecological Sphere (R-CES)
3. Materials and Methods
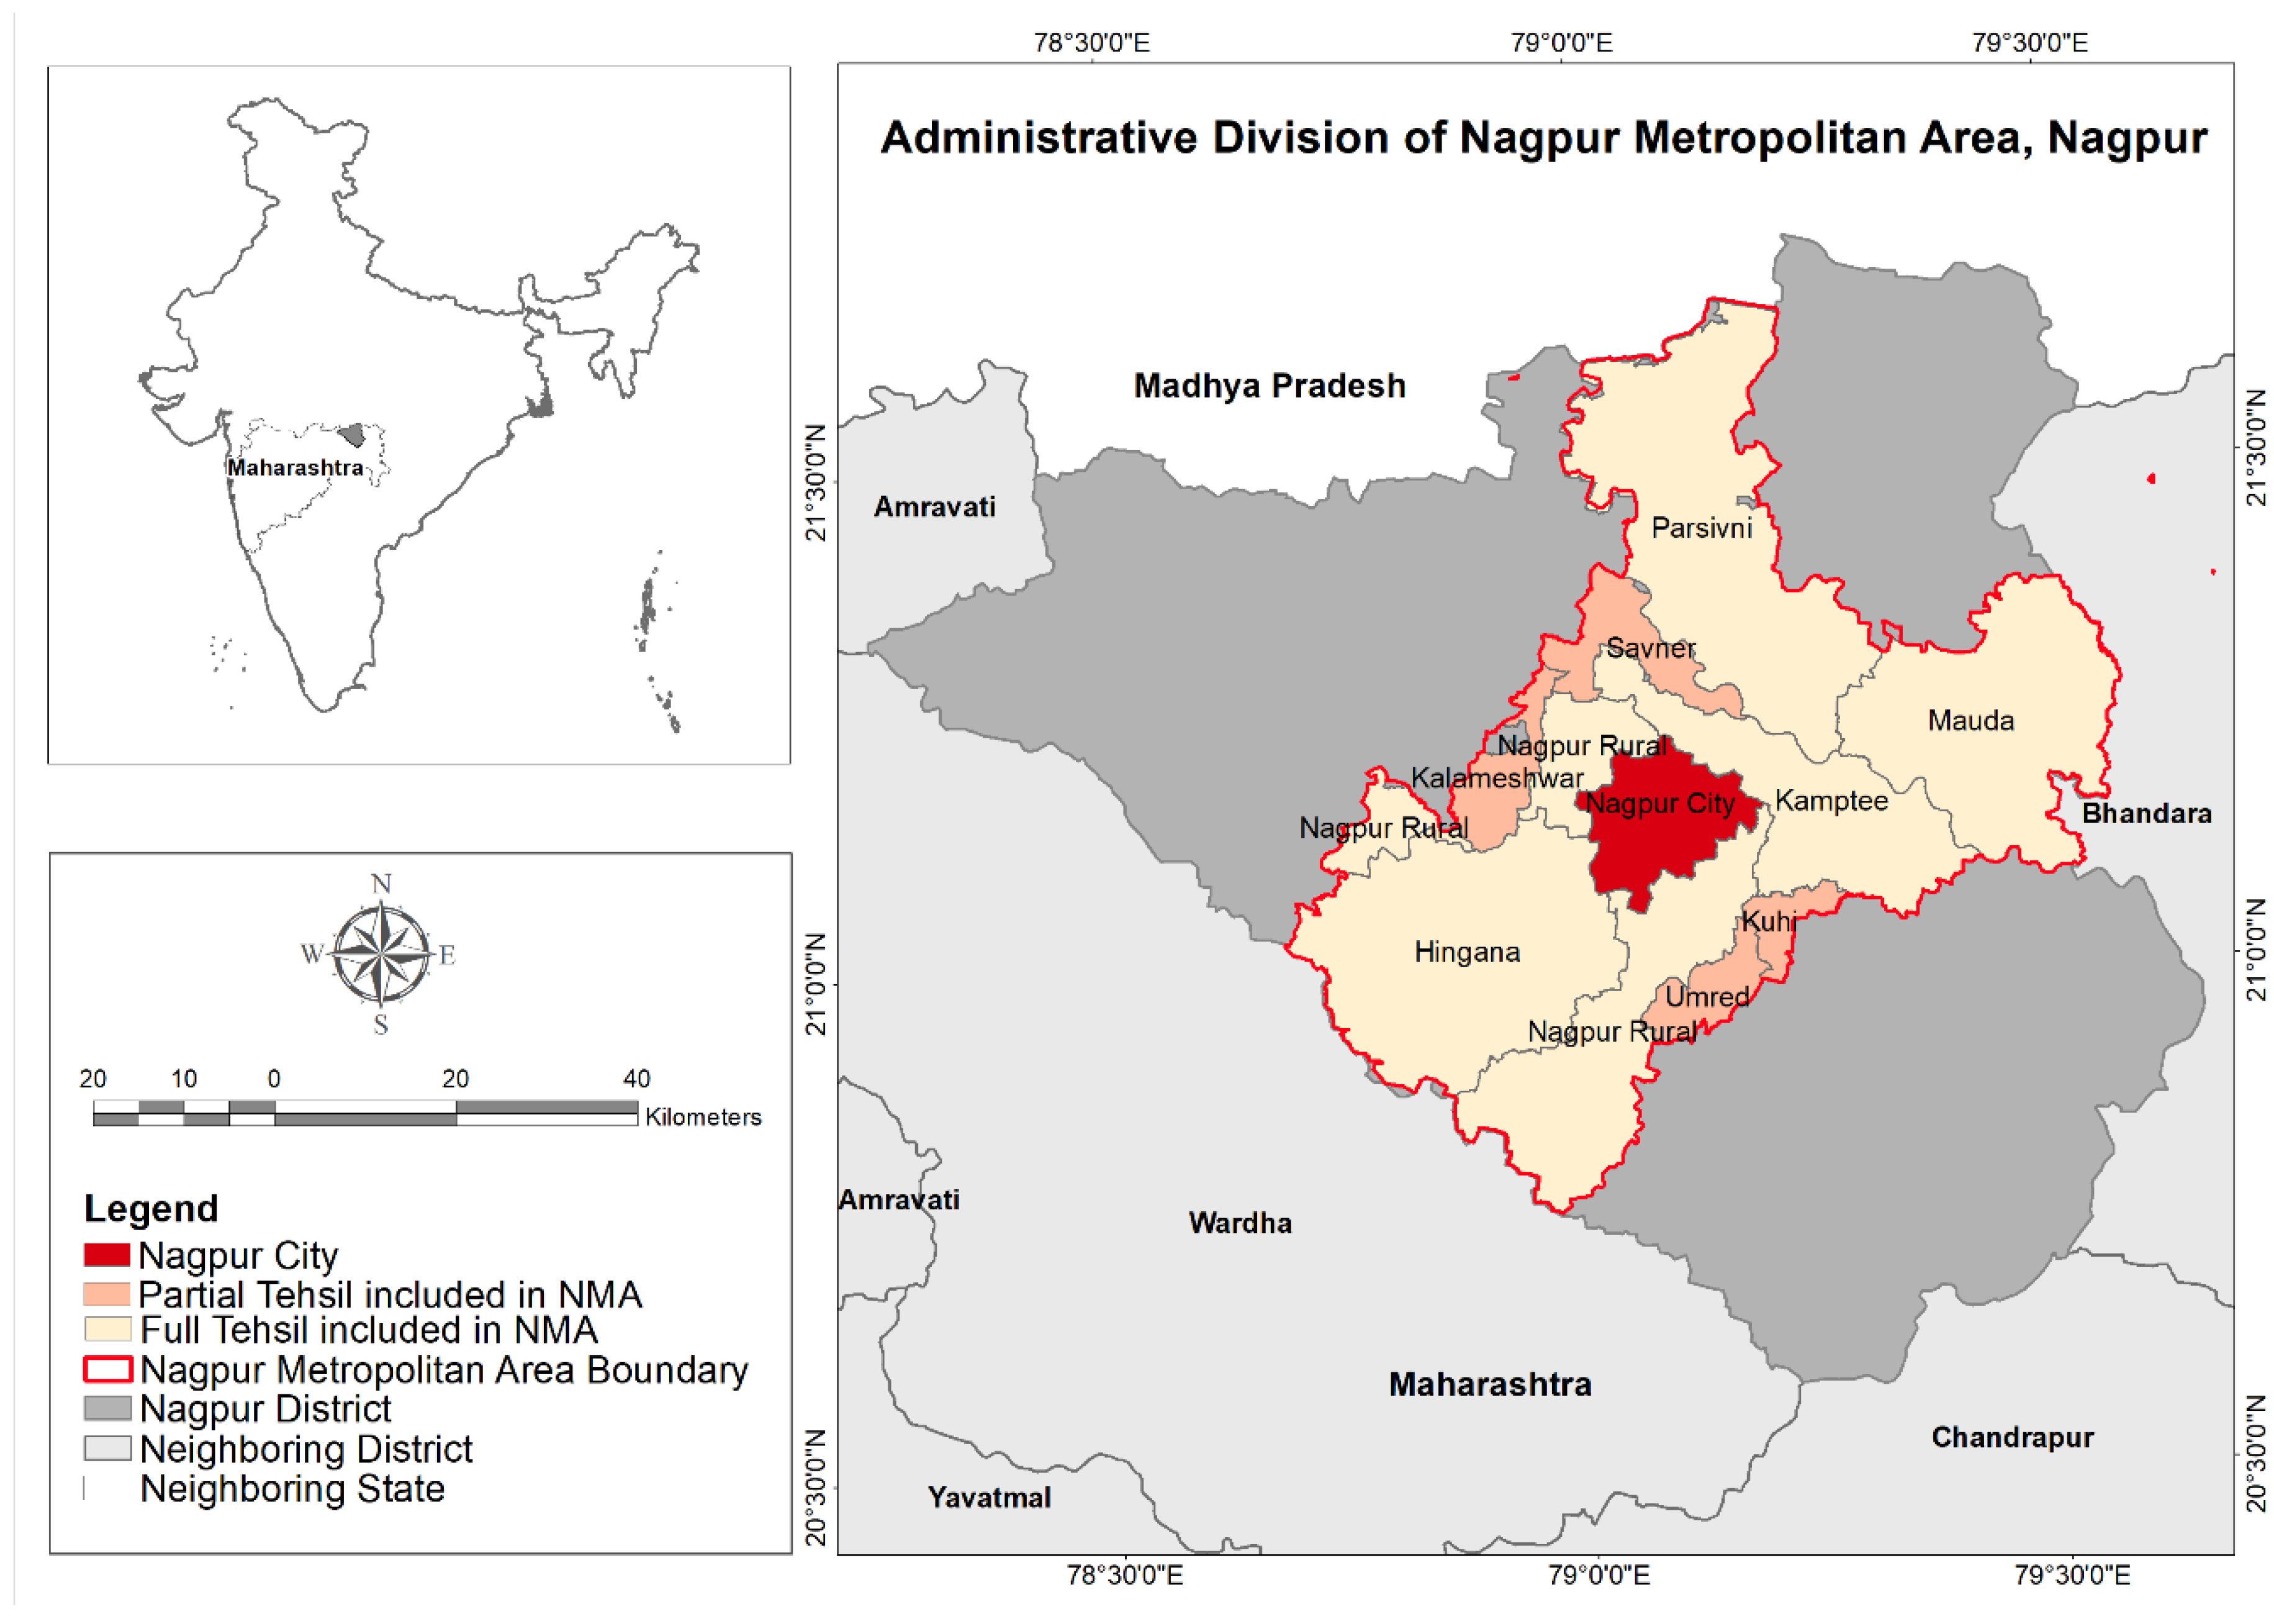
3.1. Case Study Area: Nagpur Metropolitan Area (NMA), India
3.2. Delineated Study Corridor in the NMA and Settlement Selection
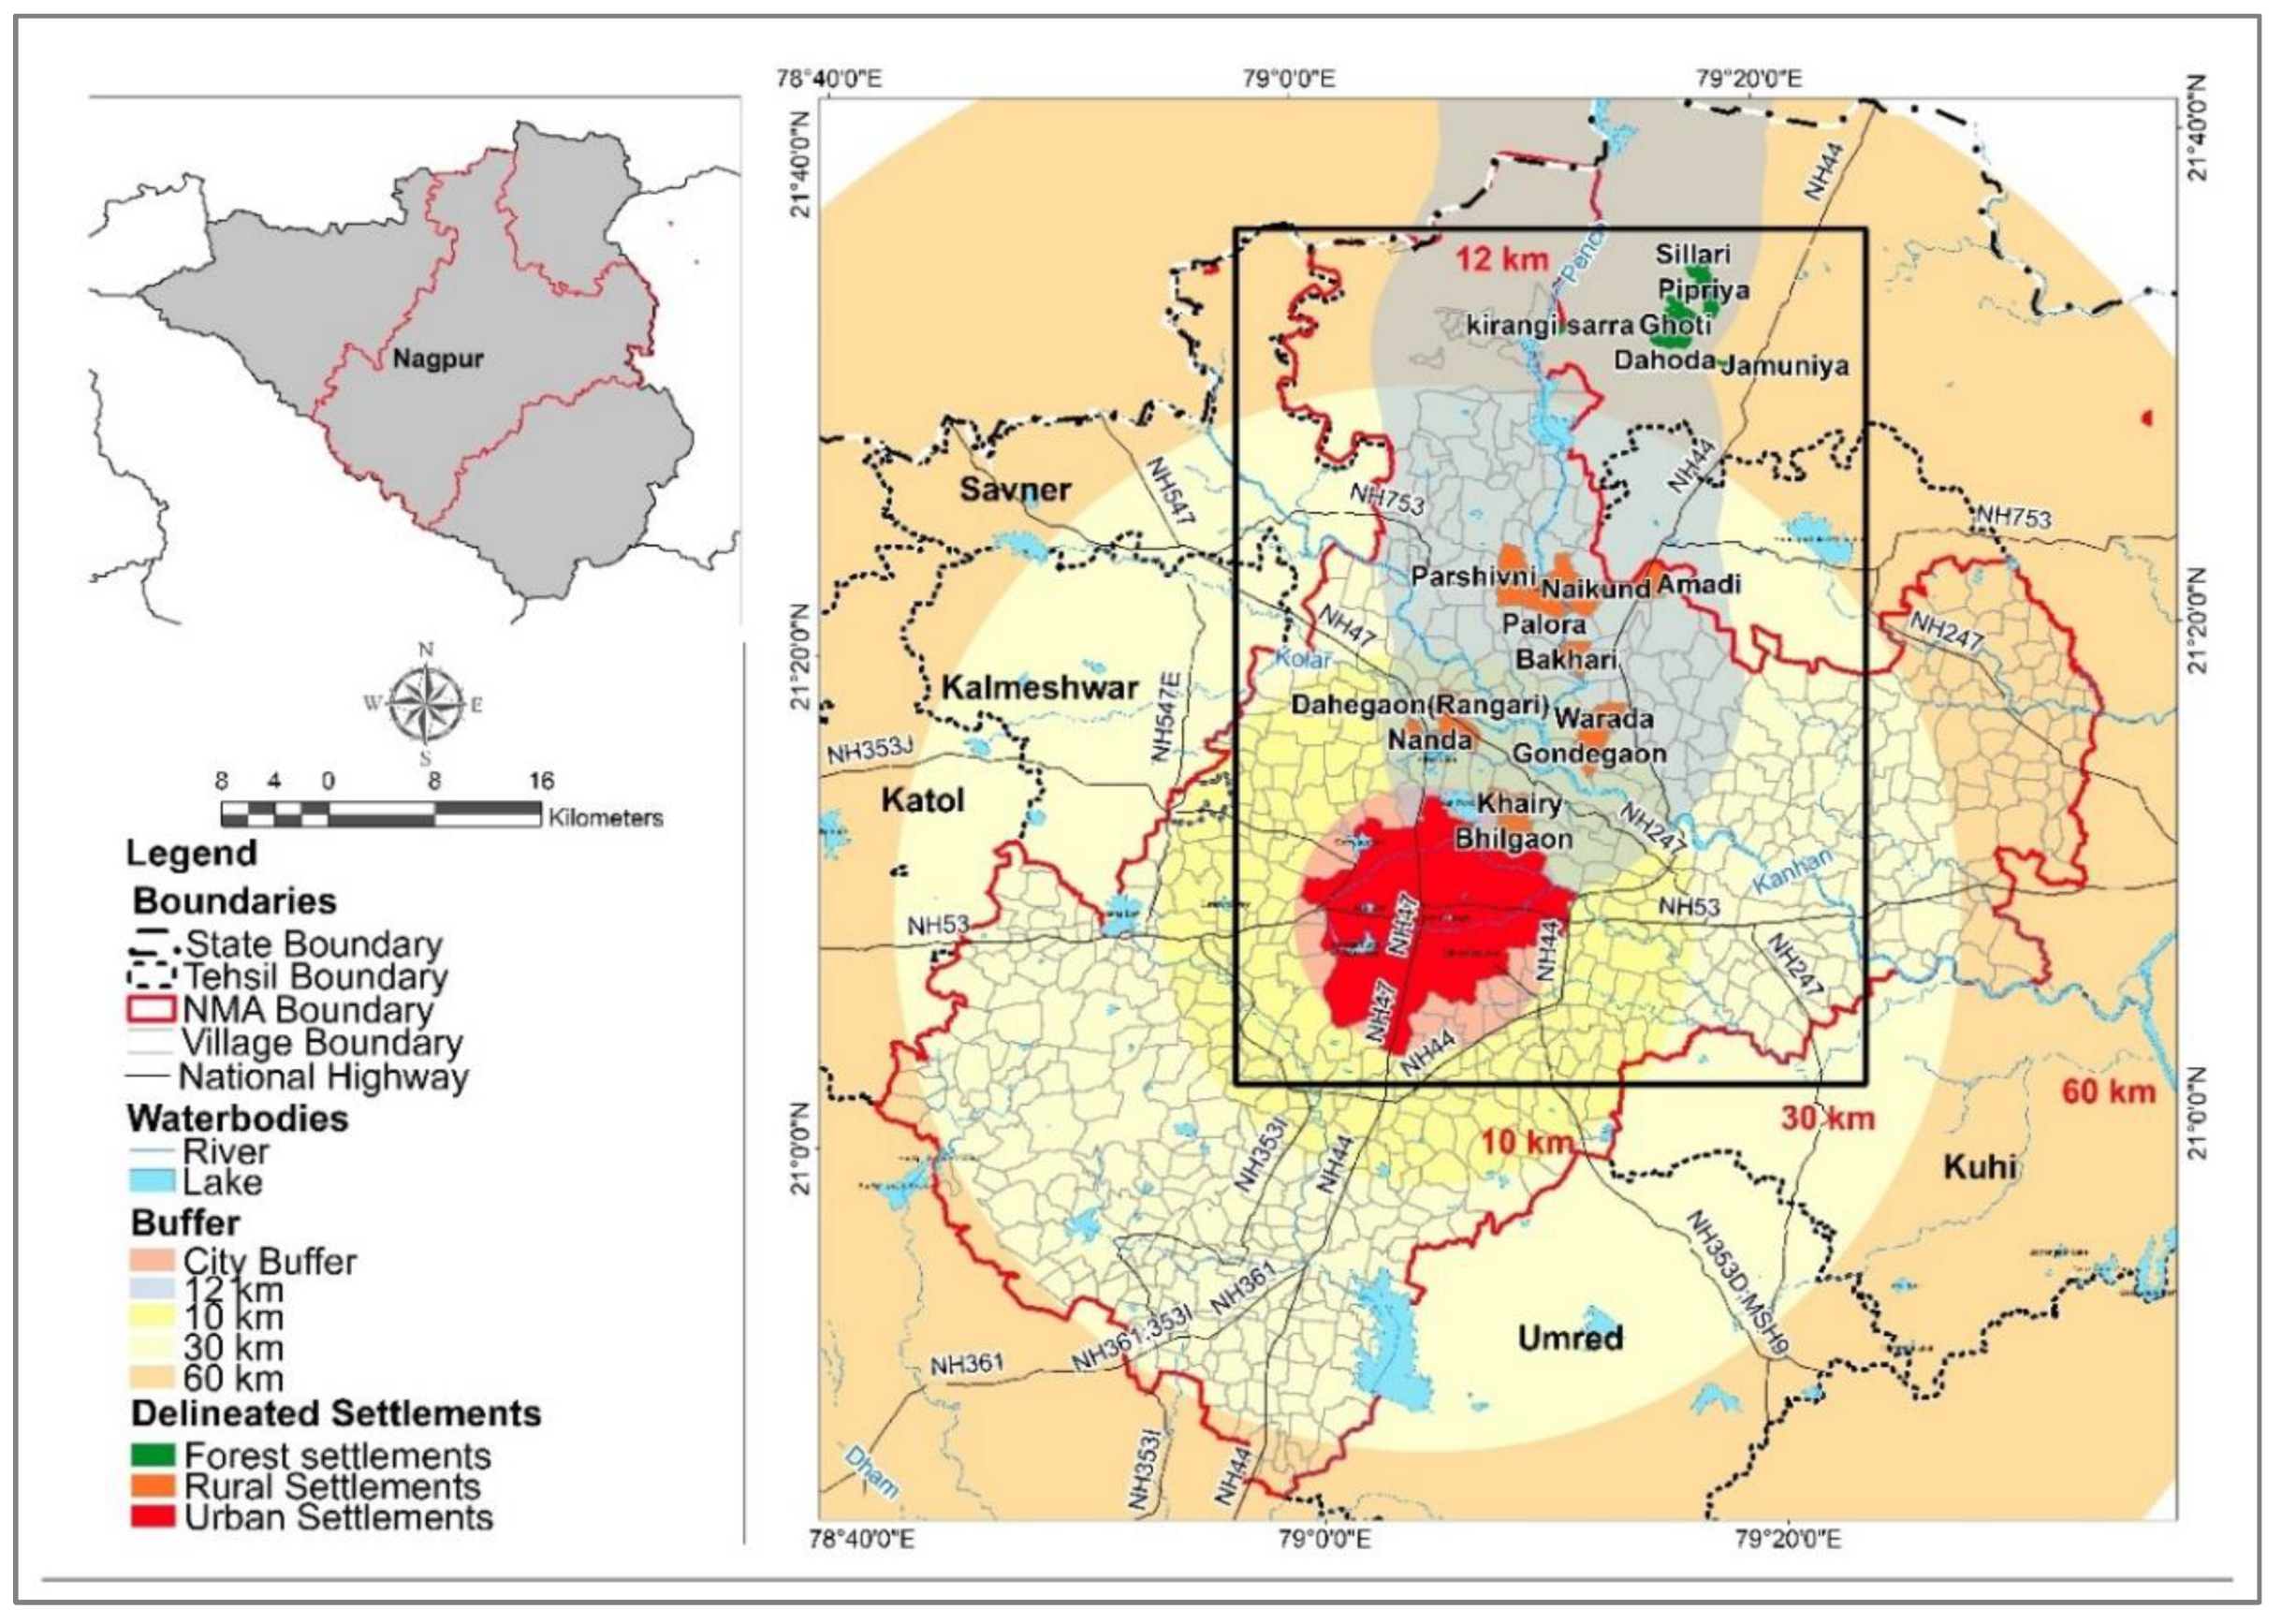
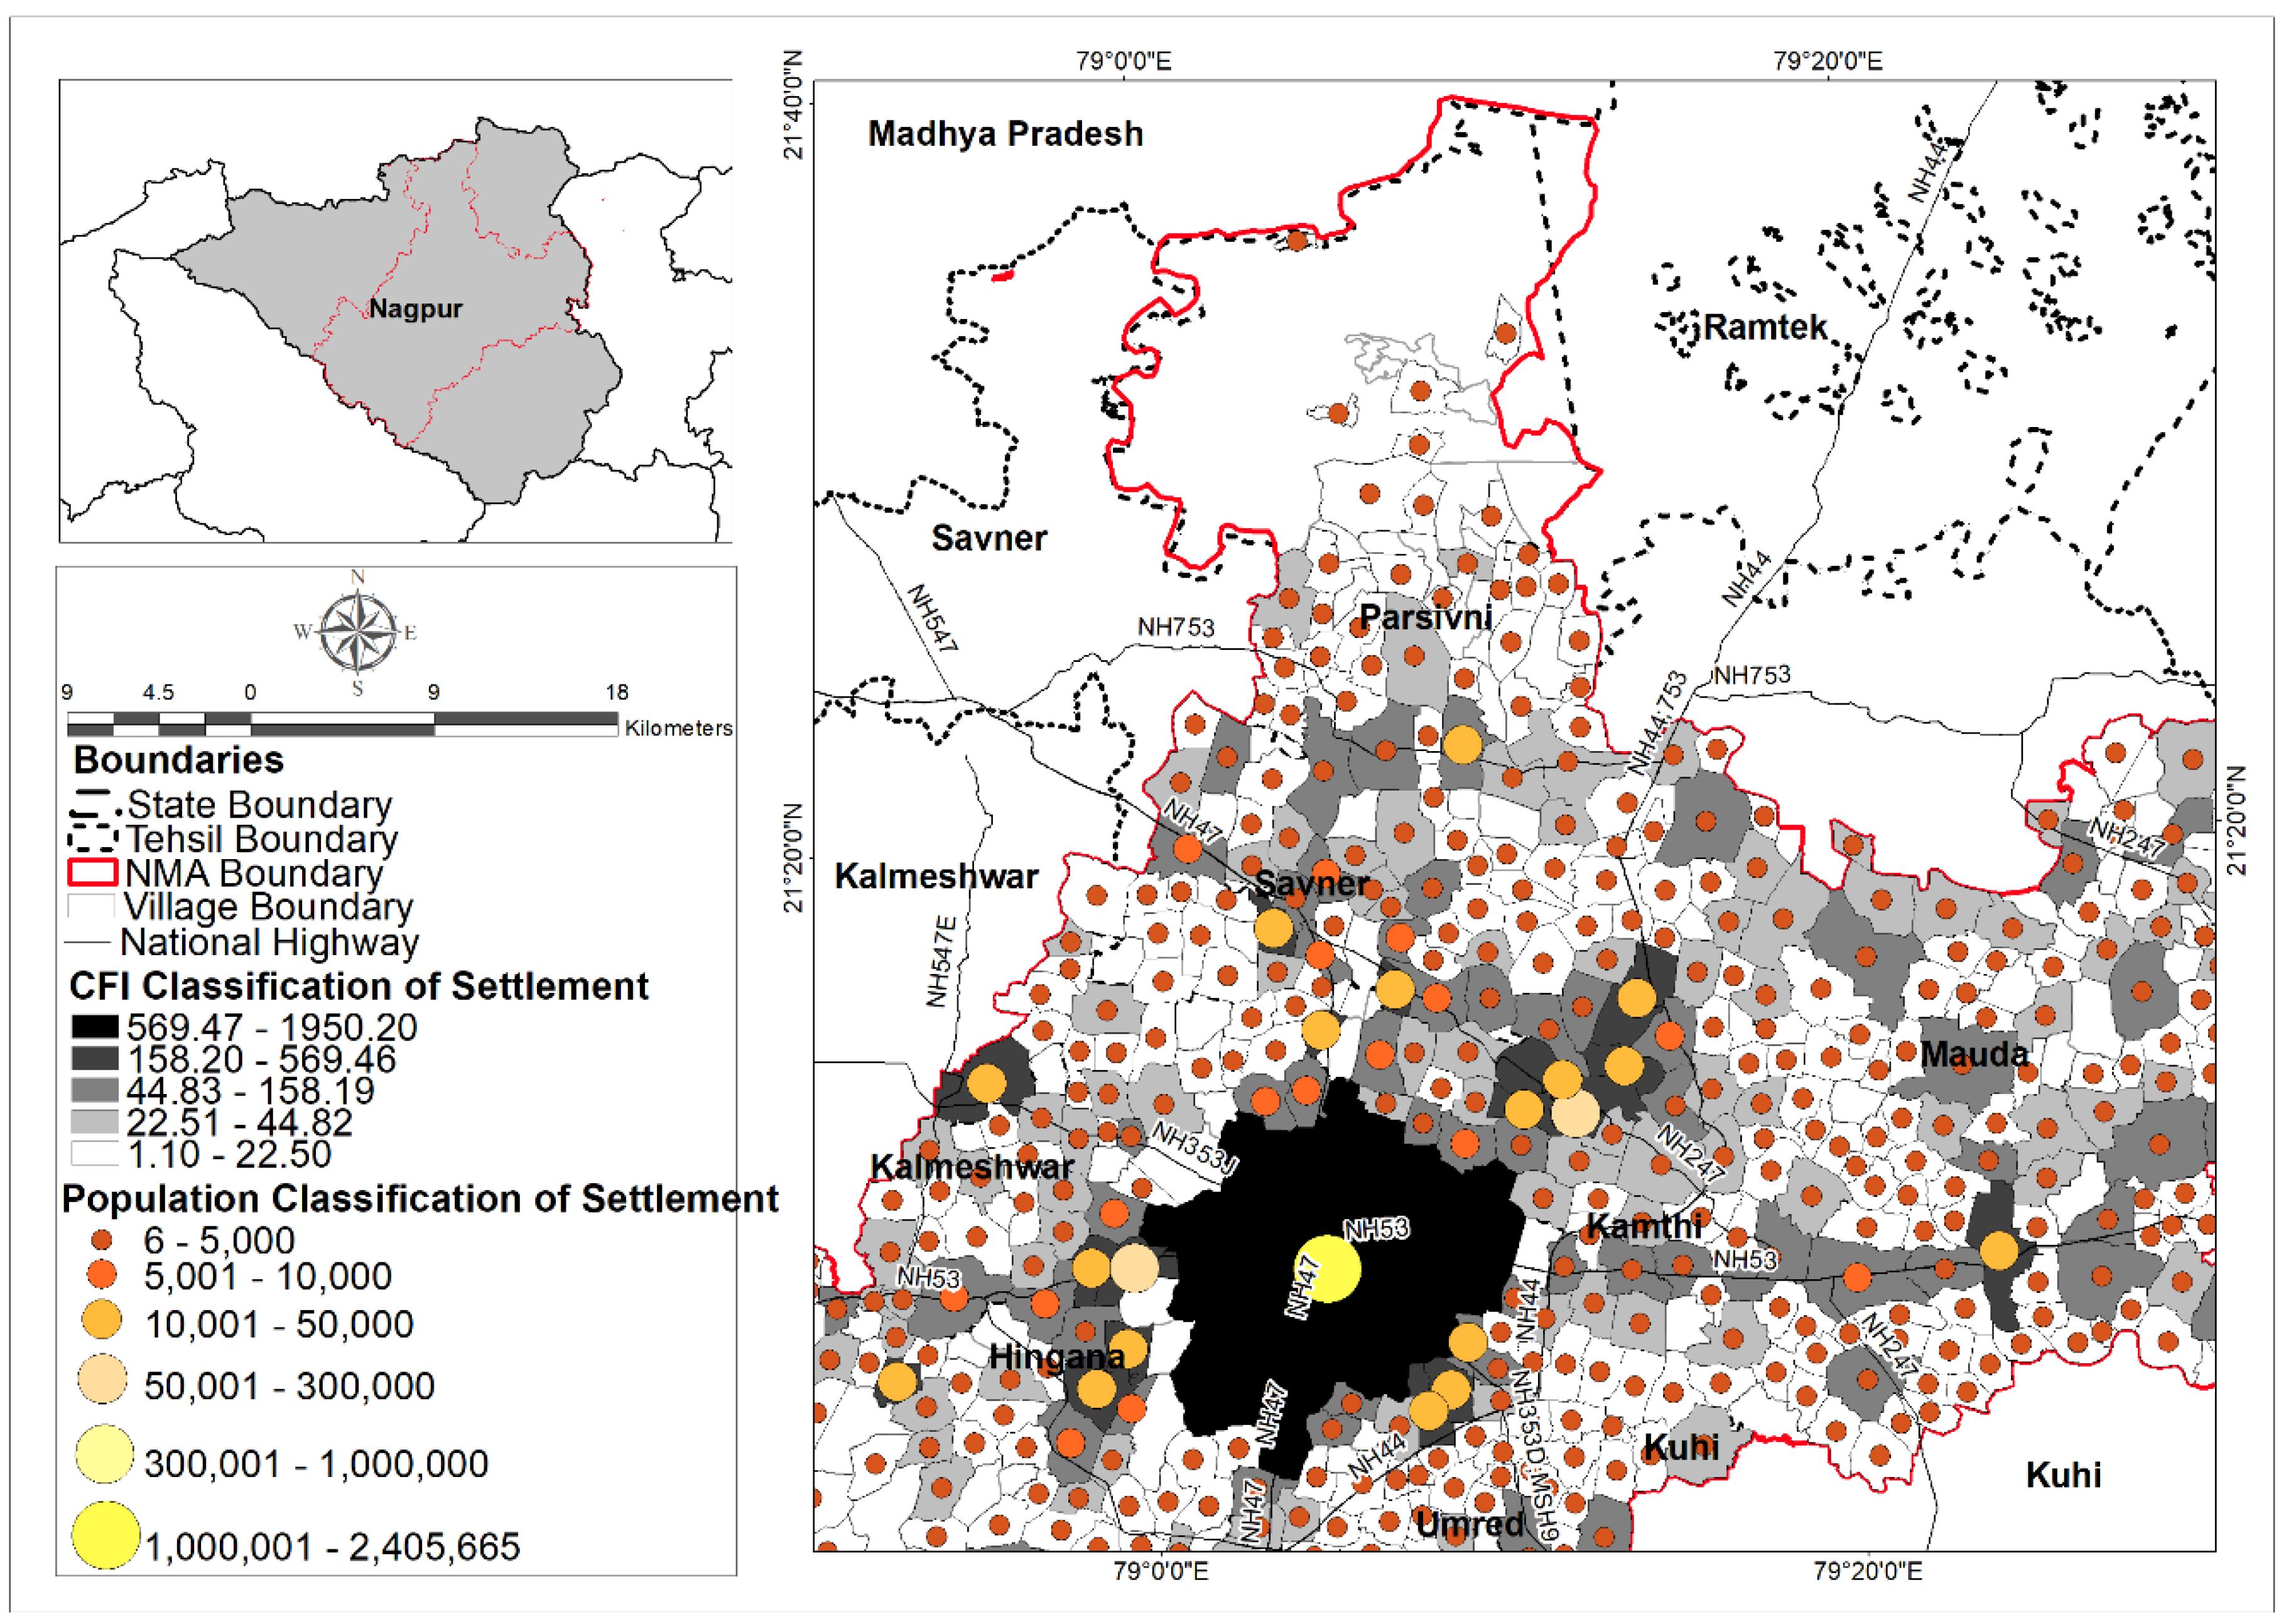
- Distance from the city: As already explained, the NMA has a distinct land use and land cover, with a varying landscape covering forest, agricultural, and built-up areas. The good road connectivity and the resource richness has attracted many investments around the city within the range of 25 to 40 km. Notably, Pench reservoir in the northern part of the NMA, located at a distance of approximately 70 km from the city serves as a key source of water. In reference to the urban-rural transect along the Pench river belt in the NMA, three concentric buffers of 10, 30, and 60 km were plotted around Nagpur city using Proximity toolset (Buffer) of ArcGIS 10.4.1 (shown in Figure 2). Similar buffers of 12 km were also drawn along the Pench river belt. These specific buffer lengths were determined based on the ongoing developments along the urban-rural transect in the NMA and Pench river belt. The key purpose was to demarcate specific urban, peri-urban, rural, and forest settlements along the defined NMA corridor.
- Population size: In consideration to the five population ranges (less than 1000; 1001–2000; 2001–5000; 5001–10,000; above 10,000) identified by the Nagpur Metropolitan Area Development Plan 2012–2032 [33], specific settlements were selected for the study under three different categories: forest settlements (500–1000 population size); rural and peri-urban settlements (1000–5000 population size); and urban settlements (5000–10,000 and above population size). Notably, the peri-urban settlements have been included under the “rural” category for the study, due to the lack of any major differences in the population sizes within the defined corridor.
3.3. Research Methods
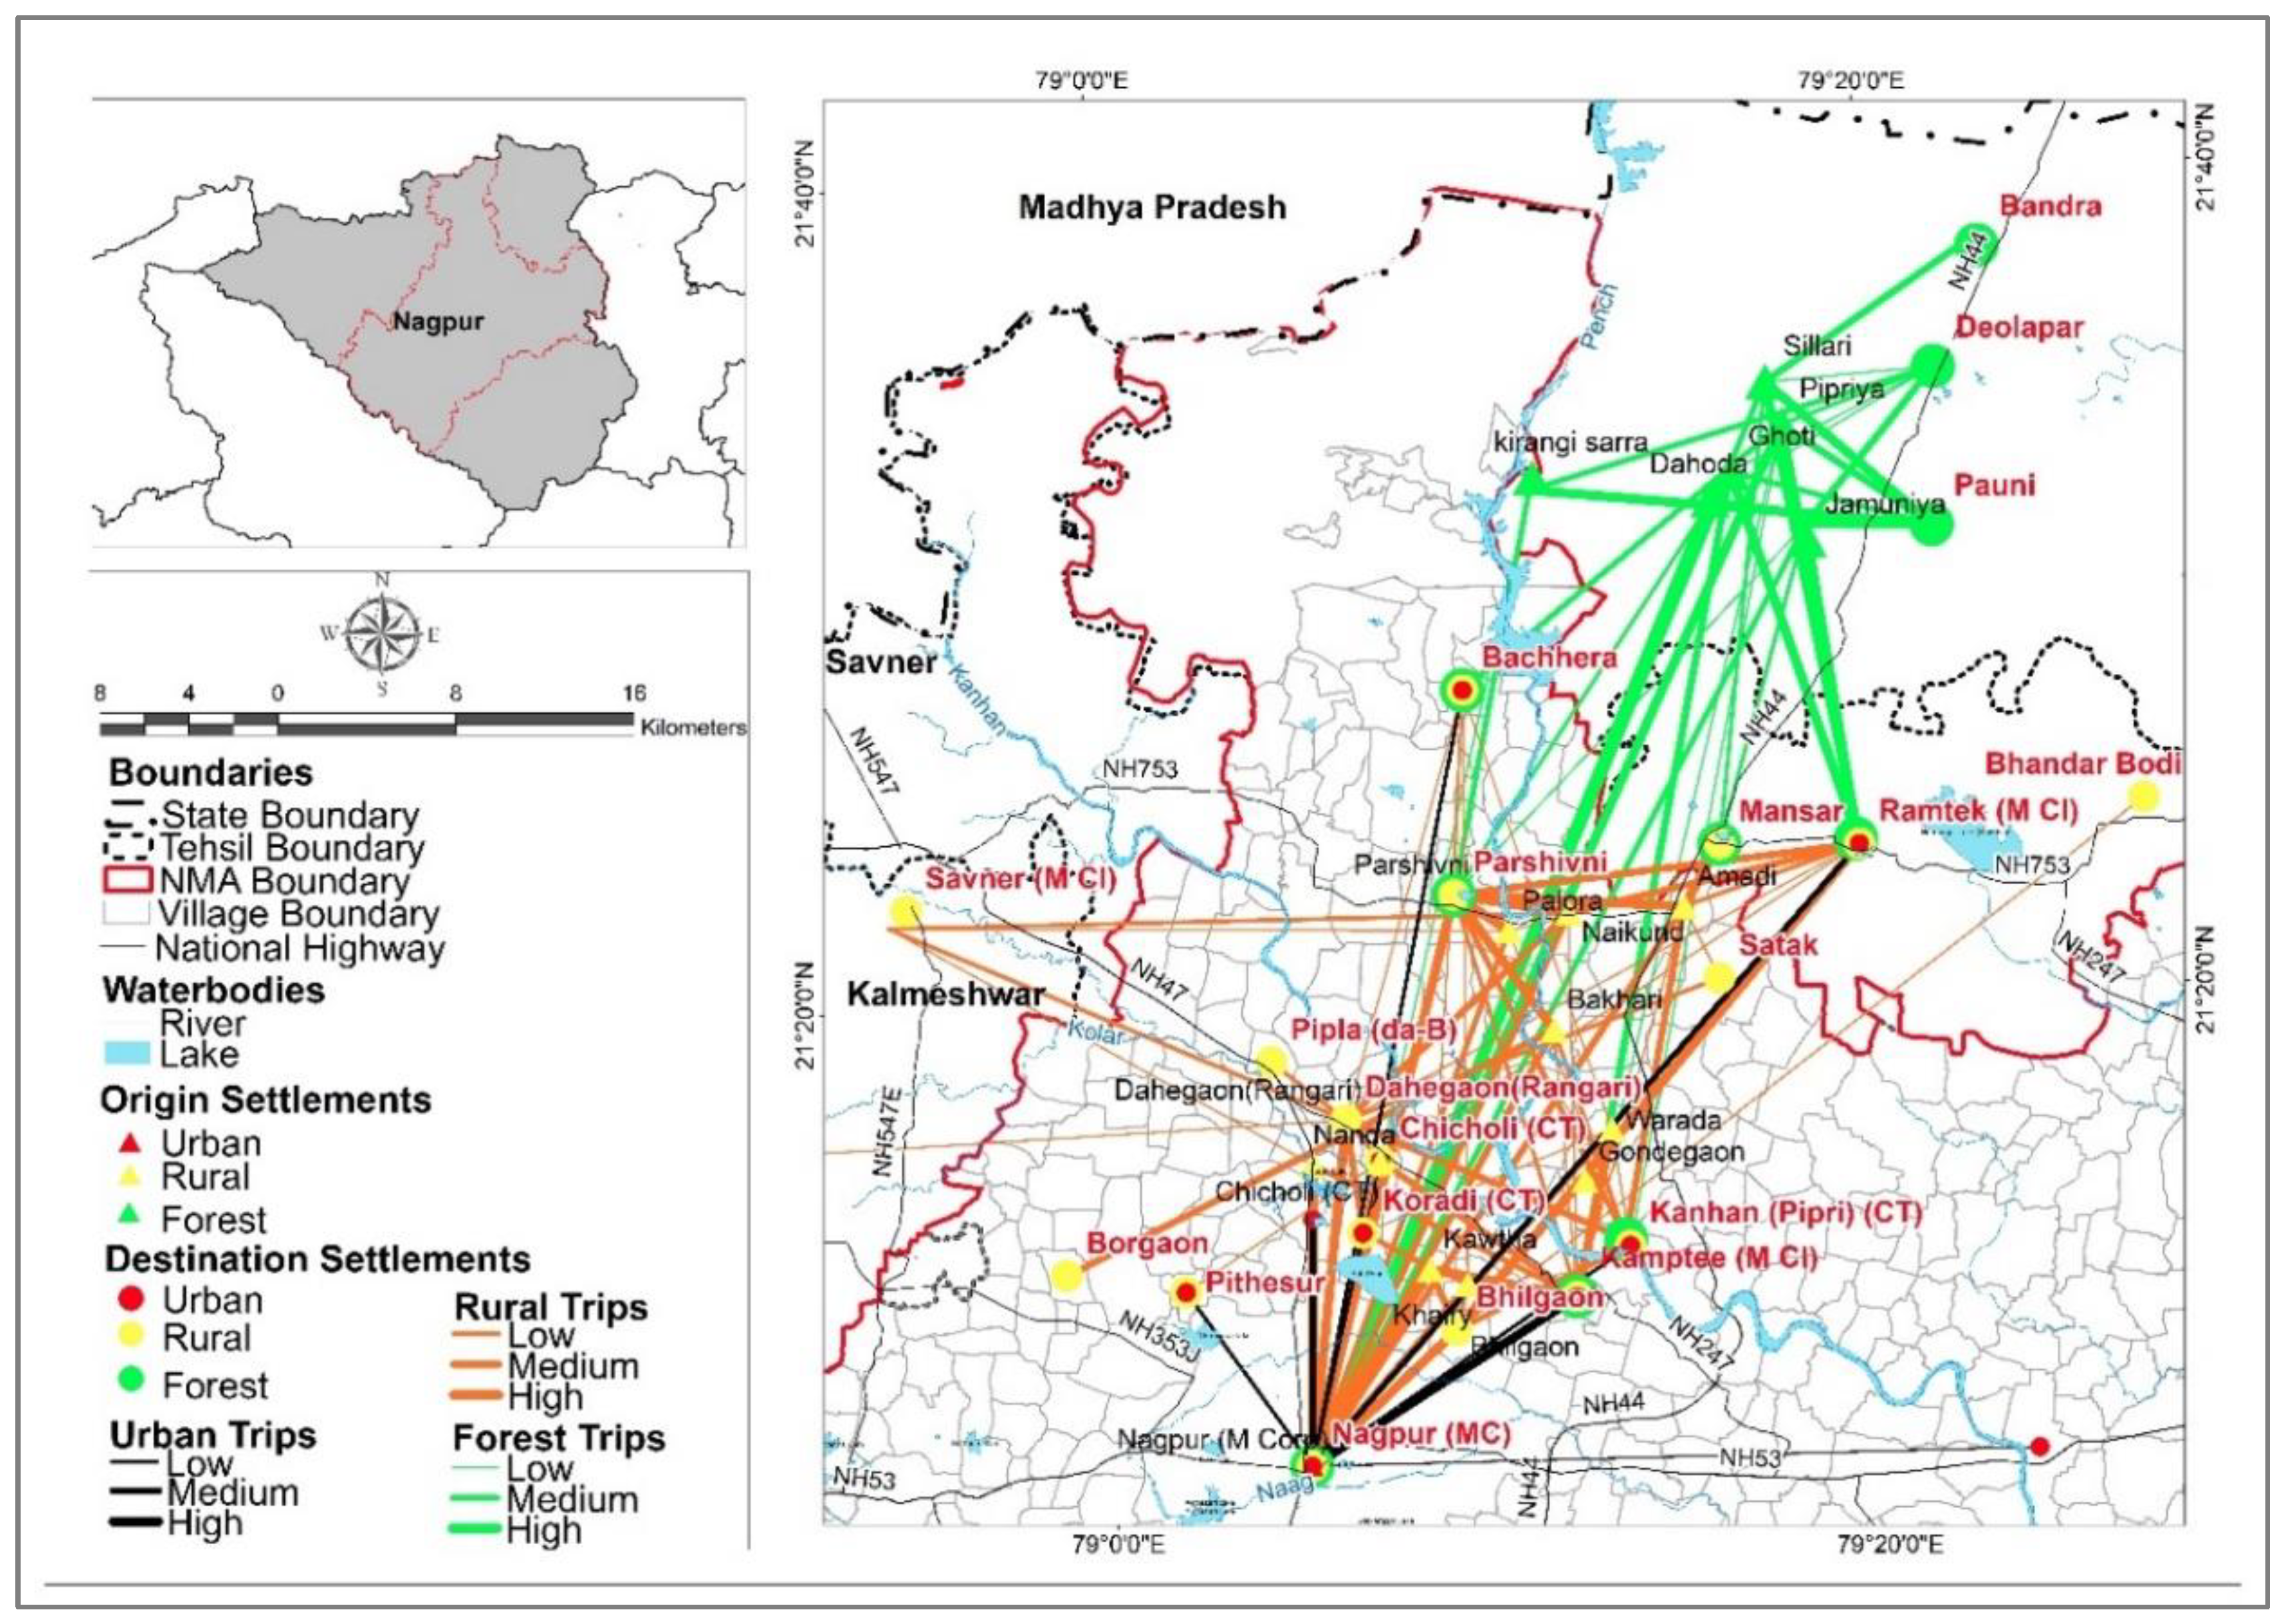
3.3.1. Flow Analysis
3.3.2. Settlement Hierarchy Analysis
- Regional Metropolitan Growth Centre: Settlements that have a zone of influence beyond the district boundary.
- Regional Urban Growth Centre: Settlements that are self-sufficient in nature with a large population base.
- Growth Centre: Settlements that have significant urbanization and economic activity.
- Sub-Growth Centre: Settlements that serve larger population bases.
- Central Village: Settlements which are centrally located villages, and which include public amenities of a secondary school, college, weekly market, bus-stop, police station (junior), co-operative bank, and sub-post office.
- Upgraded Village: Settlements which include a secondary school, police outpost, primary health sub-center, co-operative bank, and a sub-post office [33].
4. Results
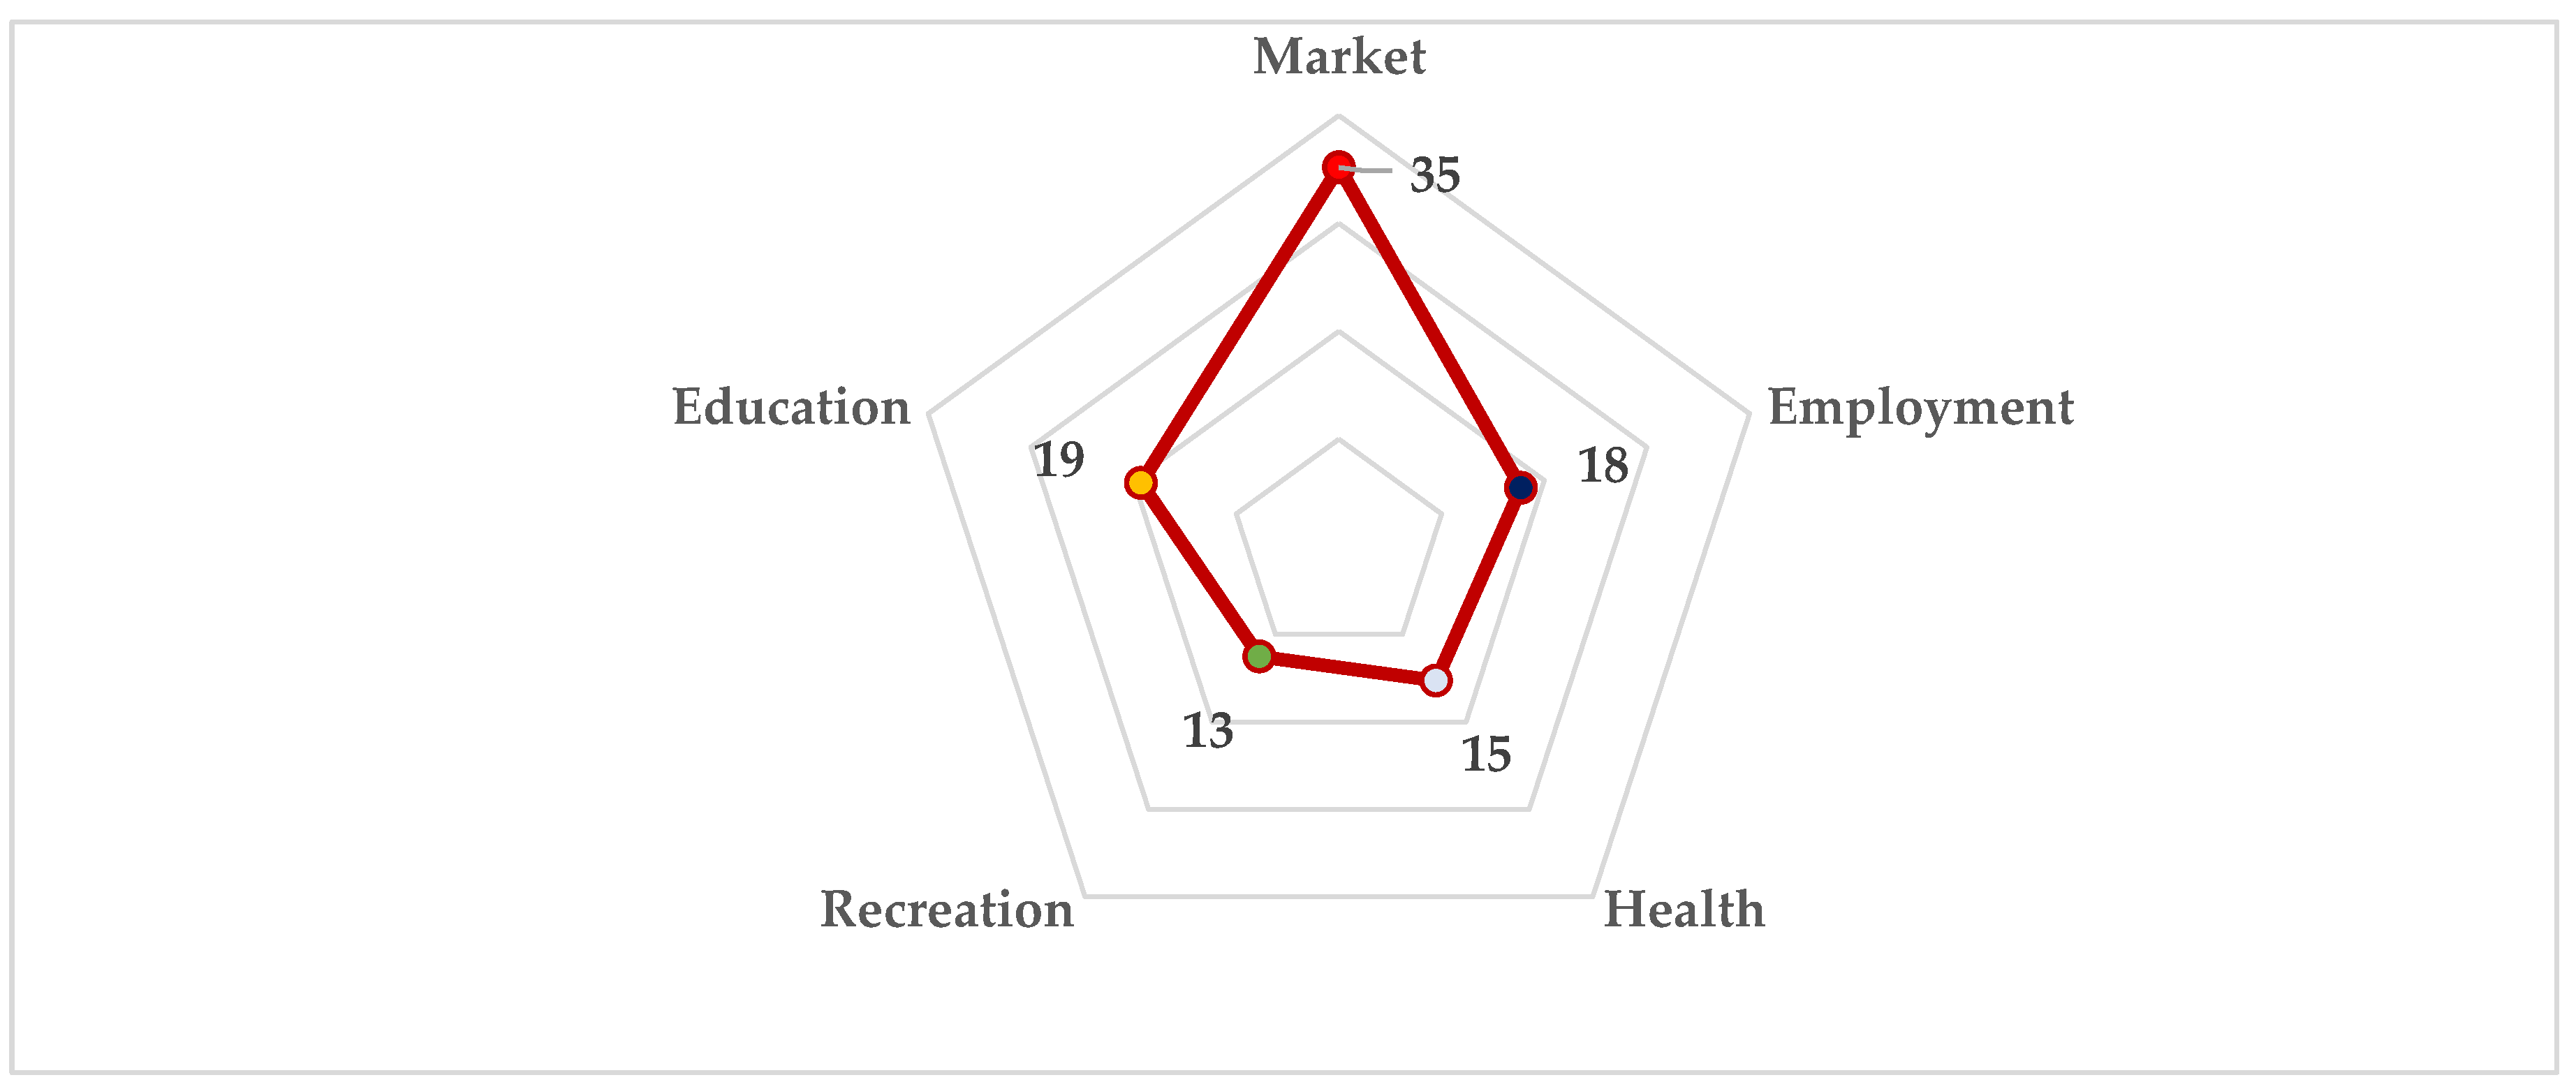
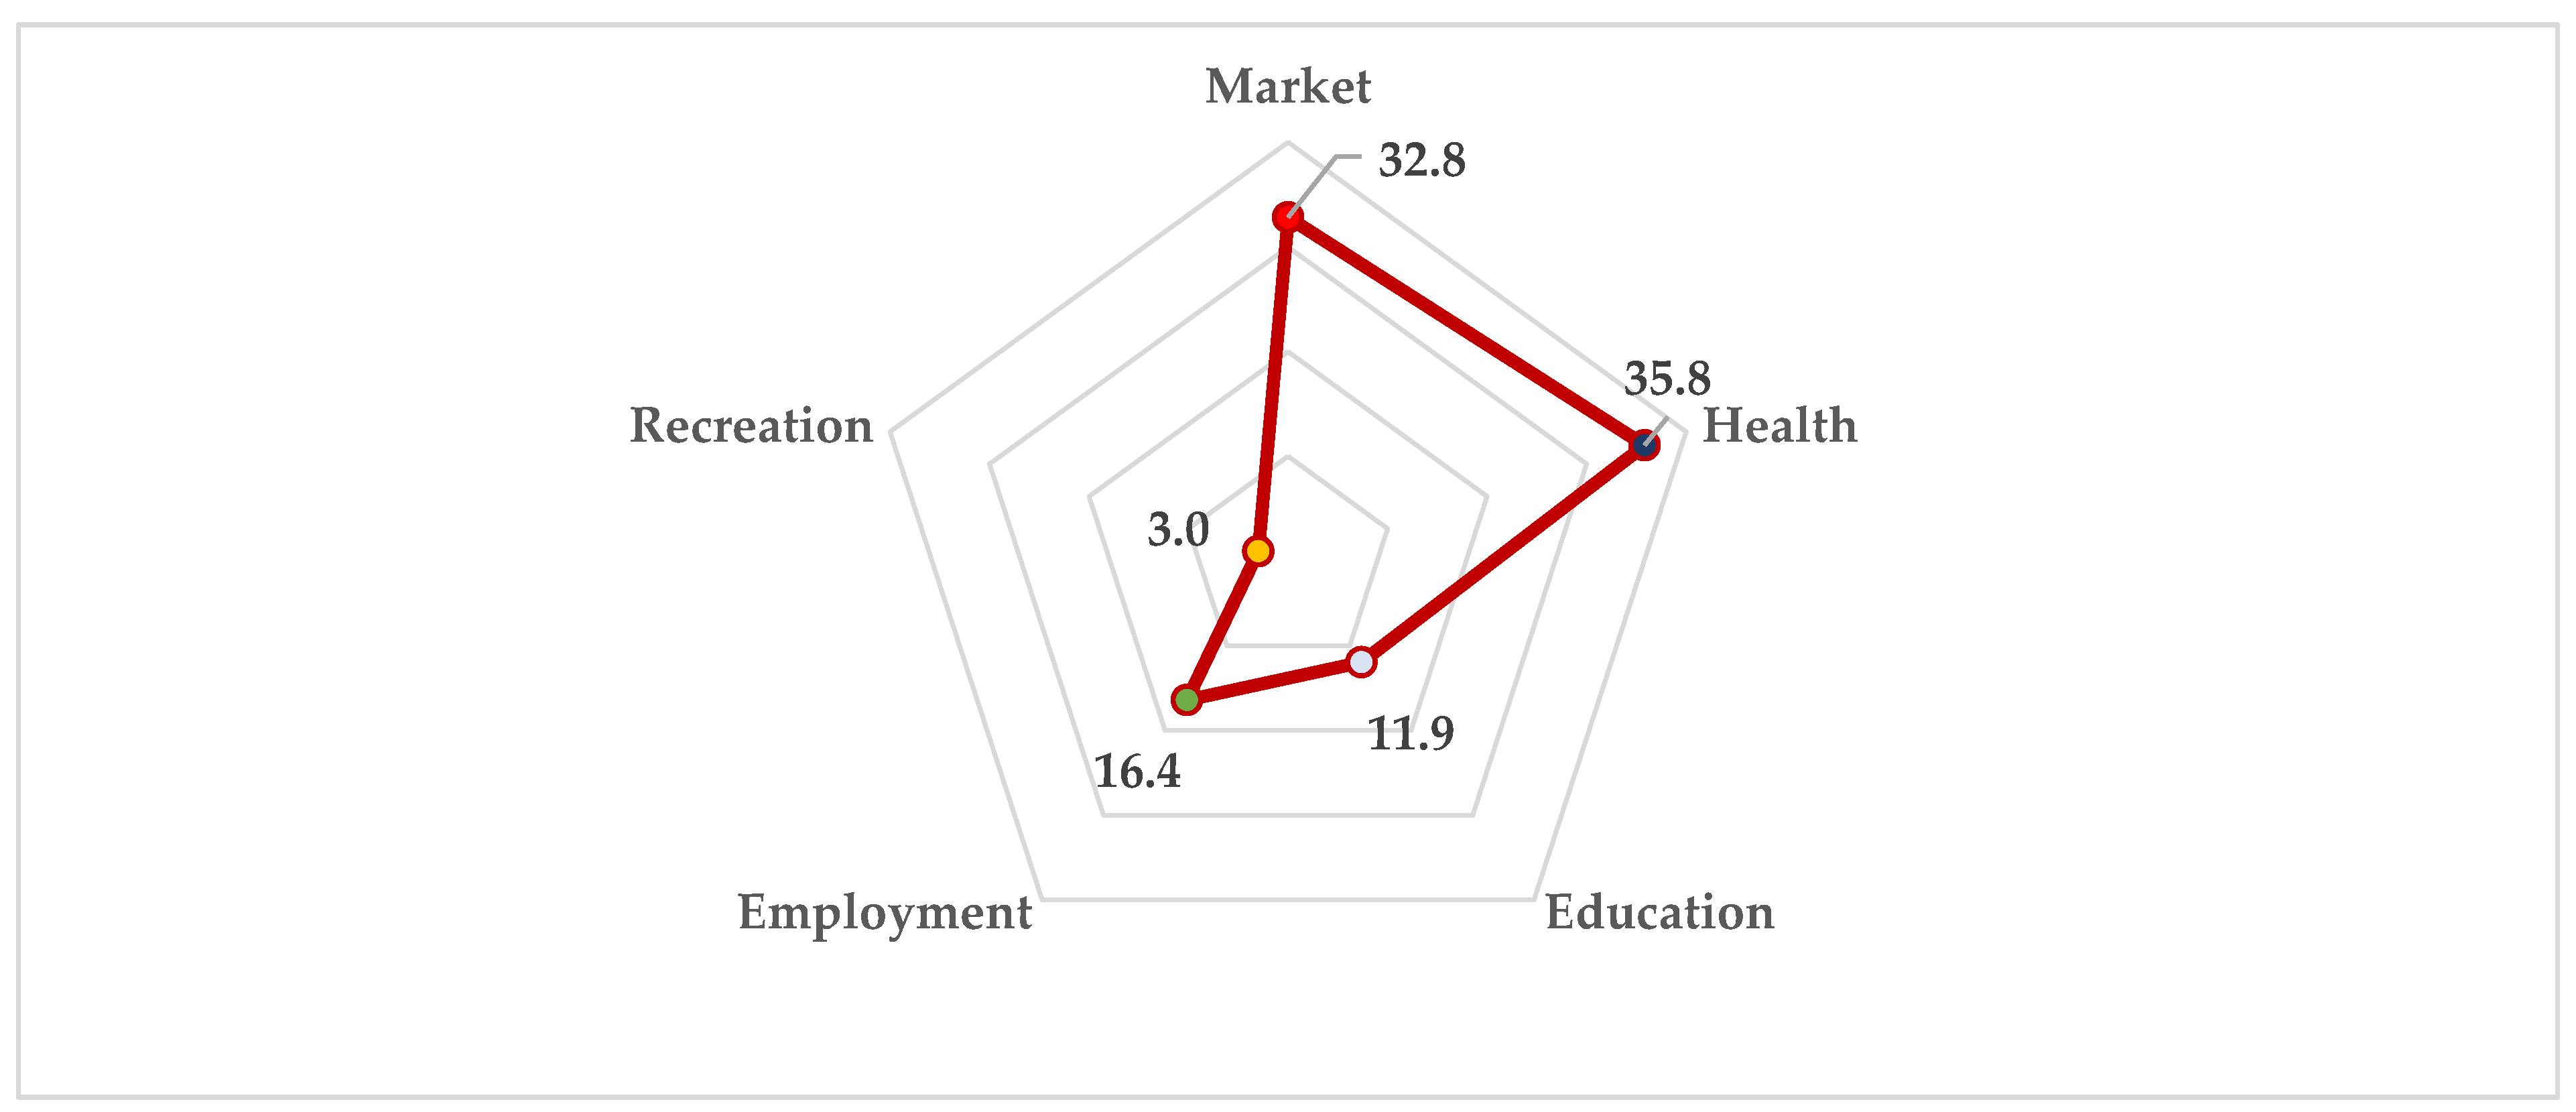
4.1. Frequency and Purpose of People Flow from the Selected Settlements
4.2. Settlement Hierarchy for Forest-Rural-Urban Settlements within the Study Corridors
4.2.1. Forest Settlements
4.2.2. Rural Settlements
4.2.3. Urban Settlements
5. Discussion
5.1. Achieving a Low Carbon Society by Upgrading the Level of Services in the Intermediate Settlements
5.2. Enhancing Nature-Based Livelihoods for Living in Harmony with Nature
6. Conclusions
Supplementary Materials
Author Contributions
Funding
Acknowledgments
Conflicts of Interest
References
- United Nations. World Urbanization Prospects 2018: Highlights; Department of Economic and Social Affairs Population Division: New York, NY, USA, 2019. [Google Scholar]
- Our World in Data Homepages. Available online: https://ourworldindata.org/how-urban-is-the-world (accessed on 10 May 2020).
- United Nation (DESA) Homepages. 68% of the World Population Projected to Live in Urban Areas by 2050, Says UN. Available online: https://www.un.org/development/desa/en/news/population/2018-revision-of-world-urbanization-prospects.html (accessed on 27 August 2020).
- UN-Habitat. Implementing the New Urban Agenda by Strengthening Urban-Rural Linkages: Leave No One and No Space Behind; United Nations Human Settlements Programme: Nairobi, Kenya, 2017. [Google Scholar]
- UN-Habitat. HABITAT III Issue Papers 10—Urban-Rural Linkages; UN-Habitat: New York, NY, USA, 2015. [Google Scholar]
- Food and Agriculture Organisation of the United Nations Homepages. Available online: http://www.fao.org/in-action/food-for-cities-programme/overview/what-we-do/en/ (accessed on 10 May 2020).
- United Nation Homepages. Available online: https://sustainabledevelopment.un.org/sdg11 (accessed on 10 May 2020).
- Wunder, S.; Wolff, F. International Governance Screening of Global Urban Policies and Their Impacts on Sustainable Land Use; GLOBALANDS: Berlin, Germany, 2015. [Google Scholar]
- ROBUST. Snapshot: Expressions of Urban—Peri-Urban—Rural Relationships. Available online: https://rural-urban.eu/sites/default/files/S-GRA1%20RURBANCE%20Project.pdf (accessed on 27 August 2020).
- Pascariu, S.; Darinka, C. Promoting Urban-Rural Linkages in Small and Medium Sized Cities. Available online: Czischkehttps://urbact.eu/sites/default/files/urban-rural_thematic_report.pdf (accessed on 27 August 2020).
- Institute for Global Environmental Strategies Homepages. Available online: https://archive.iges.or.jp/en/sdgs/sts.html (accessed on 13 April 2020).
- Takeuchi, K.; Fujino, J.; Ortiz-Moya, F.; Mitra, B.K.; Watabe, A.; Takeda, T.; Jin, Z.; Nugroho, S.B.; Koike, H.; Kataoka, Y. Circulating and Ecological Economy—Regional and Local CES: An IGES Proposal; IGES: Kanagawa, Japan, 2019. [Google Scholar]
- Deshkar, S. Resilience Perspective for Planning Urban water Infrastructure: A case study of Nagpur. In Urban Drought: Disaster Risk Reduction; Ray, B., Shaw, R., Eds.; Springer: Singapore, 2019; pp. 131–154. [Google Scholar]
- Institutional Real Estate Inc. Homepages. Available online: https://irei.com/news/oxford-economics-cities-will-leading-global-economy-2035/ (accessed on 10 May 2020).
- Tacoli, C. Rural-urban interactions: A guide to the literature. EAU 1998, 10, 147–166. [Google Scholar] [CrossRef]
- Evans, H.E. Rural-Urban Linkages and Structural Transformation (English); Infrastructure and Urban Development Department Discussion Paper: Washington, DC, USA, 1990.
- Tacoli, C. Bridging the Divide: Rural-Urban Interactions and Livelihood Strategies. IIED 1998, 1–20. Available online: http://pubs.iied.org/pdfs/6144IIED.pdf (accessed on 27 August 2020).
- LOCUS Homepages. Regional Solutions for Rural and Urban Challenges. Available online: https://locusimpactinvesting.org/news/blog-articles/regional-solutions-for-rural-and-urbanchallenges.html (accessed on 27 August 2020).
- Peeters, A.; Marinho, E. Urban-Rural Interactions: Spatial Organization and Explaining Factors. CERDI Univ. Auvergne 2008, 1–12. Available online: https://www.academia.edu/4709653/Urban_Rural_Interactions_Spatial_Organization_and_Explaining_Factors (accessed on 15 October 2020).
- Kim, S.M. An Empirical Analysis on Urban-Rural Linkage in Mumbai Metropolitan Area. J. Dev. Pract. 2015, 2, 20–25. [Google Scholar]
- Balamou, E.; Psaltopoulos, D. Nature of Rural–Urban Interdependencies and Their Diffusion Patterns In Southern Greece: An Interregional Sam Model. J. Appl. Reg. Sci. Conf. 2006, 18, 60–83. [Google Scholar] [CrossRef]
- Dabson, B. Rural-Urban Independence: Why Metropolitan and Rural America Need Each Other. Brook. Inst. 2007. Available online: http://www.brookings.edu/PROJECTS/BLUEPRINT.ASPX (accessed on 27 August 2020).
- Bari, R.; Munir, A. Spatial Analysis of Rural-Urban Linkages in Basti District (U.P.). J. Humanit. Soc. Sci. 2014, 19, 127–133. [Google Scholar] [CrossRef]
- Schmitz, C.A.; Diaz, P.; Labourdette, D.R.; Jauregui, C.H.; Molina, M.; Montes, C.; Pineda, F.D.; Schmitz, M.F. Modelling of socio-ecological connectivity. The rural-urban network in the surroundings of Madrid (Central Spain). Urban Ecosyst. 2018. [Google Scholar] [CrossRef]
- Xiao, L.; He, Z.; Wang, Y.; Guo, Q. Understanding urban-rural linkages from an ecological perspective. Int. J. Sust. Dev. World Ecol. 2016, 24, 37–43. [Google Scholar] [CrossRef]
- Ali, M. Geographical Analysis of Rural-urban Linkages in Amhara Region, Ethiopia: A Case Study. IJAIR 2013, 8, 428–431. [Google Scholar]
- Sivaramakrishnan, L.; Sar, M. Rural Urban Linkages: A Study around Nalhati Municipality. IJDR 2014, 4, 721–726. [Google Scholar]
- Ministry of the Environment Japan. Outline of the Fifth Basic Environment Plan. Available online: https://www.env.go.jp/policy/kihon_keikaku/plan/plan_5/attach/ref_en-02.pdf (accessed on 13 April 2020).
- Bačová, M.; Böhme, K.; Guitton, M.; Herwijnen, M.V.; Kállay, T.; Koutsomarkou, J.; Magazzù, I.; O’Loughlin, E.; Rok, A. Pathways to a Circular Economy in Cities and Regions; ESPON, Interact, Interreg Europe and URBACT: Lille, France, 2016. [Google Scholar]
- Skea, J.; Nishioka, S. Policies and Practices for a Low-Carbon Society. Clim. Policy 2008, 8 (Suppl. 1), S5–S16. [Google Scholar] [CrossRef]
- Sukhwani, V.; Mitra, B.K.; Takasawa, H.; Ishibashi, A.; Shaw, R.; Yan, W. Urban-Rural Partnerships: A Win-Win Approach to Realize Regional CES (Regional Circular & Ecological Sphere), Compendium of Good Practices from Japan; IGES: Yokohama, Japan, 2019. [Google Scholar]
- NSSCDCL Homepages. Available online: https://nsscdcl.org/aboutnsscdcl.jsp (accessed on 10 May 2020).
- Nagpur Improvement Trust. Nagpur Metropolitan Area Development Plan. 2012–2032; Published u/s 26 of the Maharashtra Regional and Town Planning Act 1966: Nagpur, India, 2015. [Google Scholar]
- Nagpur Municipal Corporation; CRISIL. City Development Plan for Nagpur, 2041 (Final Report); Capacity Building for Urban Development Project, Ministry of Urban Development Government of India, The World Bank: Nagpur, India, 2015.
- Madjevikj, M.; Toshevska, B.A.; Ljakoska, M. Functional Development of Settlements—Theory and Reality. Int. Sci. Conf. Geobalcanica 2019, 299–309. [Google Scholar] [CrossRef]
- Census of India. Provisional Population Totals Urban Agglomerations and Cities. Available online: https://censusindia.gov.in/2011-prov-results/paper2/data_files/India2/1.%20Data%20Highlight.pdf (accessed on 25 September 2020).
- Office of the Registrar General & Census Commissioner India. Primary Census Abstract Data Tables—Maharashtra. Available online: https://censusindia.gov.in/pca/pcadata/Houselisting-housing-Maha.html (accessed on 25 September 2020).


| Category | Total | Name of the Settlements | Total Population |
|---|---|---|---|
| Urban | 1 | Nagpur city | 2,405,665 |
| Rural | 12 | Amadi, Bakhari, Bhilgaon, Dahegaon, Gondegaon, Kawtha, Khairy, Parshivni, Palora, Naikund, Nanda, Warda | 31,770 |
| Forest | 6 | Dahoda, Ghoti, Jamuniya, Kirangi, Pipriya, Sillari | 3504 |
| Purpose | Travel Destination for Selected Rural Areas in the Defined Study Corridor | Average Distance * (in Kilometers) |
|---|---|---|
| Market | Bhilgaon, Kalmana, Kamptee, Kanhan, Mansar, Lakadganj, Nagpur, Parshivni, Ramtek, Saoner | 21.71 |
| Employment | Kalamna, Kamptee, Kanhan, Khaperkheda, Koradi, Nagpur Parshivni, Pipla, Ramtek, Saoner | 23.93 |
| Health | Dahegaon, Kanhan, Mansar, Parshivni, Kalmana, Nagpur, Ramtek, Satak, Kamptee | 15.58 |
| Education | Borgaon, Kamptee, Kanhan, Parshivni, Dahegaon, Koradi, Mansar, Ramtek, Sadar, Kalamna, Nagpur | 15.95 |
| Recreation | Kamptee, Koradi, Kanhan, Nagpur, Takarghat, Khaperkheda, Parshivni, Pench, Ramtek | 37.66 |
| Purpose | Travel Destination for Selected Forest Areas in the Defined Study Corridor | Average Distance * (in Kilometers) |
|---|---|---|
| Market | Kanhan, Nagpur, Parshivni, Ramtek, Paoni | 21.31 |
| Employment | Bandara, Kamptee, Pench, Mansar, Nagpur Parshivni, Ramtek | 51.82 |
| Health | Deolpar, Parshivni, Pauni, Nagpur, Ramtek, Kamptee | 27.22 |
| Education | Parshivni, Mansar, Ramtek, Nagpur | 53.19 |
| Recreation | Nagpur, Ramtek | 61.5 |
| Purpose | Travel Destination for Selected Urban Areas in the Defined Study Corridor | Average Distance * (in Kilometers) |
|---|---|---|
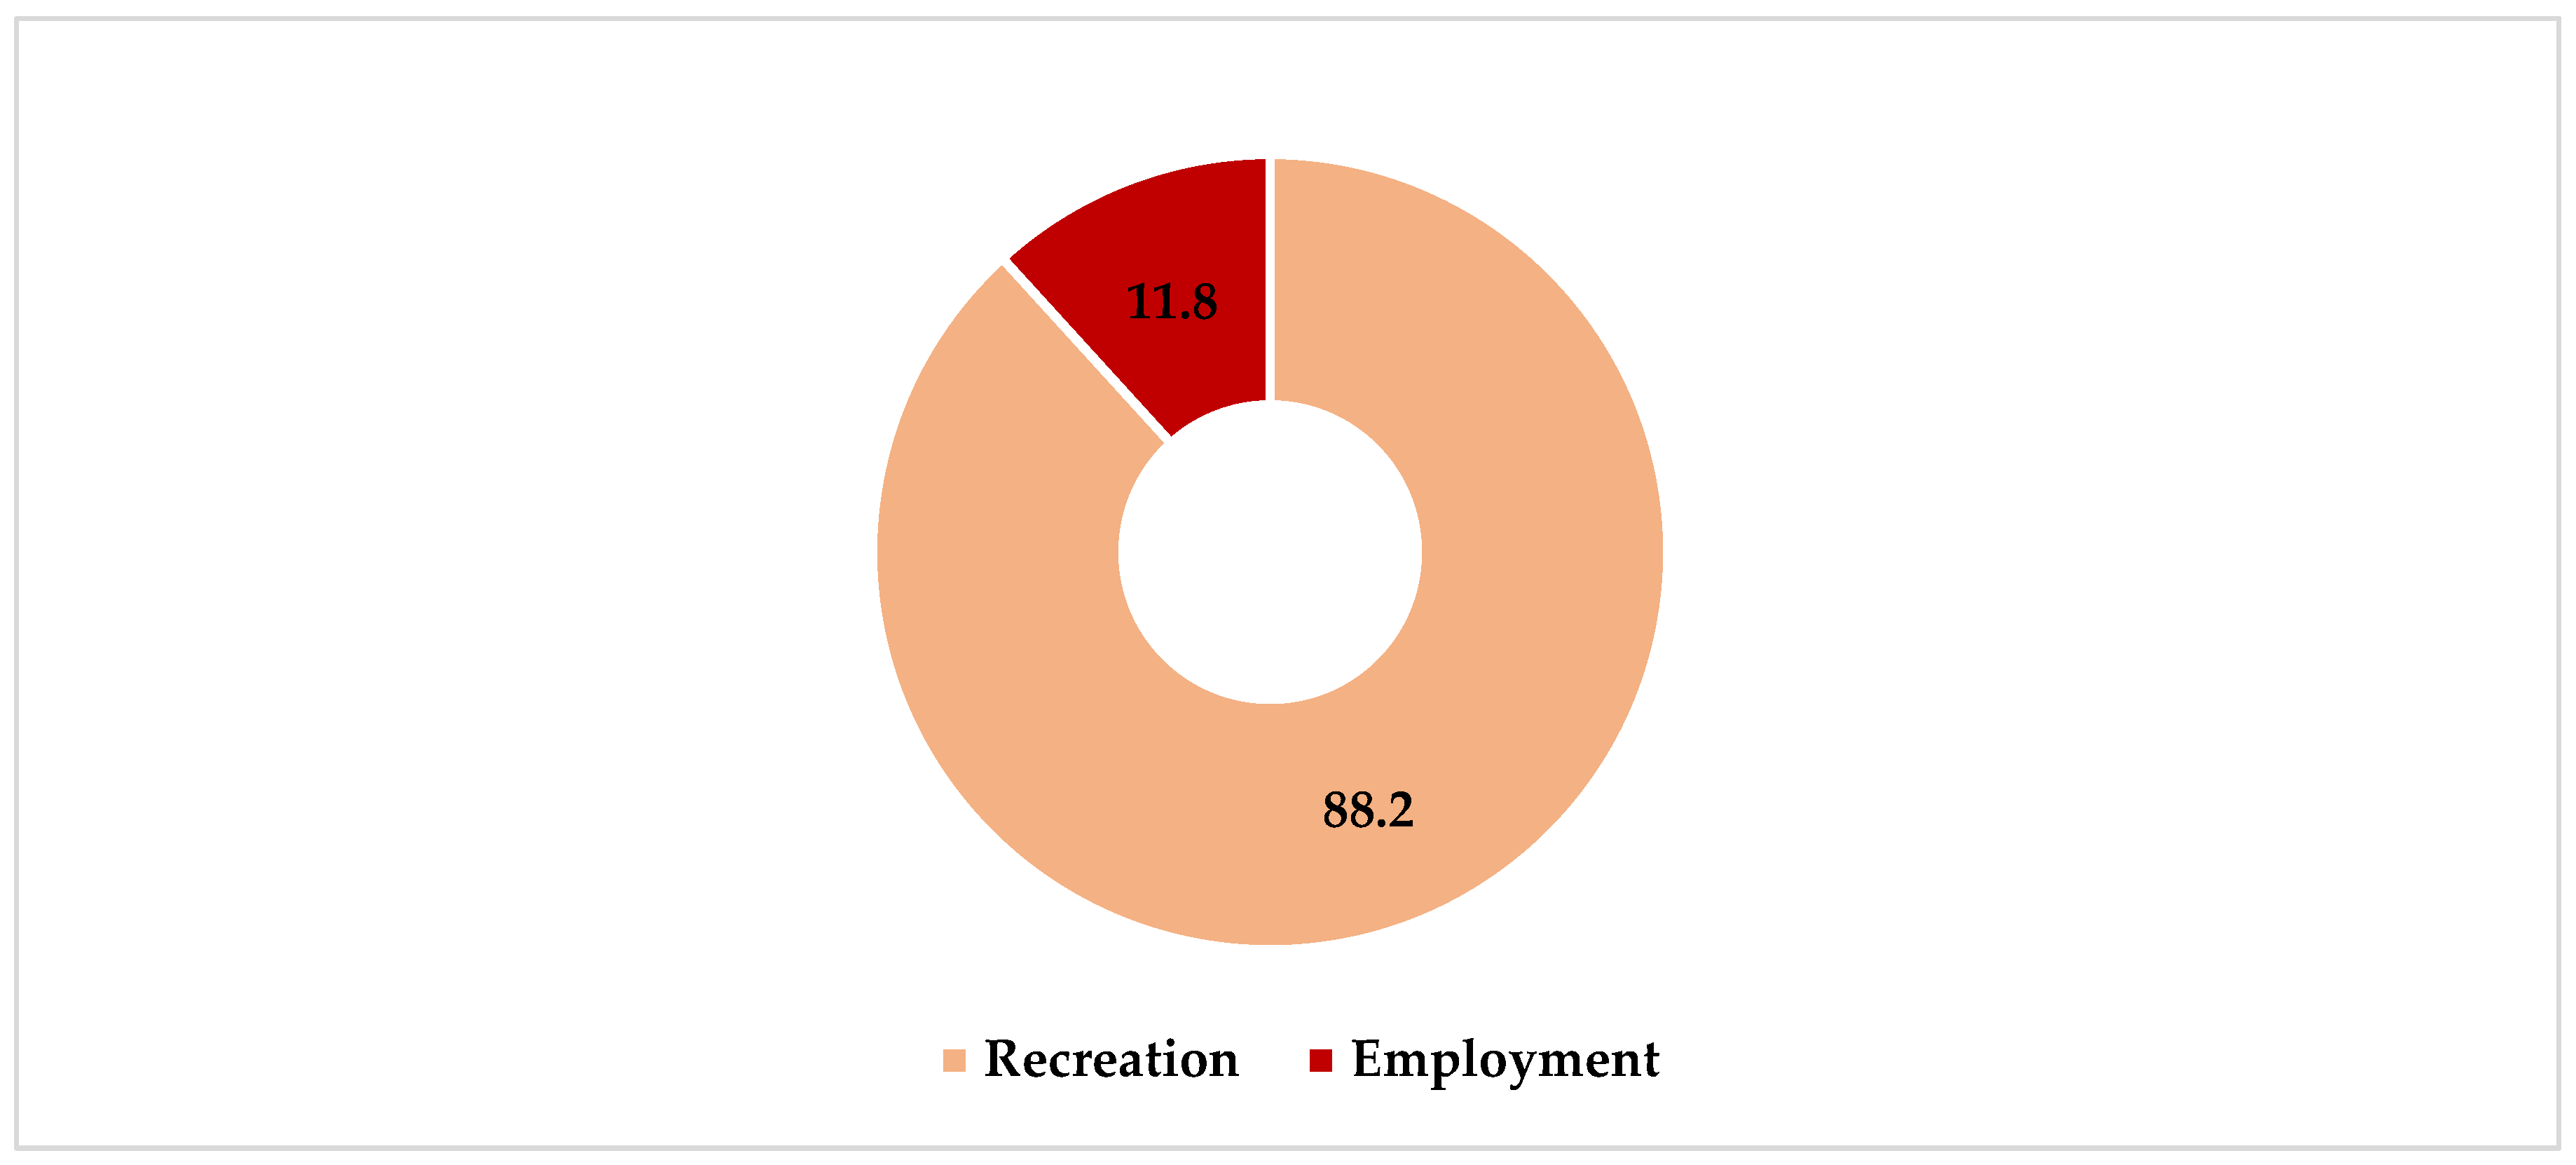
| Employment | Gorewada, Itwari, Kamptee, Khindsi, Koradi, Shegaon, Nagpur, Mahadula, Ramtek, Pench | 51.54 |
| Recreation | Akola, Mravati, Chandrapur, Chicholi, Gorewada, Kamptee, Kanhan, Kasturchand, Telang khedi, Khindsi, koradi, Mouda, Tadoba, Tekarghat, Pench, Ramtek | 67.55 |
Publisher’s Note: MDPI stays neutral with regard to jurisdictional claims in published maps and institutional affiliations. |
© 2020 by the authors. Licensee MDPI, Basel, Switzerland. This article is an open access article distributed under the terms and conditions of the Creative Commons Attribution (CC BY) license (http://creativecommons.org/licenses/by/4.0/).
Share and Cite
Thapa, K.; Sukhwani, V.; Deshkar, S.; Shaw, R.; Mitra, B.K. Strengthening Urban-Rural Resource Flow through Regional Circular and Ecological Sphere (R-CES) Approach in Nagpur, India. Sustainability 2020, 12, 8663. https://doi.org/10.3390/su12208663
Thapa K, Sukhwani V, Deshkar S, Shaw R, Mitra BK. Strengthening Urban-Rural Resource Flow through Regional Circular and Ecological Sphere (R-CES) Approach in Nagpur, India. Sustainability. 2020; 12(20):8663. https://doi.org/10.3390/su12208663
Chicago/Turabian StyleThapa, Kamakshi, Vibhas Sukhwani, Sameer Deshkar, Rajib Shaw, and Bijon Kumer Mitra. 2020. "Strengthening Urban-Rural Resource Flow through Regional Circular and Ecological Sphere (R-CES) Approach in Nagpur, India" Sustainability 12, no. 20: 8663. https://doi.org/10.3390/su12208663
APA StyleThapa, K., Sukhwani, V., Deshkar, S., Shaw, R., & Mitra, B. K. (2020). Strengthening Urban-Rural Resource Flow through Regional Circular and Ecological Sphere (R-CES) Approach in Nagpur, India. Sustainability, 12(20), 8663. https://doi.org/10.3390/su12208663