Efficiency and Driving Factors of Green Development of Tourist Cities Based on Ecological Footprint
Abstract
1. Introduction
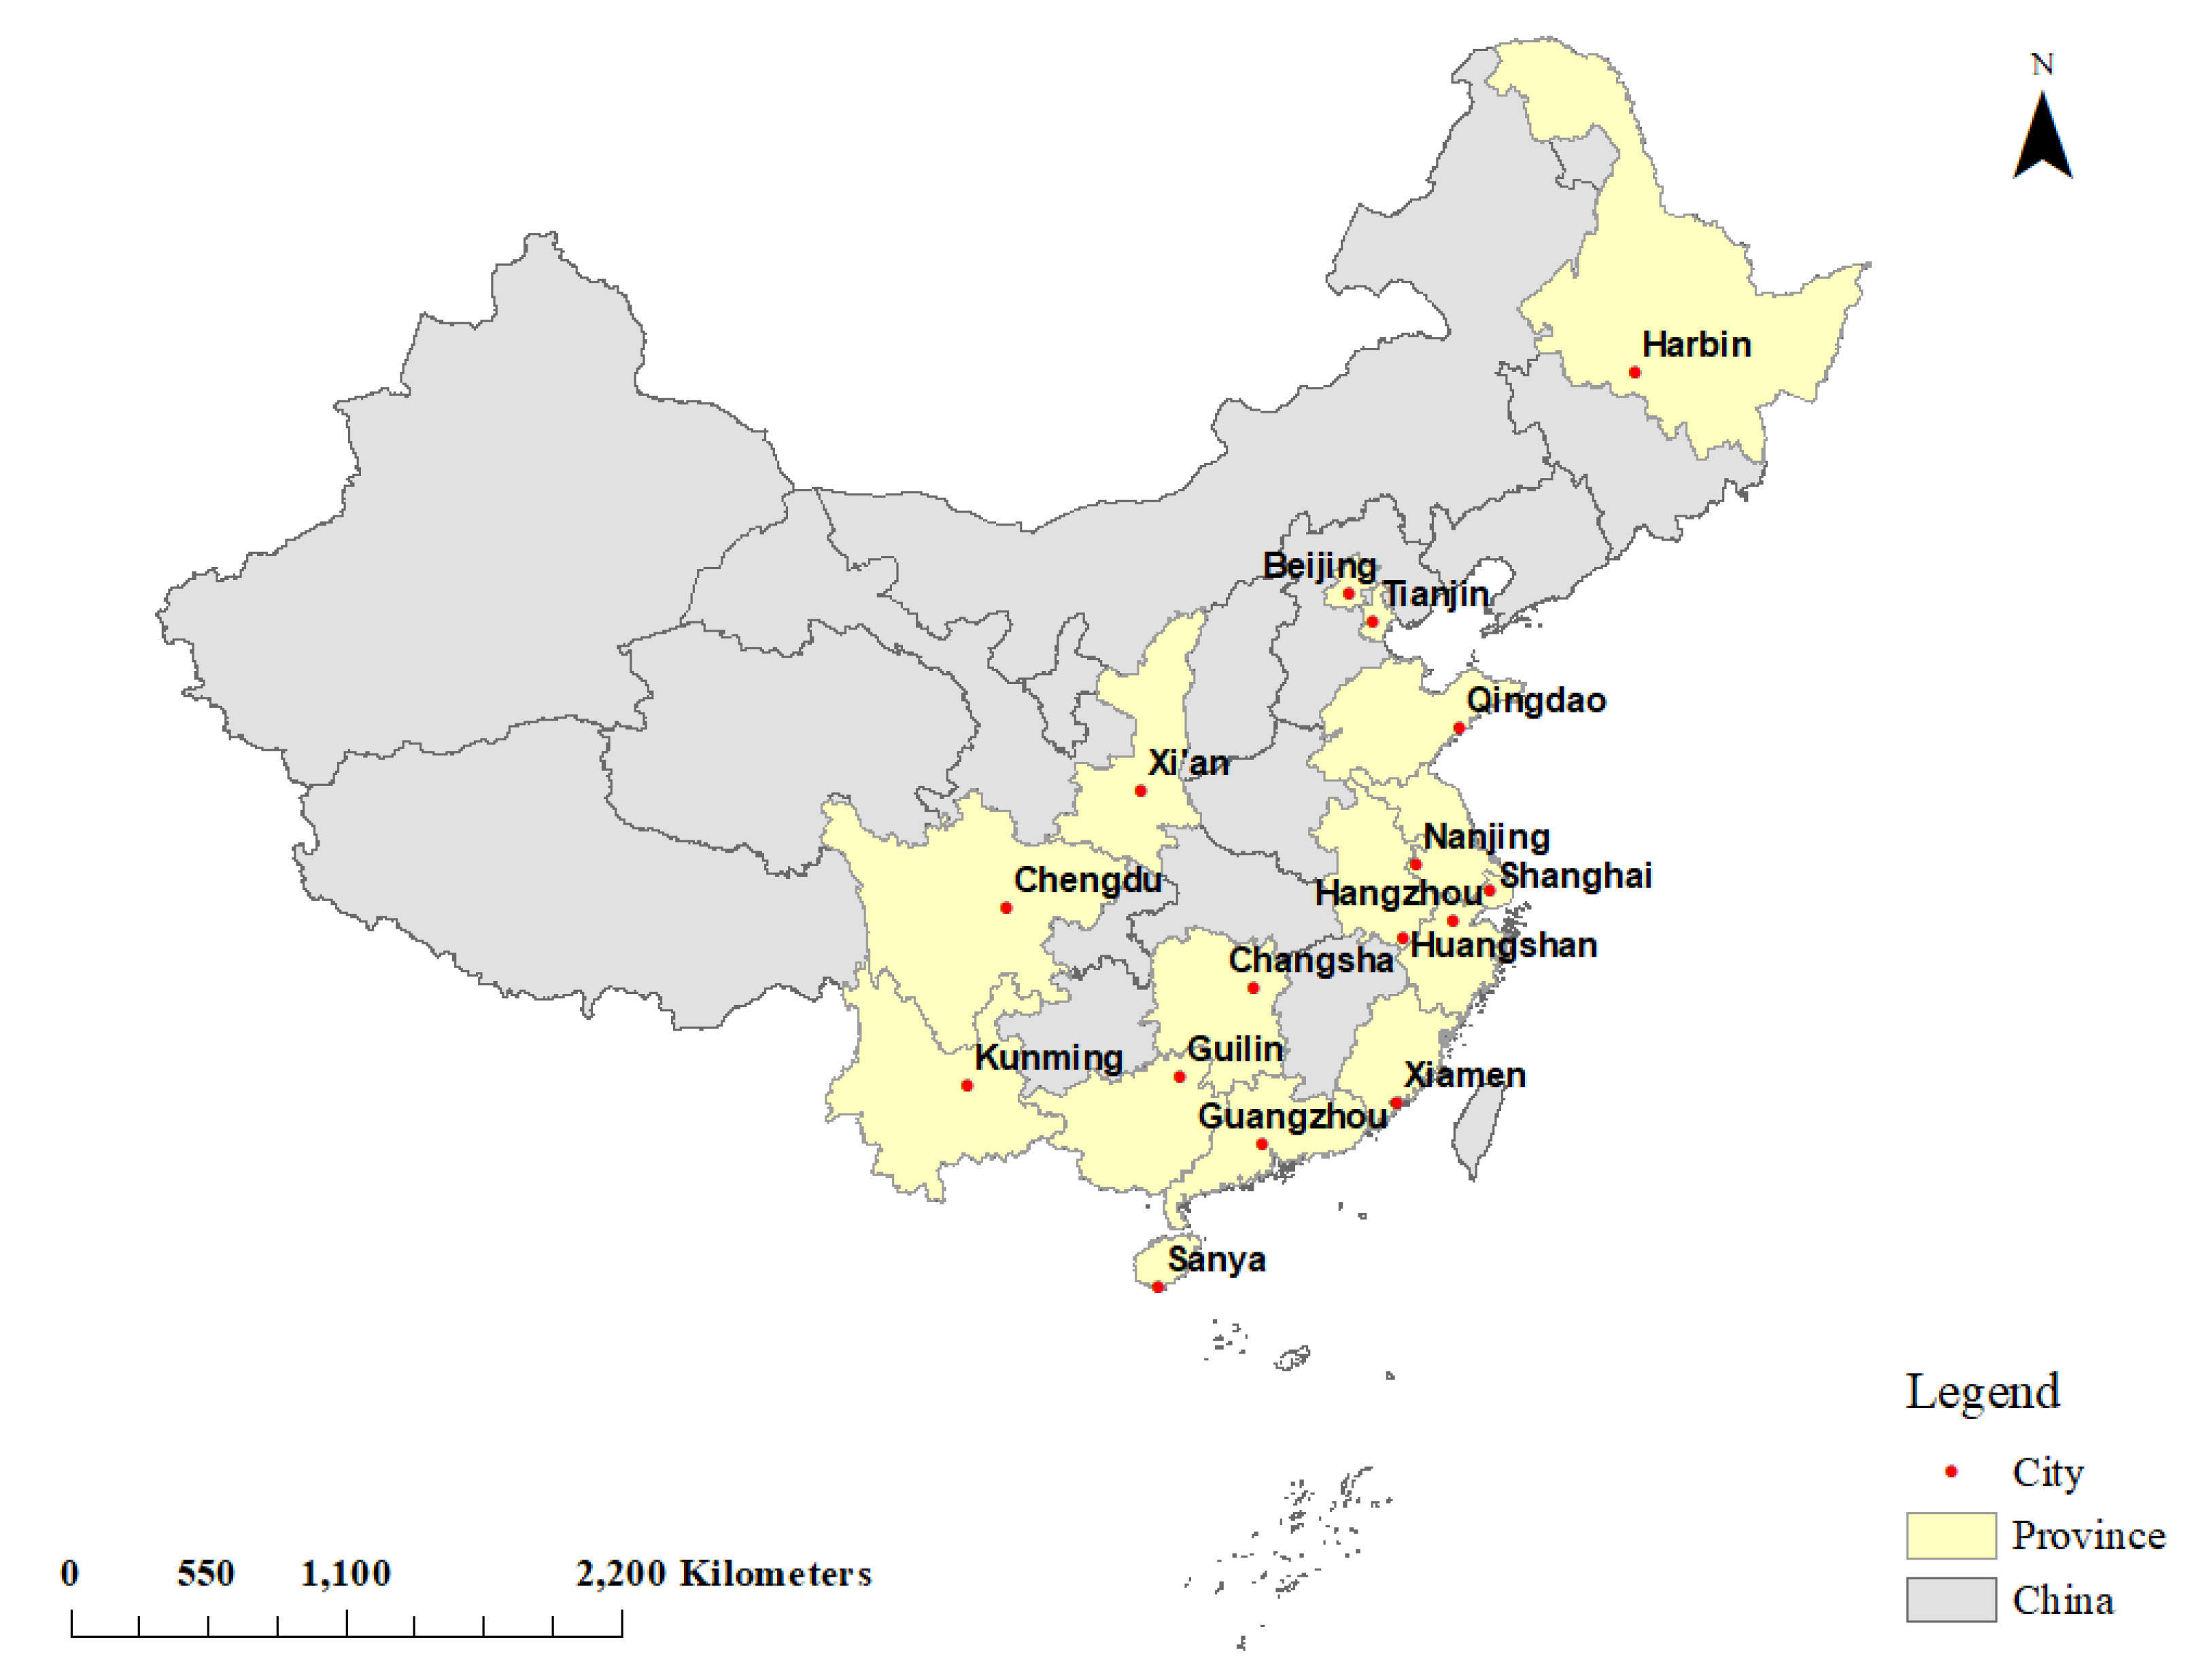
2. Study Area
3. Methods and Data
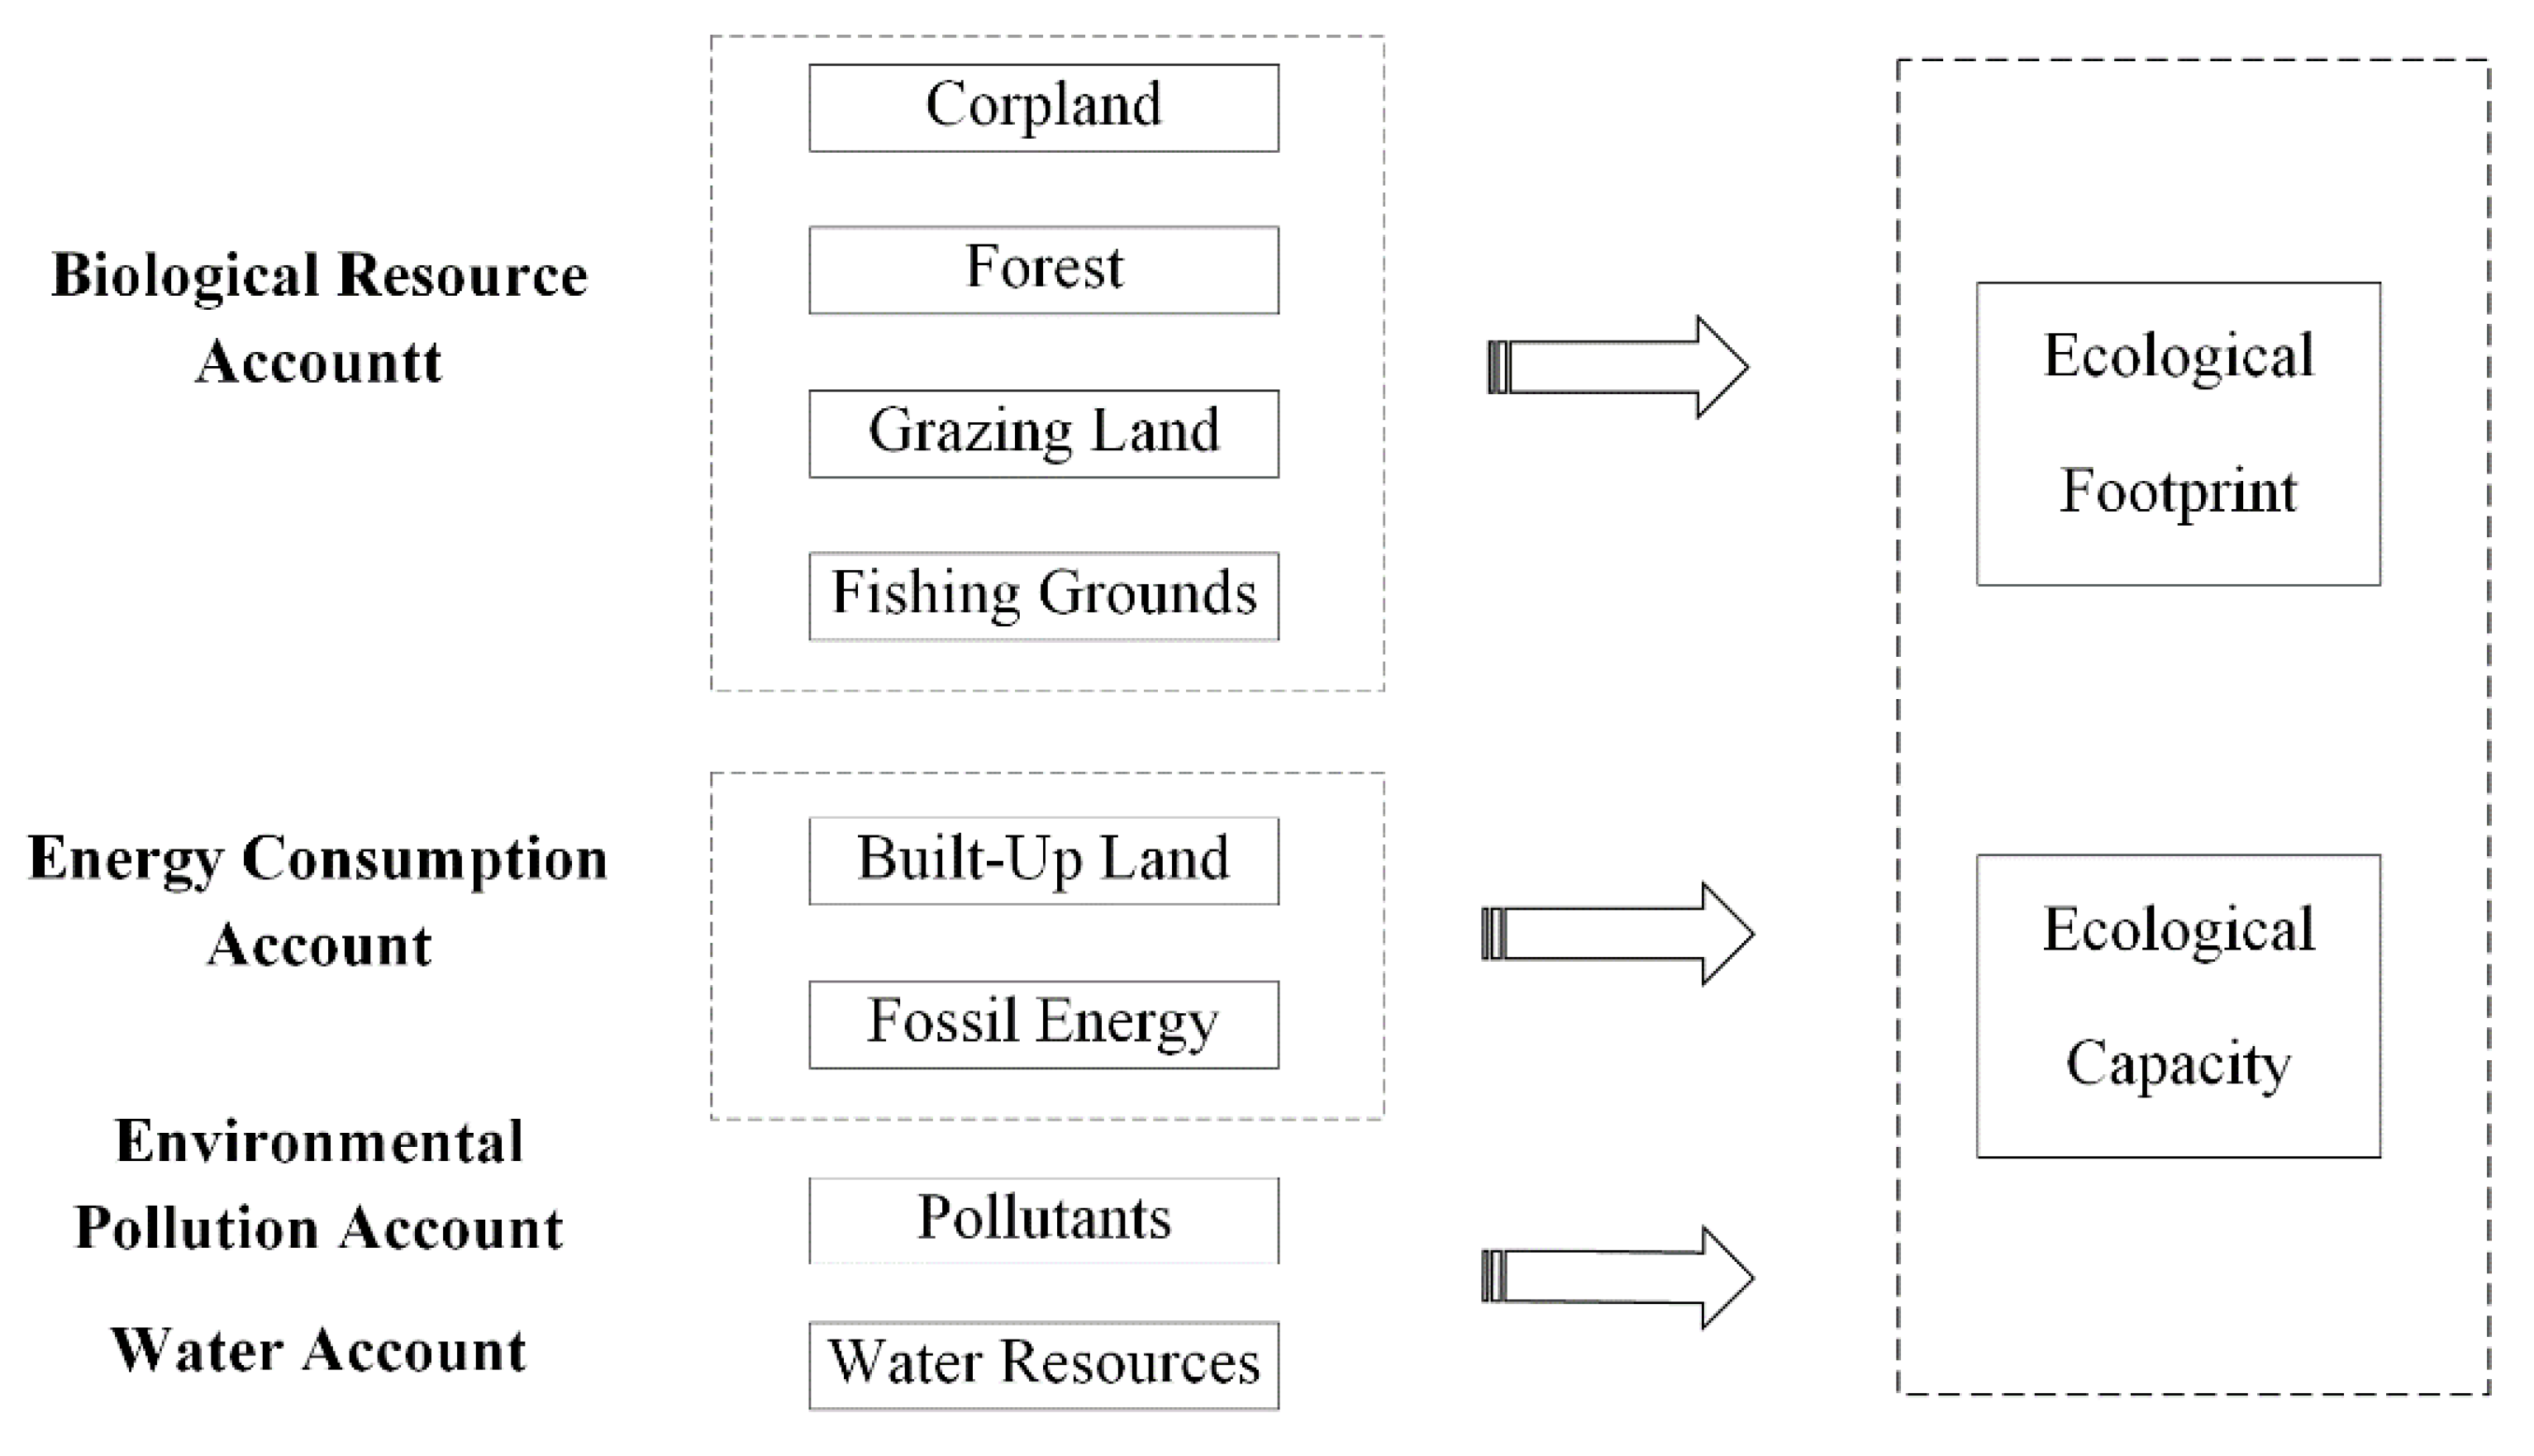
3.1. Calculation Model and Evaluation Indexes
3.1.1. Improvement of the Calculation Model
3.1.2. Calculation of EF
3.1.3. Calculation of EC
3.2. Evaluation Method of the Green Development Efficiency
3.3. Determination of Driving Factors
3.4. Cluster Analysis
3.5. Data Sources
4. Results and Discussions
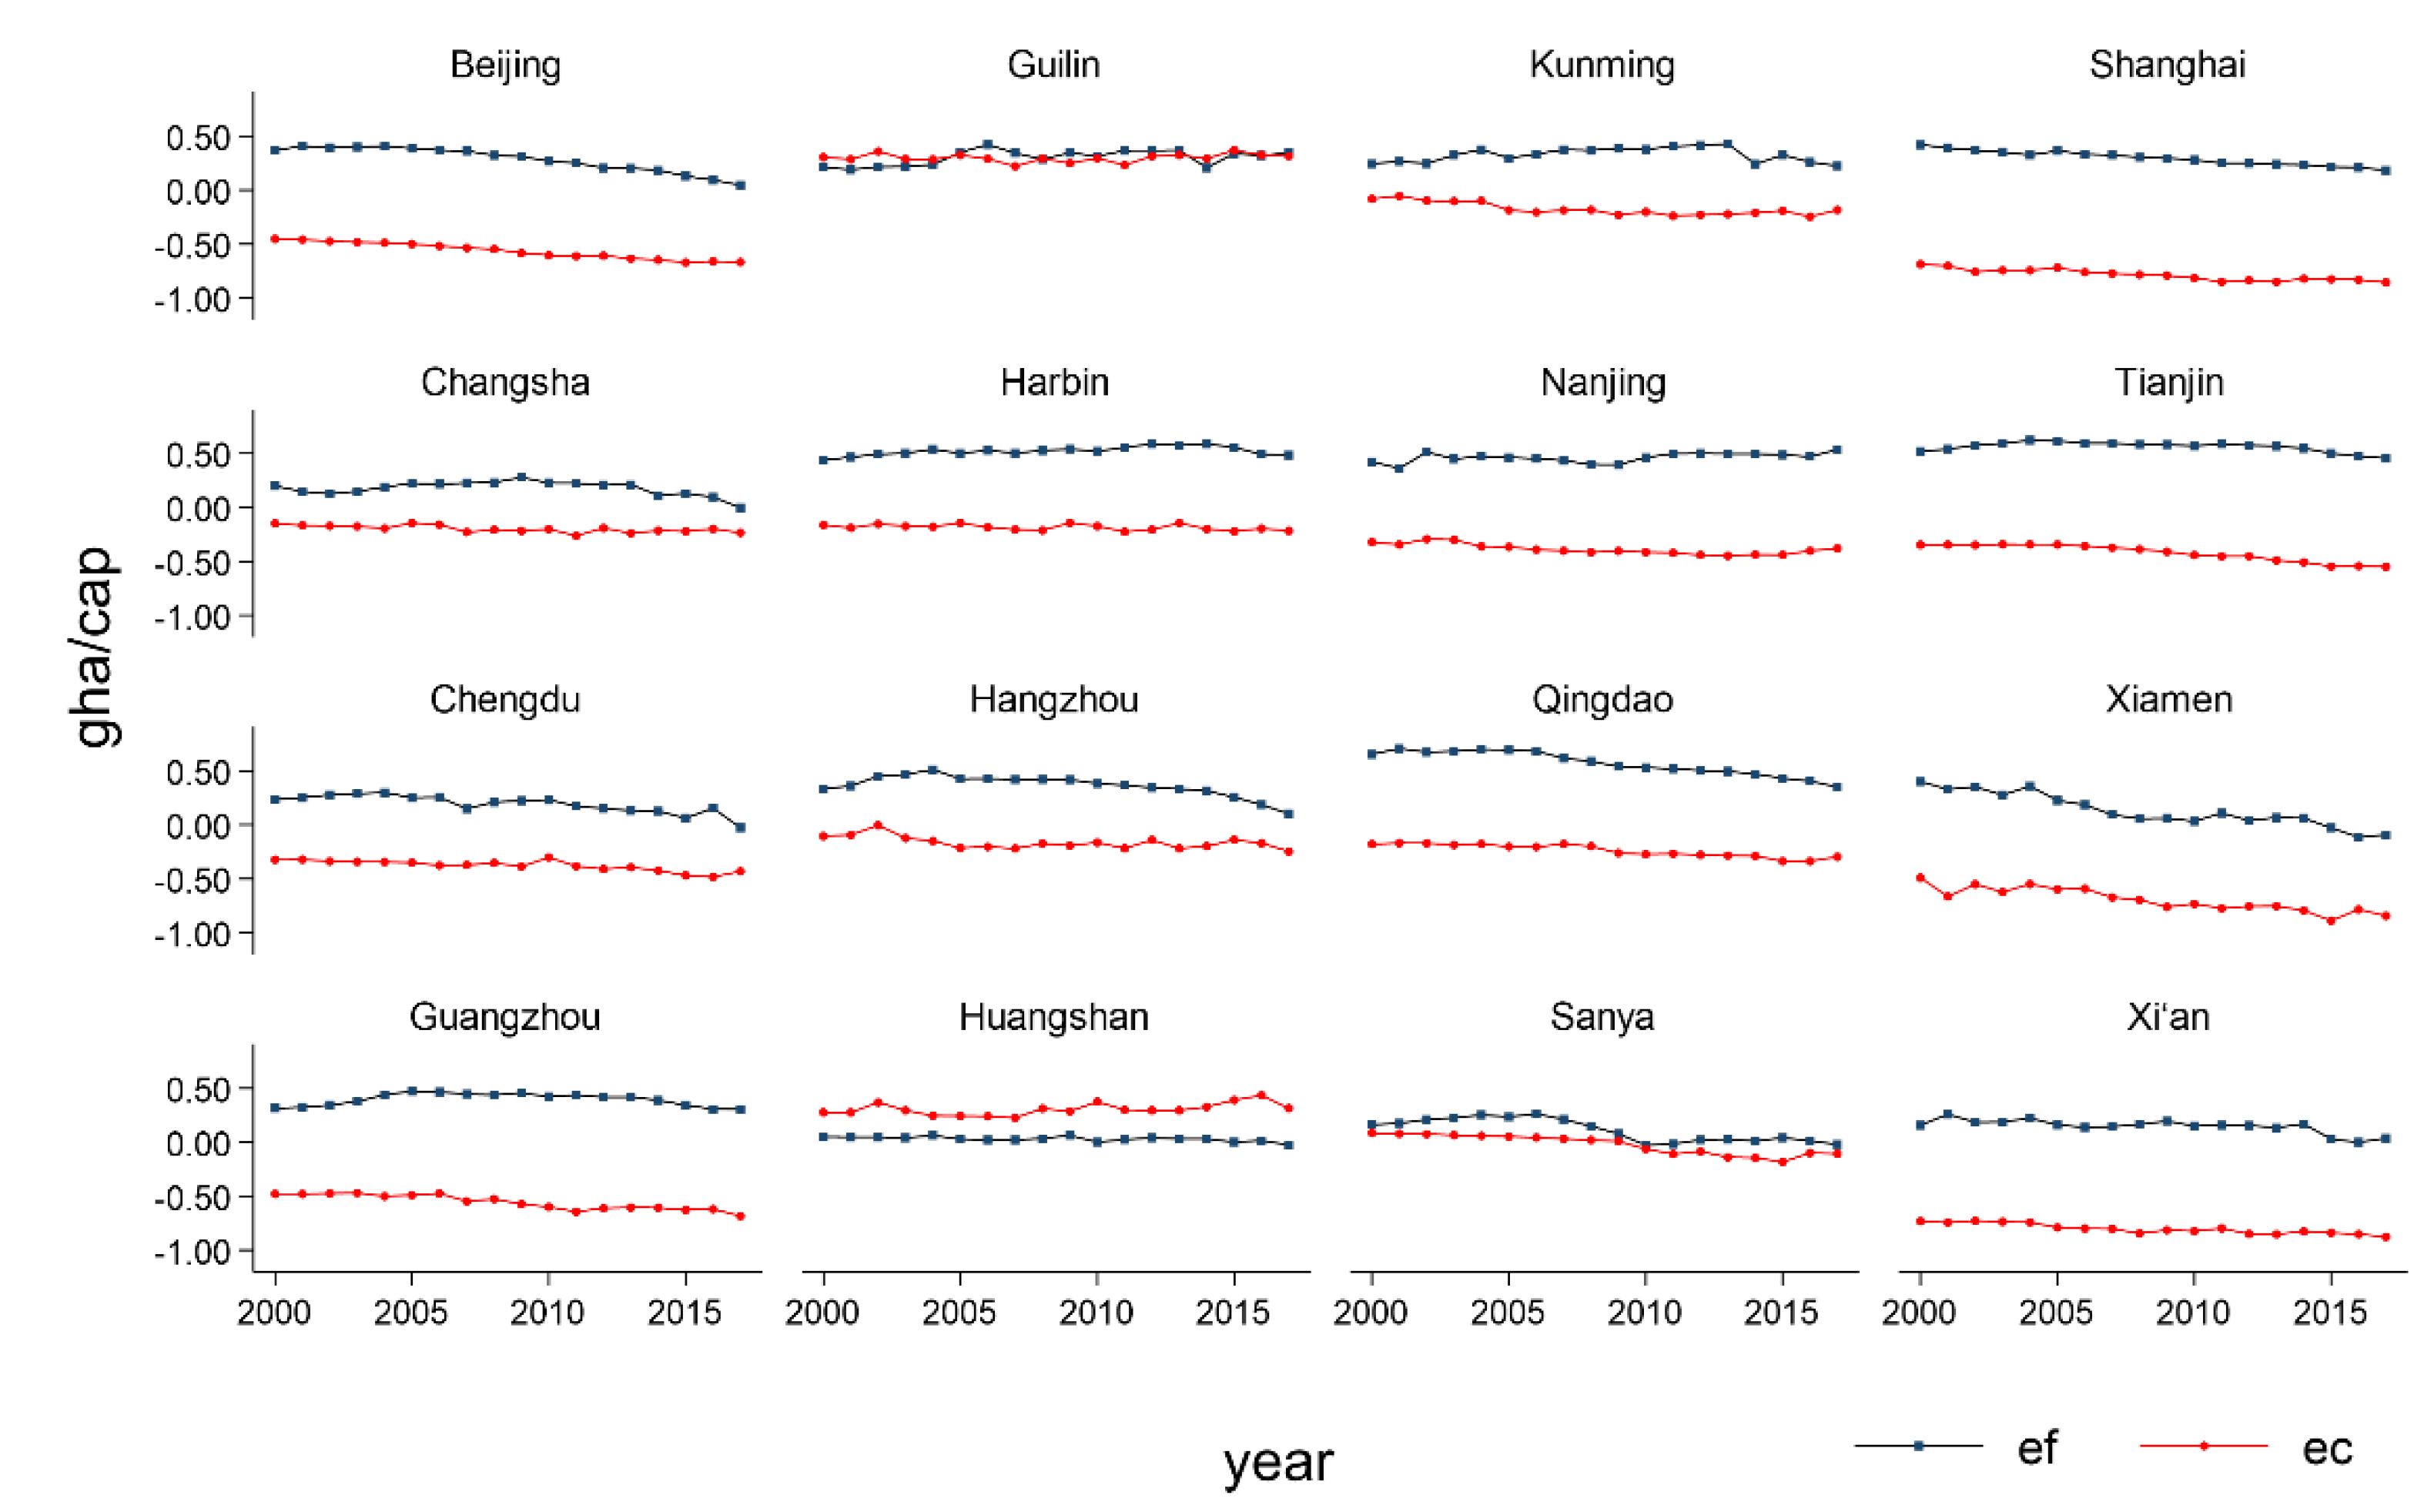
4.1. Dynamic Analysis of EF and EC
4.2. Evaluation of the Green Development Efficiency
4.2.1. Dynamic Analysis of EFI
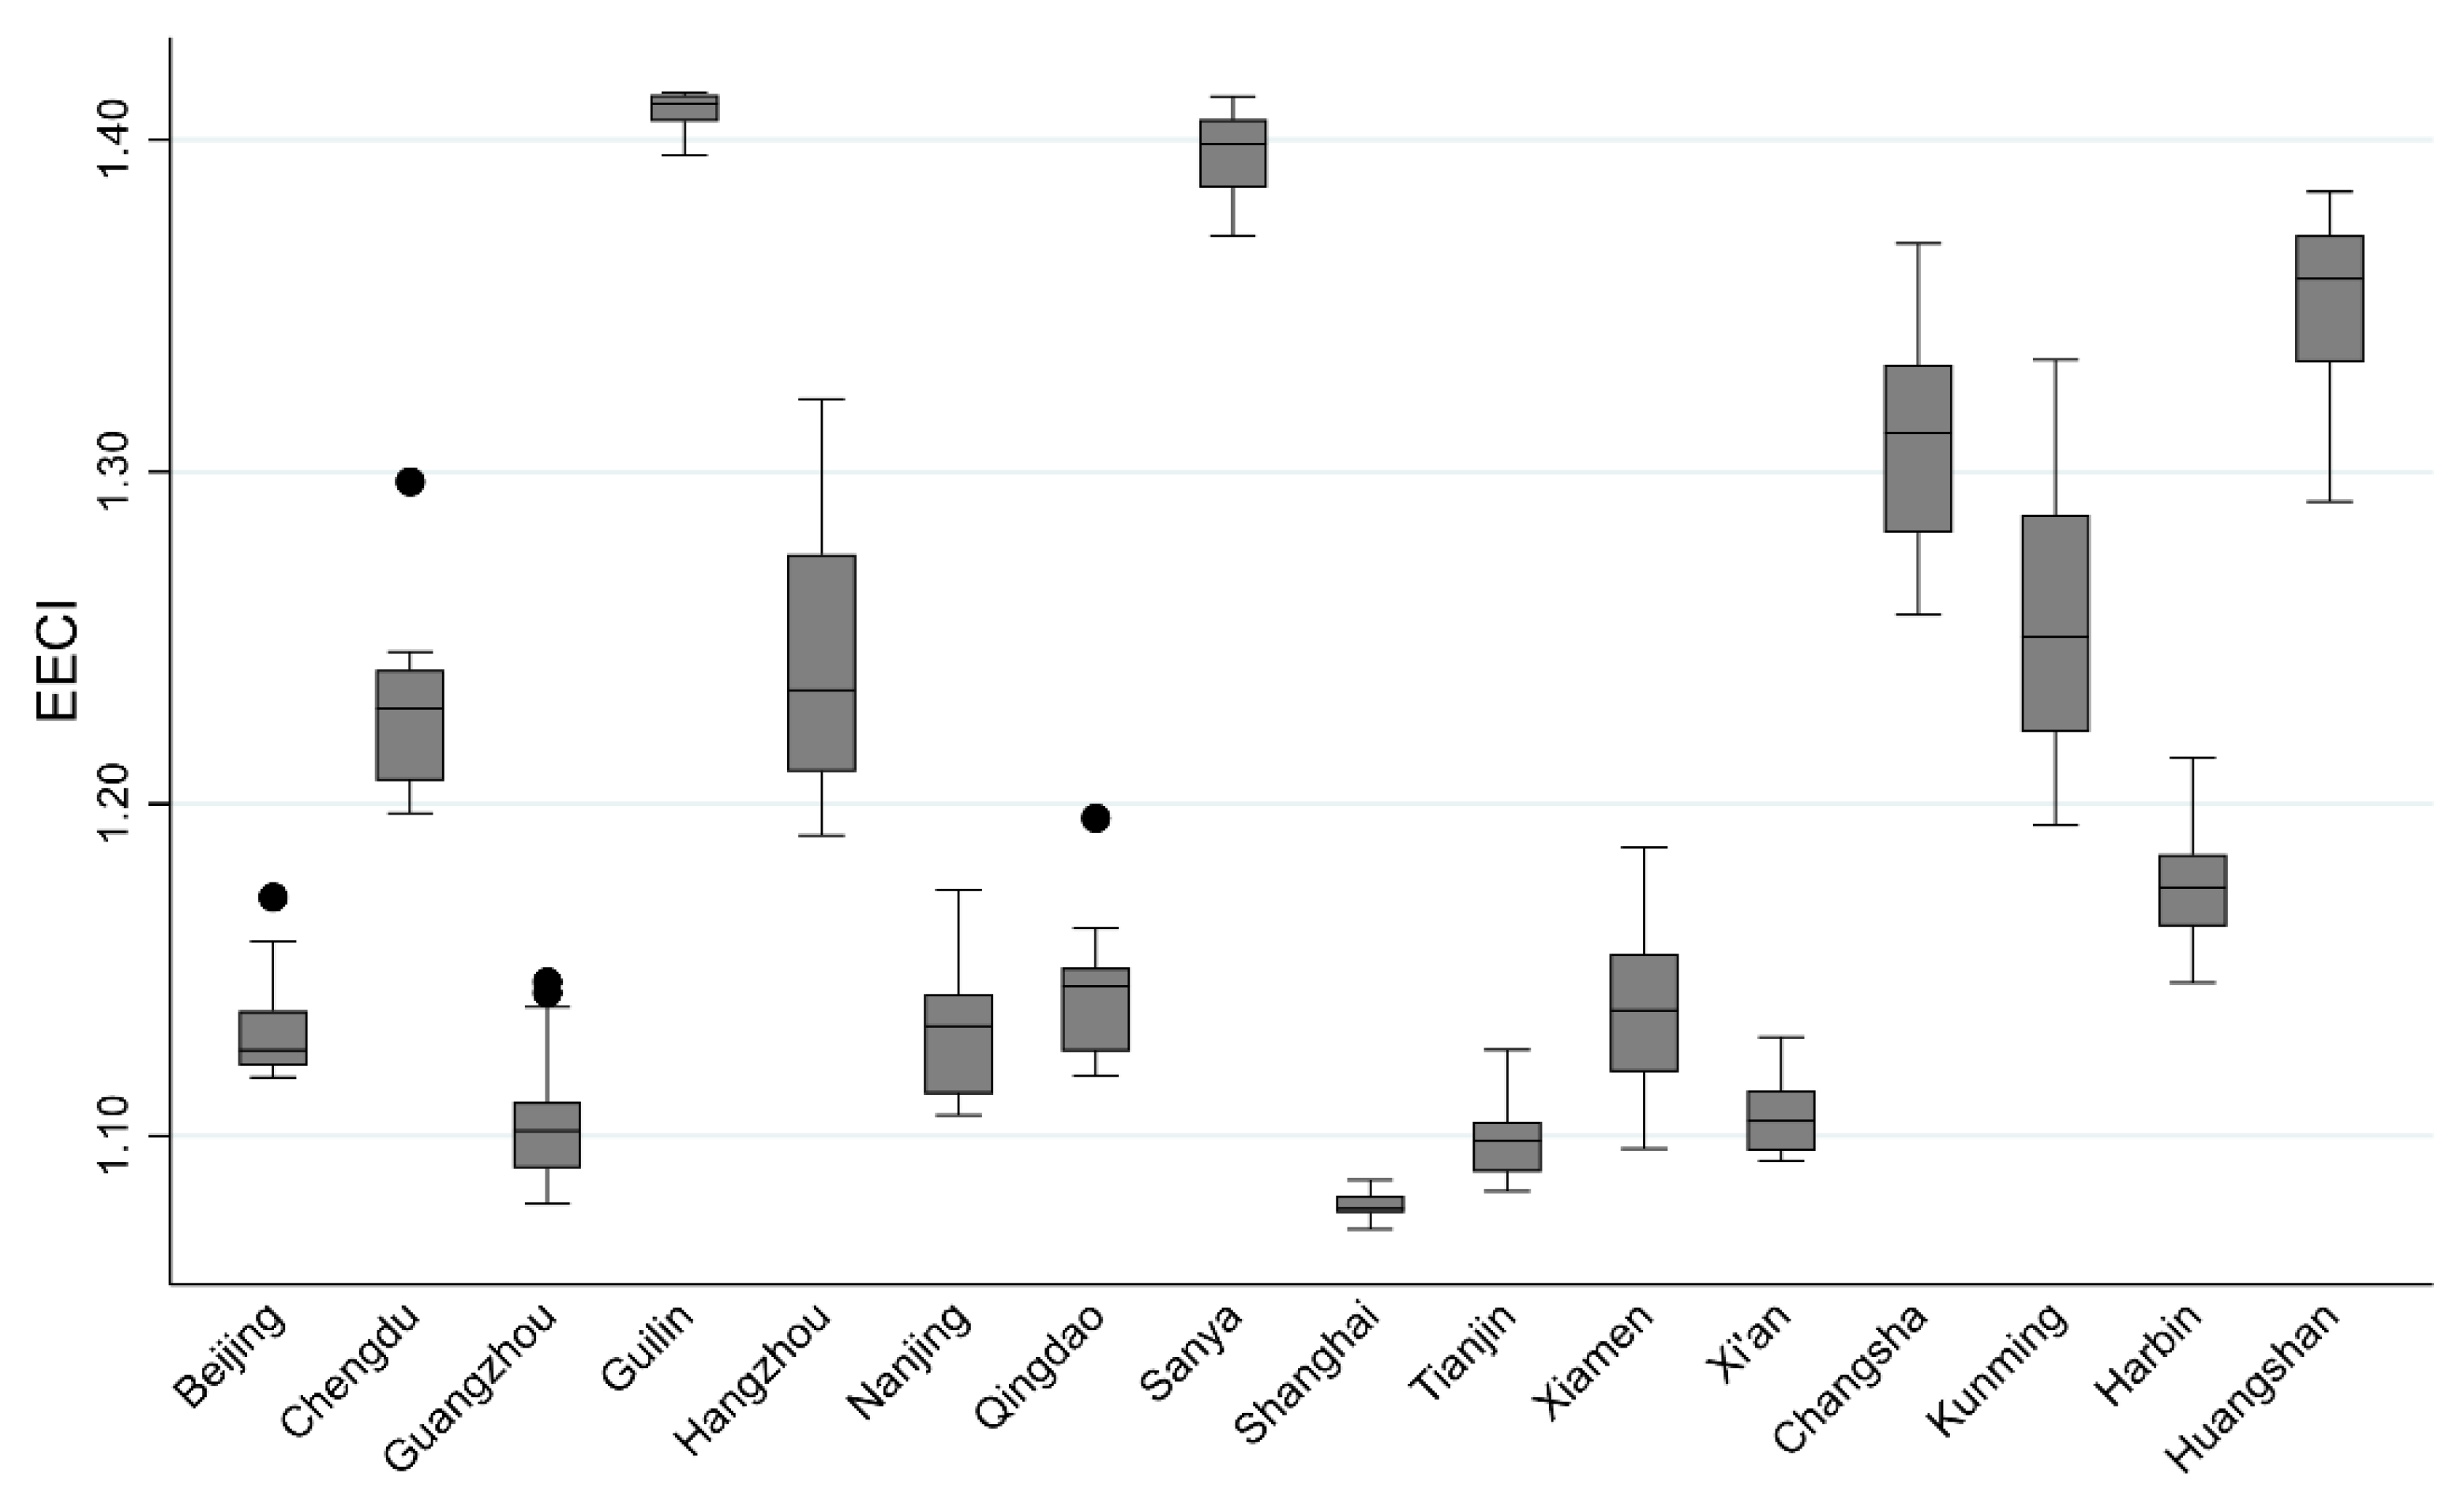
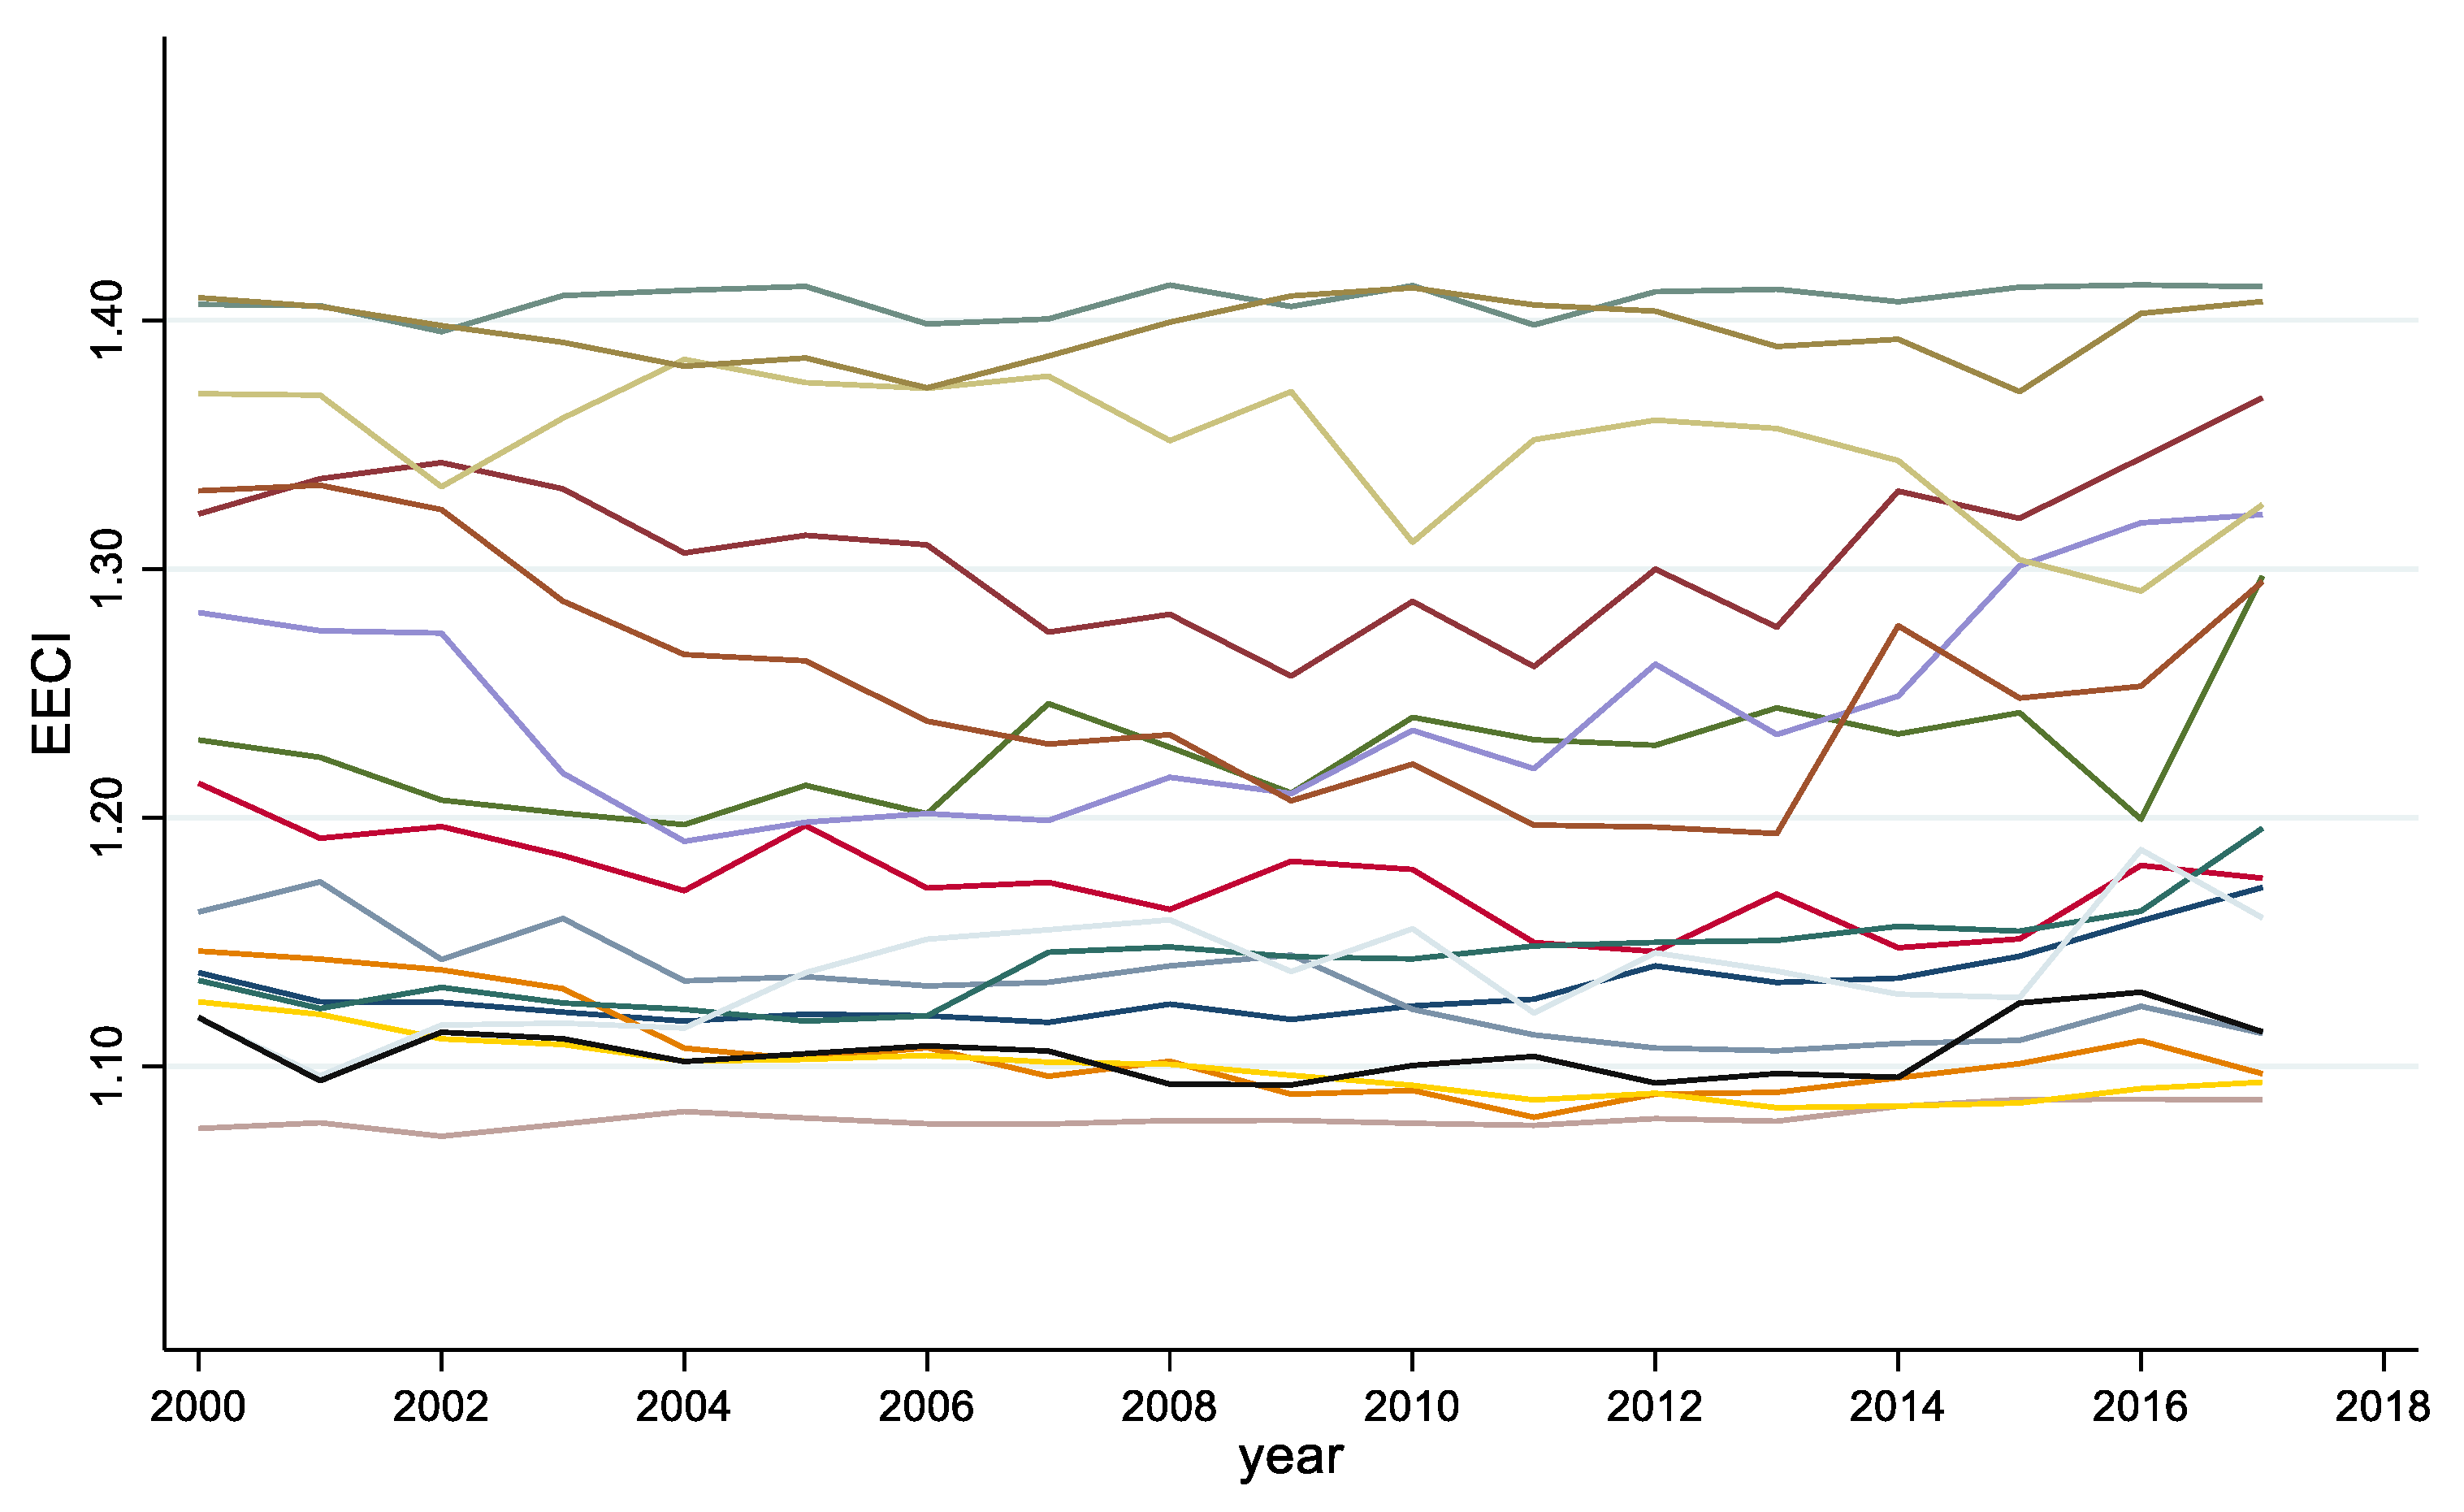
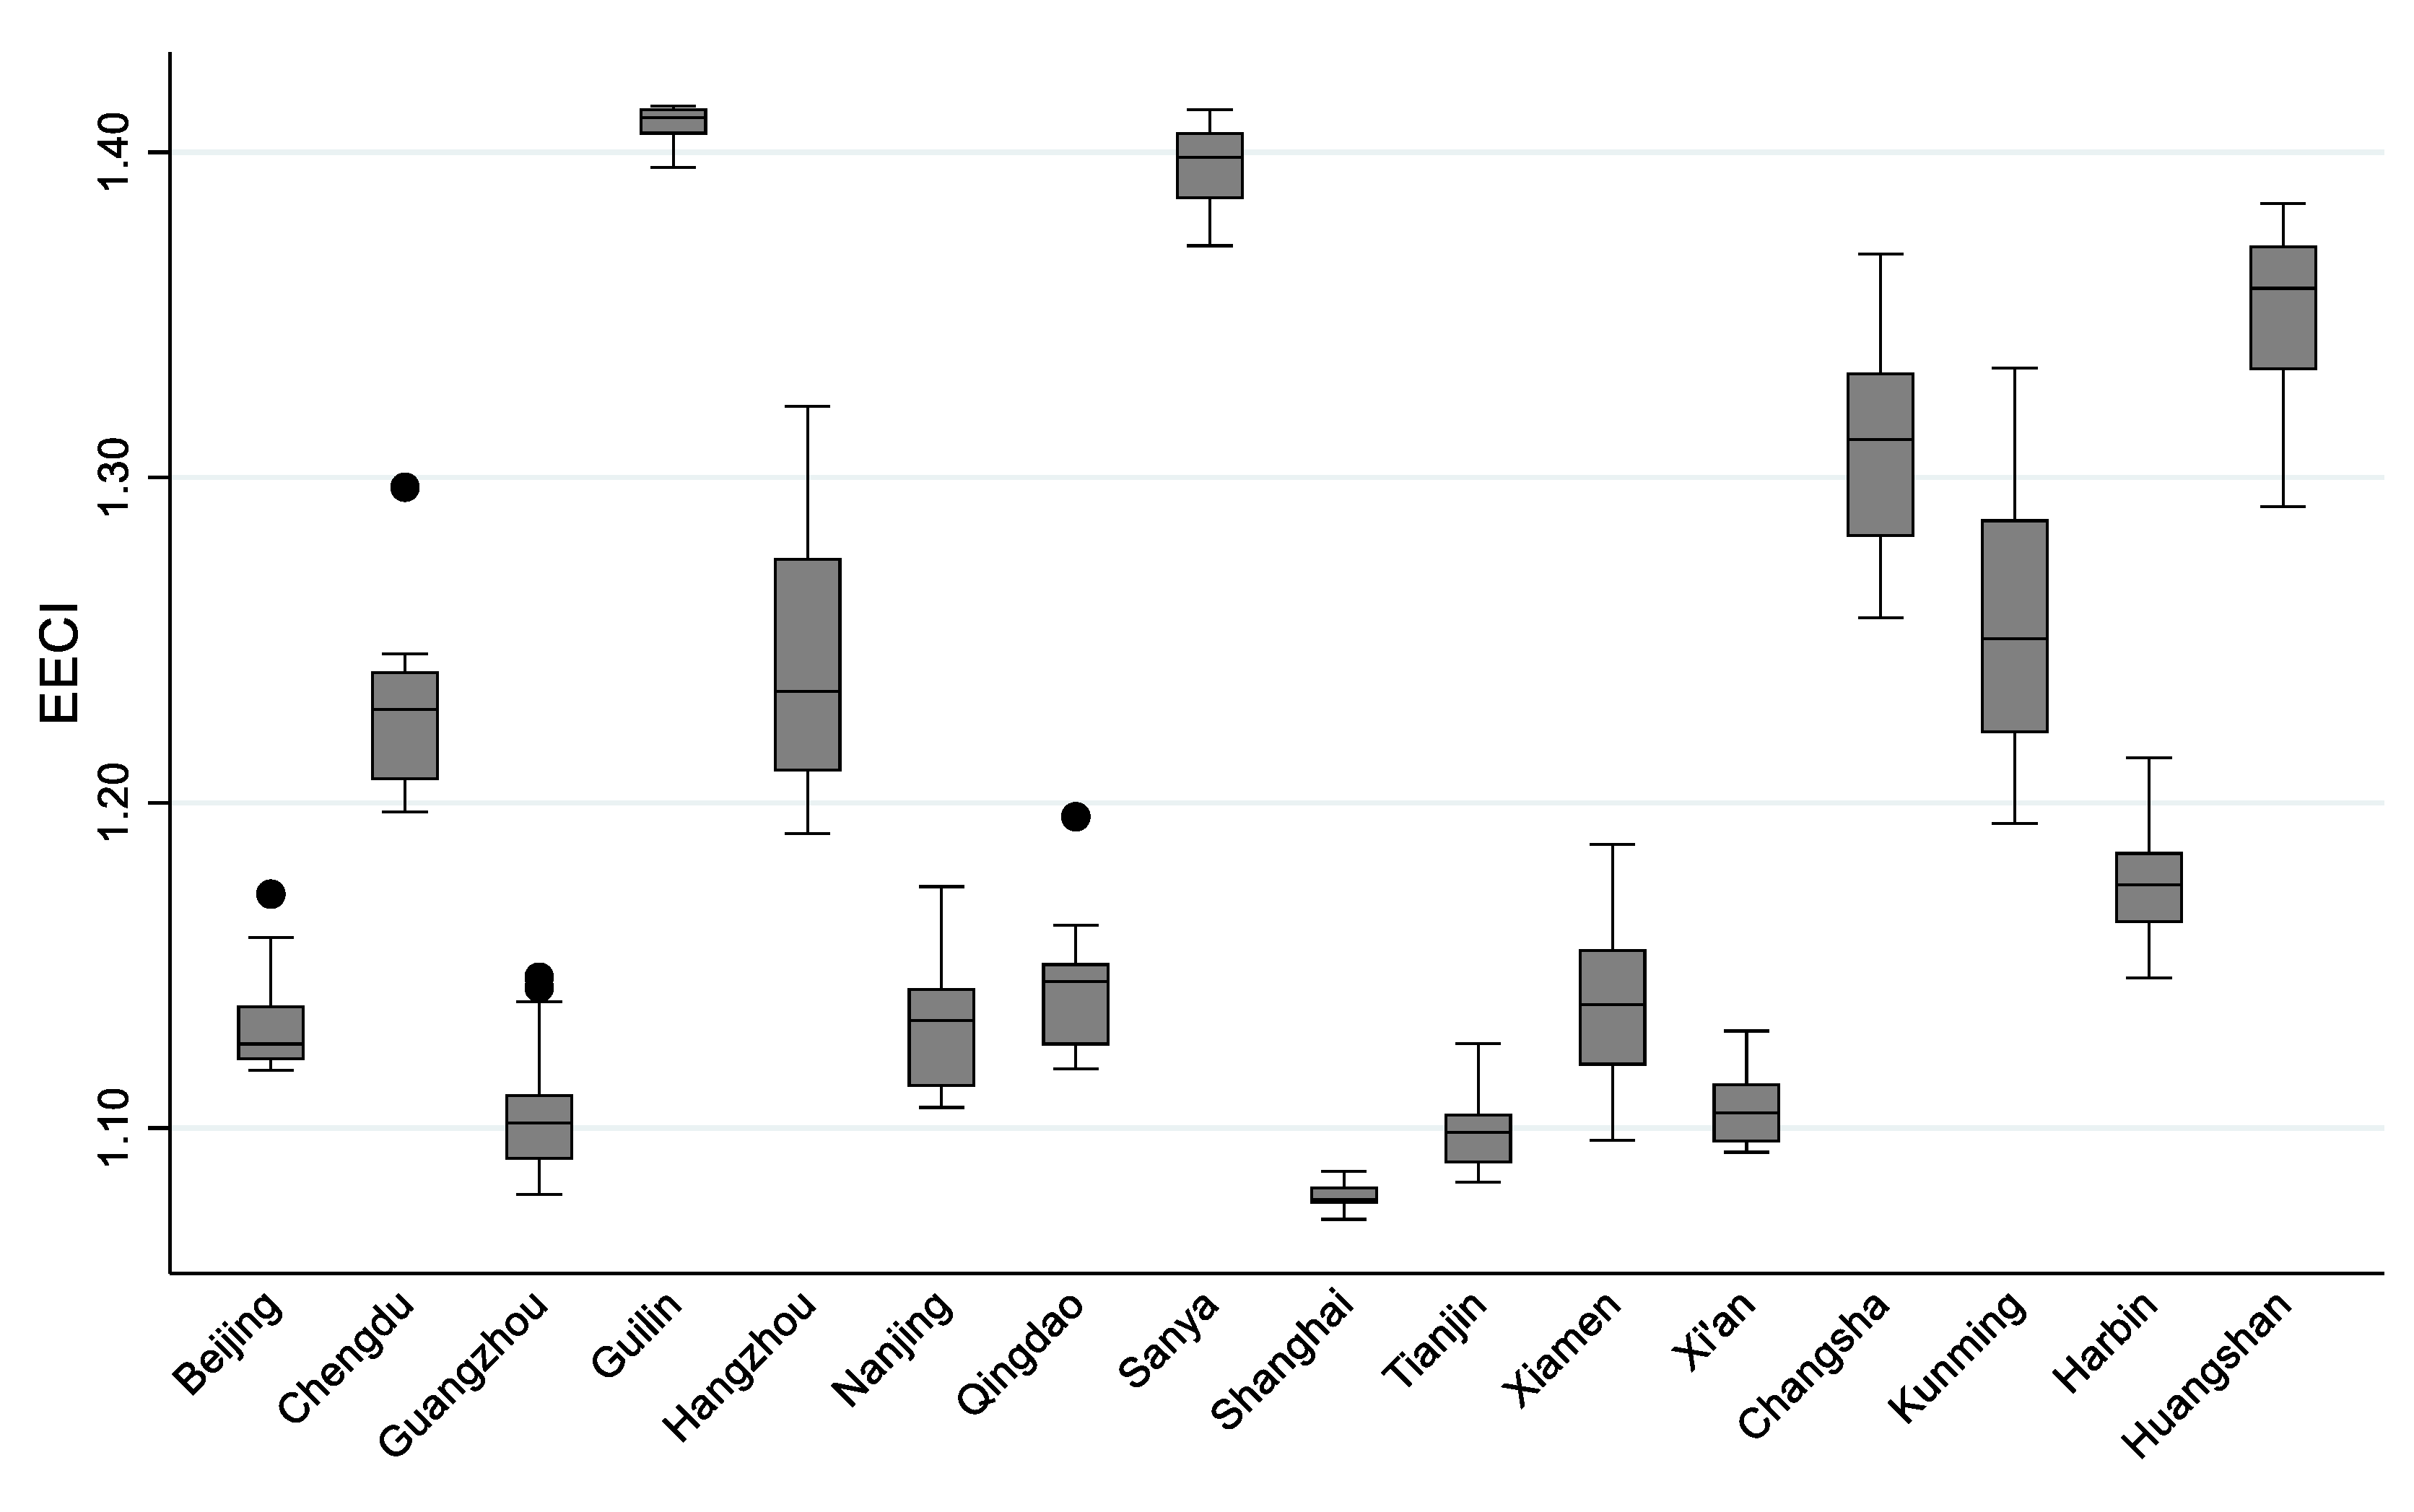
4.2.2. Dynamic Changes of EECI
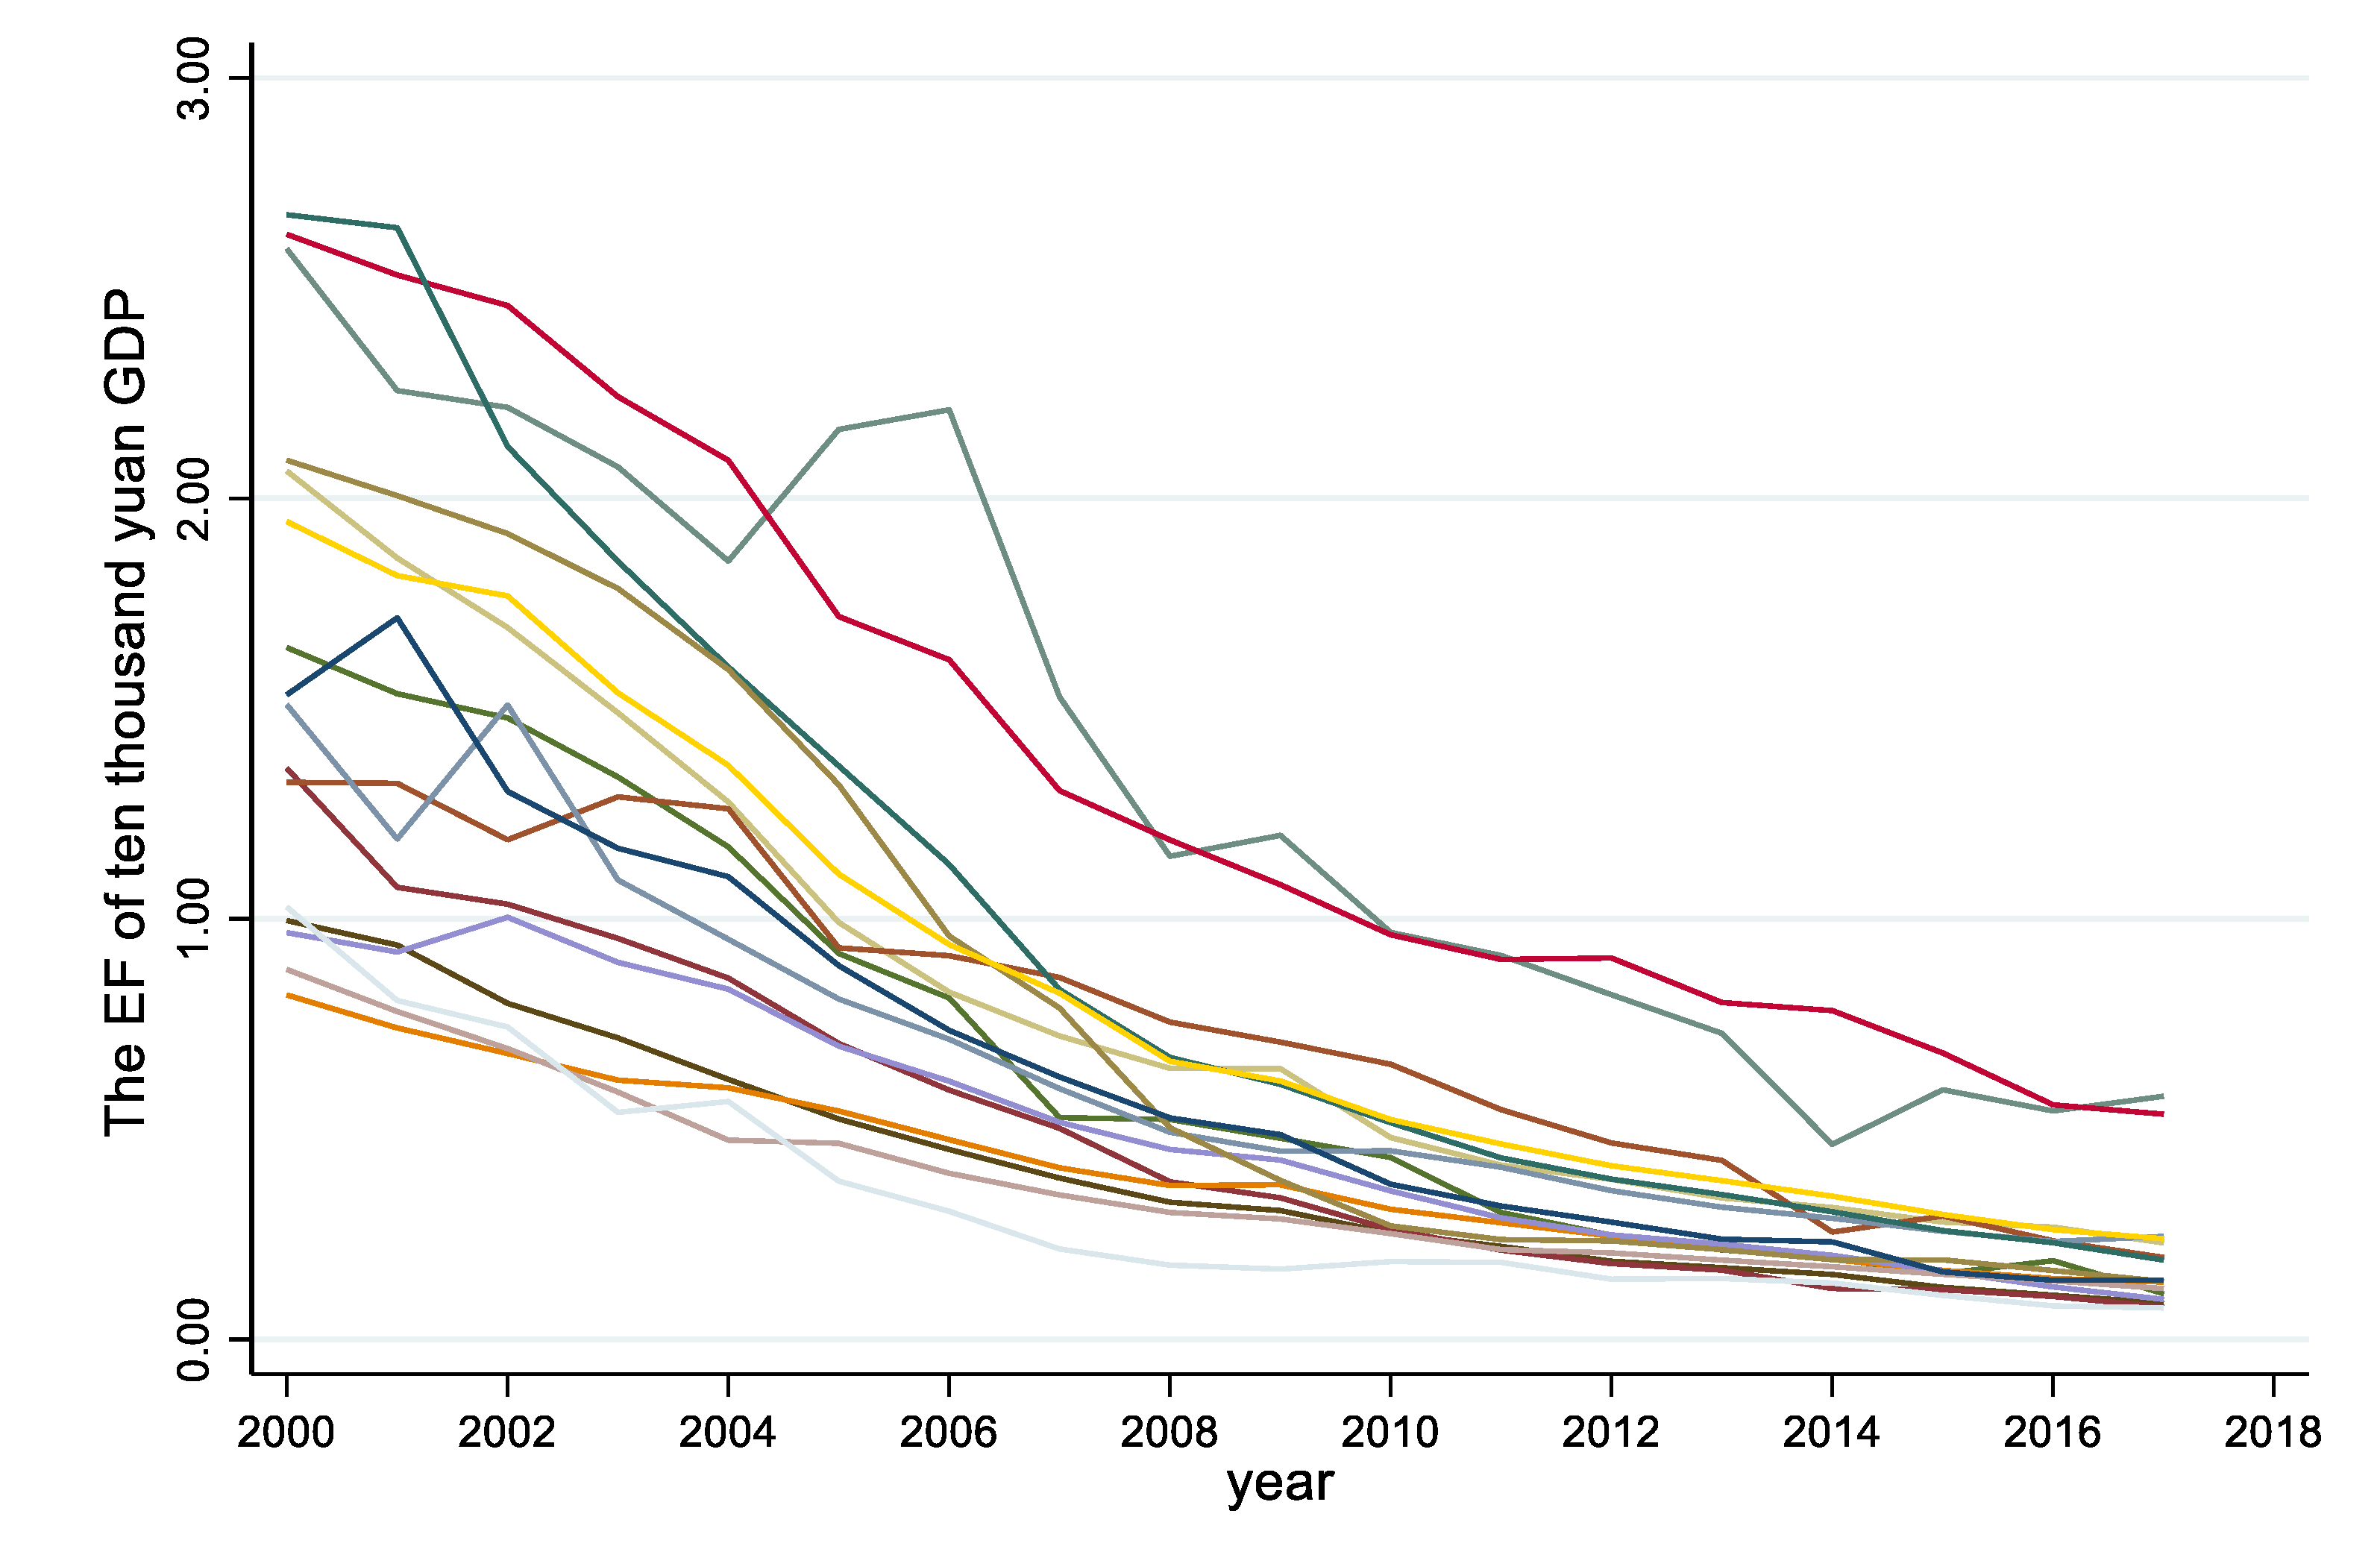
4.2.3. Dynamic Changes in the EF of Ten Thousand Yuan GDP
4.3. Analysis of Driving Factors
4.3.1. Determination of Regression Model
4.3.2. Analysis of Driving Factors of Economic Subsystem
4.3.3. Analysis of Driving Factors of Social Subsystem
4.3.4. Analysis of Driving Factors of Ecological Subsystem
4.3.5. Analysis of Driving Factors of Tourism Subsystem
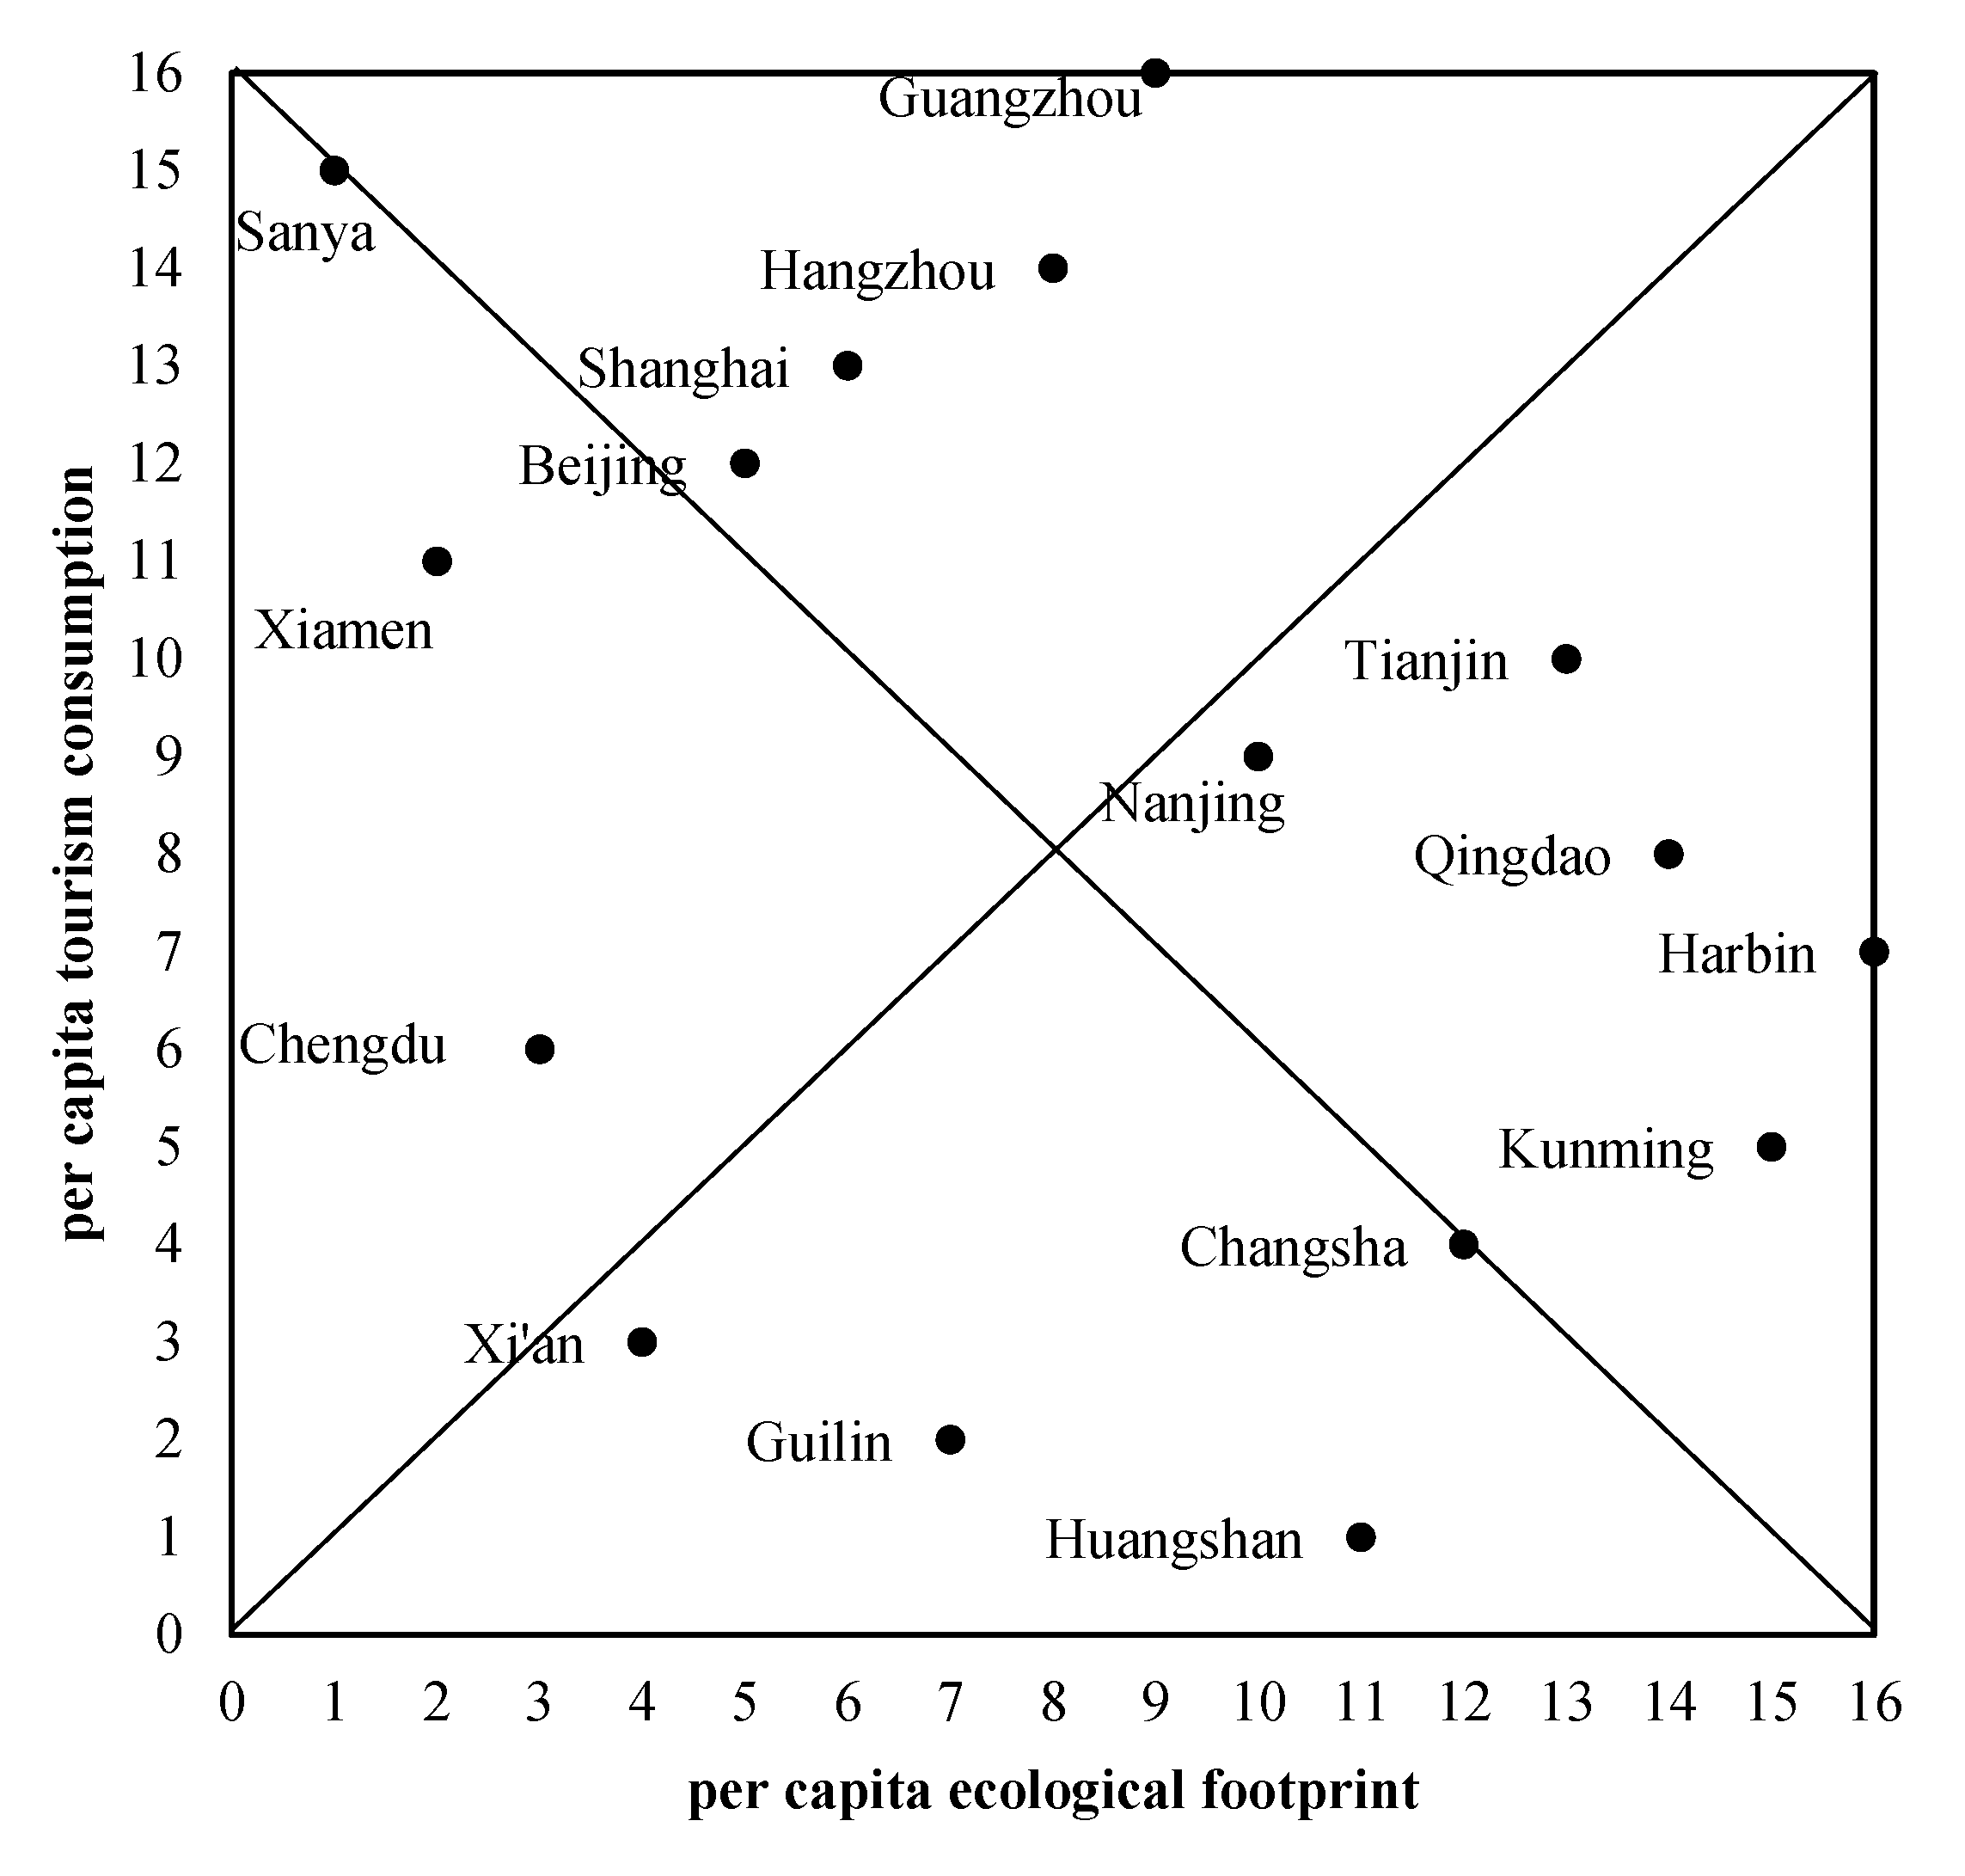
4.4. Classification Analysis of Tourist Cities
5. Conclusions and Suggestions
Author Contributions
Funding
Conflicts of Interest
References
- UNWTO. International Tourism Highlights, 2019 ed.; World Tourism Organization: Madrid, Spain, 2019; p. 23. [Google Scholar]
- WTCF. Report on World Tourism Economy Trends. Available online: https://en.wtcf.org.cn/Research/WTCFReports/2019011516448.html (accessed on 20 June 2020).
- Ministry of Culture and Tourism of the PRC Statistical Bulletin on Cultural and Tourism Development. Available online: https://www.mct.gov.cn/whzx/ggtz/202006/t20200620_872735.htm (accessed on 20 June 2020).
- Hall, C.M. Constructing sustainable tourism development: The 2030 agenda and the managerial ecology of sustainable tourism. J. Sustain. Tour. 2019, 27, 1044–1060. [Google Scholar] [CrossRef]
- Mercado, L.; Lassoie, J.P. Assessing Tourists’ Preferences for Recreational and Environmental Management Programs Central to the Sustainable Development of a Tourism Area in the Dominican Republic. Environ. Dev. Sustain. 2002, 4, 253–278. [Google Scholar] [CrossRef]
- Onder, I.; Wober, K.; Zekan, B. Towards a sustainable urban tourism development in Europe. Tour. Econ. 2017, 23, 243–259. [Google Scholar] [CrossRef]
- Benckendorff, P.J.; Pearce, P.L. Australian Tourist Attractions: The Links between Organizational Characteristics and Planning. J. Travel Res. 2003, 42, 24–35. [Google Scholar] [CrossRef]
- Pearce, P.L.; Lee, U.-I. Developing the Travel Career Approach to Tourist Motivation. J. Travel Res. 2005, 43, 226–237. [Google Scholar] [CrossRef]
- Ashworth, G.; Page, S.J. Urban tourism research: Recent progress and current paradoxes. Tour. Manag. 2011, 32, 1–15. [Google Scholar] [CrossRef]
- Meethan, K. York: Managing the tourist city. Cities 1997, 14, 333–342. [Google Scholar] [CrossRef]
- Lenzen, M.; Sun, Y.; Faturay, F.; Ting, Y.P.; Geschke, A.; Malik, A. The carbon footprint of global tourism. Nat. Clim. Chang. 2018, 8, 522–528. [Google Scholar] [CrossRef]
- Zorpas, A.A.; Voukkali, I.; Pedreno, J.N. Tourist area metabolism and its potential to change through a proposed strategic plan in the framework of sustainable development. J. Clean. Prod. 2018, 172, 3609–3620. [Google Scholar] [CrossRef]
- Yang, Z.; Jiang, M.M.; Chen, B.; Zhou, J.; Chen, G.Q.; Li, S.C. Solar emergy evaluation for Chinese economy. Energy Policy 2010, 38, 875–886. [Google Scholar] [CrossRef]
- Mancini, M.S.; Evans, M.; Iha, K.; Danelutti, C.; Galli, A. Assessing the Ecological Footprint of Ecotourism Packages: A Methodological Proposition. Resources 2018, 7, 38. [Google Scholar] [CrossRef]
- Lv, Y.; Fu, W.; Li, T.; Liu, Y. Progress and prospects of research on integrated carrying capacity of regional resources and environment. Prog. Geogr. 2018. (In Chinese) [Google Scholar] [CrossRef][Green Version]
- Hunter, C.; Shaw, J. The ecological footprint as a key indicator of sustainable tourism. Tour. Manag. 2007, 28, 46–57. [Google Scholar] [CrossRef]
- Gonzalezvallejo, P.; Marrero, M.; Solisguzman, J. The ecological footprint of dwelling construction in Spain. Ecol. Indic. 2015, 52, 75–84. [Google Scholar] [CrossRef]
- Castellani, V.; Sala, S. Ecological Footprint and Life Cycle Assessment in the sustainability assessment of tourism activities. Ecol. Indic. 2012, 16, 135–147. [Google Scholar] [CrossRef]
- Yang, Y.; Ling, S.; Zhang, T.; Yao, C. Three-dimensional ecological footprint assessment for ecologically sensitive areas: A case study of the Southern Qin Ling piedmont in Shaanxi, China. J. Clean. Prod. 2018, 194, 540–553. [Google Scholar] [CrossRef]
- Wackernagel, M. Our Ecological Footprint: Reducing Human Impact on the Earth; New Society Publishers: Oxford, UK, 1996; p. 160. [Google Scholar]
- Rees, W.E. Ecological footprints and appropriated carrying capacity: What urban economics leaves out. Environ. Urban. 1992, 4, 121–130. [Google Scholar] [CrossRef]
- Rees, W.E.; Wackernagel, M. Ecological Footprints and Appropriated Carrying Capacity: Measuring the Natural Capital Requirements of the Human Economy. In Investing in Natural Capital: The Ecological Economics Approach to Sustainability; Jansson, A., Hammer, M., Folke, C., Costanza, R., Eds.; Island Press: Washington, DC, USA, 1994. [Google Scholar]
- Chambers, N.; Simmons, C.; Wackernagel, M. Sharing Nature’s Interest: Ecological Footprints As an Indicator of Sustainability; Routledge: London, UK, 2000. [Google Scholar]
- Mattila, T. Any sustainable decoupling in the Finnish economy? A comparison of the pathways and sensitivities of GDP and ecological footprint 2002–2005. Ecol. Indic. 2012, 16, 128–134. [Google Scholar] [CrossRef]
- Li, X.M.; Xiao, R.B.; Yuan, S.H.; Chen, J.A.; Zhou, J.X. Urban total ecological footprint forecasting by using radial basis function neural network: A case study of Wuhan city, China. Ecol. Indic. 2010, 10, 241–248. [Google Scholar] [CrossRef]
- Zhang, L.; Jia, W.; Liu, Y. Relation between the ecological footprint and the economic growth of Huan Bohai Sea Economic Region—An empirical analysis based on the panel data model. J. Arid Land Resour. Environ. 2010, 24, 1–7. (In Chinese) [Google Scholar]
- Hopton, M.E.; White, D. A simplified ecological footprint at a regional scale. J. Environ. Manag. 2012, 111, 279–286. [Google Scholar] [CrossRef] [PubMed]
- Li, X.; Tian, M.; Wang, H.; Wang, H.; Yu, J. Development of an ecological security evaluation method based on the ecological footprint and application to a typical steppe region in China. Ecol. Indic. 2014, 39, 153–159. [Google Scholar] [CrossRef]
- Sun, C.; Zhen, L.; Giashuddin Miah, M. Comparison of the ecosystem services provided by China’s Poyang Lake wetland and Bangladesh’s Tanguar Haor wetland. Ecosyst. Serv. 2017, 26, 411–421. [Google Scholar] [CrossRef]
- Katircioglu, S.; Gokmenoglu, K.K.; Eren, B.M. Testing the role of tourism development in ecological footprint quality: Evidence from top 10 tourist destinations. Environ. Sci. Pollut. Res. 2018, 25, 33611–33619. [Google Scholar] [CrossRef] [PubMed]
- Lenzen, M.; Murray, S.A. A modified ecological footprint method and its application to Australia. Ecol. Econ. 2001, 37, 229–255. [Google Scholar] [CrossRef]
- Wang, S.; Fang, C.; Yang, W. Quantitative investigation of the interactive coupling relationship between urbanization and eco-environment. Acta Ecol. Sin. 2015, 221–231. (In Chinese) [Google Scholar] [CrossRef]
- Lu, Y.; Chen, B. Urban ecological footprint prediction based on the Markov chain. J. Clean. Prod. 2017, 163, 146–153. [Google Scholar] [CrossRef]
- Gao, C.; Zhang, S.; Mo, C.; Xingeng, C. Measuring sustainable development with the ecological footprint analysis in Guangdong province. Ecol. Environ. 2005, 014, 57–62. (In Chinese) [Google Scholar] [CrossRef]
- Jiang, L.; Chen, Z.; Shen, X.; Guo, N. Quantitative analysis on the impact factors of ecological footprint--a case study of China’s provinces ecological footprints in 1999. Resour. Environ. Yangtze Basin 2005, 2, 108–112. (In Chinese) [Google Scholar] [CrossRef]
- Wang, Z.; Tao, C.; Shen, P. Regional green technical efficiency with its influencing factors analysis based on ecological footprint. China Popul. Resour. Environ. 2014, 1, 37–42. (In Chinese) [Google Scholar] [CrossRef]
- Senbel, M.; Mcdaniels, T.L.; Dowlatabadi, H. The ecological footprint: A non-monetary metric of human consumption applied to North America. Glob. Environ. Chang.-Hum. Policy Dimens. 2003, 13, 83–100. [Google Scholar] [CrossRef]
- Wu, K.; Wang, L. Partial least square regression model of ecological footprint and its influencing factors. Resour. Sci. 2006, 28, 182–188. (In Chinese) [Google Scholar] [CrossRef]
- Li, Z.; Wang, G.; Guan, X. Co-Integration analysis and an error correction model for ecological footprint and economy growth in China. Resour. Sci. 2008, 2, 103–108. (In Chinese) [Google Scholar] [CrossRef]
- Yang, J.; Wang, C.; Li, B.; Li, H.; Bai, G. Prediction of average ecological footprint in Chengdu based on genetic neural network model. Acta Ecol. Sin. 2009, 1, 363–371. (In Chinese) [Google Scholar] [CrossRef]
- Ma, C.; Zhao, J.; Zhao, X. Spatio-temporal analysis of resource environment pressure in Ningxia Hui Autonomous Region based on footprint family. Acta Sci. Circumstantiae 2016, 36, 3049–3058. (In Chinese) [Google Scholar] [CrossRef]
- Wang, Z.; Yang, L.; Yin, J.; Zhang, B. Assessment and prediction of environmental sustainability in China based on a modified ecological footprint model. Resour. Conserv. Recycl. 2017, 132, 301–313. [Google Scholar] [CrossRef]
- Yang, L.; Yang, Y. Evaluation of eco-efficiency in China from 1978 to 2016: Based on a modified ecological footprint model. Sci. Total Environ. 2019, 662, 581–590. [Google Scholar] [CrossRef]
- Ma, J.; Wang, D.; Lai, H.; Wang, Y. Water footprint-an application in water resources research. Resour. Sci. 2005, 27, 96–100. [Google Scholar] [CrossRef]
- Wu, Z.; Hu, Y.; Li, D.; Kuang, Y. Analyzing and modeling temporal variation of water ecological footprint in Guangzhou city of China. Resour. Sci. 2006, 28, 152–156. (In Chinese) [Google Scholar] [CrossRef]
- Wackernagel, M.; Monfreda, C.; Schulz, N.; Erb, K.-H.; Haberl, H.; Krausmann, F. Calculating National and Global Ecological Footprint Time Series: Resolving Conceptual Challenges. Land Use Policy 2004, 21, 271–278. [Google Scholar] [CrossRef]
- Galli, A.; Wiedmann, T.; Ercin, E.; Knoblauch, D.; Ewing, B.R.; Giljum, S. Integrating ecological, carbon and water footprint into a “footprint family” of indicators: Definition and role in tracking human pressure on the planet. Ecol. Indic. 2012, 16, 100–112. [Google Scholar] [CrossRef]
- Liu, S.; Zhu, J.; Xu, J.; Wu, X.; Zhao, S.; Hou, X. Effect of urbanization on the ecological footprint and their interactive coupling relationship. Acta Ecol. Sin. 2018. (In Chinese) [Google Scholar] [CrossRef]
- Fang, K.; Zhang, Q.; Yu, H.; Wang, Y.; Dong, L.; Shi, L. Sustainability of the use of natural capital in a city: Measuring the size and depth of urban ecological and water footprints. Sci. Total Environ. 2018, 631, 476–484. [Google Scholar] [CrossRef]
- Wackernagel, M.; Schulz, N.B.; Deumling, D.; Linares, A.C.; Randers, J. Tracking the Ecological Overshoot of the Human Economy. Proc. Natl. Acad. Sci. USA 2002, 99, 9266–9271. [Google Scholar] [CrossRef] [PubMed]
- Zhang, J.; Zhang, J. Touristic Ecological Footprint Model and Analysis of Huangshan City in 2002. Acta Geogr. Sin. 2004, 59, 763–771. (In Chinese) [Google Scholar] [CrossRef]
- Zhang, T. Study on Ecological Security of Main Cities in Northwest China Based on Improved Ecological Footprint Model. Ph.D. Thesis, Northwest University, Xi’an, China, 2018. (In Chinese). [Google Scholar]
- Yang, H.; Wang, Z.; Zhao, H.; Li, J. Dynamic analysis of ecological footprint of Dongying City based on a modified model. Chin. J. Appl. Ecol. 2009, 20, 1753–1758. (In Chinese) [Google Scholar] [CrossRef]
- Wackernagel, M.; Monfreda, C.; Erb, K.H.; Haberl, H.; Schulz, N.B. Ecological footprint time series of Austria, the Philippines, and South Korea for 1961–1999: Comparing the conventional approach to an ‘actual land area’ approach. Land Use Policy 2004, 21, 261–269. [Google Scholar] [CrossRef]
- Tan, X.; Zhen, Q. Dynamic analysis and forecast of water resources ecological footprint in China. Acta Ecol. Sin. 2009, 29, 121–130. (In Chinese) [Google Scholar] [CrossRef]
- Yang, Q.; Liu, G.; Hao, Y.; Coscieme, L.; Zhang, J.; Jiang, N.; Casazza, M.; Giannetti, B.F. Quantitative analysis of the dynamic changes of ecological security in the provinces of China through emergy-ecological footprint hybrid indicators. J. Clean. Prod. 2018, 184, 678–695. [Google Scholar] [CrossRef]
- Chen, D.; Cheng, G.; Xu, Z.; Zhang, Z. Ecological footprint of the Chinese population, environment and development. Environ. Conserv. 2004, 31, 63–68. [Google Scholar] [CrossRef]
- Xu, Z.; Cheng, G.; Qiu, G. ImPACTS identity of sustainability assessment. Acta Geogr. Sin. 2005, 60, 198–208. (In Chinese) [Google Scholar] [CrossRef]
- Dietz, T.; Rosa, E.A.; York, R. Driving the human ecological footprint. Front. Ecol. Environ. 2007, 5, 13–18. [Google Scholar] [CrossRef]
- Ma, X. Innovative approach for the development of a water quality identification index—A case study from the Wen-Rui Tang River watershed, China. Desalin. Water Treat. 2014, 1–11. [Google Scholar] [CrossRef]
- Rees, W.E. Eco-footprint analysis: Merits and brickbats. Ecol. Econ. 2000, 32. [Google Scholar] [CrossRef]
- Liu, L.; Lei, Y. An accurate ecological footprint analysis and prediction for Beijing based on SVM model. Ecol. Inform. 2018, 44, 33–42. [Google Scholar] [CrossRef]
- Zhu, J.; Chen, M. The cluster analysis of panel data and its application. Stat. Res. 2007, 24, 11–14. (In Chinese) [Google Scholar] [CrossRef]
- Zhang, Y. Change of ecological footprint and its effect on sustainable development in Beijing, China. J. China Univ. Geosci. (Soc. Sci. Ed.) 2006, 4, 53–61. (In Chinese) [Google Scholar] [CrossRef]
- Jin, Z.; Weihua, G. Study on sustainable development in nanjing based on ecological footprint model. Acta Ecol. Sin. 2012, 20, 196–205. (In Chinese) [Google Scholar] [CrossRef][Green Version]

| Subsystems | Driving Factors | Independent Variable | Units | Description |
|---|---|---|---|---|
| Economic | Proportion of the primary industry in GDP | X1 | % | Reflect the scale of economic development |
| Proportion of the secondary industry in GDP | X2 | % | Reflect the level of industrialization | |
| Proportion of the tertiary industry in GDP | X3 | % | Reflect the industrial structure | |
| Social | Urbanization rate | X4 | % | Reflect the level of urban urbanization |
| Per capita investment in fixed assets | X5 | yuan per person | Reflect the impact of policy on urban natural capital utilization | |
| Number of granted patents | X6 | item | Reflect the level of scientific and technological development of the city | |
| Ecological | Forest coverage rate | X7 | % | Reflect urban resource endowment |
| Percentage of greenery coverage in built-up areas | X8 | % | Reflect the level of urban ecological environment construction | |
| Per capita cultivated land area | X9 | yuan per person | Reflect the change of land use | |
| Tourism | Per capita tourism consumption | X10 | yuan per person | Reflect the efficiency of urban tourism |
| Length of highways per 10,000 people | X11 | kilometer per 104 persons | Reflect the size of regional transportation investment |
| Aspects | The Detail Data | Data Sources | |
|---|---|---|---|
| Biological Resource Account | Output of cropland product | Grain, oil crops, cotton, hemp, sugar cane, vegetables, fruit melons | Statistical yearbook, social and economic yearbook, statistical bulletin of national and social and economic development, water resources bulletin of each selected city |
| Output of grassland products | Meat, poultry eggs, milk | ||
| Output of forest products | Tea, fruits, nuts | ||
| Output of fishing grounds products | Aquatic products | ||
| Energy Consumption Account | Energy consumption of built-up land | Electricity, heat | |
| Direct energy consumption | Coal, coke, natural gas, liquefied petroleum gas, gasoline, kerosene, diesel, fuel oil | ||
| Pollution Emissions Account | The amount of pollutants discharged | Industrial wastewater, domestic wastewater, carbon dioxide, nitrogen oxides, smoke and dust, dust | |
| Water Resource Account | Water resources | Water supply, total water resources | |
| Driving Factors | Macro data | HTTP://DATA.CNKI.NET/ | |
| Land Use Data | http://www.resdc.cn/ | ||
| Population Data | Statistical yearbook | ||
| Global Average Yield | http://www.fao.org/faostat/zh/#data | ||
| http://www.fao.org/fishery/statistics/zh | |||
| Equilibrium Factor, Yield Factor | http://data.footprintnetwork.org/#/ | ||
| https://data.world/footprint | |||
| Breitung Unit-Root Test | Fisher-Augmented Dickey-Fuller (ADF) Test | Fisher- Phillips Perron (PP) Test | ||||
|---|---|---|---|---|---|---|
| Level | 1st Difference | Level | 1st Difference | Level | 1st Difference | |
| p-Value | p-Value | p-Value | p-Value | p-Value | p-Value | |
| ef | 0.7696 | 0 | 0.1402 | 0 | 0.0252 | 0 |
| X1 | 0.9869 | 0.0028 | 0.0076 | 0 | 0 | 0 |
| X2 | 0.8155 | 0 | 0.4275 | 0 | 0.7545 | 0 |
| X3 | 0.9938 | 0 | 0.6580 | 0 | 0.7842 | 0 |
| X4 | 0.9801 | 0 | 0.9461 | 0 | 0.6341 | 0 |
| X5 | 0.9997 | 0.0032 | 0 | 0 | 0.0460 | 0 |
| X6 | 0.9992 | 0 | 0.0002 | 0 | 0.0003 | 0 |
| X7 | 0.8892 | 0 | 0.1903 | 0 | 0.0637 | 0 |
| X8 | 0.1885 | 0 | 0 | 0 | 0 | 0 |
| X9 | 0.0318 | 0 | 0.0604 | 0 | 0.0001 | 0 |
| X10 | 0.6931 | 0 | 0.0631 | 0 | 0.0016 | 0 |
| X11 | 0.5425 | 0.2049 | 0.1686 | 0 | 0.0015 | 0 |
| Test | Chibar2(01) | Prob > Chibar2 |
|---|---|---|
| Breusch-Pagan LM random | 647.74 | 0 |
| Breusch-Pagan LM | 286.501 | 0 |
| Hausman | 20.41 | 0.0301 |
| Modified Wald test | 145.84 | 0 |
| Wooldridge | 15.996 | 0.0012 |
| Variables | Fixed Effects | Random Effects | Fixed Effects (Driscoll–Kraay Standard Errors) |
|---|---|---|---|
| X1 | 0.00470 | 0.00211 | 0.00470 |
| X2 | 0.00896 *** | 0.00811 *** | 0.00896 *** |
| X3 | −0.00140 | −0.00121 | −0.00140 |
| X4 | −0.00419 *** | −0.00376 *** | −0.00419 *** |
| X5 | 0.0879 ** | 0.0549 | 0.0879 ** |
| X6 | −0.00787 | 0.00575 | −0.00787 |
| X7 | −0.00361 *** | −0.00502 *** | −0.00361 *** |
| X8 | −0.00294 *** | −0.00277 ** | −0.00294 ** |
| X9 | −0.0426 | −0.00559 | −0.0426 |
| X10 | −0.182 *** | −0.148 *** | −0.182 *** |
| X11 | 0.0817 * | 0.0826 * | 0.0817 |
| Constant | 0.700 *** | 0.683 *** | 0.700 ** |
| Observations | 288 | 288 | 288 |
| R-squared | 0.534 | 0.528 | 0.534 |
| F test | 0 | 0 | 0 |
| Category | I | II | III | IV |
|---|---|---|---|---|
| Included cities | Sanya, Xiamen, Beijing, Hangzhou, Guangzhou, Shanghai | Nanjing, Tianjin, Qingdao | Chengdu, Xi’an, Guilin, Huangshan, Changsha | Kunming, Harbin |
Publisher’s Note: MDPI stays neutral with regard to jurisdictional claims in published maps and institutional affiliations. |
© 2020 by the authors. Licensee MDPI, Basel, Switzerland. This article is an open access article distributed under the terms and conditions of the Creative Commons Attribution (CC BY) license (http://creativecommons.org/licenses/by/4.0/).
Share and Cite
Shi, Y.; Shao, C.; Zhang, Z. Efficiency and Driving Factors of Green Development of Tourist Cities Based on Ecological Footprint. Sustainability 2020, 12, 8589. https://doi.org/10.3390/su12208589
Shi Y, Shao C, Zhang Z. Efficiency and Driving Factors of Green Development of Tourist Cities Based on Ecological Footprint. Sustainability. 2020; 12(20):8589. https://doi.org/10.3390/su12208589
Chicago/Turabian StyleShi, Yanmin, Chaofeng Shao, and Zheyu Zhang. 2020. "Efficiency and Driving Factors of Green Development of Tourist Cities Based on Ecological Footprint" Sustainability 12, no. 20: 8589. https://doi.org/10.3390/su12208589
APA StyleShi, Y., Shao, C., & Zhang, Z. (2020). Efficiency and Driving Factors of Green Development of Tourist Cities Based on Ecological Footprint. Sustainability, 12(20), 8589. https://doi.org/10.3390/su12208589


