Article

Efficiency and Driving Factors of Green Development of Tourist Cities Based on Ecological Footprint

1
College of Life Sciences, Huaibei Normal University, Huaibei 235000, China
2
College of Environmental Science and Engineering, Nankai University, Tianjin 300071, China
*
Author to whom correspondence should be addressed.
Sustainability 2020, 12(20), 8589; https://doi.org/10.3390/su12208589
Submission received: 12 September 2020 / Revised: 9 October 2020 / Accepted: 12 October 2020 / Published: 16 October 2020

Abstract

:
For tourist cities, the ecological footprint not only affects tourism competitiveness but also affects green development. This paper adopted an improved ecological footprint accounting model, used a series of relevant indicators of ecological footprint to compare the green development efficiency, and explored the main driving factors of the per capita ecological footprint and city classification of 16 major tourist cities in China from 2000 to 2017. The results show that the green development efficiency of the studied tourist cities still needs to be improved. Secondly, the panel data analysis shows that the proportion of the primary industry in GDP, the proportion of the secondary industry in GDP, the per capita investment in fixed assets, and the length of highways per 10,000 people can increase the per capita ecological footprint. Then, the cluster analysis divides the selected tourist cities into four categories, and different types of cities need to be managed differently. Finally, this paper puts forward corresponding suggestions to improve the quality of the green development of selected tourist cities. The in-depth study of the ecological footprint in this paper will provide a scientific basis for tourist cities to promote green economic growth that considers ecological footprint and GDP and achieve sustainable development of tourism.

1. Introduction

At present, the industrial status and benefits of tourism in the world economy have been significantly improved, and it has increasingly become an emerging hot spot and an important development direction for consumption growth. Tourism is one of the fastest-growing socio-economic fields. In 2018, the number of global tourist arrivals was 12.11 billion, and the global total tourism revenue was 5.8 trillion US dollars, contributing 6.7% of global GDP [1,2]. The tourism industry has low resource consumption, many employment opportunities, and high overall benefits. Therefore, it is an important format of the modern service industry and an important direction for industrial structure adjustment in many countries. In 2019, the number of domestic tourists in China was 6.006 billion, a year-on-year increase of 8.4%, the number of inbound tourists was 14.53 million, and the total annual tourism revenue was 0.96 trillion US dollars [3]. Tourism is an important means of sustainable development, and it has broad development prospects in the field of action to promote the realization of the 2030 Sustainable Development Agenda and various sustainable development goals [4]. At the same time, sustainable development is the foundation of tourism development. Research on the relationship and influence mechanism of tourism activities with social, economic, and environmental factors and exploring ways of sustainable development of tourism are the difficulties and research hotspots faced by the world tourism industry [5,6]. At this stage, under the new development situation of tourism, such as the popularization of tourism income, the increasing demand for high-quality tourism, and the modernization of the tourism industry, how to further stimulate the driving force of tourism resources for economic transformation, enable more cities with excellent tourism resources to convert resources into productivity, and lead the ecological construction through the development of tourism are issues that researchers and governments need to consider.
Urban tourism includes tourist activities in the city and its impact on society, economy, and environment [7,8]. Urban tourism has become a new growth point of modern tourism, which has gradually enriched research on urban tourism [9]. While tourism flow brings more and more economic benefits, it may also cause negative social, cultural, environmental, and ecological impacts, which not only affect the quality of tourists’ tourism experience but also restrict the development of the tourism economy [10,11,12]. The conflict between urban sprawl and environmental pollution is also more intense in tourist cities that rely on both the development of urbanization and the quality of the ecological environment [13]. Ecotourism is an important plan for minimizing the impact of tourism on the ecosystem, but it requires that each city or region share the sustainability standards and monitoring tools used to assess the impact [14]. In order to measure the ability of natural resources to support human production and daily life under the influence of urbanization, the resource and environmental carrying capacity evaluation system has received more and more attention [15,16]. The accounting methods of regional natural capital mainly include the ecological footprint (EF) method, the net productivity method, the material flow analysis method, and the energy flow method [17,18,19]. Among them, the EF method is widely used by researchers in terms of the ecological effects of urban expansion.
The EF measures the sustainable status of regional economic development by estimating the ecologically productive area required for consumption and absorbing waste discharge in a specific area and comparing it with the ecologically productive area that the area can provide [20]. Since the theory was put forward in 1992, it has received extensive attention from researchers. Scholars from various countries have continuously adjusted the adaptability of the EF model and have derived many analytical methods to explore the correlation between EF and other elements [16,21,22,23,24]. The EF method has rich empirical analysis in the analysis of dynamic changes in different industries, different provinces and cities, and different time scales [17,25,26,27,28,29,30]. The EF is closely related to the degree of economic development, and regions or cities with a higher degree of economic development generally have a higher per capita EF [31]. While urbanization has a negative impact on the ecological capacity (EC), as the spatial carrier of urbanization, it also has an increasingly counter-force to urbanization [32]. Therefore, the analysis of the driving forces of the EF in combination with the indicators that reflect urban development is a useful supplement to the study of EF [33]. It mainly includes studying the historical development process of the EF in a longer time series, establishing an autoregressive model, and establishing a single or multiple regression equation of the EF and the main driving factors [34,35,36,37]. In terms of specific analysis methods, the researchers have used partial least squares regression, neural network methods, co-integration theory, and error correction models to analyze the driving factors of EF and predict future trends [38,39,40,41,42].
Existing EF accounting models often only consider biological resources and energy consumption, ignoring the impact of various pollutants discharged and the large amount of water consumed by urban residents on the EF, making the results unable to highlight the differences between cities [43]. Once pollutants are released into the environment, they will occupy productive land and cause environmental damages, which are difficult to repair. In addition to the function of fishery production, water resources, as an essential resource, play an important role in supporting urban development and maintaining the ecological balance [23,44,45]. Previous studies have mainly used two-dimensional time series (time and indicators) data, but the two-dimensional information model often fails to meet actual analysis needs. The panel data contains three-dimensional information of cross-section, time, and indicators. It can be used to construct and test behavior equations that are more realistic than the cross-section or time-series data for deeper analysis [26]. In order to further explore the development law and driving factors of the EF of tourist cities, this paper selected 16 typical tourist cities in China, constructed a revised EF model and panel data analysis model, combined land use data, statistical data, and macroeconomic data, explored the efficiency of green development and the main driving factors of these cities from 2000 to 2017. Firstly, the EF of each city was calculated, and pollutant emissions and water resource were included in the EF model; secondly, the efficiency of green development of the selected cities was analyzed through relevant indicators; the panel data model of the social-economic system and the ecosystem was established to test the impact of various indicators of urbanization on the EF of the tourist city; finally, the cluster analysis was used to classify the selected cities, and suggestions are made for the future development of tourism in different types of tourist cities.

2. Study Area

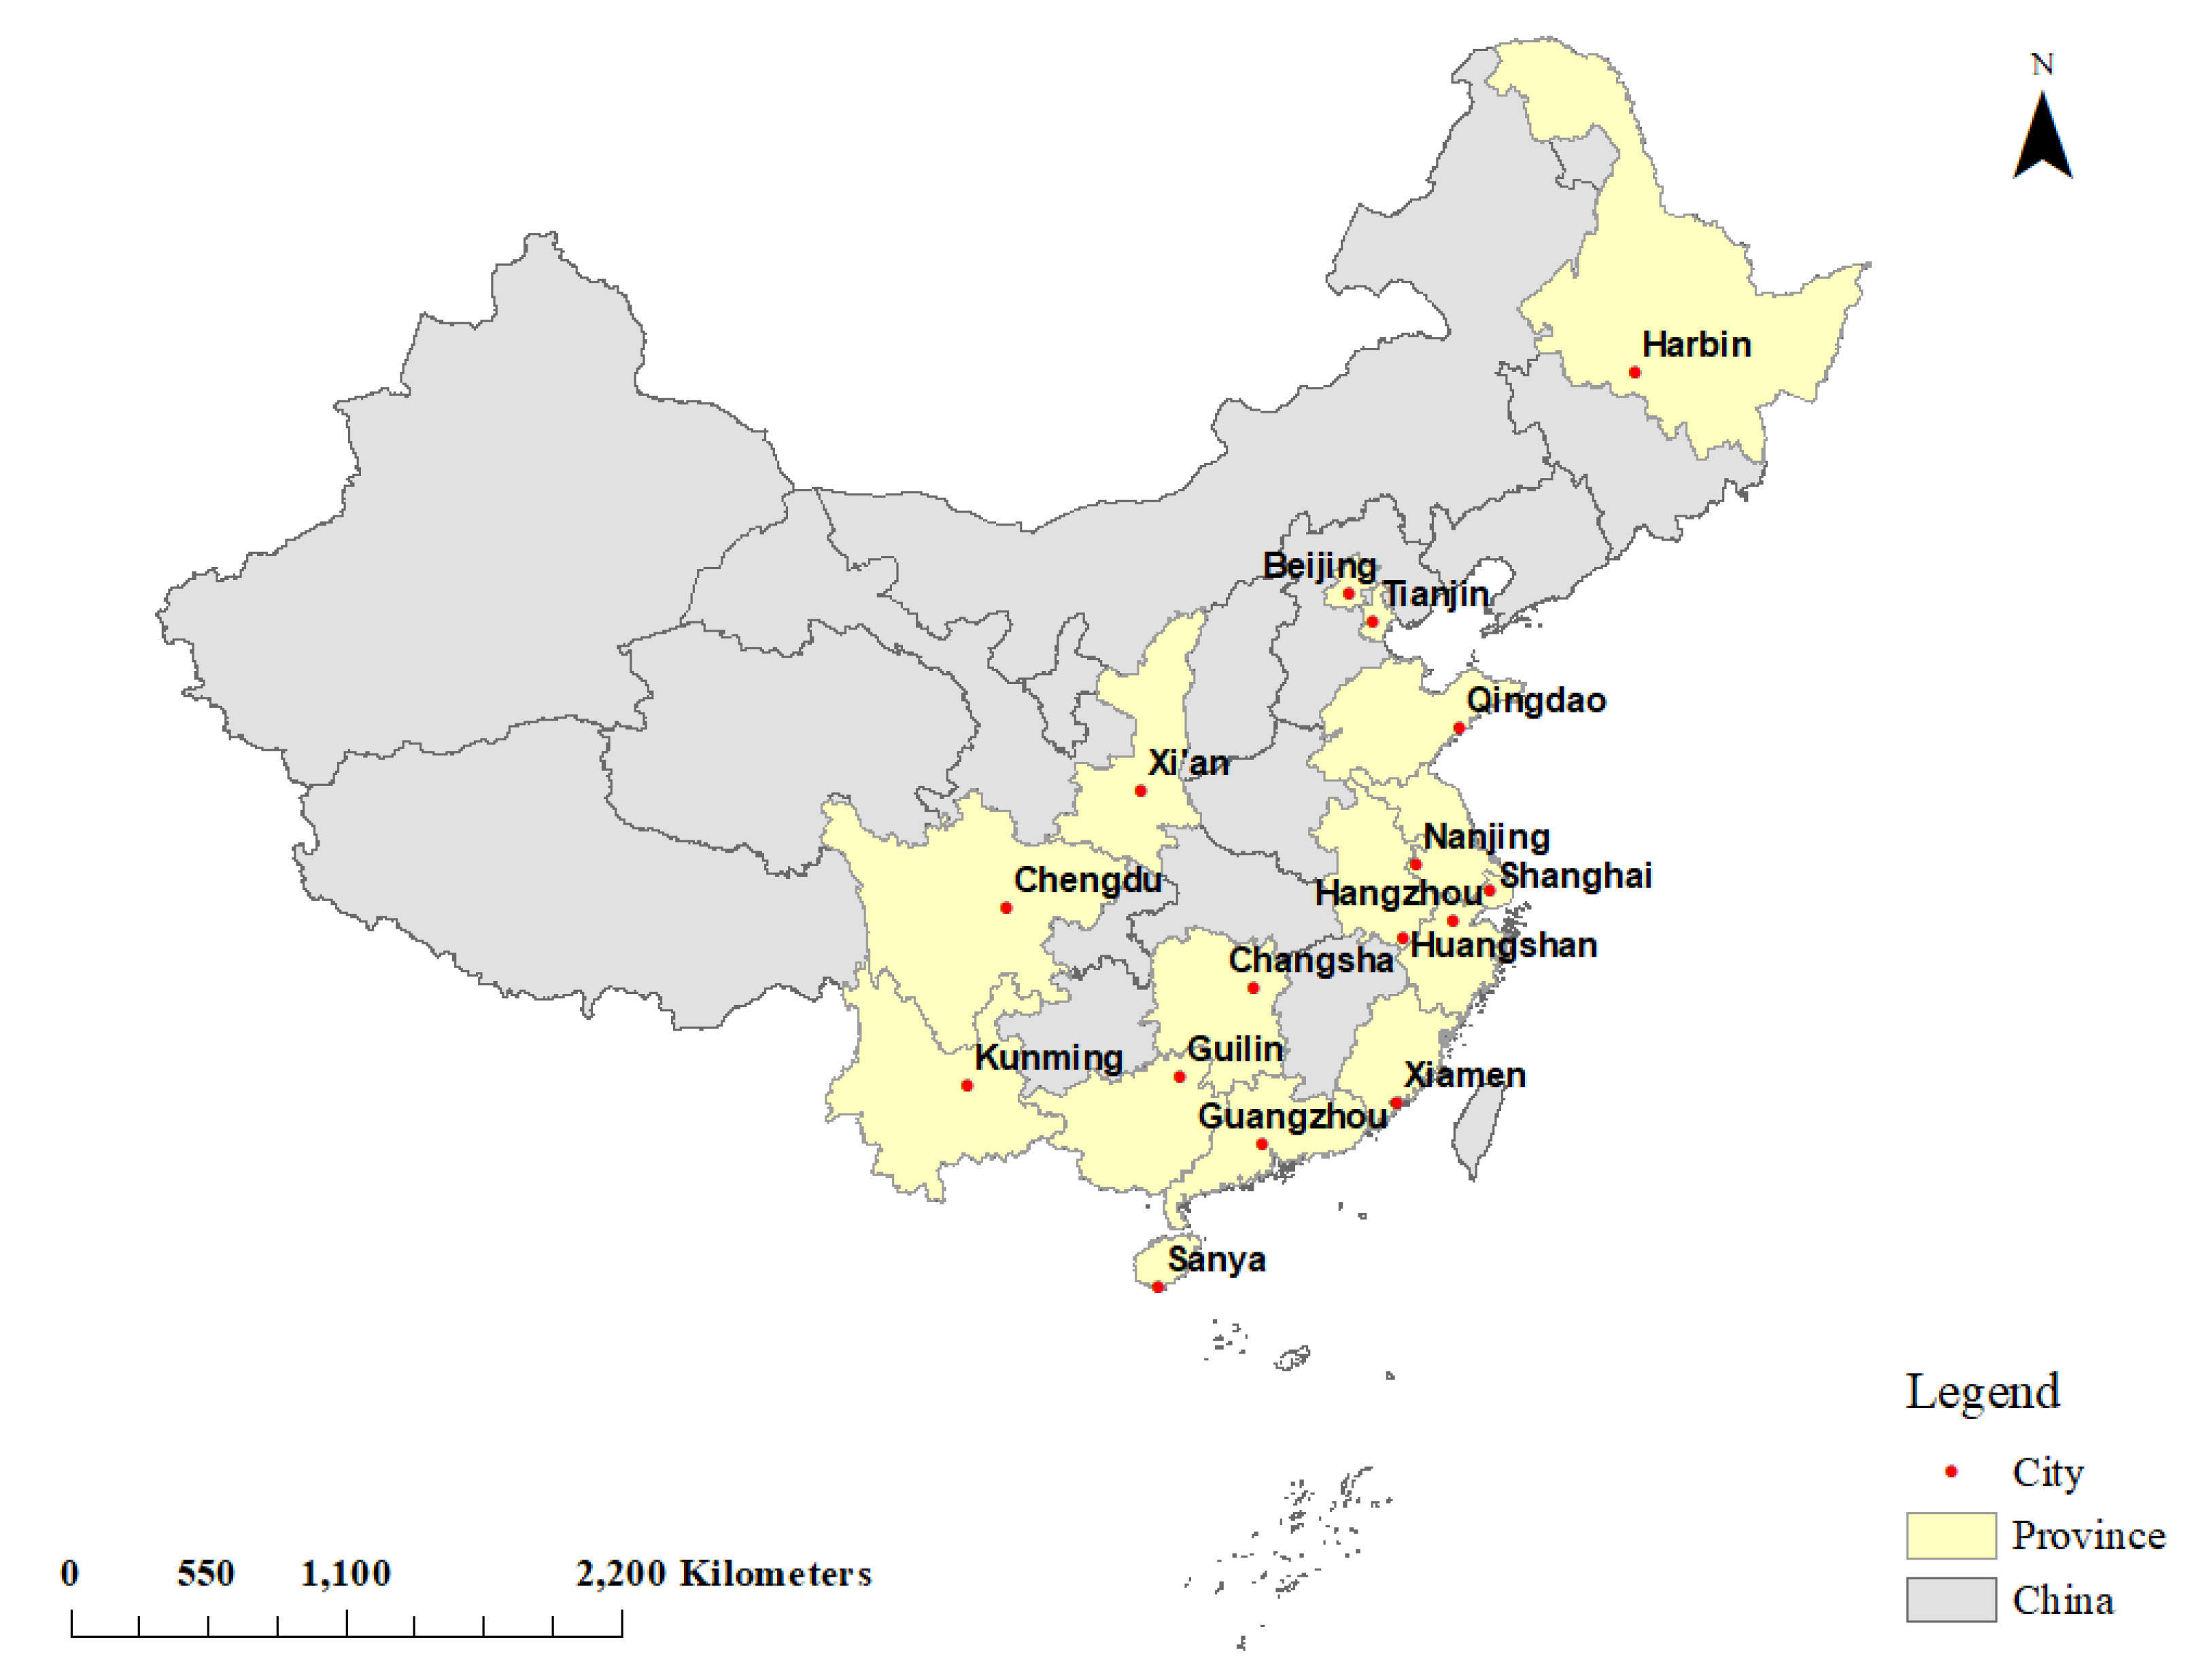
The development of the tourism industry has a certain relationship with the city’s tourism resources, scale, economic level, and transportation. There are two main types of tourist cities in China. The first type of city not only has natural advantages in tourism resources, but its advanced urbanization level can also attract a large number of tourists, such as Beijing, Shanghai, and Guangzhou. Both the number of people and the income from the tourism of these cities are large. The second type is cities with a large-scale tourism industry due to its unique cultural or ecological landscape resources. The tourism industry in these cities has a strong momentum of development and is even the main source of regional GDP. In order to make the research results more representative, this paper combined these two types of cities when selecting the study area. Based on factors, such as the number of tourists, the proportion of tourism revenue to the regional GDP, and the availability of data, this paper finally selected 16 cities, namely Beijing, Chengdu, Guangzhou, Guilin, Hangzhou, Nanjing, Qingdao, Sanya, Shanghai, Tianjin, Xiamen, Xi’an, Changsha, Kunming, Harbin, and Huangshan. The geographical distribution of selected tourist cities is shown in Figure 1.

3. Methods and Data

3.1. Calculation Model and Evaluation Indexes

3.1.1. Improvement of the Calculation Model

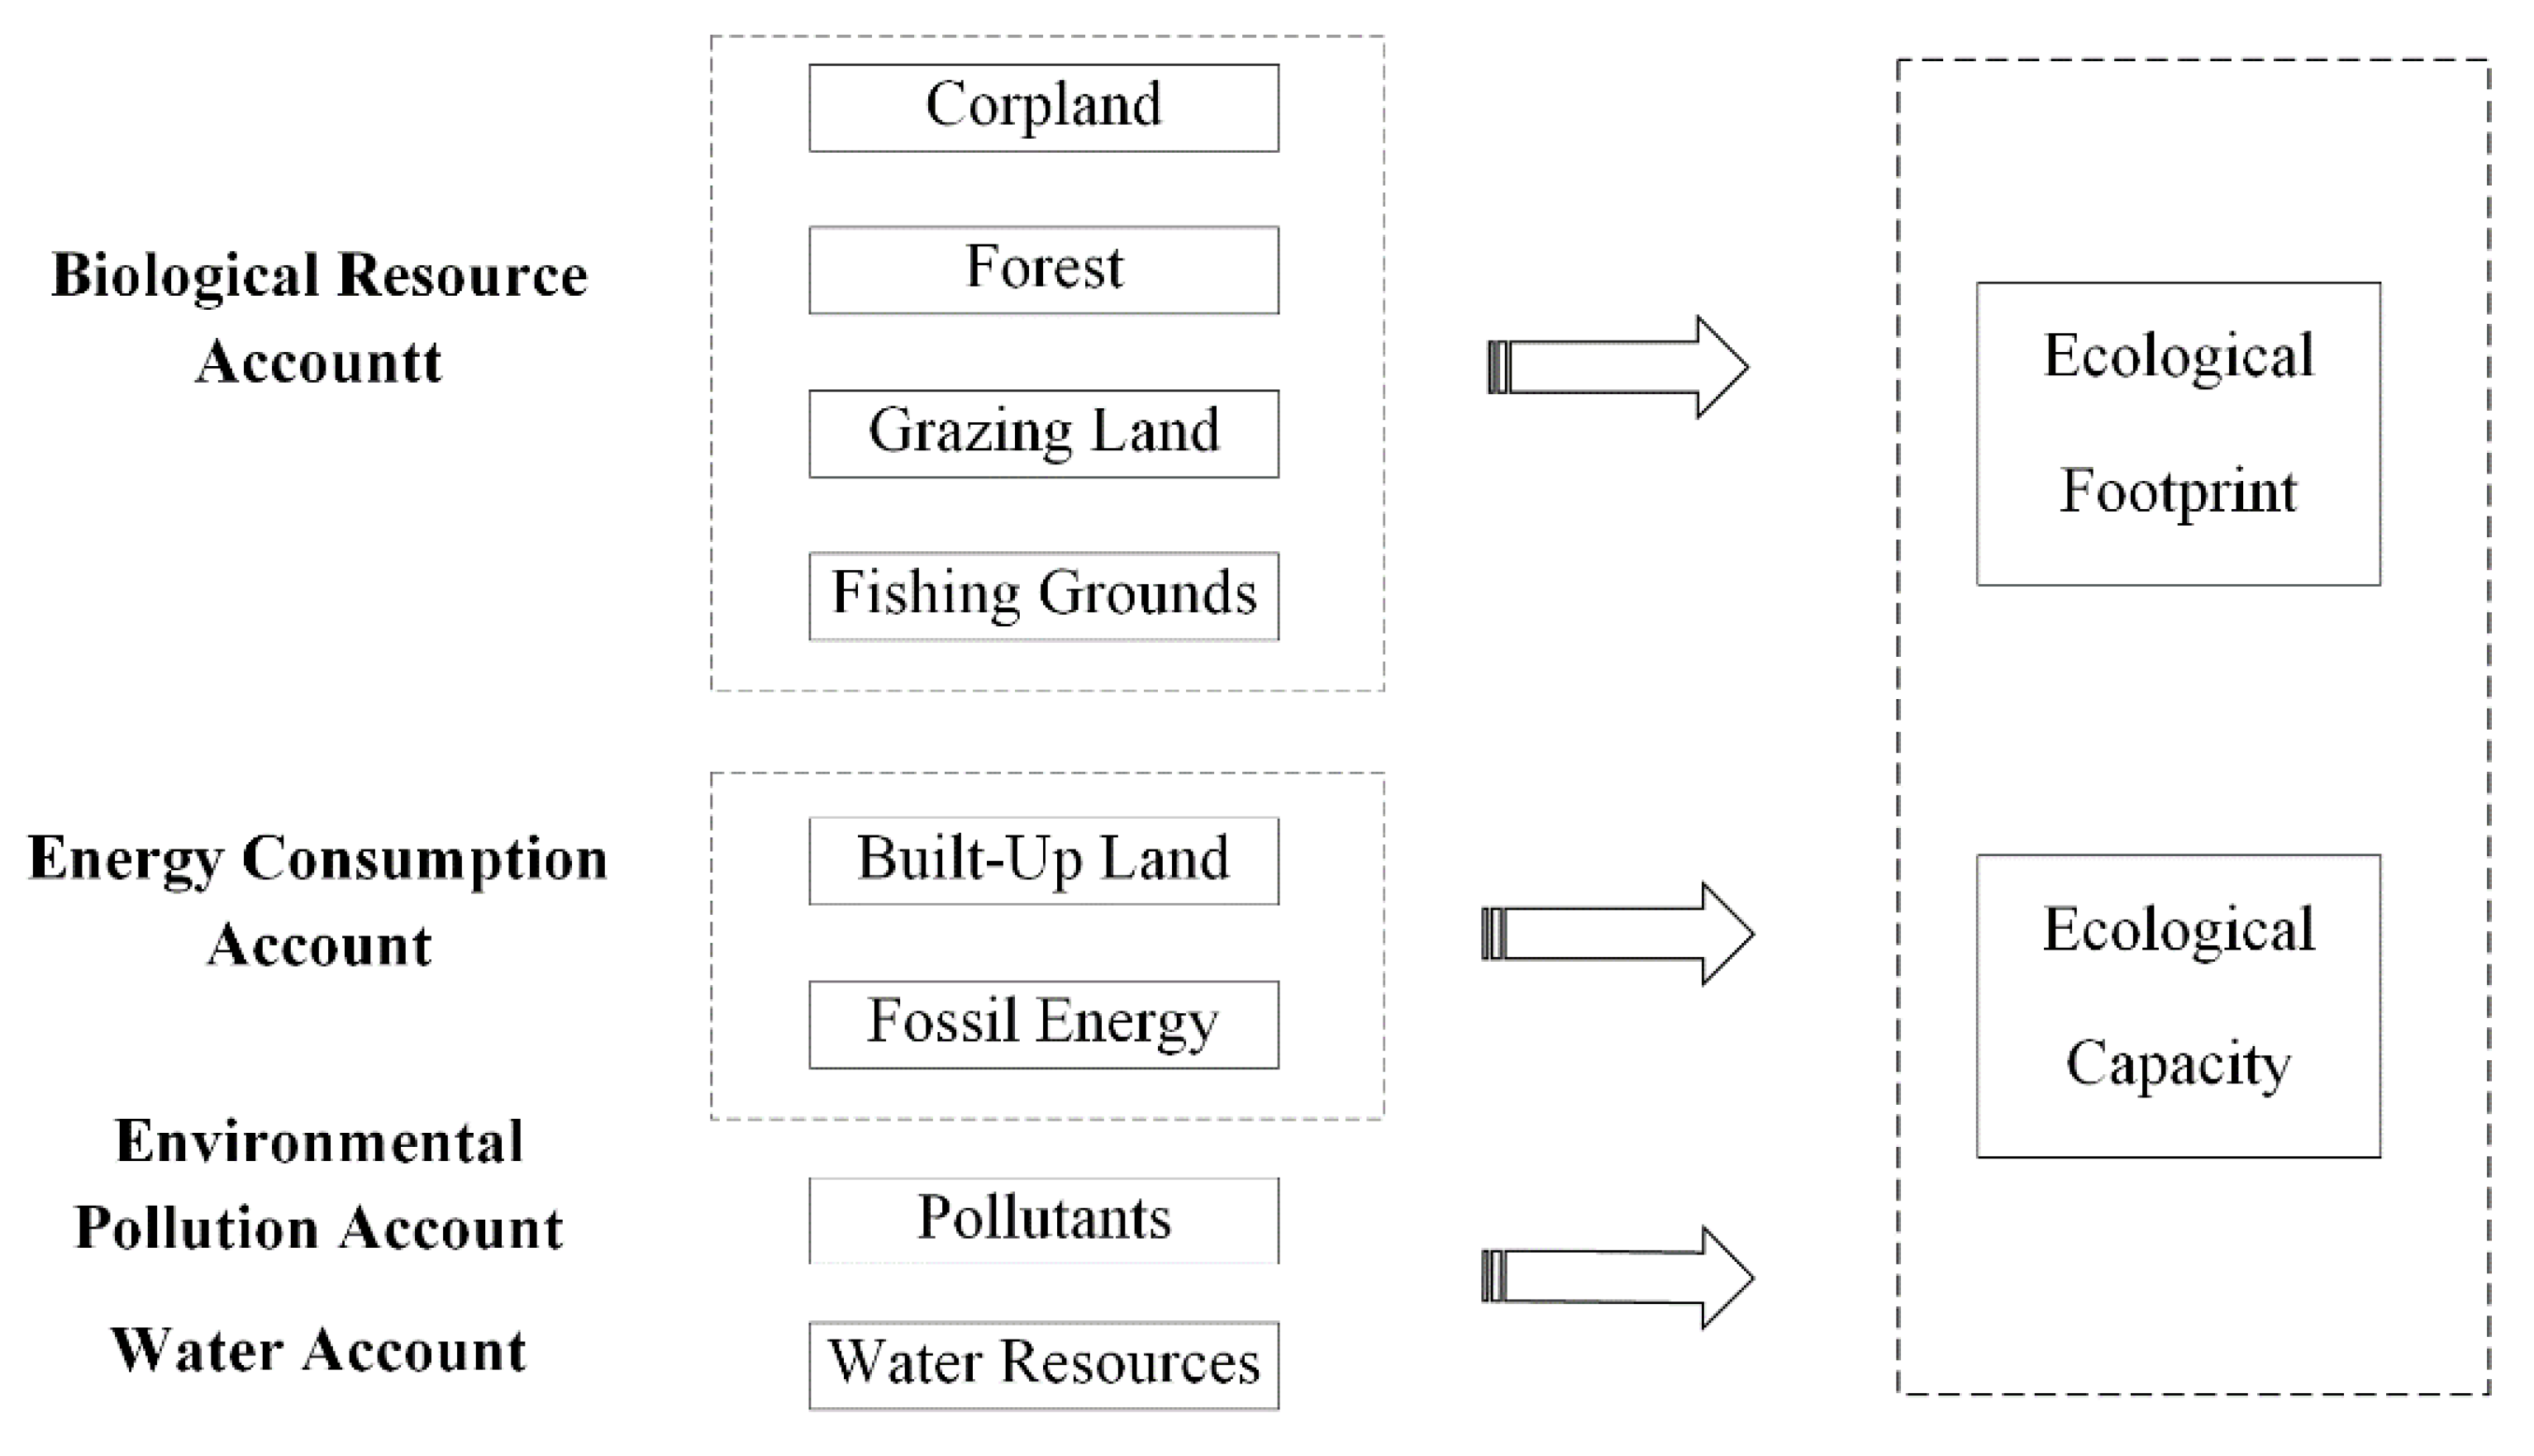
Traditional EF accounting can be divided into six parts according to different land-use types: cropland footprint, grazing footprint, forest footprint, fishing grounds footprint, built-up land footprint, and carbon footprint [46]. According to the functions of EF, it can be divided into the EF of ecological production (including cropland footprint, grazing footprint, forest footprint, fishing grounds footprint) and the EF of energy consumption (carbon footprint and built-up land footprint). To make the calculation results reflect the current situation of the ecosystem as comprehensively as possible, this paper improved the traditional EF model (Figure 2). On the basis of the traditional model, the EF of pollutants is added to calculate the EF of the land occupied directly or indirectly by wastewater, waste gas, and solid waste [43]. At the same time, a water resource account is added to convert the amount of water consumed into fishing grounds land [47,48,49].

3.1.2. Calculation of EF

Since the average biological productivity of different land-use types and different countries or regions are different, in order to facilitate the accumulation of various types of EFs and enable the results to be compared on a global scale, yield factors and equilibrium factors are introduced. The equilibrium factor reflects the difference in biological productivity between different land types, and the yield factor expresses the difference in average land productivity between the national or regional and global, including differences in natural factors, such as precipitation or soil quality, as well as human factors, such as management level difference [50]. For any land use type, the EF of a country or region, calculated by global hectares (gha), is:
E F = e f × N = P i Y i × Y F × E Q F
where EF is the total ecological footprint of the city, ef is the per capita ecological footprint, N is the population of the study area, Pi is the quantity of a certain product harvested or a certain pollutant discharged, Yi is the average yield of product Pi in the country or region, and YF and EQF are the yield factor and equilibrium factor of the studied land-use type. In the calculation of energy consumption footprint, first, use the average calorific value per unit of fossil fuel to convert energy consumption into heat consumed, and then use the world average output and equilibrium factors to obtain the global average biologically productive land area [51].
For the added pollutant emission account in the EF evaluation model of this paper, the calculation formula is:
E F p = e f p × N = Q p A C p × E Q p
Among them, EFp is the total ecological footprint of pollutants, efp is the ecological footprint of pollutants per capita, Qp is the discharge of each pollutant, ACp is the absorption capacity of each pollutant, and EQp is the corresponding equilibrium factor.
The EF of water resources uses the average production capacity and equilibrium factor of water resources in China to convert the amount of water consumed (only the local water resources in the study area, excluding water imported from other regions) into the corresponding productive land area. The following is the water resource footprint calculation formula:
E F W = e f W × N = W p × E Q W
where EFW is the total ecological footprint of water resources, efW is the ecological footprint of water resources per capita, W is the amount of water consumed, p is the average production capacity of water resources, and EQW is the water balance factor. According to the definition of the equilibrium factor and the ecological productivity of water resources, the equilibrium factor of water resources is considered to be 1 [52]. The global average production capacity of water resources is taken as 3140 m3hm−2, but considering the difference in global average production capacity, the water resources production factor in this paper adopted China’s average production capacity of 2946 m3hm−2 [53].

3.1.3. Calculation of EC

In the calculation of EC, it is also necessary to use equilibrium factors and yield factors to convert the area of various land-use types into the corresponding EC [54]. This paper included 8 types of land use: cropland, grazing land, fishing grounds land, forest, carbon land, built-up land, pollutant absorption land, and water resource land. Since the energy consumption account and pollutant emissions account have no EC, the calculation of EC only includes 6 types of land use. In order to maintain biodiversity, in the calculation of EC, 12% of the land area needs to be deducted for biodiversity protection [20].
E C = e c × N = 1 0.12 × A i × Y E × E Q F
Among them, EC is the total ecological capacity of the city, ec is the per capita ecological capacity, Ai is the area corresponding to the land use type, and YE and EQF are the yield factor and equilibrium factor of the studied land-use type, respectively.
In order to protect water resources that can maintain the ecological environment and biodiversity, the water extraction rate shall not exceed 40%, so only 40% of the ecological carrying capacity is calculated [55]. The following is the calculation formula:
E C W = e c w × N = 0.4 × Y w × E Q w × W p
Among them, ECW is the water resources ecological capacity, ecw is the per capita water resources ecological capacity, YW is the water resource production factor, EQW is the water resource equilibrium factor. In this paper, the value of the water production factor in China is 0.94 [53].

3.2. Evaluation Method of the Green Development Efficiency

(1) Ecological Footprint Index (EFI)
Since EF may be affected by factors, such as population, region, and GDP, EFI is selected to evaluate and classify the EF [19]. EFI is the ratio of the EF to the EC, which evaluates ecological security by analyzing the pressure on the ecosystem under the unit EC. The calculation formula is:
E F I = e f / e c = E F / E C
When EFI < 1, the pressure caused by human activities on the ecological environment is less than the ecological carrying capacity, and the study area is in a state of ecological security. When EFI = 1, human pressure and ecological carrying capacity are in balance. When EFI > 1, the pressure on the ecosystem is greater than the ecological carrying capacity of the area, indicating that the area cannot achieve ecological security. The bigger the EFI, the worse the overall ecological security [56].
(2) Eco-economic coordination index (EECI)
The ecological deficit cannot reflect its relationship with resource endowment conditions [42]. EECI refers to the comprehensive calculation of the supply and demand of biological resources in a region to obtain the degree of coordination between the quality of the ecological environment and the economic development. The calculation formula is:
E E C I = ( e f + e c ) / e f 2 + e c 2 = ( e f e c + 1 ) / e f 2 e c 2 + 1 = ( E F I + 1 ) / E F I 2 + 1
It can be seen from the transformation form of the formula that EECI is closely related to EFI, and EECI can be analyzed according to the value range of EFI. When EFI > 1, the closer the EECI is to 1, the lower the coordination degree of ecological capacity in the area. The closer the EECI is to 1.41, the higher the coordination of the ecological capacity in the area. When EECI is equal to 1.41, it indicates that the EF and EC of the area are in a completely balanced state.
(3) EF of ten thousand yuan GDP
Since the EF reflects the occupancy of ecological resources by urban construction and production needs and household use, many factors of the social development in the process of urbanization may affect the size of the EF. The EF of ten thousand yuan GDP can reflect the efficiency of the use of natural resources [57]. The EF of GDP per ten thousand yuan is expressed as the ratio of the EF of a region to the gross domestic product (ten thousand yuan) of the region. The larger the value, the greater the occupation of the local economic development on the ecological environment, and the lower the efficiency of resource utilization, otherwise the higher the efficiency of resource utilization.
E F   o f   t e n   t h o u s a n d   y u a n   G D P = E F G D P
In the formula, GDP represents the gross regional product.

3.3. Determination of Driving Factors

The IPAT equation is a classic identity that measures the impact of human activities on the environment. The environmental impact (I) is the product of the total population (P), economic development level (A), and technology (T). The identical equation is as follows:
I = P × A × T
The IPAT equation can help us find some countermeasures to reduce the environmental pressure of human activities. Correlation analysis shows that the EF can be partially restored to the classic IPAT equation, in which the level of economic development is replaced by consumption, and technological progress is taken into account when transforming consumption into bioproductive land area [58].
When technological progress and economic growth show a non-monotonous and disproportionate impact on the environment, the IPAT equation is not appropriate. Therefore, the STIRPAT model is further selected, which is a stochastic model of the IPAT equation, and its formula is as follows:
I = × P i β × A i γ × T i δ × ε i
In the above formula, represents a constant term; β, γ, and δ are the parameters to be estimated; ε is a random error term. The equation not only allows the coefficients to be used as parameters for estimation but also allows the proper decomposition of the driving factors [59]. Relevant literature has improved and adjusted the equation in empirical research due to different research purposes. Take the natural logarithm on both sides of the equal sign of the above equation to get:
l n I = 0 + β l n ( P i ) + γ l n ( A i ) + δ l n ( T i ) + u i
Among them,
ln ( i ) = 0 ,   is   a   constant   term ;   β ,   γ ,   δ   are   the   coefficients   of   each   variable ;   ln ( ε i ) = u i ,   is   a   disturbance   term .
According to the relationship between urban sustainable development and ecological resource demand, the theoretical driving force index that can reflect the change of EF should be selected [60,61,62]. This paper referred to the concept of sustainable development to select indicators, including economic, social, and ecological sustainable development. Since the selected cities are all tourist cities, the sustainable development of tourism also needs to be included in the assessment scope. Therefore, in this paper, using stata16.0 software, with per capita EF as the explained variable, explanatory variables were selected from the economic, social, ecological, and tourism subsystems to construct an index system for measuring the impact of EF (Table 1). Among them, the independent variable whose unit is percentage has no dimension influence, so logarithm processing is not required. Therefore, the following model is established in this paper:
l n e f i t = i + β 1 X 1 i t + β 2 X 2 i t + β 3 X 3 i t + β 4 X 4 i t + β 5 l n X 5 i t + β 6 l n X 6 i t + β 7 X 7 i t + β 8 X 8 i t + β 9 X l n 9 i t + β 10 l n X 10 i t + β 11 l n X 11 i t + u i

3.4. Cluster Analysis

Natural resources participate in the process of urban development as ecological inputs, and their expected output is usually GDP, which is often represented by tourism income for tourism-oriented cities. However, the increase in GDP is often accompanied by undesired output, that is, a large increase in the EF, which ultimately leads to the continuous increase of pressure on resources and environmental resources. To seek a sustainable development model in which the natural system and the economic system are coordinated, it is necessary to further explore the relationship between the EF and the tourism industry of different tourist cities. This paper took the per capita EF as an indicator of natural resource demand and per capita tourism consumption as an indicator of urban tourism efficiency. Based on these two indicators, a cluster analysis is performed on the selected 16 cities.
At present, the general method of panel data clustering analysis is to convert three-dimensional data into two-dimensional data. Taking the average value of each indicator in the time dimension can eliminate the influence of the time dimension and reduce the three-dimensional data to cross-sectional data [63]. To eliminate the impact of different dimensions, first, use the average method to standardize the per capita EF and per capita tourism consumption. Since clustering is carried out among different samples in this paper, to preserve the differences between the samples, the denominator used in the averaging process is the mean of all samples of the same indicator. Then, the mean value of each cross-section of the two indicators is taken as the basis of clustering analysis in the time dimension. Third, after obtaining the basic data of cluster analysis, sort according to the size of corresponding indicators. The results of sorting are displayed on the coordinate axis, with per capita ecological footprint as the horizontal axis and per capita tourism consumption as the vertical axis. This paper divided selected cities into four different categories: high per capita ecological footprint-high per capita tourism consumption (Ι), high per capita ecological footprint-low per capita tourism consumption (II), low per capita ecological footprint-high per capita tourism consumption (III), low per capita ecological footprint-low per capita tourism consumption (IV). Fourth, the cluster analysis method is adopted for classification, and the four cities with the shortest distance from the four vertices of the histogram in the quadrant are selected as the initial cluster centers. These four cities can better represent the characteristics of the city type they belong to. Using the K-means clustering method, 16 cities are divided into four categories.

3.5. Data Sources

The calculation of EF involves the area of five types of land use, including cropland, forest, grazing land, fishing grounds, and built-up land. At present, remote sensing monitoring technology is mostly used to obtain land use data. The land use data involved in the calculation of EF in this paper come from China’s land-use remote sensing monitoring data from the Chinese Academy of Sciences Resources and Environment Science Data Cloud Platform. Then, use ArcGIS software to count the area of each type of land use in each city. For the consideration of data accessibility and data applicability, it is appropriate to obtain remote sensing data at 5-year intervals. Therefore, this paper selected four years of land use data in 2000, 2005, 2010, and 2015. In theory, both biological resources and energy consumption accounting should use corresponding consumption data. However, when the EF is applied at the city scale, there is a problem of a lack of detailed trade statistics. Therefore, the output of agricultural products, forest products, animal products, and aquatic products is commonly used in the actual accounting [19]. In addition, macroeconomic data have been deflated using the year 2000 as the base period to eliminate the impact of price factors. See Table 2 for detailed data sources.

4. Results and Discussions

4.1. Dynamic Analysis of EF and EC

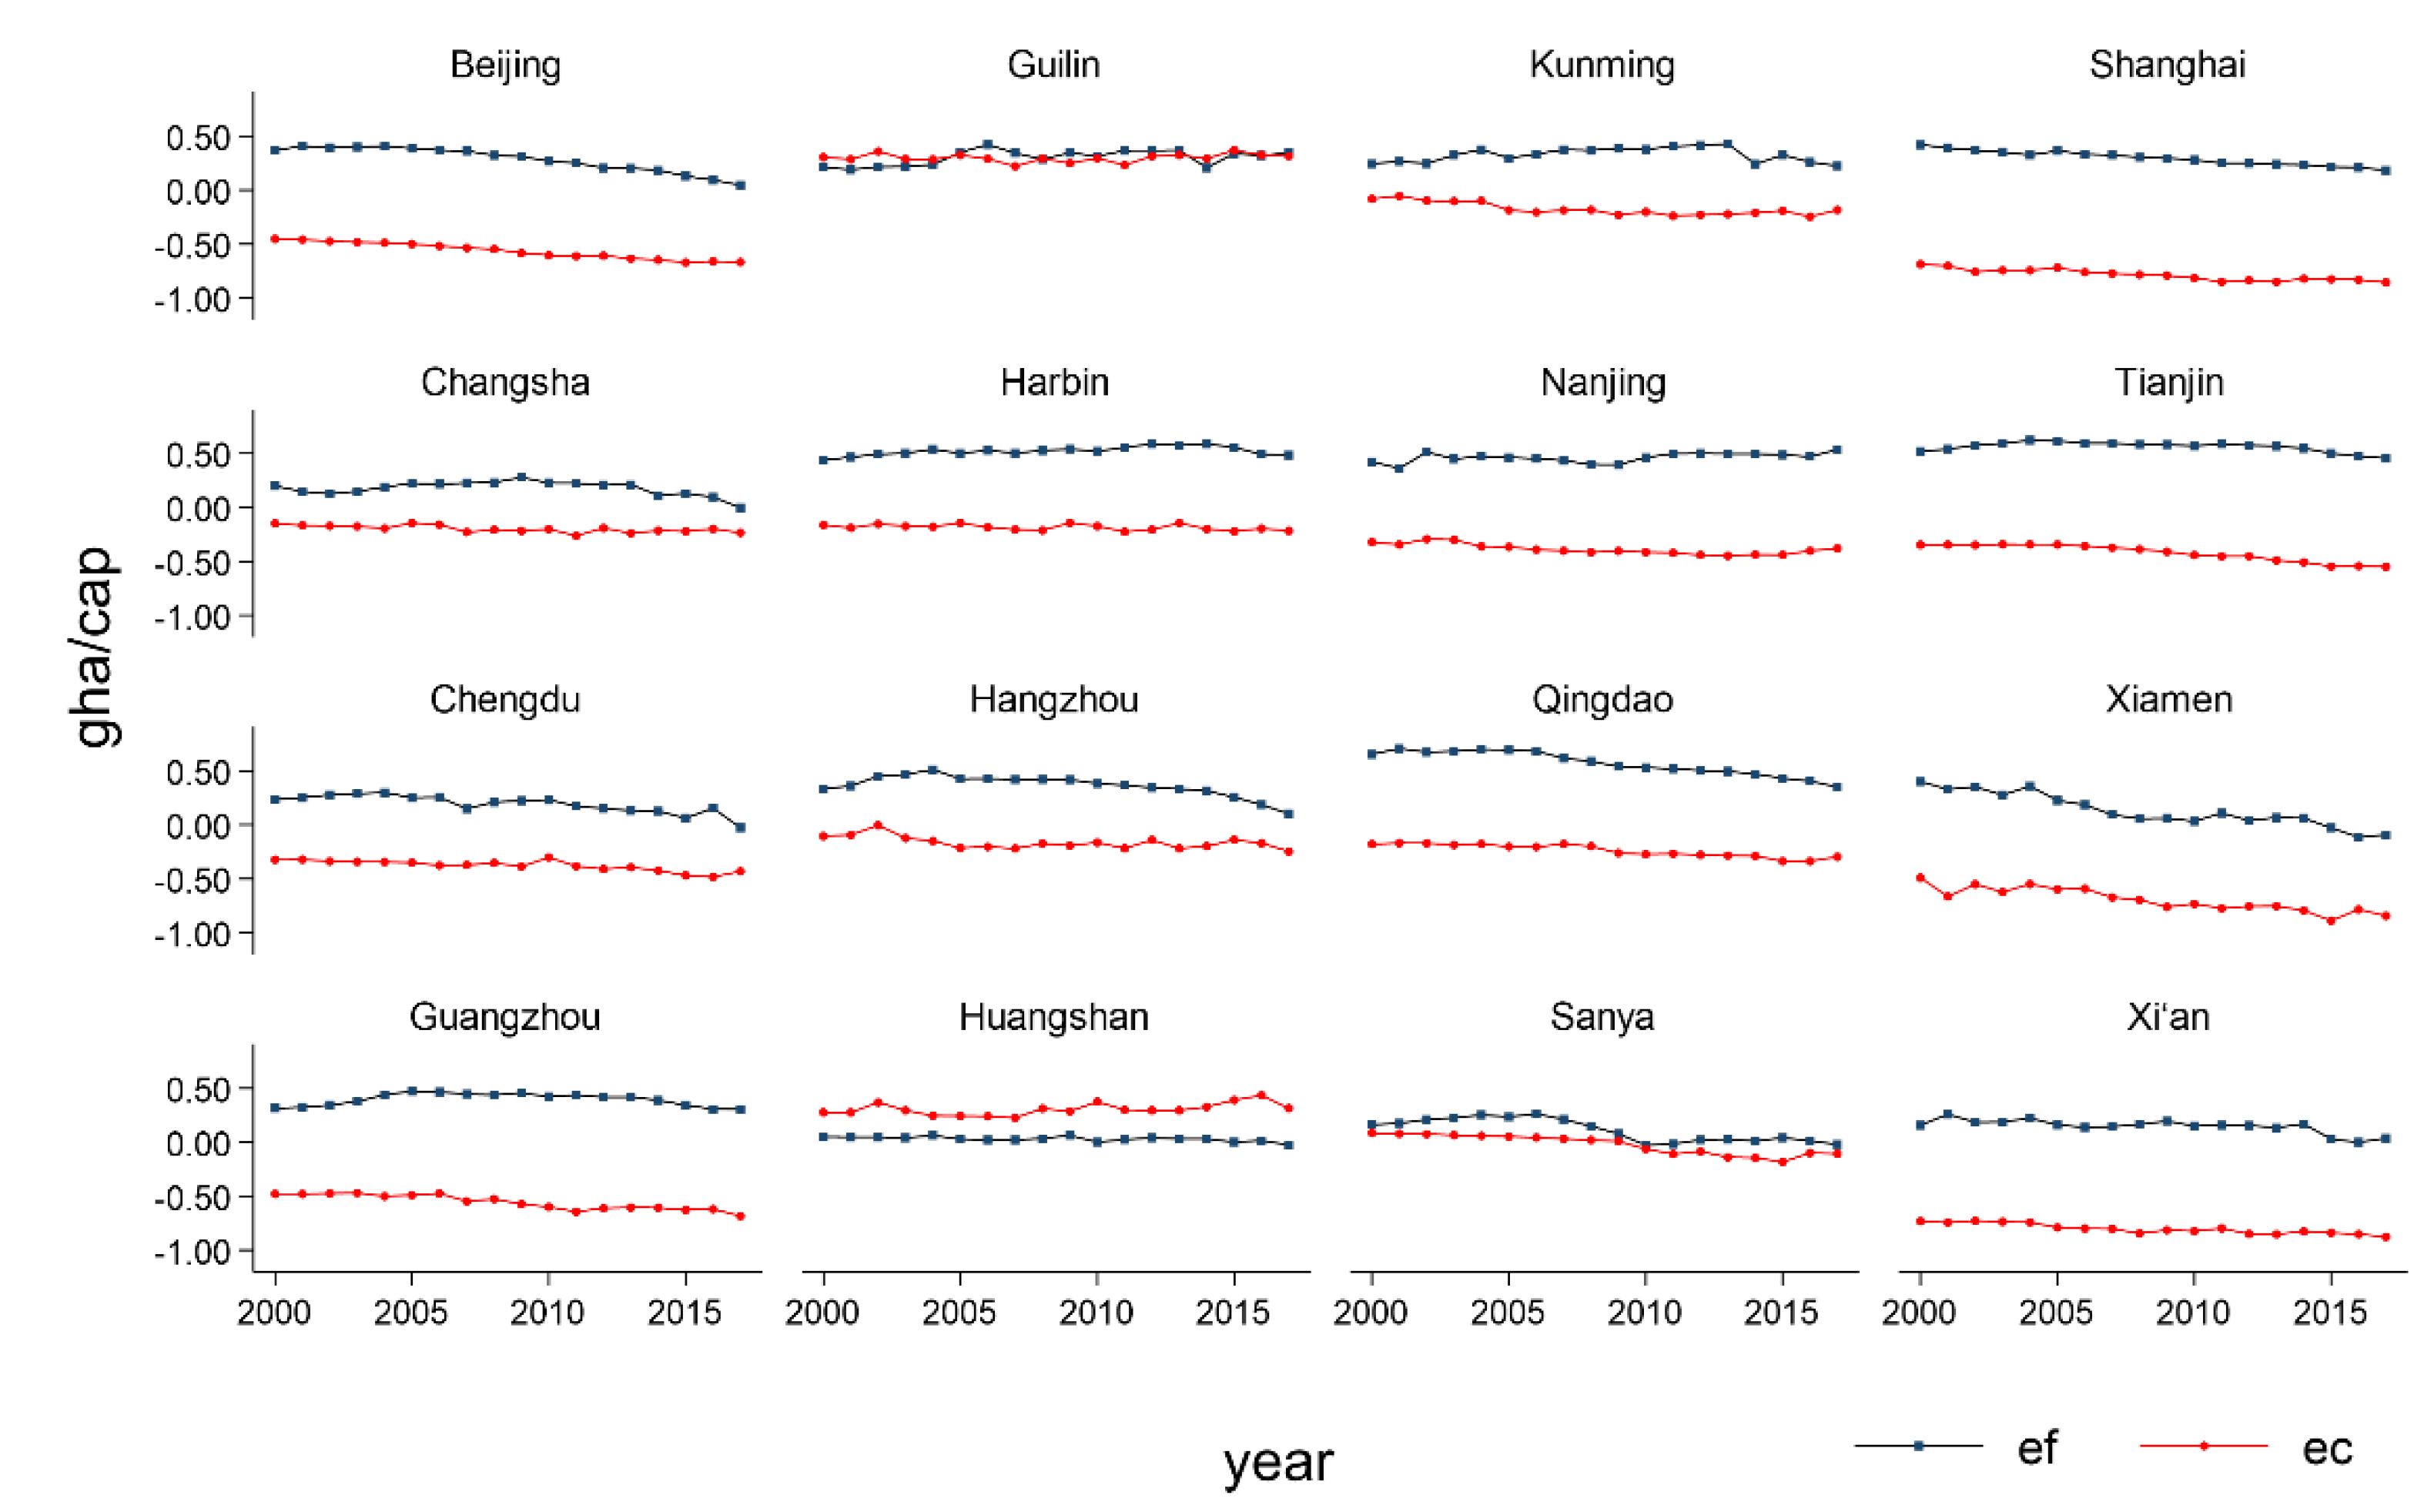
The relationship between per capita EF and per capita EC can help to study the green development status of selected cities. The dynamic changes in per capita EF and per capita EC of the 16 selected cities from 2000 to 2017 are shown in Figure 3. Among the 16 cities studied, the EF of Huangshan is slightly larger than the EC, and the EC and EF of Guilin and Sanya are basically the same. The EFs of the other 13 cities have far exceeded their EC, which means that these cities all have ecological deficits. It shows that between 2000 and 2017, the contradiction between supply and demand between EF and EC was significant. The rapid economic development and steady progress of urbanization have brought tremendous pressure to the ecosystem. The unsustainable development in the initial stage of urban construction consumes a lot of natural resources, which have exceeded the range that the ecosystem can withstand. Further analysis of the trend of change, although the EF of Beijing, Chengdu, Hangzhou, Qingdao, Sanya, Shanghai, Xiamen, and Xi’an has fluctuated in a small range, reveals that the overall trend is declining year by year. While Changsha, Guangzhou, Guilin, Harbin, Huangshan, Kunming, Nanjing, Tianjin have always kept their EF at a certain level. From the specific numerical point of view, the global EF is 1.6 hm2 per person, and the cities studied belong to the “regional-global unsustainable” development area, which means they are unsustainable regardless of the local or global scale [64,65]. From the perspective of per capita EC, the overall per capita EC did not change much from 2000 to 2017. The population of each city is increasing to varying degrees, so the per capita EC indicates that the total EC of the selected cities is gradually increasing. It shows that environmental management and control measures have achieved initial results. However, further analysis is needed for the specific factors that cause the dynamic changes of the EF.

4.2. Evaluation of the Green Development Efficiency

4.2.1. Dynamic Analysis of EFI

After analyzing the per capita EF and EC, the EFI is selected to evaluate the overall ecological sustainability of the study area. It can be seen intuitively from Figure 4 that the EFIs of all cities are all greater than 1, which means that the ecological pressure of these cities is greater than the EC. Although the EFI of cities all fluctuates in different degrees, they all fall within the range of 1–10. It shows that during the study period, although these cities were in a slightly unbalanced state of ecological pressure and carrying capacity, the overall ecosystem was in a relatively safe state. However, this kind of ecological security is still not optimistic. A series of problems, such as unreasonable economic structure, irrational consumption structure, and a serious waste of resources, is still threatening the ecological security of tourist cities.

4.2.2. Dynamic Changes of EECI

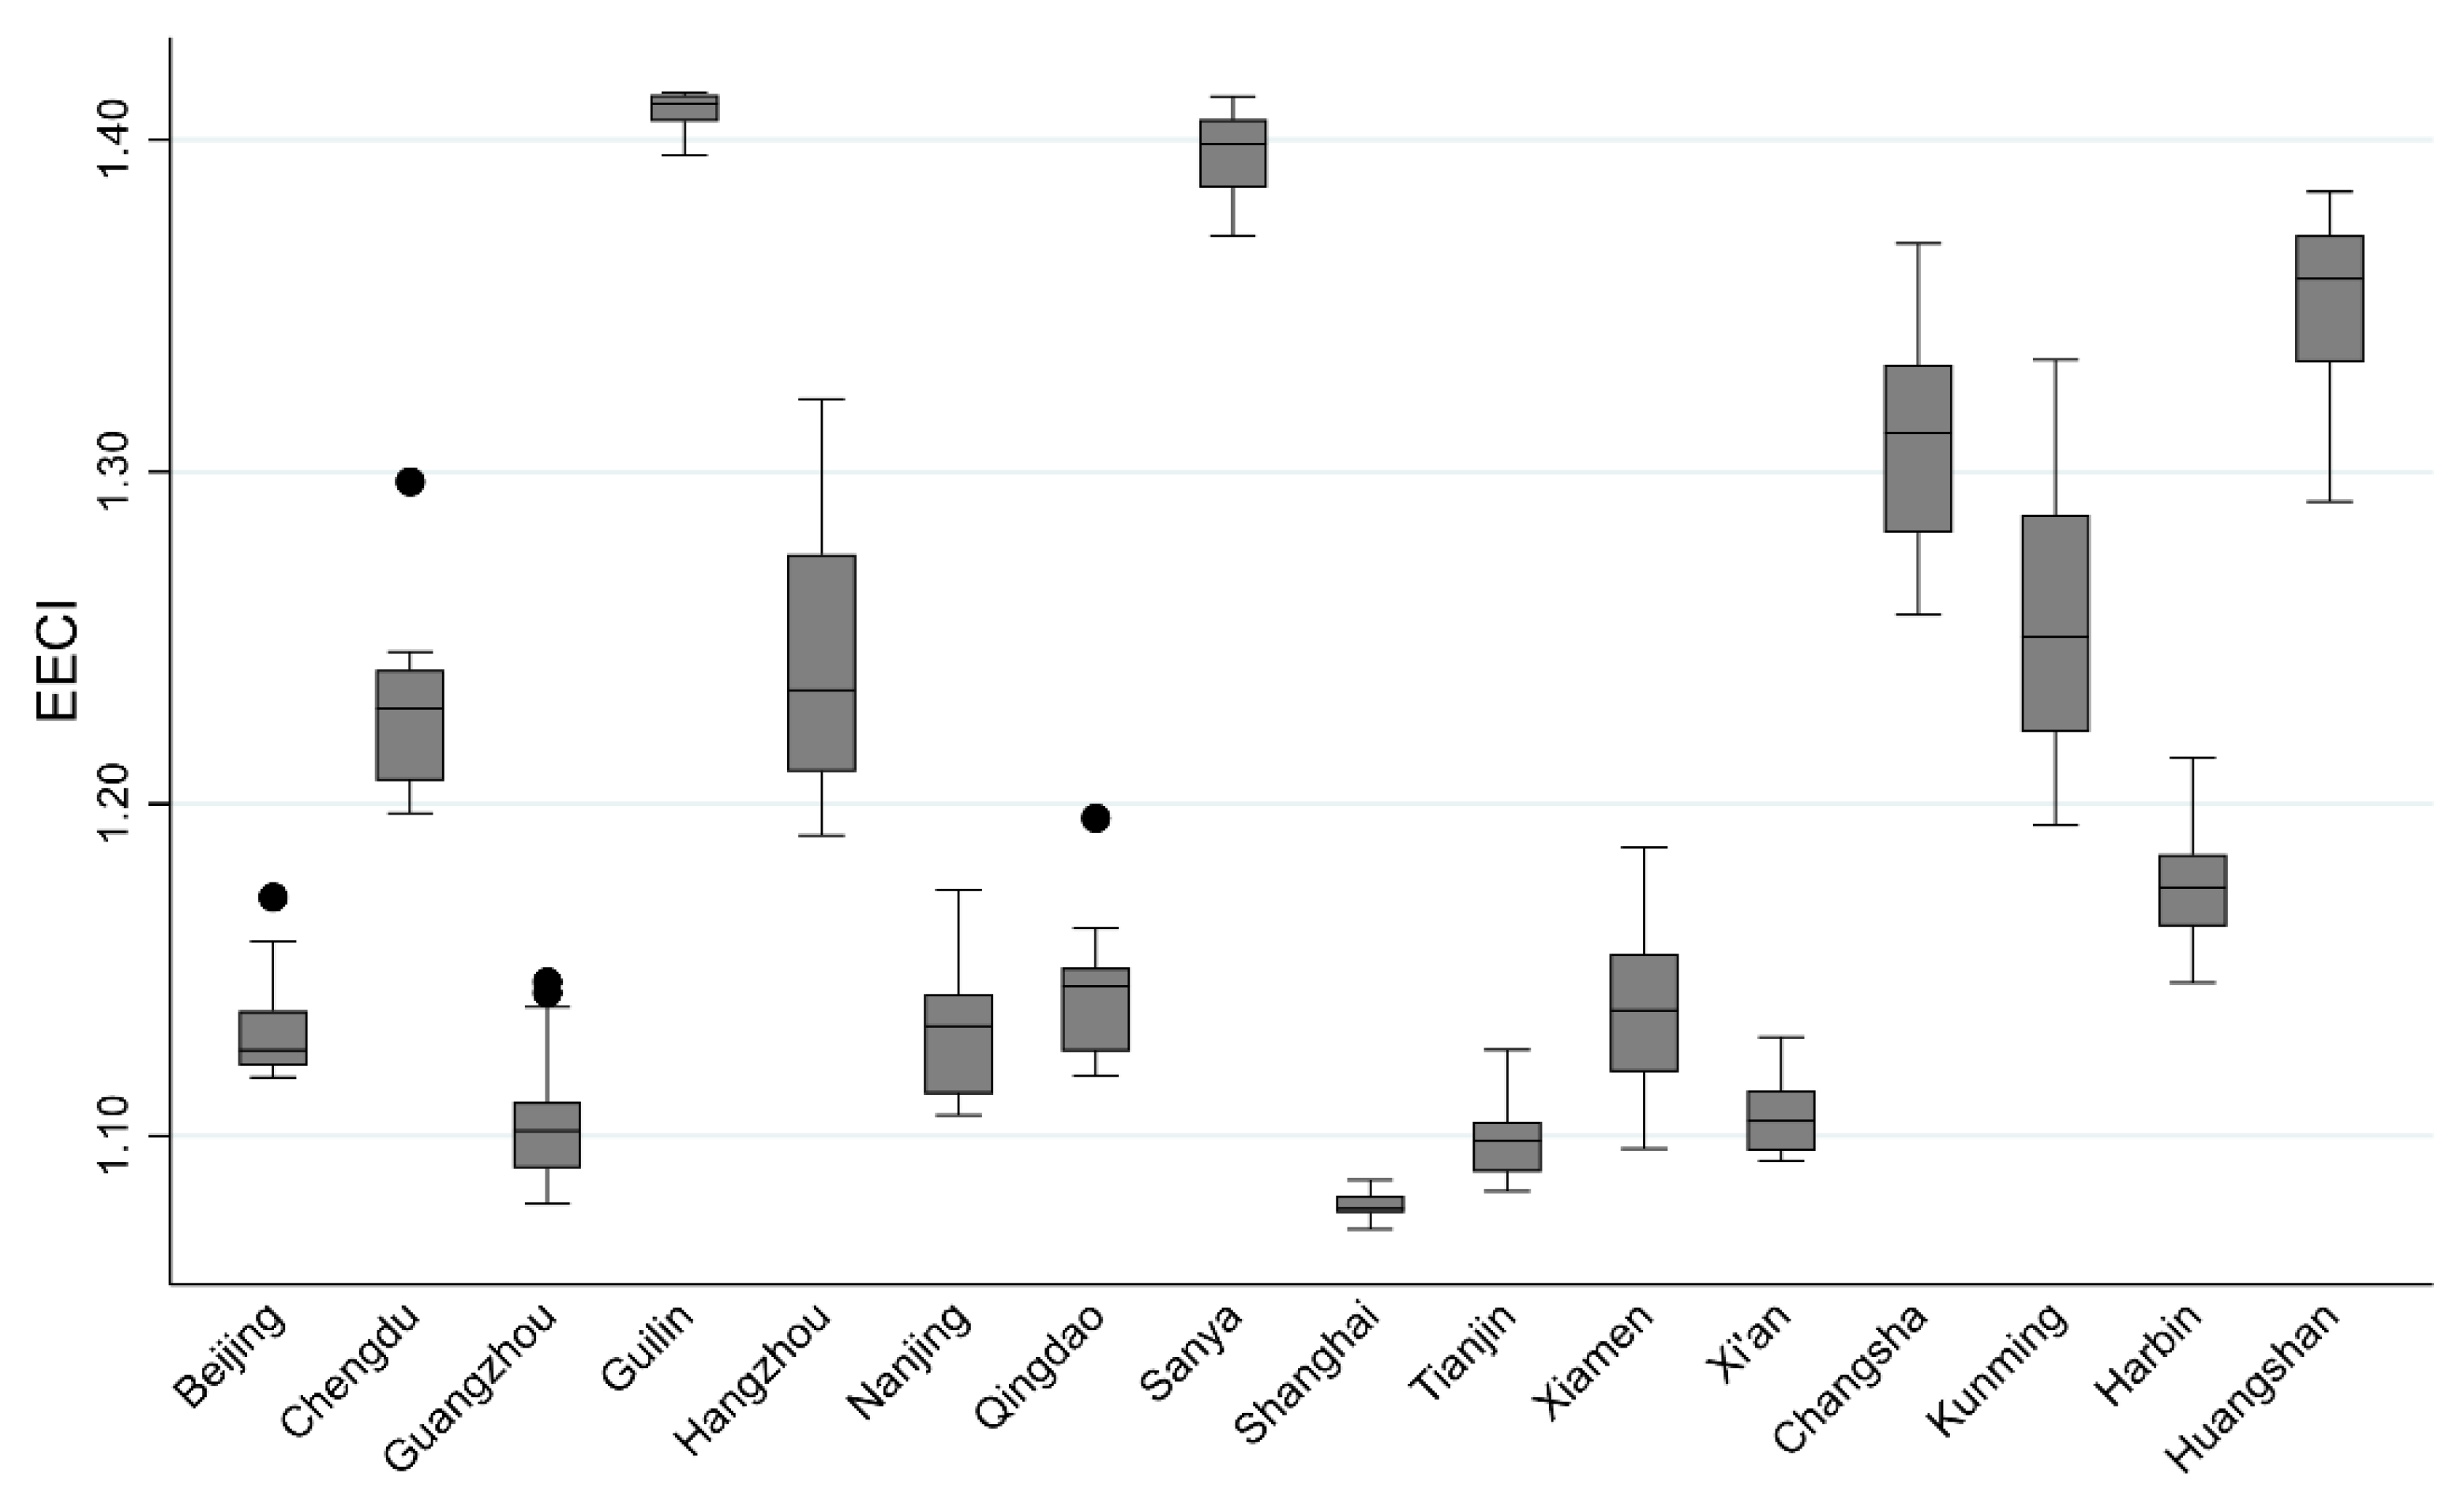
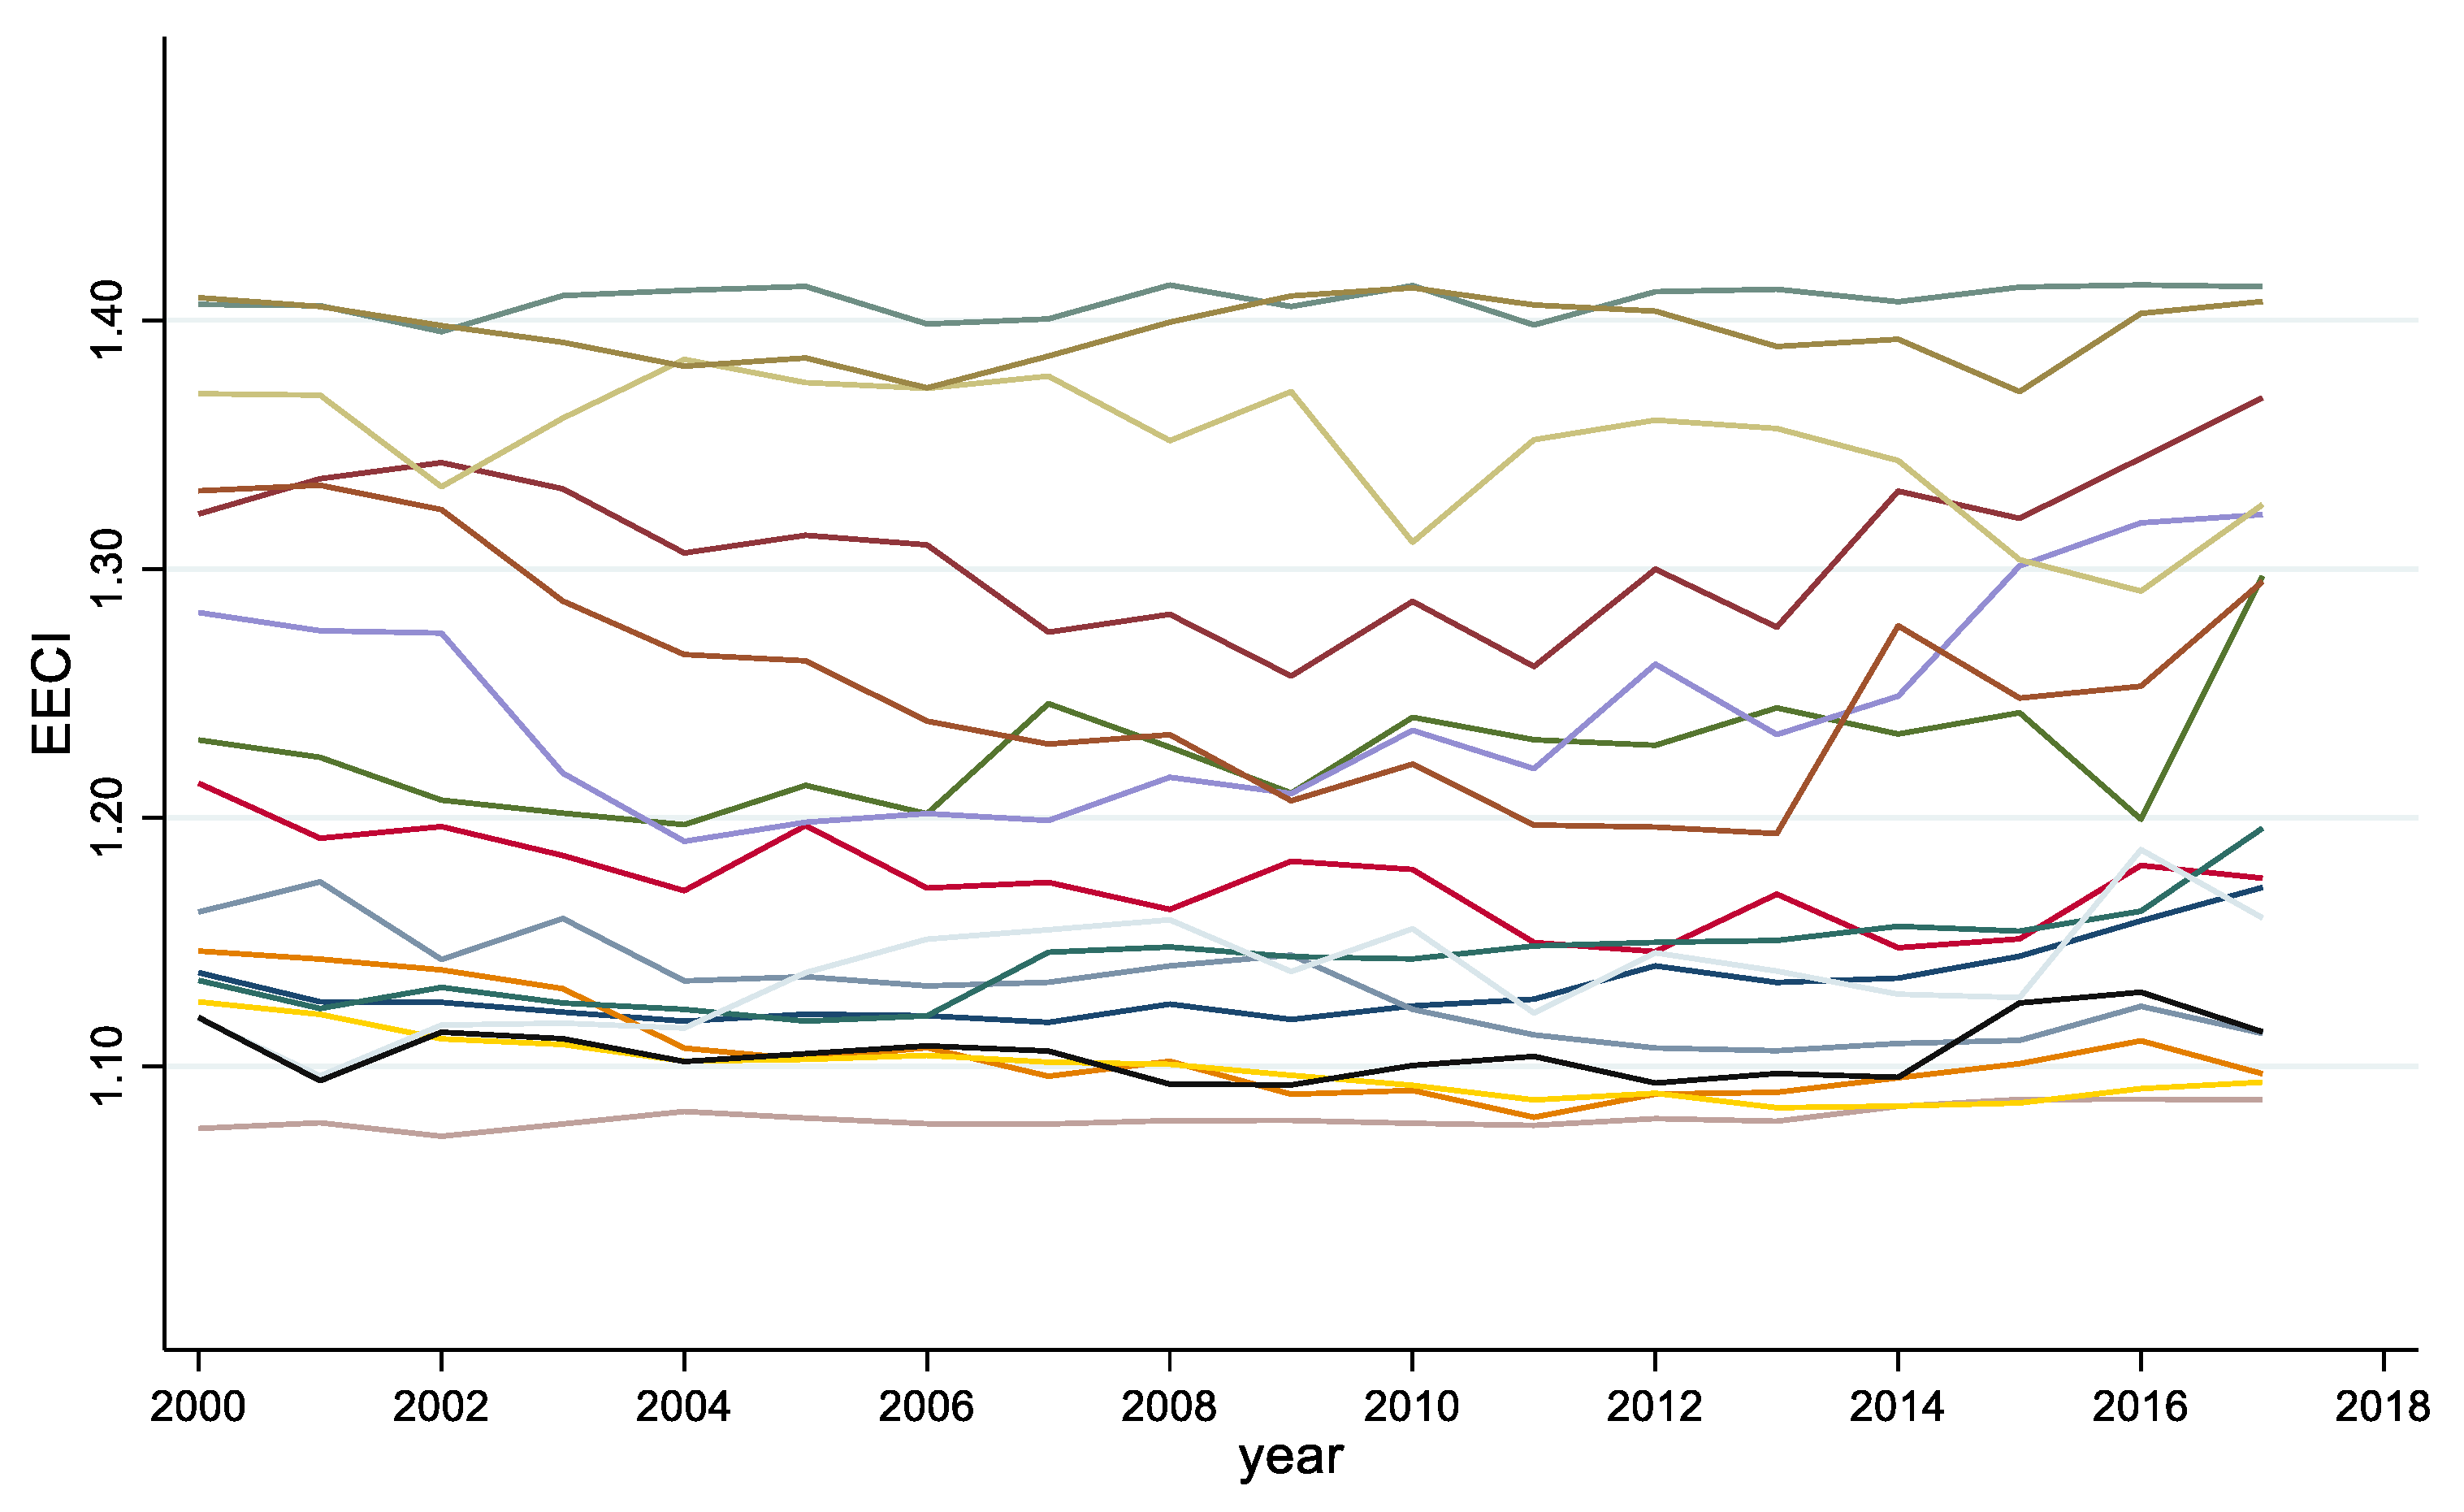
To further reflect the relationship between EF and resource endowment conditions, the trend of EECI is shown in Figure 5. The EECI values of the 16 cities selected in this study are all greater than 1 and are concentrated in the range of 1.17–1.41, indicating that these cities are all in poor coordination of land overload capacity, and their demand for ecological resources slightly exceeds the local ecological load. There is little change in EECI value in the time series, indicating that the ecological coordination status has changed little in the past 17 years. Since the EFI value in this study is greater than 1, this trend indicates that the coordination between the ecosystem and the economic system has been improved. The contradiction between EF and EC has eased, but it is still in an unbalanced state. This is due to the city’s vigorous adjustment of economic structure, pollution control, and ever-expanding social and economic scale.
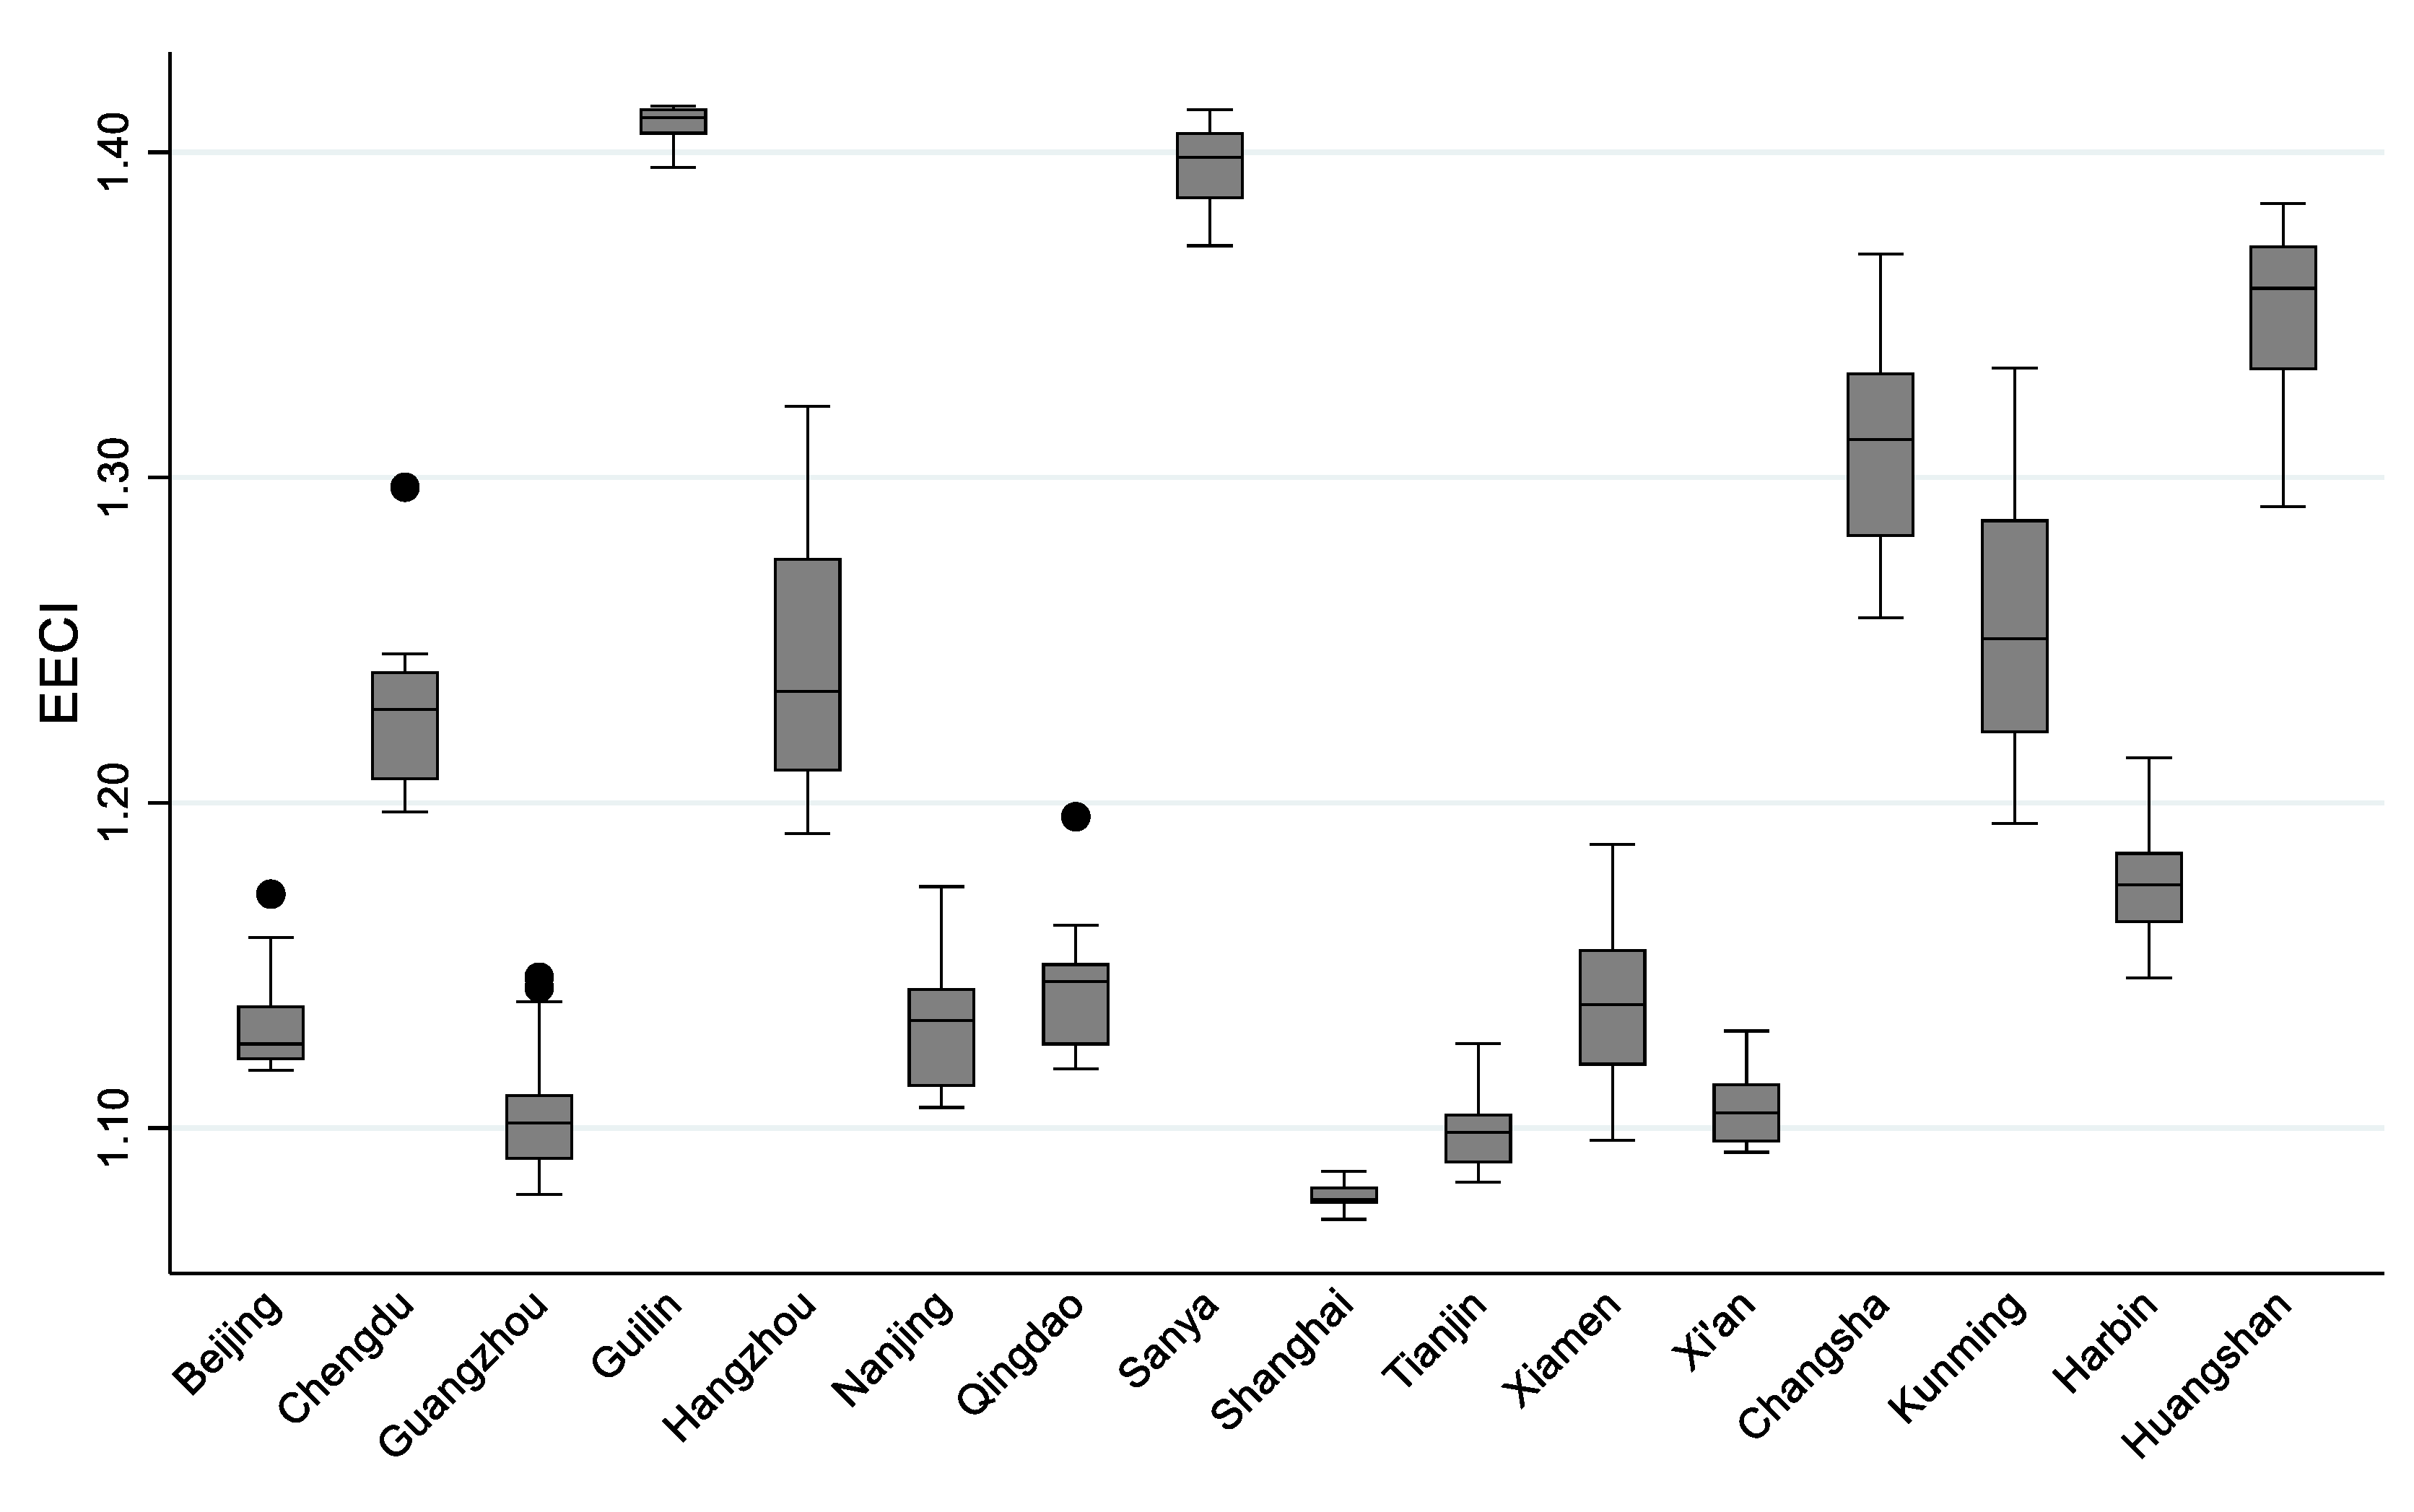
For different cities, although the EECI of all cities is distributed between 1.00 and 1.41, there are certain differences in the value range. Taking the intermediate value of 1.20 as the limit, it can be seen intuitively in Figure 6, the EECI values of Chengdu, Guilin, Hangzhou, Sanya, Changsha, Kunming, and Huangshan all fluctuate to a certain extent, but they are all close to 1.41, indicating that these cities have good ecological coordination. Among them, Guilin has the highest ecological coordination index, and the median line is (1.41). The regional EF and EC are in a completely balanced state, and the ecological carrying pressure is the smallest. The EECI values of Beijing, Guangzhou, Nanjing, Qingdao, Shanghai, Tianjin, Xiamen, Xi’an, and Harbin are all less than 1.2 and closer to 1, indicating that these cities have poor ecological coordination. Among them, the EECI of Shanghai is the lowest, and the change is extremely small, indicating that the supply of ecological resources in this area is extremely unbalanced, the ecological carrying pressure is extremely great, and the local ecological sustainable development still has serious challenges.

4.2.3. Dynamic Changes in the EF of Ten Thousand Yuan GDP

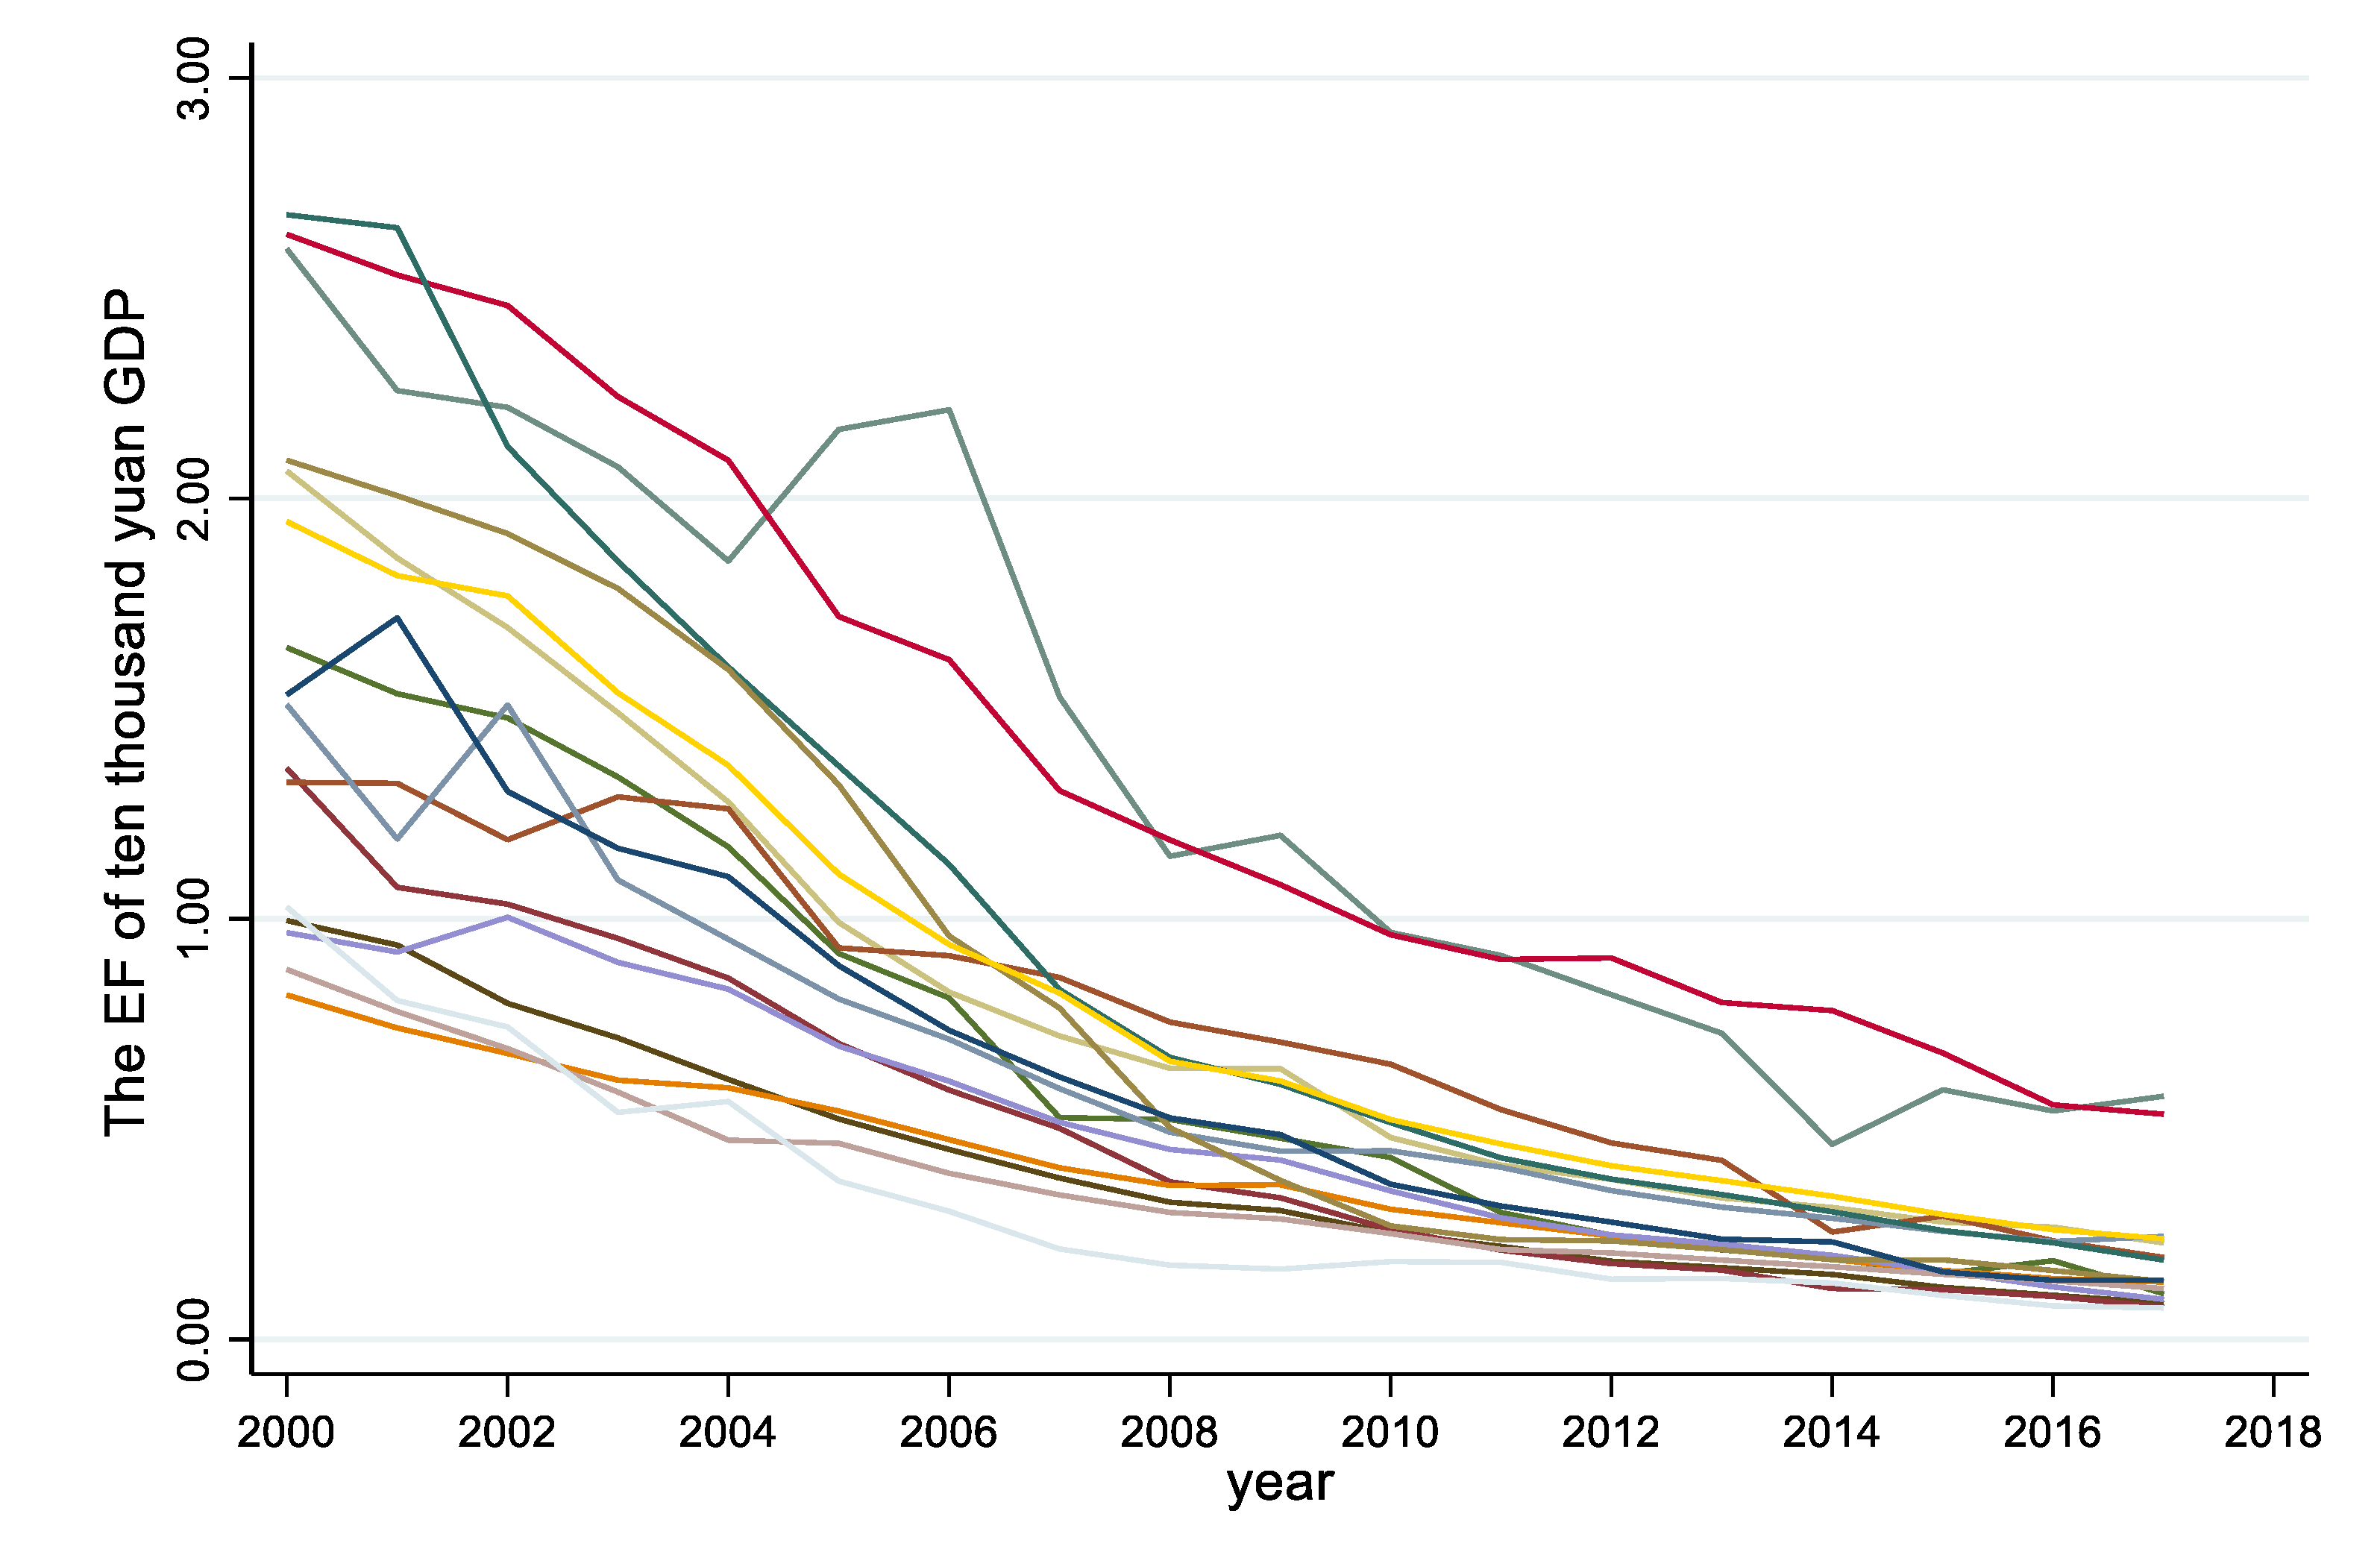
The EF of ten thousand yuan GDP can reflect the efficiency of the use of natural resources. In Figure 7, the EF required for the ten thousand yuan of GDP of the 16 tourist cities studied is decreasing year by year, which indicates that while increasing resource consumption, these cities have also achieved a certain degree of improvement in the utilization ratio of resources. This means that although most of the selected cities have EF that does not match the EC and excessive use of natural capital stocks, resource utilization efficiency is increasing year by year. The mode of resource utilization has a tendency from extensive and consumable to intensive and economical. Progressive science and technology have made it possible to get rid of the heavy dependence on natural resources. The improvement of environmental awareness also makes the government pay more attention to the ecological environment in urban development.
Although all cities show a downward trend in the EF of ten thousand yuan GDP, the degree of decline varies. This paper further compared the EF of each city in 2000 and 2017 and analyzed the differences between cities. It can be seen from Figure 8 that the change rate of the EF of ten thousand yuan GDP is greater than 75%, and the resource utilization efficiency is greatly improved. Among them, the rate of change in Beijing, Chengdu, Hangzhou, Qingdao, Sanya, Xiamen, Xi’an, and Changsha is greater than 90%. Urbanization has increased the demand for natural capital, but under the condition of rational and efficient use of natural resources, the overall dependence of these cities on ecological resources has declined. Guilin and Harbin have the lowest change rate with a relatively high EF of ten thousand yuan GDP. There is still room for improvement in the efficiency of resource utilization, and further measures need to be taken to reduce the EF while developing the economy.

4.3. Analysis of Driving Factors

4.3.1. Determination of Regression Model

The ecological deficit is affected by the combination of EF and EC. The per capita EC of each study area has not changed much in recent years, which reflects the effectiveness of ecological environment control. Therefore, this paper used the significantly changed per capita EF as the explained variable to construct a panel data analysis model, trying to explore the driving factors of EF. First, the unit root test is done on the data. The test result is Ι (1) single integer, and all cross-sectional data have stationarity, as shown in Table 3.
Since panel data includes both time series data and cross-sectional data, problems of heteroscedasticity and serial correlation may occur, which makes ordinary least squares (OLS) invalid. This paper used mixed least squares, fixed effects (FE), and random effects (RE) of the panel data model to estimate the results and conducted the Breusch-Pagan Lagrange multiplier (LM) test and Hausman test. The results of the Breusch-Pagan LM show that the panel data estimation method should be adopted, and the Hausman test further indicates that the FE model and the Least Square Dummy Variables (LSDV) model should be adopted. In addition, this paper tested the existing intra-group autocorrelation, inter-group heteroscedasticity, and inter-group synchronization correlation, and the above errors are found in the data (Table 4). Finally, a fixed effect with Driscoll and Kraay’s standard errors approach is used. See Table 5 for details. The final regression results are consistent with the coefficient estimates obtained by the fixed effects and the in-group R2, but the standard error has changed.

4.3.2. Analysis of Driving Factors of Economic Subsystem

Based on the characteristics of each industry, the factors affecting the EF are different. With reference to the EF accounting process, the primary industry mainly generates direct ecological occupation, and its EF is mainly the biological production footprint. The development of the secondary industry needs to consume a lot of resources and energy, mainly energy consumption footprint. The tertiary industry is mainly related to the EF of built-up land. The influence coefficients of the proportion of the primary industry and the secondary industry in GDP on the per capita EF are 0.00470 and 0.00896, respectively, indicating that the improvement of the economic development level and the adjustment of the economic structure have increased the pressure on natural resources and the per capita EF. The scale of the urban primary industry and traditional industry studied is still very large, and the economic growth is very dependent on industrial development. The pollution caused by energy consumption and the environmental damage caused by resource extraction have already had a greater impact on the ecological environment. It is still necessary to further strengthen macro-control and adjust the industrial structure.
The proportion of the tertiary industry in GDP has an impact coefficient of −0.00140 on the per capita EF, indicating that the development of the tertiary industry in the selected city will help reduce the regional EF. The more the tertiary industry attaches importance to the ecological environment, the smaller the impact on environmental pollution. However, this indicator has failed the significance test, mainly because the proportion of tertiary industry in the GDP of different types of tourist cities is quite different. For natural resource-based tourist cities, the tertiary industry accounts for an extremely high proportion of GDP, and they are very dependent on natural landscape resources, so changes in the tertiary industry have a greater impact on the EF. In cities that rely on developed economy and urbanization to achieve their own tourism development, both the secondary industry and the tertiary industry are very developed, of which the secondary industry is the mainstay. The strength of the EF of these cities itself is very high, so the adjustment of industrial institutions brought about by the changes in the tertiary industry has a relatively small impact on the growth of the EF. Secondly, since the tertiary industry mainly corresponds to built-up land in the process of EF calculation, the increase in the scale of the tertiary industry will also be accompanied by an increase in the area of built-up land, which suppresses its mitigation effect on the EF to a certain extent. From the perspective of the industrial structure, the development of cities will inevitably be accompanied by the transfer of economic factors from the primary industry to the secondary and tertiary industries and, finally, to the tertiary industry. From the perspective of energy structure, the development of the tertiary industry is conducive to promoting the improvement of energy efficiency. Therefore, promoting the development of the tertiary industry is an important means to optimize the ecological environment of large and medium cities in China.

4.3.3. Analysis of Driving Factors of Social Subsystem

In the social subsystem, the urbanization rate has a significantly negative impact (−0.00419) on the per capita EF. Urbanization has caused a large number of people to gather in a certain area, intensively consuming the resources and energy of the area, and increasing the pressure on the sustainable ecological environment. At the same time, the expansion of the urban area also requires more cropland and built-up land, which has over-utilized the land ecology of the area. When the population growth rate is greater than its impact on the ecological environment, the urbanization rate and per capita EF show a negative correlation. With the advancement of urbanization and the development of urban tourism, the construction of the ecological environment will be increased, energy utilization efficiency will continue to increase, and finally, the industrial organization will be transformed. Ultimately, the high-quality development of cities can contribute to reducing environmental pollution and reducing EF. At the same time, the improvement of the level of urban development will be accompanied by an increase in residents’ environmental awareness, which will also help to reduce the EF.
The per capita investment in fixed assets and per capita EF show a significant positive correlation. In the calculation of EF, the land use types involved in fixed-asset investment are mainly built-up land and fossil energy land. Fixed asset investment is mainly used for infrastructure construction and public facilities, reflecting the intensity of land use to a certain extent. The more capital and labor are invested, the faster the area of built-up land will increase, which will increase the EF. At the same time, the increase in investment in fixed assets will inevitably increase the production scale of industrial enterprises, resulting in more consumption of resources and energy, and ultimately increasing environmental pollution.
The number of patents granted represents the degree of technological progress, and its impact coefficient on the per capita EF is −0.00787. The level of technological development is an indispensable element for cities to improve the utilization of natural capital. On the one hand, the update of related technologies can improve the efficiency of capital utilization and supply capacity, thereby largely curbing the negative impact of human activities on the ecological environment. At the same time, technological progress can promote the optimization of the industrial structure, which, in turn, has an indirect impact on the economic subsystem. At present, the direct contribution of scientific and technological progress to the reduction of EF is still not significant. It is necessary to further promote related technologies to be practically applied to the improvement of the ecological environment as much as possible. However, technological progress will also lead to an increase in demand for natural resources. If the blind use of natural resources exceeds the carrying capacity of the ecological environment, it will eventually lead to ecological imbalance.

4.3.4. Analysis of Driving Factors of Ecological Subsystem

The tourism industry has a dual relationship with the ecological environment. On the one hand, the extensive and high-intensity tourism activities in the initial stage gradually exert pressure on the urban ecological environment. On the other hand, the development of tourism is also restricted by the regional ecological environment. For tourist cities, especially cities with abundant natural resources and landscapes, a good ecological environment and natural landscape are the primary factors to attract tourists to travel. It is necessary to actively protect the endowment of ecological resources in order to realize the sustainable development of its tourism industry. The forest coverage rate has a significant and negative impact on the per capita EF (−0.00361). The forest ecosystem has a strong absorption capacity for waste gas and other pollution emitted by human production and life, which can help alleviate environmental pollution to a certain extent and alleviate the increase in per capita EF. The percentage of greenery coverage in built-up areas, which reflects the ability to improve the quality of the urban ecological environment, on the EF is also negative (−0.00294) and has passed the 1% significance test. With the advancement of urbanization, the demand for urban greening facilities has increased, which has promoted the increase of urban green space. The increase in a green area can help improve the quality of the urban ecological environment and, to a certain extent, alleviate the pressure on the ecological environment during urban construction. Improving the endowment of ecological resources is an important way to reduce the EF and achieve sustainable development. The increase in forest coverage and green coverage in built-up areas reflects the government’s investment in and emphasis on the ecological environment during the construction process.
The per capita cultivated land area and the per capita EF show a significant negative correlation, with a coefficient of −0.0426. Cultivated land resources have strong externalities, and the ecological benefits they produce play a huge role in the maintenance of the ecosystem. Cultivated land is an important source of material resources for human daily life, as well as an important source of EC. However, the expansion of cities, the increase of built-up land, and the increasing degree of human activities’ impact on natural resources have made the protection of cultivated land resources with the attributes of public goods more and more severe. Therefore, only by protecting cropland can the sustainable development of cities and regions be guaranteed.

4.3.5. Analysis of Driving Factors of Tourism Subsystem

The regression results show that the impact of per capita tourism consumption on the per capita EF is negative (−0.0182). Considering the development status of tourist cities comprehensively, different development models of the tourism industry will have different effects on the EF. Tourism income based on urban landscapes has a great demand for built-up land and urban infrastructure. The activities and consumption of tourists in the city will increase the overall resource and energy burden of the city, which will increase the local EF per capita. For tourism income dominated by natural landscapes, the growth of tourism income is a huge economic driving force for local protection of the natural ecological environment. When planning for the development of tourism, diversified forms of tourism should be developed while maintaining the existing good natural ecological environment. This also means that the improvement of tourism quality urges tourist cities to attach great importance to the ecological environment, develop eco-tourism, and achieve green development in the process of developing tourism.
The impact of highway mileage on the per capita EF is always positive. The length of highways per 10,000 people can reflect the size of regional transportation investment to a certain extent. The increase in highway mileage increases the city’s carrying capacity and makes travel more convenient for passengers. In the process of improving tourism-related infrastructure construction, it is inevitable that natural resources and land will be occupied, increasing the pressure on the ecological environment. At the same time, transportation will produce air pollution, which will undoubtedly increase the load on the ecological environment.

4.4. Classification Analysis of Tourist Cities

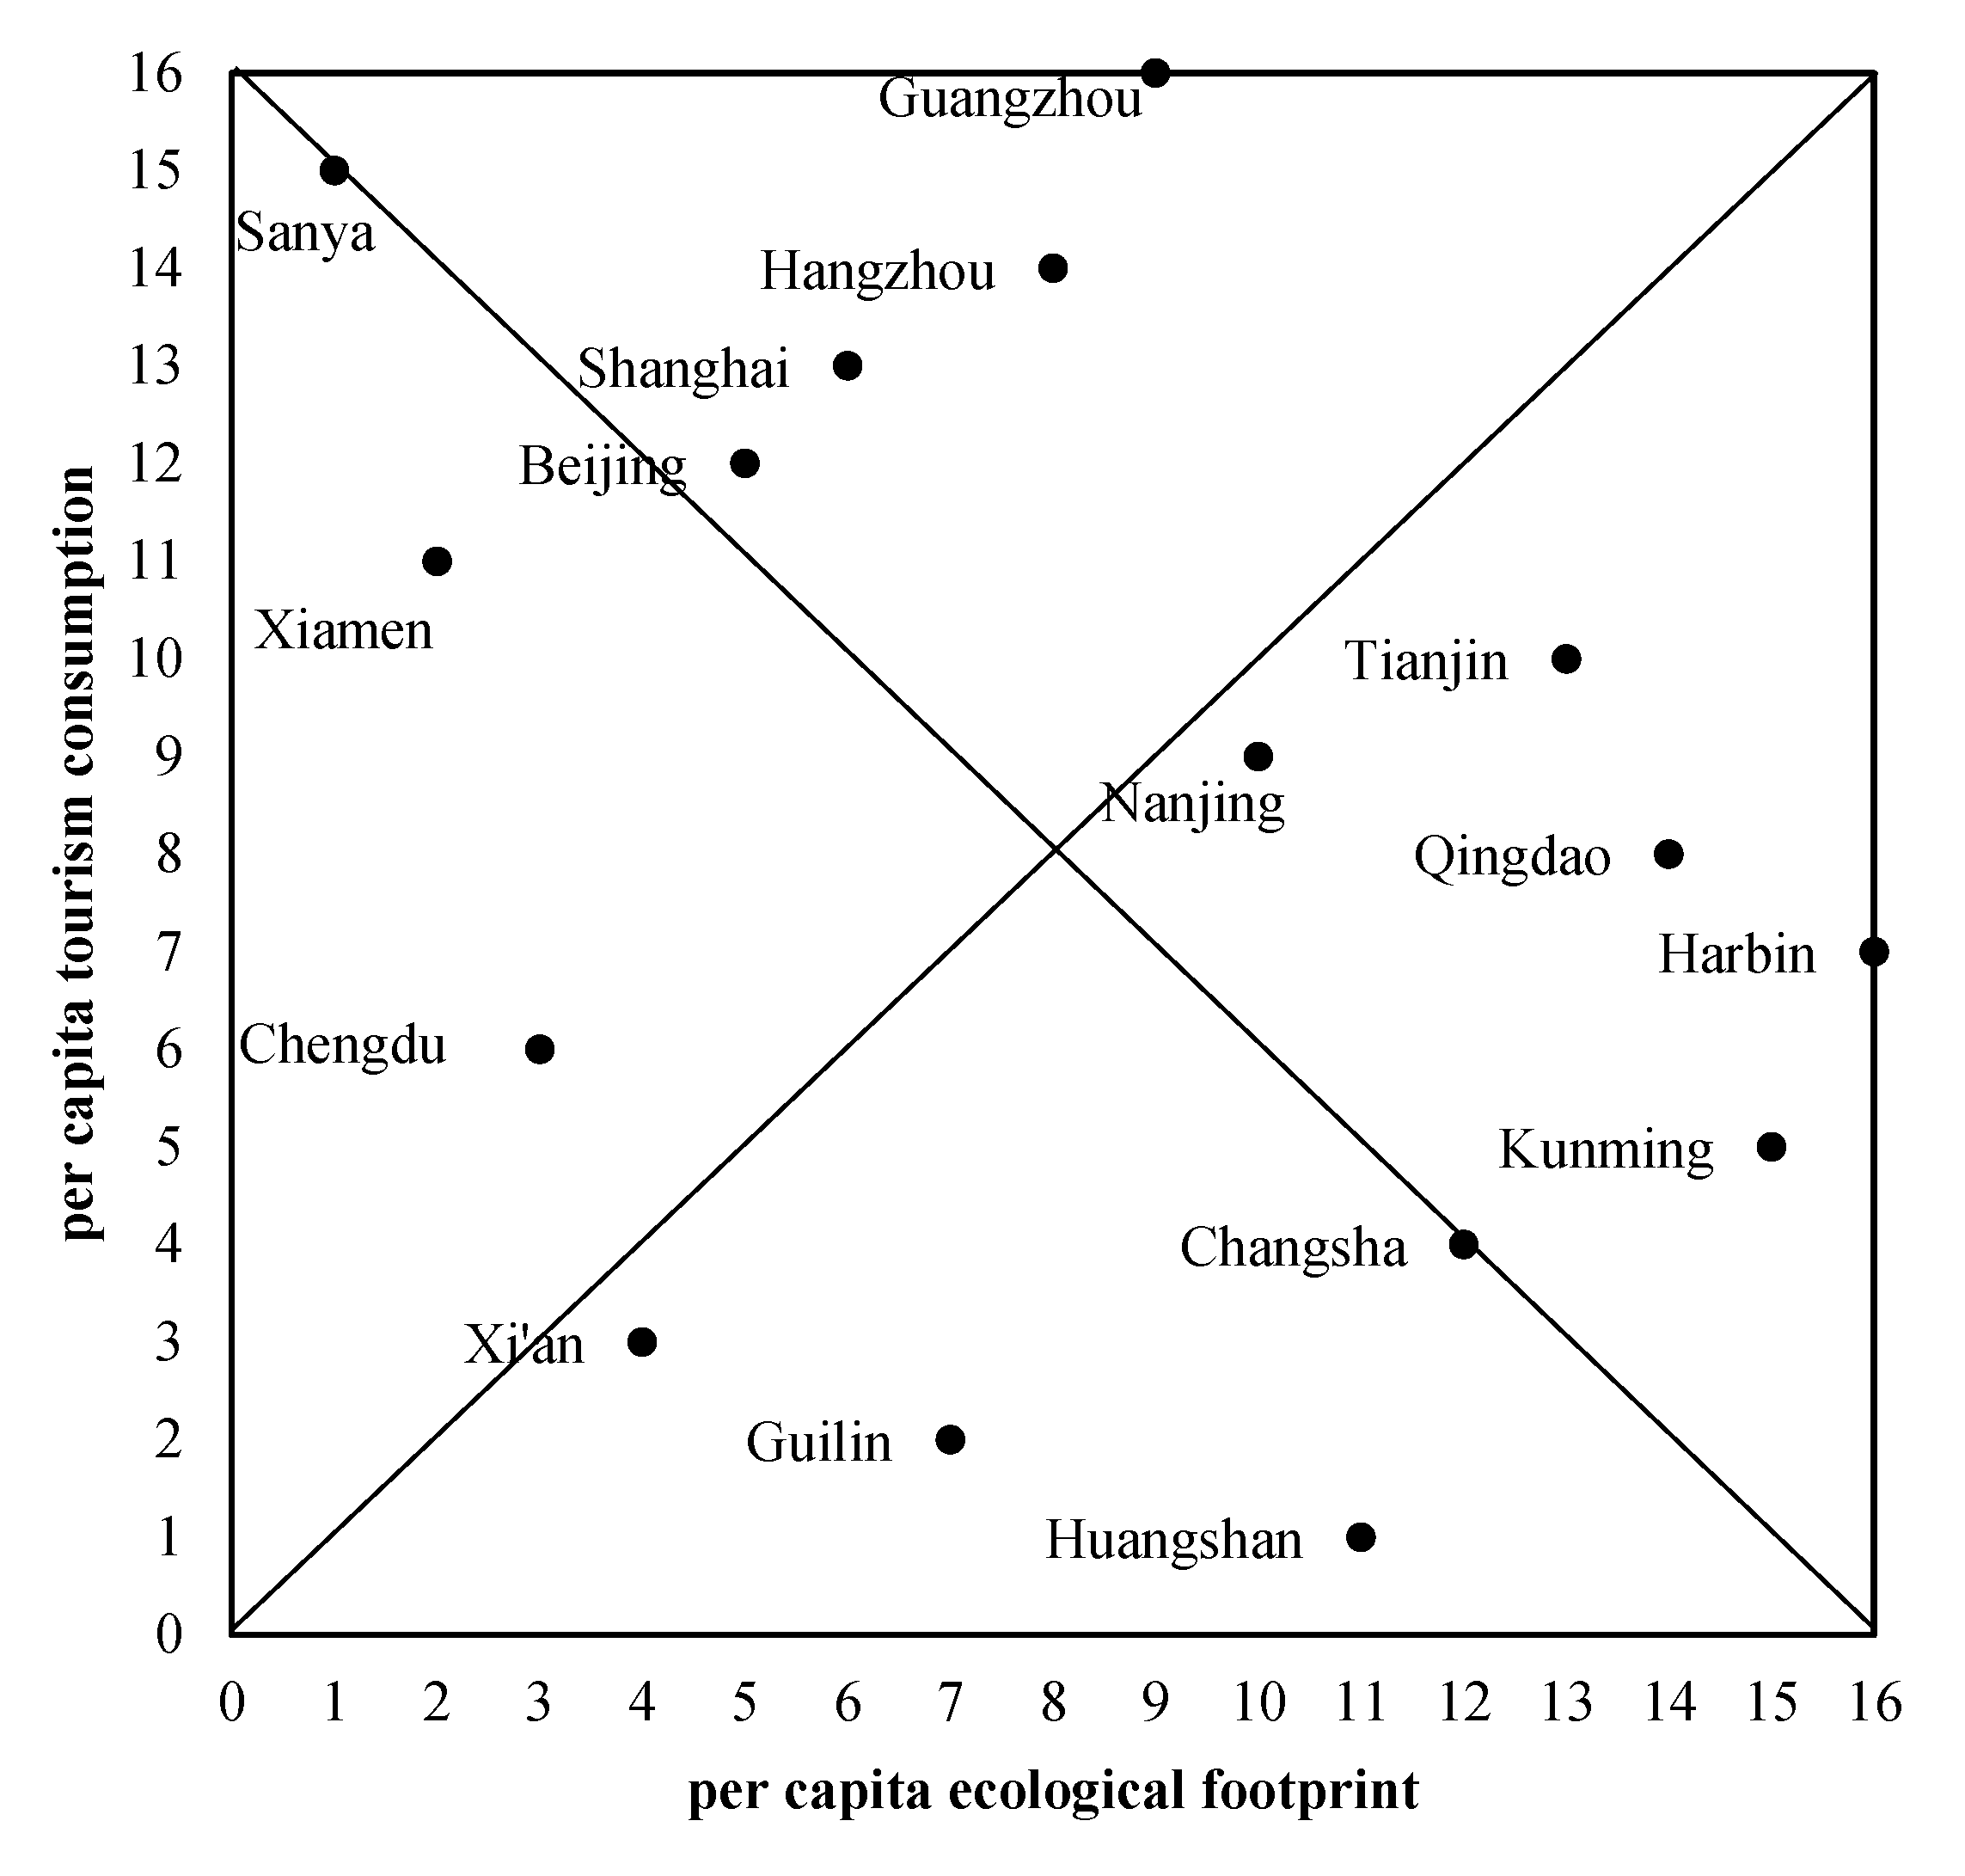
The analysis of driving factors shows that per capita tourism consumption has a negative impact on the per capita EF. However, due to the different economic development status and the different quality of natural resources, different cities show different laws of tourism development. This paper divided selected cities into four different categories according to the relationship between per capita ecological footprint and per capita tourism consumption, which are high per capita ecological footprint-high per capita tourism consumption (Ι), high per capita ecological footprint-low per capita tourism consumption (II), low per capita ecological footprint-high per capita tourism consumption (III), low per capita ecological footprint-low per capita tourism consumption (IV) (Figure 9). To obtain more accurate classification results, Sanya, Xi’an, Guangzhou, and Kunming, the four cities with the shortest distance from the four vertices in Figure 9, are selected as the initial clustering center.
Table 6 shows the results of the cluster analysis using the K-means clustering method. The cluster analysis has classified the selected tourist cities into four categories. Sanya, Xiamen, Beijing, Hangzhou, Guangzhou, and Shanghai are cities with low per capita EF and high per capita tourism consumption. Nanjing, Tianjin, and Qingdao belong to the category of high per capita ecological footprint-high per capita tourism consumption. Chengdu, Xi’an, Guilin, Huangshan, and Changsha are cities with low per capita EF and low per capita tourism consumption, while Kunming and Harbin are cities with high per capita EF and low per capita tourism consumption.
The per capita EF of category I cities is relatively low, while per capita tourism consumption is high. It shows that urbanization has relatively little pressure on the local ecosystem, and the tourism quality is relatively high. The reasonable planning and construction of the tourism industry and the protection of the ecological environment have greatly increased the willingness to pay off tourists so that the tourism industry can truly bring a lot of income to these kinds of cities. For category II cities, their tourism industry is very efficient. However, the EF generated during the development of tourism and the advancement of urbanization indicates that cities need to focus on improving the quality of the ecological environment and improving the efficiency of natural resource utilization. The per capita EF and per capita tourism consumption of cities in category III are both low. Low EF is beneficial to sustainable development, but the quality of tourism is also crucial to a tourist city. In particular, the two cities, Guilin and Huangshan, are inferior to other cities in terms of urban scale and overall economic development level, but they are rich in eco-tourism resources. If the local government wants to achieve the common development of ecology and economy, it is necessary to further improve the management level and develop green tourism to achieve high-quality development of tourism. Kunming and Harbin belong to category IV. These two cities not only have a high EF per capita but also low per capita tourism consumption. It means that it is necessary to further develop the tertiary industry represented by tourism in the industrial structure, strengthen the construction of the ecological environment, and reduce the negative impact of urban development on the ecology.

5. Conclusions and Suggestions

This paper selected 16 typical tourist cities in China and used EF to analyze the efficiency of green development and the main driving factors that cause changes from 2000 to 2017. First, among the 16 cities studied, the EF of Huangshan is slightly larger than the EC, and the EC and EF of Guilin and Sanya are basically the same. The EF of the other 13 cities all exceeds their EC. The contradiction between supply and demand with the carrying capacity of the ecosystem is significant. Secondly, the selected cities all have a certain degree of low ecological security and poor ecological and economic coordination, which means the green development of these cities need to further improve. However, the utilization efficiency of natural resources is increasing year by year, and the pressure on the ecological environment is gradually alleviating. Third, the results of panel data analysis show that the proportion of the primary industry in GDP, the proportion of the secondary industry in GDP, the per capita investment in fixed assets, and the length of highways per 10,000 people can increase the per capita EF. The proportion of the tertiary industry in GDP, the urbanization rate, the number of granted patents, the forest coverage rate, the percentage of greenery coverage in built-up areas, the per capita cultivated land area, and the per capita tourism consumption can reduce the per capita EF. In the process of exploring the green development of tourist cities, these driving factors need to be considered comprehensively to ensure the balance between urban development and ecological environment quality. Finally, the 16 selected cities are divided into four categories, and differentiated management suggestions on future ecological construction and tourism development are put forward to achieve sustainable tourism development.
Based on the researches in this article, the following suggestions are given for the green development of tourist cities in the future:
First, implement the division of labor and optimize the industrial structure. On the one hand, promote the coordinated development of tourism and agriculture. The primary industry is the foundation of national economic development, and cultivated land resources are an important part of the EF calculation. The contradiction between economic growth and limited cultivated land resources should be paid close attention to. At the same time, we must actively stimulate knowledge, technology, and information to become new driving forces for the development of the primary industry. Tourist cities should actively explore the social and economic development forms of mutual penetration and integration of agriculture and tourism and use their own resource advantages to develop characteristic tourism projects, such as rural tourism, experience tourism, and sightseeing agriculture. For cities with low per capita tourism consumption, it is necessary to actively introduce guiding policies and increase relevant investment to stimulate the further development of tourism.
Second, focus on promoting the sustainable development of tourism. Due to the particularity of tourist cities, their requirements for the quality of the natural environment are higher. It is more necessary to protect the landscape resources and environment through ecological conservation to realize the coordinated development of tourism and ecological construction. It is of great significance to improve the ecological carrying capacity, reduce or even reverse the ecological deficit, and realize the ecological balance to keep the city’s environmental resource endowment well. Cities with a large per capita EF should optimize the urban ecological environment through advanced industrial structure and rapid development of the service industry. For cities with small per capita EF and high natural resource endowment while tourism is not fully developed, governments should guide high-grade tourism, such as leisure tourism and experience tourism, actively advocate green tourism consumption, implement green tourism development, strengthen tourism environmental protection, and innovate green development mechanisms to stimulate the vitality of the local tourism market.
Third, promote a circular economy and gradually improve the energy structure. Fossil energy often occupies a major position in EF accounting. The dependence of current economic development on fossil energy cannot be significantly reduced in the short term. Therefore, in order to reduce the EF, improving energy efficiency, improving energy consumption structure, and developing environmentally friendly clean energy are very necessary and effective measures. The research and development of clean energy should be emphasized to promote the decoupling of economic growth and resource consumption.
Finally, handle the relationship between urbanization and ecological civilization. Blindly pursuing the urbanization and the size of the city will increase ecological pressure. Population growth should be controlled to keep pace with the improvement of EC and production capacity and avoid the increase of total EF caused by excessive population growth. It is necessary to integrate the concept of green, low-carbon, and ecological development into the entire process of the urbanization construction and formulate corresponding policies to mitigate the negative effects of urbanization, such as carbon taxes, emissions trading, and marketization of energy prices. It should be noted that due to differences in environmental pollution and urban expansion rates in different cities, the reasons for their formation are also different. This requires the corresponding development paths for cities in different regions and different stages of development in management strategies to achieve the coordinated development of urbanization and ecological civilization.
It needs to be pointed out that there are still many directions to be explored in the research on EF. First of all, the EF method is used for ecological sustainability analysis. The method is ecologically biased and does not consider people’s satisfaction with the existing consumption patterns. It needs to be combined with other methods to further reflect the status and goals of sustainable development. In addition, for modern cities, there is often a problem of centralization of economic function and the transfer of other functions to surrounding urban agglomerations, which will make EF calculated by traditional methods too large. In future related researches, urban agglomerations can be used as the research object to discuss the transfer of EFs between different cities so as to explore the management and planning methods of ecological environment based on EFs from a regional perspective.

Author Contributions

Conceptualization, Y.S.; Formal analysis, Y.S.; Funding acquisition, C.S.; Investigation, Y.S.; Methodology, Y.S., Z.Z.; Project administration, C.S.; Resources, C.S.; Supervision, C.S.; Validation, Z.Z.; Writing–original draft, Y.S., Z.Z.; Writing–review and editing, C.S. All authors have read and agreed to the published version of the manuscript.

Funding

This work was supported by the National Key R&D Program of China (No. 2019YFC0507505) and the Natural Science Foundation of the Higher Education Institutions of Anhui Province, China (No. KJ2020B23).

Conflicts of Interest

The authors declare no conflict of interest.

References

  1. UNWTO. International Tourism Highlights, 2019 ed.; World Tourism Organization: Madrid, Spain, 2019; p. 23. [Google Scholar]
  2. WTCF. Report on World Tourism Economy Trends. Available online: https://en.wtcf.org.cn/Research/WTCFReports/2019011516448.html (accessed on 20 June 2020).
  3. Ministry of Culture and Tourism of the PRC Statistical Bulletin on Cultural and Tourism Development. Available online: https://www.mct.gov.cn/whzx/ggtz/202006/t20200620_872735.htm (accessed on 20 June 2020).
  4. Hall, C.M. Constructing sustainable tourism development: The 2030 agenda and the managerial ecology of sustainable tourism. J. Sustain. Tour. 2019, 27, 1044–1060. [Google Scholar] [CrossRef]
  5. Mercado, L.; Lassoie, J.P. Assessing Tourists’ Preferences for Recreational and Environmental Management Programs Central to the Sustainable Development of a Tourism Area in the Dominican Republic. Environ. Dev. Sustain. 2002, 4, 253–278. [Google Scholar] [CrossRef]
  6. Onder, I.; Wober, K.; Zekan, B. Towards a sustainable urban tourism development in Europe. Tour. Econ. 2017, 23, 243–259. [Google Scholar] [CrossRef]
  7. Benckendorff, P.J.; Pearce, P.L. Australian Tourist Attractions: The Links between Organizational Characteristics and Planning. J. Travel Res. 2003, 42, 24–35. [Google Scholar] [CrossRef]
  8. Pearce, P.L.; Lee, U.-I. Developing the Travel Career Approach to Tourist Motivation. J. Travel Res. 2005, 43, 226–237. [Google Scholar] [CrossRef]
  9. Ashworth, G.; Page, S.J. Urban tourism research: Recent progress and current paradoxes. Tour. Manag. 2011, 32, 1–15. [Google Scholar] [CrossRef]
  10. Meethan, K. York: Managing the tourist city. Cities 1997, 14, 333–342. [Google Scholar] [CrossRef]
  11. Lenzen, M.; Sun, Y.; Faturay, F.; Ting, Y.P.; Geschke, A.; Malik, A. The carbon footprint of global tourism. Nat. Clim. Chang. 2018, 8, 522–528. [Google Scholar] [CrossRef]
  12. Zorpas, A.A.; Voukkali, I.; Pedreno, J.N. Tourist area metabolism and its potential to change through a proposed strategic plan in the framework of sustainable development. J. Clean. Prod. 2018, 172, 3609–3620. [Google Scholar] [CrossRef]
  13. Yang, Z.; Jiang, M.M.; Chen, B.; Zhou, J.; Chen, G.Q.; Li, S.C. Solar emergy evaluation for Chinese economy. Energy Policy 2010, 38, 875–886. [Google Scholar] [CrossRef]
  14. Mancini, M.S.; Evans, M.; Iha, K.; Danelutti, C.; Galli, A. Assessing the Ecological Footprint of Ecotourism Packages: A Methodological Proposition. Resources 2018, 7, 38. [Google Scholar] [CrossRef] [Green Version]
  15. Lv, Y.; Fu, W.; Li, T.; Liu, Y. Progress and prospects of research on integrated carrying capacity of regional resources and environment. Prog. Geogr. 2018. (In Chinese) [Google Scholar] [CrossRef] [Green Version]
  16. Hunter, C.; Shaw, J. The ecological footprint as a key indicator of sustainable tourism. Tour. Manag. 2007, 28, 46–57. [Google Scholar] [CrossRef]
  17. Gonzalezvallejo, P.; Marrero, M.; Solisguzman, J. The ecological footprint of dwelling construction in Spain. Ecol. Indic. 2015, 52, 75–84. [Google Scholar] [CrossRef]
  18. Castellani, V.; Sala, S. Ecological Footprint and Life Cycle Assessment in the sustainability assessment of tourism activities. Ecol. Indic. 2012, 16, 135–147. [Google Scholar] [CrossRef]
  19. Yang, Y.; Ling, S.; Zhang, T.; Yao, C. Three-dimensional ecological footprint assessment for ecologically sensitive areas: A case study of the Southern Qin Ling piedmont in Shaanxi, China. J. Clean. Prod. 2018, 194, 540–553. [Google Scholar] [CrossRef]
  20. Wackernagel, M. Our Ecological Footprint: Reducing Human Impact on the Earth; New Society Publishers: Oxford, UK, 1996; p. 160. [Google Scholar]
  21. Rees, W.E. Ecological footprints and appropriated carrying capacity: What urban economics leaves out. Environ. Urban. 1992, 4, 121–130. [Google Scholar] [CrossRef]
  22. Rees, W.E.; Wackernagel, M. Ecological Footprints and Appropriated Carrying Capacity: Measuring the Natural Capital Requirements of the Human Economy. In Investing in Natural Capital: The Ecological Economics Approach to Sustainability; Jansson, A., Hammer, M., Folke, C., Costanza, R., Eds.; Island Press: Washington, DC, USA, 1994. [Google Scholar]
  23. Chambers, N.; Simmons, C.; Wackernagel, M. Sharing Nature’s Interest: Ecological Footprints As an Indicator of Sustainability; Routledge: London, UK, 2000. [Google Scholar]
  24. Mattila, T. Any sustainable decoupling in the Finnish economy? A comparison of the pathways and sensitivities of GDP and ecological footprint 2002–2005. Ecol. Indic. 2012, 16, 128–134. [Google Scholar] [CrossRef]
  25. Li, X.M.; Xiao, R.B.; Yuan, S.H.; Chen, J.A.; Zhou, J.X. Urban total ecological footprint forecasting by using radial basis function neural network: A case study of Wuhan city, China. Ecol. Indic. 2010, 10, 241–248. [Google Scholar] [CrossRef]
  26. Zhang, L.; Jia, W.; Liu, Y. Relation between the ecological footprint and the economic growth of Huan Bohai Sea Economic Region—An empirical analysis based on the panel data model. J. Arid Land Resour. Environ. 2010, 24, 1–7. (In Chinese) [Google Scholar]
  27. Hopton, M.E.; White, D. A simplified ecological footprint at a regional scale. J. Environ. Manag. 2012, 111, 279–286. [Google Scholar] [CrossRef] [PubMed]
  28. Li, X.; Tian, M.; Wang, H.; Wang, H.; Yu, J. Development of an ecological security evaluation method based on the ecological footprint and application to a typical steppe region in China. Ecol. Indic. 2014, 39, 153–159. [Google Scholar] [CrossRef]
  29. Sun, C.; Zhen, L.; Giashuddin Miah, M. Comparison of the ecosystem services provided by China’s Poyang Lake wetland and Bangladesh’s Tanguar Haor wetland. Ecosyst. Serv. 2017, 26, 411–421. [Google Scholar] [CrossRef]
  30. Katircioglu, S.; Gokmenoglu, K.K.; Eren, B.M. Testing the role of tourism development in ecological footprint quality: Evidence from top 10 tourist destinations. Environ. Sci. Pollut. Res. 2018, 25, 33611–33619. [Google Scholar] [CrossRef] [PubMed]
  31. Lenzen, M.; Murray, S.A. A modified ecological footprint method and its application to Australia. Ecol. Econ. 2001, 37, 229–255. [Google Scholar] [CrossRef]
  32. Wang, S.; Fang, C.; Yang, W. Quantitative investigation of the interactive coupling relationship between urbanization and eco-environment. Acta Ecol. Sin. 2015, 221–231. (In Chinese) [Google Scholar] [CrossRef] [Green Version]
  33. Lu, Y.; Chen, B. Urban ecological footprint prediction based on the Markov chain. J. Clean. Prod. 2017, 163, 146–153. [Google Scholar] [CrossRef]
  34. Gao, C.; Zhang, S.; Mo, C.; Xingeng, C. Measuring sustainable development with the ecological footprint analysis in Guangdong province. Ecol. Environ. 2005, 014, 57–62. (In Chinese) [Google Scholar] [CrossRef]
  35. Jiang, L.; Chen, Z.; Shen, X.; Guo, N. Quantitative analysis on the impact factors of ecological footprint--a case study of China’s provinces ecological footprints in 1999. Resour. Environ. Yangtze Basin 2005, 2, 108–112. (In Chinese) [Google Scholar] [CrossRef]
  36. Wang, Z.; Tao, C.; Shen, P. Regional green technical efficiency with its influencing factors analysis based on ecological footprint. China Popul. Resour. Environ. 2014, 1, 37–42. (In Chinese) [Google Scholar] [CrossRef]
  37. Senbel, M.; Mcdaniels, T.L.; Dowlatabadi, H. The ecological footprint: A non-monetary metric of human consumption applied to North America. Glob. Environ. Chang.-Hum. Policy Dimens. 2003, 13, 83–100. [Google Scholar] [CrossRef]
  38. Wu, K.; Wang, L. Partial least square regression model of ecological footprint and its influencing factors. Resour. Sci. 2006, 28, 182–188. (In Chinese) [Google Scholar] [CrossRef]
  39. Li, Z.; Wang, G.; Guan, X. Co-Integration analysis and an error correction model for ecological footprint and economy growth in China. Resour. Sci. 2008, 2, 103–108. (In Chinese) [Google Scholar] [CrossRef]
  40. Yang, J.; Wang, C.; Li, B.; Li, H.; Bai, G. Prediction of average ecological footprint in Chengdu based on genetic neural network model. Acta Ecol. Sin. 2009, 1, 363–371. (In Chinese) [Google Scholar] [CrossRef]
  41. Ma, C.; Zhao, J.; Zhao, X. Spatio-temporal analysis of resource environment pressure in Ningxia Hui Autonomous Region based on footprint family. Acta Sci. Circumstantiae 2016, 36, 3049–3058. (In Chinese) [Google Scholar] [CrossRef]
  42. Wang, Z.; Yang, L.; Yin, J.; Zhang, B. Assessment and prediction of environmental sustainability in China based on a modified ecological footprint model. Resour. Conserv. Recycl. 2017, 132, 301–313. [Google Scholar] [CrossRef]
  43. Yang, L.; Yang, Y. Evaluation of eco-efficiency in China from 1978 to 2016: Based on a modified ecological footprint model. Sci. Total Environ. 2019, 662, 581–590. [Google Scholar] [CrossRef]
  44. Ma, J.; Wang, D.; Lai, H.; Wang, Y. Water footprint-an application in water resources research. Resour. Sci. 2005, 27, 96–100. [Google Scholar] [CrossRef]
  45. Wu, Z.; Hu, Y.; Li, D.; Kuang, Y. Analyzing and modeling temporal variation of water ecological footprint in Guangzhou city of China. Resour. Sci. 2006, 28, 152–156. (In Chinese) [Google Scholar] [CrossRef]
  46. Wackernagel, M.; Monfreda, C.; Schulz, N.; Erb, K.-H.; Haberl, H.; Krausmann, F. Calculating National and Global Ecological Footprint Time Series: Resolving Conceptual Challenges. Land Use Policy 2004, 21, 271–278. [Google Scholar] [CrossRef]
  47. Galli, A.; Wiedmann, T.; Ercin, E.; Knoblauch, D.; Ewing, B.R.; Giljum, S. Integrating ecological, carbon and water footprint into a “footprint family” of indicators: Definition and role in tracking human pressure on the planet. Ecol. Indic. 2012, 16, 100–112. [Google Scholar] [CrossRef]
  48. Liu, S.; Zhu, J.; Xu, J.; Wu, X.; Zhao, S.; Hou, X. Effect of urbanization on the ecological footprint and their interactive coupling relationship. Acta Ecol. Sin. 2018. (In Chinese) [Google Scholar] [CrossRef]
  49. Fang, K.; Zhang, Q.; Yu, H.; Wang, Y.; Dong, L.; Shi, L. Sustainability of the use of natural capital in a city: Measuring the size and depth of urban ecological and water footprints. Sci. Total Environ. 2018, 631, 476–484. [Google Scholar] [CrossRef]
  50. Wackernagel, M.; Schulz, N.B.; Deumling, D.; Linares, A.C.; Randers, J. Tracking the Ecological Overshoot of the Human Economy. Proc. Natl. Acad. Sci. USA 2002, 99, 9266–9271. [Google Scholar] [CrossRef] [PubMed] [Green Version]
  51. Zhang, J.; Zhang, J. Touristic Ecological Footprint Model and Analysis of Huangshan City in 2002. Acta Geogr. Sin. 2004, 59, 763–771. (In Chinese) [Google Scholar] [CrossRef]
  52. Zhang, T. Study on Ecological Security of Main Cities in Northwest China Based on Improved Ecological Footprint Model. Ph.D. Thesis, Northwest University, Xi’an, China, 2018. (In Chinese). [Google Scholar]
  53. Yang, H.; Wang, Z.; Zhao, H.; Li, J. Dynamic analysis of ecological footprint of Dongying City based on a modified model. Chin. J. Appl. Ecol. 2009, 20, 1753–1758. (In Chinese) [Google Scholar] [CrossRef]
  54. Wackernagel, M.; Monfreda, C.; Erb, K.H.; Haberl, H.; Schulz, N.B. Ecological footprint time series of Austria, the Philippines, and South Korea for 1961–1999: Comparing the conventional approach to an ‘actual land area’ approach. Land Use Policy 2004, 21, 261–269. [Google Scholar] [CrossRef]
  55. Tan, X.; Zhen, Q. Dynamic analysis and forecast of water resources ecological footprint in China. Acta Ecol. Sin. 2009, 29, 121–130. (In Chinese) [Google Scholar] [CrossRef]
  56. Yang, Q.; Liu, G.; Hao, Y.; Coscieme, L.; Zhang, J.; Jiang, N.; Casazza, M.; Giannetti, B.F. Quantitative analysis of the dynamic changes of ecological security in the provinces of China through emergy-ecological footprint hybrid indicators. J. Clean. Prod. 2018, 184, 678–695. [Google Scholar] [CrossRef]
  57. Chen, D.; Cheng, G.; Xu, Z.; Zhang, Z. Ecological footprint of the Chinese population, environment and development. Environ. Conserv. 2004, 31, 63–68. [Google Scholar] [CrossRef]
  58. Xu, Z.; Cheng, G.; Qiu, G. ImPACTS identity of sustainability assessment. Acta Geogr. Sin. 2005, 60, 198–208. (In Chinese) [Google Scholar] [CrossRef]
  59. Dietz, T.; Rosa, E.A.; York, R. Driving the human ecological footprint. Front. Ecol. Environ. 2007, 5, 13–18. [Google Scholar] [CrossRef]
  60. Ma, X. Innovative approach for the development of a water quality identification index—A case study from the Wen-Rui Tang River watershed, China. Desalin. Water Treat. 2014, 1–11. [Google Scholar] [CrossRef] [Green Version]
  61. Rees, W.E. Eco-footprint analysis: Merits and brickbats. Ecol. Econ. 2000, 32. [Google Scholar] [CrossRef]
  62. Liu, L.; Lei, Y. An accurate ecological footprint analysis and prediction for Beijing based on SVM model. Ecol. Inform. 2018, 44, 33–42. [Google Scholar] [CrossRef]
  63. Zhu, J.; Chen, M. The cluster analysis of panel data and its application. Stat. Res. 2007, 24, 11–14. (In Chinese) [Google Scholar] [CrossRef]
  64. Zhang, Y. Change of ecological footprint and its effect on sustainable development in Beijing, China. J. China Univ. Geosci. (Soc. Sci. Ed.) 2006, 4, 53–61. (In Chinese) [Google Scholar] [CrossRef]
  65. Jin, Z.; Weihua, G. Study on sustainable development in nanjing based on ecological footprint model. Acta Ecol. Sin. 2012, 20, 196–205. (In Chinese) [Google Scholar] [CrossRef] [Green Version]
Figure 1. Geographical distribution map of the selected cities.
Sustainability 12 08589 g001
Figure 2. Improved ecological footprint model.
Sustainability 12 08589 g002
Figure 3. Dynamic changes in the per capita ecological footprint (EF) and per capita ecological capacity (EC) of selected cities from 2000 to 2017.
Sustainability 12 08589 g003
Figure 4. Dynamic changes in the ecological footprint index (EFI) of selected cities from 2000 to 2017.
Sustainability 12 08589 g004
Figure 5. Dynamic changes in the eco-economic coordination index (EECI) of selected cities from 2000 to 2017.
Sustainability 12 08589 g005
Figure 6. Dynamic changes in the EECI of selected cities from 2000 to 2017.
Sustainability 12 08589 g006
Figure 7. Dynamic changes in the EF of ten thousand yuan GDP of selected cities from 2000 to 2017.
Sustainability 12 08589 g007
Figure 8. Comparison of EF of ten thousand yuan GDP between 2000 and 2017.
Sustainability 12 08589 g008
Figure 9. The relationship between the average of the per capita EF and the per capita tourism consumption of each city from 2000 to 2017.
Sustainability 12 08589 g009
Table 1. Index system of driving factors of per capita ecological footprint (EF).
SubsystemsDriving FactorsIndependent VariableUnitsDescription
EconomicProportion of the primary industry in GDPX1%Reflect the scale of economic development
Proportion of the secondary industry in GDPX2%Reflect the level of industrialization
Proportion of the tertiary industry in GDPX3%Reflect the industrial structure
SocialUrbanization rateX4%Reflect the level of urban urbanization
Per capita investment in fixed assetsX5yuan per personReflect the impact of policy on urban natural capital utilization
Number of granted patentsX6itemReflect the level of scientific and technological development of the city
EcologicalForest coverage rateX7%Reflect urban resource endowment
Percentage of greenery coverage in built-up areasX8%Reflect the level of urban ecological environment construction
Per capita cultivated land areaX9yuan per personReflect the change of land use
TourismPer capita tourism consumptionX10yuan per personReflect the efficiency of urban tourism
Length of highways per 10,000 peopleX11kilometer per 104 personsReflect the size of regional transportation investment
Table 2. Data sources for EF accounting and analysis of driving factors.
AspectsThe Detail DataData Sources
Biological Resource AccountOutput of cropland productGrain, oil crops, cotton, hemp, sugar cane, vegetables, fruit melonsStatistical yearbook, social and economic yearbook, statistical bulletin of national and social and economic development, water resources bulletin of each selected city
Output of grassland productsMeat, poultry eggs, milk
Output of forest productsTea, fruits, nuts
Output of fishing grounds productsAquatic products
Energy Consumption AccountEnergy consumption of built-up landElectricity, heat
Direct energy consumptionCoal, coke, natural gas, liquefied petroleum gas, gasoline, kerosene, diesel, fuel oil
Pollution Emissions AccountThe amount of pollutants dischargedIndustrial wastewater, domestic wastewater, carbon dioxide, nitrogen oxides, smoke and dust, dust
Water Resource AccountWater resourcesWater supply, total water resources
Driving FactorsMacro dataHTTP://DATA.CNKI.NET/
Land Use Datahttp://www.resdc.cn/
Population DataStatistical yearbook
Global Average Yieldhttp://www.fao.org/faostat/zh/#data
http://www.fao.org/fishery/statistics/zh
Equilibrium Factor, Yield Factorhttp://data.footprintnetwork.org/#/
https://data.world/footprint
Table 3. The unit root test results for each variable.
Breitung Unit-Root TestFisher-Augmented Dickey-Fuller (ADF) Test Fisher- Phillips Perron (PP) Test
Level1st DifferenceLevel1st DifferenceLevel1st Difference
p-Valuep-Valuep-Valuep-Valuep-Valuep-Value
ef0.769600.140200.02520
X10.98690.00280.0076000
X20.815500.427500.75450
X30.993800.658000.78420
X40.980100.946100.63410
X50.99970.0032000.04600
X60.999200.000200.00030
X70.889200.190300.06370
X80.188500000
X90.031800.060400.00010
X100.693100.063100.00160
X110.54250.20490.168600.00150
Table 4. Results of different standard error checking methods.
TestChibar2(01)Prob > Chibar2
Breusch-Pagan LM random647.740
Breusch-Pagan LM286.5010
Hausman20.410.0301
Modified Wald test145.840
Wooldridge15.9960.0012
Table 5. Comparison of regression results of different regression models.
VariablesFixed EffectsRandom EffectsFixed Effects (Driscoll–Kraay Standard Errors)
X10.004700.002110.00470
X20.00896 ***0.00811 ***0.00896 ***
X3−0.00140−0.00121−0.00140
X4−0.00419 ***−0.00376 ***−0.00419 ***
X50.0879 **0.05490.0879 **
X6−0.007870.00575−0.00787
X7−0.00361 ***−0.00502 ***−0.00361 ***
X8−0.00294 ***−0.00277 **−0.00294 **
X9−0.0426−0.00559−0.0426
X10−0.182 ***−0.148 ***−0.182 ***
X110.0817 *0.0826 *0.0817
Constant0.700 ***0.683 ***0.700 **
Observations288288288
R-squared0.5340.5280.534
F test000
*** p < 0.01, ** p < 0.05, * p < 0.1.
Table 6. Cluster analysis results.
CategoryIIIIIIIV
Included citiesSanya, Xiamen, Beijing, Hangzhou, Guangzhou, ShanghaiNanjing, Tianjin, QingdaoChengdu, Xi’an, Guilin, Huangshan, ChangshaKunming, Harbin
Publisher’s Note: MDPI stays neutral with regard to jurisdictional claims in published maps and institutional affiliations.