Article

Development of Savonius Rotors Integrated into Control Valves for Energy Harvesting

1
School of Mechanical Engineering, Shandong University, Jinan 250061, China
2
Key Laboratory of High-Efficiency and Clean Mechanical Manufacture (Shandong University), Ministry of Education, Jinan 250061, China
*
Author to whom correspondence should be addressed.
Sustainability 2020, 12(20), 8579; https://doi.org/10.3390/su12208579
Submission received: 21 September 2020 / Revised: 11 October 2020 / Accepted: 13 October 2020 / Published: 16 October 2020
(This article belongs to the Special Issue Advances in Renewable Energy Technologies for Distributed Generation)

Abstract

:
Integrating vertical-axis runners into ball valves for energy harvesting from pressurized pipes in water supply systems has become a promising scheme of self-supplying power (referred to as the “GreenValve” scheme). In addition to energy harvesting, the GreenValve configuration also has the function of fluid regulating, which makes a qualitative breakthrough in both structure and function. However, the runner specially used to match the ball valve has not been fully studied and designed. Hence, based on the traditional Savonius rotor, a modified semi-elliptical runner is proposed in this study. To better match the ball valve structurally, the roundness of the runner at blade tip position is improved and, thus, the initial runner configuration is obtained. Moreover, research on blade profile flatness and runner aspect ratio is conducted in FLUENT software to be more functionally compatible with the ball valve. Numerical results indicate that the GreenValve always performs best in terms of shaft power at 25% opening regardless of the aspect ratio and the flatness. When the flatness value is equal to 0.7, the GreenValve presents the maximum shaft power and the second highest flow coefficient which is only 1.9% lower than the maximum value. Comparison results of three models with different aspect ratios reveal that the model with the smallest aspect ratio has a slight reduction in flow capacity while a significant improvement in shaft power, reaching a maximum shaft power of 78.6W.

1. Introduction

Solving the problem of pipeline leakage is a challenging work for all over the world. No matter whether medium transported in the pipeline is drinking water, oil or some other harmful substances, the leakage problem will lead to serious consequences [1]. Taking the leakage problem of water supply system as an example, according to literature [2], the water loss caused by pipeline leakage accounts for about 35% of the total water supply quantity. The water supply situation is becoming increasingly severe [3]. Therefore, sensors and other monitoring equipment should be arranged at thousands of nodes along the pipeline to achieve real-time monitoring and remote control [4]. The power sources of these sensor devices are usually chemical batteries. However, once the chemical batteries are damaged, serious water pollution problems will occur [5]. Hence, finding alternative energy for monitoring equipment has become an important research subject [6]. Wang et al. [7] and Rosenbloom et al. [8] respectively use wind energy and solar photovoltaic technology to power the monitoring equipment of water supply system. However, these two modes cannot guarantee continuous and stable power supply due to the limitation of weather conditions [6]. Moreover, the large volume of their equipment requires large space for installation, which limits their development. In contrast, hydropower is the most promising green energy to replace chemical batteries [9].
In addition to deterioration of pipelines, excess pressure in the pipe is another inducement to pipeline leakage. The pressure is usually balanced by reducing valve [10,11,12,13], which causes a serious waste of water energy. As a result, more and more attention has been paid to the development of this part of surplus hydraulic energy. Among them, the configuration of in-pipe turbine shows great potential in energy harvesting. An initial in-pipe turbine configuration is developed by integrating a vertical axis turbine into the water supply pipe, and it presents a good performance of energy harvesting after modification and optimization by Chen [14]. By integrating a cross-flow turbine into the water supply pipe, Du [15] also achieved the objective of self-supplying energy for the leakage monitoring equipment.
Ball valves are widely distributed in different fluid conveying system. Compared with the pipe, ball valve has the advantage of convenient loading and unloading and, thus, it has greater space for transformation and integration potential. A vertical axis turbine is firstly integrated inside the control valve by Malavasi et al. [16] to harvest the water energy in the pressurized pipe. They have proved that the GreenValve scheme is both technically and economically feasible through experiments [17]. However, this energy harvesting scheme is still in the exploratory stage. The turbine configuration integrated in the GreenValve has not been systematically designed and studied, which greatly limits its development.
The Savonius rotor is one of the simplest vertical axis turbines with good self-starting capability. Compared with other types of turbines, Savonius rotor is more suitable for application in the flow channel [18]. Therefore, in this study, a modified Savonius runner is considered to be integrated into the ball valve to harvest the surplus water energy in the pipeline. Due to the low efficiency of Savonius runner, it is necessary to optimize its parameters and, thus, improve its performance [19,20].
There are many parameters to be studied for the Savonius runner equipped in the GreenValve, among which the blade profile is one of the most critical parameters affecting its performance. Both Saha [21] and Ghatage [22] have studied the performance of twisted Savonius turbines, and the results show that the twisted blades have greater development potential in terms of efficiency and self-starting capability than the traditional blades. After a series of wind tunnel tests, Roy [23] has developed a new two-bladed turbine whose power coefficient is larger than that of turbine with standard blades. Alom [24] firstly conducted a systematic and comprehensive review on the blade profile parameters of the Savonius turbine, which provided guidance for the development of blade shape in future research. The elliptical Savonius turbine has been studied in detail in [25,26,27,28], and the conclusion shows that the elliptical Savonius turbine achieves a higher power coefficient than the traditional semi-circular turbines.
The aspect ratio is also a key parameter in the design of Savonius turbine. The impact of the aspect ratio on moment coefficient and power coefficient of the Savonius turbine has been reviewed in literature [29]. Kamoji [30] obtained the optimal parameters and thus improved the turbine performance by comparing the power coefficients of four types of turbines with different aspect ratios. The aspect ratio of the Savonius turbine has been investigated both numerically and experimentally by Bhayo [31], eventually resulting in a 47% increase in turbine power coefficient. Jaohindy [32] achieved the performance estimation of two turbines with different aspect ratios through the transient force analysis. Sobczak [33] has made a special study on the aspect ratio of Savonius turbine and the results show that the power coefficient will increase with the increase of aspect ratio. The same conclusion has been drawn by Patel [34] after the research on the aspect ratio parameter. A 3D numerical simulation of four rotors with different aspect ratios between 0.55 and 1.66 was carried out in [35], and the conclusions present the positive impacts of the increasing aspect ratio on the moment coefficient and power coefficient.
The literature review indicates that blade profile and aspect ratio have significant effects on the performance improvement of traditional Savonius turbines. However, these two parameters of the Savonius runner equipped in the GreenValve have not been studied and optimized, which greatly limits the widespread application of the Savonius runner in the GreenValve system. Therefore, CFD investigations concerning the blade profile and the aspect ratio of the newly developed Savonius runner equipped in the GreenValve are conducted in this paper.

2. System Description and Objective

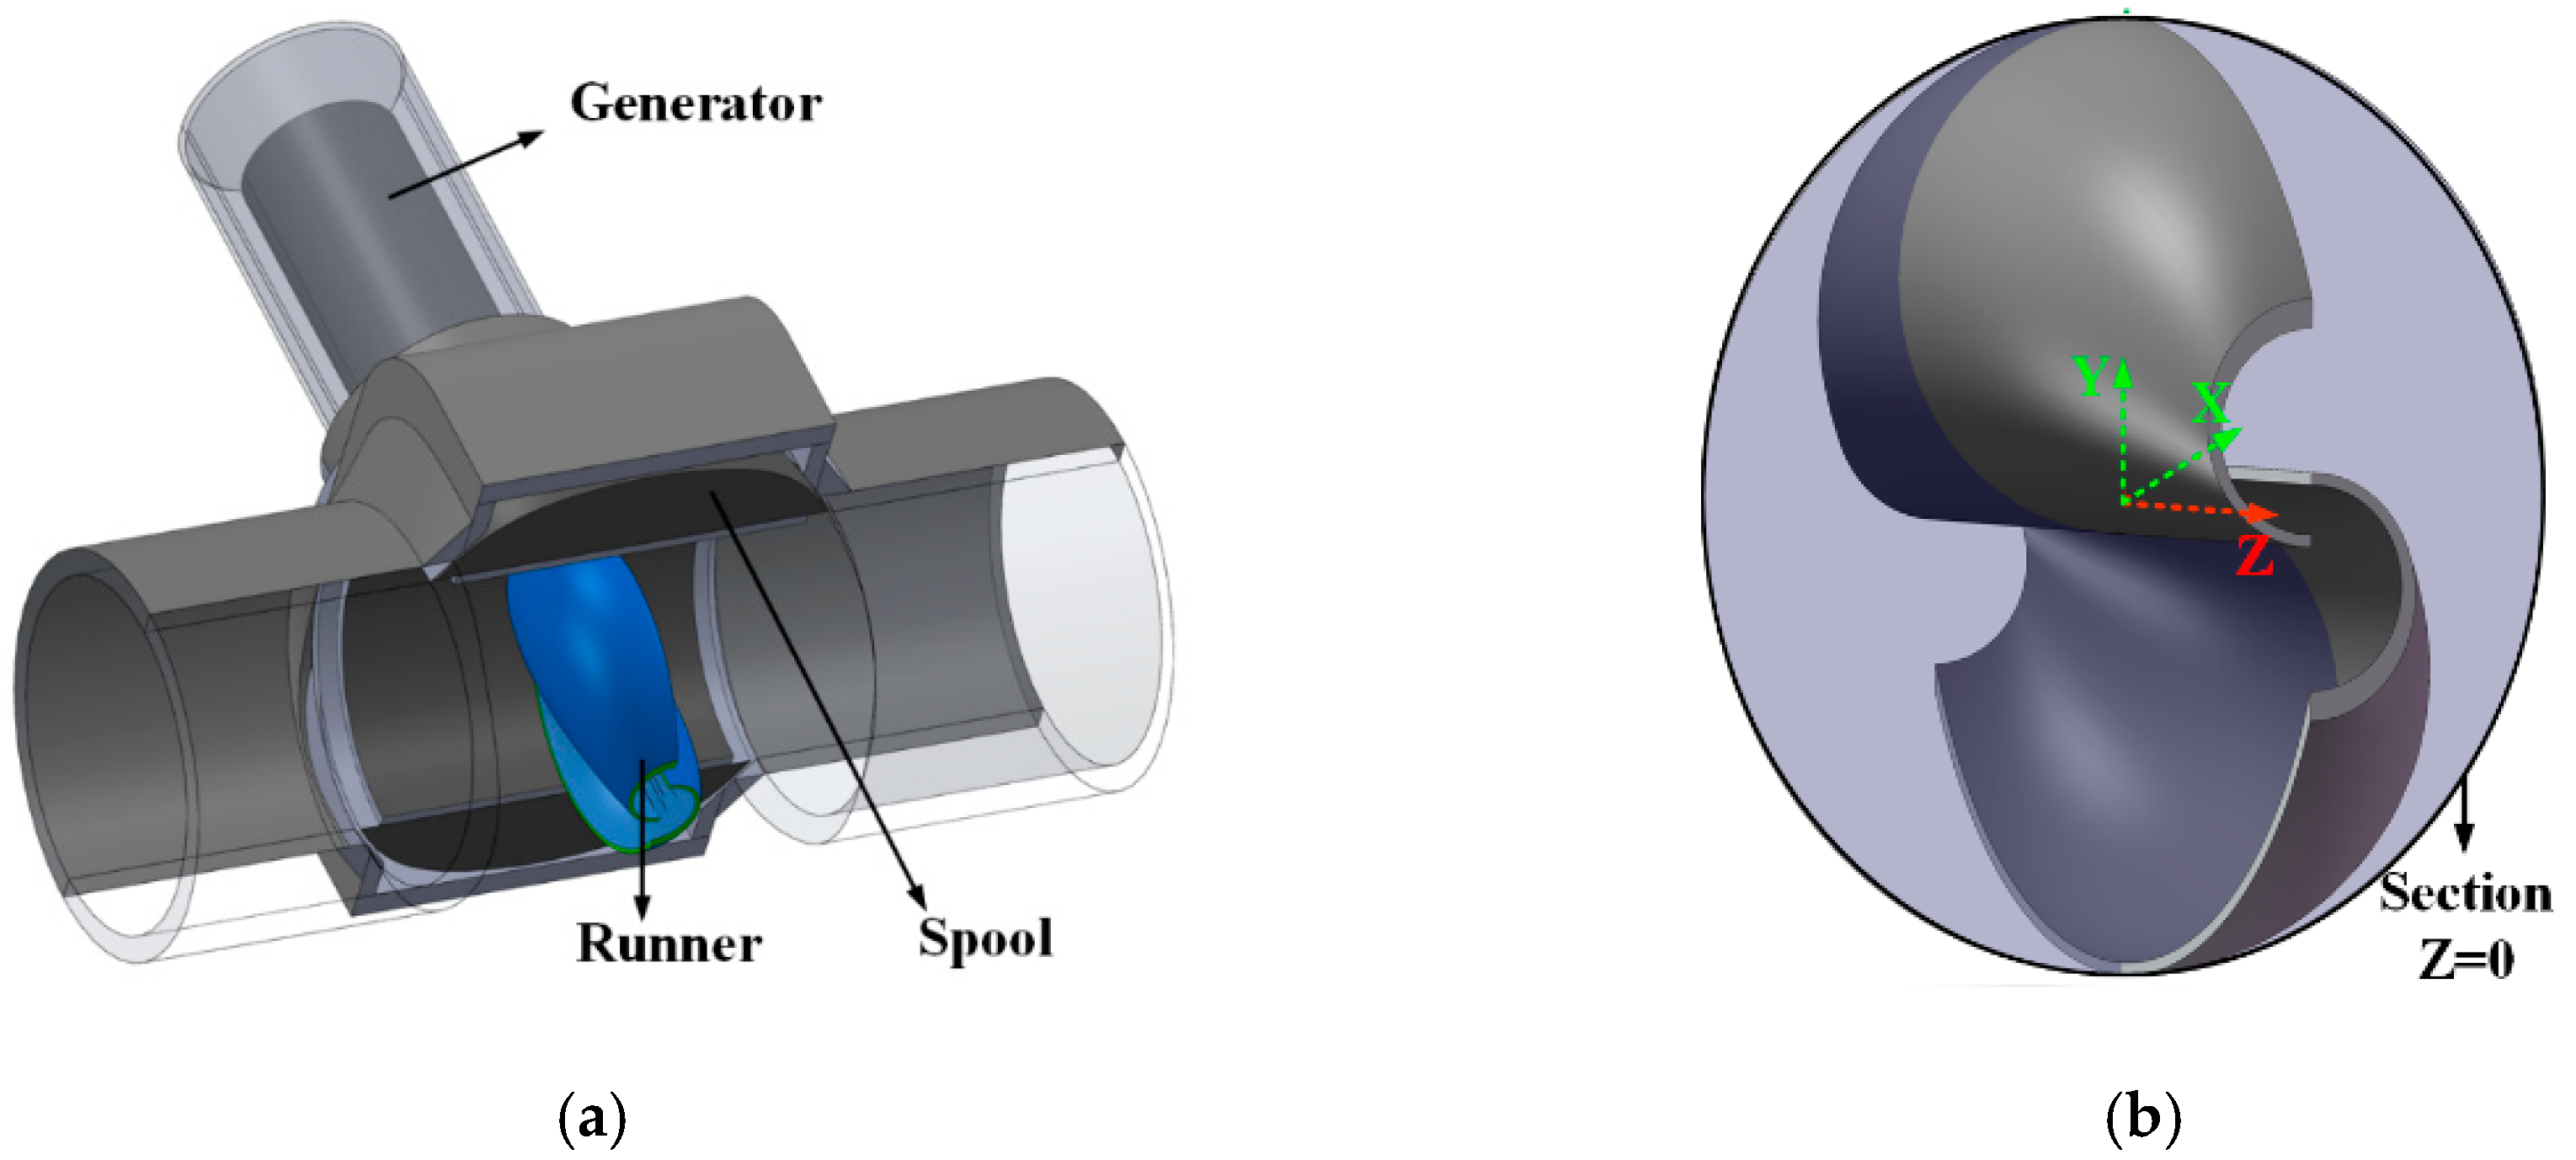
2.1. GreenValve Description

As shown in Figure 1a, when water flows through the GreenValve, the internal runner will be directly impacted and rotate anticlockwise. Then the moment generated by the runner will be transmitted to the generator through the shaft. Eventually, the chemical batteries will be replaced and the water supply system will realize the self-supply of power.
In addition to the runner, spool is the other important component of the GreenValve. The spool in the GreenValve can not only regulate the fluid, but also have an important impact on the energy harvesting characteristics of the runner. This paper mainly studies the performance of the GreenValve under seven opening conditions: 13%, 25%, 39%, 53%, 69%, 84%, 100%.

2.2. Runner Design Procedure

Due to the fact that the intracavity of ball valve is cylindrical and the chord length of traditional Savonius runner in each section is constant, the chord length and the height of the runner will inevitably restrict each other if a conventional Savonius runner is equipped in the valve, which will make the runner unable to achieve its optimal performance. Hence, an initial runner configuration has been developed by modifying the structure of conventional Savonius rotor, as shown in Figure 1b. It can be seen from Figure 2b that the roundness of the initial runner at the tip position has been improved, which keeps the tip clearance ( ε ) constant. Therefore, the structure matching degree of the runner with the ball valve has been greatly improved. It should be noted that the aspect ratio and the flatness of the initial runner are 0.9 and 1.0, respectively.
In order to study the impact of blade profile on the performance of GreenValve, the blade profile of initial runner configuration is transformed into semi-elliptical geometry in the following. Finally, according to different flatness ( E ) of elliptical profiles, six types of runners are obtained including the initial runner. As shown in Figure 2a, the flatness of the six runners is 0.6, 0.7, 0.8, 0.9, 1.0, and 1.1, respectively. For the convenience of analysis, these runners are named as E0.6, E0.7, E0.8, E0.9, E1.0, and E1.1, respectively. In addition, three runners with different aspect ratios ( A R ) are studied in this paper: A R = 0.9, A R = 0.85, and A R = 0.8. These three runners are denoted as AR0.9, AR0.85, and AR0.8, respectively. The specific research process is presented in Section 2.3.
The geometric parameters of runners studied in this paper are shown in Figure 2b. Among them, the symbols and values of the main parameters are explicit in Table 1.

2.3. Objective of the Present Study

Our final goal is to develop a type of runner that is structurally and functionally compatible with the ball valve, allowing the GreenValve system to achieve optimal performance of fluid regulating and energy harvesting.
As mentioned above, the structure matching degree of the initial runner configuration (AR0.9-E1.0) with the ball valve has been improved. In order to improve their function matching degree, further research on parameter optimization of the initial runner should be carried out. The newly developed runner includes many parameters to be studied. Among them, two key parameters (blade profile flatness and runner aspect ratio) have been studied in this paper. Hence, the objective of this paper is to illustrate the impacts of blade profile flatness and runner aspect ratio on the coupling performance of GreenValve, obtaining the optimized runner configuration, so as to lay a foundation for the subsequent research on other parameters.
All the runner configurations studied in this paper are shown in Table 2. Firstly, the effects of six runner configurations with different flatness on the performance of GreenValve are studied at A R = 0.9. Then, a numerical simulation concerning the impact of different aspect ratios on the coupling characteristics of GreenValve is carried out at E = 0.7. Finally, the flow field characteristics and transient mechanism of the GreenValve are obtained.

3. Numerical Approach

CFD simulation has been widely used in hydro turbine design and performance prediction [36]. ANSYS FLUENT software is a powerful and highly recognized professional software [37], and it is suitable for numerical calculation of complex geometric models, can accurately simulate the flow field around the turbine with low cost [38]. Hence, for the current work, ANSYS FLUENT software is employed to study the impacts of the aspect ratio ( A R ) and the flatness ( E ) on the performance of the GreenValve.

3.1. Grid Generation

The whole physical model can be divided into three parts: GreenValve, straight pipe upstream the valve, straight pipe downstream the valve, and they are all built in SolidWorks. Moreover, due to that fact that the computational domain composed of stationary domain and rotational domain is symmetric, only half of the model is created to reduce the number of grids as well as the computation time. In order to achieve the mesh motion between stationary and rotational domains, sliding mesh technique is adopted in this study, and the mesh near the interface is densified to improve the calculation accuracy. To reduce the number of grids as much as possible while ensuring the accuracy of simulation results, a grid independence test is performed. Grids with 0.37, 0.48, 0.54, 0.61, 0.83, 2.23, and 2.60 million elements are chosen for the test. The independence of the moment on the grid number is shown in Figure 3. It can be seen that the grids with 0.83 and 2.60 million elements show almost similar moment. Hence, the grid independence can be satisfied when the number of grids is 0.83 million. The final mesh of the model is shown in Figure 4.

3.2. Governing Equation and Turbulence Model

The unsteady incompressible flow is described by the Navier–Stokes equations:
u i x i = 0
u i t + ( u i u j ) x j = 1 ρ p x i + μ 2 u i x i x j
where u is the fluid velocity, p is the pressure, μ is the dynamic viscosity of fluid, ρ is the density of fluid.
For turbomachinery with complex geometries, it requires a lot of computing resources to directly solve the Navier-Stokes equations. Hence, the method of Reynolds-averaged Navier–Stokes (RANS) is adopted to solve the Navier–Stokes equations. With the appropriate turbulence model, the RANS method can not only reduce the computational cost, but also obtain reliable numerical solution. Moreover, the SST k ω model, which is often used in the simulation of internal flow cases, is used in this study. The micro flow in the viscous layer can been captured in the SST k ω model because it considers the impact of turbulence shear stress on turbulence viscosity [9]. The PISO algorithm is adopted for the velocity-pressure coupling. The discretization schemes of governing equations are based on the second-order upwind scheme while the standard of residual convergence is set to 1 × 10⁻⁵. Generally, the velocity range of the fluid in water supply pipe is between 1.0–3.0 m/s [39]. In this study, a typical flow velocity (2 m/s) is chosen as the inlet boundary condition of the model to conduct the optimization research on runner parameters and, thus, the average flow rate is 15.7 × 10⁻³ m3/s; the outlet boundary condition is set as pressure outlet whose value is equal to atmospheric pressure. In addition, the symmetric plane is set as symmetry.

3.3. Data Analysis

As mentioned above, the semi-elliptical runner developed in this paper is derived from the traditional Savonius rotor, and hence the tip speed ratio ( T S R ) will directly affect the energy harvesting characteristics of the GreenValve. It can be expressed by Equation (3):
T S R = ω D 2 v
where   ω is the angular velocity of the runner, rad/s; v is the incoming flow velocity of inlet, m/s. Besides, the runner phase angle ( θ ) and the relative opening ( K ) of the GreenValve are also the key research parameters in this study.
In this study, the fluid regulating characteristics of the GreenValve are estimated by the flow coefficient ( C v ), which can be calculated by Equation (4):
C v = Q N ρ ρ 1 Δ p
where N is a transformation parameter (equal to 0.865); ρ is the density of fluid, Kg/m3; ρ 1 is the reference density of fluid under standard conditions, Kg/m3; Q is the flow rate, m3/h; Δ p is the pressure difference between two reference sections (2 D 1 upstream the valve and 6 D 1 downstream the valve), bar.
In addition, the indicators used to estimate the energy harvesting characteristics of the GreenValve include: the shaft power ( P o u t ), the efficiency ( η ) as well as the water head loss ( h f ). The shaft power ( P o u t ) and the efficiency ( η ) can be calculated by the following equations:
P o u t = M ω
η = P 1 P = M ω Δ p Q
where M is the moment of the runner, Nm; P is the total power, W; moreover, Δ p is expressed in Pa while Q expressed in m3/s.

3.4. Validation

The numerical simulation scheme in this paper is similar to the experimental scheme of Malavasi et al. [40]. Hence their experimental results are adopted to verify the numerical model in this study. As flow coefficient ( C v ) is a key parameter to estimate the fluid regulating characteristics, the C v values of numerical simulation in this paper are compared with the experimental results [40]. The simulation model retains the experimental parameters and conditions of Malavasi et al. [40]. The final comparison results are plotted in Figure 5. It can be observed that the test results of the two models are in good agreement with the experimental results. Hence, both of the models can be used in the numerical simulation work of this research. Among them, the results of SST k ω model are more accurate at intermediate openings, and all the deviations are within 5%. Hence, the proposed model and the numerical solution in this study prove to be reliable enough to analyze the performance of the GreenValve.

4. Results and Discussion

4.1. TSR Conditions

The tip speed ratios ( TSRs ) in this paper are given as preconditions, but their values cannot be arbitrarily specified. The selected values should make the GreenValve fully reflect its good performance. Hence, the selection work of the tip speed ratios should be performed first. According to our previous research, the tip speed ratio has a great impact on the energy harvesting characteristics of the GreenValve while a small effect on its fluid regulating characteristics. Thus, the shaft power is adopted as the selection indicator of tip speed ratio.
Specifically, the GreenValve equipped with the initial runner (AR0.9-E1.0) is selected to work at different tip speed ratios. Then, the curves of shaft power changing with T S R at different openings are obtained, as shown in Figure 6. By extracting the tip speed ratio corresponding to the maximum shaft power in Figure 6, a set of representative tip speed ratios are obtained, as shown in Table 3. These fixed tip speed ratios are adopted for all cases in the following.

4.2. Effect of Blade Profile Flatness on Performance of the GreenValve

When A R = 0.9, GreenValves equipped with E0.6, E0.7, E0.8, E0.9, E1.0, and E1.1 are studied and compared in terms of the fluid regulating characteristics and energy harvesting characteristics.

4.2.1. Energy Harvesting Characteristics

Figure 7 shows the shaft power ( P o u t ) of runners with different flatness ( E ) at different openings ( K ). It can be seen that with the increase of the opening, the shaft power curves of all the runners show a trend of first rising and then falling. Moreover, the maximum values of all curves occur at K   = 25% while the minimum values appear at K   = 100%.
In order to study the effect of flatness ( E ) on shaft power ( P o u t ), the curves of shaft power changing with flatness have been given in Figure 8. It can be seen that when K   ≥ 69%, the shaft power of all runners is less affected by flatness and is lower than 12 W. Hence, the energy harvesting performance of the six GreenValves is poor within the opening range of higher than 69%. The reason is that with the increase of the opening, the guiding effect of the spool is weakened, resulting in the increase of negative moment on the returning blade. When K   ≤ 53%, the maximum value of each shaft power curve is always reported at E = 0.7 or E = 1.0. In particular, the shaft power of both E0.7 and E1.0 can reach 40.4 W at K   = 25%, which is the maximum value of all the shaft power curves. Therefore, E0.7 and E1.0 can exhibit better energy harvesting characteristics than other runners.
According to the above analysis, the six GreenValves can harvest more hydropower when K   < 69%. Therefore, in the following analysis, the efficiency values at K   < 69% should be taken as the main reference. As can be seen from the curves of efficiency in Figure 9, the efficiency values of all runners always increase with the opening when K   < 69%. When K   ≤ 39%, the efficiency values are not sensitive to the change of flatness, but it can be found that the efficiency values of E0.7 are slightly higher than that of other runners. Furthermore, when 39% < K   ≤ 53%, the efficiency values of E0.7 are close to that of E1.0 and higher than that of other runners. When the opening reaches 69%, the efficiency of E0.7 is reversed by other runners, which no longer has the advantages at low openings.
Figure 10 indicates the water head consumed by the runners with different flatness. It can be seen that the six curves tend to coincide, which means that the water head loss is independent of flatness. Under the current given conditions, the water head loss is only affected by the opening, and it decreases with the growth of opening. From K   = 13% to 25%, the water head loss decreases sharply from 53 m to 12 m; when K < 53%, the water head loss is always remaining within 3 m. It should be highlight that when working at the opening range of 25–39%, the GreenValve can consume the appropriate water head (4–12 m) to balance the excess pressure in the pipeline.

4.2.2. Fluid Regulating Characteristics

Figure 11 shows the flow coefficient ( C v ) values of GreenValves equipped with runners of different flatness. The C v values of the six GreenValves show similar behaviors, all of which are approximately linear. According to the relevant content of linear flow characteristics, the optimal regulating characteristics of these GreenValves are all within the opening range of 25–69%. The reason is that when working at small openings (generally refers to K   < 25%), the control effect of the GreenValve is too strong, which easily makes the system oscillate; on the contrary, when working at large openings (generally refers to K > 69%), the control effect of the valve is too weak to be controlled in time.
In addition to energy harvesting, the GreenValve should be ensured that there is sufficient maximum flow capacity and hence its maximum flow coefficient should be as high as possible. The results reveal that the smaller the flatness, the greater the maximum flow coefficient of GreenValve. Among them, the maximum flow coefficient of the GreenValve with E0.7 is 5.6% higher than that of the GreenValve with E1.0, showing a better maximum flow capacity. Although the GreenValve with E0.6 presents a maximum C v value of 308, showing the strongest flow capacity, the maximum C v value of the GreenValve with E0.7 is only 1.9% lower than it. Hence, besides the best energy harvesting performance, the GreenValve with E0.7 also shows strong integration potential in terms of flow capacity.
In summary, E0.7 is the most promising one among the six runners in terms of matching performance with ball valve. Based on the GreenValve with E0.7, the optimization research on aspect ratio of the runner will be carried out in the following.

4.3. Effect of Runner Aspect Ratio on Performance of the GreenValve

In this paper, the aspect ratio is adjusted by changing the chord length of the runner. The height of the runner is always a constant value.

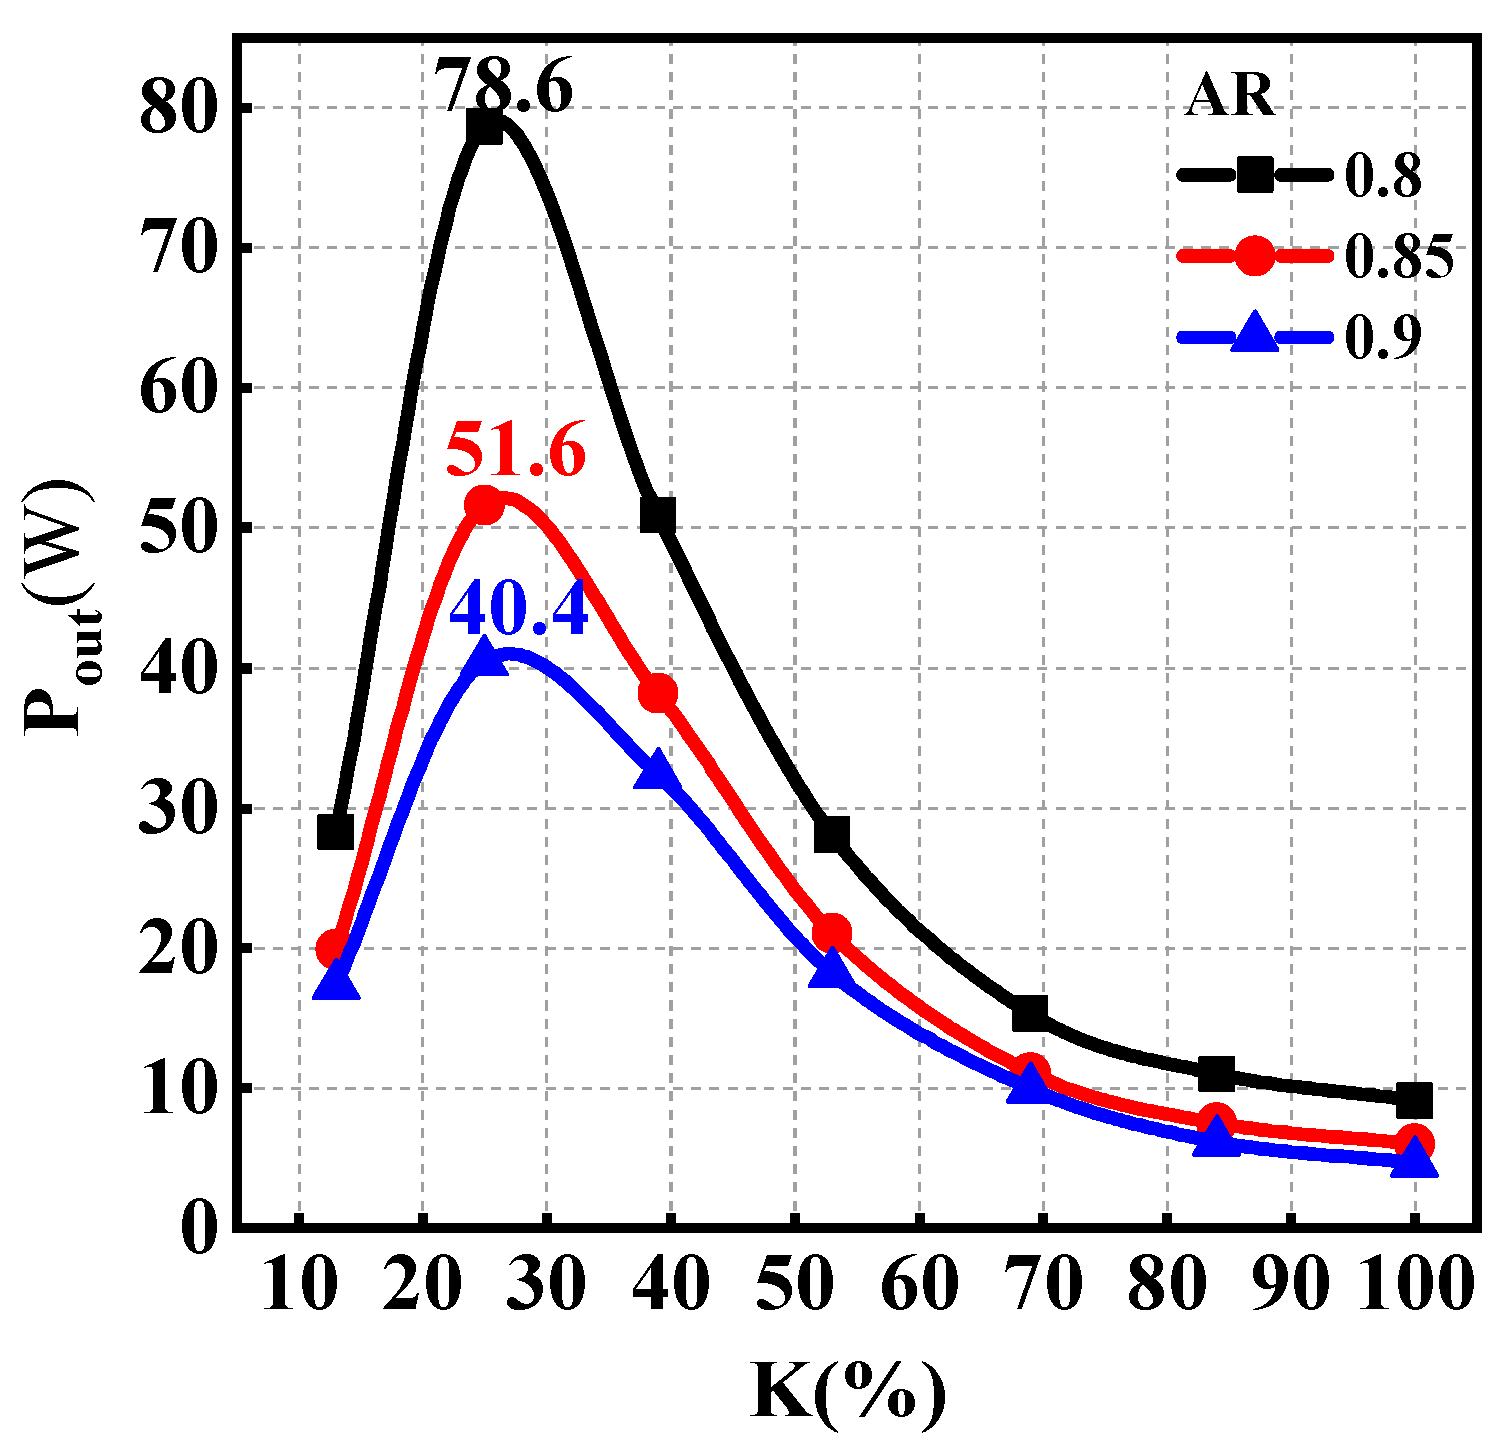
4.3.1. Energy Harvesting Characteristics

Figure 12 reveals the shaft power behaviors of the GreenValves equipped with AR0.8, AR0.85, and AR0.9 respectively. The overall trend of the three curves is similar, rising first and then falling, and reaching the maximum values at K   = 25%. However, it is obvious that the smaller the aspect ratio, the greater the shaft power. In particular, the maximum difference of shaft power occurs at K   = 25%: the shaft power of AR0.8 (78.6W) is 94.6% higher than that of AR0.9 (40.4W).
Figure 13 depicts the efficiency curves of runners with different aspect ratios. A vital difference between the three efficiency curves lies in the different openings corresponding to the maximum efficiency values. It is noticed that both AR0.8 and AR0.85 achieve their maximum efficiency at K = 53%, and the maximum efficiency values are 8.65% and 7.45%, respectively. However, the maximum efficiency value of AR0.9 occurs at K   = 69% and is only 7.11%. It can be seen that the decrease of aspect ratio not only increases the efficiency value, but also makes the maximum efficiency move towards lower openings, which increases the overlapping range of high-efficiency opening and high-power opening to a certain extent. Overall, AR0.8 presents the highest efficiency because of its minimum tip clearance and minimum leakage, which means that hydroenergy can be more fully converted into mechanical energy of the runner.
As can be seen in Figure 14, the water head losses caused by the three runners are very close under all conditions of opening, and thus the aspect ratio has little impact on the water head loss.

4.3.2. Fluid Regulating Characteristics

Figure 15 shows the C v values of the three GreenValves equipped with runners of different aspect ratios. In terms of trends, the C v values of the three GreenValves are close to straight lines, which means their best regulating characteristics will occur within the opening range of 25–69%. It can be observed that the main difference between the three GreenValves is reflected in the maximum flow coefficient. Specifically, when the aspect ratio decreases from 0.9 to 0.8, the maximum flow coefficient of the GreenValve changes from 302 to 252, decreasing by 16.6%. The reason may be that the decreasing aspect ratio will reduce the leakage at the tip clearance and, thus, weaken the flow capacity.
To sum up, the decreasing aspect ratio will lead to a slight weakening of the maximum flow capacity, but it can significantly improve the shaft power of the GreenValve. Specifically, compared to the GreenValve with AR0.9, the GreenValve with AR0.8 has a 16.6% reduction in maximum C v value, but a 94.6% increase in shaft power. Hence, 0.8 can be chosen as the optimization parameter value of the aspect ratio in this study.

4.4. Flow Field Characteristics and Transient Mechanism

The impacts of the flatness and aspect ratio on the macro performance of the GreenValve have been fully demonstrated above. To better illustrate these results, study on flow field characteristics and transient mechanism of the GreenValve will be carried out in the following part.

4.4.1. Instantaneous Moment Characteristics of Runners with Different Aspect Ratios

Figure 16 shows the instantaneous moment curves of the three runners with different aspect ratios at K   = 25%. It can be seen that the three runners reach the maximum values at θ ≈ 20° and reach the minimum values at θ ≈ 110°. It is noticed that the reduction of aspect ratio will increase the maximum moment and decrease the minimum moment. Although these two factors have opposite effects on the average moment of the runner, the difference of the three curves at the minimum moment is relatively small, while the difference at the maximum moment is large. Hence, the average moment of AR0.8 is the highest.

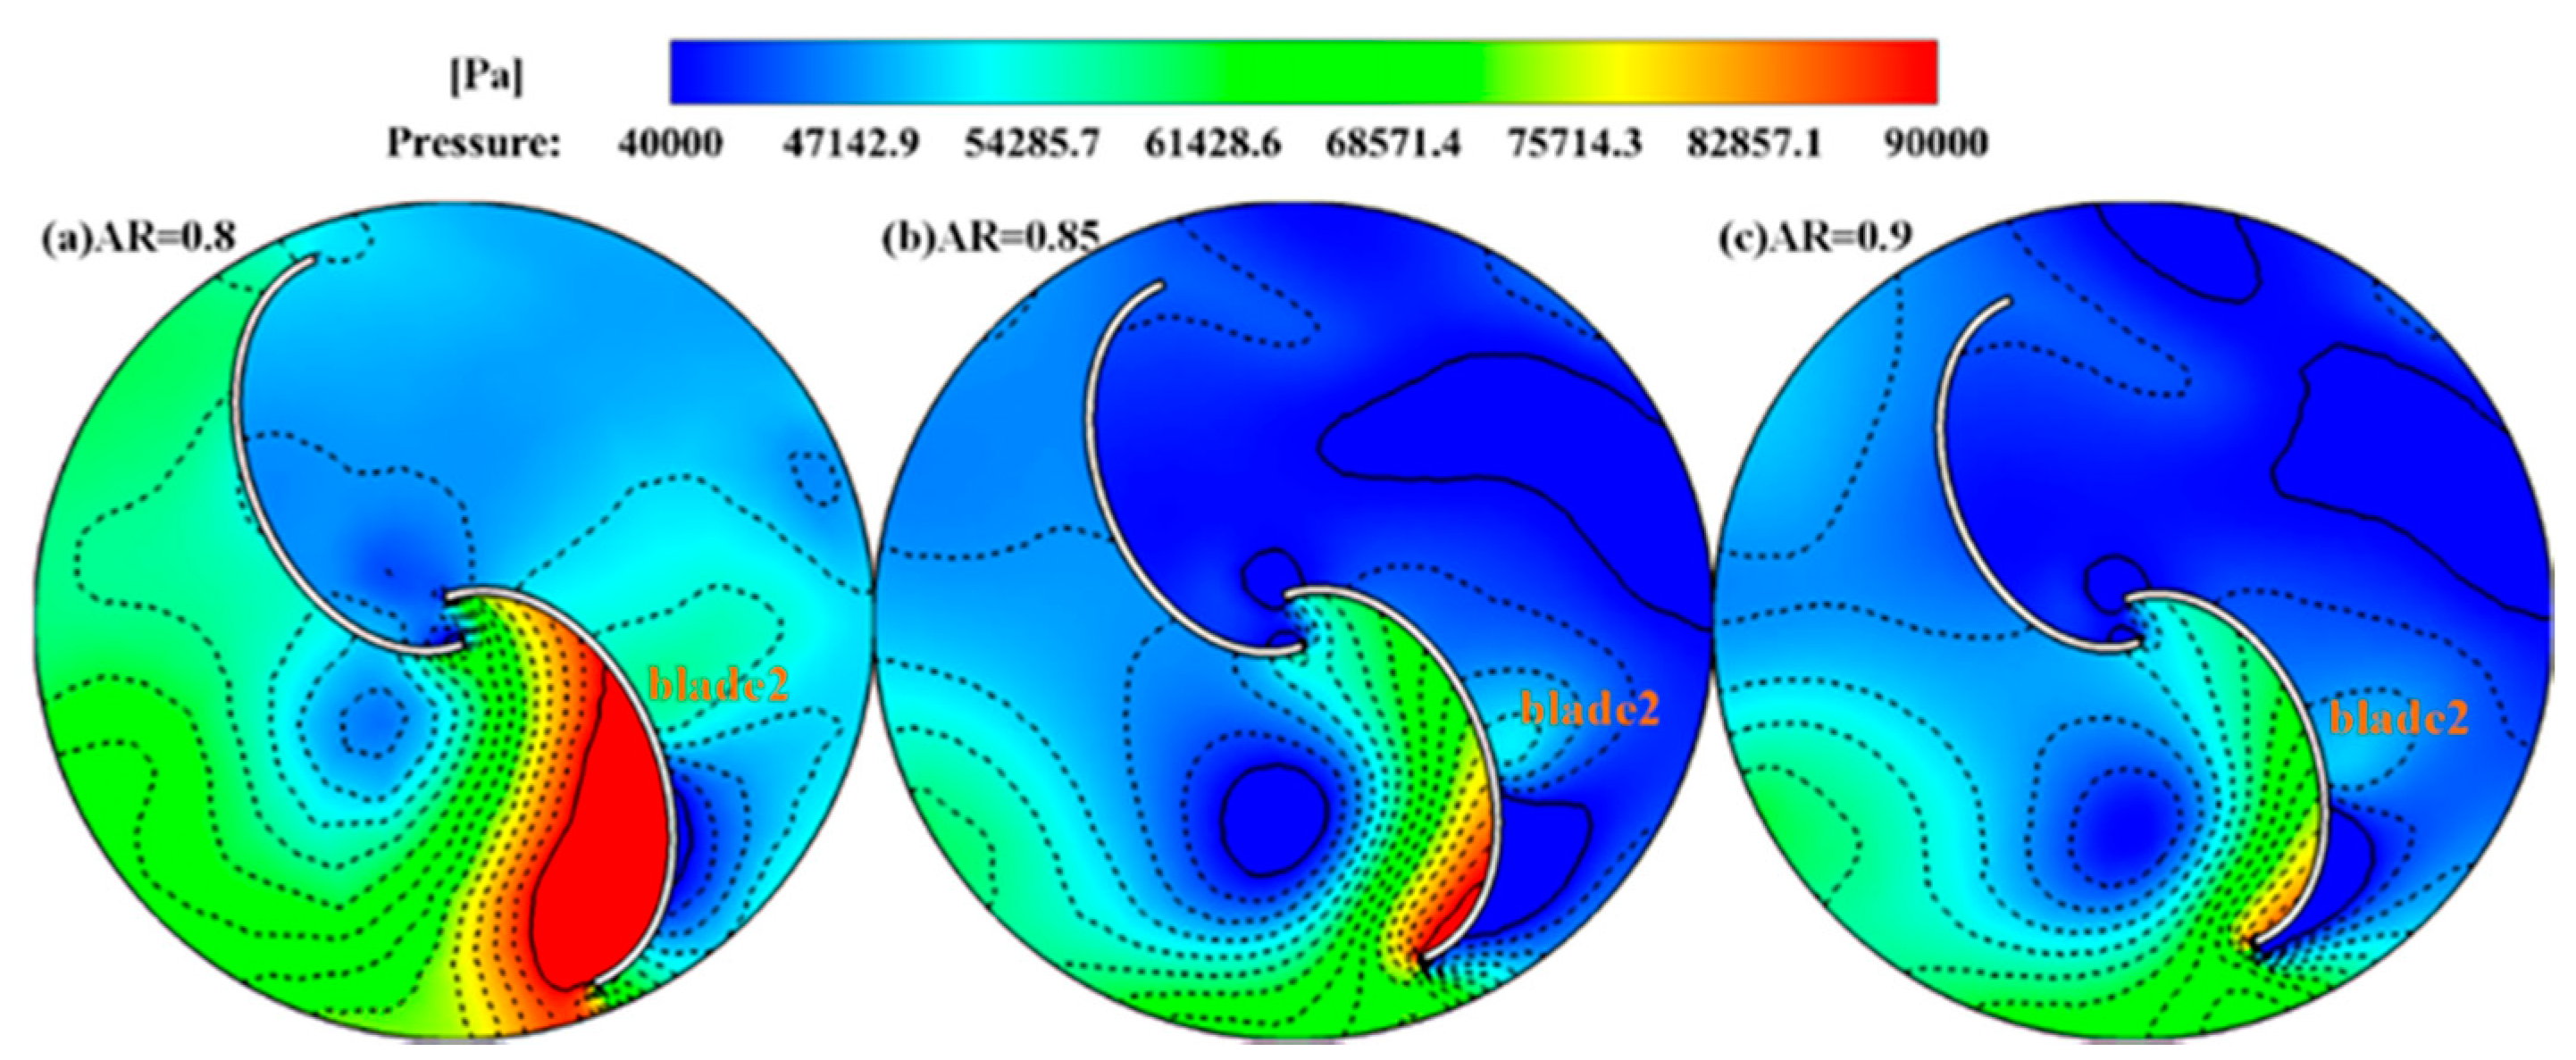
4.4.2. Surface Pressure Characteristics of Blades

Figure 17 depicts the pressure contours around AR0.8, AR0.85, and AR0.9 at θ = 20 ° and K   = 25%. Under this opening condition, the incoming flow mainly impacts blade 2 (shown in Figure 17) directly, therefore, blade 2 is taken as the main research object. All the blade 2s of the three runners are characterized by high-pressure concave surface and low-pressure convex surface. However, with the increase of aspect ratio, the range and strength of the high-pressure region on the concave surface decrease gradually. AR0.8 presents the most obvious high-pressure region on the concave surface of blade 2, which makes its maximum moment significantly higher than that of other runners, as shown in Figure 12. Moreover, both high-pressure region on the concave surface of blade 2 and low-pressure region on the convex surface are found to be larger on AR0.85 than that on AR0.9, which makes the moment of AR0.9 lower than that of AR0.85.The surface pressure values of blade 2 at section Z = 0 are depicted in Figure 18 when K   = 25% and θ = 20 ° . Among them, Figure 18a–c are the pressure scatter diagrams as well as their projections on V plane. It can be observed that the maximum pressure difference between the convex and concave surfaces of blade 2 occurs near the tip. Sicne the arm of force near the blade tip is relatively long, the maximum pressure difference occurred at this position is conducive to energy harvesting.
In order to better compare the pressure of the three runners, the figures on the V plane in Figure 18a–c are drawn together in Figure 18d. It is noticed that from the blade tip to root, the pressure on concave surfaces of the three blades decreases gradually, and the pressure on concave surface decreases along with the increase of aspect ratio. However, the pressure on convex surfaces shows a trend of first decreasing, then increasing and then decreasing, and the minimum pressure occurs near Y = −27.9 mm. Hence, we can conclude that there is a negative correlation between the pressure on surfaces directly impacted by the incoming flow and the aspect ratio, while the pressure on surfaces non-directly impacted by the incoming flow has no obvious mathematical relationship with the aspect ratio. This is because with the increase of aspect ratio, the tip clearance decreases gradually, which makes the leakage increase, leading to the decrease of blade resistance to incoming flow, thus reducing the pressure on the blade surfaces directly impacted by incoming flow.

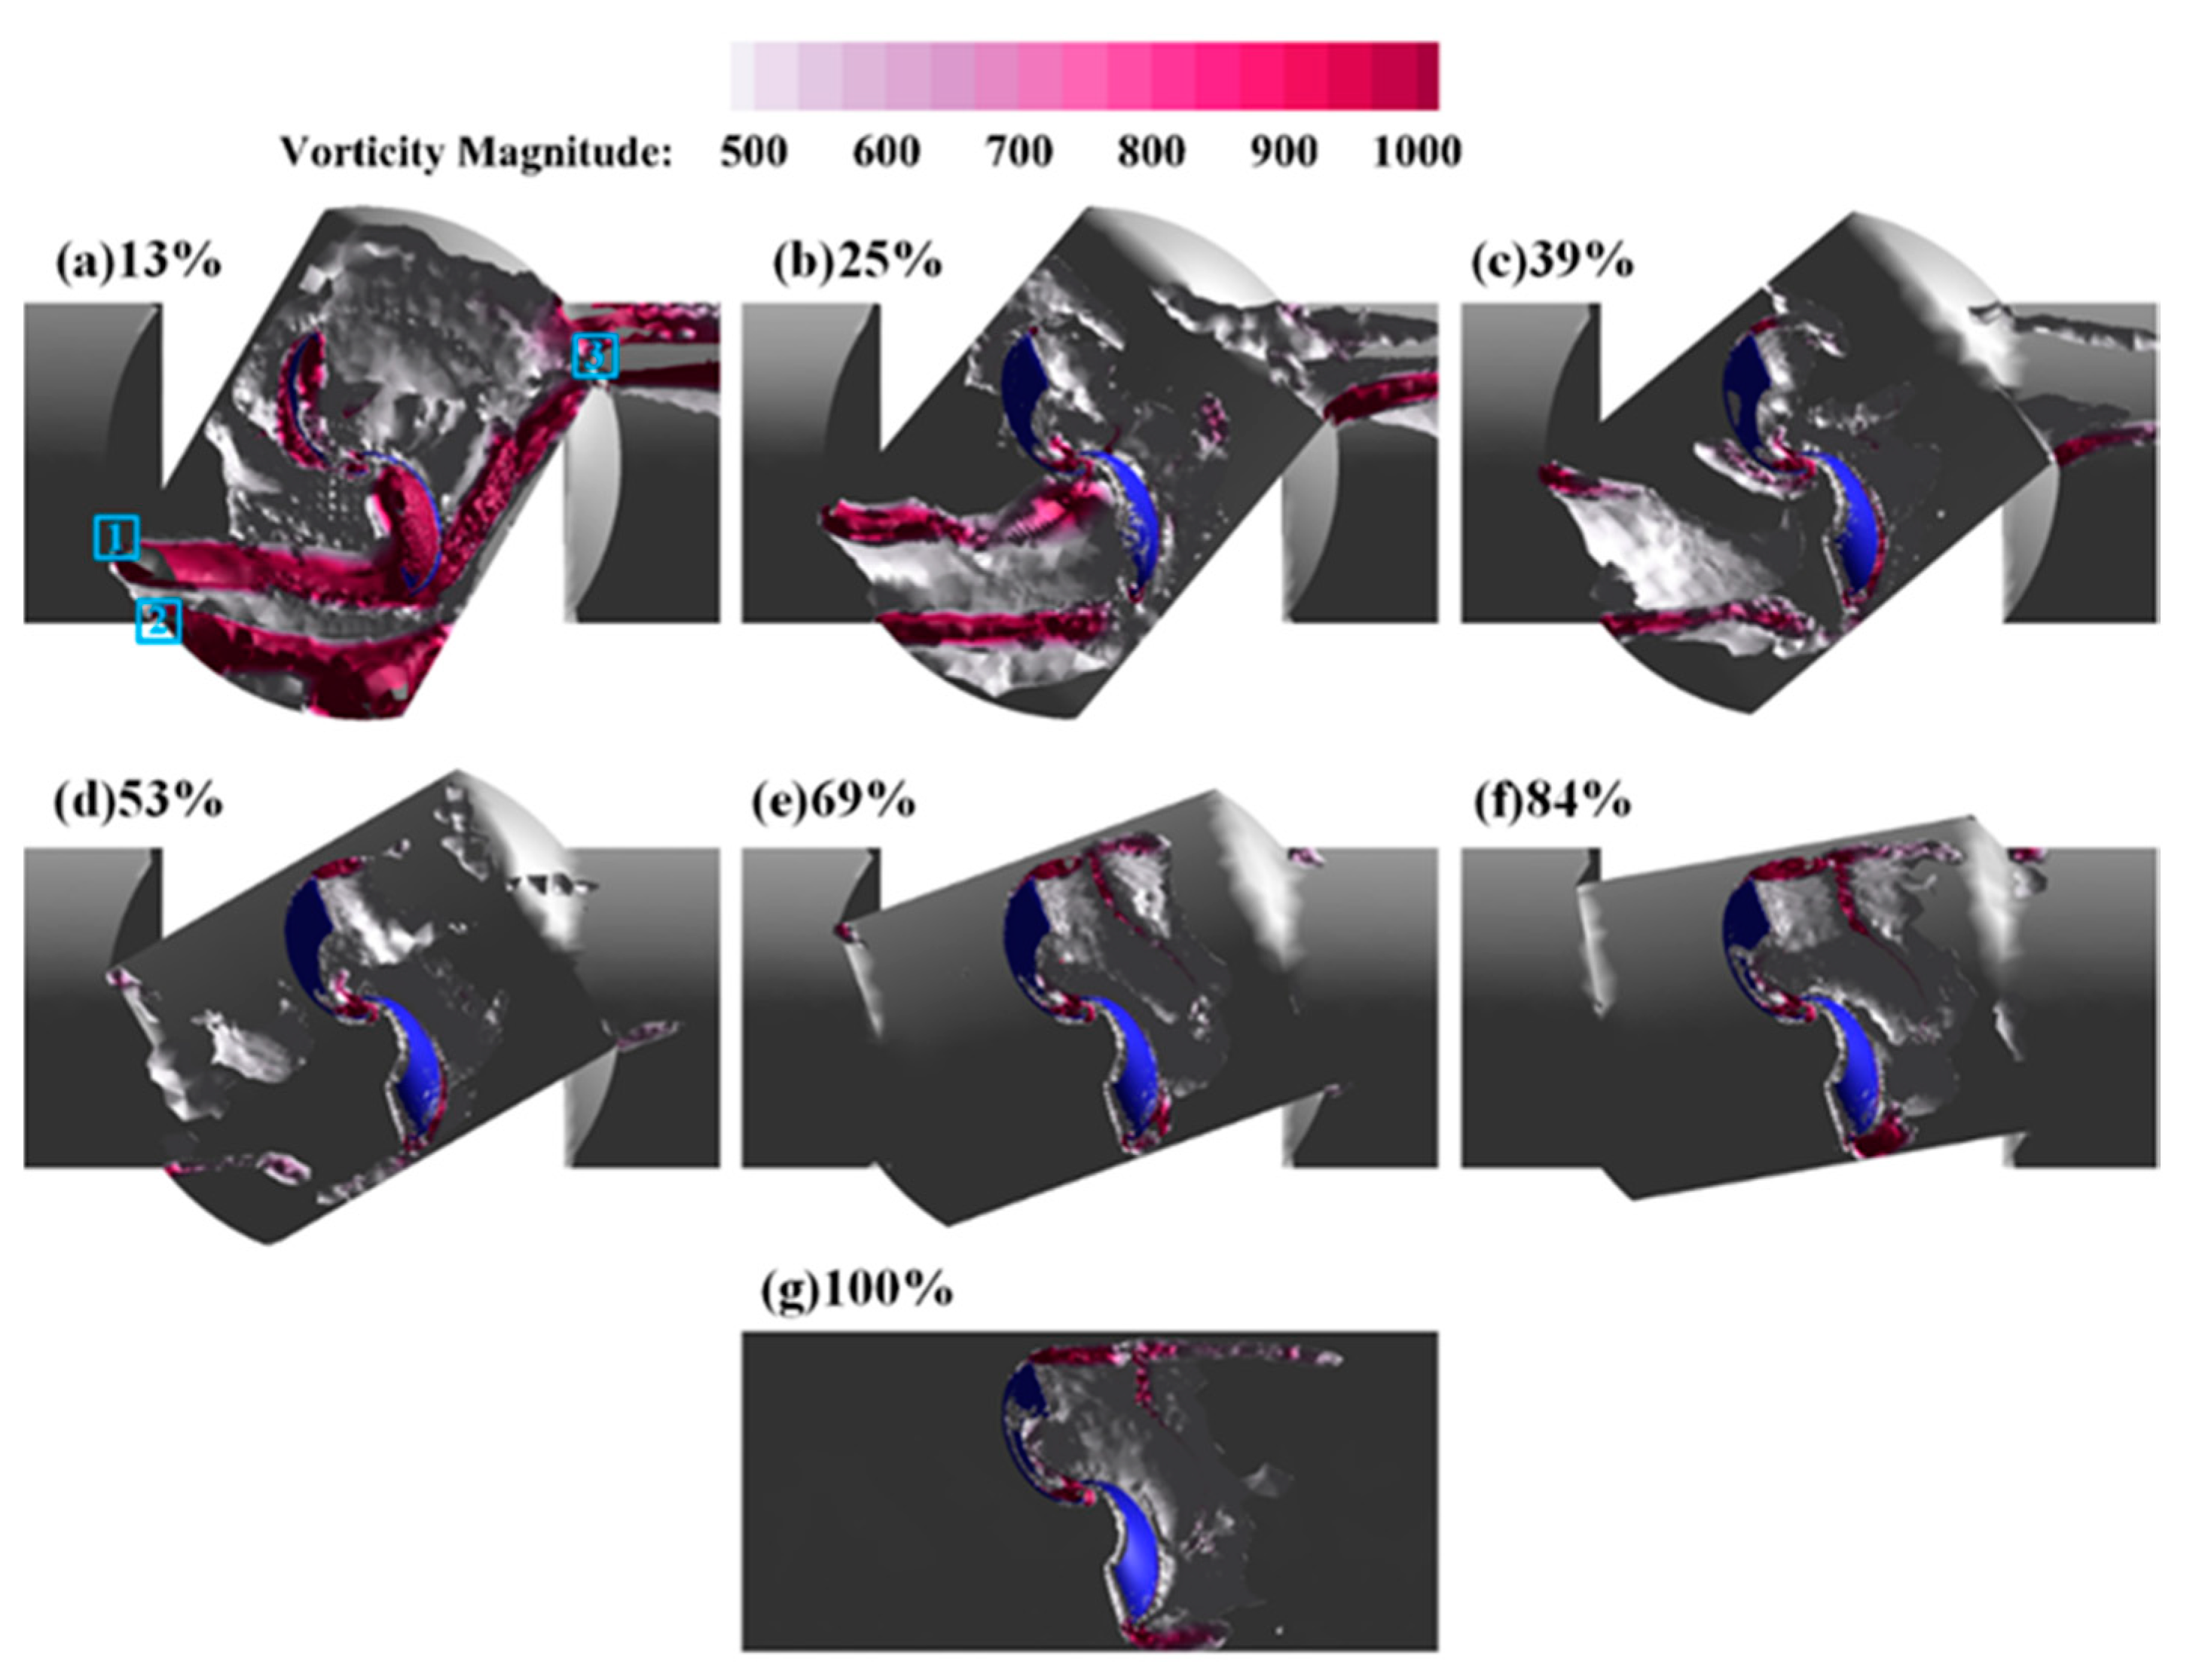
4.4.3. Vortex Contours of the GreenValve Equipped with AR0.8-E0.7 at Different Openings

According to the above analysis, the spool plays an important role in the energy harvesting characteristics of GreenValve. In order to study the transient characteristics of the GreenValve at different openings, Figure 19 shows the flow field around AR0.8-E0.7 at θ = 20 ° . As shown in Figure 19a–c, when K   < 39%, obvious vortices will form at the inlet and outlet of the spool (blue rectangular box in Figure 19a). However, the strength and range of the vortices are different due to their different openings. Specifically, with the decrease of opening, the strength and range of the vortex will increase, and the energy carried by the vortex will increase, so that the water head loss will be greater, as shown in Figure 14. Moreover, since the downstream vortex (vortex 3) at the outlet of the spool does not directly affect the blade, it only dissipates the water energy in the pipeline. On the contrary, vortex 1 and vortex 2 at the inlet of the spool have direct impacts on blade 2, thus playing the role of energy transport rather than energy dissipation. Most of the hydrodynamic force at the inlet of the spool is carried by vortex 1 and vortex 2 with high-speed rotation. After detaching from the surface of spool, vortex 1 and vortex 2 will directly act on the concave surface of advancing blade, and thereby the hydrodynamic force carried by the vortices will be diffused to the advancing blade, so that the GreenValve can harvest more hydropower at relatively small openings, as shown in Figure 12. According to Figure 19a, a high-intensity vortex is generated at the tip clearance, which cannot be found in Figure 19b. This vortex dissipates too much energy carried by vortex 1 and vortex 2, and thus the energy harvested by the GreenValve at K   = 13% is much lower than that at K   = 25%, as shown in Figure 12. With the increase of opening, obvious vortex is no longer formed at the inlet of spool, and the incoming flow uniformly impacts and induces the advancing blade as well as part of the returning blade. As a result, the energy harvesting characteristics deteriorate significantly at this time, as shown in Figure 12.

4.4.4. Velocity Distribution of the GreenValve with AR0.8-E0.7 at Different Phase Angles

Figure 20 shows the velocity contours around AR0.8-E0.7 from θ   = 0° to 110° when K = 25%. Since blade 2 is the main stress part of the runner, the following analysis is carried out based on blade 2.
It can be seen from Figure 20 that high speed jets generate at the inlet of the spool, which is caused by vortex shedding. Specifically, as shown in Figure 19a, vortex 1 and vortex 2 are formed at the inlet of the spool, and the high-speed region (as shown in the red circular box in Figure 20) is formed by the interaction of the two vortices.
At θ = 0°, 10°, and 20°, different degrees of flow separation occur on the convex surface of blade 2, as shown in the red rectangular box in Figure 20. The reason is that the blade angle and the flow attack angle do not match well [41]. When θ = 20°, there is only slight flow separation on the convex surface of blade 2. At this time, the incoming flow is close to the ideal flow, and the direction of relative velocity is basically consistent with the tangent of blade bone line. Therefore, the instantaneous moment of the runner reaches the maximum value at θ = 20°, as shown in Figure 16.
It can be seen from the black rectangular box in Figure 20 that when the phase angle ( θ ) reaches 30°, the flow velocity at the tip of blade 2 increases sharply due to the reduction of tip clearance. In fact, the tip vortex is formed here, which can be seen clearly from Figure 19f. Although the tip vortex here will dissipate part of the water energy, a small low-pressure region will be formed on the convex surface of the blade due to the existence of the tip vortex, so that there is only a slow decline in the moment of the runner, as shown in Figure 16. When θ = 70°, the vortex begins to detach from the blade tip and then merge with the outlet vortex gradually (as shown in the black circular box in Figure 20), resulting in a sharp decrease in the moment of the runner. Then the moment continues to decrease until it reaches the minimum value at θ = 110°. When θ > 110°, blade 1 replaces blade 2 and becomes the main stress part of the runner.

5. Conclusions

In this study, a novel GreenValve is investigated to harvest energy from water supply pipes, so as to continuously and stably supply power for monitoring equipment. Firstly, based on the traditional Savonius rotor, a novel elliptical runner has been specially developed to better match the structure of the control valve. Then, the effects of the flatness and the aspect ratio on performance of the GreenValve are numerically studied in FLUENT software. Finally, the mechanism interpretation of the obtained performance curves is performed through flow field characteristics of the GreenValve. According to the above analysis, the following conclusions are drawn:
  • The newly developed runner has been improved in the roundness of the tip position and, thus, it can match well with the control valve structurally.
  • When K = 25%, high-strength vortices will form at the inlet of the spool, and the hydrodynamic force carried by the vortices will be diffused to the advancing blade, which is conducive to energy harvesting of the runner. In addition, no obvious tip vortex is formed on the advancing blade, which indicates that the hydrodynamic force is fully captured by the runner and not dissipated from the blade tip position. Hence, the shaft power of GreenValve at K   = 25% is always higher than that at other openings regardless of the aspect ratio and the flatness.
  • The water head loss of the GreenValve is hardly affected by the flatness and the aspect ratio of the runner.
  • Compared with other runners, E0.7 and E1.0 perform better in terms of energy harvesting characteristics. However, the maximum flow coefficient of the GreenValve with E0.7 is 5.6% higher than that with E1.0. Hence, 0.7 is considered to be the optimal value of the flatness.
  • Although the maximum flow coefficient of GreenValve decreases by 16.6% when the aspect ratio changes from 0.9 to 0.8, the maximum shaft power increases by 94.6%. Therefore, 0.8 is considered to be a more promising value of aspect ratio.
After a series of research, the flatness and the aspect ratio of the runner have been optimized, and the comprehensive performance of the GreenValve has been significantly improved. In the future work, further research will be conducted on blade number, hollow shaft diameter, blade angle as well as other parameters based on the results in this paper.

Author Contributions

Conceptualization: Y.X. and K.L.; methodology: Y.X. and K.L.; software: K.L.; validation: K.L.; formal analysis: Y.X. and K.L.; investigation: Y.X. and K.L.; resources: Y.X. and Y.W.; data curation: K.L.; writing—original draft preparation: K.L.; writing—review and editing: Y.X.; visualization: X.Z. and K.L.; supervision: Y.X.; project administration: Y.X.; funding acquisition: Y.X. and Y.W. All authors have read and agreed to the published version of the manuscript.

Funding

This research was funded by the National Natural Science Foundation of China, grant number 51775310; the Key Research and Development Project of Shandong Province, grant number 2019GHY112052; the National Key Research and Development Project of China, grant number 2016YFD0701104; and the Project for Scientific Research Innovation Team of Young Scholar in Colleges and Universities of Shandong Province, grant number 2020KJB001.

Acknowledgments

The authors would like to acknowledge the financial support of the National Natural Science Foundation of China, the Key Research and Development Project of Shandong Province, the National Key Research and Development Project of China and the Project for Scientific Research Innovation Team of Young Scholar in Colleges and Universities of Shandong Province.

Conflicts of Interest

The authors declare no conflict of interest.

References

  1. Ali, H.; Choi, J. A Review of underground pipeline leakage and sinkhole monitoring methods based on wireless sensor networking. Sustainability 2019, 11, 4007. [Google Scholar] [CrossRef] [Green Version]
  2. Qiang, X.R.L.Q. Review on water leakage control in distribution networks and the associated environmental benefits. J. Environ. Sci. China 2014, 26, 955–961. [Google Scholar]
  3. Wang, S.; Cao, T.; Chen, B. Urban energy—Water nexus based on modified input—Output analysis. Appl. Energy 2017, 196, 208–217. [Google Scholar] [CrossRef]
  4. Wu, J.; Ma, D.; Wang, W.; Han, Z. Research on sensor placement for disaster prevention in water distribution networks for important users. Sustainability 2020, 12, 723. [Google Scholar] [CrossRef] [Green Version]
  5. Mohamed, M.I.; Wu, W.Y.; Moniri, M. Power harvesting for smart sensor networks in monitoring water distribution system. In Proceedings of the 2011 International Conference on Networking, Sensing and Control, Delft, The Netherlands, 11–13 April 2011; pp. 393–398. [Google Scholar]
  6. Akhtar, F.; Rehmani, M.H. Energy replenishment using renewable and traditional energy resources for sustainable wireless sensor networks: A review. Renew. Sustain. Energy Rev. 2015, 45, 769–784. [Google Scholar] [CrossRef]
  7. Hao, W.; Garcia, R. Development of a digital and battery-free smart flowmeter. Energies 2014, 7, 3695–3709. [Google Scholar] [CrossRef]
  8. Rosenbloom, D.; Meadowcroft, J. Harnessing the sun: Reviewing the potential of solar photovoltaics in Canada. Renew. Sustain. Energy Rev. 2014, 40, 488–496. [Google Scholar] [CrossRef]
  9. Jiyun, D.; Hongxing, Y.; Zhicheng, S.; Xiaodong, G. Development of an inline vertical cross-flow turbine for hydropower harvesting in urban water supply pipes. Renew Energy 2018, 127, 386–397. [Google Scholar] [CrossRef]
  10. Fontana, N.; Giugni, M.; Portolano, D. Losses reduction and energy production in water-distribution networks. J. Water Resour. Plan. Manag. 2012, 138, 237–244. [Google Scholar] [CrossRef]
  11. Williams, A.A.; Smith, N.P.A.; Bird, C.; Howard, M. Pumps as turbines and induction motors as generators for energy recovery in water supply systems. Water Environ. J. 1998, 12, 175–178. [Google Scholar] [CrossRef]
  12. García, J.P.; Marco, A.C.; Santos, S.N. Use of centrifugal pumps operating as turbines for energy recovery in water distribution networks. Two case study. Adv. Mater. Res. 2010, 107, 87–92. [Google Scholar] [CrossRef]
  13. Shao, Y.; Yu, Y.; Yu, T.; Chu, S.; Liu, X. Leakage control and energy consumption optimization in the water distribution network based on joint scheduling of pumps and valves. Energies 2019, 12, 2969. [Google Scholar] [CrossRef] [Green Version]
  14. Chen, J.; Yang, H.X.; Liu, C.P.; Lau, C.H.; Lo, M. A novel vertical axis water turbine for power generation from water pipelines. Energy 2013, 54, 184–193. [Google Scholar] [CrossRef]
  15. Jiyun, D.; Zhicheng, S.; Hongxing, Y. Numerical study on the impact of runner inlet arc angle on the performance of inline cross-flow turbine used in urban water mains. Energy 2018, 158, 228–237. [Google Scholar] [CrossRef]
  16. Malavasi, S.; Rossi, M.M.A.; Ferrarese, G. GreenValve: Hydrodynamics and applications of the control valve for energy harvesting. Urban Water J. 2018, 15, 200–209. [Google Scholar] [CrossRef]
  17. Ferrarese, G.; Malavasi, S. Perspectives of water distribution networks with the GreenValve system. Water 2020, 12, 1579. [Google Scholar] [CrossRef]
  18. Alizadeh, H.; Jahangir, M.H.; Ghasempour, R. CFD-based improvement of Savonius type hydrokinetic turbine using optimized barrier at the low-speed flows. Ocean Eng. 2020, 202, 107178. [Google Scholar] [CrossRef]
  19. Roy, S.; Saha, U.K. Review on the numerical investigations into the design and development of Savonius wind rotors. Renew. Sustain. Energy Rev. 2013, 24, 73–83. [Google Scholar] [CrossRef]
  20. Roy, S.; Saha, U.K. Review of experimental investigations into the design, performance and optimization of the Savonius rotor. Proc. Inst. Mech. Eng. Part A J. Power Energy 2013, 227, 528–542. [Google Scholar] [CrossRef]
  21. Saha, U.K.; Rajkumar, M.J. On the performance analysis of Savonius rotor with twisted blades. Renew. Energy 2006, 31, 1776–1788. [Google Scholar] [CrossRef]
  22. Ghatage, S.V.; Joshi, J.B. Optimisation of vertical axis wind turbine: CFD simulations and experimental measurements. Can. J. Chem. Eng. 2012, 90, 1186–1201. [Google Scholar] [CrossRef]
  23. Roy, S.; Saha, U.K. Wind tunnel experiments of a newly developed two-bladed Savonius-style wind turbine. Appl. Energy 2015, 137, 117–125. [Google Scholar] [CrossRef]
  24. Alom, N.; Saha, U.K. Evolution and progress in the development of savonius wind turbine rotor blade profiles and shapes. J. Sol. Energy Eng. 2019, 141, 030801. [Google Scholar] [CrossRef]
  25. Alom, N.; Saha, U.K. Examining the aerodynamic drag and lift characteristics of a newly developed elliptical-bladed savonius rotor. J. Energy Resour. Technol. 2019, 141, 051201. [Google Scholar] [CrossRef]
  26. Alom, N.; Saha, U.K. Drag and Lift Characteristics of a Novel Elliptical-Bladed Savonius Rotor With Vent Augmenters. J. Sol. Energy Eng. 2019, 141, 051007–051048. [Google Scholar] [CrossRef]
  27. Alom, N.; Saha, U.K. Influence of blade profiles on Savonius rotor performance: Numerical simulation and experimental validation. Energy Convers. Manag. 2019, 186, 267–277. [Google Scholar] [CrossRef]
  28. Alom, N.; Saha, U.K. Performance evaluation of vent-augmented elliptical-bladed savonius rotors by numerical simulation and wind tunnel experiments. Energy 2018, 152, 277–290. [Google Scholar] [CrossRef]
  29. Al-Kayiem, H.H.; Bhayo, B.A.; Assadi, M. Comparative critique on the design parameters and their effect on the performance of S-rotors. Renew. Energy 2016, 99, 1306–1317. [Google Scholar] [CrossRef]
  30. Kamoji, M.A.; Kedare, S.B.; Prabhu, S.V. Experimental investigations on single stage modified Savonius rotor. Appl. Energy 2009, 86, 1064–1073. [Google Scholar] [CrossRef]
  31. Bhayo, B.A.; Al-Kayiem, H.H. Experimental characterization and comparison of performance parameters of S-rotors for standalone wind power system. Energy 2017, 138, 752–763. [Google Scholar] [CrossRef]
  32. Jaohindy, P.; McTavish, S.; Garde, F.; Bastide, A. An analysis of the transient forces acting on Savonius rotors with different aspect ratios. Renew. Energy 2013, 55, 286–295. [Google Scholar] [CrossRef]
  33. Sobczak, K. Numerical investigations of an influence of the aspect ratio on the Savonius rotor performance. J. Phys. Conf. Ser. 2018, 1101, 12034. [Google Scholar] [CrossRef]
  34. Patel, V.; Bhat, G.; Eldho, T.I.; Prabhu, S.V. Influence of overlap ratio and aspect ratio on the performance of Savonius hydrokinetic turbine. Int. J. Energy Res. 2017, 41, 829–844. [Google Scholar] [CrossRef]
  35. Ferrari, G.; Federici, D.; Schito, P.; Inzoli, F.; Mereu, R. CFD study of Savonius wind turbine: 3D model validation and parametric analysis. Renew. Energy 2017, 105, 722–734. [Google Scholar] [CrossRef]
  36. Williamson, S.J.; Stark, B.H.; Booker, J.D. Performance of a low-head pico-hydro Turgo turbine. Appl. Energy 2013, 102, 1114–1126. [Google Scholar] [CrossRef]
  37. Ostos, I.; Ruiz, I.; Gajic, M.; Gomez, W.; Bonilla, A.; Collazos, C. A modified novel blade configuration proposal for a more efficient VAWT using CFD tools. Energy Convers. Manag. 2019, 180, 733–746. [Google Scholar] [CrossRef]
  38. Tian, W.; Mao, Z.; Zhang, B.; Li, Y. Shape optimization of a Savonius wind rotor with different convex and concave sides. Renew. Energy 2018, 117, 287–299. [Google Scholar] [CrossRef]
  39. Jiyu, D.; Shen, Z.; Yang, H. Study on the effects of runner geometries on the performance of inline cross-flow turbine used in water pipelines. Sustain. Energy Technol. Assess. 2020, 40, 100762. [Google Scholar]
  40. Malavasi, S.; Ferrarese, G.; Rossi, M.M.A. A control valve for energy harvesting. Procedia Eng. 2014, 89, 588–594. [Google Scholar] [CrossRef] [Green Version]
  41. Du, J.; Shen, Z.; Yang, H. Effects of different block designs on the performance of inline cross-flow turbines in urban water mains. Appl. Energy 2018, 228, 97–107. [Google Scholar] [CrossRef]
Figure 1. (a) Schematic diagram of the GreenValve; (b) initial runner configuration (AR0.9-E1.0).
Sustainability 12 08579 g001
Figure 2. (a) Semi-elliptical S-runners with different flatness (phase angle (θ) = 0°); (b) runner geometric parameters.
Sustainability 12 08579 g002
Figure 3. Grid independence.
Sustainability 12 08579 g003
Figure 4. Grid details of the computational domain.
Sustainability 12 08579 g004
Figure 5. Comparison of numerical and experimental [40] results of C v .
Sustainability 12 08579 g005
Figure 6. The P out along the TSR at different openings.
Sustainability 12 08579 g006
Figure 7. Curves of shaft power with opening.
Sustainability 12 08579 g007
Figure 8. The shaft power changing with flatness at different openings.
Sustainability 12 08579 g008
Figure 9. Curves of efficiency with opening.
Sustainability 12 08579 g009
Figure 10. Curves of water head loss with opening.
Sustainability 12 08579 g010
Figure 11. Cv values at different openings.
Sustainability 12 08579 g011
Figure 12. The shaft power of runners with different aspect ratios.
Sustainability 12 08579 g012
Figure 13. The efficiency of runners with different aspect ratios.
Sustainability 12 08579 g013
Figure 14. The water head loss of runners with different aspect ratios.
Sustainability 12 08579 g014
Figure 15. The C v values of runners with different aspect ratios.
Sustainability 12 08579 g015
Figure 16. Instantaneous moment curves of runners with different aspect ratios.
Sustainability 12 08579 g016
Figure 17. Pressure contours around AR0.8, AR0.85 and AR0.9 at θ = 20° and K = 25%.
Sustainability 12 08579 g017
Figure 18. The surface pressure scatter diagrams as well as their projections on V plane of blade 2 at section Z = 0 when K   = 25% and θ = 20 ° : (a) AR = 0.8; (b) AR = 0.85; (c) AR = 0.9; (d) comparative results of the three projections of (a), (b), and (c) on the V plane.
Sustainability 12 08579 g018
Figure 19. Vortex contours around the runner at θ = 20°. (a) 13%, (b) 25%, (c) 39%, (d) 53%, (e) 69%, (f) 84%, (g) 100%.
Sustainability 12 08579 g019
Figure 20. Velocity distribution around the runner at K = 25%.
Sustainability 12 08579 g020
Table 1. Runner geometric parameter values.
Geometrical ParametersSymbolsValues
Pipe diameter D 1 100 mm
Chord length of the runner D 78–88 mm
Overlap distance S 6.31–7.09 mm
Aspect ratio A R (H/D)0.8–0.9
Overlap ratio O R (S/2a)0.15
Flatness E (b/a)0.6–1.1
Height of the runner H 70 mm
Blade thickness h 1 mm
Table 2. Different runner configurations.
E0.6E0.7E0.8E0.9E1.0E1.1
AR0.9AR0.9-E0.6AR0.9-E0.7AR0.9-E0.8AR0.9-E0.9AR0.9-E1.0AR0.9-E1.1
AR0.85 AR0.85-E0.7
AR0.8 AR0.8-E0.7
Table 3. TSR values.
K (%) 132539536984100
TSR 0.51.71.31.31.00.90.8
Publisher’s Note: MDPI stays neutral with regard to jurisdictional claims in published maps and institutional affiliations.

