Examining Household Food Waste Behaviors and the Determinants in Korea Using New Questions in a National Household Survey


Abstract
:1. Introduction
2. Review of Literature
2.1. Related Studies
2.2. Related Policies by International Organizations and Countries
2.2.1. Efforts of International Organizations
2.2.2. Policies by Country
3. Data and Methods
3.1. Data and Summary Statistics
3.2. Econometric Analysis
3.2.1. Analysis of Factors Affecting the Amount of Food Waste
3.2.2. Analysis of Differences in the Amount of Food Waste by Intensity of Efforts and by Household Awareness on Reducing Food Waste
4. Empirical Results and Discussions
4.1. Descriptive Statistics
4.1.1. Food Waste Discharge in Korea
4.1.2. Volume-Rate Food Waste Disposal System
4.1.3. Main Source of Food Waste
4.1.4. Household Efforts to Reduce Food Waste and Their Recognition on Food Waste
4.2. Estimation Results
4.3. Discussions and Policy Implications
4.3.1. Efforts to Reduce Food Waste and Loss
4.3.2. Implications of the Analysis of Factors Affecting Food Waste of Korean Households
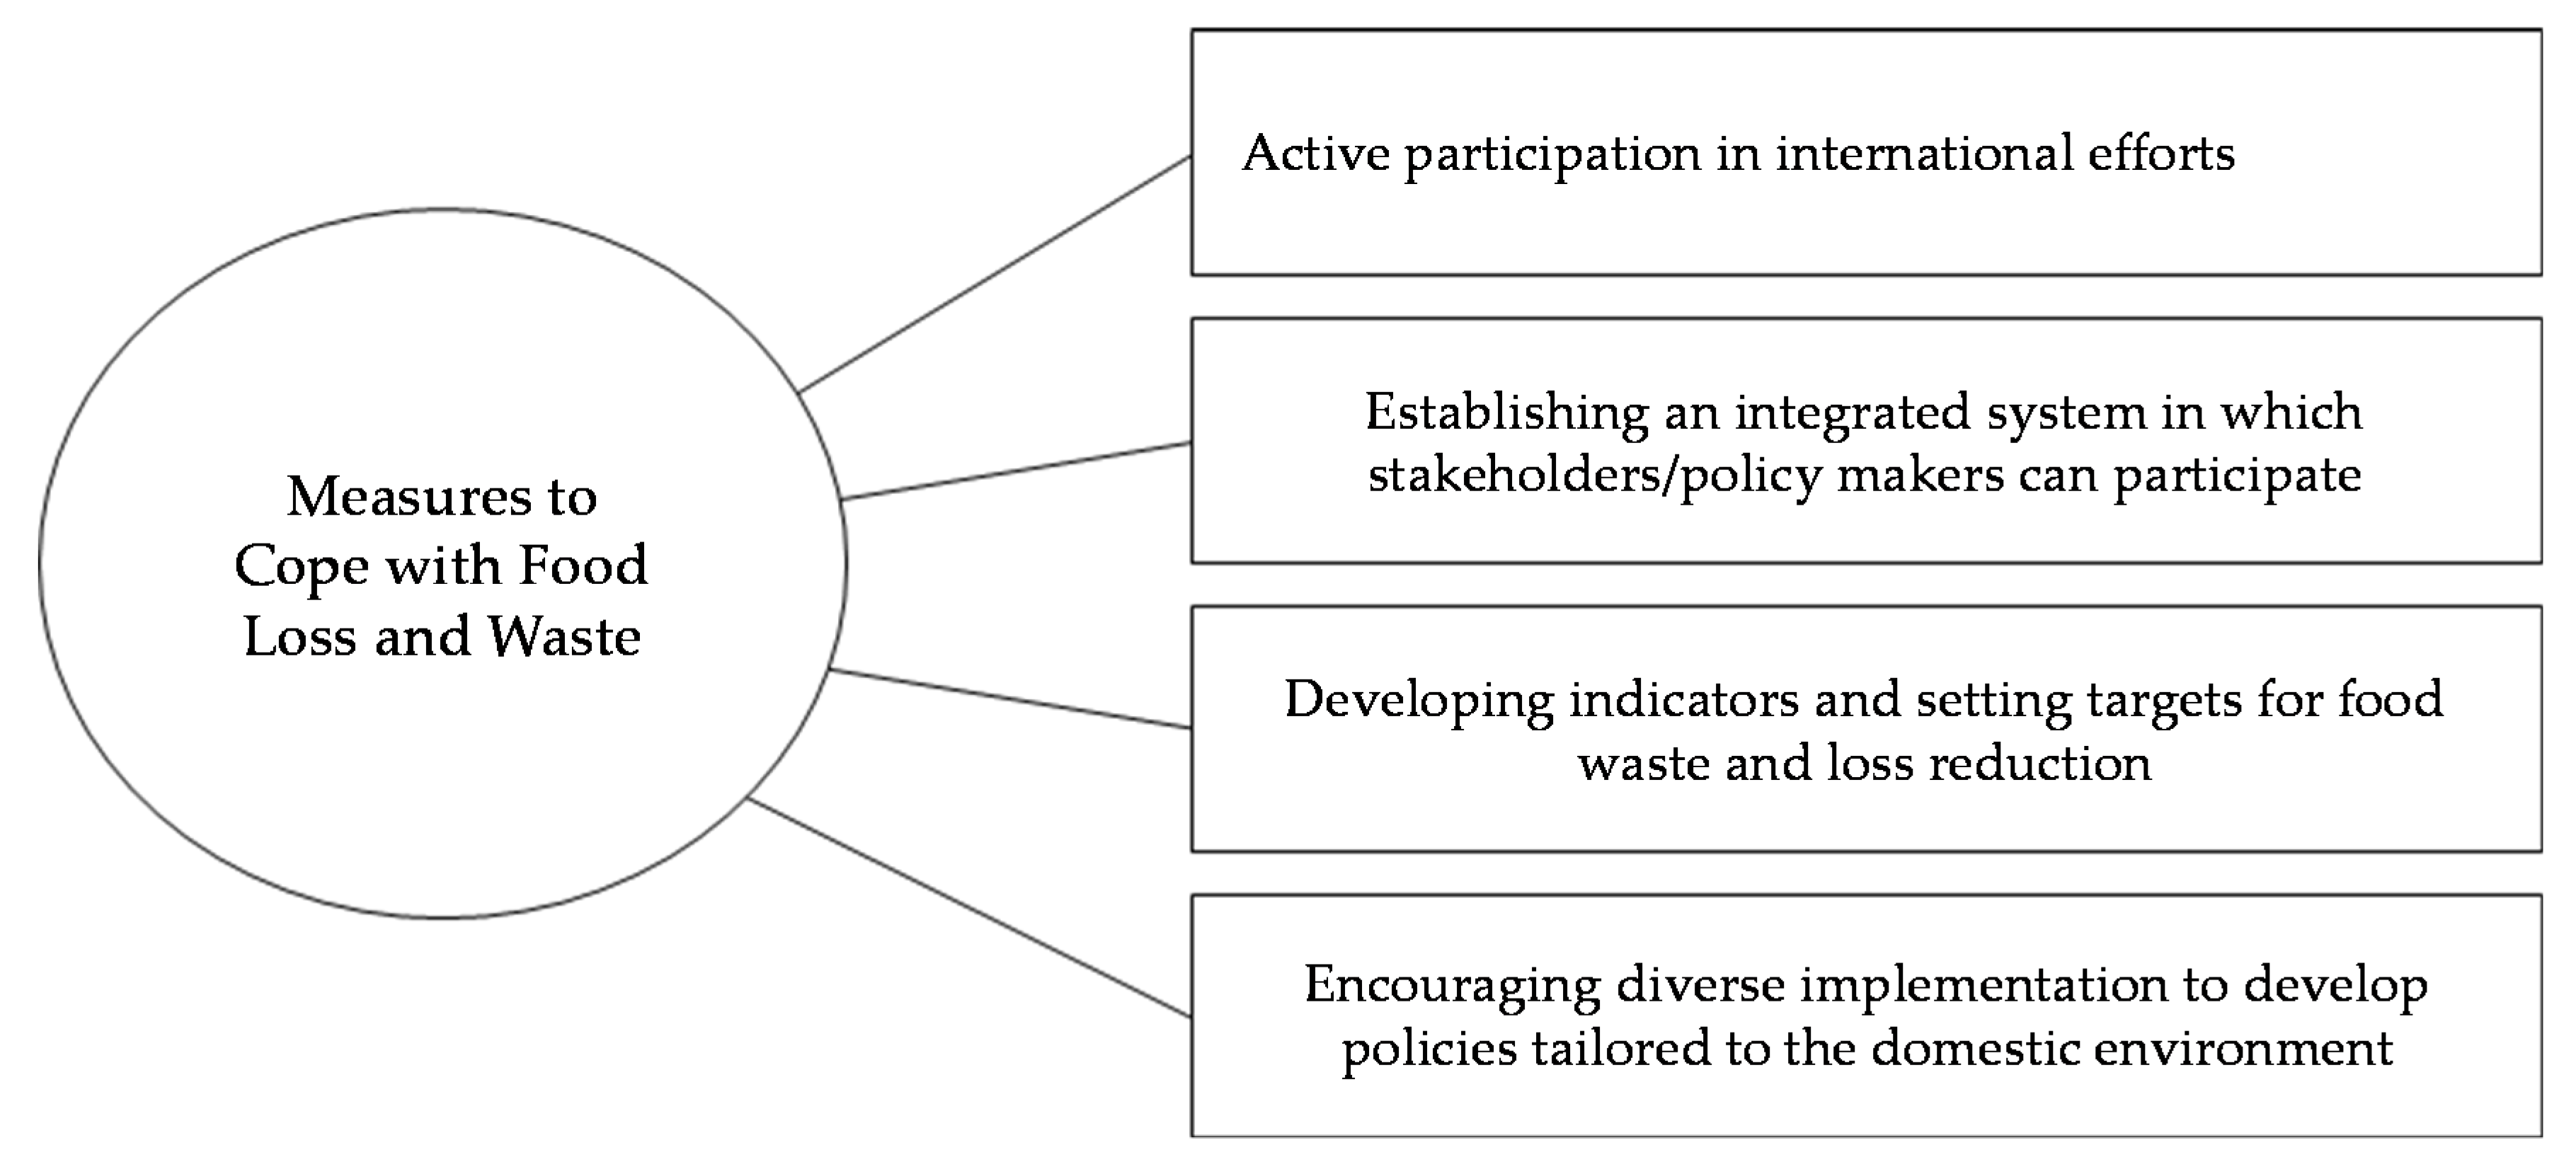
4.3.3. Suggestions for Responding to Food Waste and Loss Issue
5. Conclusions
Author Contributions
Funding
Acknowledgments
Conflicts of Interest
References
- Food and Agriculture Organization of the United Nations. Food Wastage Footprint: Impacts on Natural Resources. Available online: http://www.fao.org/3/i3347e/i3347e.pdf (accessed on 20 June 2020).
- Gustavsson, J.; Cederberg, C.; Sonesson, U.; Emanuelsson, A. The Methodology of the FAO Study: Global Food Losses and Food Waste. Available online: http://www.diva-portal.org/smash/record.jsf?pid=diva2%3A944159&dswid=-85 (accessed on 20 June 2020).
- United Nations. Transforming Our World: The 2030 Agenda for Sustainable Development. Available online: https://www.unfpa.org/sites/default/files/resource-pdf/Resolution_A_RES_70_1_EN.pdf (accessed on 14 July 2020).
- Food and Agriculture Organization of the United Nations. Global food losses and food waste. Available online: http://www.fao.org/3/mb060e/mb060e00.htm (accessed on 20 June 2020).
- The Ministry of Environment. A Study on the Plan to Introduce the Volume-Based Food Waste Rate System and Reduction Policy. 2010; Policy Report. Available online: http://www.prism.go.kr/homepage/researchCommon/downloadResearchAttachFile.do;jsessionid=7C03D2E30D874DEF4F96F7A2A276AA4C.node02?work_key=001&file_type=CPR&seq_no=001&pdf_conv_yn=N&research_id=1480000-201100465 (accessed on 20 June 2020). (In Korean)
- The Ministry of Environment. A Study on Food Waste Treatment Status and Management Plan. 2017; Policy Report. Available online: http://www.prism.go.kr/homepage/researchCommon/downloadResearchAttachFile.do?work_key=001&file_type=CPR&seq_no=001&pdf_conv_yn=N&research_id=1480000-201600023 (accessed on 20 June 2020). (In Korean)
- The Ministry of Environment. A Study on Improvement Plan of Food Waste Management Policy. 2015; Policy Report. Available online: http://www.prism.go.kr/homepage/researchCommon/downloadResearchAttachFile.do;jsessionid=A0122B149DE1762646EE19EC1D102AEB.node02?work_key=002&file_type=CPR&seq_no=001&pdf_conv_yn=Y&research_id=1480000-201500011 (accessed on 20 June 2020). (In Korean)
- Korea Rural Economic Institute. Consumer Behavior Survey for Foods for 2018. Available online: http://www.krei.re.kr/foodSurvey/selectBbsNttList.do?bbsNo=451&key=809 (accessed on 7 August 2020).
- Qi, D.; Roe, B.E. Household Food Waste: Multivariate Regression and Principal Components Analyses of Awareness and Attitudes among U.S. Consumers. PLoS ONE 2016, 11, e0159250. [Google Scholar] [CrossRef] [PubMed]
- Radzymińska, M.; Jakubowska, D.; Staniewska, K. Consumer Attitude and Behaviour towards Food Waste. J. Agribus. Rural. Dev. 2016, 10, 175–181. [Google Scholar] [CrossRef]
- Refsgaard, K.; Magnussen, K. Household behaviour and attitudes with respect to recycling food waste—Experiences from focus groups. J. Environ. Manag. 2009, 90, 760–771. [Google Scholar] [CrossRef] [PubMed]
- Secondi, L.; Principato, L.; Laureti, T. Household food waste behaviour in EU-27 countries: A multilevel analysis. Food Policy 2015, 56, 25–40. [Google Scholar] [CrossRef]
- Halloran, A.; Clement, J.; Kornum, N.; Bucatariu, C.; Magid, J. Addressing food waste reduction in Denmark. Food Policy 2014, 49, 294–301. [Google Scholar] [CrossRef]
- Fanelli, R.M. Using Causal Maps to Analyse the Major Root Causes of Household Food Waste: Results of a Survey among People from Central and Southern Italy. Sustainability 2019, 11, 1183. [Google Scholar] [CrossRef] [Green Version]
- Falasconi, L.; Cicatiello, C.; Franco, S.; Segrè, A.; Setti, M.; Vittuari, M. Such a Shame! A Study on Self-Perception of Household Food Waste. Sustainability 2019, 11, 270. [Google Scholar] [CrossRef] [Green Version]
- Qi, D.; Roe, B.E. Foodservice Composting Crowds Out Consumer Food Waste Reduction Behavior in a Dining Experiment. Am. J. Agric. Econ. 2017, 99, 1159–1171. [Google Scholar] [CrossRef]
- Miller, B.D.D.; Welch, R.M. Food system strategies for preventing micronutrient malnutrition. Food Policy 2013, 42, 115–128. [Google Scholar] [CrossRef] [Green Version]
- Lee, D.; Sönmez, E.; Gómez, M.I.; Fan, X. Combining two wrongs to make two rights: Mitigating food insecurity and food waste through gleaning operations. Food Policy 2017, 68, 40–52. [Google Scholar] [CrossRef]
- Zu Ermgassen, E.K.; Phalan, B.; Green, R.E.; Balmford, A. Reducing the land use of EU pork production: Where there’s swill, there’s a way. Food Policy 2016, 58, 35–48. [Google Scholar] [CrossRef] [PubMed] [Green Version]
- Sonnino, R.; McWilliam, S. Food waste, catering practices and public procurement: A case study of hospital food systems in Wales. Food Policy 2011, 36, 823–829. [Google Scholar] [CrossRef]
- Moult, J.; Allan, S.; Hewitt, C.; Berners-Lee, M. Greenhouse gas emissions of food waste disposal options for UK retailers. Food Policy 2018, 77, 50–58. [Google Scholar] [CrossRef] [Green Version]
- Caswell, H. Britain’s battle against food waste. Nutr. Bull. 2008, 33, 331–335. [Google Scholar] [CrossRef]
- Fanelli, R.M.; Di Nocera, A. How to implement new educational campaigns against food waste: An analysis of best practices in European Countries. Econ. Agro-Aliment. Food Econ. 2017, 19, 223–244. [Google Scholar] [CrossRef]
- Bellemare, M.F.; Çakir, M.; Peterson, H.H.; Novak, L.; Rudi, J. On the Measurement of Food Waste. Am. J. Agric. Econ. 2017, 99, 1148–1158. [Google Scholar] [CrossRef]
- Giordano, C.; Piras, S.; Boschini, M.; Falasconi, L. Are questionnaires a reliable method to measure food waste? A pilot study on Italian households. Br. Food J. 2018, 120, 2885–2897. [Google Scholar] [CrossRef]
- Fanelli, R.M.; Romagnoli, L. Annual food waste per capita as influenced by geographical variations. Riv. DI Studi Sulla Sostenibilità 2019, 1, 59–76. [Google Scholar] [CrossRef]
- Sustainable Consumption and Production. Available online: https://www.un.org/sustainabledevelopment/sustainable-consumption-production/ (accessed on 22 October 2018).
- Food and Agriculture Organization of the United Nations. Reduction of Food Losses and Waste in Europe and Central Asia for Improved Food Security and Agrifood Chain Efficiency. Available online: http://www.fao.org/3/a-au844e.pdf (accessed on 11 August 2020).
- APEC Strengthening Public-Private Partnership to Reduce Food Losses in the Supply Chain. Available online: http://www.mofa.go.kr/eng/brd/m_5465/down.do?brd_id=8116&seq=315089&data_tp=A&file_seq=1 (accessed on 22 October 2018).
- Food Chain Analysis Network. Available online: https://www.oecd.org/agriculture/topics/food-chain-analysis-network/ (accessed on 22 October 2018).
- OECD. The Summary Report. In Proceedings of the 8th Meeting of the OECD Food Chain Analysis Network on Reducing Food Loss and Waste in Retail and Processing Sectors, Paris, France, 23–24 June 2016. [Google Scholar]
- Food Date Labeling Act. Available online: https://www.refed.com/tools/food-waste-policy-finder/federal-policy/food-date-labeling-act (accessed on 22 October 2018).
- About Fusions. Available online: http://www.eu-fusions.org/index.php/about-fusions#:~:text=FUSIONS%20(Food%20Use%20for%20Social,European%20Commission%20Framework%20Programme%207 (accessed on 22 October 2018).
- France-Summary of Policies and Legislation for Food Waste Prevention and Reduction. Available online: https://www.eu-fusions.org/index.php/country-reports/reports/292-france (accessed on 22 October 2018).
- Food Waste Reduction. Available online: http://www.wrap.org.uk/food-waste-reduction (accessed on 22 October 2018).
- Our History. Available online: http://www.wrap.org.uk/about-us/our-history (accessed on 22 October 2018).
- Resource Revolution: Creating the Future. Available online: http://www.wrap.org.uk/about-us/our-plan#:~:text=Our%20five%20year%20plan%2C%20’Resource,define%20how%20we%20use%20materials (accessed on 22 October 2018).

| Organization | Project | Content |
|---|---|---|
| United Nations (UN) | Sustainable Development Goal 12.3 and 12.5 |
|
| Food and Agriculture Organization (FAO) | Global Initiative on Food Waste and Loss Reduction |
|
| UN Environment Programme (UNEP) and FAO | Sustainable Food Systems Program |
|
| Asia-Pacific Economic Cooperation (APEC) | Strengthening Public-Private Partnerships to Reduce Food Loss in the Supply Chain |
|
| Organization for Economic Co-operation and Development (OECD) | Food Chain Analysis Network |
|
| OECD and International Food Policy Research Institute (IFPRI) | n/a |
|
| Classification | Percentage (%) | Number of Participants (#) | |
|---|---|---|---|
| Survey Area | Seoul Metro City | 11.93 | 410 |
| Busan Metro City | 7.62 | 262 | |
| Incheon Metro City | 5.79 | 199 | |
| Daegu Metro City | 5.5 | 189 | |
| Daejeon Metro City | 4.86 | 167 | |
| Gwangju Metro City | 4.48 | 154 | |
| Ulsan Metro City | 3.52 | 121 | |
| Gyounggi Province | 12.28 | 422 | |
| Gyeongsangbuk-do | 6.95 | 239 | |
| Gyeongsangnam-do | 7.33 | 252 | |
| Jeollabuk-do | 4.34 | 149 | |
| Jeollanam-do | 5.56 | 191 | |
| Chungcheongbuk-do | 5.76 | 198 | |
| Chungcheongnam-do | 5.82 | 200 | |
| Gangwon-do | 6.43 | 221 | |
| Jeju Island | 1.83 | 63 | |
| Total | 100 | 3437 | |
| Gender | Female | 87.78 | 3017 |
| Male | 12.22 | 420 | |
| Total | 100 | 3437 | |
| Age | 30s or below | 17.66 | 607 |
| 40s | 25.08 | 862 | |
| 50s | 29.36 | 1009 | |
| 60s | 20.45 | 703 | |
| 70s | 7.45 | 256 | |
| Total | 100 | 3437 | |
| # of people in a household | 1 person | 22.35 | 768 |
| 2 people | 39.66 | 1363 | |
| 3 people | 21.12 | 726 | |
| 4 people | 15.04 | 517 | |
| 5 people or more | 1.83 | 63 | |
| Total | 100 | 3437 | |
| Classification | Below 500 g (%) | 500 g–1 kg (%) | 1–2 kg (%) | 2–3 kg (%) | Above 3 kg (%) | Number of Participants (#) | |
|---|---|---|---|---|---|---|---|
| Upper-level Administrative District | Seoul Metro City | 64.39 | 28.78 | 4.88 | 1.95 | 0.00 | 410 |
| Busan Metro City | 52.67 | 43.89 | 2.67 | 0.76 | 0.00 | 262 | |
| Incheon Metro City | 66.83 | 27.14 | 6.03 | 0.00 | 0.00 | 199 | |
| Daegu Metro City | 46.56 | 34.39 | 13.23 | 3.17 | 2.65 | 189 | |
| Daejeon Metro City | 64.07 | 29.94 | 2.99 | 2.99 | 0.00 | 167 | |
| Gwangju Metro City | 58.44 | 39.61 | 1.30 | 0.65 | 0.00 | 154 | |
| Ulsan Metro City | 50.41 | 42.15 | 6.61 | 0.83 | 0.00 | 121 | |
| Gyounggi Province | 58.53 | 29.86 | 9.95 | 1.66 | 0.00 | 422 | |
| Gyeongsangbuk-do | 78.66 | 19.67 | 1.67 | 0.00 | 0.00 | 239 | |
| Gyeongsangnam-do | 68.25 | 28.17 | 3.17 | 0.40 | 0.00 | 252 | |
| Jeollabuk-do | 74.50 | 22.82 | 2.68 | 0.00 | 0.00 | 149 | |
| Jeollanam-do | 56.02 | 42.93 | 0.52 | 0.52 | 0.00 | 191 | |
| Chungcheongbuk-do | 65.66 | 33.33 | 1.01 | 0.00 | 0.00 | 198 | |
| Chungcheongnam-do | 76.00 | 23.50 | 0.50 | 0.00 | 0.00 | 200 | |
| Gangwon-do | 62.44 | 34.39 | 3.17 | 0.00 | 0.00 | 221 | |
| Jeju Island | 69.84 | 25.40 | 4.76 | 0.00 | 0.00 | 63 | |
| Gender | Female | 61.88 | 32.28 | 4.67 | 0.99 | 0.17 | 3017 |
| Male | 72.14 | 25.00 | 2.38 | 0.48 | 0.00 | 420 | |
| Age of household head | 30s or below | 66.89 | 28.34 | 4.28 | 0.33 | 0.16 | 607 |
| 40s | 51.97 | 39.33 | 7.31 | 1.16 | 0.23 | 862 | |
| 50s | 59.07 | 35.38 | 4.36 | 1.09 | 0.10 | 1009 | |
| 60s | 73.12 | 23.90 | 2.13 | 0.71 | 0.14 | 703 | |
| 70s | 80.47 | 16.80 | 1.17 | 1.56 | 0.00 | 256 | |
| Household size | 1 person | 86.59 | 11.85 | 1.04 | 0.52 | 0.00 | 768 |
| 2 persons | 64.27 | 31.47 | 3.30 | 0.81 | 0.15 | 1363 | |
| 3 persons | 51.38 | 41.18 | 6.20 | 1.24 | 0.00 | 726 | |
| 4 persons | 44.68 | 44.10 | 9.48 | 1.16 | 0.58 | 517 | |
| 5 persons or more | 39.68 | 50.79 | 6.35 | 3.17 | 0.00 | 63 | |
| Total | 63.14 | 31.39 | 4.39 | 0.93 | 0.15 | 3437 | |
| Classification | Percentage (%) | Number of Participants (#) | |
|---|---|---|---|
| Change in amount of food waste | decreased significantly | 0.32 | 11 |
| somewhat decreased | 7.86 | 270 | |
| not changed | 79.28 | 2725 | |
| somewhat increased | 12.45 | 428 | |
| increased significantly | 0.09 | 3 | |
| Total | 100 | 3437 | |
| Classification | Percentage (%) | Number of Participants (#) |
|---|---|---|
| Radio-Frequency Identification (RFID) method | 11.14 | 383 |
| Exclusive containers only for food waste | 28.78 | 989 |
| Bag for food waste | 25.02 | 860 |
| Public food waste collection boxes (as in apartments or multi-household residence) | 29.44 | 1012 |
| Others | 5.62 | 193 |
| Total | 100 | 3437 |
| Classification | Percentage (%) | Number of Participants (#) |
|---|---|---|
| Leftover rice, side dishes, or soup scraps | 40.38 | 1388 |
| Pre-cooking stage (fruit peel and vegetable or fish dressing) | 54.52 | 1874 |
| Spoiled or old foods | 5.09 | 175 |
| Total | 100 | 3437 |
| Classification | No Effort at All (%) | Tend Not to Try (%) | Average (%) | Tend to Try (%) | Trying Very Hard (%) | Number of Participants (#) | |
|---|---|---|---|---|---|---|---|
| Gender | Female | 0.1 | 3.4 | 43.5 | 50.5 | 2.5 | 3017 |
| Male | 0.5 | 3.8 | 57.6 | 36.4 | 1.7 | 420 | |
| Age of household head | 30s or below | 0.3 | 2.1 | 49.3 | 46.3 | 2.0 | 607 |
| 40s | 0.00 | 3.6 | 41.8 | 53.0 | 1.6 | 862 | |
| 50s | 0.00 | 3.0 | 42.4 | 52.2 | 2.4 | 1009 | |
| 60s | 0.1 | 4.4 | 47.9 | 45.0 | 2.6 | 703 | |
| 70s | 1.2 | 4.7 | 51.2 | 37.1 | 5.9 | 256 | |
| Household size | 1 person | 0.4 | 4.8 | 55.5 | 36.6 | 2.7 | 768 |
| 2 persons | 0.2 | 3.7 | 46.6 | 46.7 | 2.7 | 1363 | |
| 3 persons | 0.0 | 2.2 | 37.6 | 58.7 | 1.5 | 726 | |
| 4 persons | 0.0 | 2.1 | 38.1 | 57.6 | 2.1 | 517 | |
| 5 persons or more | 0.0 | 3.2 | 38.1 | 54.0 | 4.8 | 63 | |
| Region | Seoul Metropolitan | 0.0 | 2.8 | 36.2 | 58.2 | 2.7 | 1031 |
| Chungcheong | 0.0 | 0.6 | 49.0 | 45.0 | 5.4 | 565 | |
| Honam | 0.0 | 4.9 | 45.0 | 47.7 | 2.4 | 557 | |
| Daekyung | 1.7 | 6.9 | 53.0 | 37.7 | 0.7 | 428 | |
| Dongnam | 0.0 | 2.6 | 52.7 | 43.8 | 0.9 | 635 | |
| Kangwon | 0.0 | 5.9 | 56.8 | 32.4 | 4.9 | 221 | |
| Total | 0.2 | 3.4 | 45.2 | 48.8 | 2.4 | 3437 | |
| Classification | Not Important at All (%) | Not Really Important (%) | Average (%) | Somewhat Important (%) | Really Important (%) | Number of Participants (#) | |
|---|---|---|---|---|---|---|---|
| Gender | Female | 0.0 | 0.9 | 34.7 | 58.5 | 5.9 | 3017 |
| Male | 0.0 | 0.7 | 45.0 | 49.8 | 4.5 | 420 | |
| Age of household head | 30s or below | 0.0 | 0.7 | 37.7 | 56.2 | 5.4 | 607 |
| 40s | 0.1 | 0.5 | 34.7 | 58.9 | 5.80 | 862 | |
| 50s | 0.0 | 1.0 | 33.2 | 59.6 | 6.2 | 1009 | |
| 60s | 0.0 | 1.1 | 37.2 | 56.2 | 5.4 | 703 | |
| 70s | 0.0 | 1.2 | 43.0 | 50.4 | 5.5 | 256 | |
| Household size | 1 person | 0.0 | 0.9 | 46.0 | 47.7 | 5.5 | 768 |
| 2 persons | 0.0 | 1.3 | 37.5 | 56.5 | 4.8 | 1363 | |
| 3 persons | 0.0 | 0.3 | 29.6 | 62.7 | 7.4 | 726 | |
| 4 persons | 0.2 | 0.6 | 26.7 | 66.0 | 6.6 | 517 | |
| 5 persons or more | 0.0 | 0.0 | 28.6 | 66.7 | 4.8 | 63 | |
| Total | 0.0 | 0.8 | 35.9 | 57.4 | 5.8 | 3437 | |
| Classification | Coefficient Estimate | Standard Error | |
|---|---|---|---|
| Demographic factors | Age | 0.0084 ** | 0.0043 |
| Number of household members | 0.2983 *** | 0.0472 | |
| Highest level of education | 0.2762 *** | 0.0663 | |
| Gender (male = 1) | −0.0956 | 0.1256 | |
| Single-person household | −0.9895 *** | 0.1419 | |
| Eup/Myeon area (rural) | −0.1195 | 0.1020 | |
| Housing: House-type | −0.0811 | 0.1201 | |
| Housing: Apartment | 0.0014 | 0.1173 | |
| Housing: Others | 1.7957 *** | 0.4665 | |
| Pattern of purchasing foods | Average amount of groceries purchased at a time | 0.0045 *** | 0.0011 |
| Grocery shopping cycle | −0.0857 | 0.0542 | |
| Volume-rate disposal system | Exclusive container | 0.0373 | 0.1401 |
| Volume-rate bag | −0.5201 *** | 0.1384 | |
| Public food waste collection box | −0.3463 *** | 0.1263 | |
| Others | −0.6148 ** | 0.2441 | |
| Estimation results | /cut1 | 2.1455 | |
| /cut2 | 4.6247 | ||
| /cut3 | 6.3187 | ||
| /cut4 | 8.3363 | ||
| # of sample | 3437 | ||
| LR ( | 457.7 *** | ||
| Pseudo | 0.0789 | ||
| Classification | Coefficient Estimate for Group 1 | Coefficient Estimate for Group 2 | |
|---|---|---|---|
| Demographic factors | Age | 0.0102 * | 0.0071 |
| Number of household members | 0.3541 *** | 0.2615 *** | |
| Highest level of education | 0.3405 *** | 0.2078 ** | |
| Gender (male = 1) | −0.1170 | −0.0337 | |
| Single-person household | −1.1393 *** | −0.8405 *** | |
| Eup/Myeon area (rural) | −0.3338 ** | 0.1440 | |
| Housing: House-type | −0.2593 | 0.1052 | |
| Housing: Apartment | −0.2393 | 0.2564 | |
| Housing: Others | 1.7730 *** | 1.6838 ** | |
| Pattern of purchasing foods | Average amount of groceries purchased at a time | 0.0035 ** | 0.0059 *** |
| Grocery shopping cycle | −0.0764 | −0.1088 | |
| Volume-rate disposal system | Exclusive container | 0.0802 | −0.0742 |
| Volume-rate bag | −0.4194 * | −0.6349 *** | |
| Public food waste collection box | −0.5350 *** | −0.2341 | |
| Others | 0.4851 | −0.7270 * | |
| Estimation results | /cut1 | 2.3512 | 1.9050 |
| /cut2 | 4.8377 | 4.3978 | |
| /cut3 | 7.3084 | 5.7111 | |
| /cut4 | 8.3021 | 8.4026 | |
| # of sample | 1678 | 1759 | |
| LR ( | 299.07 *** | 173.06 *** | |
| Pseudo | 0.1107 | 0.0563 | |
| Classification | Coefficient Estimate for Group 1 | Coefficient Estimate for Group 2 | |
|---|---|---|---|
| Demographic factors | Age | 0.0100 | 0.0069 |
| Number of household members | 0.2874 *** | 0.2957 *** | |
| Highest level of education | 0.3971 *** | 0.1913 ** | |
| Gender (male = 1) | −0.3839 ** | 0.0689 | |
| Single-person household | −1.1307 *** | −0.9140 *** | |
| Eup/Myeon area (rural) | −0.2695 | −0.0351 | |
| Housing: House-type | −0.3487 * | 0.0594 | |
| Housing: Apartment | −0.3198 | 0.1647 | |
| Housing: Others | 1.3749 ** | 2.0393 *** | |
| Pattern of purchasing foods | Average amount of groceries purchased at a time | 0.0020 | 0.0061 *** |
| Grocery shopping cycle | −0.0425 | −0.1166 * | |
| Volume-rate disposal system | Exclusive container | 0.2013 | −0.0329 |
| Volume-rate bag | −0.1000 | −0.6955 *** | |
| Public food waste collection box | −0.3422 | −0.3076 ** | |
| Others | −0.2736 | −0.6460 * | |
| Estimation results | /cut1 | 2.5743 | 1.8265 |
| /cut2 | 5.2097 | 4.2602 | |
| /cut3 | 9.1761 | 5.6787 | |
| /cut4 | - | 7.6770 | |
| # of sample | 1265 | 2172 | |
| LR ( | 196.32 *** | 265.18 *** | |
| Pseudo | 0.1041 | 0.0685 | |
Publisher’s Note: MDPI stays neutral with regard to jurisdictional claims in published maps and institutional affiliations. |
© 2020 by the authors. Licensee MDPI, Basel, Switzerland. This article is an open access article distributed under the terms and conditions of the Creative Commons Attribution (CC BY) license (http://creativecommons.org/licenses/by/4.0/).
Share and Cite
Kim, S.; Lee, S.H. Examining Household Food Waste Behaviors and the Determinants in Korea Using New Questions in a National Household Survey. Sustainability 2020, 12, 8484. https://doi.org/10.3390/su12208484
Kim S, Lee SH. Examining Household Food Waste Behaviors and the Determinants in Korea Using New Questions in a National Household Survey. Sustainability. 2020; 12(20):8484. https://doi.org/10.3390/su12208484
Chicago/Turabian StyleKim, Sanghyo, and Sang Hyeon Lee. 2020. "Examining Household Food Waste Behaviors and the Determinants in Korea Using New Questions in a National Household Survey" Sustainability 12, no. 20: 8484. https://doi.org/10.3390/su12208484
APA StyleKim, S., & Lee, S. H. (2020). Examining Household Food Waste Behaviors and the Determinants in Korea Using New Questions in a National Household Survey. Sustainability, 12(20), 8484. https://doi.org/10.3390/su12208484