Article

A City Capability Assessment Framework Focusing on Planning, Financing, and Implementing Sustainable Energy Projects

by
Niki-Artemis Spyridaki
1,
Nikos Kleanthis
1,
Dimitra Tzani
1,
Mia Dragović Matosović
2 and
Alexandros Flamos
1,*
1
Technoeconomics of Energy Systems laboratory (TEESlab), Department of Industrial Management and Technology, University of Piraeus, Karaoli & Dimitriou 80, 18534 Piraeus, Greece
2
Institute for European Energy and Climate Policy Stichtung (IEECP), Amsterdam Sloterdijk Teleport Towers Kingsfordweg 151, 1043GR Amsterdam, The Netherlands
*
Author to whom correspondence should be addressed.
Sustainability 2020, 12(20), 8447; https://doi.org/10.3390/su12208447
Submission received: 10 September 2020 / Revised: 6 October 2020 / Accepted: 6 October 2020 / Published: 14 October 2020

Abstract

:
Cities are critical actors in reducing global greenhouse gas (GHG) emissions; the level of knowledge, skills, and capacity, especially regarding innovative project planning such as sustainable energy (SE) projects, is fundamental for cities to meet their untapped potential. A range of indicator-based frameworks have been developed, focusing on general city economic competitiveness, yet these are often disconnected from the actual city operation and processes relevant to the investment cycle of SE projects. This paper proposes an integrated methodology for developing a City Capability Assessment Framework focusing on city planning, financing, and implementation capacity for SE projects. A principal component analysis (PCA) was applied to the results of a European city-survey to uncover areas highly relevant for the successful implementation of local SE projects. The insights gained aid policymakers to better understand implementation barriers, leading to the development of more effective actions and policy interventions towards the implementation of SE projects. The proposed framework can further enhance cities’ efforts with the implementation of local SE projects and guide potential investors to properly evaluate city capabilities and potential, when choosing local investment projects.

1. Introduction

The Paris Agreement at the 2015 United Nations Climate Change Conference (COP21) has essentialized actions and investments addressing climate change and leading towards a sustainable low-carbon future. Greenhouse gas (GHG) emissions’ mitigation has been the foremost priority of local governments over the last years [1]. Cities are critical actors in reducing global GHG emissions, with C40 (a network of the largest cities in the world, committed to addressing climate change) estimates setting the reduction potential to 8 Gt CO2 until 2050 [2]. However, cities are facing various sustainability challenges due to economic, social, and environmental factors [3]. Considering the post-pandemic economic challenges, it is essential for cities to build resilience to prepare and respond to sudden shocks [4,5] by planning holistically [6]. Towards this direction, cities should exploit integrated frameworks that combine sustainability and resilience indicators at the local level [7,8] and focus on investments that generate savings and have a beneficial side-effect on the health and wellbeing of their citizens.
Governments can lead the way in exploiting energy efficiency and clean energy technologies to create jobs and boost economies. Sustainable energy (SE) investments are a key part of stimulus packages offering many opportunities, through labour-intensive projects (e.g., public buildings, sustainable urban mobility plans, street lighting, etc.) that start quickly and are rooted in local supply chains such as construction and manufacturing [9]. In the realm of the Energy Union strategy, climate mitigation and adaptation are no longer side activities, since the “energy efficiency first” principle guides the Member States not to overlook energy efficiency when making long-term energy-related investments [10]. The majority of SE projects fit these criteria and, although the stimulus packages such as the EU Solidarity Fund for COVID-19 [11] are designed for the national level, adaptation and mitigation measures are mostly planned and executed locally. Thus, it will be important for cities to deploy comprehensive investment plans, which governments can upscale and support through the newly created stimulus packages.
However, investment levels in the EU have been generally low since the 2009 global crisis [12] and incapacity-related barriers pertain, which inhibits cities from reaching their untapped potential of productivity and sustainable growth. Existing needs assessment studies from large European city networks conclude that the financing of cities’ SE projects is hindered primarily by a lack of internal capacity to identify and implement innovative financing schemes and investment programs [13,14]. Other important barriers include the high cost of financing, lack of private-sector capital, and the issue of debt accounting in cities’ balance sheets. Simultaneously, a city’s competence in securing financing entails evidence of creditworthiness, transparency, the internal capacity to develop bankable projects, and established partnerships with the public and private sectors [15,16]. Development of skills for managing new knowledge created is an important component for cities towards sustainability [17,18]. Thus, the levels of knowledge, skills, and capacities are fundamental for cities, especially for sustainable project planning, financing, and implementation; new innovative financing mechanisms are available to finance sustainable projects, but specific knowledge and expertise is necessary for their identification and implementation [19].
For these reasons, this study intended to create a City Capability Assessment Framework focusing on the capacities of cities to finance and implement SE-related projects. The framework was first developed as a part of Horizon 2020 project PROSPECT–Peer Powered Cities and Regions [20], which enabled cities to learn from their peers how to implement SE measures through innovative financing instruments, and was intended to measure a city’s capability to attract investments, identify and utilize funding sources and set-up, implement, and monitor investment projects. The developed benchmark framework includes aspects that offer a more accurate portrayal of cities’ staffing conditions tailored to the requirements of implementing SE projects at the local level and it assesses at a higher level of detail than the other existing frameworks. An integrated methodology was adopted for the development of the benchmark framework based on principal component analysis (PCA). Apart from a detailed description of the requirements for implementing SE projects at the local level, the adopted approach allowed for their correlation with the progress of cities with implementing such projects. In developing this integrated approach, a city survey was conducted to identify which capacities are most relevant for cities. The adopted methodology was then tested empirically to arrive at a more robust assessment framework. Such an approach is useful in identifying the most capable cities with regards to SE investments at the local level as well as in guiding and monitor the needed improvement in resources and capacities at the local level. This study, therefore, provides clear guidelines on the development of a City Capability Assessment Framework based on PCA. It identifies, through an interpretation of the principal factors, the areas that should be emphasized at the local level when implementing SE and Climate Action Plans (SECAPs).

2. Background

Identifying underlying drivers of city (the term city used throughout this study is representative of, and the findings are replicable to, all local governance structures, including regions and municipalities) competitiveness has been a key pursuit of economic analyses. Different frameworks have been developed to identify and measure the impact of competitiveness factors that drive prosperity and productivity across cities [21]. The development of city capacity assessment frameworks is of great importance to ensure the appropriate formulation of future cohesion policy, since competitive cities tend to act as hubs for growth and innovation and are capable of spearheading climate change [19,22,23].
The Economist Intelligence Unit has conducted a study focusing on city competitiveness [24]; a Global City Competitiveness Index was developed to classify cities by their demonstrated ability to attract capital, businesses, talent, and visitors. Several other indices of city competitiveness have been developed, such as A.T. Kearney’s Global Cities Index which examines the current performance of cities based on 27 metrics spanning five dimensions (Table 1) [25]. The CityLab’s Global Economic Power Index, on the other hand, highlights three key dimensions of economic power: economic (economic output), innovation (patents), and financial. In the case of the Mori Memorial Foundation’s Global Power City Index, six main functions and five global actors, who led the urban activities in their cities, were examined: manager, researcher, artist, visitor, and resident [26]. The Index proposed by the Centre of Globalization and Strategy of IESE Business School provides a comprehensive set of indices through 10 fundamental dimensions, describing all aspects of local economic development [27].
What is common across most city competitiveness frameworks developed thus far is that these most often include quantitative indicators that do not consider important qualitative aspects [28]. Thus, it remains crucial to discover the complexity of the interrelations of the factors of competitiveness in specific cases to identify the critical factors of the economic competitiveness of cities. Emphasizing the qualitative aspects of city competitiveness and correlating different areas of city competitiveness was the gap intended to close when creating the PROSPECT benchmark.
Apart from assessments on cities’ general competitiveness and financial performance, other evaluations have highlighted financial and other performance aspects that characterize the state of resources, experience, and infrastructure concerning city-level SE-relevant projects and investments [29]. A study conducted by the European Federation of Agencies and Regions for Energy and the Environment [14] revealed that the implementation of innovative financing mechanisms is a pressing need in regional and local policies. The same study presented a plethora of innovative financing schemes and their main needs and barriers as well as the best practices to implement each scheme. Under the CASCADE project [30], a set of benchmarks has been created to assess the implementation of climate and energy policies in cities tailored for different sectors (e.g., renewables, public buildings, etc.). Five general types of key factors structured the evaluation benchmarks including local leadership and ambitions, local strategies and policies, organisational and managerial issues, stakeholder and citizen involvement, information, knowledge, awareness and financing, investments, and risks [31]. A City Capability Framework was also developed by Gibberd et al. [32] focusing on cities’ SE strategies and procedures and establishing links between sustainability targets, indicators, and planning and implementation processes.
Similarly, Campillo et al. [33] developed a Technology Capacity Assessment Tool for developing City Action Plans, which aimed at establishing the technological capacity and energy efficiency performance of the measured cities in the context of energy efficiency. To establish a baseline—the level of relevance of each key field on energy efficiency improvement for their cities—a general survey was sent out to different city representatives. Finally, the recently published Municipality Infrastructure Investment Module of the European Investment Bank (EIB) Investment Survey [34] bears great resemblance to the evaluation purposes presented here. The survey gathered information from key decision-makers in local municipalities on local infrastructure performance and needs regarding investment-related activities, priorities, gaps, efficiency, drivers, barriers, and finance.

3. Materials and Methods

3.1. Process for Developing a City’s Capacity Assessment Framework

To explore whether cities’ general investment conditions or capacity-relevant features help to explain the variation behind cities’ progress with financing and implementing SE projects, a City Capability Assessment Framework was created. The focus was on the financing and implementation processes and availability of personnel for working on SE projects, such as projects from SECAPs and similar plans. To develop the benchmark, cities’ general competitiveness and financial performance was assessed, including organizational and other performance aspects that characterize the state of a city’s resources, experience, and infrastructure. The process of developing the City Capability Assessment Framework is illustrated in Figure 1.
The first step was to choose which capacities to measure through a wide review of the literature combined with the findings of a preliminary needs assessment analysis of cities participating in the project. In addition to the review of related works, the PROSPECT needs assessment survey [13] proved to be invaluable in verifying the importance of the selected capacities, as cities reported on their perceived strengths, weaknesses, and barriers within the SE investments’ context. Using this source, the less important capacities were eliminated, and new ones were introduced, ensuring that the selected ones represent real-world situations as much as possible.
Next, to measure the selected capacities and characteristics of cities, a Likert scale was developed for each of the measured capacities so that the assessment can occur in a semi-quantitative manner. The open-source LimeSurvey software was used to populate the assessment framework and enable an online data-collection process. A pilot survey for representatives of five cities preceded the wider survey. Feedback from the pilot application of the benchmark was used to verify and improve the capacity selection and the related ratings, ensuring that the selected capacities are all relevant, that no relevant capacities were left out, that the scale enables accurate measurement of the participating parties’ situation, and that the benchmark is understandable and user-friendly. Finally, the online survey was conducted for cities across Europe that were interested to implement SE projects. The survey targeted city representatives specifically involved in city departments relevant to investment and/or SE planning. The final step in developing a comprehensive benchmark assessment framework involved conducting a PCA to examine the interrelations between indicators and to enable a more accurate evaluation. These steps are described in more detail in the following subsections.

3.2. Assessment of Capacities: General Principles and Aim

Assessing capacities is an important analytical step that precedes any other step of the assessment procedure. It is useful in several ways: from supporting policy dialogue and strategy formulation to enhancing monitoring and evaluation by improving capacity development [35,36]. The term “capacity assessment” is used in the literature to describe and assess the existing capacity of an individual or collective entity to perform and deliver specific action and measure the existing ability and know-how. Depending on the context of the problem and the resources available, a capacity assessment can be conducted at one or more levels; organizational, sectoral, or individual. Regardless of the assessment level, a capacity assessment should account for the interrelationships of capacity issues between the targeted level(s) and the enabling context. Capacity assessment at a municipal level can be described as a test of the adequacy of people, rules, resources, and knowledge for the supply of infrastructural services for the targeted audience. To measure municipal capacity, the selection and design of measurement tools and indicators should adhere to the following principles: (i) clarity of purpose, (ii) nature of information required and choice of data collection method, and (iii) overall management of the assessment process [37,38].
The approach for the development of the PROSPECT benchmark has adopted these principles in the following ways:
  • Clarity of purpose. The selected measurement means aimed to determine and evaluate the different capacities that best describe the ability of municipalities and regions to secure sustainable financing for energy and climate-related projects.
  • Nature of information required and choice of the data collection method. In the PROSPECT assessment framework, well-conceived and targeted survey questions were complemented by indicators to reduce information overload. Examples of evidence were provided for each field of assessment to facilitate the completion of the survey as well as offer participant cities a collection of best-case practices and real-world illustrations on how similar issues are being handled in other city-contexts.
  • Overall management of the assessment process. Online survey-tool and indicators were developed to manage the assessment process. These were combined with information and example cases to guide good judgment and self-evaluation.
A variety of sources was considered throughout the benchmark development to create a measuring structure as well as to identify the most important capacities for measurement:
  • Review of relevant works to reach an initial framework structure and identify the most important capacities that affect city capability.
  • Utilization of the information provided by the PROSPECT needs assessment survey to refine and improve the created benchmark, making it more applicable to real-world situations.
  • Utilization of user feedback gathered from its application within PROSPECT learning cycles to update and enhance benchmark ease of use and improve its applicability.
The assessment means used to evaluate capacities were based on a process defined in the United Nations Development Programme (UNDP) Capacity Assessment Methodology, which entails defining the capacities to measure, the desired future capacity levels, and finally the assessment of the existing capacities. The selected capacities can also be viewed as city “success factors,” in the sense that cities with well-developed capacities are more likely to succeed in securing financing for SE projects, often encountering fewer hindrances or enjoying greater success in their implementation. Similarly, the measured capacities also represent major barriers that cities typically encounter with such projects. For the identification process, of much greater use was to consider them as probable barriers, as the literature sources that focus on barriers are much more extensive than those focusing on success factors.
Accordingly, a Likert scale was developed for each of the measured capacities. For example, a rating of “5” defined the most favourable envisaged situation, meaning that cities have the highest level for the respective capacity measurement. At the other end of the scale, a rating of “1” defined the least-capable situation, meaning cities that score “1” are considered to be at an early/premature stage with regards to the related capacity. To improve the targeted cities’ ability to correctly understand the scale and specific questions, both real-world and envisaged situations were provided within the benchmark survey as a supplement to the questions and the ratings. Finally, to retain the ability to evaluate the answers, the targeted cities were also required to fill in a “justification” field, where they provided information and evidence to justify for their ratings.

3.3. Overview of the Initial Assessment Framework: Structure and Assessment Axes

The most important part of the benchmark’s creation was selecting which capacities to measure. The results from PROSPECT needs assessment survey [13] were used for elimination of less important capacities and new ones were introduced, ensuring they represent the real-world situation as possible in gauging the selected cities’ capacities.
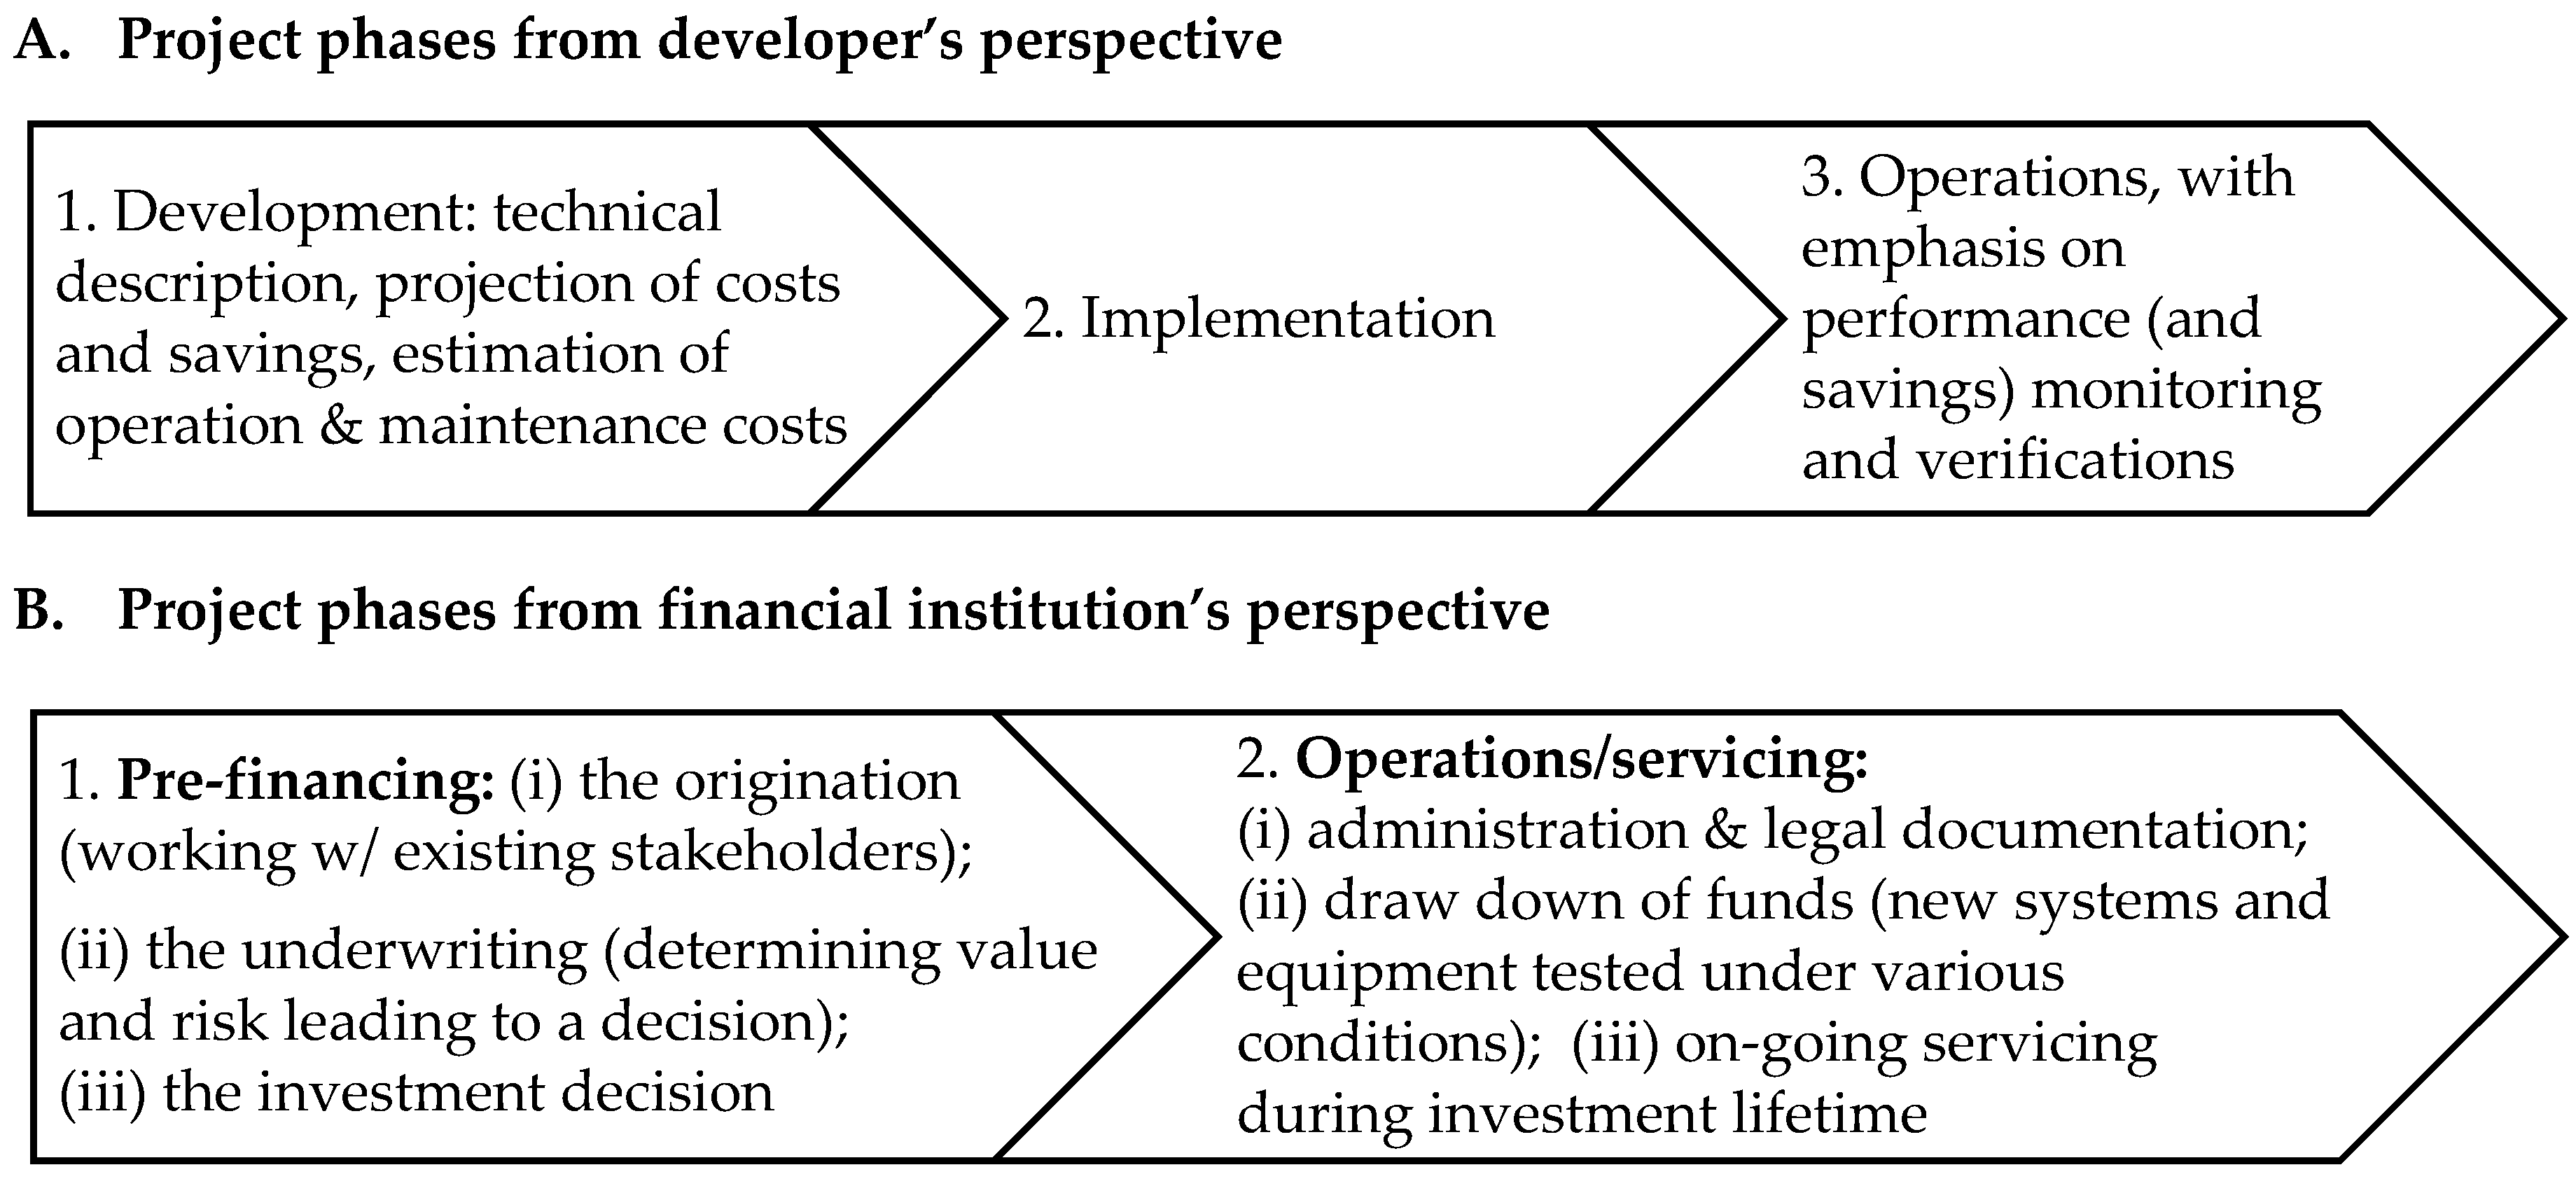
The selected categories and sub-categories of capacities reflect all key steps in an investment energy project life cycle (Figure 2) from both a developer’s [39] and financial institutions’ perspective [40]. As both perspectives recognise that good planning is the basis for successful project implementation, the accent was given to the development stage; 29 out of 34 questions in the PROSPECT benchmark ask city representatives to reflect on city’s general capacity to identify and utilize financing options and to implement SE projects.
Ideally, investors and lenders aim for an arrangement, which, according to Dentons [41], succeeds in: (i) allocating the risks to the most capable party for handling them, (ii) providing ways to measure the project’s performance, and (iii) providing some monetary safeguards to protect investors and lenders. The adopted structure for categorizing measured capacities follows a typical investment project development process: attracting prospective investors, identifying investment projects and utilizing potential financing options, and finally implementing and monitoring the selected investment projects (Table 2). The assessment benchmark was therefore structured along the following three axes:
Axis 1.
Attracting Investments
Axis 2.
Identifying and utilizing financing options
Axis 3.
Setting up, implementing, and monitoring the financing of SECAP or other SE projects
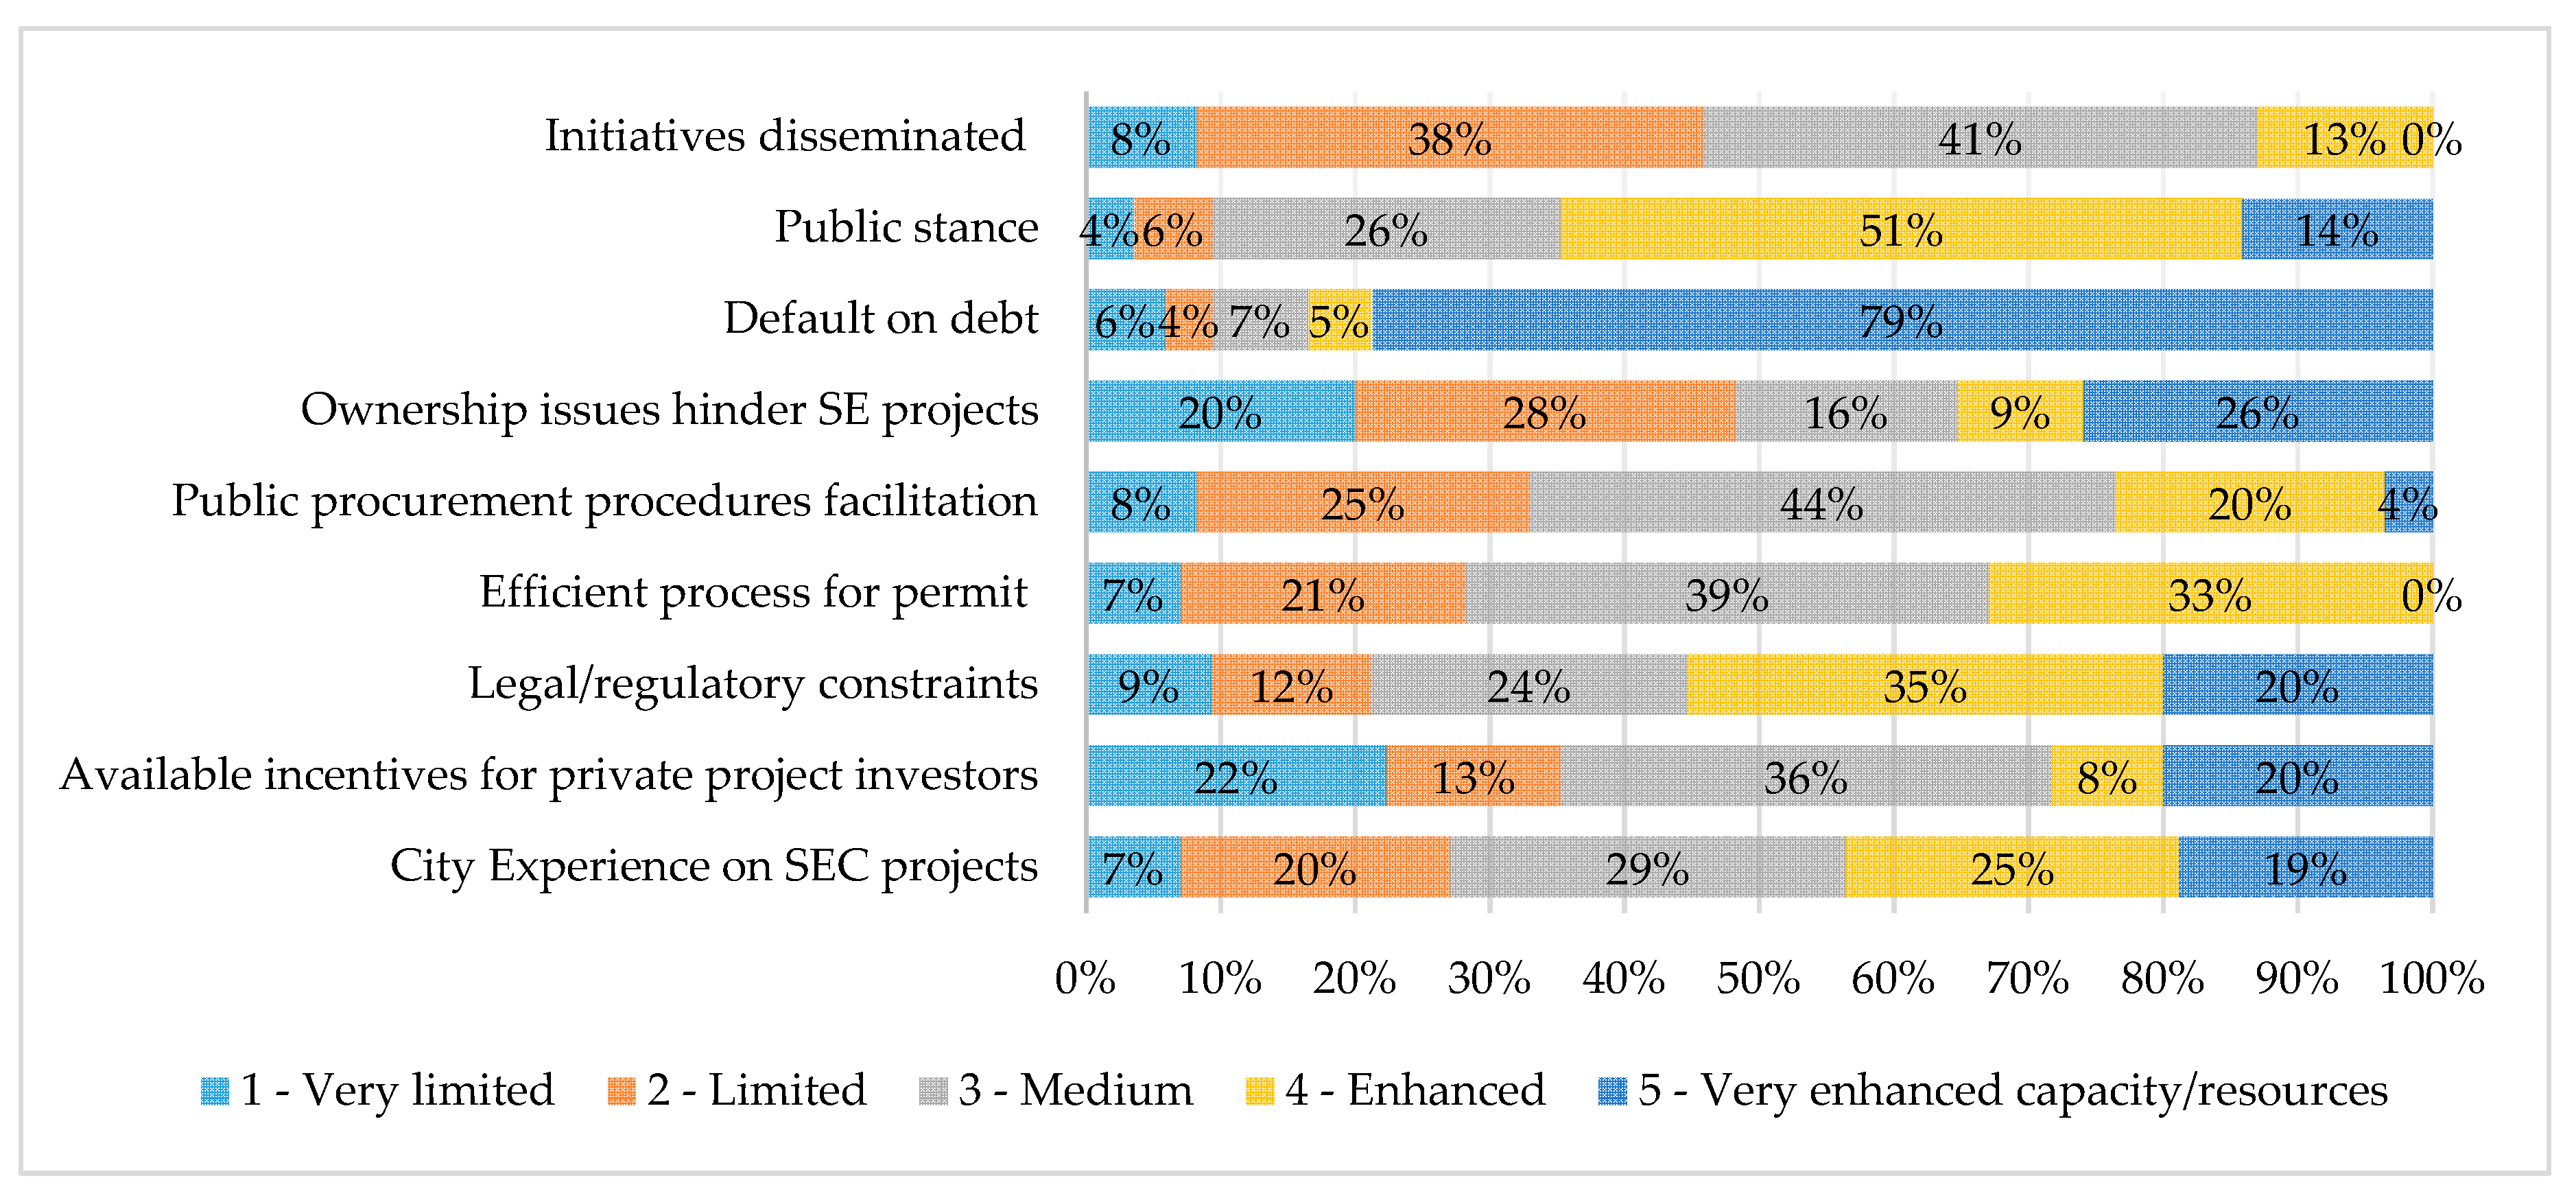
The most important aspects regarding the first axis on attracting investments were found to relate to the political and economic environment [44]. Specifically, the absence of a local strategy and its assorted commitments creates an obstacle as prospective investors perceive a vague political environment with regards to SE policy, in which mechanisms to reduce investment uncertainties (such as risk mitigation measures, guarantees, and incentives) are absent [46]. Moreover, such an environment can create a situation where the legal framework related to SE investments is inefficient, and thus public procurement, permit acquisition, and ownership issues pose insurmountable challenges in the implementation of related investments [42]. A city’s ability to attract investments is also dependent on its economic strength. Economically weak cities are often unable to acquire funding or find the capital too costly. Especially important is a city’s creditworthiness, which is affected mainly by its GDP, revenues, debt, and history of defaults. The economic situation of the citizens is also illustrative, as several innovative funding mechanisms depend on small-scale private initiatives [56]. Thus, the taxation rate, population, and per-capita GDP can also affect a city’s capacity for SE investments [24]. To leverage private initiative, the public stance on SE investments is of great importance, thus effective dissemination can be crucial. It can help inform prospective investors about new investment opportunities and increasing their propensity to invest. In addition, information exchange also promotes cross-city cooperation, ideally creating a situation where cities disseminate best practices and experiences, thus progressively improving their effectiveness and policies [31].
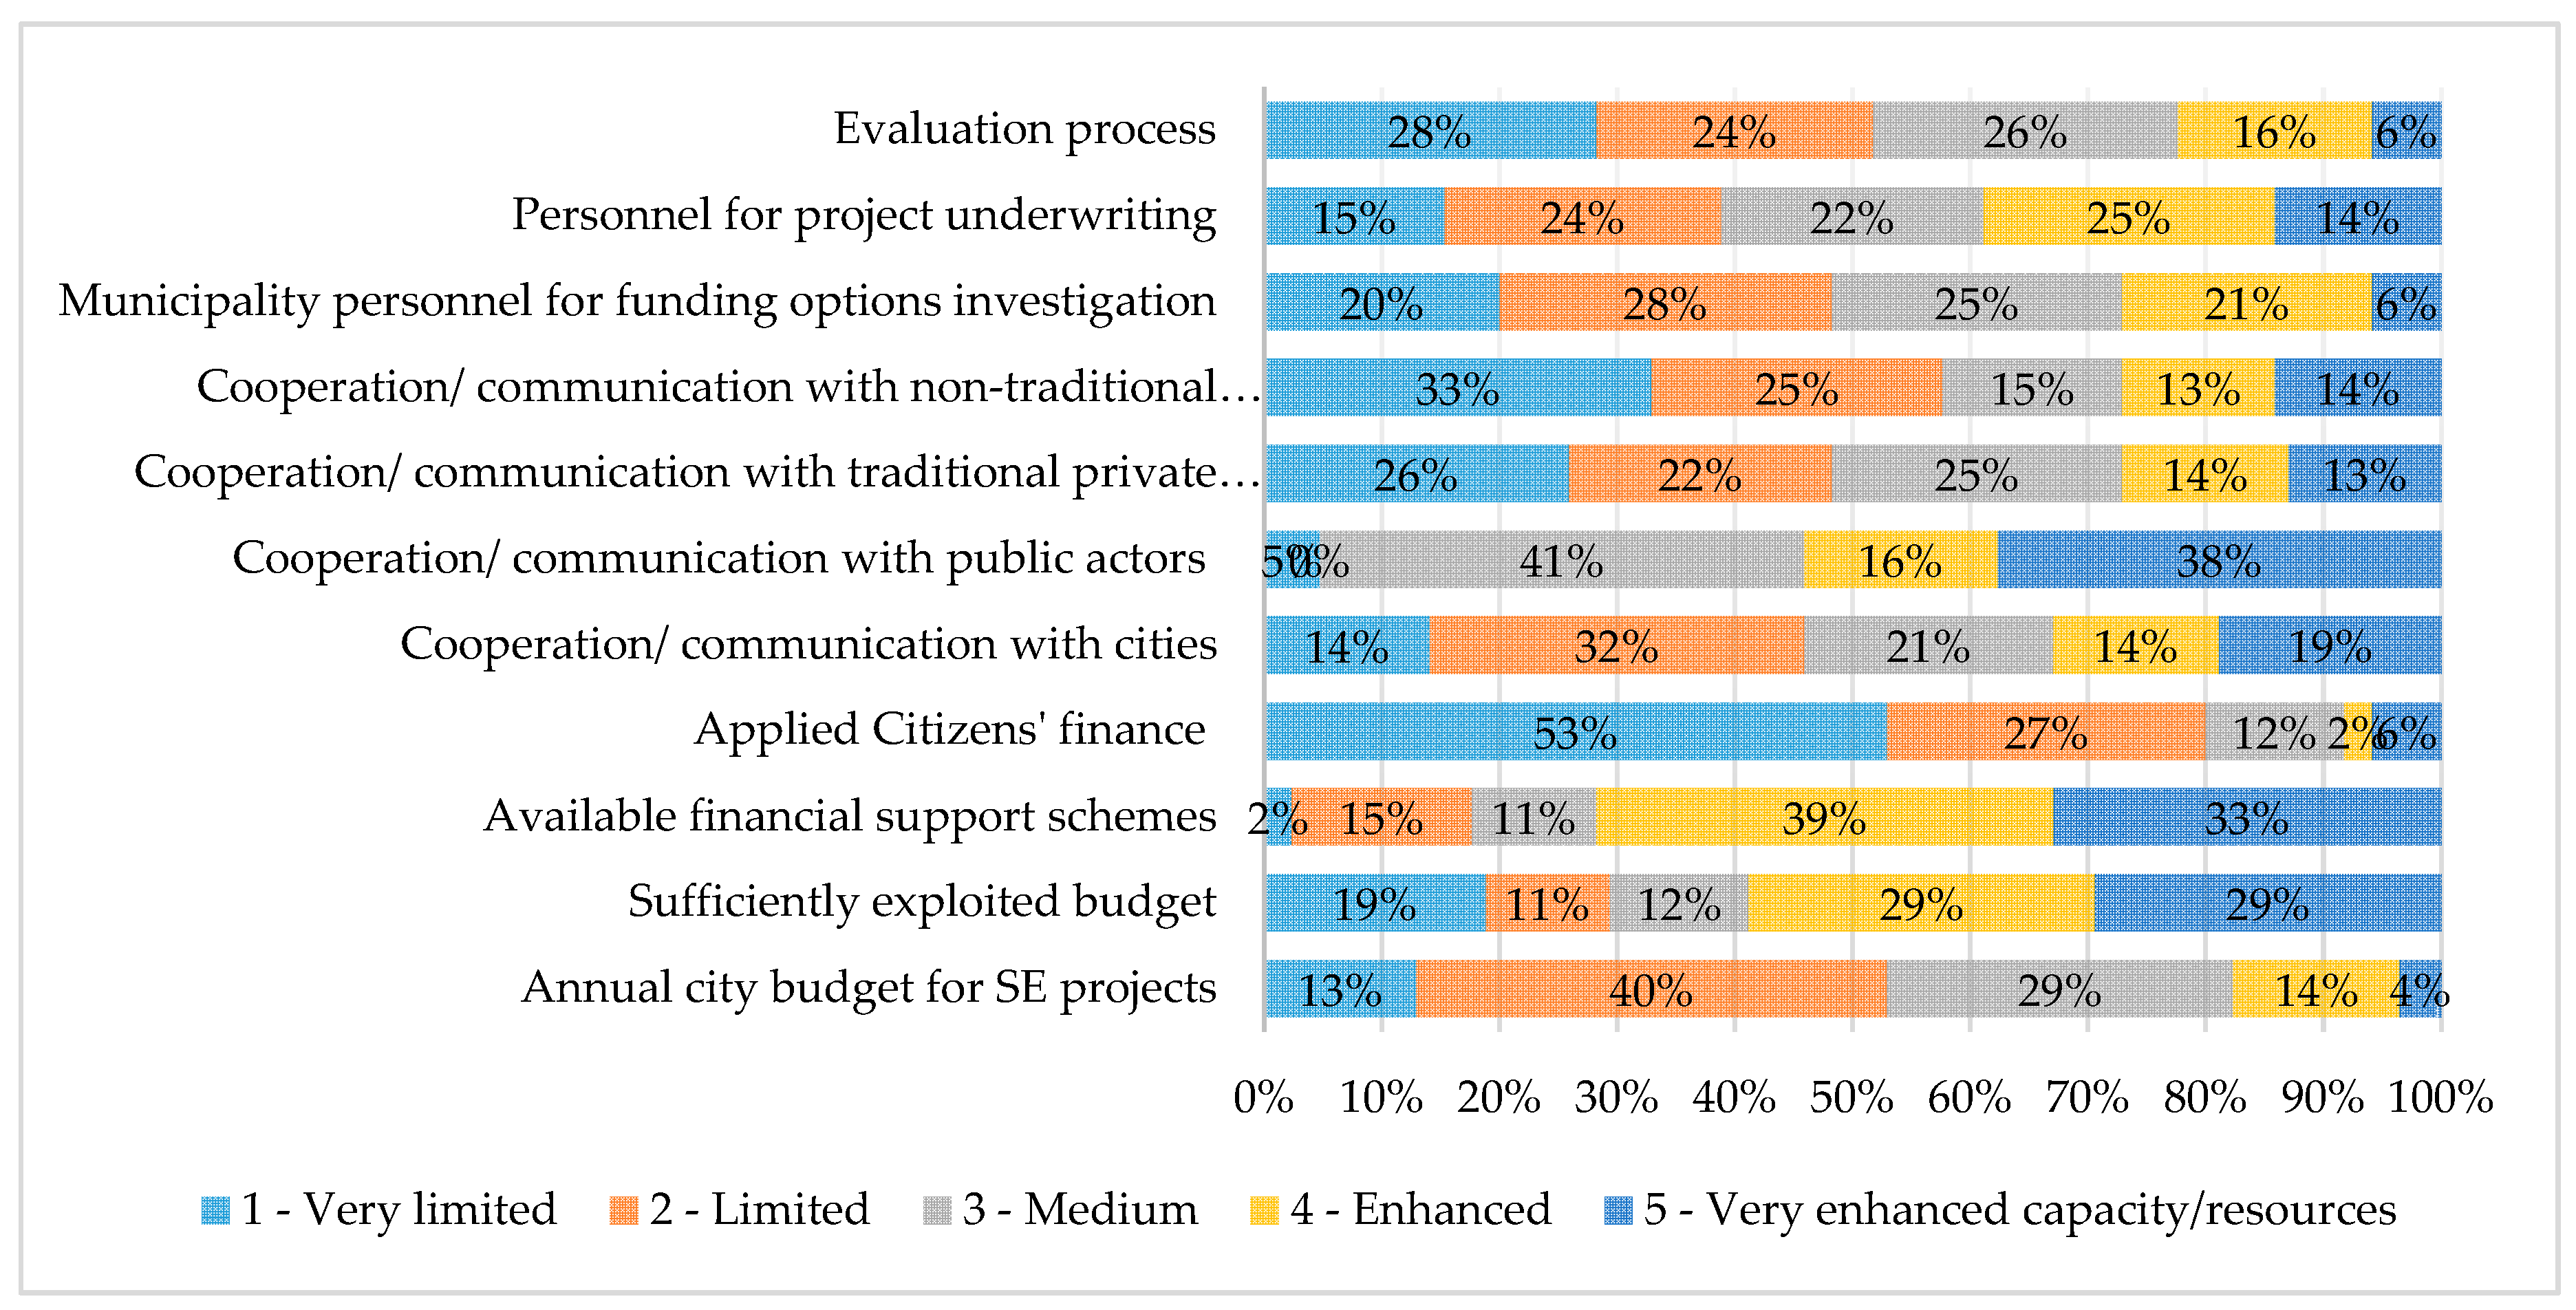
The second axis captured the ability of a city to determine the availability and utilization of financing sources (including own- and third-party funding) as well as the city’s relationships with relevant actors to ensure funding for SE-related projects. For a city’s origination team and project developers, it is important to explore what sources of financing SE projects are available and applicable in the city-territory, in what timeframe, planned or already used (and how often) to exploit the most sufficient financial support schemes for the examined city [39]. The cooperation among cities may also improve the efficiency of municipal services and promote the exchange of skills, investment services, etc. Additionally, communication with public (e.g., ministries and other governmental bodies) and private actors through joint projects (not necessarily SE-related) or training workshops may prove beneficial in terms of capacity enhancement and facilitate the processes of implementing a SE-related project. Apart from the resource utilization, this particular axis investigated the city capacity in terms of municipal services and personnel. The proper identification and selection of a project is a time consuming and demanding process and depends to a great extent on the existence of trained personnel with a background in project underwriting and evaluation [42].
Finally, the third axis explored the city’s general administration capacity and monitoring ability concerning investment projects. The project administration function assists project managers and teams by providing a framework for them to operate within. The framework typically includes processes, standards, coaching/education, and usually employs experienced project practitioners, who have a thorough understanding of the way projects should be administrated. The existence of dedicated personnel, which supports project administration and monitoring procedures, ensures good project outcomes and improves the effectiveness of investments [53]. Each municipality should have the ability to employ or train permanent/temporary personnel to ensure that projects run in compliance with specific requirements, to maintain and integrate project plans, and to track and report the overall progress. To ensure monitoring, standardization, and quality assurance, verification procedures and specific operational standards should be established and implemented [57]. This axis also intended to investigate the operational standards and/or quality assurance methods currently used by cities. This will provide evidence on the management-capacity of SE projects as well as other general investment plans by cities and whether monitoring procedures are in place, according to engineering standards and technical specifications.

3.4. Applying Descriptive Statistics and the PCA

An integral part of the proposed assessment framework was determining whether the selected capacities are interrelated. To avoid bias, due to information overlap, in the use of the proposed benchmark, a PCA was applied to the city-survey evaluation results as a final step. The concept is predicated on the applicability of PCA not only to remove information overlap among indicators, but also to rank the comprehensively evaluated PCA scores via a multi-dimensional analysis [33,58].
CatPCA is a variation of the PCA, used as a dimension reduction technique for categorical variables. It applies algebraic principles to reduce the number of explanatory (dependent) variables to a smaller number of principal components, which contain the most information i.e., the largest portion of variance [59]. In CatPCA, ordinal categorical data are transformed into quantitative data through optimal scaling. The main objective of this method is to extract the most important information from the data by compressing their size while simplifying and analysing the sample [60].
The survey included capacities that were operationalized as both interval and ordinal. Out of the selected 34 capacities of the assessment framework, nine were interval and 25 were ordinal. First, the outlier values of the interval capacities were eliminated, as they bias the mean, inflate standard deviation (SD) and thus can affect the accuracy of the model [61]. Outliers were mainly found in the “GDP per capita,” “Nominal bank lending rate,” and “Population” capacities due to the different economic and population-based characteristics of the cities. Next, the interval capacities were converted into ordinal through a classification of their values into bins.
After the dataset has been prepared, the statistical package SPSS 25 was used to perform the analysis. The main steps that were followed to conduct the CatPCA included reliability, correlation, and multicollinearity testing of the sample, selection of the rotation method, deciding on the number of components’ number based on criteria and export and interpretation of results (Figure 3) [62,63]. For the reliability testing, the sample’s Chronbach’s α (alpha) was calculated equalling 0.8235, which is above the 0.7 threshold set in the literature, proving the reliability of the sample’s scale [61]. The Kaiser-Meyer-Olkin (KMO) Measure of Sampling Adequacy was found to check whether the sample size is satisfactory. When the KMO is higher than 0.5, then the sample is considered sufficient [64]. For the city sample, the KMO equals 0.596. The Bartlett’s test of sphericity was used as a means of testing the correlation among the sample’s capacities. If this test results in a value lower than 0.05, then no patterned relationships exist among the sample’s capacities [65]. For our city sample, the value of the Bartlett’s test of sphericity was estimated at satisfactory low levels and equal to 0.000. Multicollinearity was tested through the determinant of the correlation matrix and was estimated at 0.0000124 (i.e., higher than 0.00001) suggesting that multicollinearity is not an issue within the sample [61].
The numerical transformed values derived from the CatPCA were used as input for a PCA by selecting the rotation method needed. Rotation methods are used to achieve a simple structure of the sample’s results [66]. Two kinds of these methods are available in SPSS 25; (i) orthogonal, which assumes that the components are uncorrelated and (ii) oblique, which assumes that they are correlated [67,68]. Theoretically, the components are expected to be uncorrelated, but this is sometimes not the case on an empirical level [69]. Regarding the city sample, both orthogonal and oblique rotation methods were used to further justify the lack of correlation among the components [67], with both methods giving identical results; thus, the components were uncorrelated.
The first criterion used for the choice of components’ number was the scree plot, which is created by plotting the eigenvalues of the components and is used to see if there is an “elbow” point, i.e., a point with a sudden change in the slope of the graph [60]. According to this criterion, only the components before the “elbow” are kept and the rest are discarded [60]. The second criterion used was the Kaiser criterion, according to which, only components with eigenvalues greater than one are kept [67]. The rest of the criteria used are the variance explained by the principal components, which should be 60–70% of the total variance, the communalities values, which should not be relatively low, the component loadings, which should be above a preselected cut-off point, and the interpretability of the components [64].

4. Results

4.1. The City Sample

The sample includes survey results from 84 representatives of cities, which are signatories of the Covenant of Mayors (CoM). The surveyors either had previous experience in SE projects as project managers or hold sustainable-related positions in the respective city and they were asked to provide information on the conditions and capacity of their city regarding the progress and implementation of SE projects within the city premises. Cities under the CoM have SECAPs that cover administrative areas with populations ranging from a few hundred to several million [70]. The represented cities also have a variety of market and financial conditions, different experience levels in SECAP-related investments, and wide-ranging populations. The cities’ mean population equals to 461,009 citizens, whereas the population’s standard deviation amounts to 1,244,969 citizens. Judging by the variation of the cities’ scores, the sample is representative of the varying financing conditions that cities across different EU Member States face. This can also be concluded by looking at the cities’ market conditions imprinted in the interval capacities, such as GDP per capita, nominal bank lending rate, taxation rates, unemployment rate, etc., as shown in Table 3.
The ratings for the 25 ordinal capacities included in the assessment framework were based on a four and five-point scale assessment that spans from “1” indicating limited capacity or resources to “4” or “5” representing sufficient resources. For instance, when cities were asked whether there are legal or regulatory constraints preventing the utilization of private financing for city-level investments, possible ratings ranged from “1,” which denoted that there are prohibitive legal constraints, to a rating of “5,” which signified that there are no legal constraints and that the existing legislation fully supports all third party financing methods.
When observing the ordinal capacities from the first axis—attracting investments (Figure 4)—it becomes evident that 73% of the cities which participated in the survey are either somewhat or extensively experienced with the implementation of SECAP related projects, while 54% reported frequent dissemination activities for SE-related initiatives. Seventy-nine percent of the cities presented no defaults on debt and 55% faced no serious legal or regulatory constraints. Moreover, 65% of the public exhibited no negative reactions or even expressed a positive stance towards SECAP related projects. Seventy-two percent of cities reported the permit acquisition processes for sustainable project construction works are either somewhat efficient or straightforward and efficient. By contrast, ownership issues appeared as either a major obstacle or somewhat of a hindrance for 64% of the cities, public procurement procedures lacked a clear regulatory framework for 33% of the respondents and the incentives for private investors at the city-level are non-existent for 35% and limited for an additional 36% of cities.
Considering the second axis—identifying and utilizing financing options (Figure 5)—it can be concluded that most cities are able to finance their SE projects through public funds and have efficient cooperation with different actors; 72% of cities reported to be either good or sufficient in utilising available financial support schemes, and around half of the cities also demonstrated successful cooperation with public actors, other cities as well as traditional and non-traditional private investors. Furthermore, 58% of cities exploited most or all of their budget for sustainable projects, even though only 18% of them reported a sufficient annual budget for SECAP projects (i.e., equal or above 10% of the total city budget). Even though the public stance was promising, only eight percent reported instances of applied citizens’ finance. However, this could easily change if innovative financing schemes such as crowdfunding and cooperative schemes were to be propelled. Regarding city personnel, around half of cities lack the personnel for project underwriting, for investigating funding alternatives, and for the project selection and prioritization process. The latter category is scored high in cities that show greater success in implementing SE projects, signifying the importance of people available to prioritize projects.
Figure 6 portrays answers related to the third axis–cities’ capacity regarding setting up, implementing, and monitoring the financing of SECAP or other SE projects. Fifty-one percent of the cities have instituted their own monitoring and evaluation (M&V) procedures and 41% reported they follow operational standards established by the legislation. Although most cities did not provide adequate training schemes for their personnel, 67% of cities reported being able to employ or train the personnel needed to support project underwriting. Finally, personnel for administration, coordination, and monitoring appears sufficient for the needs of 37% of the sample cities.

4.2. PCA Results and the Final Benchmark Framework

Component loadings indicate a correlation between the variables (i.e., capacities) and the components [71]. A cut-off point was set to decide which component loadings were acceptable for the export and interpretation of the results. In a sample with around 85 observations, component loadings with values less than 0.6 in absolute value are considered unreliable and they should be excluded [72]. Hence, in this analysis, a cut-off point with an absolute value of 0.6 was set.
Regarding the dataset that was inserted in SPSS, four capacities (i.e., “City GDP growth rate,” “Annual city expenditure,” “Annual city revenues,” and “Value of city debt”) were not included due to the cities’ missing values in these capacities. Notably, 20 out of the 30 capacities were above the cut-off point. The high pass rate supports the initial selection of the data analysis variables. Considering the representation of each axis, axis 1 “Attracting Investments” contributes to the component structure with eight out of 14 capacities (57%), “Identifying and utilizing financing options” with eight out of 11 capacities (72%) and “Setting-up, implementing, and monitoring the financing of SECAP or other SE projects” with four out of five capacities (80%).
Moreover, from the PCA model summary (Table 4), it is evident that the five extracted components explain 65.92% of the sample’s variance. This percentage is among the acceptable limits of the variance explained by components criterion (60–70%) [71,72]. The components’ eigenvalues also satisfy the Kaiser criterion. The final selection of the number of components was mostly based on the component loadings of the extracted components in comparison to the cut-off point. The components after the fifth one lacked high enough component loadings to be considered important enough to be included in the final set of components. Based on the proposed criteria for the selection of the components’ number, a total of five components was selected.
After exporting the results, the capacities were ranked according to their component loadings and classified regarding their conceptual characteristics. The next step was to interpret and label each component. The labelling of the classification is based on the capacities with the highest component loadings among the components [72]; accordingly, the first component represents the city’s personnel availability and capacity, the second one reflects the city’s communication and dissemination capacity, the third one consists of the city’s market conditions, the fourth component refers to the citizens’ stance and finance, and the fifth to the city’s regulatory conditions. Specifically, the first component comprises capacities related to the project origination and the project underwriting and evaluation categories, the second component is composed of capacities related to public stance and project origination capacity categories, and the third includes capacities regarding mainly the economic situation category. The fourth component consists of capacities associated with the public stance and the project origination categories and the fifth component reflects the legislative and regulatory situation category.
The last column shows the communalities values (h2), which present the percentage of variance for each variable explained by the components [73]. Typical values for communalities are between 0.4 and 0.7 [64]. It can be observed that the capacities’ communalities are adequately high (i.e., most are above 0.8) for a real data analysis [67], which confirms that the components of the analysis represent a high percentage of the capacities’ variance. Loadings can either have a positive or negative sign. For instance, the variable “Unemployment Rate” has a negative sign, which means that it is negatively associated with the “City’s market conditions” component. Moreover, the variable “Ability to employ/train personnel to support project underwriting” had a cross-loading, i.e., it had component loadings in multiple components [72]. In this case, due to the variable’s higher relation to the first component, the respective loading was kept and the other one was removed.
For each one of the five components, the capacities with the higher loadings in the same column are the most important ones, since these capacities are related to the component’s percentage of explained variance [73]. These capacities appear to have a closer relationship with the components that they are correlated with [71]. Therefore, capacities such as “Available personnel training schemes” and “Personnel for project underwriting” play the most significant role in cities’ personnel availability and capacity, since they are correlated to the first component on a higher level than the rest of its capacities. However, it should be noted that all capacities presented in Table 5 should be taken under consideration when assessing cities’ attractiveness and capacity with regards to the implementation of SE-related projects, since all their component loadings were above the cut-off point.
Moreover, capacities with relatively high communalities are being accounted for fairly well in the analysis [73], since the higher the communalities, the better the components explain the original data [61]. This means that the loadings of these capacities have been efficiently described and thus conclusions from the given values can be deduced. In other words, the high communalities of the capacities shown in Table 5 demonstrate that the analysis captured efficiently their variation and that the recorded component loadings can be interpreted sufficiently. For instance, there is clear insight for the importance of the “Nominal bank lending rate” for a city’s market conditions, as this capacity has a communality of 0.92 and a loading of 0.795. Finally, some critical factors, i.e., the principal components, which explain cities’ progress with regards to their SECAPs implementation, can be suggested. The importance of these factors is based on the percentage of variance explained by each component. A city’s personnel availability and capacity and city’s communication and dissemination capacity can be considered as the most crucial success factors for SECAP implementation. Notably, the market conditions of a city seem to be of relatively lower significance in explaining the level of SECAP implementation in comparison to the city’s staffing adequacy. Citizens’ stance and finance also have a role to play, while the regulatory conditions present the lowest share in explaining the observed variance with regards to the level of SECAP implementation.

5. Discussion and Implications

Understanding which capacities to primarily invest in is important for cities, as their resources and available budget are often constrained, thus a prioritization of the key functionalities would benefit the strategic planning at the city level. Awareness of which capacities bear the greatest returns can further strengthen cities’ efforts with the implementation of local SE projects. Investors and development banks would also benefit from being able to recognize which conditions in the city to evaluate when having to select future city-level investments. Developing city stakeholder’s awareness could lead to active behaviour and make cities more climate-resilient [74,75].
The most important competences for SE project development and implementation at the city level are availability of training schemes, personnel for project underwriting, personnel for administration/coordination, and personnel for funding options investigation. Specifically, the importance lies not only in personnel availability and technical capacity, but rather in whether there are dedicated resources allocated for the available personnel to investigate new projects and whether the personnel is trained in innovative project financing. This confirms, and further specifies, existing findings underlying the importance of human capital for smart cities [76]. Cities should establish training schemes to create personnel capable of investigating and applying innovative financing. Each city would benefit from specialized departments for financing, implementation, underwriting, and monitoring of projects, as well as from having technical experts, especially when it comes to innovative projects, such as SE projects. Alternatively, where this is not feasible, significant support should be provided by state governments in the form of project development assistance and primarily by enhancing cooperation with other innovative market actors (e.g., by establishing a Super-ESCO facility).
Regardless of less favourable financial and market conditions, some examples of cities thriving were observed. This implies that, although the performed analysis demonstrated that the area that cities should focus the most is their personnel, cities of any size and circumstances can thrive if efforts are focused on strengths other than additional employment. For example, cities could make use of existing innovative financing models such as energy performance contracting or citizen financing. Such instruments usually entail a strategic partnership between the city and an energy agency, an energy service company (ESCO), or a crowdfunding organisation encouraging citizen investment in sustainable projects. Developing aforementioned partnerships allows the city to tap into the pool of expertise and innovation which might otherwise be too expensive to have in the form of additional trained personnel. This is also confirmed through the results of the performed PCA highlighting that cooperation with other cities and both traditional and non-traditional private actors are among the most important capacities. Essentially, cities can overcome their lack of internal capacities through outsourcing and strengthening their ties with private actors and other cities, which have already implemented similar sustainable projects not only at the regional level, but also at the interregional level [77].
The latter conclusion is backed by additional major obstacles against the identification and implementation of SE projects identified in this research—weak communication and cooperation between cities and private actors, both traditional and non-traditional, and the lack of adequate dissemination activities. As mentioned above, to overcome these barriers, cooperation between cities and other local stakeholders such as citizens, businesses (commerce and industry), academia, educational institutions, energy agencies, cooperatives, or ESCOs should be established. This can be achieved through stakeholder engagement events, collaborative workshops, and educational/informational activities. In this context, a variety of properly structured dissemination actions should target specific public or private actors and other cities.
The fourth component also recognized the role of public stance and applied citizens’ finance in implementing SE-related projects at the city level. Even though public stance is positive regarding SECAP implementation, citizens’ finance is not quite common amongst cities with only eight percent of them applying crowdfunding or cooperative financing. The development of new business models and alternative sources of funding at city-level—such as cooperatives, energy communities, and crowd-funding platforms—is necessary to overcome financial barriers. Once a platform for social innovations is established, citizens can individually play an active role in overcoming financing barriers [78]. The experiences of cities which participated in PROSPECT survey suggest that smaller cities are especially interested in crowdfunding, as they have less administrative barriers and the community sense of belonging is larger than in big cities. Although research confirms the finding that citizen participation models are in their early phase of development, an advanced understanding of preconditions that enable successful innovative partnerships, including citizen participation, exists [79].
The regulatory/legal framework for cities across the EU has also escalated in the recent years, including the revision of the Energy Efficiency Directive in 2018, and in 2019 the Clean Energy for All package [80] and an obligation to produce National Energy and Climate Plans were introduced. The effect of these national regulations on the local government is that the new ambitious goals can hardly be accomplished with overlooking local projects and sustainable endeavours. Nevertheless, further improvements in terms of legal modifications could assist to eliminate identified barriers since the regulatory framework was also found to influence the financial, cooperation, and technical aspects of a city. Property ownership also appears as a barrier in the sample, which agrees with recent literature findings denoting its importance, mainly due to potentially limited cooperation of all owners for implementing investments at a more attractive scale [42]. More empowered cities can more easily finance their sustainable development actions and achieve the delivery of their plans through regulation, taxation, levies, land readjustment policies, and planning gains. To lead the local economy towards a more sustainable direction, a sound regulation with transparent and clear objectives should be established. An integrated legal framework to foresee and describe detailed public-private partnerships should be developed to minimize the related legal and ownership constraints. Thus, continuity and predictability throughout legislation is an important factor for SE related projects at the local level. Cities with limited capacities or an employment ban could benefit from joining forces with other cities or third parties such as energy agencies, ESCOs, or other private partners, which already have tested existing procedures and legal frameworks in place.
Overall, the resulting components built on the large diversity of cities’ implemented SECAPs, both when it comes to their size and location [81], as well as other relevant market and institutional factors [82], and consist of the underlying conditions that explain the progress of cities with their SECAP implementation. A positive observation is that even cities with lower than average market conditions can be successful in implementing SECAP projects. What sets those cities apart was performing quite high in components shown as most important in the presented framework: personnel capacity and training as well as cooperation with various actors. Finally, the literature supports the notion that Urban Living labs can facilitate bringing different actors together and foster learning, especially for innovative projects such as SE projects [83]. Cities acting as living labs could help overcome the observed obstacles of cooperating with different actors and thus partially overcome lack of internal capacity and personnel training. Consequently, investing at a local and regional level would be increased.

6. Conclusions

This study had two aims: (i) to present an integrated methodology for the development of a City Capability Assessment Framework based on PCA and (ii) to investigate the main factors that influence the entire process of developing SE investments at the local level.
To meet the first aim, first, a literature review was undertaken, and a city needs assessment was conducted, resulting in a pre-selection of 34 identified city capacities, which were categorised into three axes. The framework was deployed based on qualitative Likert scales instead of merely quantitative assessments, facilitating the understanding of the interrelations of the factors relevant to city competitiveness and financing performance focusing on SE investments. A European city-survey was the next crucial step to test the robustness of the framework. To select the most important capacities relevant to the implementation of SE projects at the city-level, CatPCA was applied to the results of the survey. The advantage of the proposed framework lies both in the structural steps as well as its content, since unveiling detailed preconditions for the financing and implementation of SE projects can enable other cities to retrace the same path by understanding which areas they should primarily invest in to successfully implement their SE projects. The framework can be effectively applied in other regions, on the provision that further analysis and research will be conducted by adapting it to the corresponding regional conditions. It can also be utilized by prospect investors (e.g., development banks, other financial institutions, private investors) since it can support their decision-making towards investments in energy efficiency and other SE technologies at the local level.
Regarding the second aim, the results of both the benchmark descriptive statistics and the CatPCA were analysed demonstrating the importance of city personnel availability and capacity, not only in terms of developing and exploring financing solutions for SE projects, but also regarding the availability of training schemes for these types of projects. The next important capacity concerns a city’s ability to cooperate with different investors, especially with other cities that have successfully implemented similar projects, as well as with private actors that can support their investments. Finally, cities’ market conditions, citizen stance, and finance and regulatory conditions exhibited similar variance, meaning that these aspects can almost equally explain why some cities thrive more than others in implementing SE projects.
An overall conclusion of the importance of educated personnel as well as of good cooperation with other cities points to the need for peer-to-peer projects similar to PROSPECT, which enable city employees to be informed about the types of innovative financing instruments (and constantly being in search for new solutions) and to establish contacts with their peers and more experienced cities, that have already been successful in overcoming similar financing as well as other barriers.
A basic limitation of the results of the proposed assessment framework concerns the representativeness of the sample. So far, 84 European cities from the PROSPECT project have participated in the benchmark survey, implying that, even though variations in terms of city size, location, and market conditions are represented by the city-sample, most of the cities that participated in the benchmark were eager to learn and familiar with sustainable projects, even if they were in the initial phases of identifying, attracting, and implementing SE investments. Sampling a more various representation of cities, including cities less developed in sustainable project implementation as well as those that are experts in sustainability, could confirm the importance of capacities identified in this research. With a more random sample, the importance of implementing the identified capacities would become even more evident.
Another weakness, but also a potential opportunity of this benchmark, is that it is based on self-assessment and perception responses from city-representatives, meaning that it allows for biased answers. Nevertheless, the Likert scaling methodology was constructed in a manner to avoid bias in responses through the proper labelling for the descriptive interpretation, combined with detailed examples and open field justification required for each question. Self-assessment is also required to step away from the currently available research, which focuses mostly on investment and project results, overlooking the actual situation in terms of city personnel and experience in project development and financing. The focus was on finding the principal factors that explain the status of cities regarding the development and implementation of their local plans. Identifying such preconditions for successful implementation of SE projects enables other cities to retrace the same path by understanding the areas that they should primarily invest in to successfully implement their SECAPs.
The methodology utilized in this study, as well as the outcomes of its application, can be further exploited by a variety of stakeholders, including international investors, development banks, ESCOs as well as local and regional authorities. Such a framework enables the former stakeholders to decide which cities to invest in to minimize risks and potential delays in project development and implementation. Deployment of the findings of this study could also facilitate ESCOs to effectively provide services to meet cities’ unique needs. Finally, the insights offer a better understanding of their strengths and weaknesses regarding city-level project development and implementation and can serve as a guide for cities to further enhance their capacities with regards to SE projects.

Author Contributions

N.-A.S.: conceptualization, methodology, writing—original draft preparation, data curation, formal analysis, writing—review and editing; N.K.: methodology, software, writing—original draft preparation, data curation; D.T.: writing—review and editing, data curation; M.D.M.: writing—original draft preparation, writing—review and editing, visualization; A.F.: conceptualization, writing—original draft preparation, writing—review and editing, supervision, funding acquisition. All authors have read and agreed to the published version of the manuscript.

Funding

This paper is based on research conducted within the EC funded Horizon 2020 Framework Programme for Research and Innovation (EU H2020) Project titled ‘Peer Powered Cities and Regions’ (PROSPECT)–Grant Agreement No. 752126.

Acknowledgments

The authors would like to acknowledge the support from the EC. The authors would also like to thank all PROSPECT partners as well as the cities that have participated in the survey. The content of the paper is the sole responsibility of its authors and does not necessarily reflect the views of the EC.

Conflicts of Interest

The authors declare no conflict of interest.

References

  1. Grafakos, S.; Enseñado, E.M.; Flamos, A.; Rotmans, J. Mapping and measuring European local governments’ priorities for a sustainable and low-carbon energy future. Energies 2015, 8, 11641–11666. [Google Scholar] [CrossRef] [Green Version]
  2. C40 CITIES. Deadline 2020: An Analysis of the Contribution C40 Cities Can Make to Delivering the Paris Agreement Objective of Limiting Global Temperature Rise Up to 1.5 Degrees; C40 CITIES: London, UK, 2017. [Google Scholar]
  3. Androulaki, S.; Doukas, H.; Spiliotis, E.; Papastamatiou, I.; Psarras, J. A framework to assess the behavior and performance of a city towards energy optimization. Stud. Comput. Intell. 2016, 627, 189–205. [Google Scholar] [CrossRef]
  4. Moraci, F.; Errigo, M.F.; Fazia, C.; Burgio, G.; Foresta, S. Making less vulnerable cities: Resilience as a new paradigm of smart planning. Sustainability 2018, 10, 755. [Google Scholar] [CrossRef] [Green Version]
  5. Pirlone, F.; Spadaro, I.; Candia, S. More resilient cities to face higher risks. the case of Genoa. Sustainability 2020, 12, 4825. [Google Scholar] [CrossRef]
  6. Hernantes, J.; Maraña, P.; Gimenez, R.; Sarriegi, J.M.; Labaka, L. Towards resilient cities: A maturity model for operationalizing resilience. Cities 2019, 84, 96–103. [Google Scholar] [CrossRef]
  7. Grafakos, S.; Flamos, A. Assessing low-carbon energy technologies against sustainability and resilience criteria: Results of a European experts survey. Int. J. Sustain. Energy 2017, 36, 502–516. [Google Scholar] [CrossRef]
  8. Mori, K.; Fujii, T.; Yamashita, T.; Mimura, Y.; Uchiyama, Y.; Hayashi, K. Visualization of a City Sustainability Index (CSI): Towards transdisciplinary approaches involving multiple stakeholders. Sustainability 2015, 7, 12402–12424. [Google Scholar] [CrossRef] [Green Version]
  9. International Energy Agency (IEA). An IEA Analysis: Energy Efficiency can Boost Economies Quickly, with Long-Lasting Benefits. Available online: https://www.iea.org/commentaries/energy-efficiency-can-boost-economies-quickly-with-long-lasting-benefits?utm_content=buffer29105&utm_medium=social&utm_source=linkedin.com&utm_campaign=buffer&fbclid=IwAR0Oqc9FgjNoHqF-ClQNIFydCxq628E3W9TJjie3ZH5wClhCVeQzel (accessed on 14 April 2020).
  10. European Parliament. Fact Sheets on the European Union. Available online: https://www.europarl.europa.eu/factsheets/en/sheet/69/energy-efficiency (accessed on 20 April 2020).
  11. European Commission. Regional Policy, EU Solidarity Fund for COVID-19. Available online: https://ec.europa.eu/regional_policy/en/funding/solidarity-fund/covid-19 (accessed on 18 April 2020).
  12. Pucher, J. Obstacles to Investments at Local and Regional Level; European Committee of the Regions: Brussels, Belgium, 2016. [Google Scholar]
  13. EUROCITIES. Peer Powered Cities and Regions: Report on Needs Assessment; European Commission: Brussels, Belgium, 2020. [Google Scholar]
  14. European Federation of Agencies and Regions for Energy and the Enviroment (FEDARENE). Innovative Financing Schemes in Local and Regional Energy Efficiency Policies; FEDARENE: Brussels, Belgium, 2015. [Google Scholar]
  15. Floater, G.; Dowling, D.; Chan, D.; Ulterino, M.; Braunstein, J.; Mcminn, T.; Ahmad, E. Global Review of Finance for Sustainable Urban Infrastructure; Coalition for Urban Transitions: Washington, DC, USA, 2017. [Google Scholar]
  16. International Finance Corporation. Financing Climate-Smart Investments in Cities; International Finance Corporation: Washington DC, USA, 2018. [Google Scholar]
  17. Wolfram, M. Conceptualizing urban transformative capacity: A framework for research and policy. Cities 2016, 51, 121–130. [Google Scholar] [CrossRef]
  18. Seeliger, L.; Turok, I. Towards sustainable cities: Extending resilience with insights from vulnerability and transition theory. Sustainability 2013, 5, 2108–2128. [Google Scholar] [CrossRef] [Green Version]
  19. Li, Q. Resilience thinking as a system approach to promote China’s sustainability transitions. Sustainability 2020, 12, 5008. [Google Scholar] [CrossRef]
  20. CLIMATE-KIC. Peer Powered Cities and Regions: Report on Certification Framework; European Commission: Brussels, Belgium, 2018. [Google Scholar]
  21. Ketels, D.C. Review of competitiveness frameworks. Irish Natl. Compet. Counc. 2016, 15, 2017. [Google Scholar]
  22. Van den Berg, L.; Galal, H.; Teunisse, P. Innovative City Strategies for Delivering Sustainable Competitiveness. 2014, pp. 1–80. Available online: https://www.pwc.com/gx/en/psrc/global/assets/pwc-innovative-city-strategies-for-sustainable-competitiveness.pdf (accessed on 14 April 2020).
  23. Jabareen, Y. An assessment framework for cities coping with climate change: The case of New York City and its plaNYC 2030. Sustainability 2014, 6, 5898–5919. [Google Scholar] [CrossRef] [Green Version]
  24. The Economist Intelligence Unit. Hot Spots 2025: Benchmarking the Future Competitiveness of Cities; The Economist Intelligence Unit: London, UK, 2013. [Google Scholar]
  25. A.T. Kearnay. Global Cities 2017: Leaders in a World of Disruptive Innovation; A.T. Kearnay: New York, NY, USA, 2017. [Google Scholar]
  26. Institute for Urban Strategies—The Mori Memorial Foundation. Global Power City Index 2017; The Mori Memorial Foundation: Tokyo, Japan, 2017. [Google Scholar]
  27. Berrone, P.; Ricart, J.E.; Carraso, C.; Ricart, R. IESE Cities in Motion Index; IESE Business School—Barcelona Campus Norte: Barcelona, Spain, 2017. [Google Scholar]
  28. Vegara, A. The critical factors for the competitiveness of cities. Sustain. City XI 2016, 1, 47–56. [Google Scholar] [CrossRef] [Green Version]
  29. European Commission. Financing a Sustainable European Economy; European Commission: Brussels, Belgium, 2018. [Google Scholar]
  30. Cities Exchanging on Local Energy Leadership (CASCADE)—IEE Project. Available online: http://www.cascadecities.eu/cascadecities/home#.XqTJU2gzY2w (accessed on 16 April 2020).
  31. Wuppertal Institute and EUROCITIES. Benchmark of Renewable Energy Sources and Distributed Energy Generation; European Commission: Brussels, Belgium, 2013. [Google Scholar]
  32. Gibberd, J. Strengthening Sustainability Planning: The City Capability Framework. Procedia Eng. 2017, 198, 200–211. [Google Scholar] [CrossRef]
  33. Campillo, J.; Dahlquist, E.; Vassileva, I. Technology capacity assessment tool for developing city action plans to increase efficiency in mid-sized cities in Europe. Energy Procedia 2016, 88, 16–22. [Google Scholar] [CrossRef] [Green Version]
  34. European Investment Bank. EIB Group Survey on Investment and Investment Finance: Municipality Infrastructure Investment Activities; European Investment Bank: Luxembourg, 2017. [Google Scholar]
  35. United Nations Development Programme (UNDP). Annual Report 2005: A Time for Bold Action; United Nations Development Programme: New York, NY, USA, 2005. [Google Scholar]
  36. Renn, O.; Klinke, A. A framework of adaptive risk governance for urban planning. Sustainability 2013, 5, 2036–2059. [Google Scholar] [CrossRef] [Green Version]
  37. United Nations Development Programme (UNDP). Measuring Capacities: A Guide to Benchmarks and Indicators; United Nations Development Programme: New York, NY, USA, 2005. [Google Scholar]
  38. Bester, A. Capacity Development: A Report Prepared for the United Nations Department of Economic and Social Affairs for the 2016 Quadrennial Comprehensive Policy; United Nations: New York, NY, USA, 2015. [Google Scholar]
  39. Energy Efficiency Financial Institutions Group. Eefig Underwriting Toolkit: Value and Risk Appraisal for Energy Efficiency Financing; European Commission: Brussels, Belgium, 2017. [Google Scholar]
  40. Enviromental Defense Fund (EDF). Energy Performance Protocol: Project Development Specification; Enviromental Defense Fund: New York, NY, USA, 2016. [Google Scholar]
  41. DENTONS. A Guide to Project Finance; DENTONS: Washington, DC, USA, 2018. [Google Scholar]
  42. Mosannenzadeh, F.; Di Nucci, M.R.; Vettorato, D. Identifying and prioritizing barriers to implementation of smart energy city projects in Europe: An empirical approach. Energy Policy 2017, 105, 191–201. [Google Scholar] [CrossRef]
  43. G20 Energy Efficiency Finance Task Group (EEFTG). G20 Energy Efficiency Investment Toolkit; International Energy Agency: Paris, France, 2017. [Google Scholar]
  44. International Renewable Energy Agency (IRENA). Financial Mechanisms and Investment Frameworks for Renewables in Developing Countries; IRENA: Abu Dhabi, UAE, 2012. [Google Scholar]
  45. Guillermo, A.; de Cunto, A.; Kontinakis, N.; Saraceno, P.P. Peer Powered Cities and Regions: Report on Needs Assessment; European Commission: Brussels, Belgium, 2017. [Google Scholar]
  46. European Commission. Smart Cities Stakeholder Platform: Financing Models for Smart Cities; European Commission: Brussels, Belgium, 2013. [Google Scholar]
  47. EURELETRIC. A Eureletric Policy Paper: Triggering Energy Efficiency Investments; EURELETRIC: Brussels, Belgium, 2015. [Google Scholar]
  48. UN-Habitat. Financing Sustainable Urban Development: Challenges and Opportunities; UN-Habitat: Nairobi, Kenya, 2013. [Google Scholar]
  49. Du, Q.; Wang, Y.; Ren, F.; Zhao, Z.; Liu, H.; Wu, C.; Li, L.; Shen, Y. Measuring and analysis of urban competitiveness of Chinese provincial capitals in 2010 under the constraints of major function-oriented zoning utilizing spatial analysis. Sustainability 2014, 6, 3374–3399. [Google Scholar] [CrossRef] [Green Version]
  50. CityInvest. A Guide for the Launch of a One Stop Shop on Energy Retrofitting: RenoWatt’s Experience in Liège; European Commission: Brussels, Belgium, 2017. [Google Scholar]
  51. Limaye, D.R.; Limaye, E.S. Scaling up energy efficiency: The case for a Super ESCO. Energy Effic. 2011, 4, 133–144. [Google Scholar] [CrossRef]
  52. Rezessy, S.; Bertoldi, P. Financing Energy Efficiency: Forging the link between financing and project implementation. Environ. Plan. A 2010, 41, 1072–1089. [Google Scholar]
  53. European Commission. Guidance Document on Indicators of Public Administration Capacity Building; European Commission: Brussels, Belgium, 2014. [Google Scholar]
  54. International Renewable Energy Agency (IRENA). Renewable Power Generation Costs in 2012: An Overview; IRENA: Abu Dhabi, UAE, 2012. [Google Scholar]
  55. Smart Cities Council. Smart Cities Financing Guide: Expert Analysis of 28 Municipal Finance Tools for City Leaders Investing in the Future; Center for Urban Innovation—Arizona State University: Tempe, AZ, USA, 2013. [Google Scholar]
  56. Spyridaki, N.A.; Stavrakas, V.; Dendramis, Y.; Flamos, A. Understanding technology ownership to reveal adoption trends for energy efficiency measures in the Greek residential sector. Energy Policy 2020, 140, 111413. [Google Scholar] [CrossRef]
  57. Kjaer, T.; Andersen, J.; Kjaer, N. Identifying Areas of Improvements of Monitoring and Verification Schemes and Coordination Mechanisms; European Commission: Brussels, Belgium, 2016. [Google Scholar]
  58. Li, T.; Zhang, H.; Yuan, C.; Liu, Z.; Fan, C. A PCA-based method for construction of composite sustainability indicators. Int. J. Life Cycle Assess. 2012, 17, 593–603. [Google Scholar] [CrossRef]
  59. Richardson, M. Principal Component Analysis. 2009. Available online: http://www.dsc.ufcg.edu.br/~hmg/disciplinas/posgraduacao/rn-copin-2014.3/material/SignalProcPCA.pdf (accessed on 25 July 2020).
  60. Bartholomew, D.J. Principal components analysis. Int. Encycl. Educ. 2010, 374–377. [Google Scholar] [CrossRef]
  61. Field, A. Discovering Statistics Using Spss; Sage Publications Ltd.: London, UK, 2009. [Google Scholar]
  62. Preacher, K.J.; Zhang, G.; Kim, C.; Mels, G. Choosing the Optimal Number of Factors in Exploratory Factor Analysis: A Model Selection Perspective. Multivar. Behav. Res. 2013, 48, 28–56. [Google Scholar] [CrossRef]
  63. Schmitt, T.A. Current methodological considerations in exploratory and confirmatory factor analysis. J. Psychoeduc. Assess. 2011, 29, 304–321. [Google Scholar] [CrossRef] [Green Version]
  64. Karytsas, S.; Choropanitis, I. Barriers against and actions towards renewable energy technologies diffusion: A Principal Component Analysis for residential ground source heat pump (GSHP) systems. Renew. Sustain. Energy Rev. 2017, 78, 252–271. [Google Scholar] [CrossRef]
  65. Yong, A.G.; Pearce, S. A Beginner’s Guide to Factor Analysis: Focusing on Exploratory Factor Analysis. Tutor. Quant. Methods Psychol. 2013, 9, 79–94. [Google Scholar] [CrossRef]
  66. Thurstone, L.L. Multiple-Factor Analysis; a Development and Expansion of The Vectors of Mind; University of Chicago Press: Chicago, IL, USA, 1947. [Google Scholar]
  67. Anna, B.; Costello, J.W.O. Best Practices in Exploratory Factor Analysis: Four Recommendations for Getting the Most From Your Analysis. Pract. Assess. Res. Eval. 2005, 10, 1–9. [Google Scholar]
  68. Brown, J.D. Choosing the Right Type of Rotation in PCA and EFA. JALT Test. Eval. SIG Newsl. 2009, 13, 20–25. [Google Scholar]
  69. Matsunaga, M. How to Factor-Analyze Your Data Right: Do’s, Don’ts, and How-To’s. Int. J. Psychol. Res. 2010, 3, 97–110. [Google Scholar] [CrossRef]
  70. Reckien, D.; Salvia, M.; Heidrich, O.; Church, J.M.; Pietrapertosa, F.; De Gregorio-Hurtado, S.; D’Alonzo, V.; Foley, A.; Simoes, S.G.; Krkoška Lorencová, E.; et al. How are cities planning to respond to climate change? Assessment of local climate plans from 885 cities in the EU-28. J. Clean. Prod. 2018, 191, 207–219. [Google Scholar] [CrossRef]
  71. Beaumont, R. An introduction to Principal Component Analysis & Factor Analysis Using SPSS 19 and R (psych package). J. Geophys. Res. 2012, 1–24. [Google Scholar]
  72. Hair, J.F., Jr.; Black, W.C.; Babin, B.J.; Anderson, R.E.; Tatham, R.L. Multivariate Data Analysis, 7th ed.; Pearson Education Limited: Harlow, UK, 2014. [Google Scholar]
  73. Brown, J.D. Principal components analysis and exploratory factor analysis—Definitions, differences, and choices. JALT Test. Eval. SIG Newsl. 2009, 13, 26–30. [Google Scholar]
  74. Iturriza, M.; Labaka, L.; Hernantes, J.; Abdeltawad, A. Shifting to climate change aware cities to facilitate the city resilience implementation. Cities 2020, 101, 102688. [Google Scholar] [CrossRef]
  75. Iturriza, M.; Hernantes, J.; Abdelgawad, A.A.; Labaka, L. Are Cities aware enough? A framework for developing city awareness to climate change. Sustainability 2020, 12, 2168. [Google Scholar] [CrossRef] [Green Version]
  76. Angelidou, M. Smart cities: A conjuncture of four forces. Cities 2015, 47, 95–106. [Google Scholar] [CrossRef]
  77. Mi, Z.; Zheng, J.; Meng, J.; Zheng, H.; Li, X.; Coffman, D.M.; Woltjer, J.; Wang, S.; Guan, D. Carbon emissions of cities from a consumption-based perspective. Appl. Energy 2019, 235, 509–518. [Google Scholar] [CrossRef] [Green Version]
  78. Stavrakas, V.; Flamos, A. A modular high-resolution demand-side management model to quantify benefits of demand-flexibility in the residential sector. Energy Convers. Manag. 2020, 205, 112339. [Google Scholar] [CrossRef]
  79. United Nations. Sustainable Development Financing; United Nations: New York, NY, USA, 2014. [Google Scholar]
  80. European Commission. Clean Energy for All Europeans; European Commission: Brussels, Belgium, 2019. [Google Scholar]
  81. Reckien, D.; Salvia, M.; Pietrapertosa, F.; Simoes, S.G.; Olazabal, M.; De Gregorio Hurtado, S.; Geneletti, D.; Krkoška Lorencová, E.; D’Alonzo, V.; Krook-Riekkola, A.; et al. Dedicated versus mainstreaming approaches in local climate plans in Europe. Renew. Sustain. Energy Rev. 2019, 112, 948–959. [Google Scholar] [CrossRef]
  82. Croci, E.; Lucchitta, B.; Janssens-Maenhout, G.; Martelli, S.; Molteni, T. Urban CO2 mitigation strategies under the Covenant of Mayors: An assessment of 124 European cities. J. Clean. Prod. 2017, 169, 161–177. [Google Scholar] [CrossRef]
  83. Bulkeley, H.; Coenen, L.; Frantzeskaki, N.; Hartmann, C.; Kronsell, A.; Mai, L.; Marvin, S.; McCormick, K.; van Steenbergen, F.; Voytenko Palgan, Y. Urban living labs: Governing urban sustainability transitions. Curr. Opin. Environ. Sustain. 2016, 22, 13–17. [Google Scholar] [CrossRef] [Green Version]
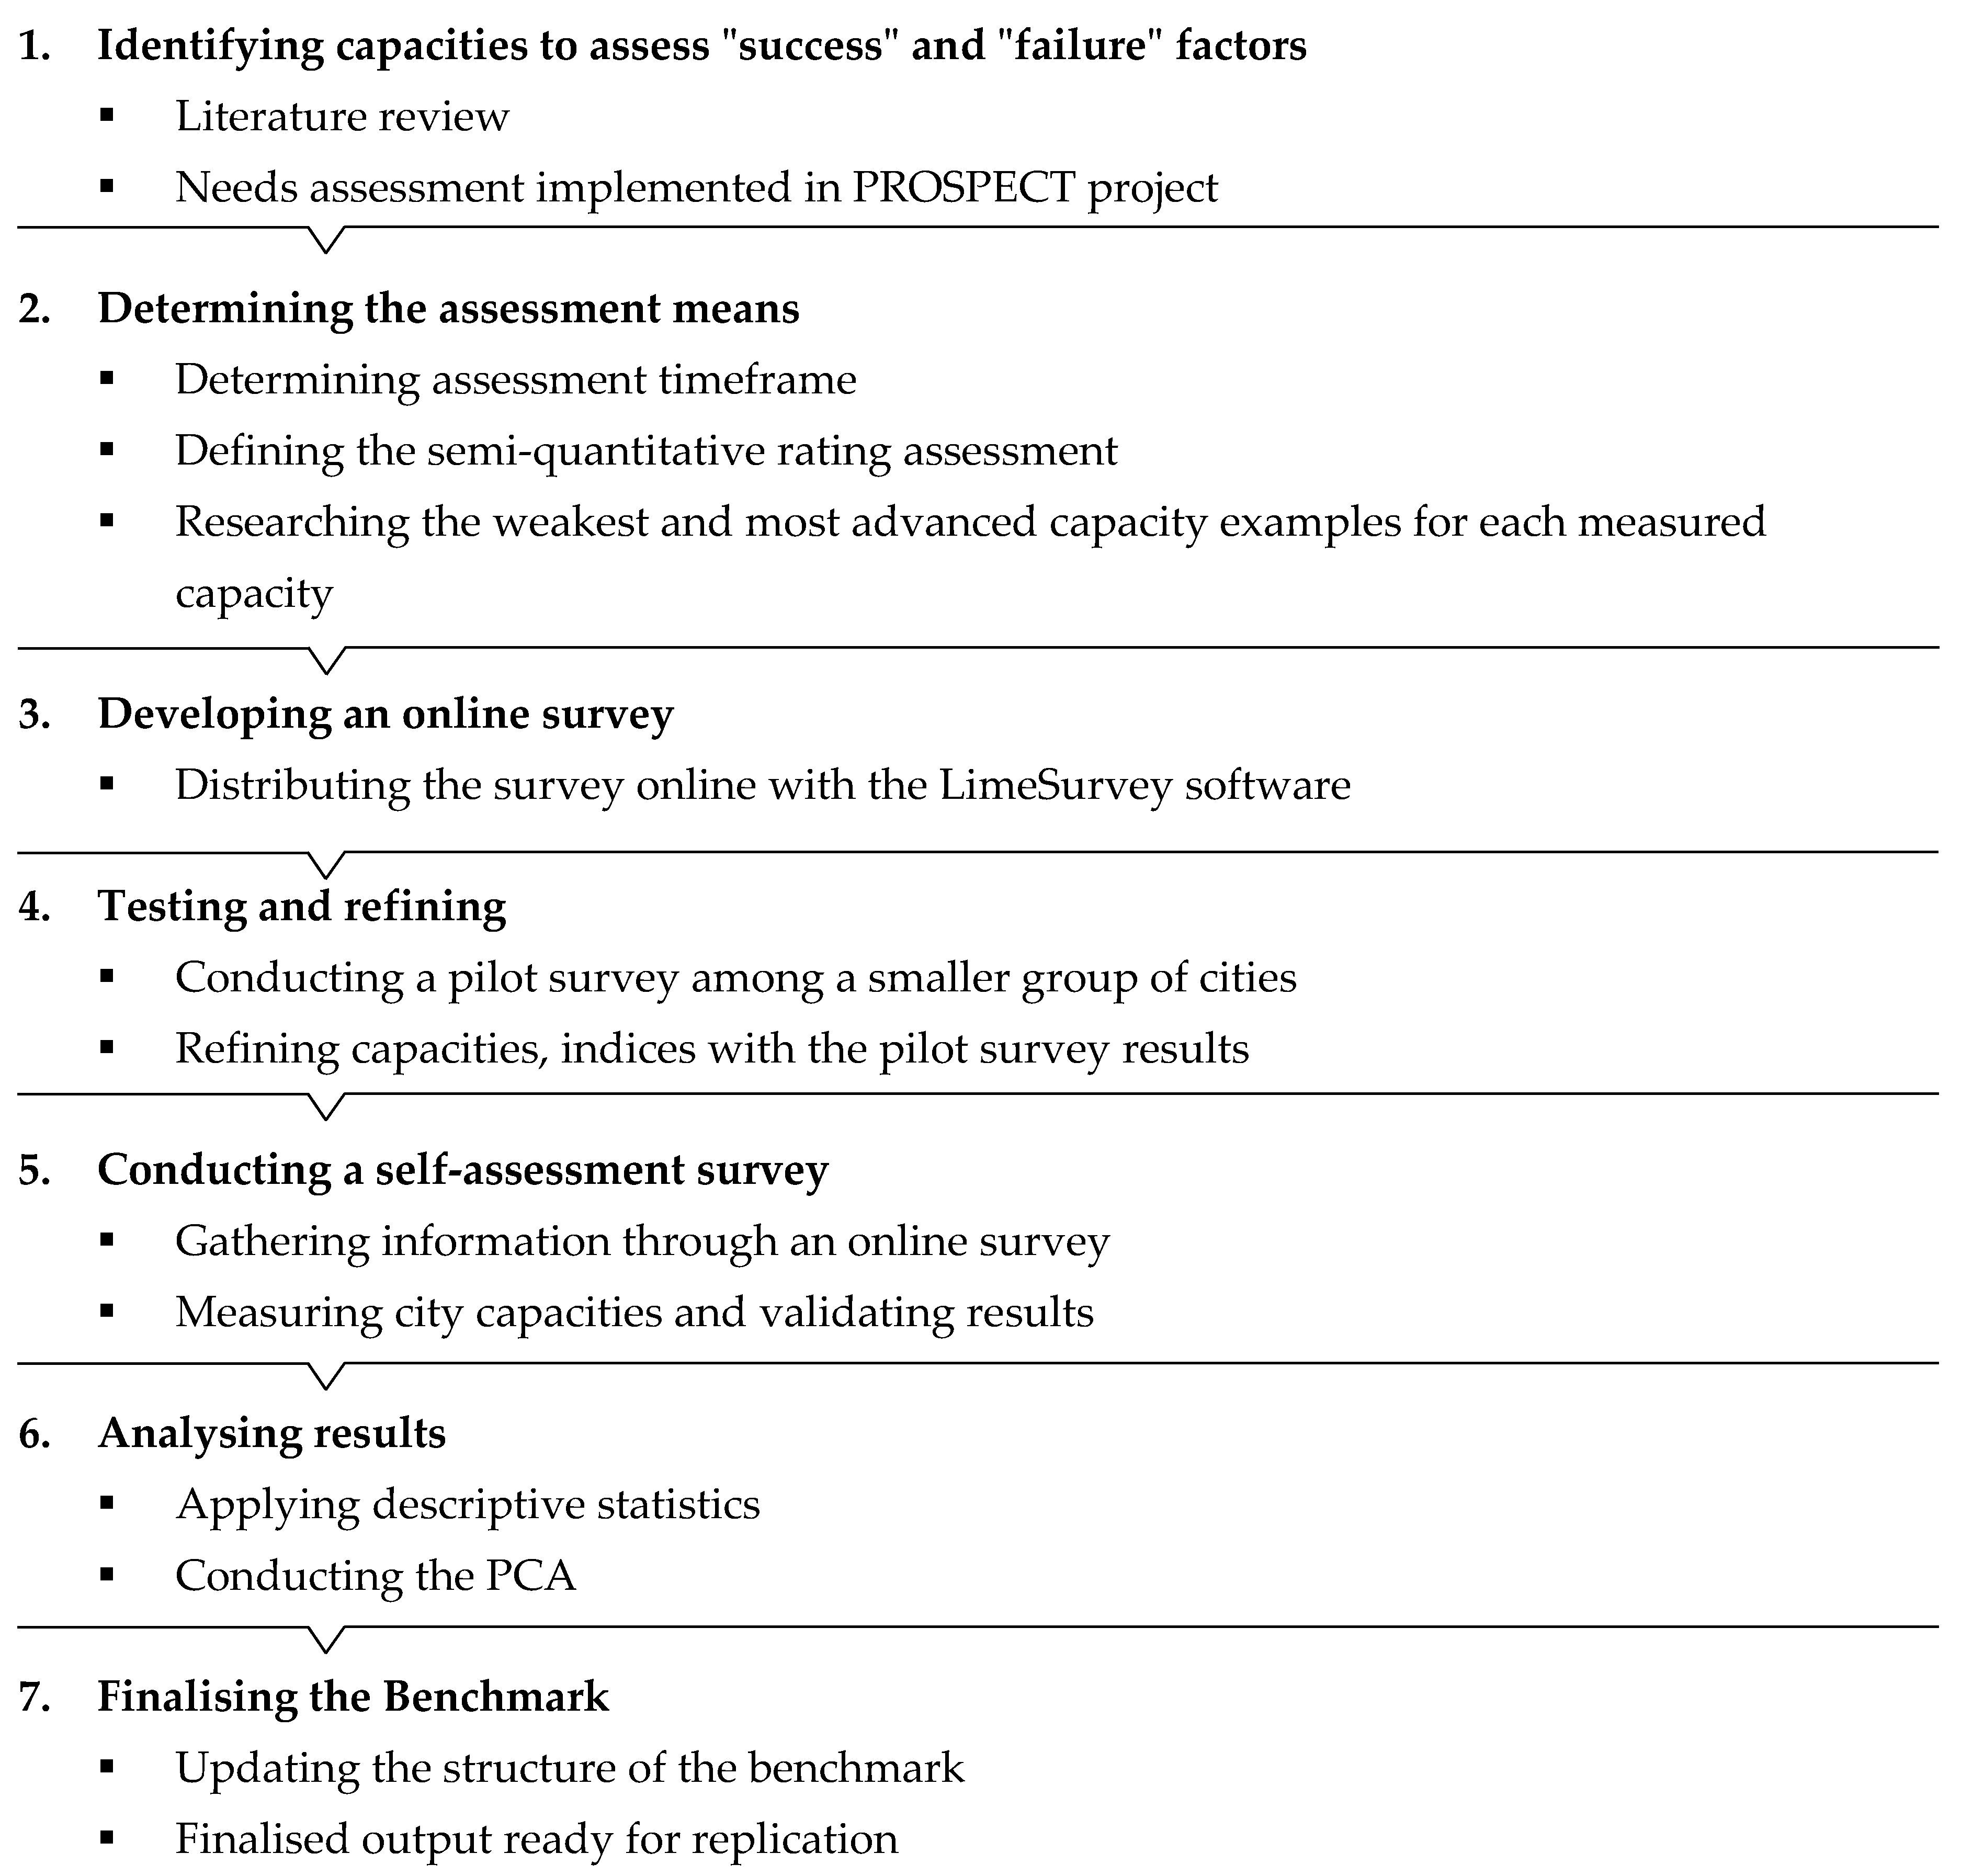
Figure 1. Methodology for developing the PROSPECT benchmark assessment framework.
Sustainability 12 08447 g001
Figure 2. Project life cycle form the developer’s and the financial institution’s perspective.
Sustainability 12 08447 g002
Figure 3. Essential steps of the principal component analysis (PCA).
Sustainability 12 08447 g003
Figure 4. Axis 1—Attracting Investments capacities.
Sustainability 12 08447 g004
Figure 5. Axis 2—Identifying and utilizing financing options capacities.
Sustainability 12 08447 g005
Figure 6. Axis 3—Setting up, implementing, and monitoring the financing of SECAP or other SE projects’ capacities.
Sustainability 12 08447 g006
Table 1. Index categories considered in the creation of the Horizon 2020 PROSPECT benchmark.
IndexIndex Categories
Global City Competitiveness Index [24]Economic strength
Physical capital
Financial maturity
Institutional effectiveness
Social and cultural character
Human capital
Environment and natural hazards
Global appeal
A. T. Kearney’s Global Cities Index [25]Business activities
Human capital
Information exchange to cultural experience
Political engagement
Mori Memorial Foundation’s Global Power City Index [26]Economy
Research and development
Cultural interaction
Liveability
Environment
Accessibility
Centre of Globalization and Strategy Index (Berrone et al., 2017)Human capital
Social cohesion
Economy
Public management
Governance
Mobility and transportation
Environment
Urban Planning
Technology
International outreach
Table 2. Assessment framework structure and measured capacities.
CategoriesMeasured Capacities
Assessment axis 1: Attracting investments
Local (and broader) strategy and commitmentsCity Experience on SE projects (Mosannenzadeh et al., 2017)
Available incentives for private project investors [42,43]
Legal/regulatory constraints [42,43,44]
Legislative and regulatory situation (local)Efficient process for permit [42,43,44]
Public procurement procedures facilitation [44,45,46]
Ownership issues hinder SE projects [42,44,45,47]
Economic situation (local)City Gross Domestic Product (GDP) [24,44,48,49]
GDP growth rate [24,44,49]
Annual city expenditure [24,48,49]
Annual city revenues [24,48,49]
City debt [24]
Default on debt (no such citation)
Nominal bank lending rate [24,43,44]
Taxation rate for corporations [24,44]
Taxation rate for individuals [24,44]
City population [24,49]
Unemployment rate [24,44]
Public stance (on SE and Climate Action Plans (SECAP) related investments) and disseminationPublic stance [42,46]
Initiatives disseminated [42,46]
Assessment axis 2: Identifying and utilizing financing options
Project origination capacityAnnual city budget for SE projects [42,48]
Sufficiently exploited budget [31]
Available financial support schemes [47]
Applied Citizens’ finance [14,47]
Cooperation/communication with other cities [14,31,50]
Cooperation/communication with public actors [14,31,43,44]
Cooperation/communication with traditional private actors [43,44,50]
Cooperation/communication with non-traditional private actors [51,52]
Project underwriting and evaluation capacityMunicipality personnel for funding options investigation [31,53]
Personnel for project underwriting [45,53]
Project selection and prioritization process [54,55]
Assessment axis 3: Setting-up, implementing, and monitoring SE projects financing
Project origination capacityPersonnel for administration, co-ordination, and monitoring [14,53]
Ability to employ/train personnel to support project underwriting [14,53]
Available personnel training schemes [14,53]
Project underwriting and evaluation capacityEstablished monitoring and evaluation (M&V) procedure [31,53]
Operational standards/QA [31,53]
Table 3. Sample descriptive statistics.
ObservationsMeanSDMinMax
Interval capacities
“City GDP per capita (€)” 8418.79315.7631.876102.214
“City GDP growth rate (%)” 565.487.69−1.5742
“Annual city expenditure (Million €)” 65187.6451.40.83130
“Annual city revenues (Million €)” 64175.3447.41.13160
“Value of city debt (Million €)” 49112.9481.103250
“Nominal bank lending rate (%)” 845.95.90.335
“Corporate taxation rate (%)” 84207.51.533.3
“City population” 84461,0091,244,96918538,173,941
“Unemployment rate (%)” 849.36.40.327.3
Ordinal capacities (1 = lower limit, 5 = upper limit)
“City experience on SE projects” 843.271.215
“Available incentives for private investors” 842.91.3915
“Legal/regulatory constraints” 843.441.2215
“Efficient process for permit” 842.980.9214
“Public procurement procedure facilitation” 840.960.9615
“Ownership issues hinder SE projects” 842.941.515
“Default on debt” 844.461.1615
“Public stance” 843.640.9115
“Initiatives disseminated” 842.580.8215
“Annual city budget for SE projects” 842.57115
“Sufficiently exploited budget” 843.381.4815
“Available financial support schemes” 843.831.1215
“Applied citizens’ finance” 841.821.1215
“Cooperation/communication with cities” 842.891.3315
“Cooperation/communication with public actors” 843.821.115
“Coop./communication with traditional private actors” 842.671.3615
“Coop./communication with non-traditional private actors” 842.511.4415
“Personnel for funding options investigation” 842.631.1915
“Personnel for project underwriting” 842.981.315
“Project selection and prioritization process” 842.461.2315
“Administration, coordination, and monitoring personnel” 843.271.2715
“Available personnel training schemes” 842.551.215
“Established M&V procedure” 842.961.6415
“Operational standards/QA” 842.631.6615
“Ability to employ/train personnel to support project underwriting” 843.11.1915
Table 4. PCA model summary.
ComponentEigenvalue% of Variance
16.0420.12
24.9216.41
33.311
43.0210.06
52.58.33
Total % of Variance65.92
Table 5. Interpretation of components.
Component12345h2
1.
City’s personnel availability and capacity
Available personnel training schemes0.891 0.897
Personnel for project underwriting0.854 0.855
Personnel for administration/coordination and monitoring0.832 0.849
Municipality personnel for funding options investigation0.794 0.855
Project selection and prioritization process0.715 0.914
Available financial support schemes0.673 0.874
Ability to employ/train personnel to support project underwriting0.649 0.882
2.
City’s communication and dissemination capacity
Cooperation/communication with cities 0.894 0.908
Cooperation/communication with non-traditional private actors 0.804 0.756
Cooperation/communication with traditional private actors 0.770 0.847
Initiatives Disseminated 0.712 0.726
Cooperation/communication with public actors 0.706 0.776
3.
City’s market conditions
Nominal bank lending rate 0.795 0.920
Ownership issues hindering SE projects 0.655 0.686
Unemployment rate 0.736 0.823
4.
Citizens’ stance and finance
Public Stance 0.893 0.824
Applied Citizens’ Finance 0.652 0.821
5.
City’s regulatory conditions
Public procurement procedures facilitation 0.8300.769
Legal/regulatory constraints 0.7880.893
Efficient process for permit 0.6890.881
% of variance explained by each component20.1216.411110.068.33
Total % of variance 65.92
Publisher’s Note: MDPI stays neutral with regard to jurisdictional claims in published maps and institutional affiliations.