Development of a Ventilation System Using Window Cavity


Abstract
1. Introduction
2. Methods
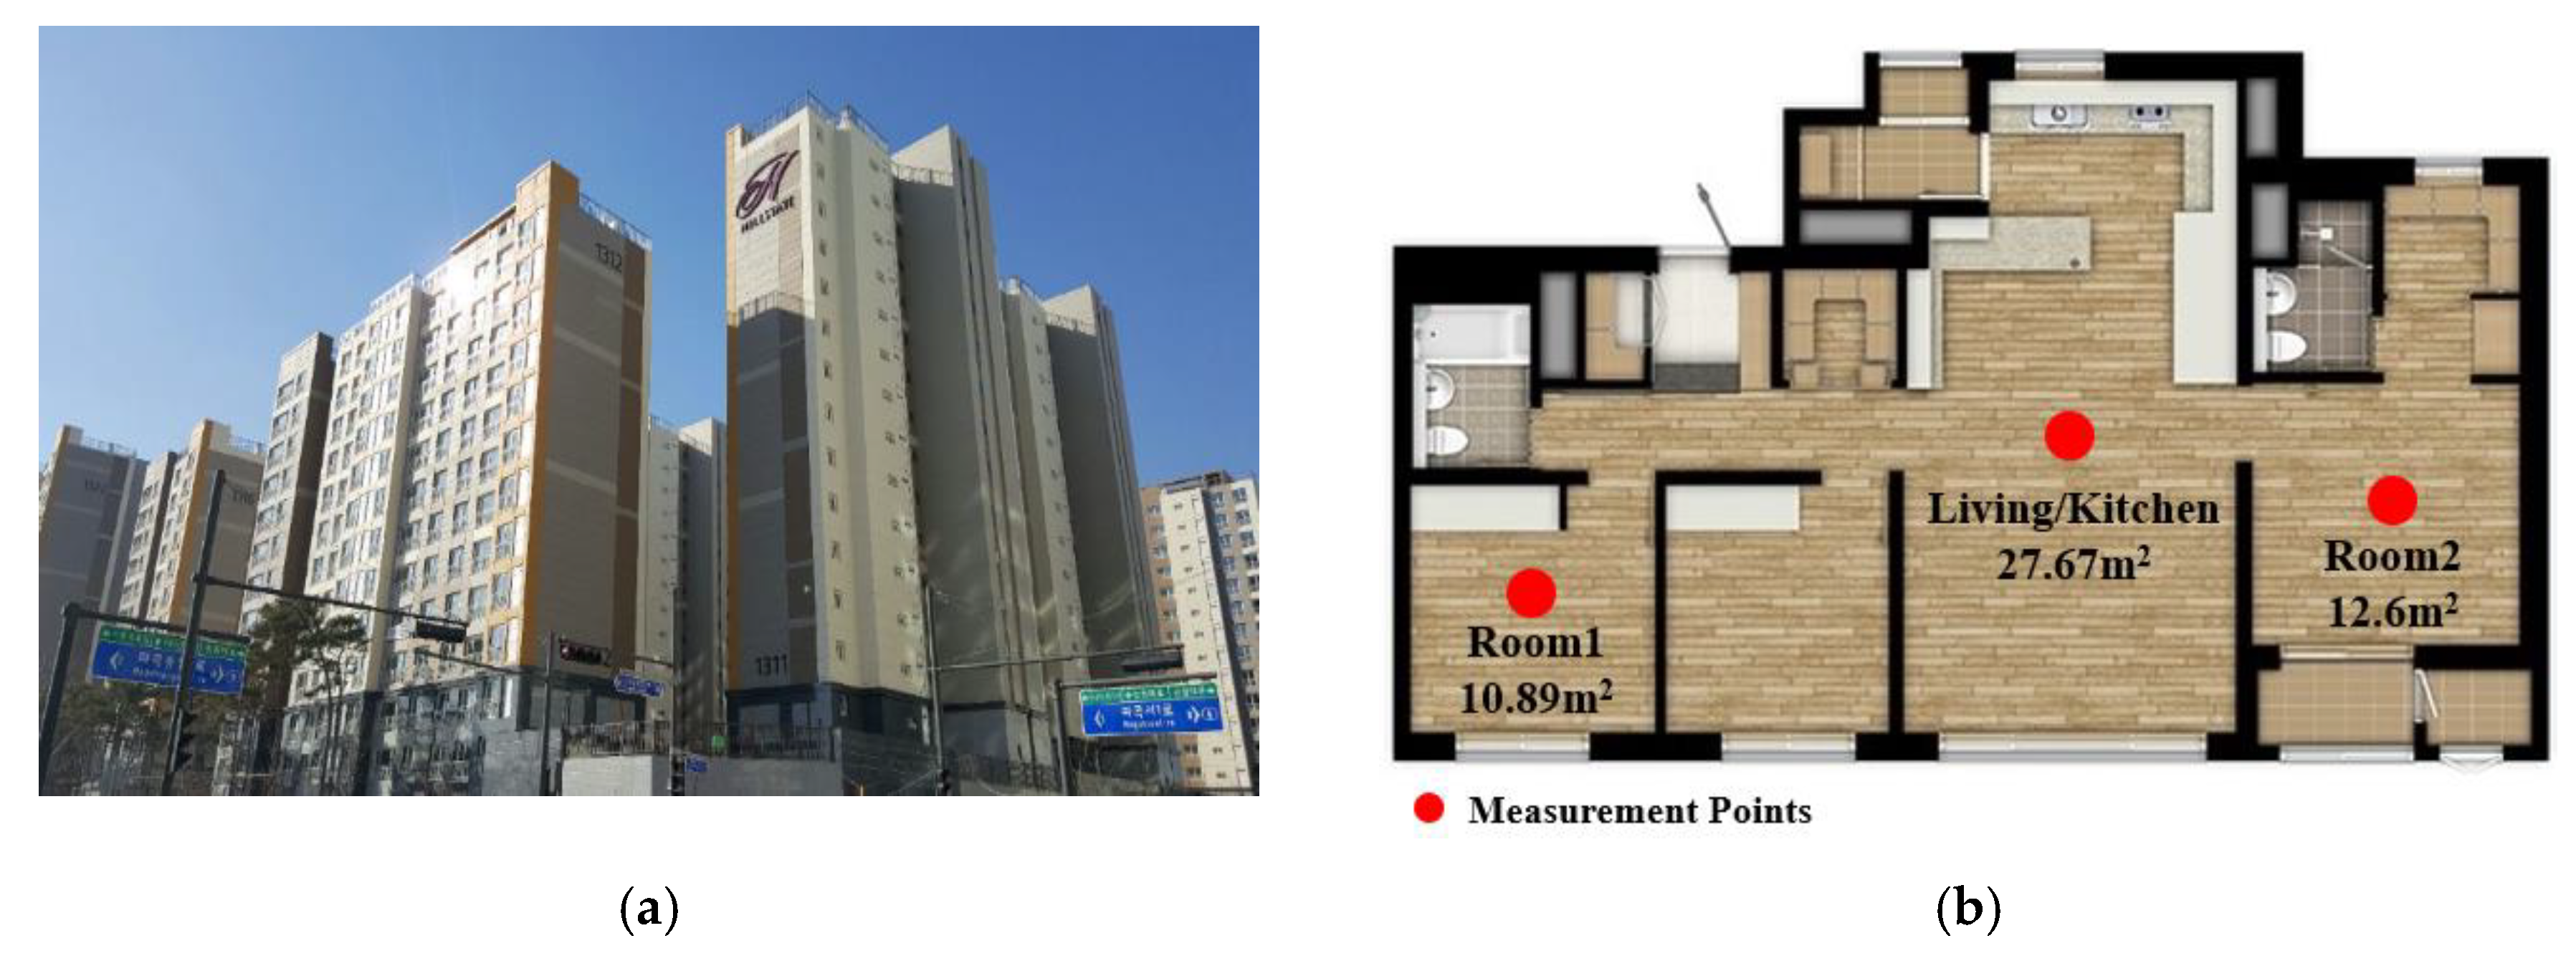
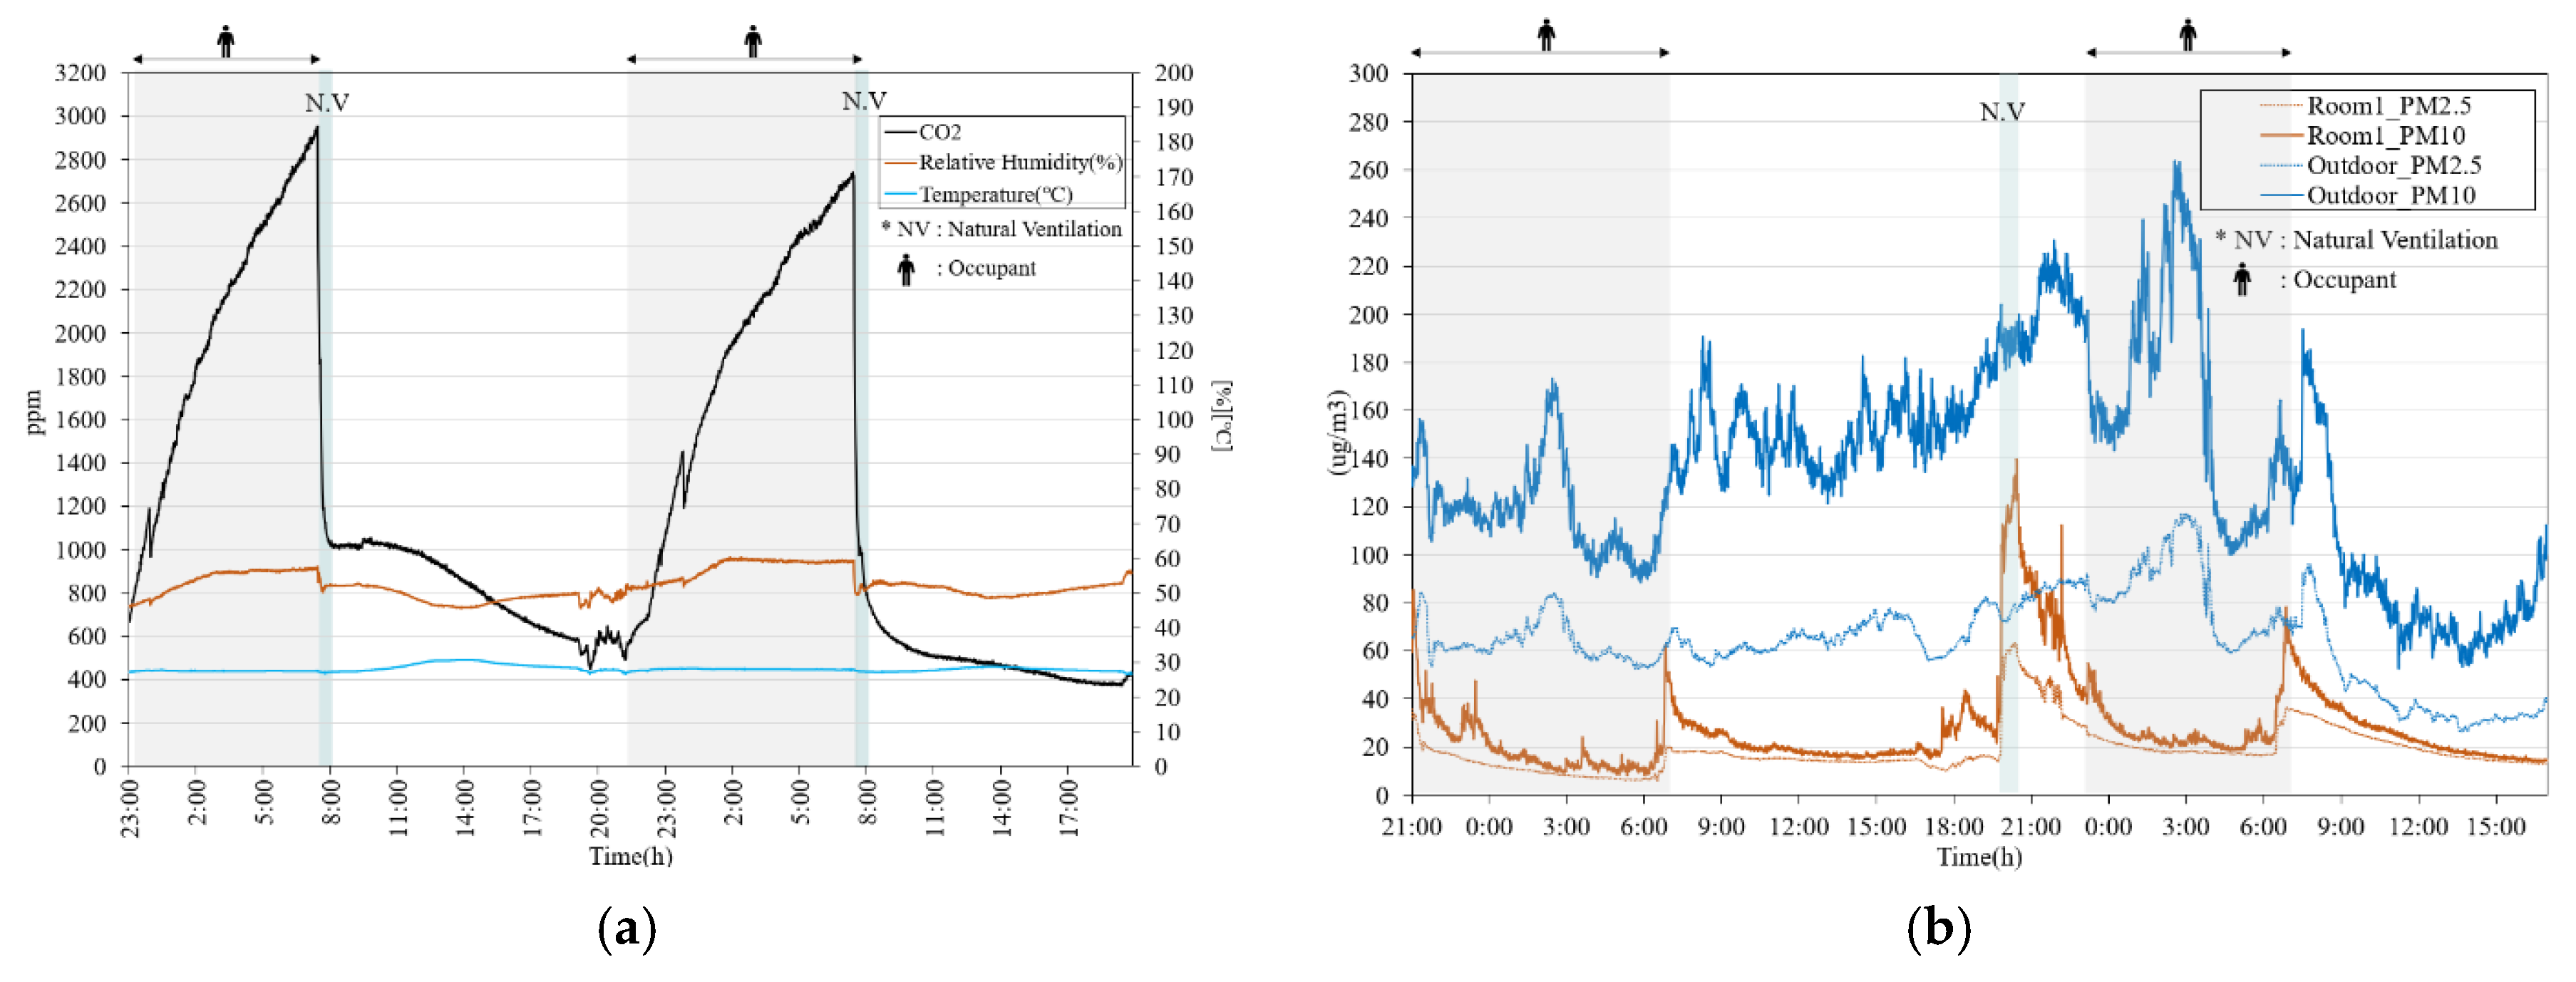
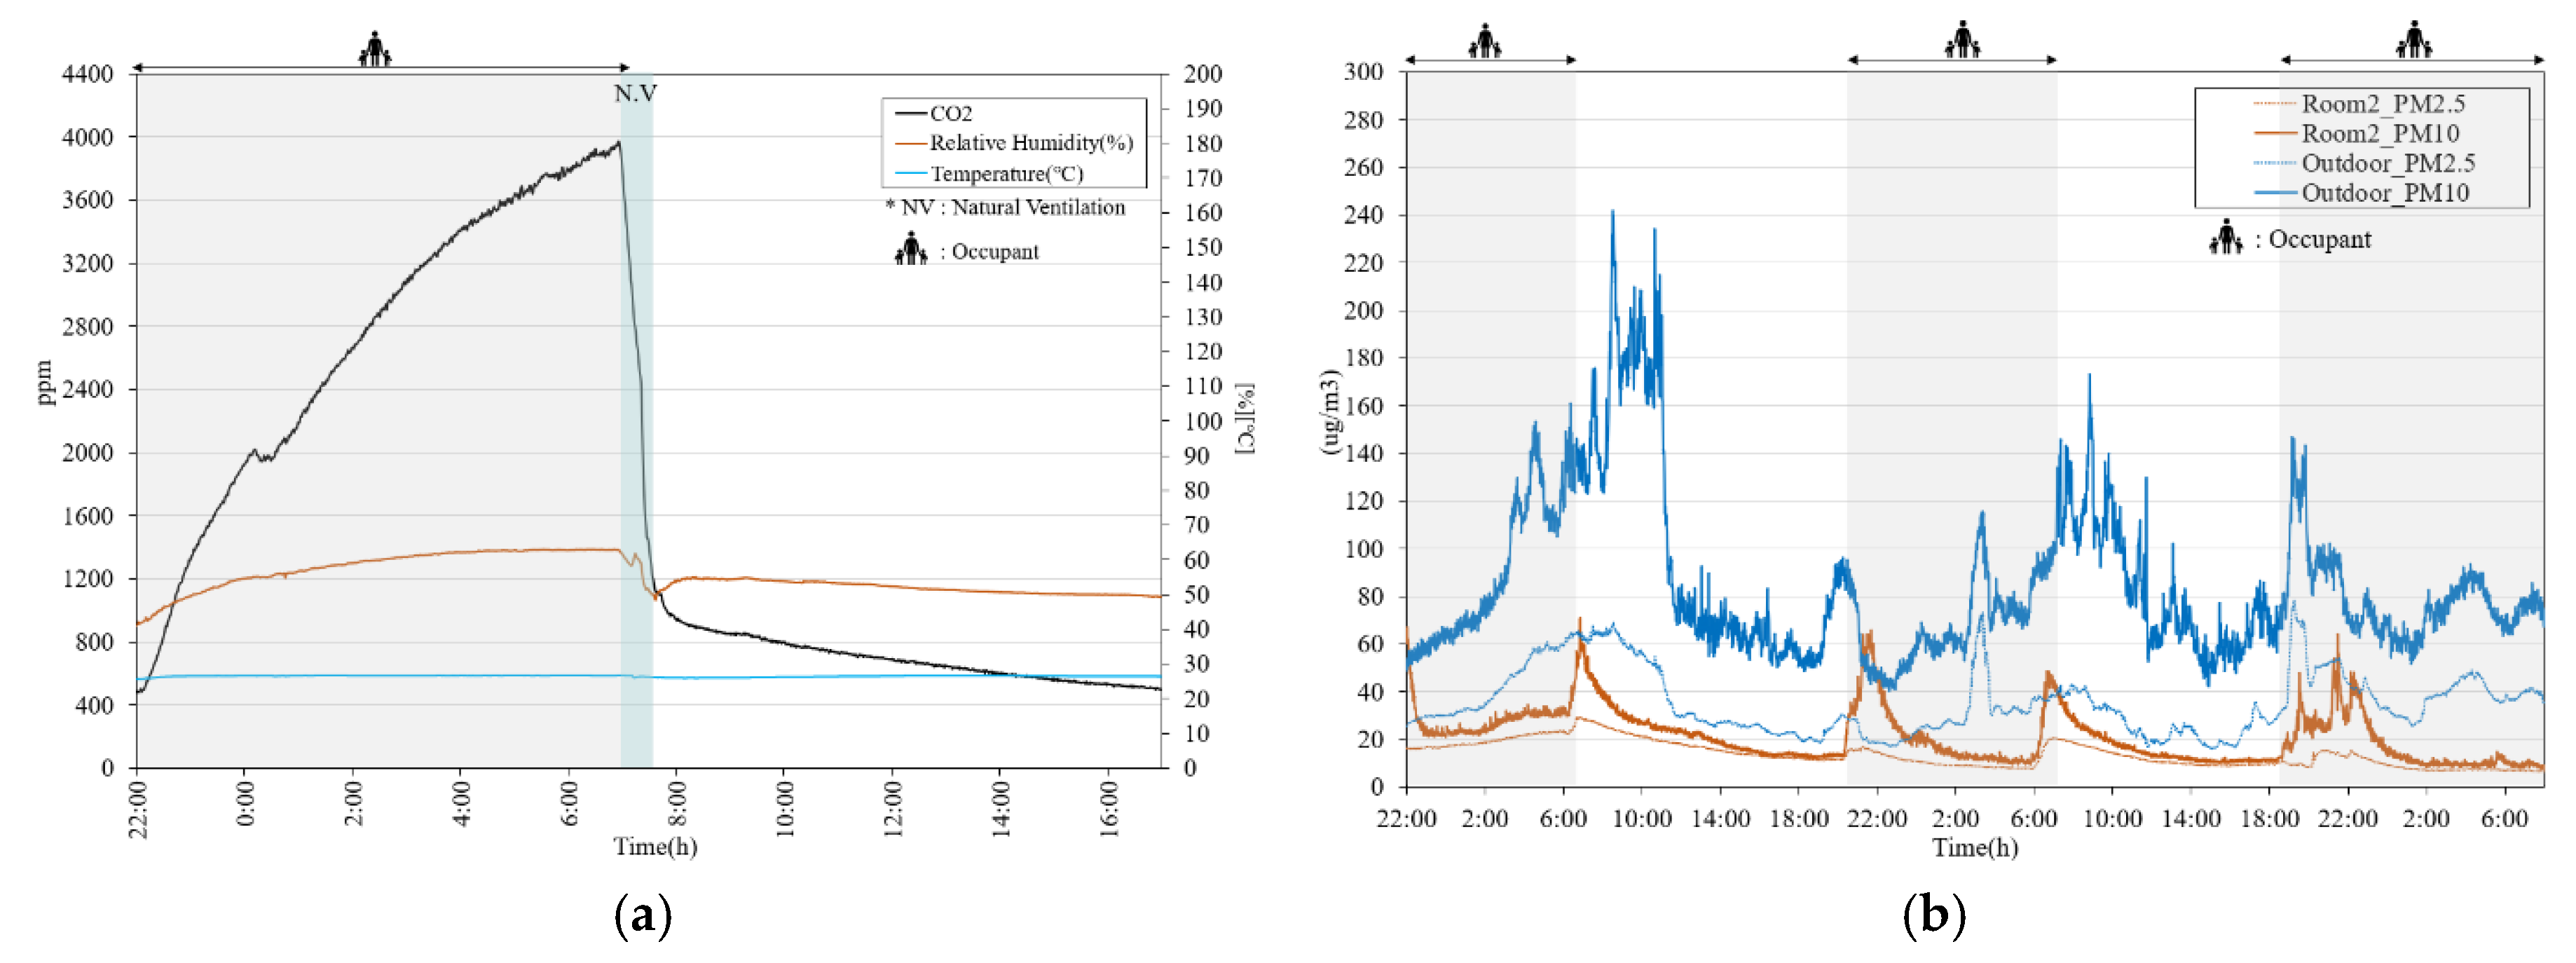
2.1. Measurement of Indoor Air Quality
2.1.1. Outline
2.1.2. Data Analysis
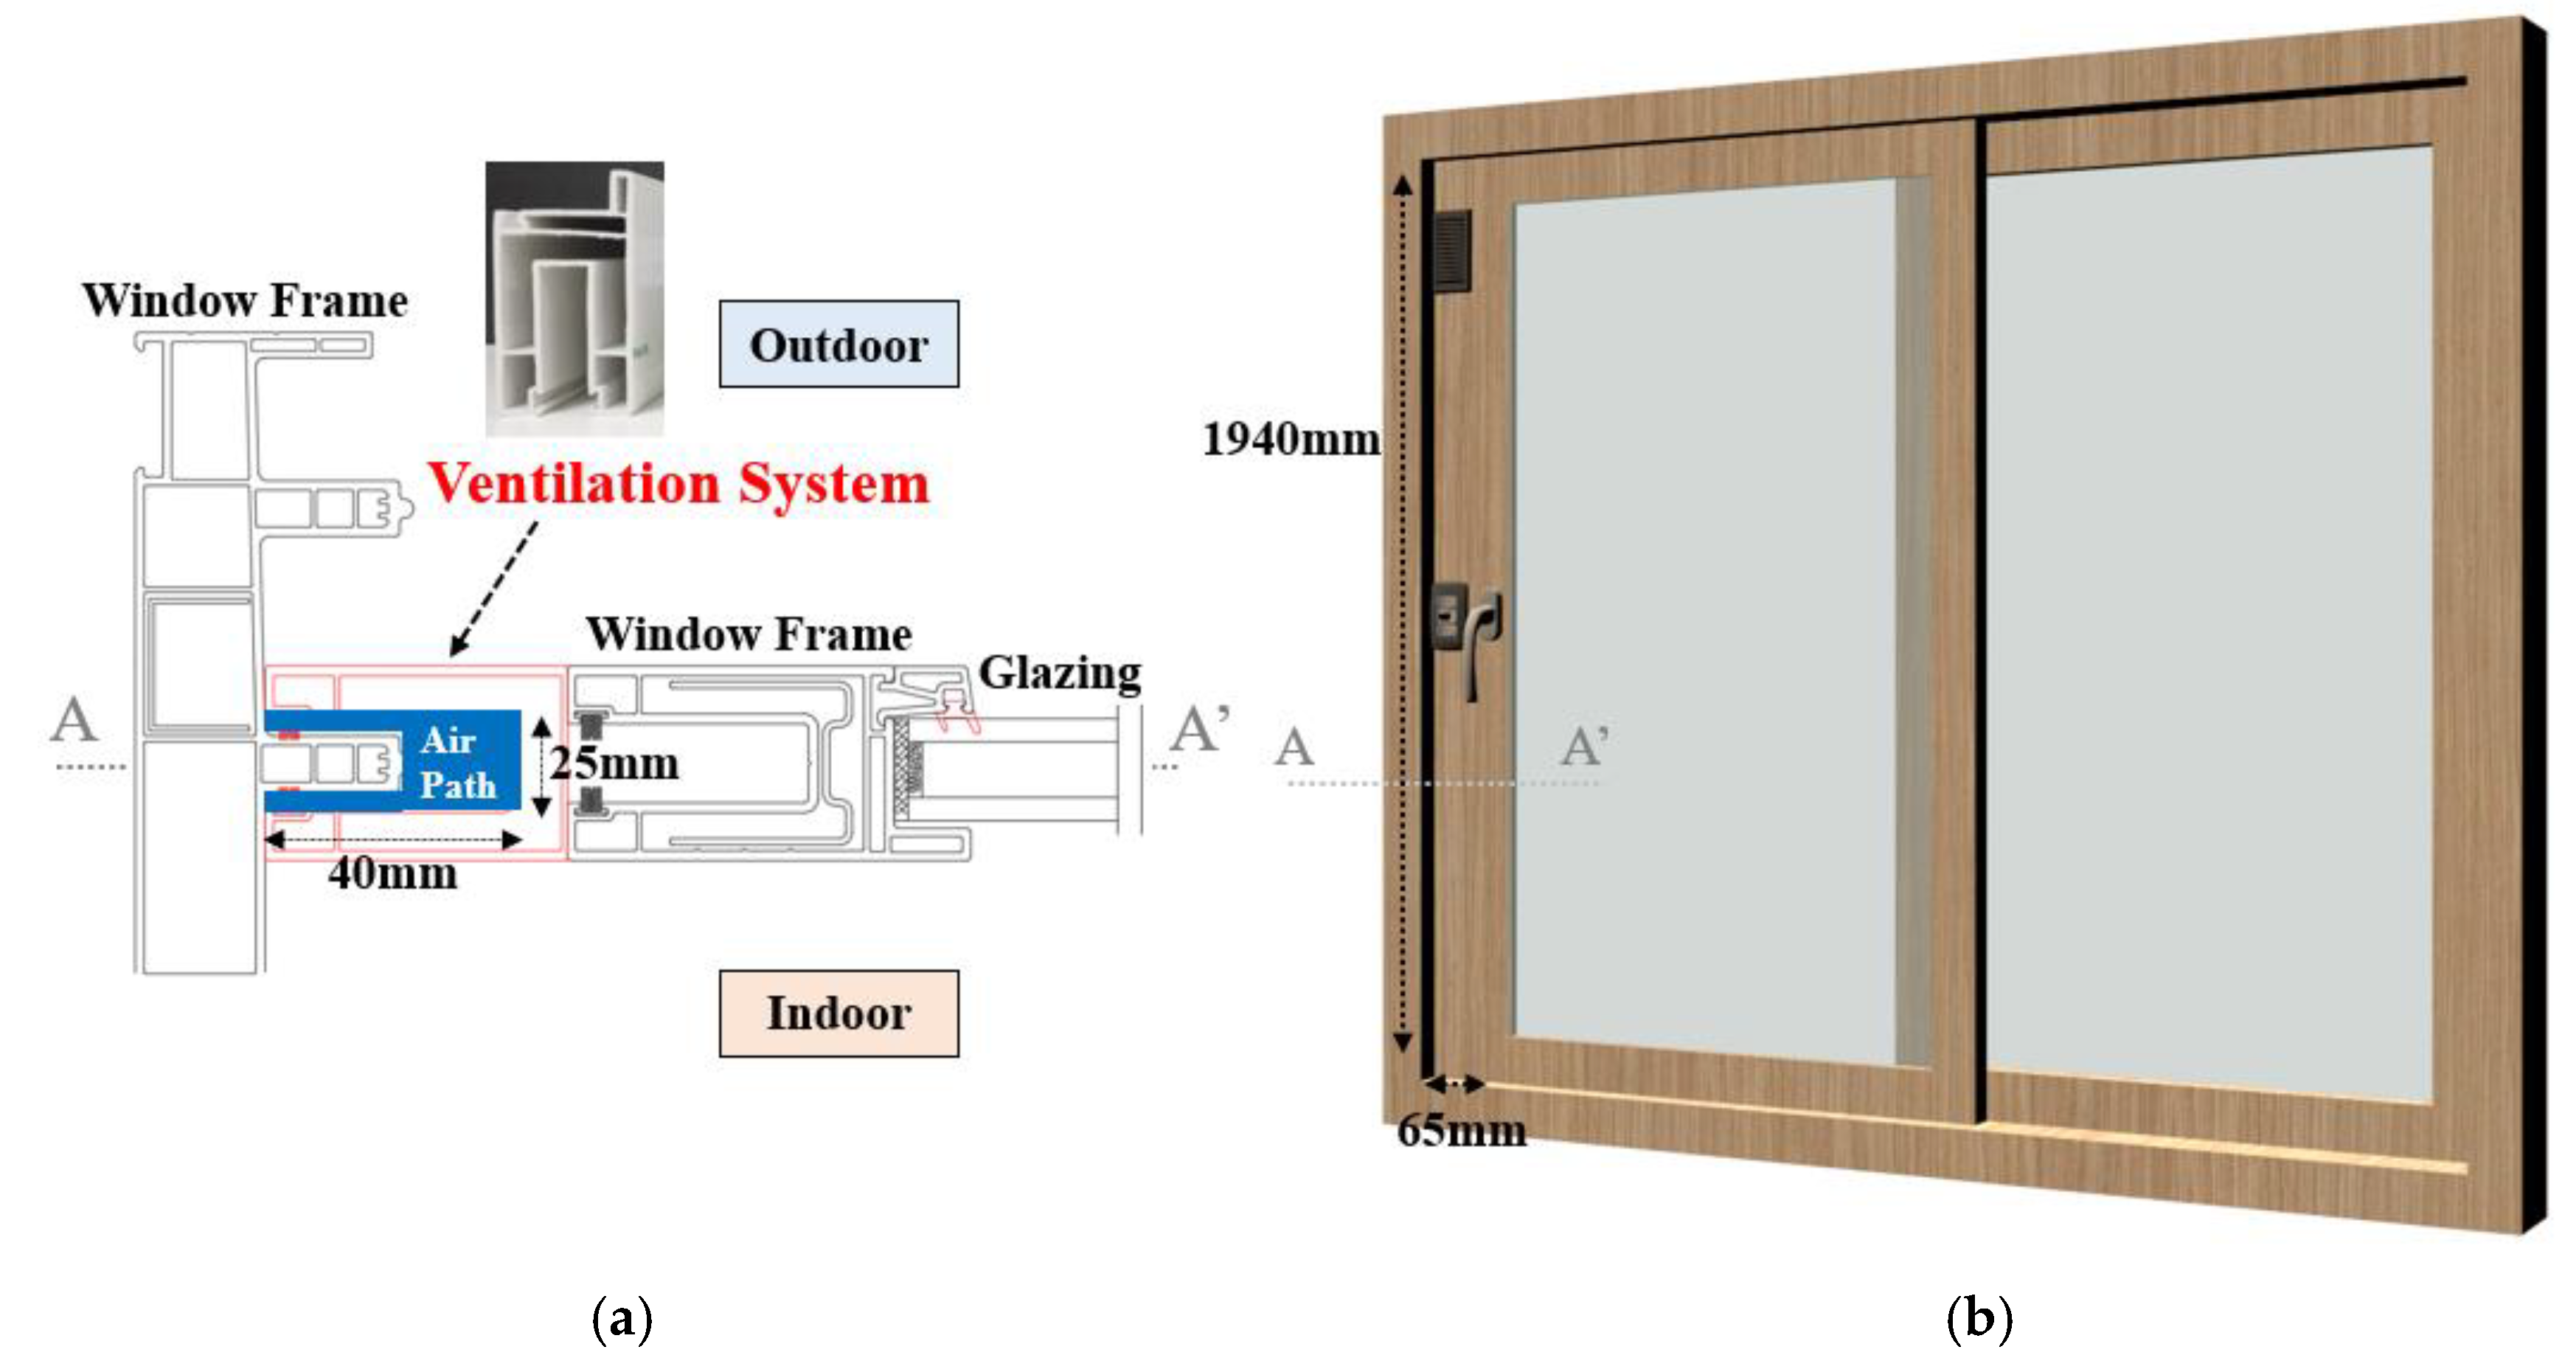
2.2. Development of Ventilation System
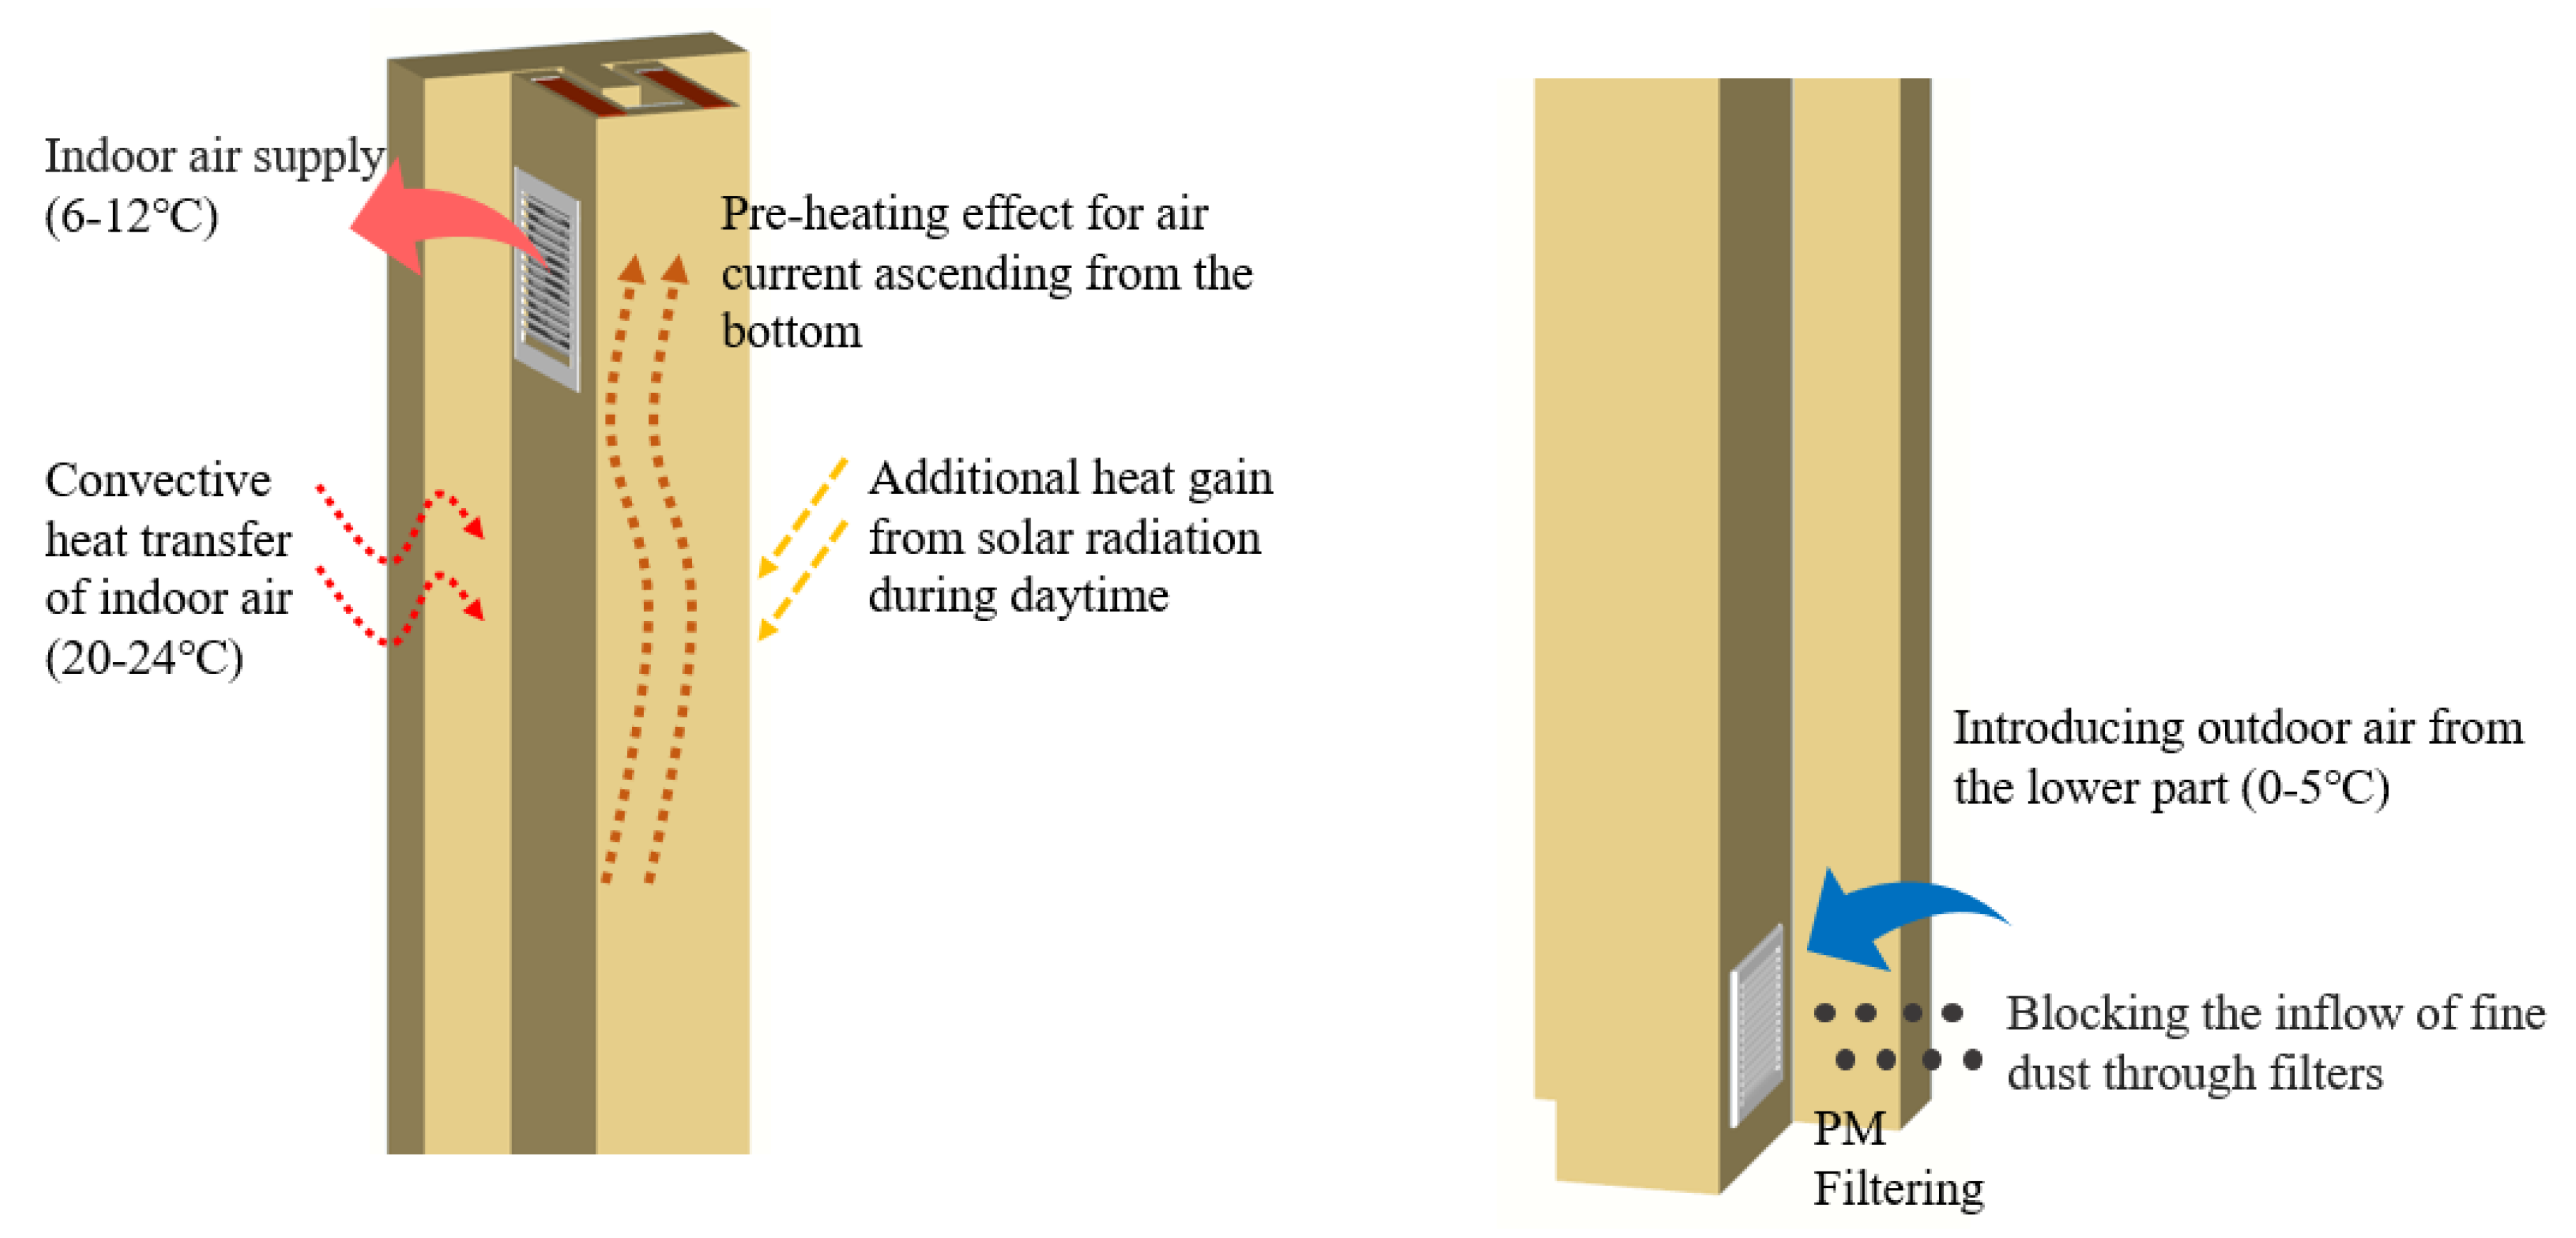
2.2.1. Concept Development
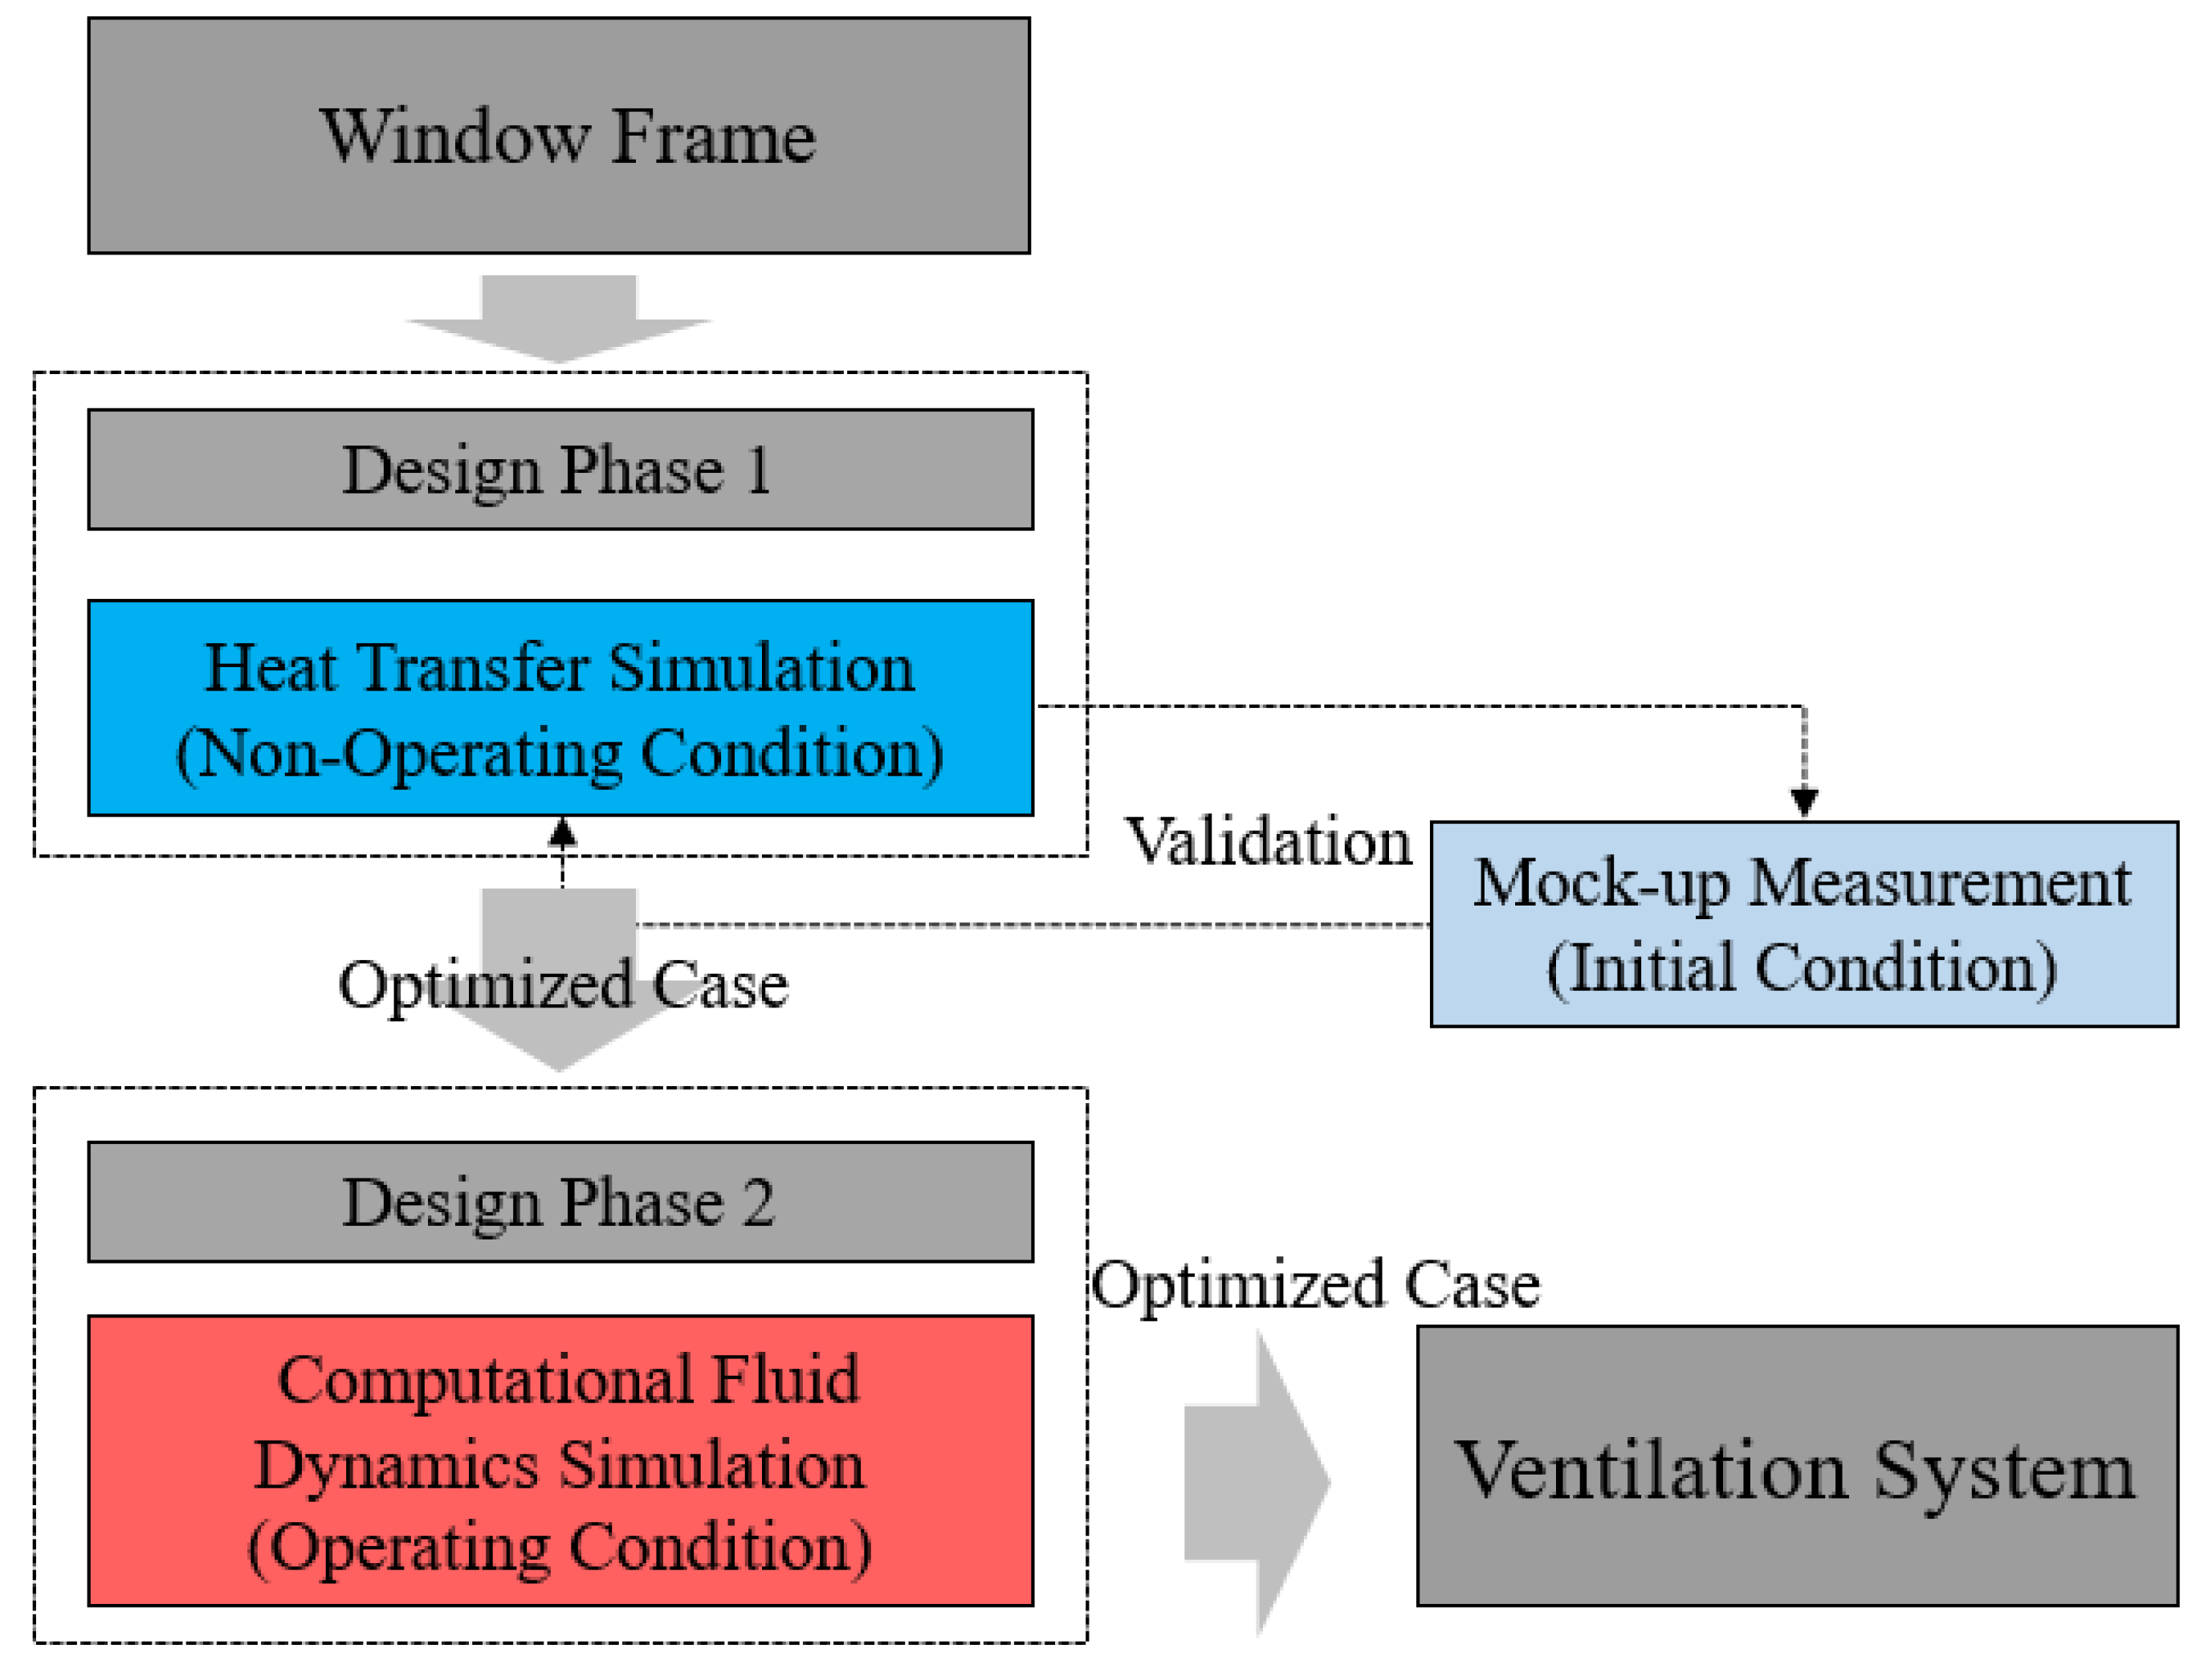
2.2.2. Design Process
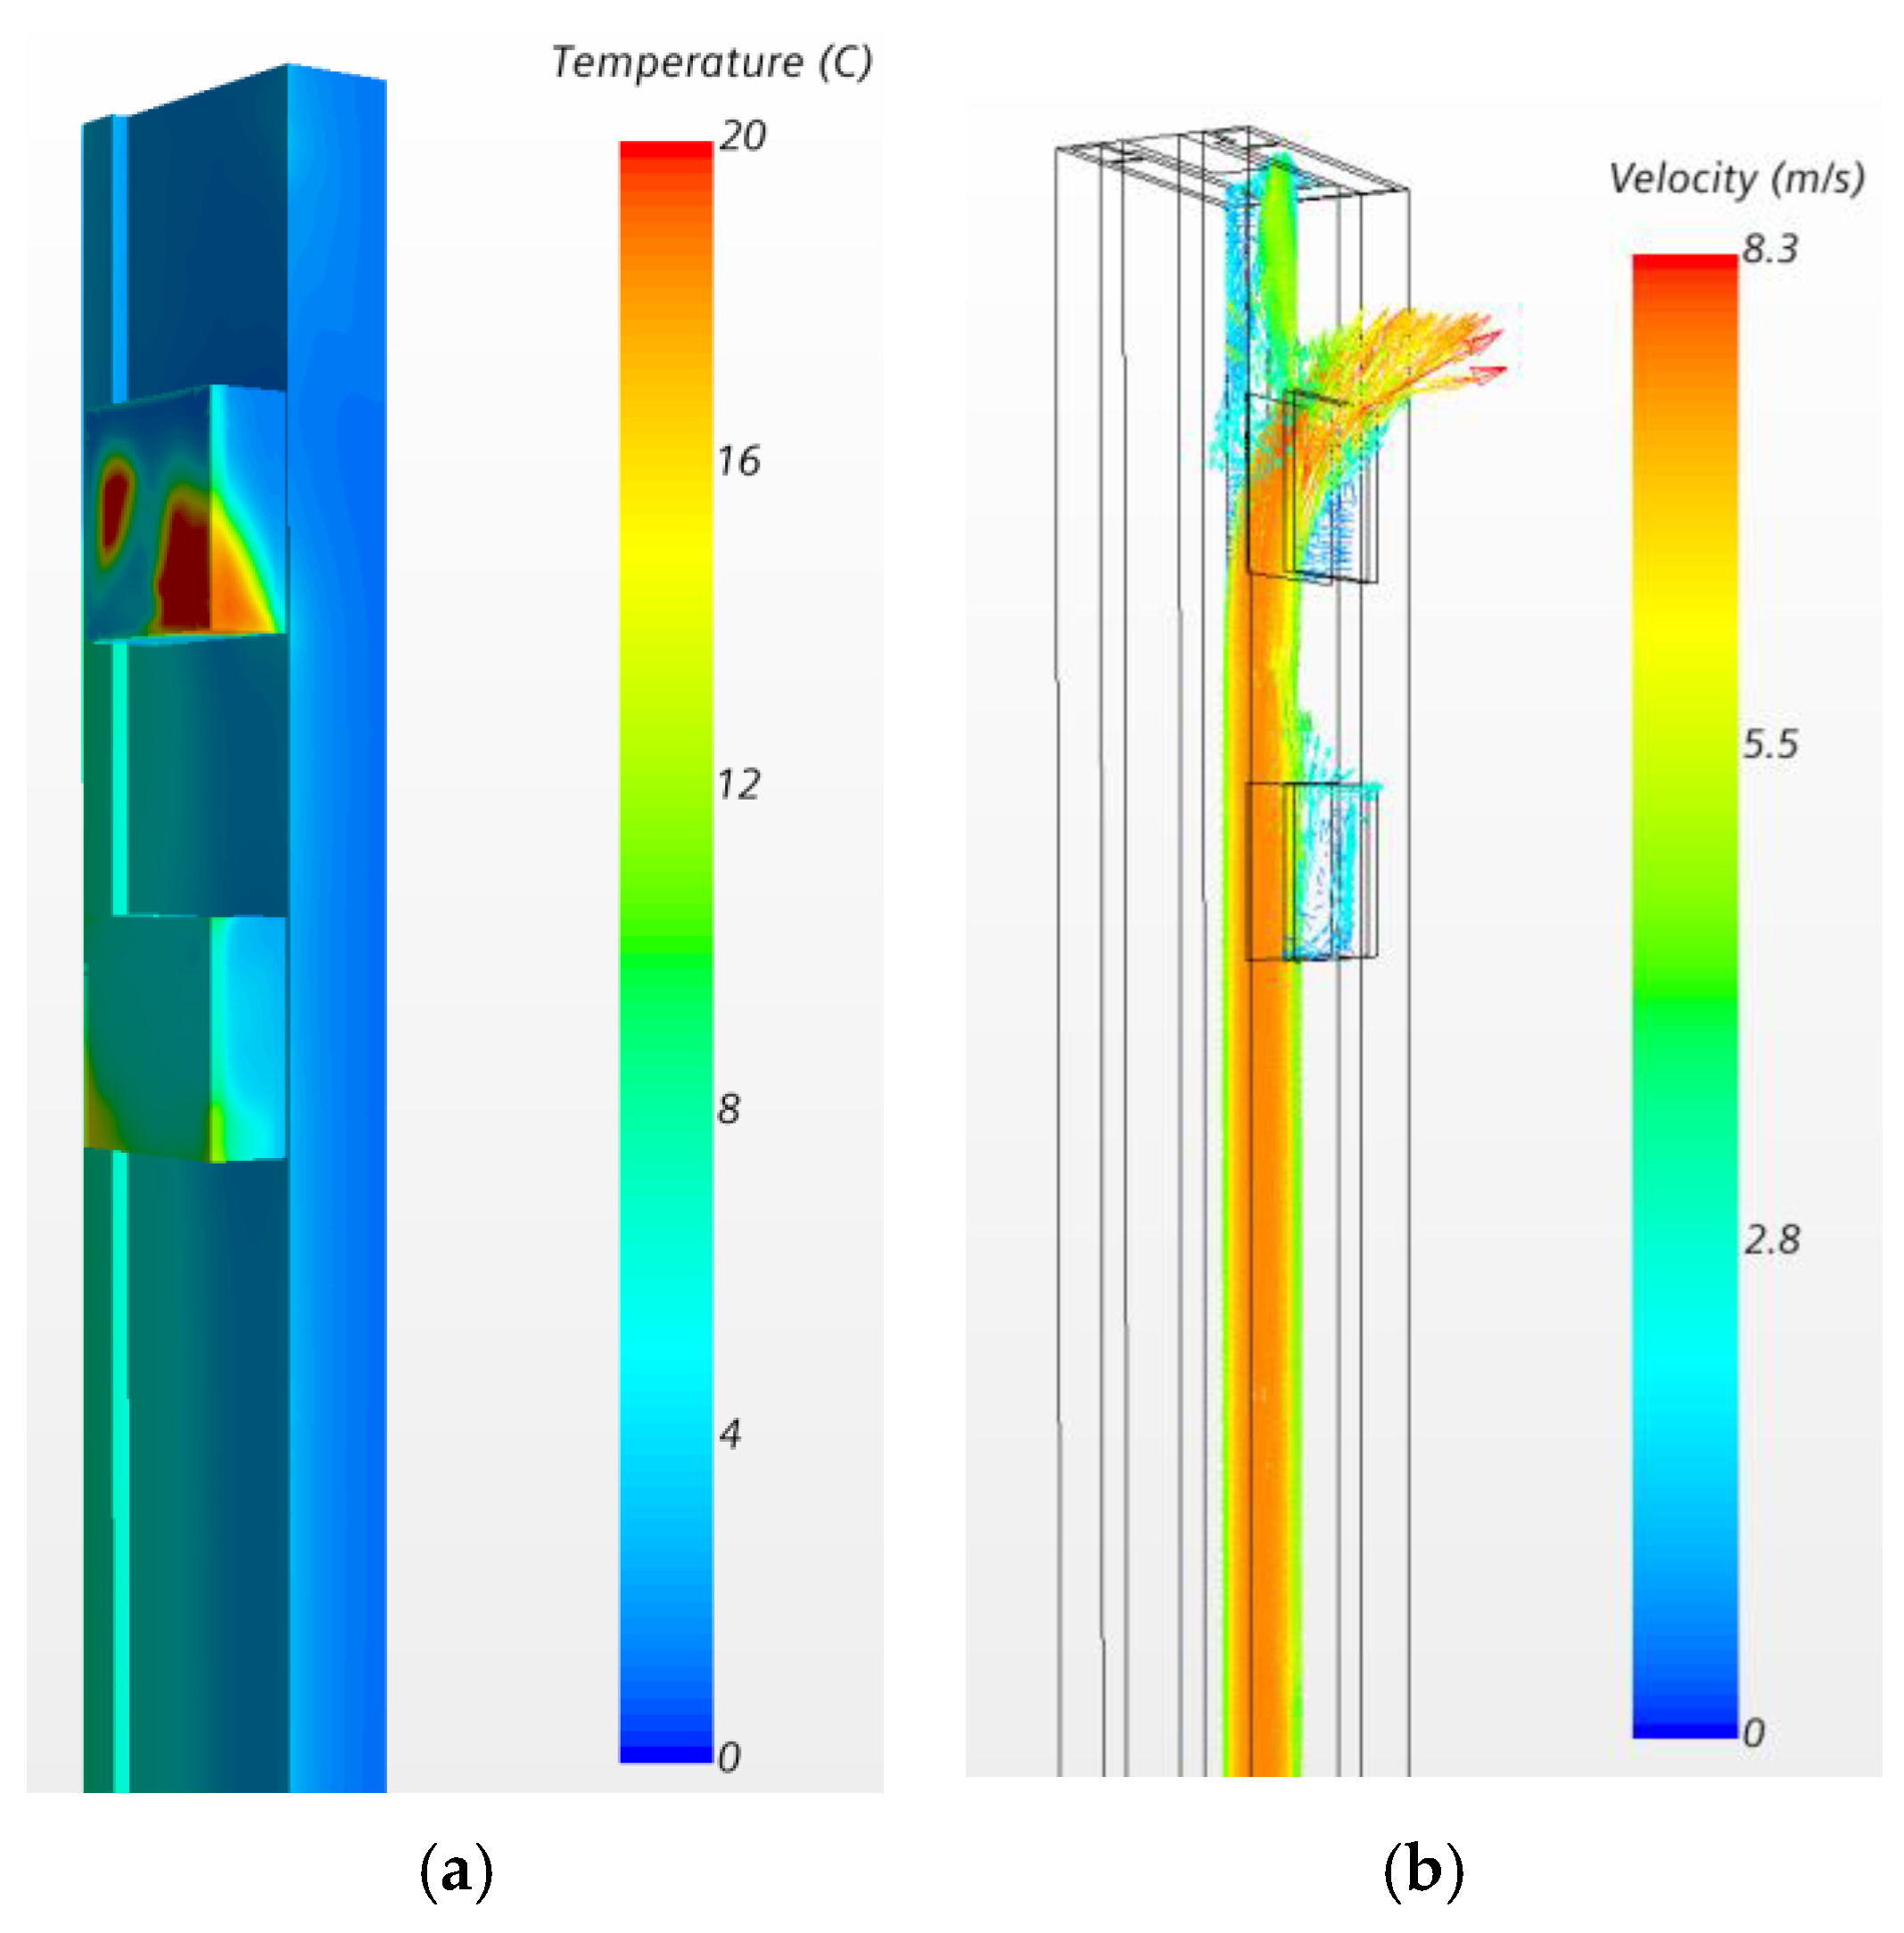
2.2.3. Heat Transfer Simulation
2.2.4. CFD Simulation
2.3. Results and Discussion
3. Conclusions
Author Contributions
Funding
Conflicts of Interest
References
- Derbez, M.; Berthineau, B.; Cochet, V.; Lethrosne, M.; Pignon, C.; Ribéron, J.; Kirchner, S. Indoor Air Quality and Comfort in Seven Newly Built, Energy-Efficient Houses in France. Build. Environ. 2014, 72, 173–187. [Google Scholar] [CrossRef]
- Du, L.; Prasauskas, T.; Leivo, V.M.; Turunen, M.; Pekkonen, M.; Kiviste, M.; Aaltonen, A.; Martuzevicius, D.; Haverinen-Shaughnessy, U. Assessment of Indoor Environmental Quality in Existing Multi-Family Buildings in North–East Europe. Environ. Int. 2015, 79, 74–84. [Google Scholar] [CrossRef] [PubMed]
- Liu, J.; Dai, X.; Li, X.; Jia, S.; Pei, J.; Sun, Y.; Lai, D.; Shen, X.; Sun, H.; Yin, H.; et al. Indoor Air Quality and occupants’ Ventilation Habits in China: Seasonal Measurement and Long-Term Monitoring. Build. Environ. 2018, 142, 119–129. [Google Scholar] [CrossRef]
- Dai, X.; Liu, J.; Li, X.; Zhao, L. Long-Term Monitoring of Indoor CO2 and PM2.5 in Chinese Homes: Concentrations and Their Relationships with Outdoor Environments. Build. Environ. 2018, 144, 238–247. [Google Scholar] [CrossRef]
- Leivo, V.M.; Turunen, M.; Aaltonen, A.; Kiviste, M.; Du, L.; Haverinen-Shaughnessy, U. Impacts of Energy Retrofits on Ventilation Rates, CO2-Levels and Occupants’ Satisfaction With Indoor Air Quality. Energy Procedia 2016, 96, 260–265. [Google Scholar] [CrossRef]
- Sharpe, T.; Farren, P.; Howieson, S.; Tuohy, P.; McQuillan, J. Occupant Interactions and Effectiveness of Natural Ventilation Strategies in Contemporary New Housing in Scotland, UK. Int. J. Environ. Res. Public Health 2015, 12, 8480–8497. [Google Scholar] [CrossRef]
- Bekö, G.; Lund, T.; Nors, F.; Toftum, J.; Clausen, G. Ventilation Rates in the Bedrooms of 500 Danish Children. Build. Environ. 2010, 45, 2289–2295. [Google Scholar] [CrossRef]
- Canha, N.; Mandin, C.; Ramalho, O.; Wyart, G.; Ribéron, J.; Dassonville, C.; Hänninen, O.; Almeida, S.; Derbez, M. Assessment of Ventilation and Indoor Air Pollutants in Nursery and Elementary Schools in France. Indoor Air 2015, 26, 350–365. [Google Scholar] [CrossRef]
- Canha, N.; Alves, A.C.; Marta, C.S.; Lage, J.; Belo, J.; Faria, T.; Verde, S.C.; Viegas, C.; Alves, C.A.; Almeida, S.M. Compliance of Indoor Air Quality During Sleep With Legislation and Guidelines – A Case Study of Lisbon Dwellings. Environ. Pollut. 2020, 264, 114619. [Google Scholar] [CrossRef]
- Strøm-Tejsen, P.; Zukowska-Tejsen, D.; Wargocki, P.; Wyon, D.P. The Effects of Bedroom Air Quality on Sleep and next-day Performance. Indoor Air 2015, 26, 679–686. [Google Scholar] [CrossRef]
- Zhang, N.; Cao, B.; Zhu, Y. Indoor Environment and Sleep Quality: A Research Based on Online Survey and Field Study. Build. Environ. 2018, 137, 198–207. [Google Scholar] [CrossRef]
- Canha, N.; Lage, J.; Candeias, S.; Alves, C.; Almeida, S.M. Indoor Air Quality during Sleep under Different Ventilation Patterns. Atmospheric Pollut. Res. 2017, 8, 1132–1142. [Google Scholar] [CrossRef]
- Accinelli, R.A.; Llanos, O.; Lopez, L.; Pino, M.I.; Bravo, Y.A.; Salinas, V.; Lazo-Porras, M.; Noda, J.R.; Sánchez-Sierra, M.; Zárate, L.; et al. Adherence to Reduced-Polluting Biomass Fuel Stoves Improves Respiratory and Sleep Symptoms in Children. BMC Pediatr. 2014, 14, 12. [Google Scholar] [CrossRef] [PubMed]
- Ai, Z.; Mak, C.M.; Niu, J.; Li, Z. The Assessment of the Performance of Balconies Using Computational Fluid Dynamics. Build. Serv. Eng. Res. Technol. 2011, 32, 229–243. [Google Scholar] [CrossRef]
- Chand, I.; Bhargava, P.; Krishak, N. Effect of Balconies on Ventilation Inducing Aeromotive Force on Low-Rise Buildings. Build. Environ. 1998, 33, 385–396. [Google Scholar] [CrossRef]
- Maier, T.; Krzaczek, M.; Tejchman, J. Comparison of Physical Performances of the Ventilation Systems in Low-Energy Residential Houses. Energy Build. 2009, 41, 337–353. [Google Scholar] [CrossRef]
- Choi, Y.; Song, D. How to Quantify Natural Ventilation Rate of Single-Sided Ventilation With Trickle Ventilator? Build. Environ. 2020, 181, 107119. [Google Scholar] [CrossRef]
- Chen, C.; Zhao, B. Review of Relationship between Indoor and Outdoor Particles: I/O Ratio, Infiltration Factor and Penetration Factor. Atmospheric Environ. 2011, 45, 275–288. [Google Scholar] [CrossRef]
- Kim, J.-H.; Kim, H.-J.; Yoo, S.-H. Public Value of Enforcing the PM2.5 Concentration Reduction Policy in South Korean Urban Areas. Sustainability 2018, 10, 1144. [Google Scholar] [CrossRef]
- Gao, J.; Woodward, A.; Vardoulakis, S.; Kovats, R.S.; Wilkinson, P.; Li, L.; Xu, L.; Li, J.; Yang, J.; Cao, L.; et al. Haze, Public Health and Mitigation Measures in China: A Review of the Current Evidence for Further Policy Response. Sci. Total Environ. 2017, 578, 148–157. [Google Scholar] [CrossRef]
- Carlos, J.S.; Corvacho, H.; Silva, P.D.; Castro-Gomes, J. Real Climate Experimental Study of Two Double Window Systems With Preheating of Ventilation Air. Energy Build. 2010, 42, 928–934. [Google Scholar] [CrossRef]
- Carlos, J.S. Optimizing the Ventilated Double Window for Solar Collection. Sol. Energy 2017, 150, 454–462. [Google Scholar] [CrossRef]
- De Gracia, A.; Castell, A.; Navarro, L.; Oró, E.; Cabeza, L.F. Numerical Modelling of Ventilated Facades: A Review. Renew. Sustain. Energy Rev. 2013, 22, 539–549. [Google Scholar] [CrossRef]
- Carlos, J.S.; Corvacho, H.; Silva, P.D.; Castro-Gomes, J.; Sedira, N. Modelling and Simulation of a Ventilated Double Window. Appl. Therm. Eng. 2011, 31, 93–102. [Google Scholar] [CrossRef]
- Carlos, J.S.; Corvacho, H.; Silva, P.D.; Castro-Gomes, J.; Sedira, N. Heat Recovery Versus Solar Collection in a Ventilated Double Window. Appl. Therm. Eng. 2012, 37, 258–266. [Google Scholar] [CrossRef]
- Liu, M.; Heiselberg, P.K.; Larsen, O.K.; Mortensen, L.; Rose, J. Investigation of Different Configurations of a Ventilated Window to Optimize Both Energy Efficiency and Thermal Comfort. Energy Procedia 2017, 132, 478–483. [Google Scholar] [CrossRef]
- Appelfeld, D.; Svendsen, S. Experimental Analysis of Energy Performance F a Ventilated Window for Heat Recovery under Controlled Conditions. Energy Build. 2011, 43, 3200–3207. [Google Scholar] [CrossRef]
- Dugué, A.; Raji, S.; Bonnamy, P.; Bruneau, D. E2VENT: An Energy Efficient Ventilated Façade Retrofitting System. Presentation of the Embedded LHTES System. Procedia Environ. Sci. 2017, 38, 121–129. [Google Scholar] [CrossRef]
- Martinez, A.; Urra, I.; Hernandez, J.; Diallo, T.; Zhao, X. Development of a Smart Modular Heat Recovery Unit Adaptable into a Ventilated Façade. Procedia Environ. Sci. 2017, 38, 94–101. [Google Scholar] [CrossRef][Green Version]
- Coydon, F.; Herkel, S.; Kuber, T.; Pfafferott, J.; Himmelsbach, S. Energy Performance of façade Integrated Decentralized Ventilation Systems. Energy Build. 2015, 107, 172–180. [Google Scholar] [CrossRef]
- Dermentzis, G.; Ochs, F.; Siegele, D.; Feist, W. Renovation With an Innovative Compact Heating and Ventilation System Integrated into the façade—An in-Situ Monitoring Case Study. Energy Build. 2018, 165, 451–463. [Google Scholar] [CrossRef]
- Bielek, B.; Szabó, D.; Lavrinčík, M. Transparent Elemental Facade with an Integrated Ventilation Unit for a High-Rise Building—Development and Experimental Verification. Slovak J. Civ. Eng. 2018, 26, 66–77. [Google Scholar] [CrossRef]
- Zhang, N.; Jin, W.; He, J. Experimental Study on the Influence of Ventilated Window on Indoor Air Quality and Energy Consumption. Procedia Eng. 2016, 146, 296–302. [Google Scholar] [CrossRef]


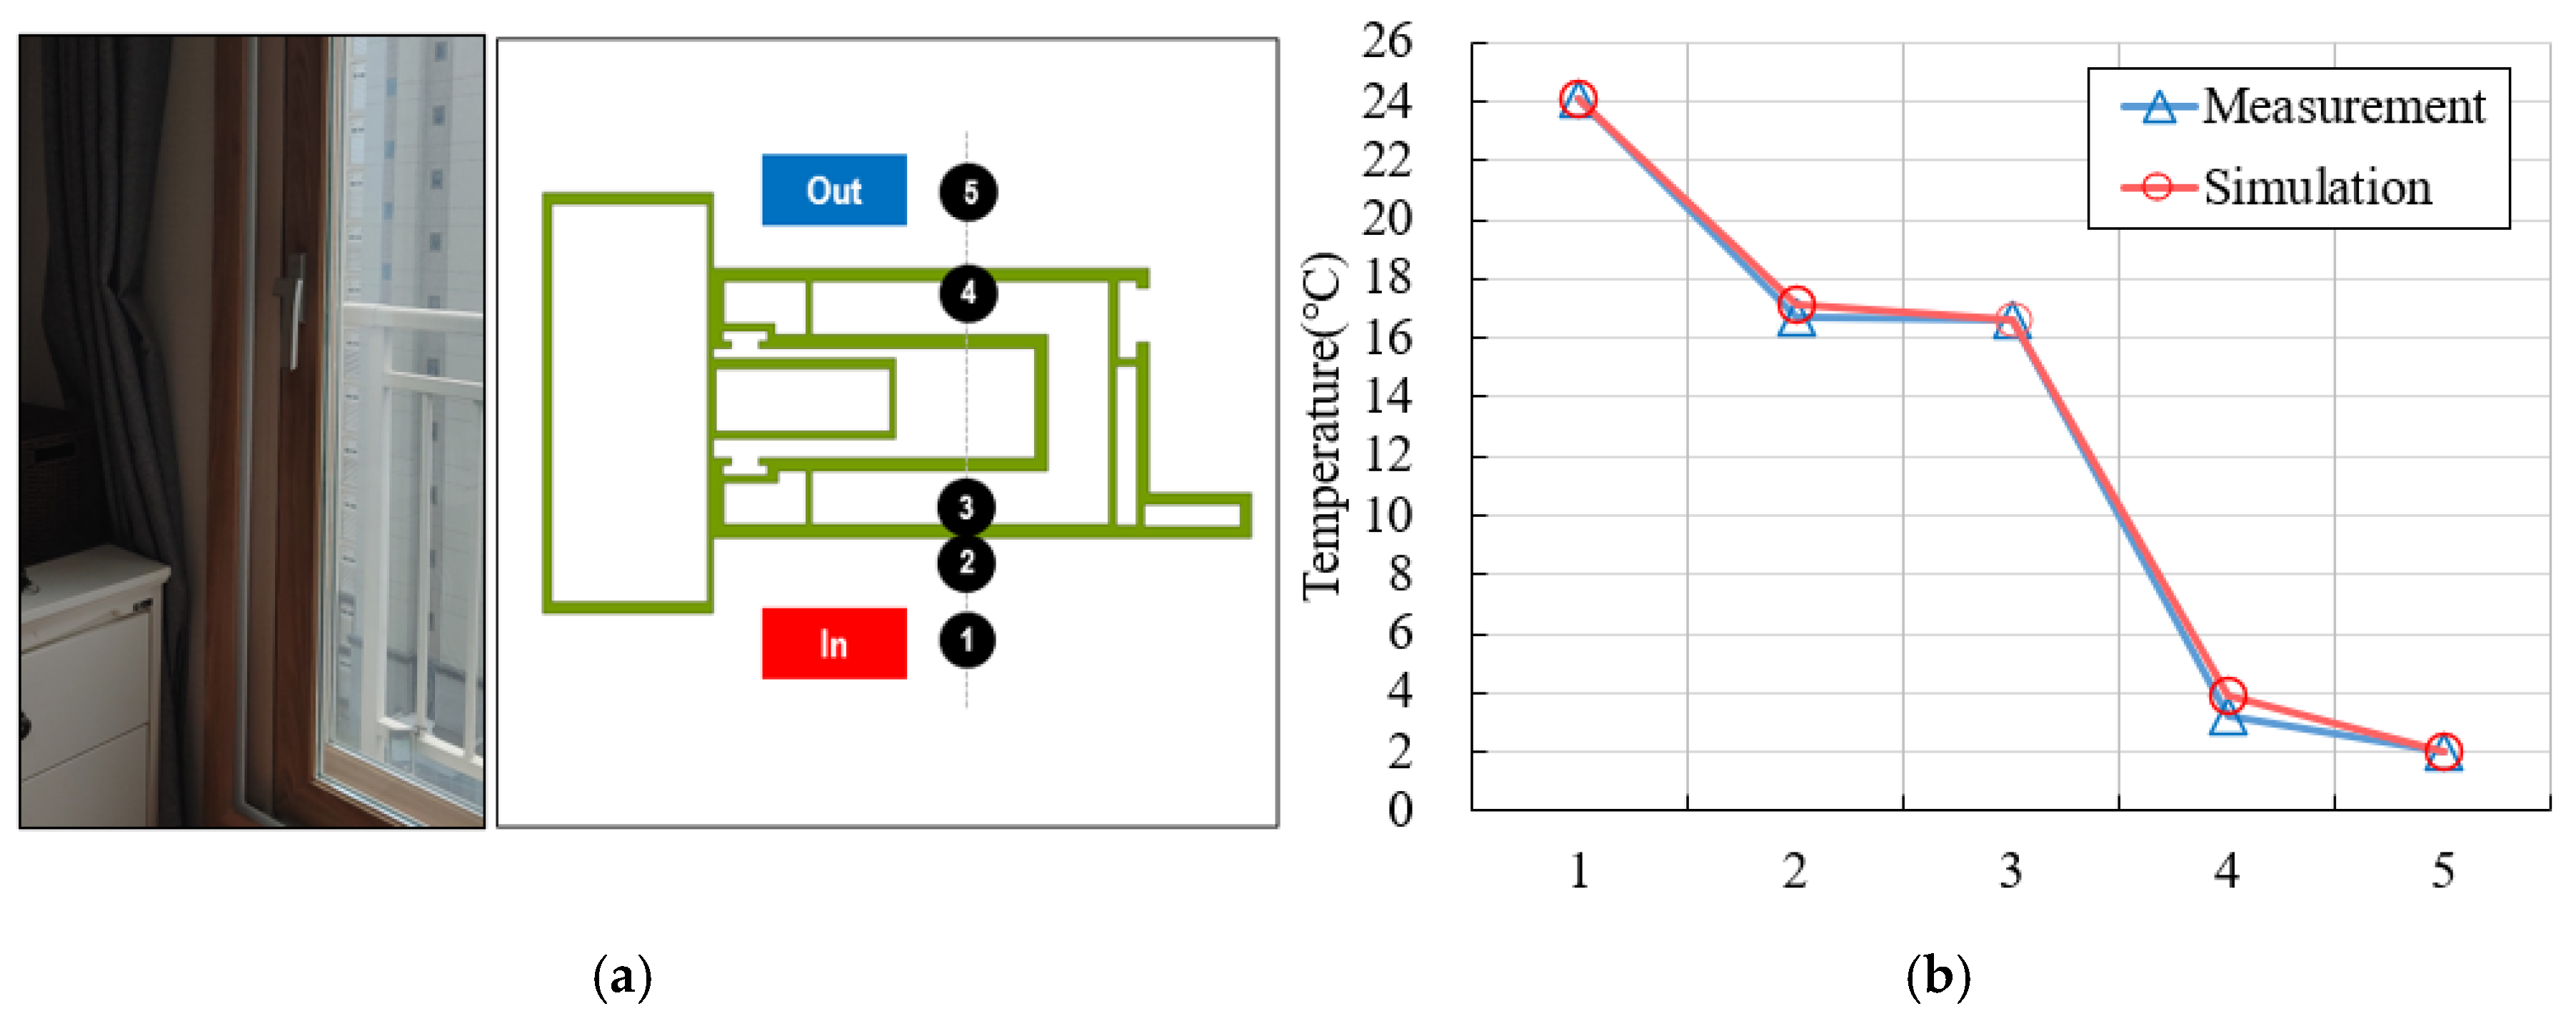
| Point | 1 (Indoor) | 2 | 3 | 4 | 5 (Outdoor) |
|---|---|---|---|---|---|
| Measurement (°C) | 24 | 16.7 | 16.6 | 3.2 | 2 |
| Simulation (°C) | 24 | 17.1 | 16.6 | 3.9 | 2 |
| Error rate (%) | - | 0.02 | 0 | 0.18 | - |
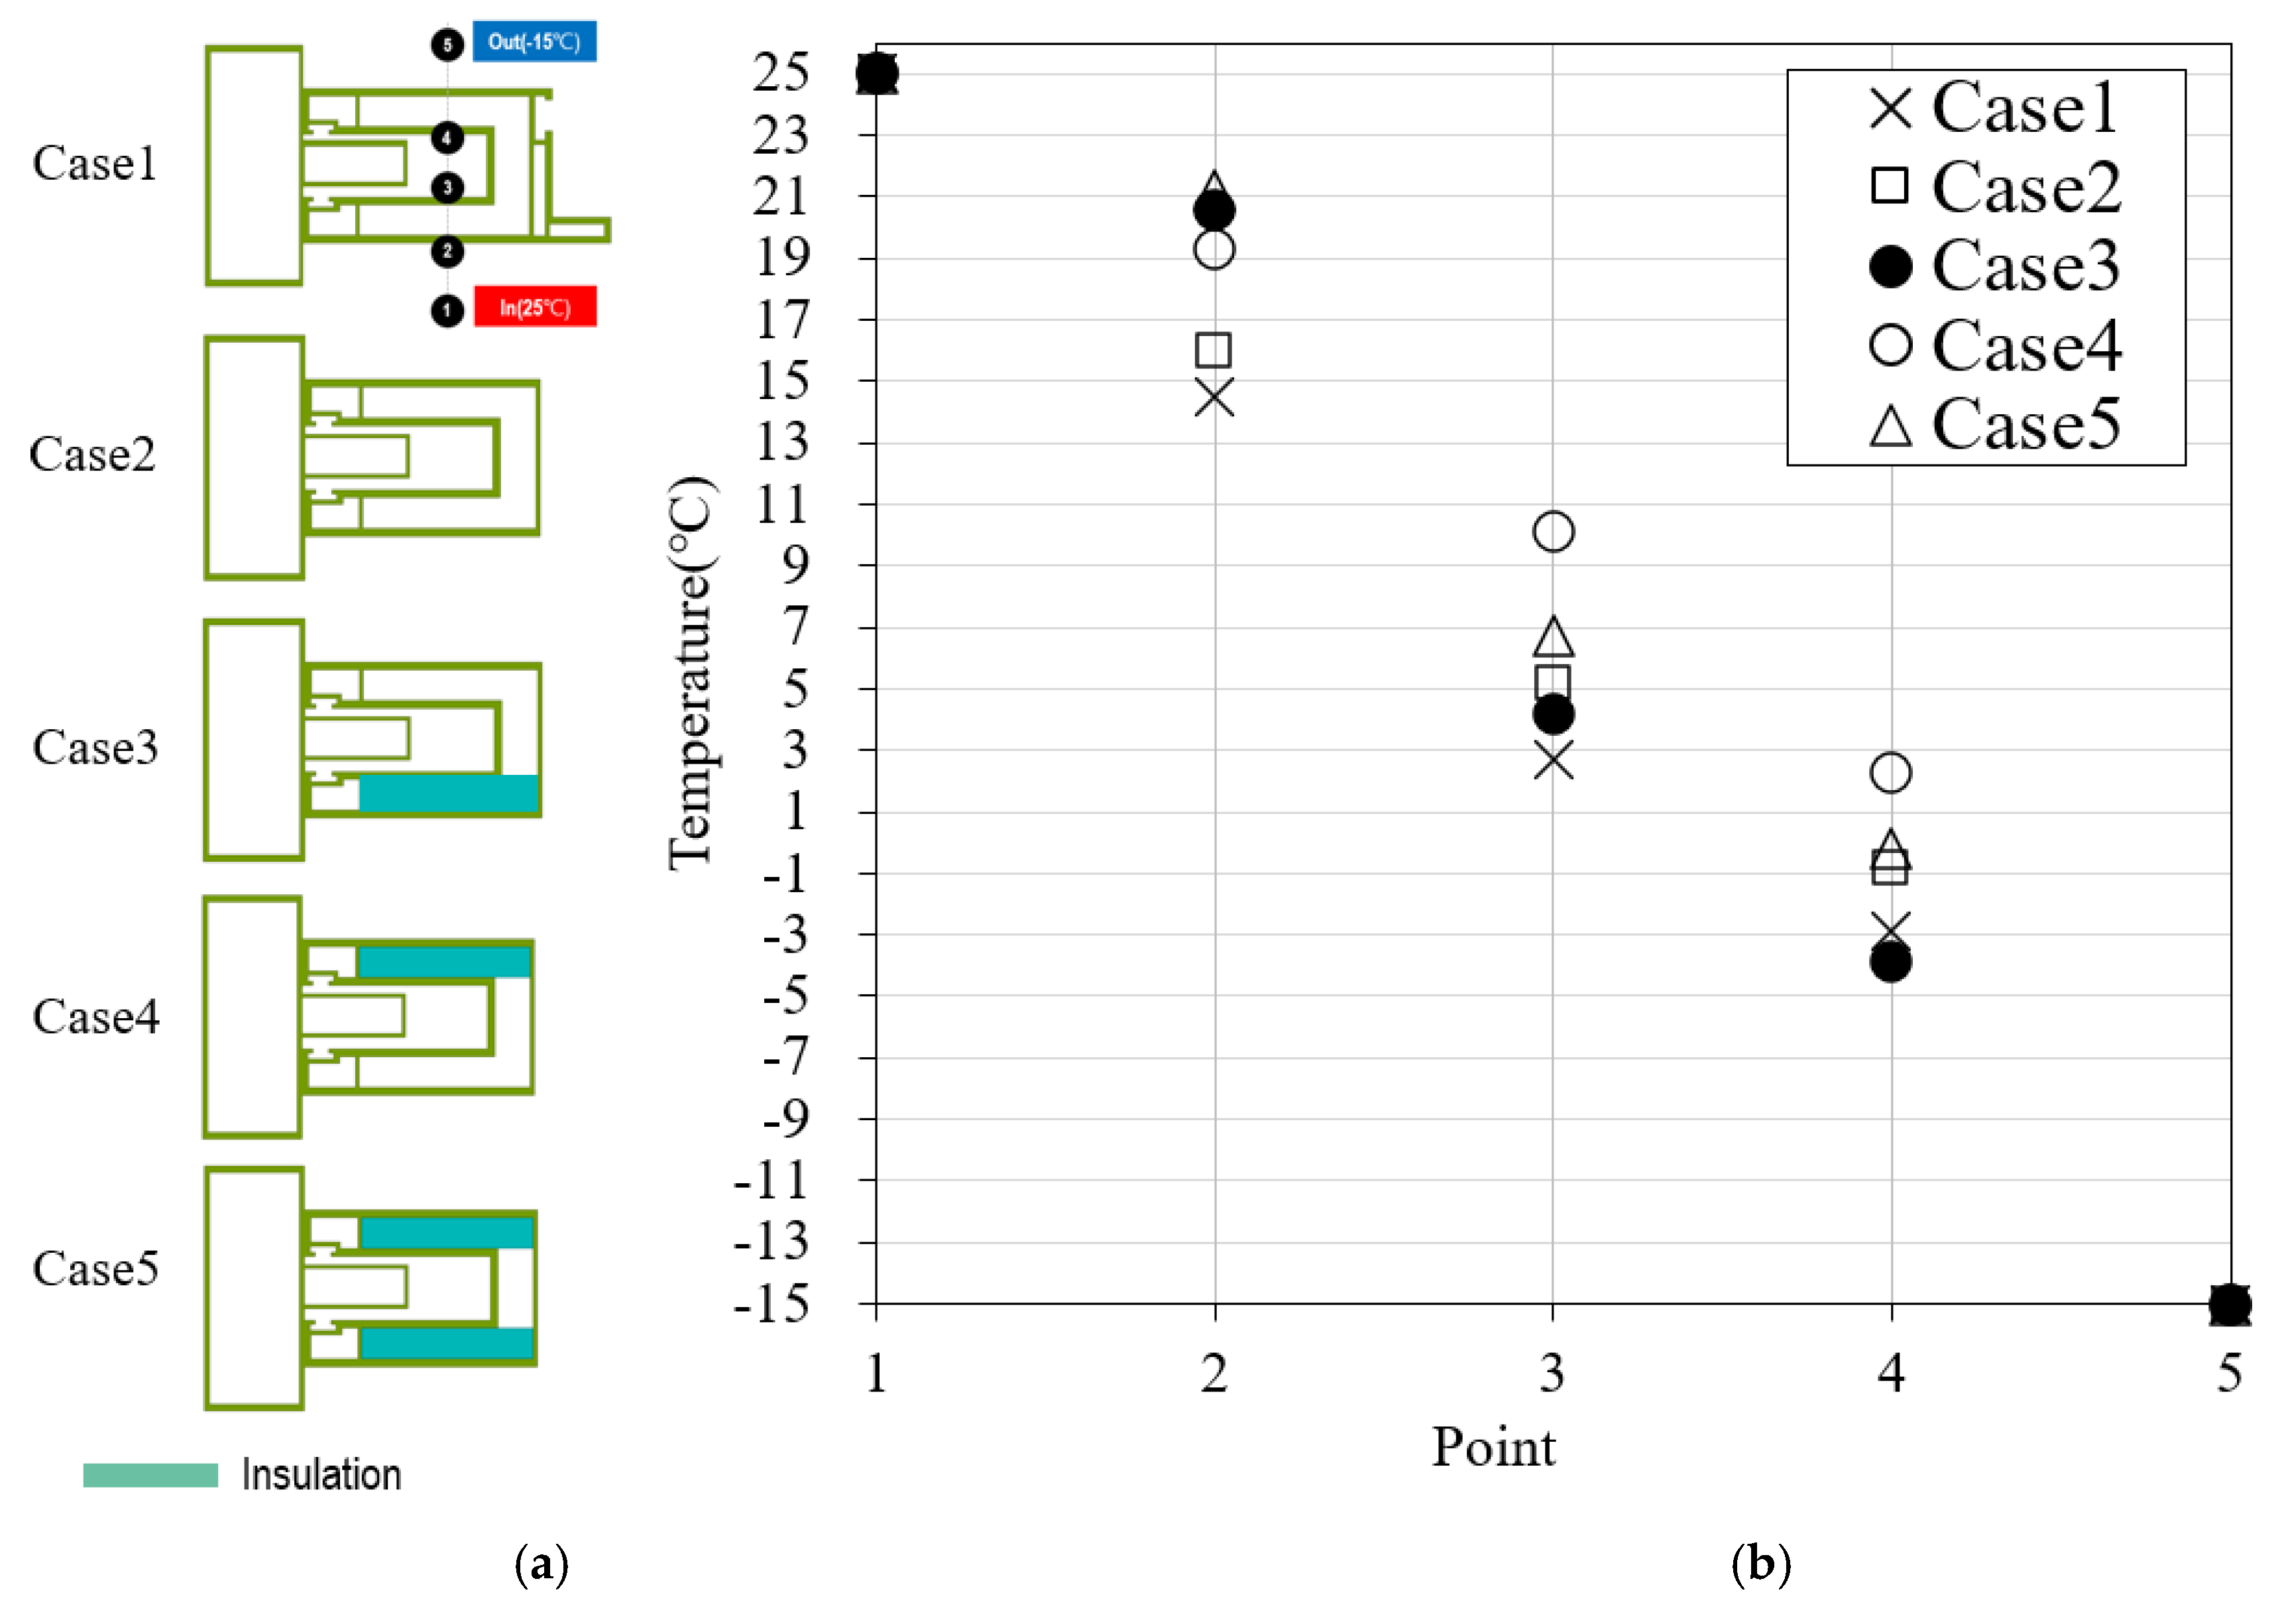
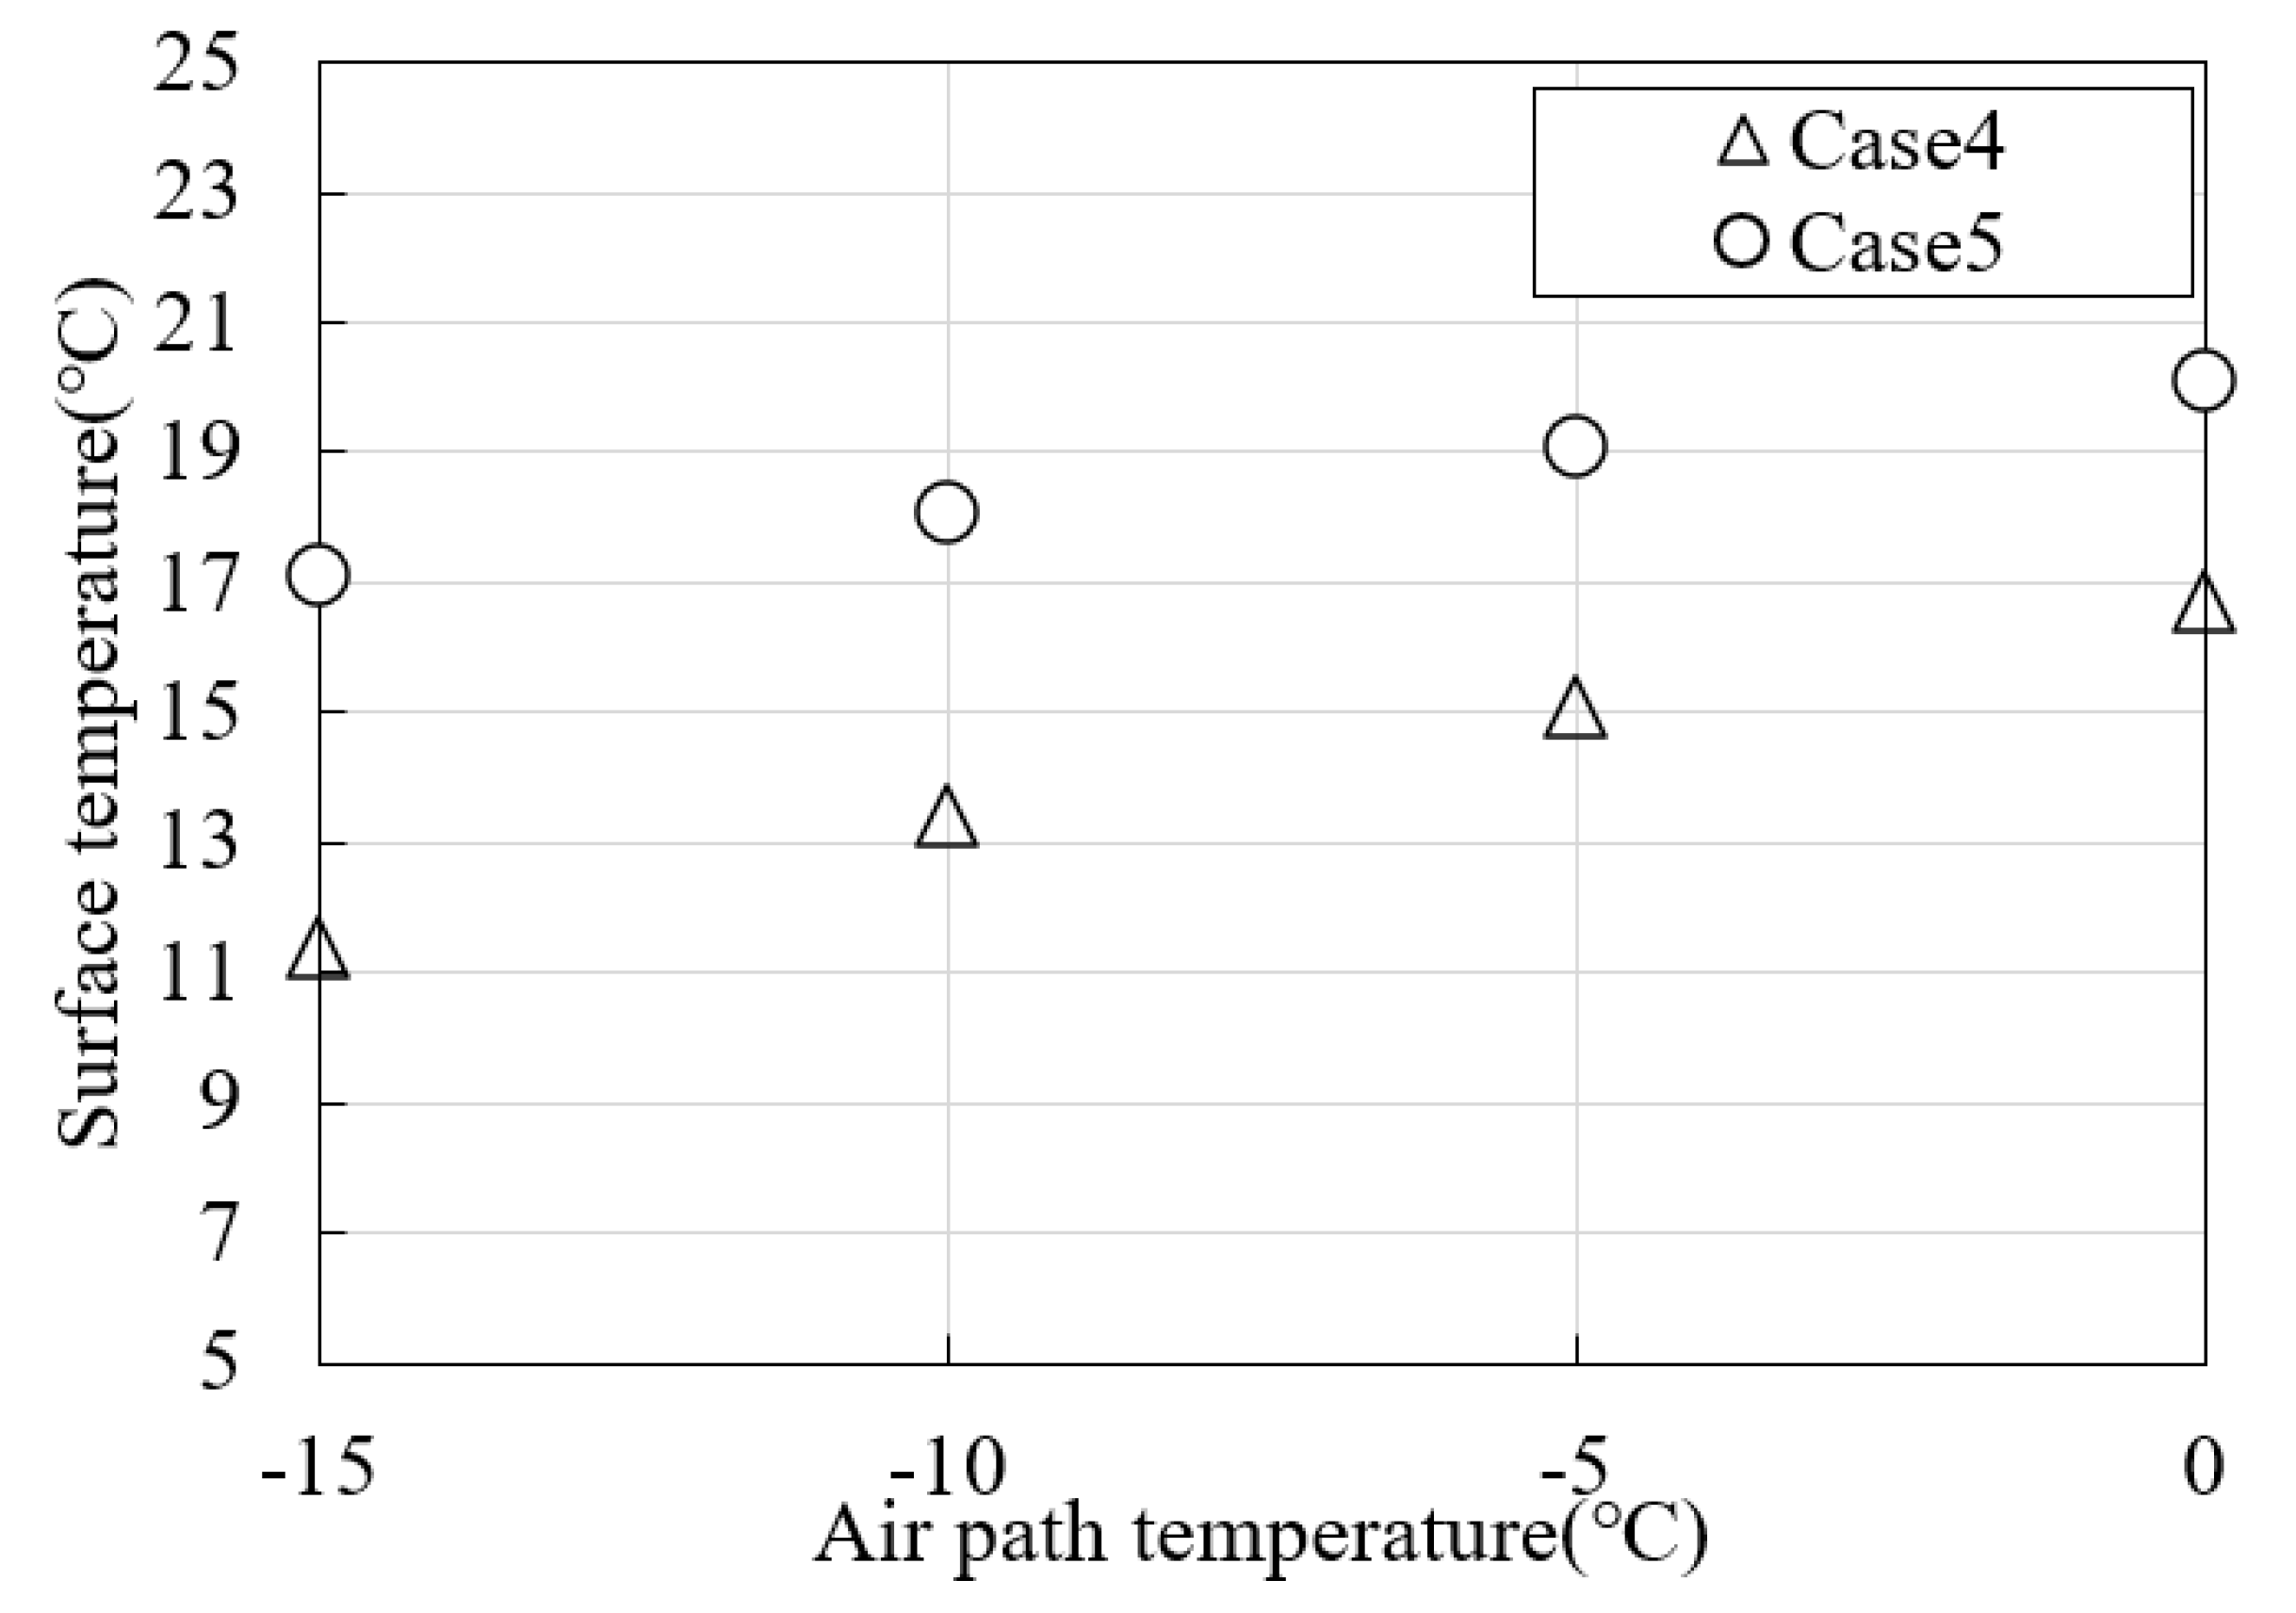
| Point | 1 | 2 | 3 | 4 | 5 | Min. Surface Temperature | Dew Point | Condensation Status |
|---|---|---|---|---|---|---|---|---|
| Case 1 | 25 | 14.5 | 2.7 | −2.9 | −15 | 6.3 | 13.9 | Yes |
| Case 2 | 25 | 16 | 5.2 | −0.8 | −15 | 13.2 | Yes | |
| Case 3 | 25 | 20.6 | 4.2 | −3.9 | −15 | 13.3 | Yes | |
| Case 4 | 25 | 19.3 | 10.1 | 2.3 | −15 | 14.4 | No | |
| Case 5 | 25 | 21.2 | 6.7 | −0.2 | −15 | 14 | No |
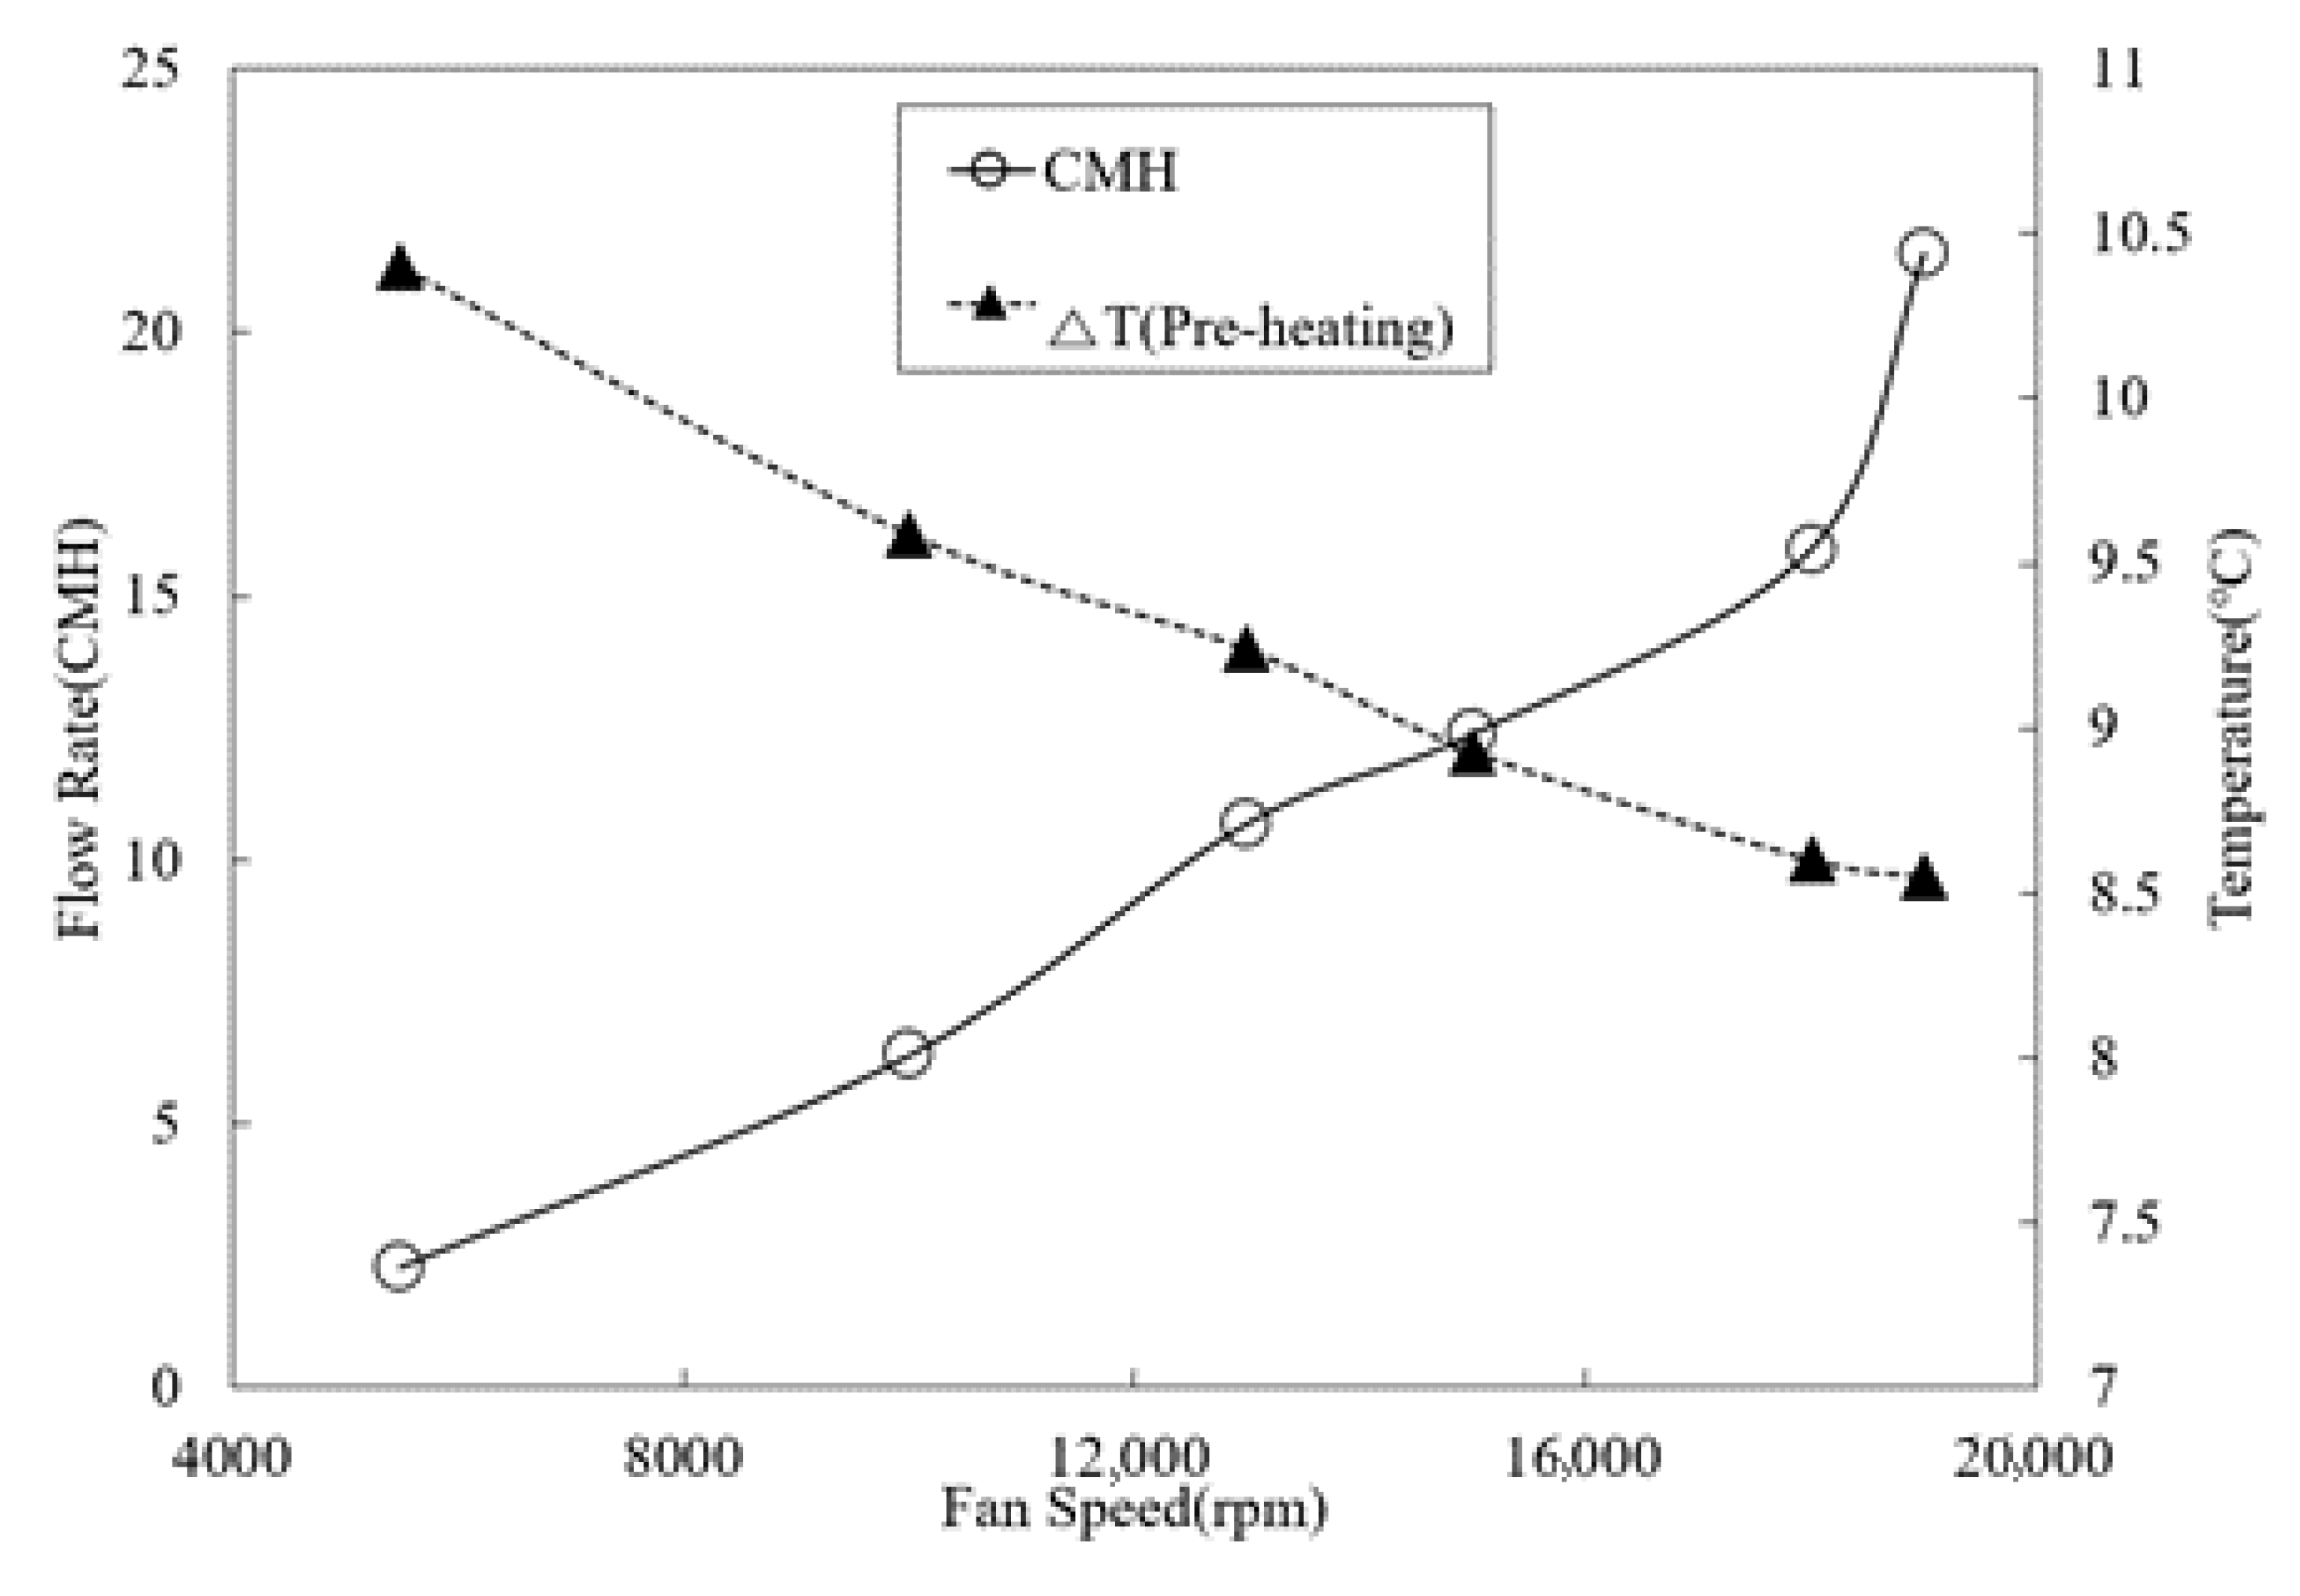
| Cases | Fan Speed (rpm) | Supply Air Velocity (m/s) | Supply Air Flow (CMH) | Average Surface Temperature (°C) | Air Change Rate (ACH) |
|---|---|---|---|---|---|
| 1 | 5500 | 0.62 | 2.3 | 16.5 | 0.09 |
| 2 | 10,000 | 1.47 | 6.3 | 15.8 | 0.25 |
| 3 | 13,000 | 2.62 | 10.7 | 15.5 | 0.43 |
| 4 | 15,000 | 3.02 | 12.5 | 15.4 | 0.5 |
| 5 | 18,000 | 3.91 | 15.9 | 15.3 | 0.64 |
| 6 | 19,000 | 5.05 | 21.5 | 15.2 | 0.86 |
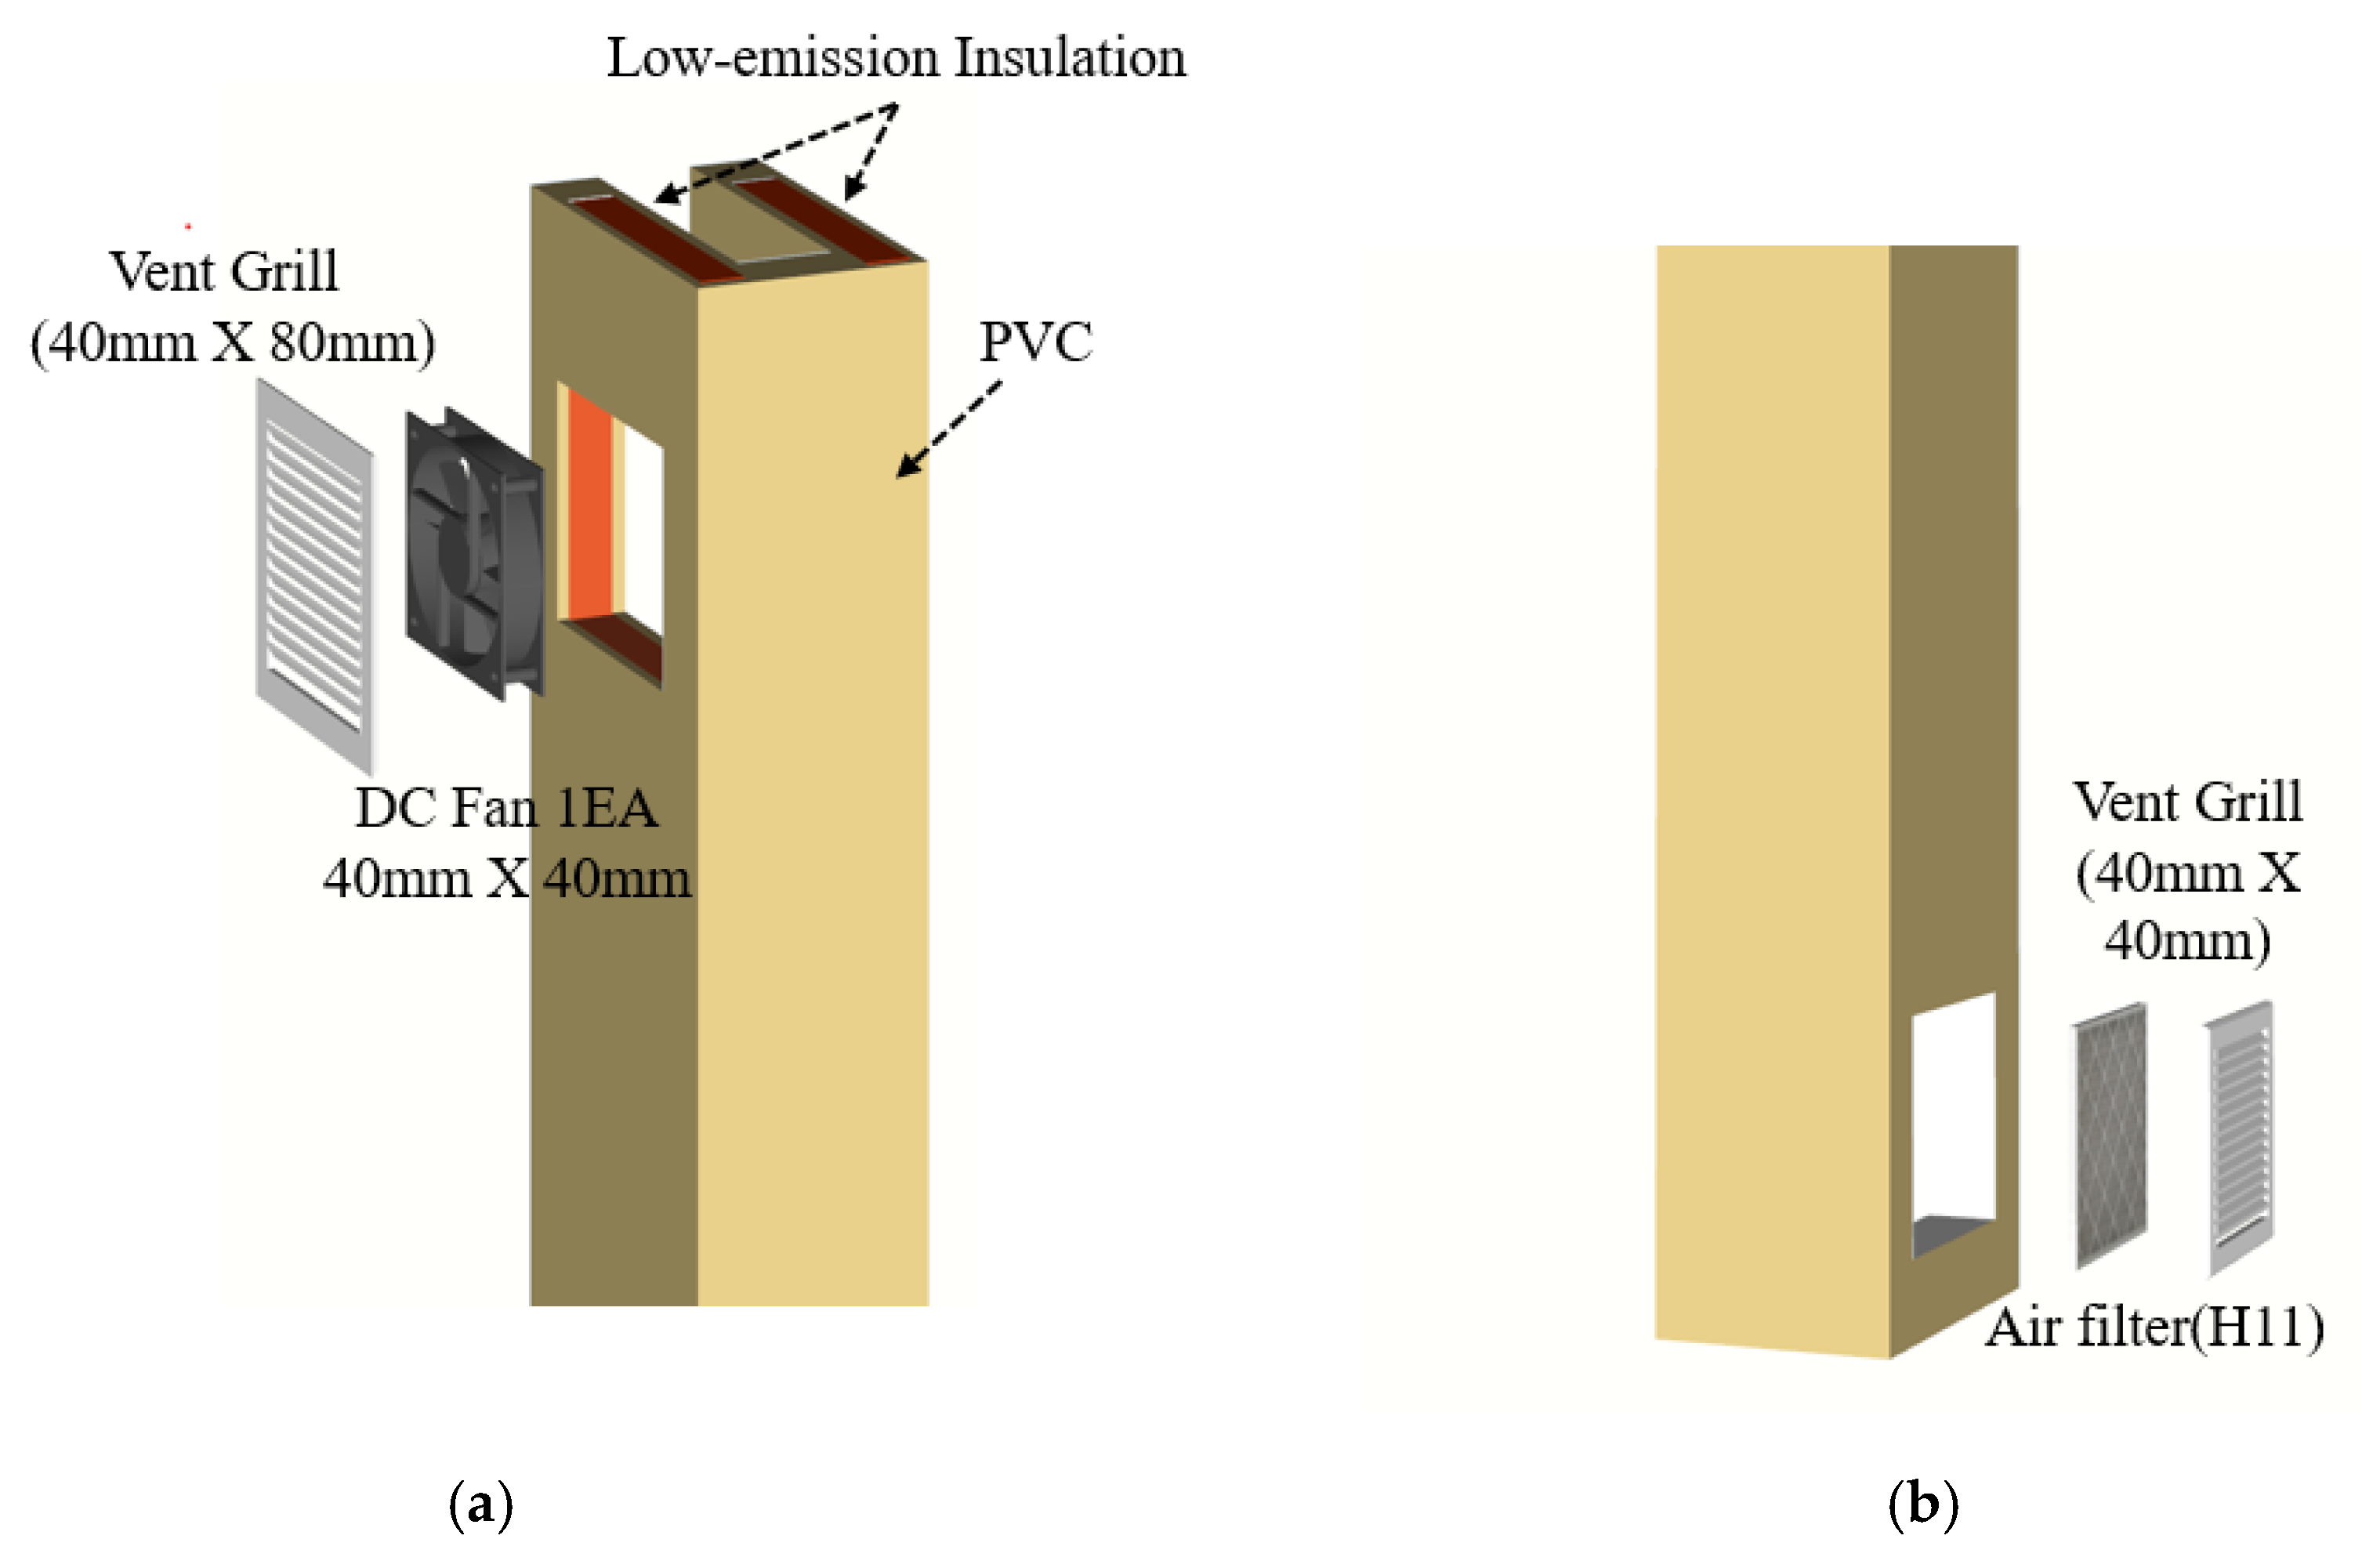
| Components | Number of Units | Specification | |
|---|---|---|---|
| Window Frame | 1EA | Materials | PVC |
| Size (mm) | W65, D40, H1940 | ||
| Low-e Insulation | 2EA | Thermal Conductivity | 0.025 W/m × K |
| Fan | 1EA | Rated Voltage | 12VDC |
| Input Current | 0.25 A (max 0.5 A) | ||
| Speed | 15,000 RPM | ||
| Actual Air Volume | 12.5 CMH | ||
| Size (mm) | 40 × 40 × 28 | ||
| Particle Filter | 2EA | Types | Matters |
| Grades | H11 (EN1822) | ||
| Vent Grill | 2EA | Size (mm) | 40 × 80 |
© 2020 by the authors. Licensee MDPI, Basel, Switzerland. This article is an open access article distributed under the terms and conditions of the Creative Commons Attribution (CC BY) license (http://creativecommons.org/licenses/by/4.0/).
Share and Cite
Lee, J.; Park, S.; Kim, T. Development of a Ventilation System Using Window Cavity. Sustainability 2020, 12, 8391. https://doi.org/10.3390/su12208391
Lee J, Park S, Kim T. Development of a Ventilation System Using Window Cavity. Sustainability. 2020; 12(20):8391. https://doi.org/10.3390/su12208391
Chicago/Turabian StyleLee, Jinuk, Sanghoon Park, and Taeyeon Kim. 2020. "Development of a Ventilation System Using Window Cavity" Sustainability 12, no. 20: 8391. https://doi.org/10.3390/su12208391
APA StyleLee, J., Park, S., & Kim, T. (2020). Development of a Ventilation System Using Window Cavity. Sustainability, 12(20), 8391. https://doi.org/10.3390/su12208391