Article

The Effects of Restoration Practices on a Small Watershed in China’s Loess Plateau: A Case Study of the Qiaozigou Watershed

1
Institute of Geographic Sciences and Natural Resources Research, Chinese Academy of Sciences, Beijing 100101, China
2
University of Chinese Academy of Sciences, Beijing 100049, China
*
Authors to whom correspondence should be addressed.
Sustainability 2020, 12(20), 8376; https://doi.org/10.3390/su12208376
Submission received: 17 September 2020 / Revised: 6 October 2020 / Accepted: 7 October 2020 / Published: 12 October 2020

Abstract

:
Soil erosion and restoration affect the structure and function of ecosystems and society, and have attracted worldwide attention. Changes in runoff and sediment transport after restoration practices in China’s Loess Plateau have been widely studied and many valuable results have been reported. However, this research was mainly conducted in large watersheds, and quantified the effects of restoration practices through the restoration period. In this study, we compared two adjacent watersheds (one restored and the other natural) in a hill and gully region of China’s Loess Plateau to reveal the impacts of restoration practices. We collected annual rainfall, runoff, and sediment transport data from 1988 to 2018, then investigated temporal variation of runoff and sediment transport to examine their relationships with rainfall. We also calculated the retention rate of soil and water under the restoration practices. The restored watershed showed a significantly decreased sediment modulus (the amount per unit area); the natural watershed showed no significant change. In addition, the restored watershed had lower runoff and sediment modulus values than the natural watershed, with greater effectiveness as rainfall increased. Revegetation and terrace construction contributed more to the retention of soil and water (65.6 and 69.7%, respectively) than check dams (<10%). These results improve our understanding of the effects of restoration practices, and provide guidance on ways to preserve soil and water through restoration in a small watershed in the Loess Plateau.

1. Introduction

Soil erosion is a significant threat that leads to land degradation, which decreases the land’s productivity [1], influences the plant communities [2], and generates negative impacts on both the environment and regional development [3]. In addition to these on-site effects, suspended sediment transported into bodies of water by soil erosion leads to off-site impacts such as increased flooding potential [4], damage to aquatic ecosystems [5], and decreased carbon cycling [6,7]. Because of its fine-textured soils, China’s Loess Plateau has the most serious documented soil erosion in the world [8]. The area that is highly vulnerable to erosion covers approximately 472,000 km2, accounting for 72.8% of the area of the Loess Plateau and including 91,200 km2 with an annual sediment yield exceeding 8000 t km−2 yr−1 [9]. The amount of suspended sediment produced from the Loess Plateau accounted for nearly 90% of the total sediment load in the Yellow River [10].
To control soil erosion and reduce the sediment load, extensive restoration practices have been conducted at a range of spatial scales around the world [11,12,13,14,15,16,17,18]; in the humid climate zones, forest shelter belts, artificial slope terracing, water diversion dams have been used in Russia [16], planting trees in Romania [17], and reduced tillage, no-tillage, and cover crops in Spain [18]. In semi-arid zones such as the Loess Plateau in China, diverse restoration practices have been conducted since 1950 [19,20,21], including revegetation [22], installation of check dams [9], terrace construction [23], creation of fish-scale pits (shallow, teardrop-shaped excavations designed to trap water flowing down a slope) [24], and conservation tillage [11,13]. In arid zones such as in South Africa, rock pack structures were used to control soil erosion [15].
In terms of revegetation, China’s Grain for Green Programme has been the largest revegetation programme implemented in the Loess Plateau, where it converted 16,000 km2 of rain-fed cropland to planted vegetation, causing a 25% increase in vegetation cover from 2000 to 2010 [22]. Check dams were also widely built in regions of the Loess Plateau with erodible soils, with more than 5340 key check dams (with a storage capacity >500,000 m3) and more than 50,000 medium and small dams (storage capacity <500,000 m3), of which approximately 6300 are still functional in sediment retention [10,25].
All of these restoration practices have decreased about 40% of the total delivery of suspended sediment into the Yellow River since 1950 [26]. Increasing vegetation cover has been one of the most effective methods to stabilize soils [27]. Vegetation can effectively stabilize soil, both by intercepting or slowing rainfall before it reaches the soil and by the root system holding the soil in place [28,29]. It will also convert macroporosity (pores > 60 μm) to mesoporosity (60–10 μm), and it will enhance the water holding capacity of soil and thus extend the sustaining water available period for plants [30]. Wang et al. [10] studied 12 of the Yellow River’s main sub-catchments on the Loess Plateau, and found that the vegetation cover increased from 29% in 1998 to 46% in 2010, and this increased vegetation cover was responsible for about 57% of the reduction in sediment transport (0.23 Gt annually). However, large-scale vegetation rehabilitation led to soil desiccation in the water-scarce Loess Plateau, due to the large amount of water consumption by new vegetation [22,31,32].
Check dams have been an effective measure to intercept transported sediment [33]; for example, during the 1970s, these dams trapped about 0.20 Gt of sediment annually, and this amount increased to 0.29 Gt annually in the 2000s [10]. Check dams can also cause the discontinuity in the fluvial environment [34], it will induce morphological adjustments that can be translated in new riparian conditions for the establishment of vegetation [30], and then affecting the ecological aspects and species diversity of riparian habitats. However, it should be noted that loaded check dams may result in severe flooding events [28], and deposits accumulated in the reservoir need to be removed to regain capacity regularly, but retrofitting is expensive [20,33,35]. Bai et al. [23] studied the runoff and sediment transport during three storm events in the 2010s in the Pianguanhe Basin, and found that terrace construction reduced runoff and sediment transport by 26.6 and 24.5%, respectively, compared with the storm events in 1990, but their maintenance is usually costly and labor-intensive [20].
Fish-scale pits were always combined with afforestation, since the goal of these pits was to trap surface runoff long enough for the water to infiltrate the soil around a tree and be stored [24,36]. Unfortunately, Sun et al. [37] suggested that fish-scale pits began to lose their ability to trap water after a total of 83 mm of rain had fallen in a single rainfall event. Research indicated that the average annual runoff in areas with hedgerows combined with slope tillage decreased by 65.9% compared with runoff on bare land, versus 84.0% in areas with straw mulching combined with conventional tillage, and 87.3% for contour tillage [38].
The effectiveness of soil erosion control by vegetation and soil restoration depends on the scale of the implementation. Most studies of the effects of restoration practices on soil erosion, runoff generation, and sediment transfer were conducted in large watersheds, usually >1000 km2 [24,39,40]. However, since soil and water restoration and watershed management in the Loess Plateau are usually conducted in small watersheds, research should be conducted at this scale to determine the impacts of restoration on ecosystem processes and soil erosion control, since this would provide direct guidance for future restoration strategies. However, there has been little research on controlling runoff and sediment yield at this small scale [41,42,43]. These studies at small watersheds always determined the runoff and sediment yield using models such as Soil and Water Assessment Tool (SWAT) [44,45], Hydrologic Simulation Programme-Fortran (HSPF) [46], and Water Erosion Prediction Project (WEEP) [47], but lacked real observed data analysis.
Moreover, watershed-scale research to measure the effects of restoration practices have quantified the change in the sediment load over time in a single watershed [10], without providing a control to allow a direct comparison, and this has made it difficult to eliminate the effects of climate change and determine the relative impacts of anthropogenic restorations. It would be particularly important to observe the effects of restoration practices through a comparison of natural (control) and restored watersheds with similar characteristics to overcome the problems of single-watershed studies. However, this kind of comparative research has been rare.
To address the gaps in our understanding, we chose two small subcatchments of a watershed in the central Loess Plateau with similar characteristics and investigated the relationships between rainfall and the resulting runoff and sediment yield from 1988 to 2018. One watershed experienced ecological restoration, and the other remained in its natural state. Our specific goals were to (1) investigate the impacts of the major restoration practices that have been adopted in the study watershed; (2) explore the temporal variation of runoff and sediment and reveal the relationships between these factors and annual rainfall in both watersheds; and (3) quantify the contributions of different restoration practices to erosion and runoff control. The results will improve our understanding of the effects of restoration practices in small watersheds, and will therefore provide guidance for future restoration.

2. Materials and Methods
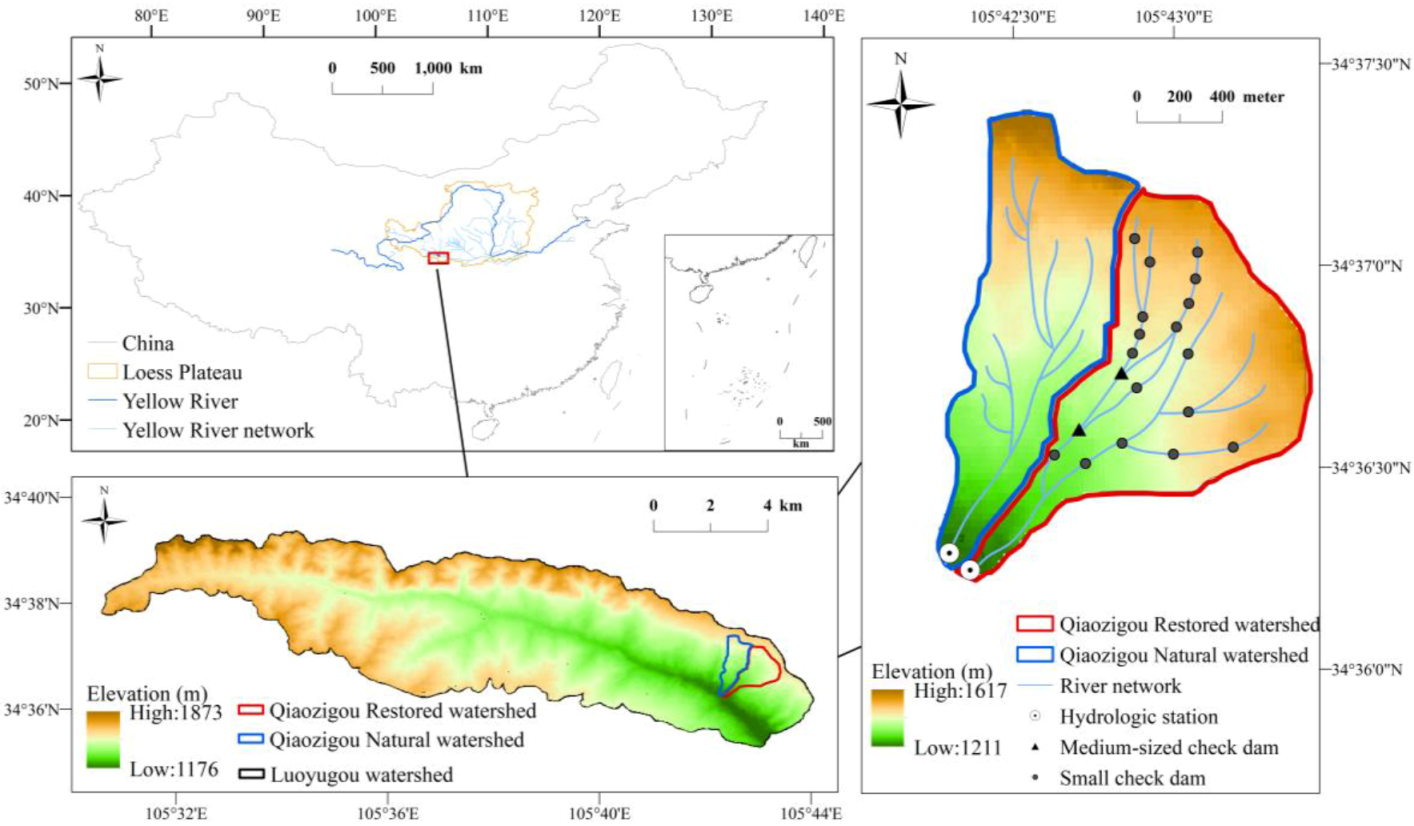
2.1. Study Area

This study was conducted in the Qiaozigou watershed (2.241 km2) in a hilly–gully loess region of the Loess Plateau, in Tianshui City of China’s Gansu Province (105°43′ E, 34°34′ N) (Figure 1). Qiaozigou watershed is located in the Luoyugou watershed, which is within the Xihe River watershed of the Weihe River, which is a main tributary of the Yellow River. This area lies at the confluence of the Yellow River Basin and the Yangtze River Basin, and is located at the southern edge of the Loess Plateau. It is a key area for soil erosion management and a demonstration area for the Grain for Green Program [48]. Qiaozigou watershed was managed by the Tianshui Soil Erosion Experimental Station, which is the first research institution that focused on soil and water restoration in China since it was established in 1942 [49]. Luoyugou watershed has a semi-arid continental climate, with a mean annual temperature of 10.7 °C and with mean monthly temperatures ranging from −2 °C in January to 22.8 °C in July [50]. The total annual rainfall averages 533 mm, with about 80% occurring between May and October [51]. The average slope in Luoyugou watershed is 19°, the proportion of slope below 15° is 48.4% and the proportion of slope above 25° is 23.6% [52]. The primary land uses are forest, cultivated land, and residential areas. The land has become seriously degraded due to long-term soil erosion and the development of a high gully density (the length of channel in per unit area), at approximately 3.5 km km−2 [53]. The mean topographic wetness index (TWI) in the Loess Plateau is 4.2 [54].
The Qiaozigou watershed consists of a pair of adjacent catchments. The restored watershed (1.266 km2) covers the eastern side of Qiaozigou watershed, and the natural watershed (0.975 km2) that has not undergone restoration activities covers the western side. Since the 1980s, some restoration practices have been applied in the restored watershed, including the creation of check dams, terraces, revegetation (forests of species such as Robinia pseudoacacia L. and Populus davidiana Dode; shrubs such as Ulmus pumila L. and Prunus sibirica L.; and grasses such as Medicago sativa L.) (Figure 2). In contrast, no restoration practices have been applied in the natural watershed. In the early stages of restoration of the restored watershed, restoration focused on vegetation restoration and reconstruction of sloping land to create terraces. In the later stages, the restoration focused on check dam construction. Each watershed has a hydrologic station at the outlet of the watershed for measuring runoff and sediment loads (Figure 1).

2.2. Data Sources

We obtained a 31 year rainfall dataset from the National Earth System Science Data Center (http://www.geodata.cn/index.html), the literature [51], and the records from the Tianshui Soil Erosion Experimental Station. All of these rainfall data were observed by auto-recording rain gauges located in the Luoyugou watershed. Annual runoff (R, m3 yr−1) and annual sediment (S, t yr−1) were obtained from the literature [52,55,56], and the records from the Tianshui Soil Erosion Experimental Station. The restoration practices in the restored watershed were determined from article analysis [52,53,57,58].

2.3. Data Processing

2.3.1. Runoff Modulus, Sediment Modulus and Sediment Concentration

All of the runoff and sediment data were observed by the hydrologic stations at the outlets of the two watersheds. The runoff modulus (RM, m3 km−2 yr−1) was calculated as:
R M = R / A
where A is the total area of the watershed.
The sediment modulus (SM, t km−2 yr−1) was calculated as:
S M = R S / A
The suspended sediment concentration (SC, t/m3) was calculated as:
S C = S / R

2.3.2. Mann-Kendall Trend Test

The Mann–Kendall (M-K) statistical test has been widely used to quantify the significance of trends in hydro-meteorological time series [59,60]. The Mann–Kendall test statistic SM-K is calculated as follows:
S M K = i = 1 n 1 j = i + 1 n sgn ( x j x i )
where n is the number of data points, i the number of values in that time series, x i and x j are the data values in time series i and j ( j > i ), respectively, and sgn ( x j x i ) is the sign function:
sgn ( x j x i ) = { + 1       i f   x j x i > 0 0           i f   x j x i = 0 1           i f   x j x i < 0
The variance is computed as:
Var ( S M K ) = n ( n 1 ) ( 2 n + 5 ) i = 1 m t i ( t i 1 ) ( 2 t i + 5 ) 18
where n is the number of data points, m is the number of tied groups, and t i denotes the number of ties of extent i . A tied group is a set of sample data that have the same value. In cases where the sample size is n > 10, the standard normal test statistic Z is computed as:
Z = { S M K 1 Var ( S )             if   S M K > 0 0             if   S = 0 S M K + 1 Var ( S )             if   S M K < 0
Positive and statistically significant values of Z indicate increasing trends and negative Z values show decreasing trends. Testing for the existence of trends is done at a specific α significance level. When Z > Z 1 α / 2 or Z < − Z 1 α / 2 , the null hypothesis is rejected and a significant trend exists in the time series. Z 1 α / 2 is obtained from the standard normal distribution table. In this study, we defined significance at p < 0.05. At this significance level, the null hypothesis (that no trend exists) is rejected if Z > 1.96 or Z < −1.96.

2.3.3. Soil and Water Retention

We used the formula of Gong et al. [61] to prevent wind erosion, to calculate the soil retention rate ( R R soil ) and water retention rate ( R R water ) and compare the rates between the two watersheds:
R R soil = 1 S M RW S M NW × 100 %
R R water = 1 R M RW R M NW × 100 %
where S M RW is the sediment modulus (t km−2 yr−1) in the restored watershed, S M NW is the sediment modulus (m3 km−2 yr−1) in the natural watershed, R M R W is the runoff modulus (m3 km−2 yr−1) in the restored watershed, and R M N W is the runoff modulus in the natural watershed. Higher values of both RR variables indicate higher retention.

3. Results

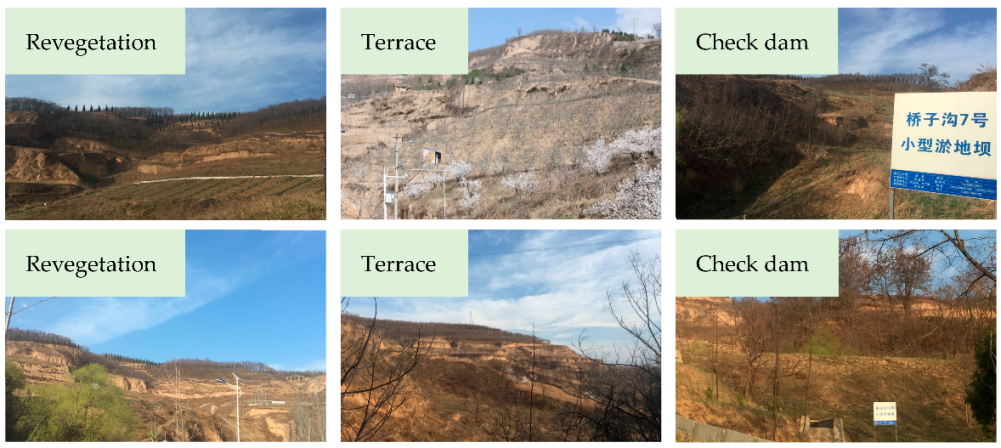
3.1. Restoration Practices in the Two Watersheds

In 1985, the proportions of the total land area affected by sloping land (here, defined as land with a mean slope greater than 6°) and terraces were similar in the restored watershed (71.9 and 0.5% of the total land area, respectively) and the natural watershed (77.5 and 2.8%, respectively), but vegetated land in the restored watershed (17.8%) was much higher than in the natural watershed (3.0%) (Table 1). After 1985, many restoration practices were implemented in the restored watershed, whereas the natural watershed had no restoration practices. From 1985 to 2004, the proportion of sloping land in the restored watershed decreased greatly, to 24.1%, while the proportion of terraces increased greatly, to 27.1%, and the proportion of land covered by vegetation increased to 35.8%. From 2005 to 2006, 19 check dams were constructed in the restored watershed (Table 1, Figure 1). Of these, 2 were medium-sized and 17 were small, 2 of the medium-sized dams were built from soil, and 15 of the small check dams were built from soil and 2 were built from stone. The medium-sized check dams were located on the main stream, and each had an approximate storage capacity of 23 × 104 m3, versus a range of 1.93 × 10⁴ to 2.55 × 10⁴ m3 for the small check dams. After 2005, there was no further vegetation restoration or terrace construction, so check dams were the main form of restoration. The results indicate that restoration of the restored watershed can be divided into two periods: the revegetation and terrace stage (period I, 1988–2004), and the check dam stage (period II, 2005–2018).

3.2. Comparison of Runoff, Sediment, and Their Temporal Variation between the Two Watersheds

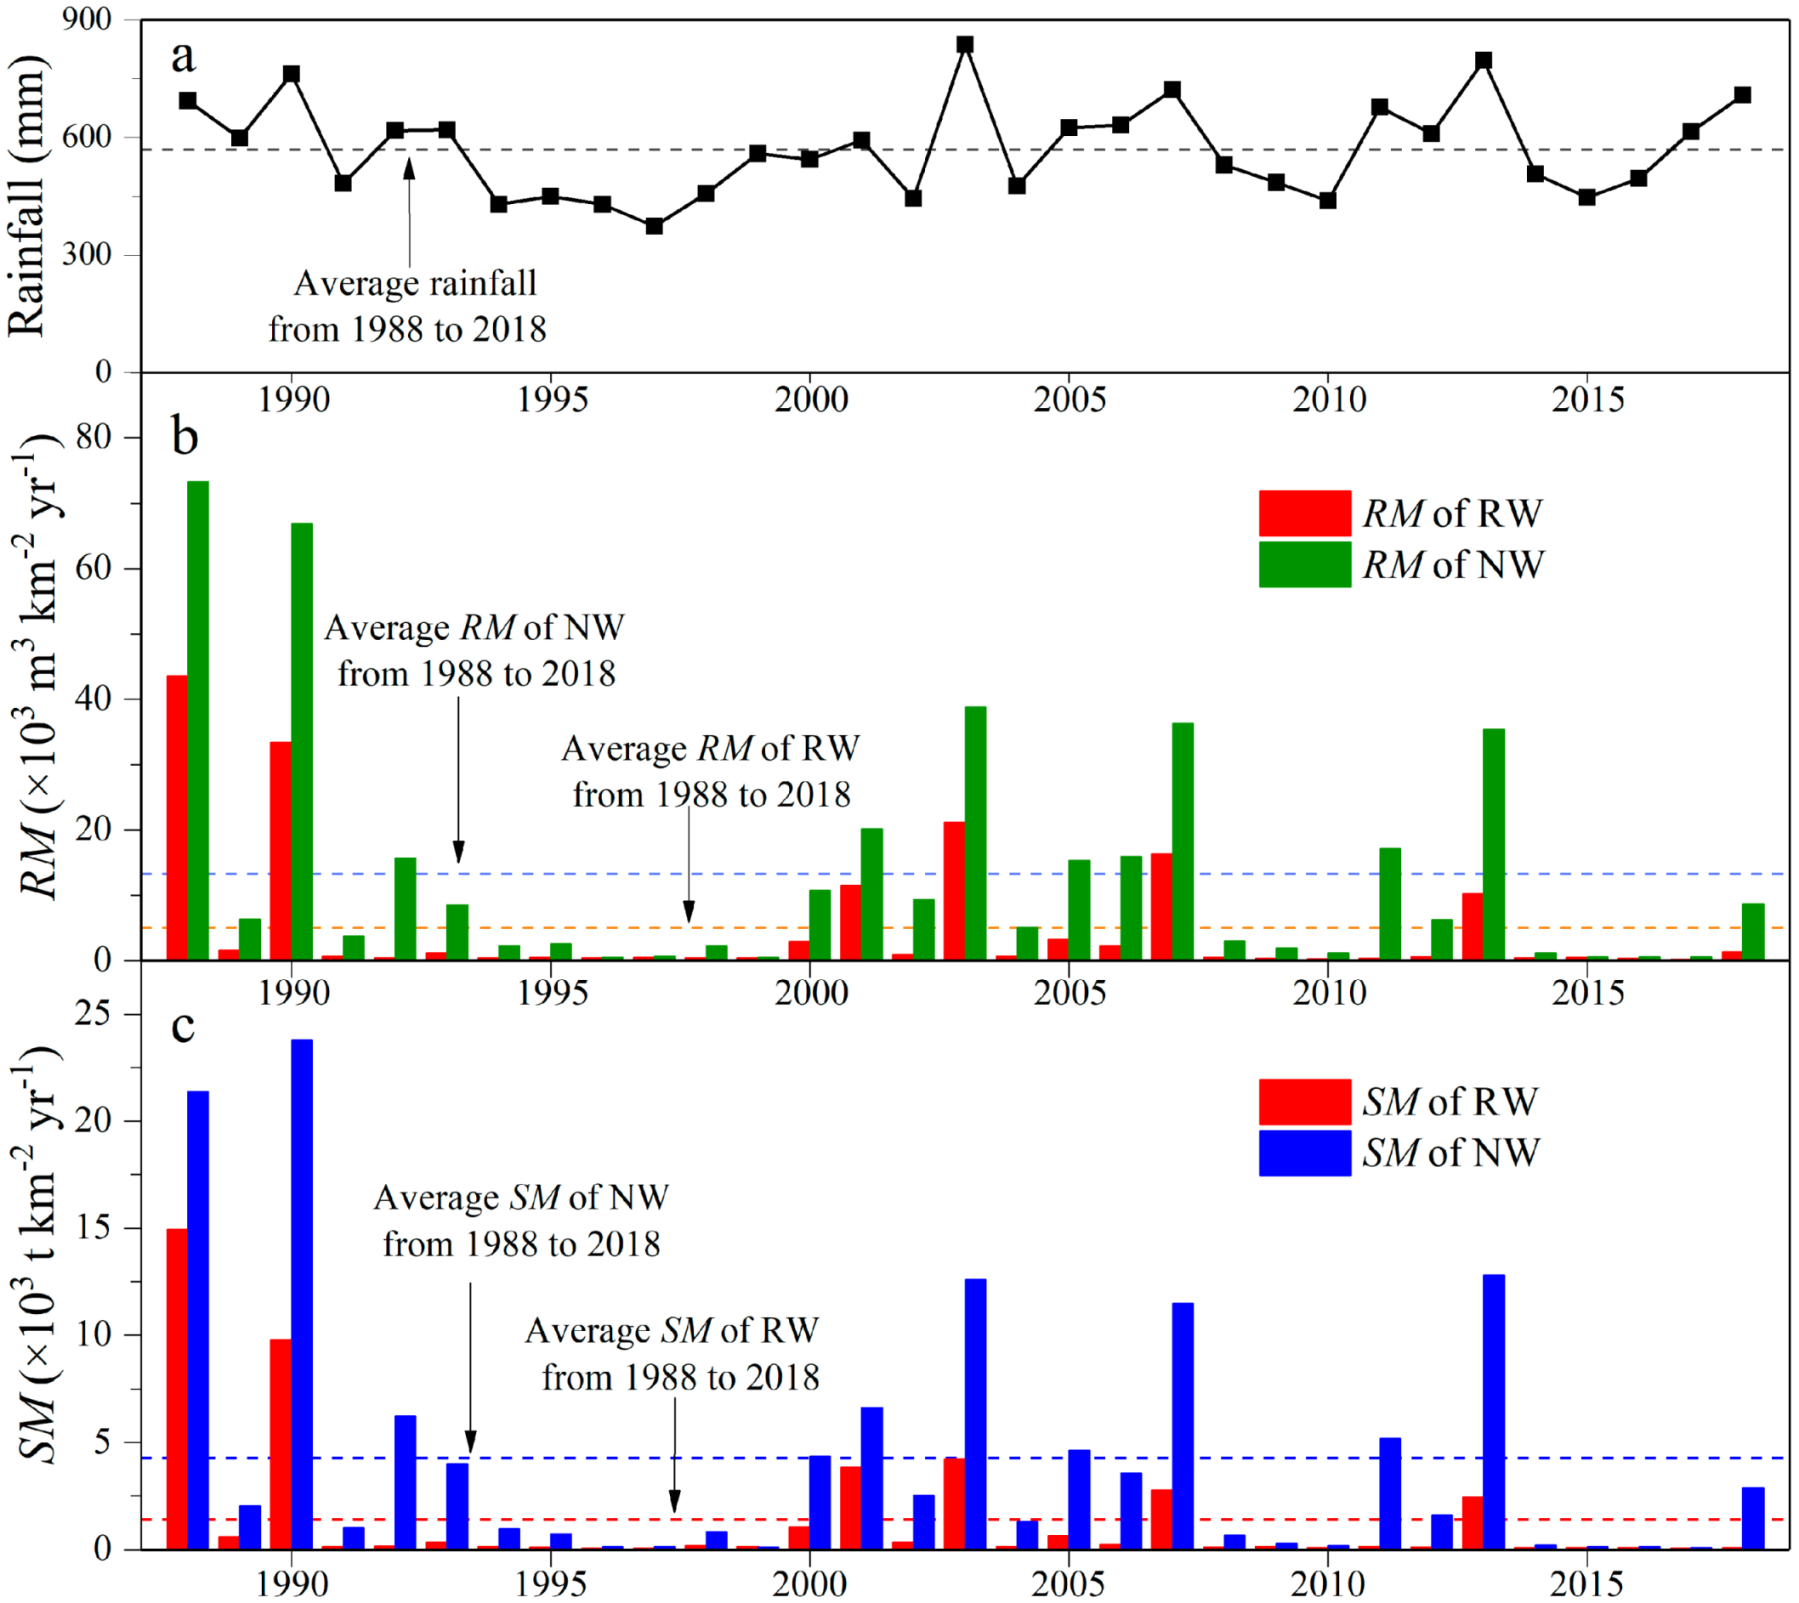
3.2.1. Annual RM and SM in the Two Watersheds from 1988 to 2018

Figure 3 shows the annual rainfall, runoff modulus, and sediment modulus from 1988 to 2018 in the two watersheds. The rainfall showed large interannual variations from 1988 to 2018 in our study area by an average of 569 mm, with a maximum of 836 mm in 2003, and smaller peaks at 795 mm in 2013 and 761 mm in 1990 (Figure 3a). In contrast, there were several dry periods, with rainfall of only 429 mm in 1994 and 373 mm in 1997, which amount to less than half of the rainfall in 2003 (Figure 3a). The annual RM and SM showed similarly high variation in the two watersheds. In both watersheds, RM was highest in 1988, at 43.6 × 10³ m3 km−2 yr−1 in the restored watershed and 73.3 × 10³ m3 km−2 yr−1 in the natural watershed (Figure 3b). SM was lowest in 2017, at only 197.1 m3 km−2 yr−1 in the restored watershed, versus 598.7 m3 km−2 yr−1 in the natural watershed (Figure 3c). SM was highest in the restored watershed in 1990, at 14.9 × 10³ t km−2 yr−1, but was highest in 1988 in the natural watershed, at 23.8 × 10³ t km−2 yr−1. SM was lowest in 2017, at only 54.3 t km−2 yr−1 in the restored watershed and 92.4 t km−2 yr−1 in the natural watershed (Figure 3c).
Figure 2 clearly shows that at a given level of rainfall, both RM and SM were much lower in the restored watershed by an average of 5.1 × 10³ m3 km−2 yr−1 and 1.4 × 10³ t km−2 yr−1, respectively, than that in the natural watershed by an average of 13.3 × 10³ m3 km−2 yr−1 and 4.3 × 10³ t km−2 yr−1, respectively. In the years with higher annual RM and annual SM (i.e., 1988, 1990, 2003, 2007, and 2013), RM in the restored watershed was only 59, 50, 55, 45, and 29%, respectively, of RM in the natural watershed. The annual SM in the restored watershed in the corresponding years was only 70, 41, 34, 24, and 19%, respectively, of SM in the natural watershed. The difference between the two watersheds was greatest in 1992, 2002, and 2011, when annual RM in the restored watershed was only 2, 10, and 2%, respectively, of RM in the natural watershed. Similarly, the difference in annual SM was greatest in 1993, 2006, and 2012, when SM in the restored watershed was only 3% of that in the natural watershed. Thus, the restoration measures greatly decreased the annual RM and SM.

3.2.2. Temporal Trends of Annual Runoff and Sediment in the Two Watersheds

Table 2 shows that for the 31 years from 1988 to 2018, the M–K test value for annual rainfall was positive, suggesting a long-term increase from 1933 to 2018, but this trend was not significant. The M–K test values for annual RM and annual SM were negative in both watersheds, suggesting a long-term decrease in these variables. However, the Z-values for RM in the restored watershed (−1.70) and the natural watershed (−1.36) were smaller than the critical value ( Z 1 α / 2 = 1.96); thus, there was no significant long-term trend for RM in either watershed. The Z-value for annual SM in the restored watershed (−2.35) was significantly larger than the critical value, whereas the Z-value for annual SM in the natural watershed (−1.73) was not; thus, SM showed a significant decreasing trend in the restored watershed but no significant trend in the natural watershed.

3.3. The Effect of Restoration Practices on Soil and Water Retention

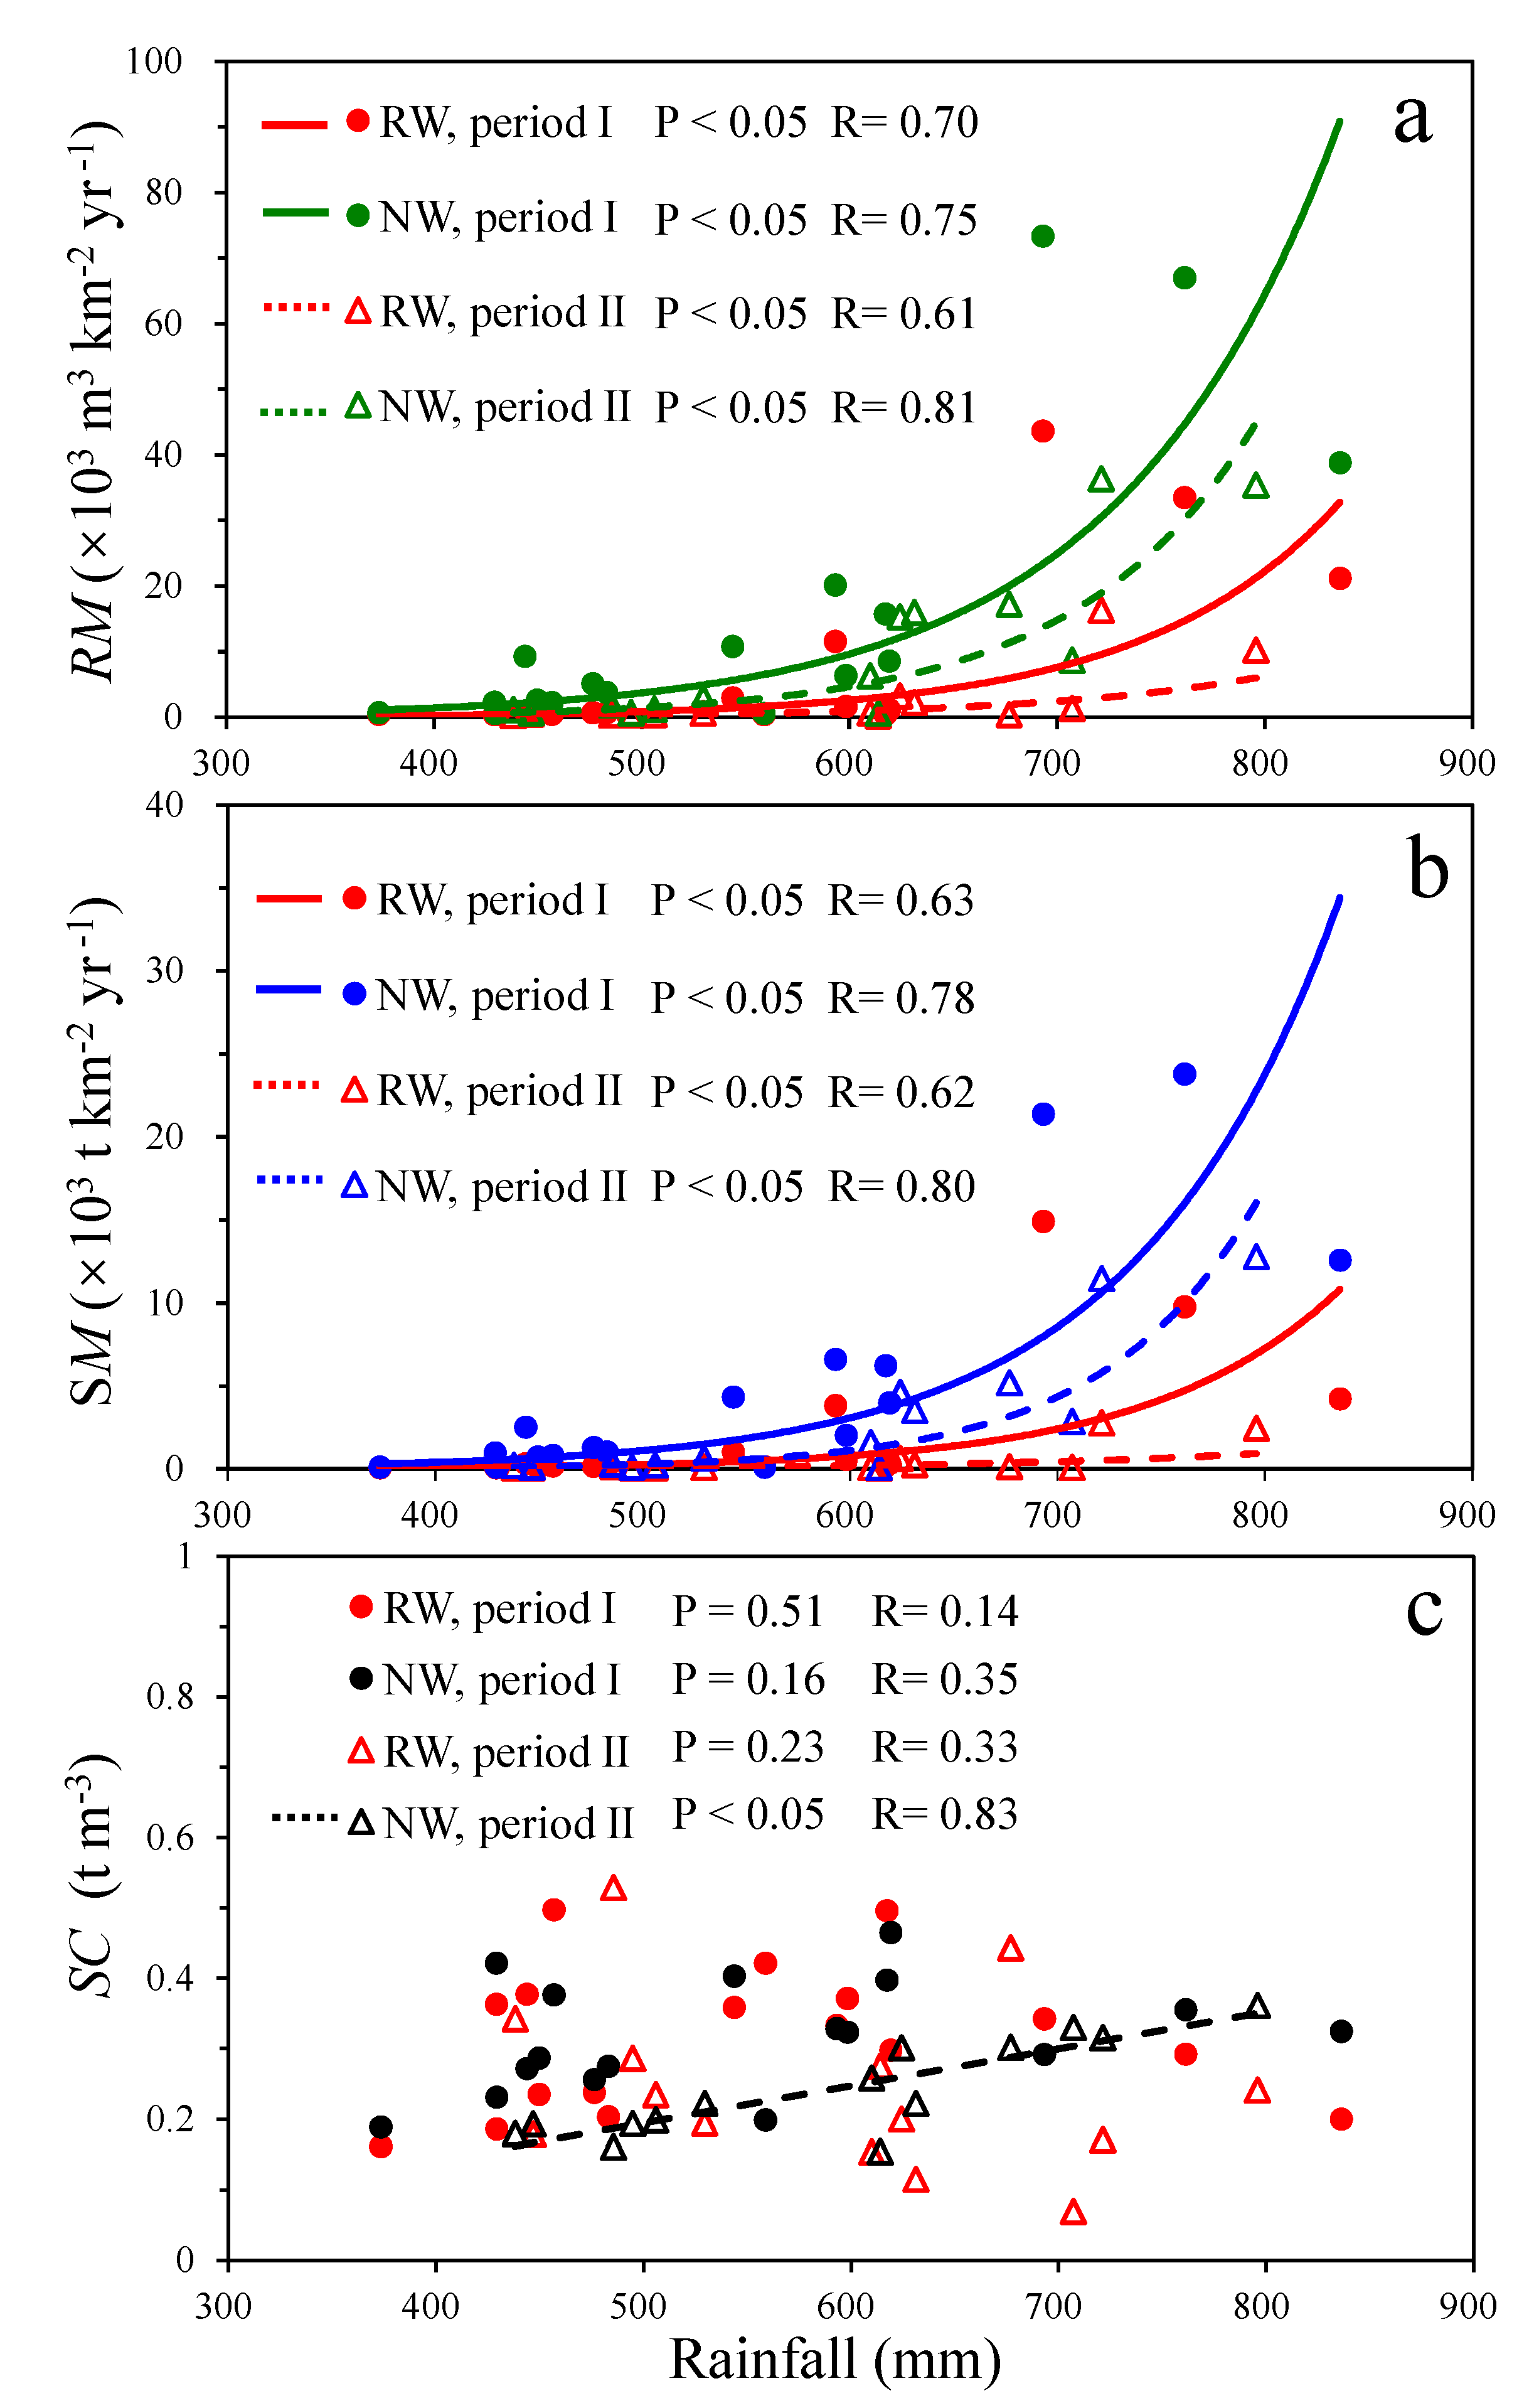
3.3.1. Relationships between Rainfall and the RM and SM in the Two Watersheds

The restoration practices in the two watersheds (Table 1) show that the restoration was divided into two periods: from 1988 to 2004, revegetation and terrace construction, and from 2005 to 2018, the construction of check dams. Before 2005, rainfall and the RM (Figure 4a) and SM (Figure 4b) were significantly and moderately strongly related in both watersheds (p < 0.05, R > 0.6), but there was no significant relationship between rainfall and the SC in both watersheds (Figure 4c). After 2004, the relationships between rainfall and the RM and SM values in both watersheds remained moderately strong and significant (p < 0.05, R > 0.6; Figure 4a,b). The relationship between rainfall and SC was only significant in the natural watershed (p < 0.05, R = 0.83) (Figure 4c). The increase in RM and SM with increasing rainfall was faster in the natural watershed in both periods (Figure 4a,b). SC increased significantly with increasing rainfall in the natural watershed during the period of 1988 to 2004, but showed no significant trend in the restored watershed (Figure 4c).
The increase in runoff with increasing rainfall was slower after 2004 in both watersheds (Figure 3a), and this was also true for SM (Figure 3b). SC in the natural watershed increased significantly after 2004, but there was no other significant trend for SC. Our results indicate that the restoration practices in the restored watershed can prevent soil erosion and retain rainfall, and that these benefits increased with increasing rainfall, particularly after construction of the 19 check dams.

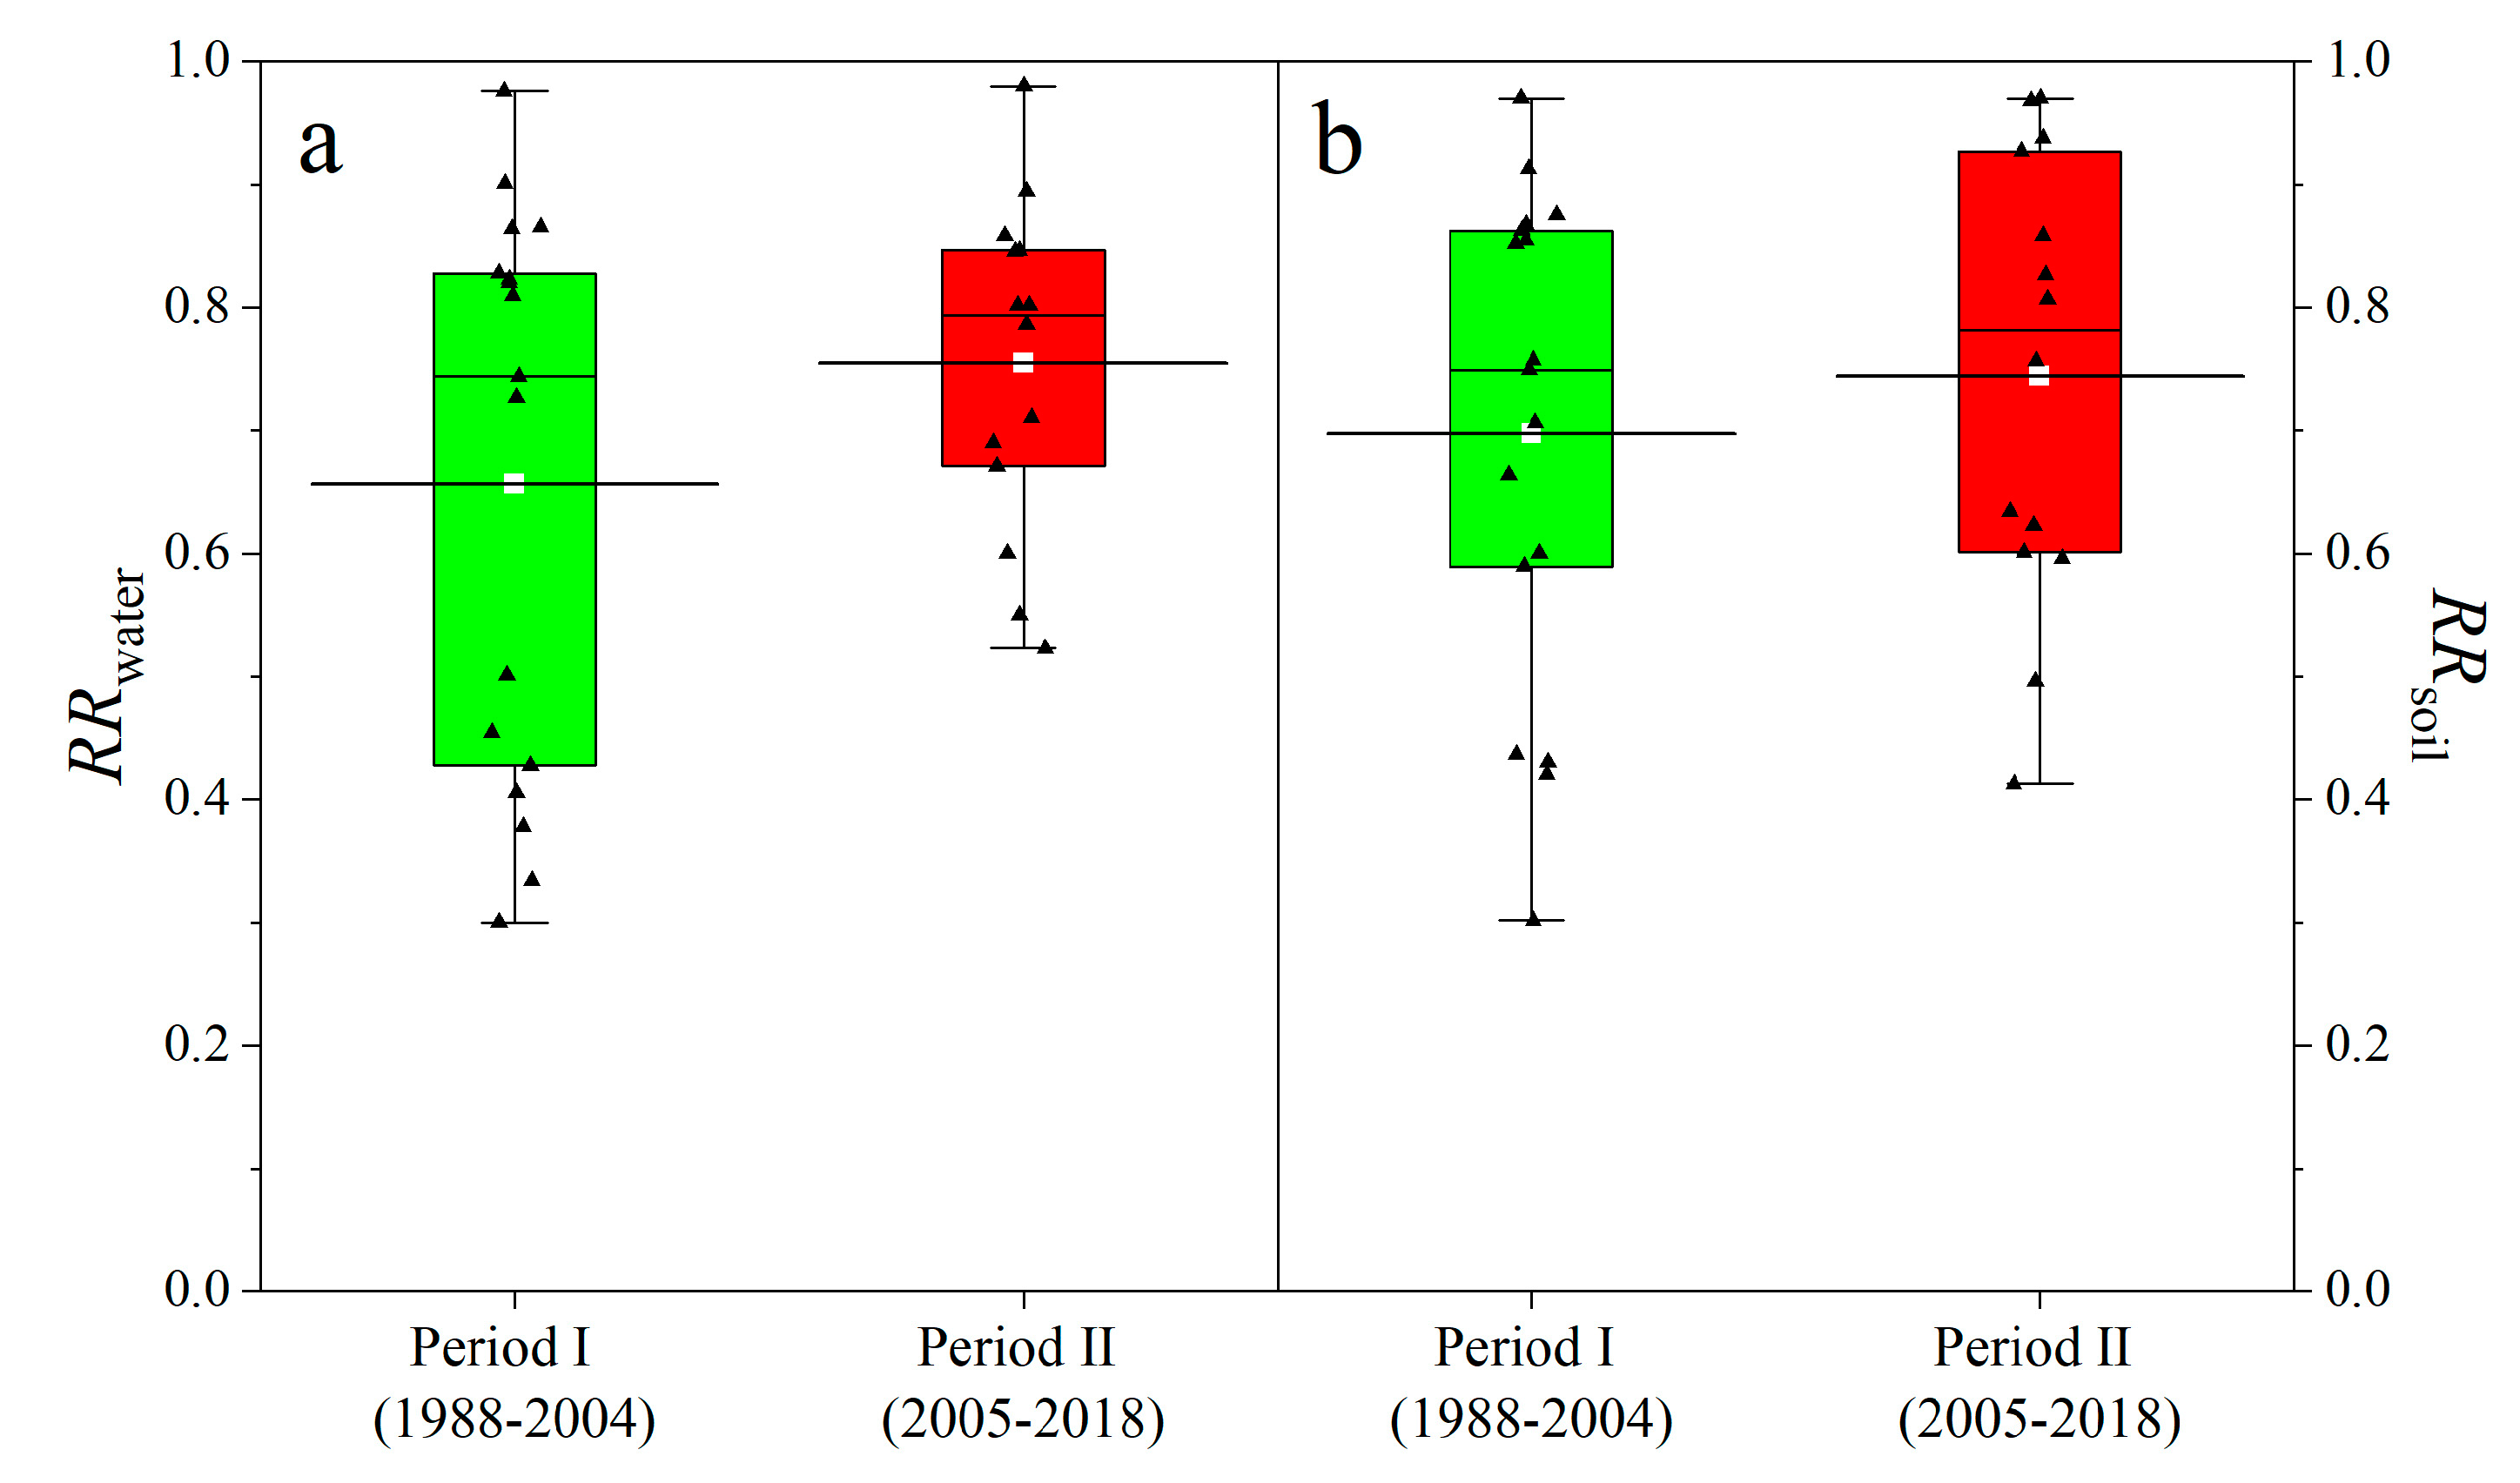
3.3.2. Retention Rates of Soil and Water (RRsoil and RRwater) in Response to Restoration Practices

Figure 5 shows the soil and water retention rates in both watersheds during the two periods. From 1988 to 2004, when the main restoration practices were revegetation and terrace construction in the restored watershed, RRsoil averaged 65.6% and RRwater averaged 69.7%. From 2005 to 2018, when the check dams were installed in the restored watershed, RRsoil averaged 75.4% and RRwater averaged 74.4%. Although the increases in both retention rates between these two periods (due exclusively to the installation of check dams) were relatively small, the average RRsoil in period Ⅱ was approximately 9.8 percentage points higher than that in period Ⅰ, and RRwater averaged about 4.7 percentage points higher. The revegetation and terrace construction led to more than 60% retention of the soil and water in the restored watershed, but the addition of the check dams contributed less than 10 additional percentage points of retention. That is, the check dams were much less effective than the revegetation and terrace construction.
Table 3 shows the M–K test for soil and water retention rates (RRwater and RRsoil) during the two periods. From 1988 to 2004, when the main restoration practices were revegetation and terrace construction in the restored watershed, the M–K test value for RRwater and RRsoil were both positive (0.12 and 0.12), suggesting a long-term increase. From 2005 to 2018, when the check dams were installed in the restored watershed, the M–K test value for RRwater and RRsoil were both negative (−1.10 and −1.20), suggesting a long-term decrease. Although the Z-values for RRwater and RRsoil in both of two periods were smaller than the critical value ( Z 1 α / 2 = 1.96), which means that there was no significant long-term trend for RRwater and RRsoil in either period, it is still possible to say that the effect of revegetation and terrace on soil and water retention is increasing as time goes by and the effect of check dam is decreasing.

4. Discussion

In this study, the restored watershed showed a significantly decreasing trend in the annual sediment load (equivalent to S) from 1988 to 2018, whereas the natural watershed did not show a significant reduction. Consistent with our results, Zuo et al. [62] found that the land-use effect decreased 25.3% of the water yield (equivalent to R) and 40.6% of the sediment yield (equivalent to S), respectively, from 1954 to 2012 in Huangfuchuan River basin. Yue et al. [63] demonstrated that soil and water restoration projects (including afforestation and the constructions of terraces, reservoirs, and check dams) reduced the sediment load (equivalent to S) in the reaches of the Yellow River between Hekouzhen and Longmen. A research carried out in the Ferenj Wuha watershed, located in the northwest of the Ethiopian highlands, shows that the conversion of communal grazing land to exclosures increased aboveground biomass by 54 Mg ha −1 (or 81%) at the watershed scale, improved soil fertility and increased the carbon and nutrient stock of soil [64]. Zouré [65] found that farmland management (e.g., stone rows, zaï and half-moon) implemented in Tougou watershed (a watershed in Sahel region) allows a runoff reduction by 25 to 100% because of enhancing the water holding ability of soil, which extends the available period of sustaining water for crops and increases their evaporation.
Besides the sediment load, some research about the soil erosion rate directly showed the reduction in soil erosion in the study area after restoration work. Chen et al. [66] showed that the rate of soil erosion was more than 4500 t km−2 yr−1 before 1988 in Luoyugou watershed, and that the erosion rate decreased to 4200 t km−2 yr−1 in 1988 and 3520 t km−2 yr−1 in 1989, and then it declined to 1630 t km−2 yr−1 in 1990, after which it stayed at a stable level between 1100 and 1800 t km−2 yr−1 from 1991 to 2004. The erosion rate decreased to approximately one third of that in the data before 1988. This is consistent with our result that both the runoff modulus and sediment modulus decreased after 1988 because of the revegetation.
Some researchers claimed that decreases in runoff or sediment over time might be caused by decreasing rainfall [31], and records from 20 meteorological stations in the Yellow River basin showed that the rainfall has decreased significantly from 1951 to 2000 [67,68]. However, in our study area, both watersheds had the same rainfall erosivity, so the erosion prevention and water retention would have resulted from the restoration practices rather than from any change in rainfall. This illustrates one advantage of using a paired control watershed in future research.
In this research, the soil and water retention that resulted from revegetation and terrace construction was larger than the retention that resulted from the construction of check dams, which agrees with previous research by Wang et al. [10]. However, high water consumption by new vegetation has aroused extensive concerns [31], since many studies have shown decreased water availability after large-scale vegetation rehabilitation that aggravated existing water scarcity, and that led to soil desiccation in the water-scarce Loess Plateau [22,32].
Restoration to prevent soil erosion should account for local environmental constraints. In particular, revegetation should rely on the selection of species that can survive and expand under local soil and climatic conditions. Relying on native species that exist in the study area is most likely to succeed, as they survive better than exotic species, which sometimes drastically deplete local soil moisture resources [69,70]. There must also be an appropriate balance between water consumption by vegetation and water use by humans, as this is critical to achieve sustainable management of the ecosystem for the benefits of both humans and nature [22,71]. In our research, the annual runoff in the restored watershed was significantly lower than that in the natural watershed. We lack sufficient data to tell whether this is a good phenomenon (e.g., because the water is retained in the soil for local use) or not (e.g., because the water yield decreases for downstream regions). Additional research will be required to determine whether the benefits outweigh the potential costs and what steps will be necessary to achieve a sustainable balance.
In this study, the effect of revegetation and terrace on soil and water retention is increasing as time goes by, but the effect of the check dam is decreasing. Soil retention by check dams is influenced by their size, storage capacity, and expected service life [72,73], they will likely require significant maintain [9,35,72,74]. For example, the service life of medium and small check dams is typically estimated to be less than 10 years, without maintenance such as dredging to remove the soil that accumulates behind the dams [75]. All of the check dams in the restored watershed were built from 2005 to 2006, which means that they had all exceeded their service life by the end of our study period, and this may explain the relatively low contribution of the check dams to soil and water retention [73].
In our analysis, we focused on annual rainfall. However, many studies have shown that the sediment exported from a watershed depends strongly on the characteristics of single rainfall events [76,77]; that is, a large proportion of the runoff and sediment load is produced by a relatively small number of large rainfall events that generate higher than average runoff. For example, Fang et al. [78] studied 40 rainfall events in the Wanjiaqiao watershed, and found that about 90% of the total sediment load was produced by nine single rainfall events, which accounted for 50% of the total rainfall and 58% of the total runoff. Therefore, it will be necessary to analyze the relationship between single rainfall events and runoff and sediment load in our study area in future research.

5. Conclusions

Revegetation and construction of terraces contribute greatly to the prevention of soil erosion. However, it should be noted that the selected species used for planting should be those that can survive and expand under local soil and climatic conditions. The amount of vegetation should keep an appropriate balance between water consumption by vegetation and water use by humans to achieve sustainable management of the ecosystem for the benefits of both humans and nature. Check dams are influenced by storage capacity and expected service life, and they will likely require significant maintenance in the future. Nonetheless, the check dams did noticeably reduce erosion and water loss, so it may be more efficient to combine check dam construction with revegetation strategies.

Author Contributions

Q.L. carried out data collection and analysis, and wrote the first draft of the manuscript. L.Z. designed the overall research framework, participated in the data collection, and provided comments for further improvement. Y.H. provided comments and suggestions for further improvement. All authors have read and agreed to the published version of the manuscript.

Funding

This research was funded by National Key Research and Development Program of China, grant number 2016YFC0503700, and the Strategic Priority Research Program of the Chinese Academy of Sciences, grant number XDA20010202.

Acknowledgments

The authors are grateful to the journal’s editor and the anonymous reviewers for their insightful comments and suggestions.

Conflicts of Interest

The authors declare no conflict of interest.

References

  1. Ayub, M.A.; Usman, M.; Faiz, T.; Umair, M.; Haq, M.A.U.; Rizwan, M.; Ali, S.; Rehman, M.Z.U. Restoration of degraded soil for sustainable agriculture. In Soil Health Restoration and Management; Springer Science and Business Media LLC: Berilin, Germany, 2019; pp. 31–81. [Google Scholar]
  2. Cano, E.; Musarella, C.M.; Cano-Ortiz, A.; Fuentes, J.C.P.; Torres, A.R.; Del Río, S.; Pinto-Gomes, C.; Quinto-Canas, R.; Spampinato, G. Geobotanical study of the microforests of Juniperus oxycedrus subsp. badia in the Central and Southern Iberian Peninsula. Sustainability 2019, 11, 1111. [Google Scholar] [CrossRef] [Green Version]
  3. Chehabeddine, M.; Tvaronavičienė, M. Securing regional development. Insights Reg. Dev. 2020, 2, 430–442. [Google Scholar] [CrossRef]
  4. Rovira, A.; Ballinger, R.; Ibáñez, C.; Parker, P.; Dominguez, M.D.; Simon, X.; Lewandowski, A.; Hochfeld, B.; Tudor, M.; Vernaeve, L. Sediment imbalances and flooding risk in European deltas and estuaries. J. Soils Sediments 2014, 14, 1493–1512. [Google Scholar] [CrossRef]
  5. Owens, P.N.; Batalla, R.J.; Collins, A.J.; Gomez, B.; Hicks, D.M.; Horowitz, A.J.; Kondolf, G.M.; Marden, M.; Page, M.J.; Peacock, D.H.; et al. Fine-grained sediment in river systems: Environmental significance and management issues. River Res. Appl. 2005, 21, 693–717. [Google Scholar] [CrossRef]
  6. Wang, Z.; Hoffmann, T.; Six, J.; Kaplan, J.; Govers, G.; Doetterl, S.; Van Oost, K. Human-induced erosion has offset one-third of carbon emissions from land cover change. Nat. Clim. Chang. 2017, 7, 345–349. [Google Scholar] [CrossRef]
  7. Galy, V.; Peucker-Ehrenbrink, B.; Eglinton, T. Global carbon export from the terrestrial biosphere controlled by erosion. Nat. Cell Biol. 2015, 521, 204–207. [Google Scholar] [CrossRef] [PubMed]
  8. Zhao, G.; Klik, A.; Mu, X.; Wang, F.; Gao, P.; Sun, W. Sediment yield estimation in a small watershed on the northern Loess Plateau, China. Geomorphology 2015, 241, 343–352. [Google Scholar] [CrossRef]
  9. Zhao, G.; Kondolf, G.M.; Mu, X.; Han, M.; He, Z.; Rubin, Z.; Wang, F.; Gao, P.; Sun, W. Sediment yield reduction associated with land use changes and check dams in a catchment of the Loess Plateau, China. Catena 2017, 148, 126–137. [Google Scholar] [CrossRef]
  10. Wang, S.; Fu, B.; Piao, S.; Lü, Y.; Ciais, P.; Feng, X.; Wang, Y. Reduced sediment transport in the Yellow River due to anthropogenic changes. Nat. Geosci. 2015, 9, 38–41. [Google Scholar] [CrossRef]
  11. Peng, Z.; Wang, L.; Xie, J.; Li, L.; Coulter, J.A.; Zhang, R.; Luo, Z.; Cai, L.; Carberry, P.; Whitbread, A. Conservation tillage increases yield and precipitation use efficiency of wheat on the semi-arid Loess Plateau of China. Agric. Water Manag. 2020, 231, 106024. [Google Scholar] [CrossRef]
  12. Teng, H.-F.; Hu, J.; Zhou, Y.; Zhou, L.-Q.; Shi, Z. Modelling and mapping soil erosion potential in China. J. Integr. Agric. 2019, 18, 251–264. [Google Scholar] [CrossRef] [Green Version]
  13. Han, Q.; Siddique, K.H.M.; Li, F.-M. Adoption of conservation tillage on the semi-arid Loess Plateau of Northwest China. Sustainability 2018, 10, 2621. [Google Scholar] [CrossRef] [Green Version]
  14. Lin, Z.; Huimin, Y.; Yunfeng, H.; Zhichao, X.; Yu, X.; Gaodi, X.; Jianxia, M.; Jijun, W. Overview of ecological restoration technologies and evaluation systems. J. Resour. Ecol. 2017, 8, 315–324. [Google Scholar] [CrossRef] [Green Version]
  15. Morokong, T.; Blignaut, J. Benefits and costs analysis of soil erosion control using rock pack structures: The case of Mutale Local Municipality, Limpopo Province, South Africa. Land Use Policy 2019, 83, 512–522. [Google Scholar] [CrossRef]
  16. Golosov, V.; Belyaev, V.R. The history and assessment of effectiveness of soil erosion control measures deployed in Russia. Int. Soil Water Conserv. Res. 2013, 1, 26–35. [Google Scholar] [CrossRef] [Green Version]
  17. Nicu, I.C. Natural risk assessment and mitigation of cultural heritage sites in North-eastern Romania (Valea Oii river basin). Area 2018, 51, 142–154. [Google Scholar] [CrossRef]
  18. Martínez-Mena, M.; Carrillo-López, E.; Boix-Fayos, C.; Almagro, M.; Franco, N.G.; Díaz-Pereira, E.; Montoya, I.; De Vente, J. Long-term effectiveness of sustainable land management practices to control runoff, soil erosion, and nutrient loss and the role of rainfall intensity in Mediterranean rainfed agroecosystems. Catena 2020, 187, 104352. [Google Scholar] [CrossRef]
  19. Ye, Y.; Gao, L.; Ye, Y.; Sun, X.; Connor, J.D.; Crossman, N.D.; Stafford-Smith, M.; Wu, J.; He, C.; Yu, D.; et al. China’s response to a national land-system sustainability emergency. Nat. Cell Biol. 2018, 559, 193–204. [Google Scholar] [CrossRef]
  20. Wen, X.; Zhen, L. Soil erosion control practices in the Chinese Loess Plateau: A systematic review. Environ. Dev. 2020, 34, 100493. [Google Scholar] [CrossRef]
  21. Shi, Z.; Wang, L.; Liu, Q.; Zhang, H.; Huang, X.; Fang, N. Soil erosion: From comprehensive control to ecological regulation. Bull. Chin. Acad. Sci. 2018, 33, 198–205, (In Chinese with English Abstract). [Google Scholar] [CrossRef]
  22. Feng, X.; Fu, B.; Piao, S.; Wang, S.; Ciais, P.; Zeng, Z.; Lü, Y.; Zeng, Y.; Li, Y.; Jiang, X.; et al. Revegetation in China’s Loess Plateau is approaching sustainable water resource limits. Nat. Clim. Chang. 2016, 6, 1019–1022. [Google Scholar] [CrossRef]
  23. Bai, J.; Yang, S.; Zhang, Y.; Liu, X.; Guan, Y. Assessing the impact of terraces and vegetation on runoff and sediment routing using the time-area method in the Chinese Loess Plateau. Water 2019, 11, 803. [Google Scholar] [CrossRef] [Green Version]
  24. Guo, H.; Zhang, B.; Hill, R.L.; Wu, S.; Dong, Q.; Sun, L.; Zhang, K. Fish-scale pit effects on erosion and water runoff dynamics when positioned on a soil slope in the Loess Plateau region, China. Land Degrad. Dev. 2019, 30, 1813–1827. [Google Scholar] [CrossRef]
  25. Xu, G.; Cheng, S.; Li, P.; Li, Z.; Gao, H.; Yu, K.; Lu, K.; Shi, P.; Cheng, Y.; Zhao, B. Soil total nitrogen sources on dammed farmland under the condition of ecological construction in a small watershed on the Loess Plateau, China. Ecol. Eng. 2018, 121, 19–25. [Google Scholar] [CrossRef]
  26. Wang, H.; Yang, Z.; Saito, Y.; Liu, J.P.; Sun, X.; Wang, Y. Stepwise decreases of the Huanghe (Yellow River) sediment load (1950–2005): Impacts of climate change and human activities. Glob. Planet. Chang. 2007, 57, 331–354. [Google Scholar] [CrossRef]
  27. Liu, X.; Yang, S.; Dang, S.; Luo, Y.; Li, X.; Zhou, X. Response of sediment yield to vegetation restoration at a large spatial scale in the Loess Plateau. Sci. China Ser. E Technol. Sci. 2014, 57, 1482–1489. [Google Scholar] [CrossRef]
  28. Zhao, G.; Mu, X.; Wen, Z.; Wang, F.; Gao, P. Soil erosion, conservation, and eco-environment changes in the Loess Plateau of China. Land Degrad. Dev. 2013, 24, 499–510. [Google Scholar] [CrossRef]
  29. Porada, P.; Van Stan, J.T.; Kleidon, A. Significant contribution of non-vascular vegetation to global rainfall interception. Nat. Geosci. 2018, 11, 563–567. [Google Scholar] [CrossRef]
  30. Bendix, J.; Hupp, C.R. Hydrological and geomorphological impacts on riparian plant communities. Hydrol. Process. 2000, 14, 2977–2990. [Google Scholar] [CrossRef]
  31. Hu, Y.; Dao, R.; Hu, Y. Vegetation change and driving factors: Contribution analysis in the Loess Plateau of China during 2000–2015. Sustainability 2019, 11, 1320. [Google Scholar] [CrossRef] [Green Version]
  32. Chen, H.; Shao, M.; Li, Y. Soil desiccation in the Loess Plateau of China. Geoderma 2008, 143, 91–100. [Google Scholar] [CrossRef]
  33. Shi, P.; Zhang, Y.; Ren, Z.; Yu, Y.; Li, P.; Gong, J. Land-use changes and check dams reducing runoff and sediment yield on the Loess Plateau of China. Sci. Total Environ. 2019, 664, 984–994. [Google Scholar] [CrossRef] [PubMed]
  34. Bombino, G.; Boix-Fayos, C.; Gurnell, A.M.; Tamburino, V.; Zema, D.A.; Zimbone, S.M. Check dam influence on vegetation species diversity in mountain torrents of the Mediterranean environment. Ecohydrology 2013, 7, 678–691. [Google Scholar] [CrossRef]
  35. Castillo, V.M.; Mosch, W.; García, C.C.; Barberá, G.G.; Navarro-Cano, J.; López-Bermúdez, F. Effectiveness and geomorphological impacts of check dams for soil erosion control in a semiarid Mediterranean catchment: El Cárcavo (Murcia, Spain). Catena 2007, 70, 416–427. [Google Scholar] [CrossRef]
  36. Fu, S.; Liu, B.; Lu, B.; Yuan, A.; Wang, N. Effect of soil conservation practice on runoff and sediment in upper reach of Guanting Reservoir. Sci. Soil Water Conserv. 2009, 7, 18–23, (In Chinese with English Abstract). [Google Scholar] [CrossRef]
  37. Sun, L.; Wu, S.; Hill, R.L.; Guo, H.; Feng, H. The effects of three micro-catchment practices on erosion and runoff dynamics for a typical soil slope on the Loess Plateau of China. Can. J. Soil Sci. 2019, 99, 46–59. [Google Scholar] [CrossRef] [Green Version]
  38. Chen, X.; Liang, Z.; Zhang, Z.; Zhang, L. Effects of soil and water conservation measures on runoff and sediment yield in red soil slope farmland under natural rainfall. Sustainability 2020, 12, 3417. [Google Scholar] [CrossRef] [Green Version]
  39. Zhang, S.; Li, Z.; Hou, X.; Yi, Y. Impacts on watershed-scale runoff and sediment yield resulting from synergetic changes in climate and vegetation. Catena 2019, 179, 129–138. [Google Scholar] [CrossRef]
  40. Dai, Z.; Fagherazzi, S.; Mei, X.; Gao, J. Decline in suspended sediment concentration delivered by the Changjiang (Yangtze) River into the East China Sea between 1956 and 2013. Geomorphology 2016, 268, 123–132. [Google Scholar] [CrossRef] [Green Version]
  41. Qiu, L.-J.; Zheng, F.-L.; Yin, R.-S. SWAT-based runoff and sediment simulation in a small watershed, the loessial hilly-gullied region of China: Capabilities and challenges. Int. J. Sediment. Res. 2012, 27, 226–234. [Google Scholar] [CrossRef]
  42. Pandey, A.; Chowdary, V.; Mal, B.C.; Billib, M. Runoff and sediment yield modeling from a small agricultural watershed in India using the WEPP model. J. Hydrol. 2008, 348, 305–319. [Google Scholar] [CrossRef]
  43. Mishra, A.; Kar, S.; Singh, V.P. Determination of runoff and sediment yield from a small watershed in sub-humid subtropics using the HSPF model. Hydrol. Process. 2007, 21, 3035–3045. [Google Scholar] [CrossRef]
  44. Arnold, J.G.; Fohrer, N. SWAT2000: Current capabilities and research opportunities in applied watershed modelling. Hydrol. Process. 2005, 19, 563–572. [Google Scholar] [CrossRef]
  45. Arnold, J.G.; Srinivasan, R.; Muttiah, R.S.; Williams, J.R. Large area hydrologic modeling and assessment Part I: Model development. JAWRA J. Am. Water Resour. Assoc. 1998, 34, 73–89. [Google Scholar] [CrossRef]
  46. Van Liew, M.W.; Arnold, J.G.; Garbrecht, J.D. Hydrologic simulation on agricultural watersheds: Choosing between two models. Trans. ASAE 2003, 46, 1539–1551. [Google Scholar] [CrossRef]
  47. Nearing, M.A.; Foster, G.R.; Lane, L.J.; Finkner, S.C. A Process-based soil erosion model for USDA-water erosion prediction project technology. Trans. ASAE 1989, 32, 1587–1593. [Google Scholar] [CrossRef]
  48. Xin, Z.; Qin, Y.; Yu, X. Spatial variability in soil organic carbon and its influencing factors in a hilly watershed of the Loess Plateau, China. Catena 2016, 137, 660–669. [Google Scholar] [CrossRef]
  49. Yang, Q.; Li, R. Review of quantitative assessment on soil erosion in China. Bull. Soil Water Conserv. 1998, 18, 13–18, (In Chinese with English Abstract). [Google Scholar] [CrossRef]
  50. Liu, C.; Li, Z.; Chang, X.; He, J.; Nie, X.; Liu, L.; Xiao, H.; Wang, D.; Peng, H.; Zeng, G. Soil carbon and nitrogen sources and redistribution as affected by erosion and deposition processes: A case study in a loess hilly-gully catchment, China. Agric. Ecosyst. Environ. 2018, 253, 11–22. [Google Scholar] [CrossRef]
  51. Qin, R.; Li, G.; Li, P. Impacts of precipitation and land use change on runoff and sediment in Luoyugou watershed. J. Soil Water Conserv. 2018, 32, 29–40, (In Chinese with English Abstract). [Google Scholar] [CrossRef]
  52. Chen, Y. Vegetation-Erosion Dynamic Process Research in Typical Watershed in the Loess Plateau. Ph.D. Dissertation, Beijing Forestry University, Beijing, China, 2008. (In Chinese with English Abstract). [Google Scholar]
  53. Zhang, X.; Yu, X.; Wu, S.; Cao, W. Effects of changes in land use and land cover on sediment discharge of runoff in a typical watershed in the hill and gully loess region of northwest China. Front. For. China 2008, 3, 334–341. [Google Scholar] [CrossRef]
  54. Zhang, H.; Shi, Z.; Fang, N.; Guo, M. Linking watershed geomorphic characteristics to sediment yield: Evidence from the Loess Plateau of China. Geomorphology 2015, 234, 19–27. [Google Scholar] [CrossRef]
  55. Yan, Q.; Yuan, C.; Lei, T.; Lei, Q.; Zhang, M.; Su, G. Effects of precipitation and erosion control practices on the rainfall-runoff-sediment delivery relationships of typical watersheds in the hilly-gully region on the Loess Plateau. Sci. Soil Water Conserv. 2013, 11, 9–16, (In Chinese with English Abstract). [Google Scholar] [CrossRef]
  56. Zhang, X. Response and Scaling on Eco-Hydrology to Land Use/Forest Vegetation Change in Typical Watersheds of Loess Plateau. Ph.D. Dissertation, Beijing Forestry University, Beijing, China, 2007. (In Chinese with English Abstract). [Google Scholar]
  57. Liu, C.; Li, Z.; Dong, Y.; Nie, X.; Liu, L.; Xiao, H.; Zeng, G. Do land use change and check-dam construction affect a real estimate of soil carbon and nitrogen stocks on the Loess Plateau of China? Ecol. Eng. 2017, 101, 220–226. [Google Scholar] [CrossRef]
  58. Chen, P.; Chen, L.; Yu, X.; Han, P. Influence of comprehensive control gully on water and sediment in small watershed. Res. Soil Water Conserv. 2010, 17, 100–104, (In Chinese with English Abstract). [Google Scholar]
  59. Mann, H.B. Nonparametric tests against trend. Econometrica 1945, 13, 245. [Google Scholar] [CrossRef]
  60. Kendall, M.G. Rank Correlation Methods, 2nd ed.; Charles Griffin and Company Ltd.: London and High Wycombe, UK, 1975. [Google Scholar]
  61. Guoli, G.; Jiyuan, L.; Quanqin, S.; Jun, Z. Sand-fixing function under the change of vegetation coverage in a wind erosion area in Northern China. J. Resour. Ecol. 2014, 5, 105–114. [Google Scholar] [CrossRef]
  62. Zuo, D.; Xu, Z.; Yao, W.; Jin, S.; Xiao, P.; Ran, D. Assessing the effects of changes in land use and climate on runoff and sediment yields from a watershed in the Loess Plateau of China. Sci. Total Environ. 2016, 544, 238–250. [Google Scholar] [CrossRef]
  63. Yue, X.; Mu, X.; Zhao, G.; Shao, H.; Gao, P. Dynamic changes of sediment load in the middle reaches of the Yellow River basin, China and implications for eco-restoration. Ecol. Eng. 2014, 73, 64–72. [Google Scholar] [CrossRef]
  64. Adem, A.A.; Mekuria, W.; Belay, Y.; Tilahun, S.A.; Guzman, C.D. Exclosures improve degraded landscapes in the sub-humid Ethiopian Highlands: The Ferenj Wuha watershed. J. Environ. Manag. 2020, 270, 110802. [Google Scholar] [CrossRef]
  65. Zouré, C.; Queloz, P.; Koïta, M.; Niang, D.; Fowé, T.; Yonaba, R.; Consuegra, D.; Yacouba, H.; Karambiri, H. Modelling the water balance on farming practices at plot scale: Case study of Tougou watershed in Northern Burkina Faso. Catena 2019, 173, 59–70. [Google Scholar] [CrossRef] [Green Version]
  66. Chen, Y.; Wang, F.; Liu, G.; Yu, X.; Jia, G.; Gan, P. Modified vegetation-erosion dynamics model and its application in typical watersheds in the Loess Plateau. Int. J. Sediment. Res. 2011, 26, 78–86. [Google Scholar] [CrossRef]
  67. Gao, G.; Ma, Y.; Fu, B. Temporal Variations of flow–sediment relationships in a highly erodible catchment of the Loess Plateau, China. Land Degrad. Dev. 2015, 27, 758–772. [Google Scholar] [CrossRef] [Green Version]
  68. Xu, K.; Milliman, J.D.; Xu, H. Temporal trend of precipitation and runoff in major Chinese rivers since 1951. Glob. Planet. Chang. 2010, 73, 219–232. [Google Scholar] [CrossRef]
  69. Lu, Q.; Lei, J.; Li, X.; Yang, Y.; Wang, F. China’s combating desertification: National solutions and global paradigm. Bull. Chin. Acad. Sci. 2020, 35, 656–664, (In Chinese with English Abstract). [Google Scholar] [CrossRef]
  70. Fu, B.; Wang, S.; Liu, Y.; Liu, J.; Liang, W.; Miao, C. Hydrogeomorphic ecosystem responses to natural and anthropogenic changes in the Loess Plateau of China. Annu. Rev. Earth Planet. Sci. 2017, 45, 223–243. [Google Scholar] [CrossRef]
  71. Ge, J.; Pitman, A.J.; Guo, W.; Zan, B.; Fu, C. Impact of revegetation of the Loess Plateau of China on the regional growing season water balance. Hydrol. Earth Syst. Sci. 2020, 24, 515–533. [Google Scholar] [CrossRef] [Green Version]
  72. Hui, B.; Hui, L.; Guo, Y. Situation of “Fully filled” warping dam and control strategies in the Loess Plateau Area. Yellow River 2020, 42, 108–112, (In Chinese with English Abstract). [Google Scholar] [CrossRef]
  73. Vaezi, A.R.; Abbasi, M.; Keesstra, S.; Cerdà, A. Assessment of soil particle erodibility and sediment trapping using check dams in small semi-arid catchments. Catena 2017, 157, 227–240. [Google Scholar] [CrossRef] [Green Version]
  74. Wei, Y.; Zhen, L.; Hu, Y.; Xiao, Y. Assessment and needs analysis on soil and water conservation technology in the typical region of the Loess Plateau: A case study of Ansai, China. Acta Ecol. Sin. 2019, 39, 5809–5819. [Google Scholar] [CrossRef]
  75. Ministry of Water Resources, PRC. Code for Design of Soil and Water Conservation Engineering (GB 51018-2014); China Planning Press: Beijing, China, 2014. (In Chinese)
  76. Bai, L.; Wang, N.; Jiao, J.; Chen, Y.; Tang, B.; Wang, H.; Chen, Y.; Yan, X.; Wang, Z. Soil erosion and sediment interception by check dams in a watershed for an extreme rainstorm on the Loess Plateau, China. Int. J. Sediment. Res. 2020, 35, 408–416. [Google Scholar] [CrossRef]
  77. Li, P.; Xu, G.; Lu, K.; Zhang, X.; Shi, P.; Bai, L.; Ren, Z.; Pang, G.; Xiao, L.; Gao, H.; et al. Runoff change and sediment source during rainstorms in an ecologically constructed watershed on the Loess Plateau, China. Sci. Total Environ. 2019, 664, 968–974. [Google Scholar] [CrossRef] [PubMed]
  78. Nu-Fang, F.; Zhi-Hua, S.; Lu, L.; Cheng, J. Rainfall, runoff, and suspended sediment delivery relationships in a small agricultural watershed of the Three Gorges area, China. Geomorphology 2011, 135, 158–166. [Google Scholar] [CrossRef]
Figure 1. Locations of the study area, check dams, and hydrologic stations in the two watersheds.
Sustainability 12 08376 g001
Figure 2. Revegetation, terraces and check dams within the restored watersheds. The photos were taken in April 2019.
Sustainability 12 08376 g002
Figure 3. Rainfall, runoff modulus (RM), and sediment modulus (SM) in the restored watershed (RW) and the natural watershed (NW) from 1988 to 2018. (a) Rainfall in the Qiaozigou watershed; (b) RM in the restored watershed and the natural watershed; (c) SM in the restored watershed and the natural watershed.
Sustainability 12 08376 g003
Figure 4. Relationships between annual rainfall and (a) the runoff modulus (RM), (b) the sediment modulus (SM), and (c) the suspended sediment concentration (SC) in the restored watershed (RW) and the natural watershed (NW).
Sustainability 12 08376 g004
Figure 5. Retention rates of (a) water (RRwater) and (b) soil (RRsoil) from 1988 to 2018. In the box plots, the horizontal line that extends beyond the box represents the mean, the horizontal line within the box represents the median, the boxes represent the range from the 25th to the 75th quartiles, and the whiskers represent the minimum and maximum.
Sustainability 12 08376 g005
Table 1. Restoration practices in the two watersheds.
Vegetation Cover (% of Land Area) aTerrace Cover (% of Land Area)Sloping Land Cover (% of Land Area)Number of Check Dams
NW19853.032.8377.460
Changes after 1985nonenonenonenone
RW198517.770.5371.940
200435.7527.1024.090
2005///19
Changes after 198517.9826.57−47.8519
Difference between RW and NW
(RW–NW)
Before 200532.7224.2753.370
After 200532.7224.2753.3719
a Vegetation includes forest, sparse forest, shrubland, orchards, and grassland.
Table 2. Mann–Kendall trend test for the annual runoff and sediment modulus values in the restored (RW) and natural (NW) watersheds.
M–K Test (Z-Value)TrendSignificance
Rainfall 0.61IncreasingNot significant
Runoff modulusRW−1.70DecreasingNot significant
NW−1.36DecreasingNot significant
Sediment modulusRW−2.35 *DecreasingSignificant at p < 0.05
NW−1.73DecreasingNot significant
Table 3. Mann-Kendall trend test for retention rates of water (RRwater) and soil (RRsoil).
PeriodM–K Test (Z-Value)TrendSignificance
RRwaterperiod Ⅰ0.12IncreasingNot significant
period Ⅱ−1.10DecreasingNot significant
RRsoilperiod Ⅰ0.12IncreasingNot significant
period Ⅱ−1.20DecreasingNot significant
Publisher’s Note: MDPI stays neutral with regard to jurisdictional claims in published maps and institutional affiliations.

