Review

Integrated and Consolidated Review of Plastic Waste Management and Bio-Based Biodegradable Plastics: Challenges and Opportunities

1
Department of Chemical Engineering Technology, University of Johannesburg, Johannesburg 2001, South Africa
2
Department of Chemical, Materials and Metallurgical Engineering, Botswana International University of Science and Technology, Private Mail Bag 16, Palapye 00000, Botswana
*
Author to whom correspondence should be addressed.
Sustainability 2020, 12(20), 8360; https://doi.org/10.3390/su12208360
Submission received: 8 September 2020 / Revised: 28 September 2020 / Accepted: 1 October 2020 / Published: 12 October 2020
(This article belongs to the Section Sustainable Materials)

Abstract

:
Cumulative plastic production worldwide skyrocketed from about 2 million tonnes in 1950 to 8.3 billion tonnes in 2015, with 6.3 billion tonnes (76%) ending up as waste. Of that waste, 79% is either in landfills or the environment. The purpose of the review is to establish the current global status quo in the plastics industry and assess the sustainability of some bio-based biodegradable plastics. This integrative and consolidated review thus builds on previous studies that have focused either on one or a few of the aspects considered in this paper. Three broad items to strongly consider are: Biodegradable plastics and other alternatives are not always environmentally superior to fossil-based plastics; less investment has been made in plastic waste management than in plastics production; and there is no single solution to plastic waste management. Some strategies to push for include: increasing recycling rates, reclaiming plastic waste from the environment, and bans or using alternatives, which can lessen the negative impacts of fossil-based plastics. However, each one has its own challenges, and country-specific scientific evidence is necessary to justify any suggested solutions. In conclusion, governments from all countries and stakeholders should work to strengthen waste management infrastructure in low- and middle-income countries while extended producer responsibility (EPR) and deposit refund schemes (DPRs) are important add-ons to consider in plastic waste management, as they have been found to be effective in Australia, France, Germany, and Ecuador.

1. Introduction

Plastics are materials that exhibit a degree of flowability during their production such that they can be extruded, molded, cast, spun, or used as coatings [1]. The term plastic is therefore derived from the Greek word “plastikos”, which means moldable [2]. Plastics are synthesized through polymerization. During polymerization, small molecules, monomers, chemically combine to form macromolecules that are interlinked to form a chain-like or network molecule, referred to as a polymer [3,4]. Bakelite was the first synthetic polymer to be produced in 1907, and this marked the beginning of the “Plastic Age”, although mass production of various items would only commence over 30 years later [1,5]. Global plastics production in 1950 reached about 2 million tonnes. However, this pales in significance when compared with the production statistics for 2015, which are estimated at 380 million tonnes [6], indicating an increase of 378 million tonnes, as shown in Table 1. The 2015 plastic production estimate is equivalent to the weight of 66% of the world’s human population assuming an average individual weight of 75 kg [7]. This marked growth in the plastics industry is due to the versatile nature of plastics, which has resulted in their application and use in varied industries. Plastics can be used over a wide range of temperatures, are biologically inert, corrosion resistant, cheap, have a high specific strength, are good heat and electrical insulators, and are durable [1,5,8]. The plastics industry has contributed significantly to economic growth, creating employment for over 60 million people globally [2]. Plastics used in the medical, transportation, manufacturing, water, and sanitation and food packaging sectors have enabled, respectively: the manufacture of medical instruments and artificial organs, reduction in fuel costs, potable water supply and storage, as well as a reduction in food wastage, as food is preserved for longer periods [1,8]. Plastics are commonly produced from petroleum-based feedstock. It is estimated that about 4% of the world’s oil is used in plastics manufacturing, while a further 3–4% is used to provide energy to produce these plastics [9]. It is expected by 2050 that the whole plastics industry will constitute 20% of the world’s total oil consumption [10].

1.1. The Plastic Waste Management Challenge or Problem

Despite the many benefits attributed to plastic use, unsustainable production, consumption, and disposal patterns will lead to the depletion of non-renewable resources, environmental degradation, climate change, as well as negatively impacting the survival of humans and animals. In 2015, petroleum-based plastics emitted 1781 Mt of carbon dioxide equivalent during their life cycle, as shown in Figure 1, and if a business-as-usual scenario is maintained, the petroleum-based plastic emissions are set to increase to 6500 Mt CO2 eq by 2050 [11].
Between 1950 and 2015, 79% of plastic waste was reported to have been mismanaged, as shown in Table 1. This implies that an estimated 5 billion tonnes of plastic are either in landfills or natural environment. By 2050, it is estimated that the cumulative amount of plastics ever produced will reach 34 billion tonnes, with 12 billion tonnes of plastic waste either in landfills or the environment as litter at current consumption levels [6,12]. In Sub-Saharan Africa, one of the regions that is regarded as inadequately resourced in waste management, waste generated will increase the fastest, by 300%, in 2050, in tandem with the boom in plastic production expected in this region signaling the needed urgency to intervene [13].
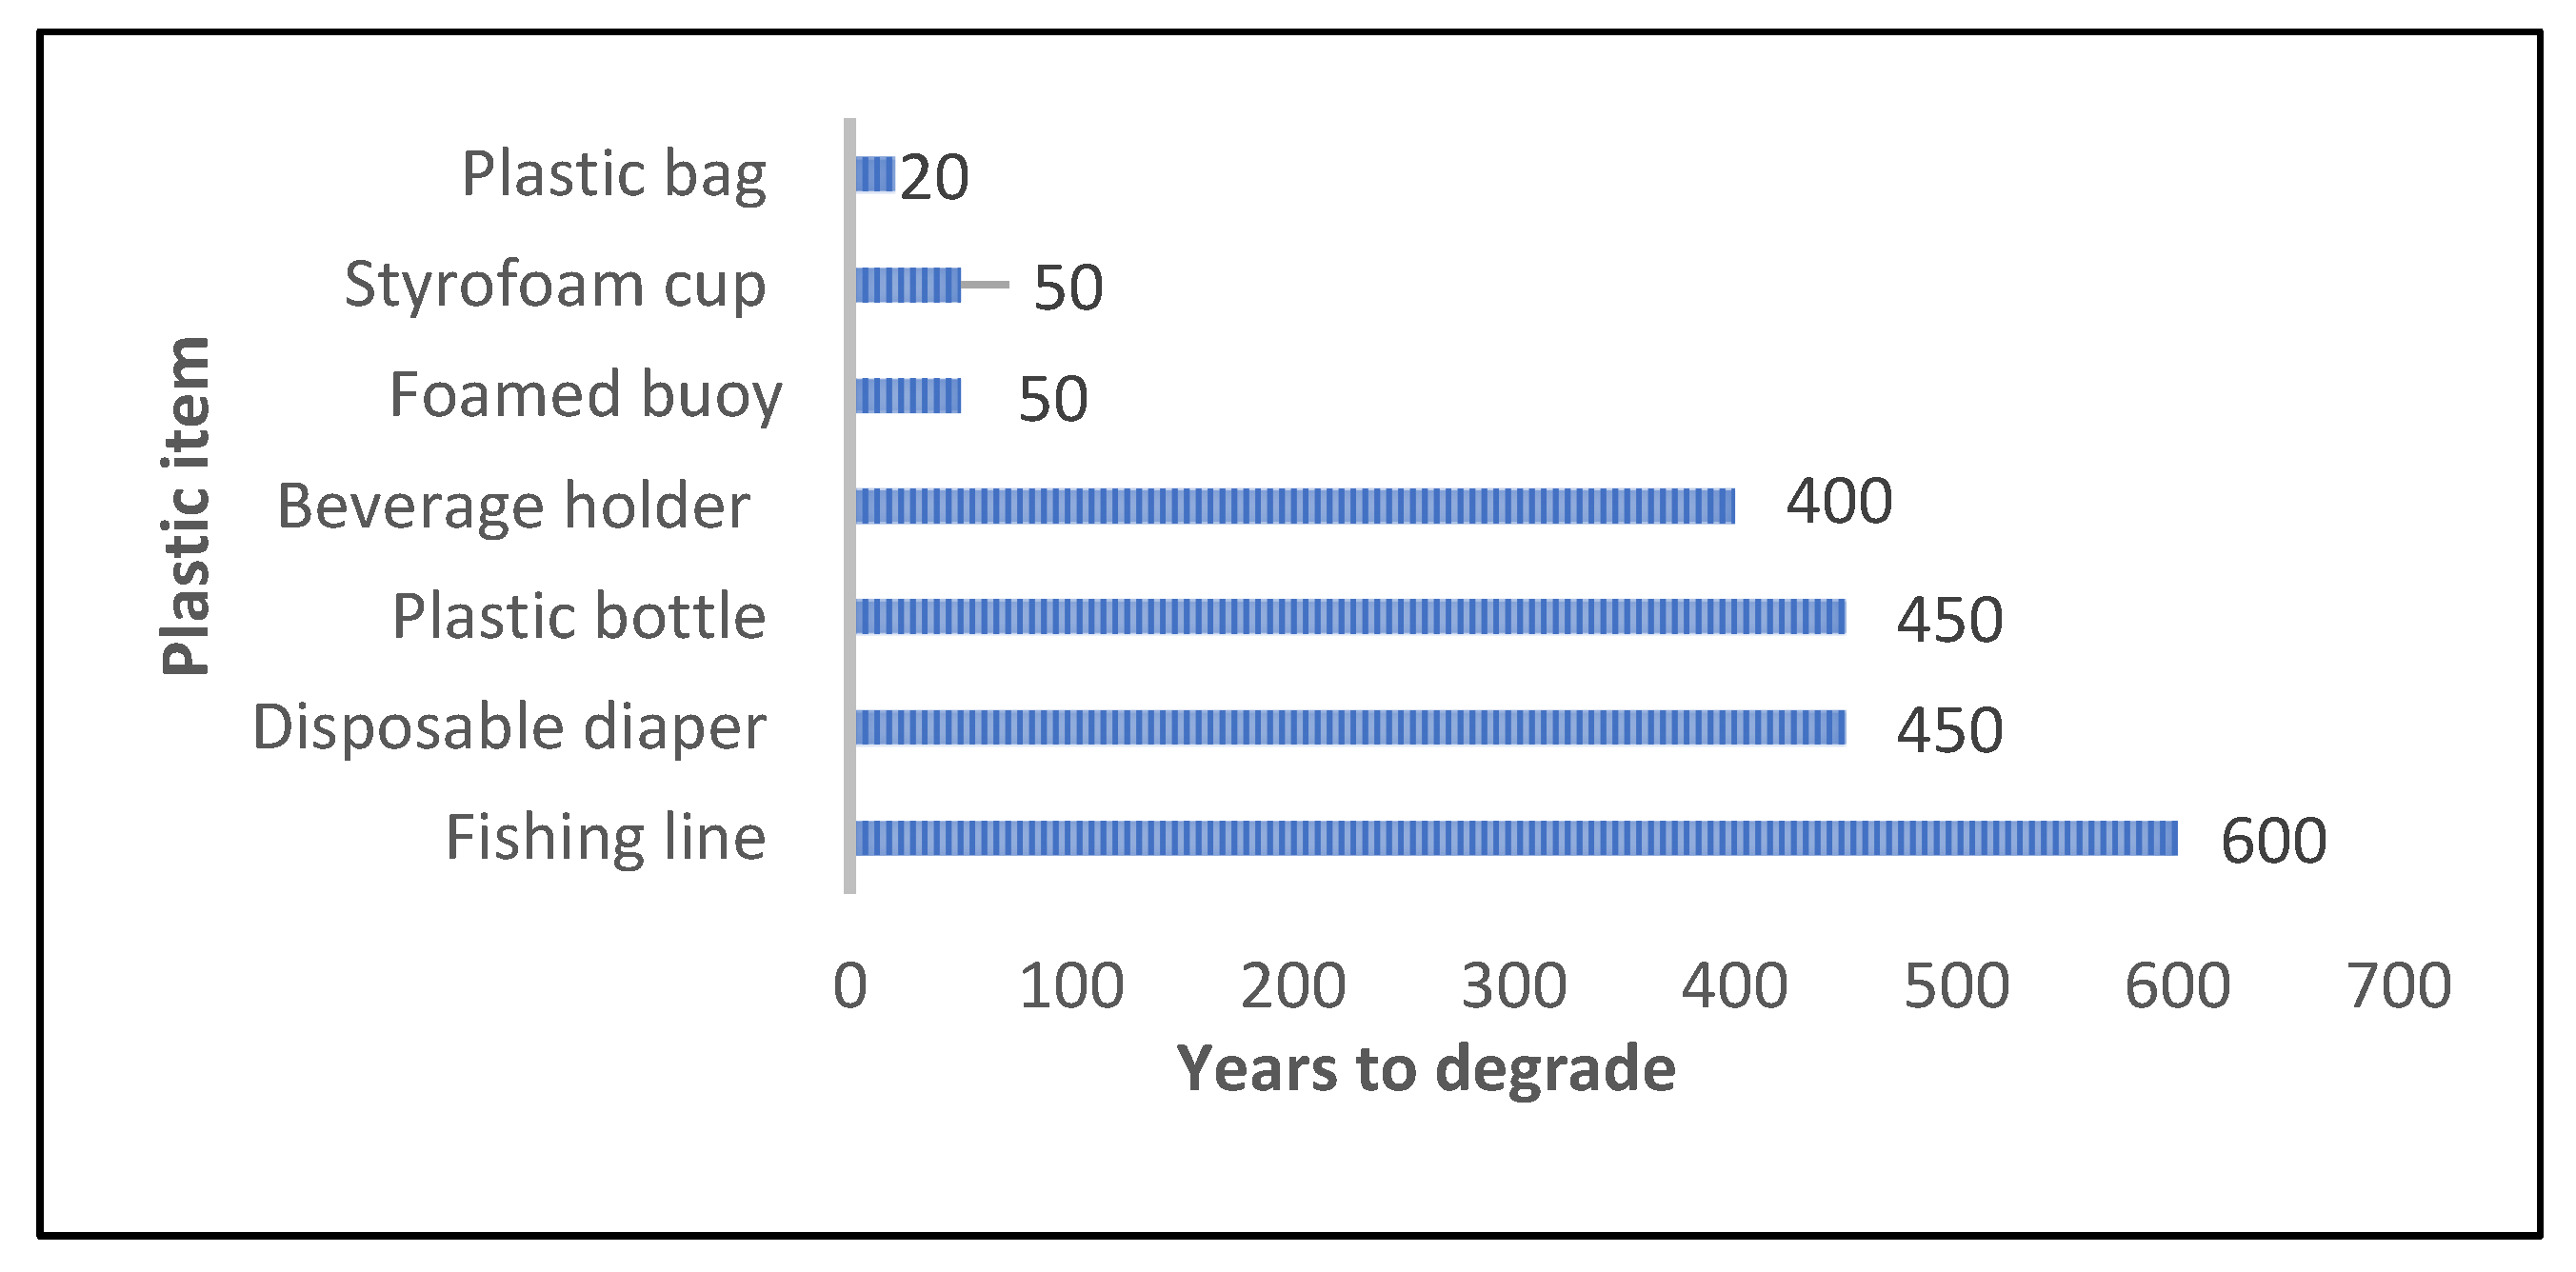
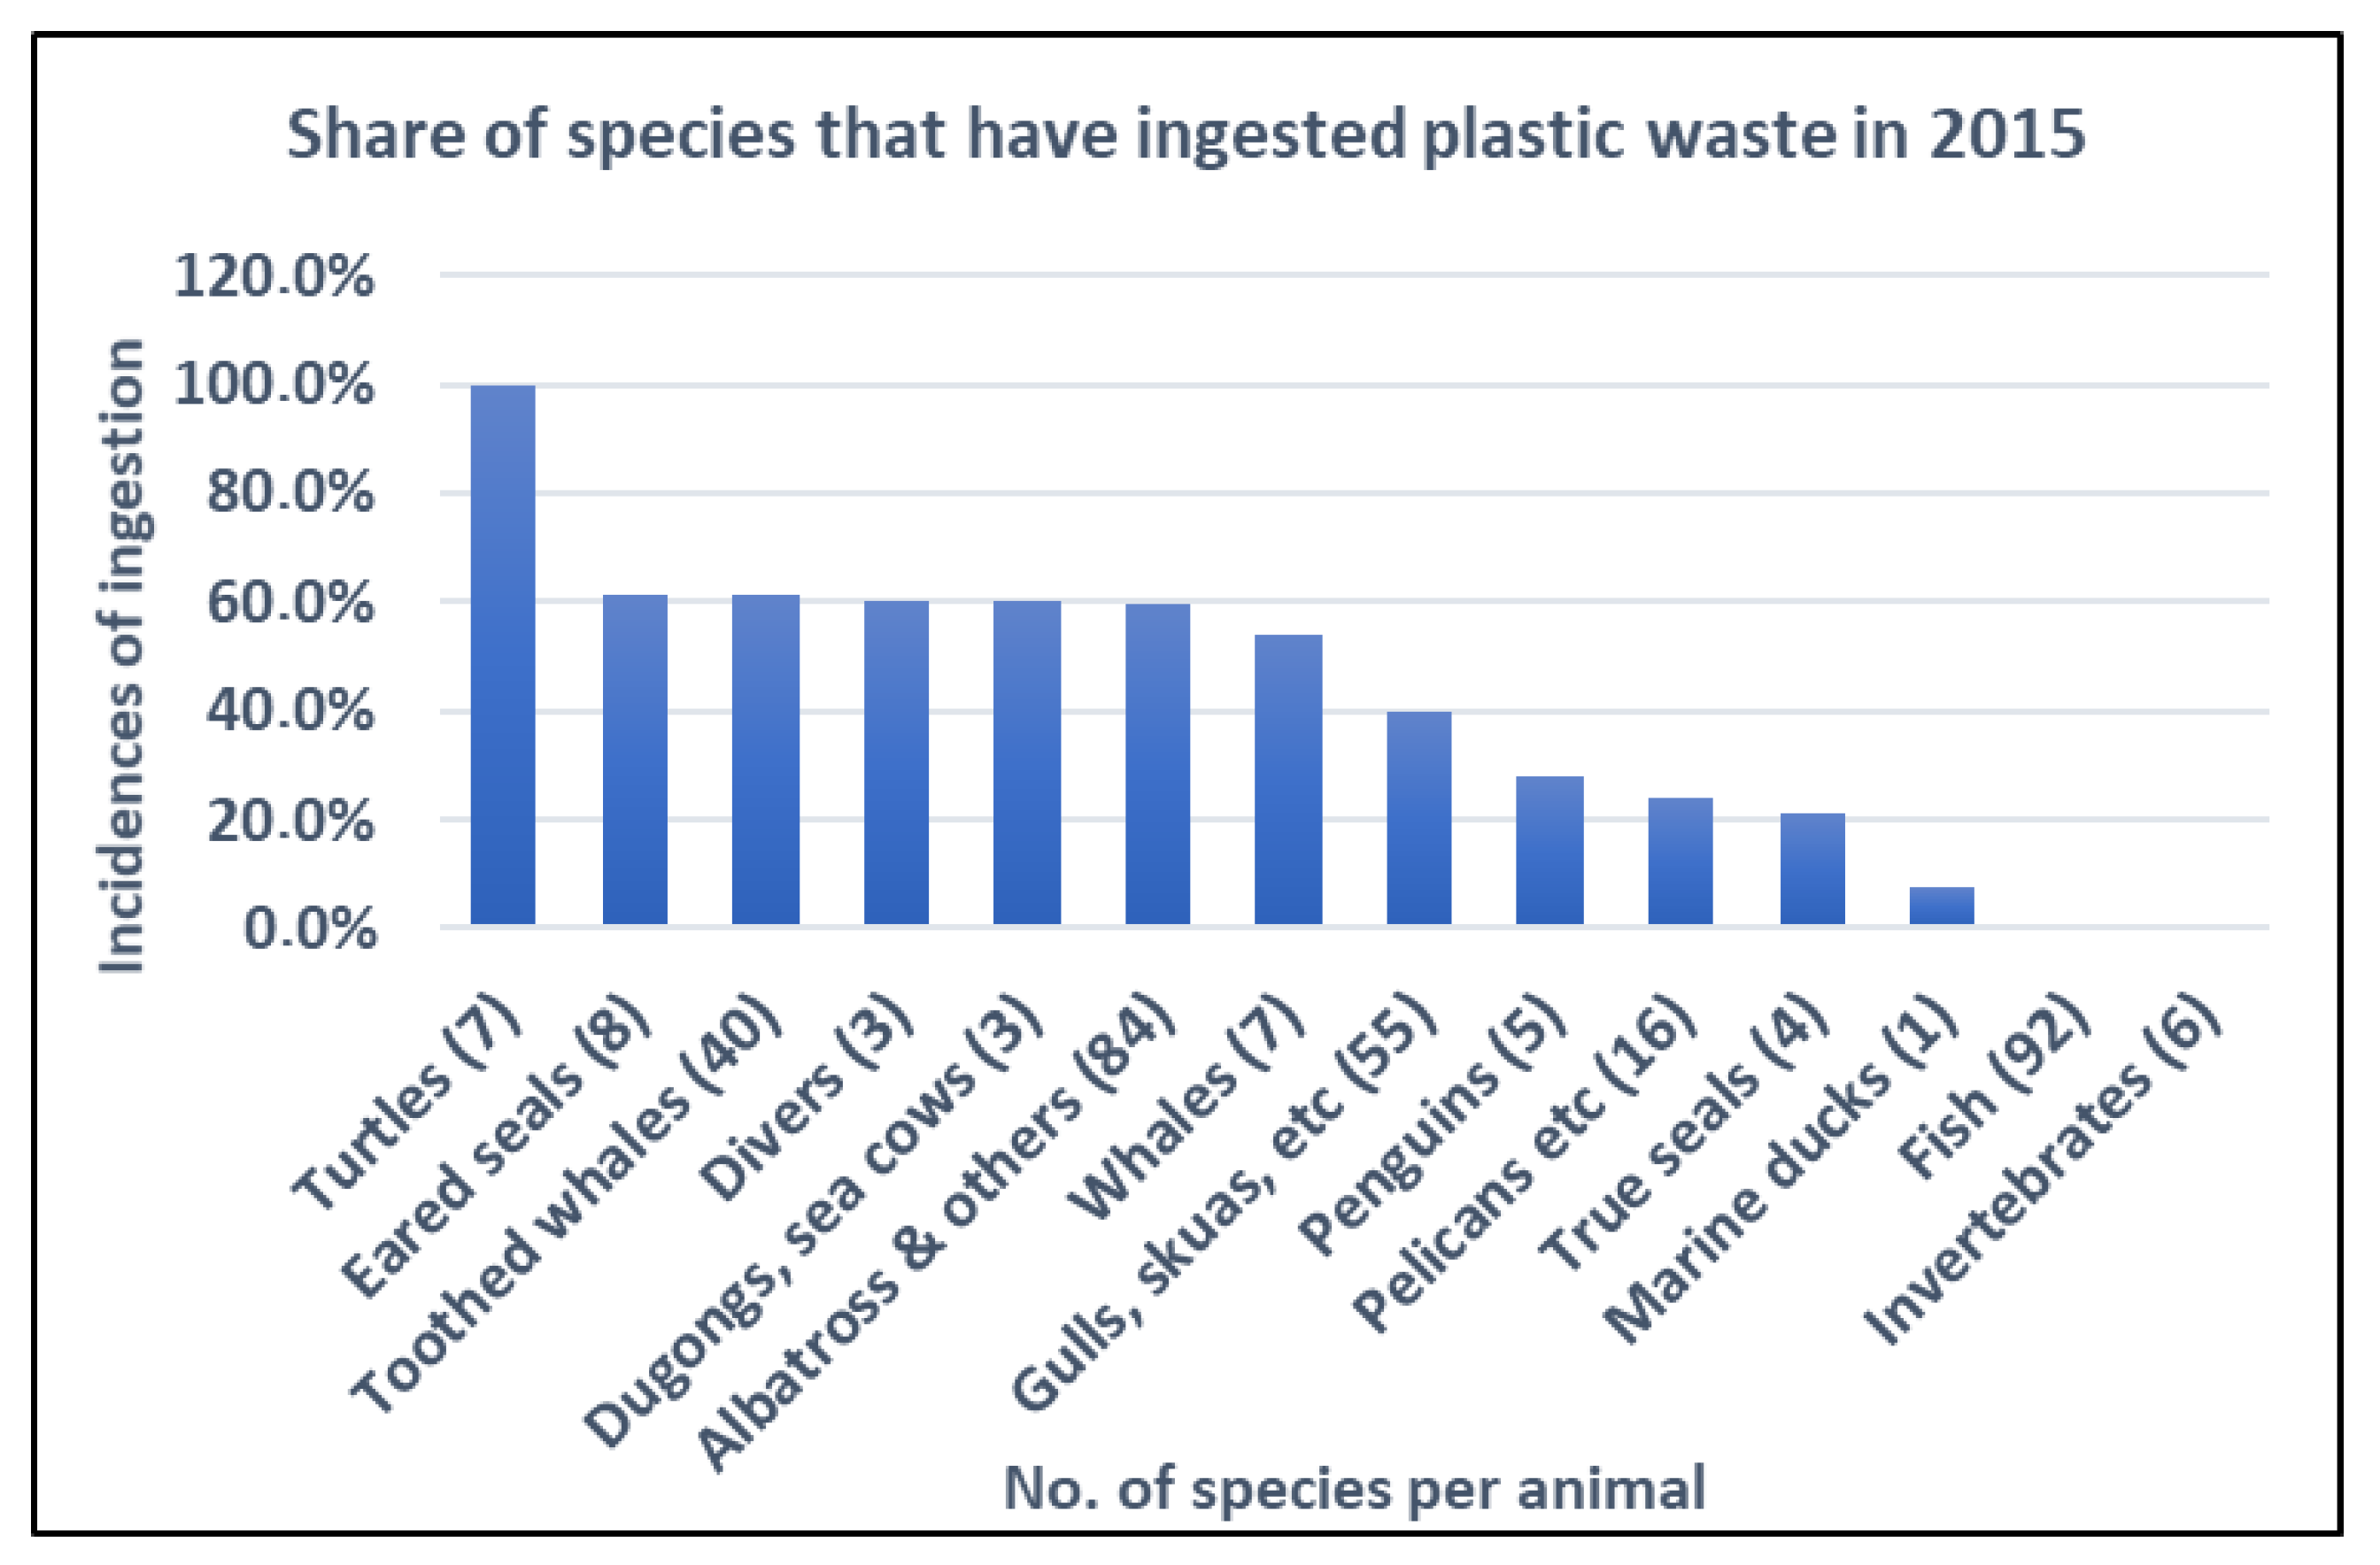
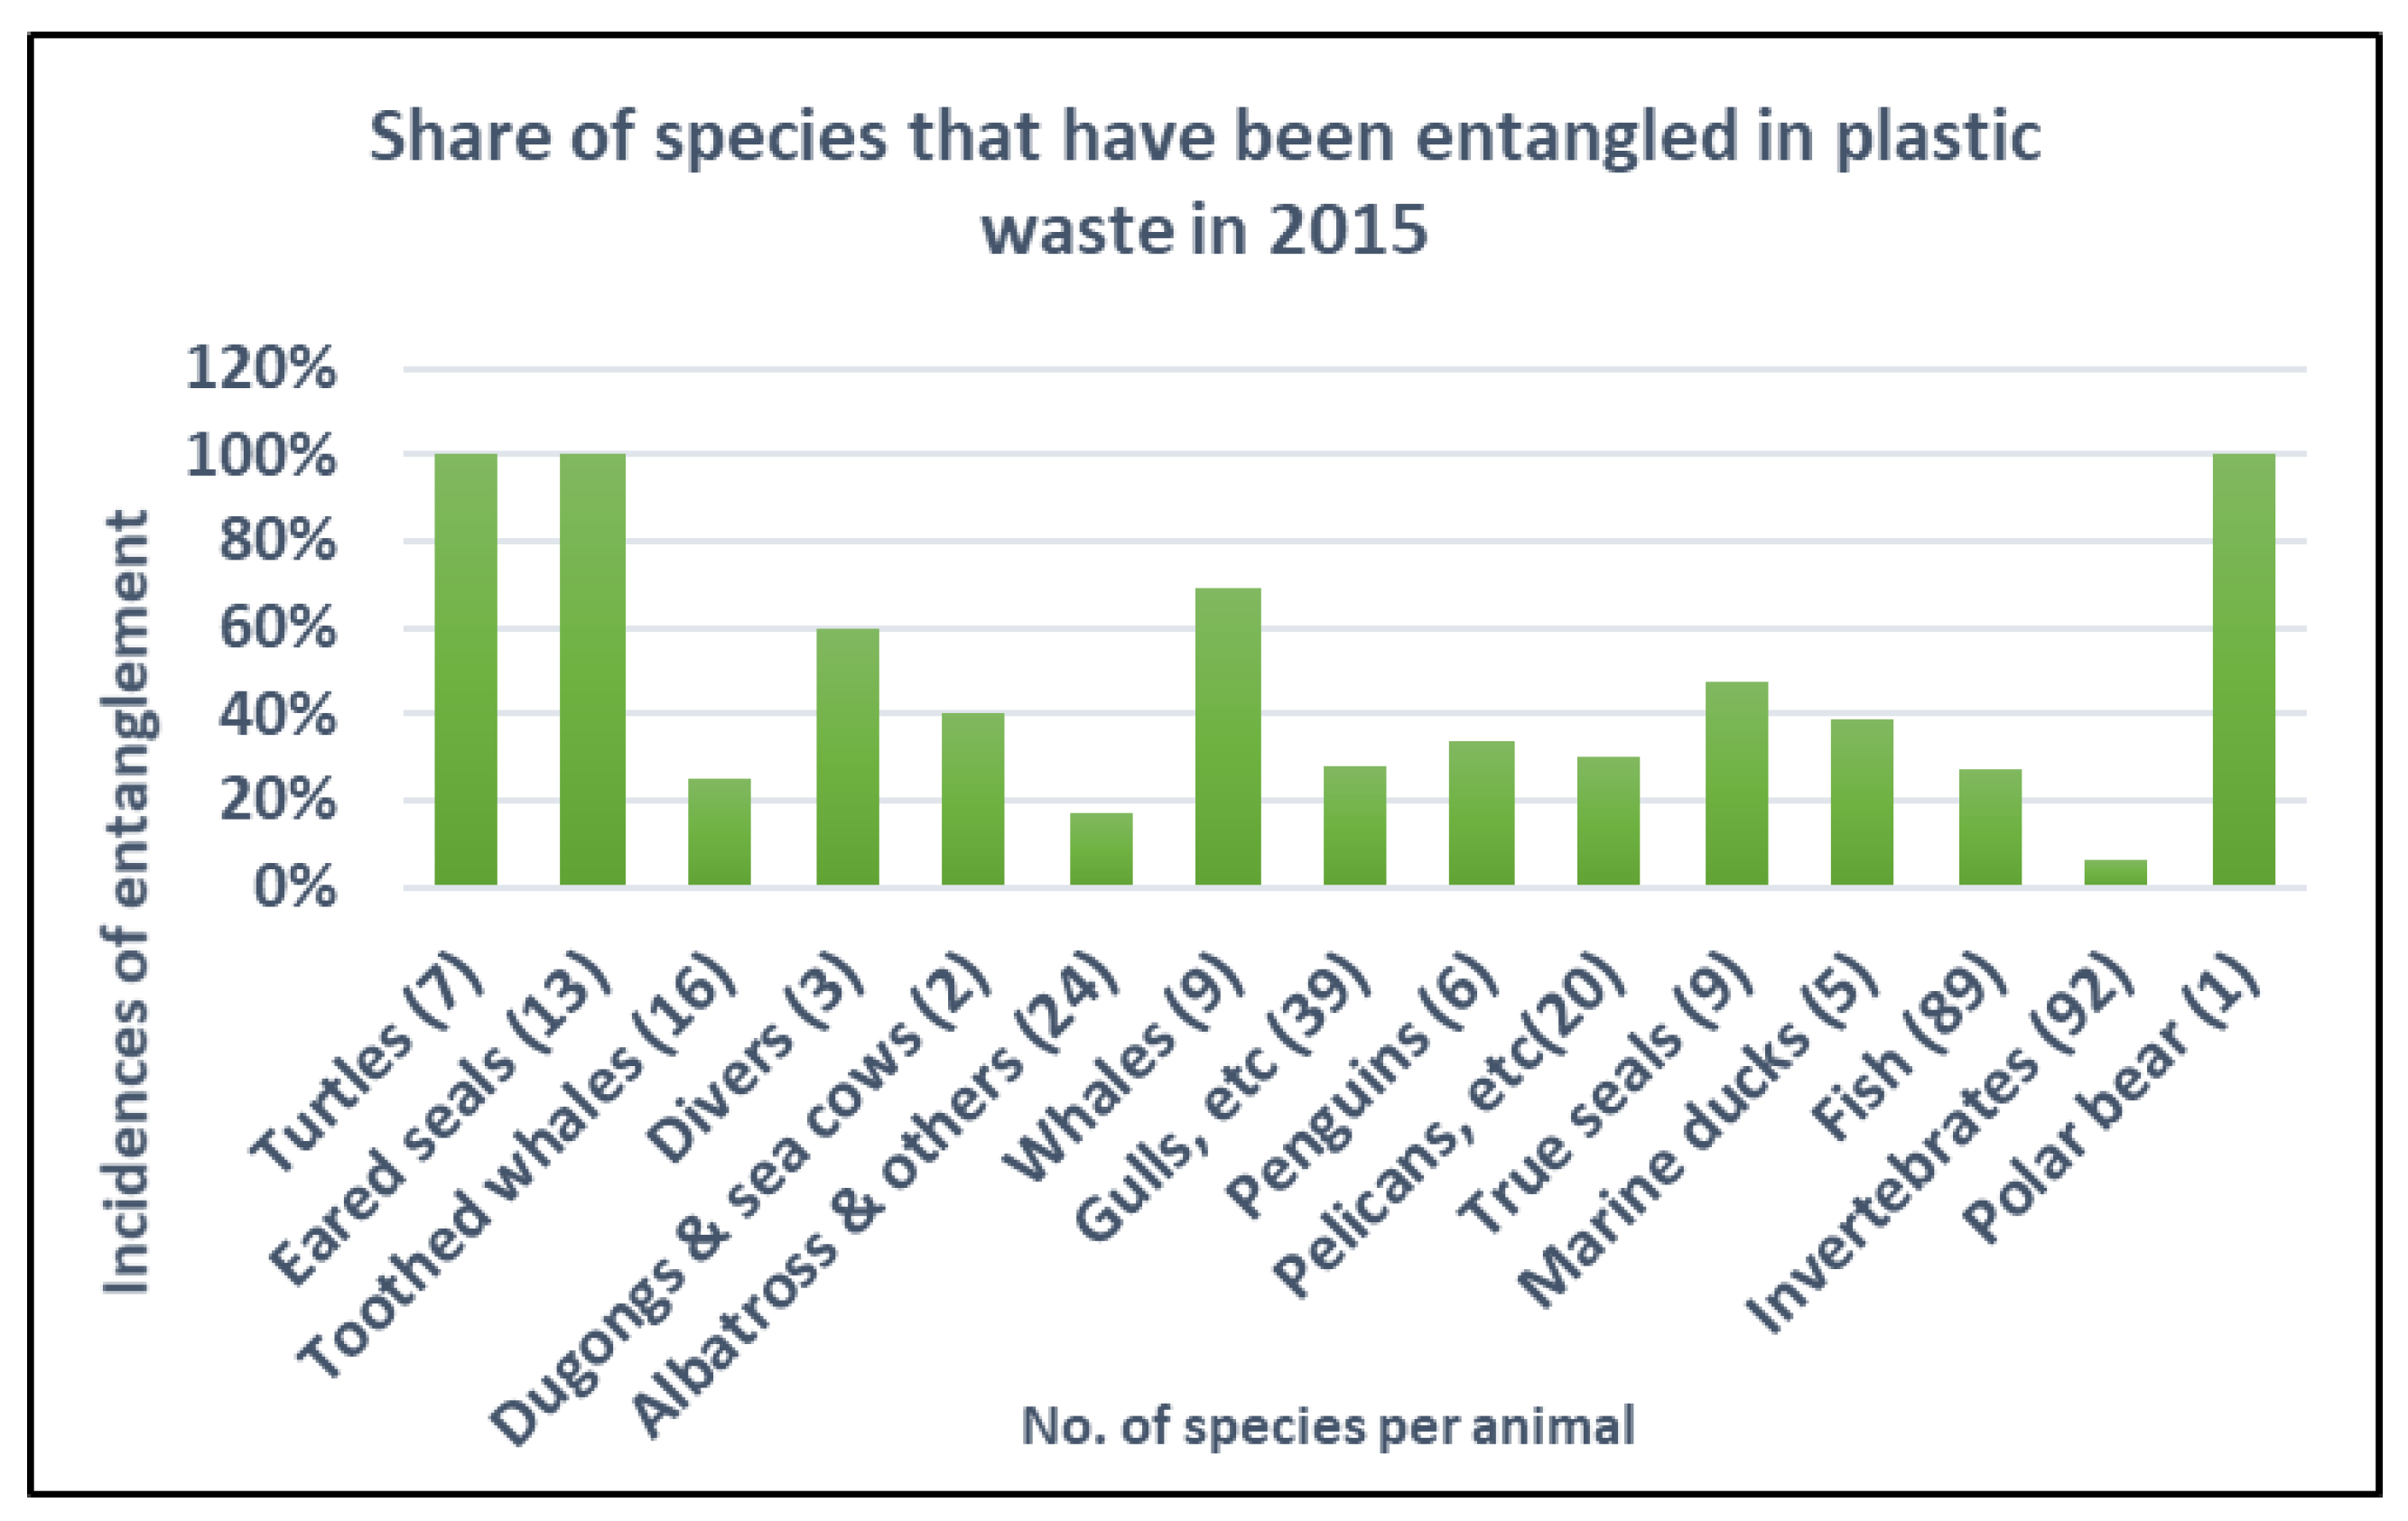
Due to its stability, plastic can be classified as a persistent pollutant. Figure 2 shows the time it takes for various plastic items to degrade. For example, plastic bottles degrade after 450 years [7], and even then, they form microplastics, which are ingested [14] by marine animals and have landed on our tables in the form of sea food as well as table salt and water [5]. Approximately 51 trillion microplastics are floating in the oceans, and this is 500 times more than the stars in our galaxy [15]. Synthetic textiles, car tires, city dust, road markings, marine coatings, personal care products, and plastic pellets all contribute towards the load of microplastics in the ocean, accounting for 35%, 28%, 24%, 7%, 3.7%, 2%, and 0.3%, respectively [16]. Larger marine animals may ingest macroplastics ([17], Figure 3, and Ritchie and Roser [7], cite de Stephanis et al. [18], who reported that a rope (9 m in length), a hose (4.5 m), 2 flowerpots, and plastic sheets have been ingested by sperm whales). A significant number of animals are also entangled [19] in plastics, as shown in Figure 4. According to the United Nations Educational, Scientific, and Cultural Organization (UNESCO) [20], over a million sea birds and more than 100,000 marine animals die yearly from plastic waste ingestion or entanglement.
Mato et al. [21] highlight the adsorption of toxic chemicals such as pesticides by plastic, which contaminates marine food chains, while Tanaka et al. [22] detected high levels of polybrominated diphenyl ethers (PBDEs) in 3 out of 12 sea birds analyzed. These chemicals, used as flame retardants in plastics, were also detected in the plastic matter found in the stomachs of these birds, indicating transference of plastic additives to marine animals [22]. Although there are concerns about potential human health impacts associated with consuming marine species that may be laden with toxins [23], the impacts are not yet fully understood [7,24], which is worrying, and therefore there is an urgent need for such potential impacts assessments to be conducted.
Land animals such as cattle, donkeys, sheep, and goats face a similar danger of plastic ingestion, which blocks the gastrointestinal tract leading to death. Chemicals may also leach out from these plastics and in turn affect the meat and milk from the livestock [25], and the impact on humans is also not yet clear. In addition, plastic waste pollution has been associated with an increase in flooding episodes in communities from blocked storm water drainage systems, parasitic diseases by serving as breeding grounds, respiratory diseases from indiscriminate burning, and eventual deaths in people [13]. A plastic-waste-induced global loss of around US$13 billion per year has also been reported for tourism (due to reduced aesthetics and therefore recreational activities) and fishing industries, together with losses from clean-up campaigns [26]. These socio/health, environmental, and economic impacts of mismanaged plastics have also been discussed at length in another publication by the authors [27].

1.2. Inventory of Plastic Management Systems

This review presents an integrative assessment of the current and important issues surrounding the generation of plastic and its management to consolidate them and identify gaps in the field for future research. Key words and phrases were used in computer-based searches of various academic databases, Google, and Google Scholar to acquire the relevant literature. This review covers key temporal and special scale statistics on plastics, considering their entire life cycle and the associated negative socio-economic, human health, and environmental impacts emanating from the unsustainable plastics production, consumption, and disposal patterns. A review of the most commonly littered plastic items, life cycle assessment studies on alternatives to traditional plastics, the importance of oceans in carbon sequestration, brief description on bioplastics, followed by an in-depth analysis on the advantages and disadvantages of bio-based biodegradable plastics and various renewable feedstocks previously studied was undertaken. Descriptions of EPR and DPR are given in order to determine where these tools fit in relation to plastic waste management. In addition, conventions, commitments, and declarations that have been drafted globally in the fight against plastic pollution are also compiled and listed to provide a readily available database for policy analysts on plastic and its waste management.
This integrative and consolidated review thus builds on previous studies that have focused either on one or a few of the aforementioned aspects. For example, Alabi et al. [28] reviewed the environmental and health impacts of mismanaged plastic waste and ways to manage this waste. They report that bioplastics would be better for the environment, despite not providing an adequate assessment to make this bold claim. Narancic and O’Connor [29] reviewed bio-based biodegradable plastics, specifically polyhydroxyalkanoates and polylactide and their biodegradability, but their scope did not address other shortcomings of these plastics, which are highlighted in greater detail in this article. Cheng et al. [30] only reviewed polylactide in their work, while Walker and Rothman [31] conducted a review on life cycle assessments of bio-based and fossil-based plastics only. This review article will therefore not only be a helpful guide to use for researchers in the field, policy makers, and other stakeholders, but will also provide detailed critical issues relating to plastic and its management, thereby giving insights for possible future research gaps.
The review study therefore specifically seeks:
  • To conduct an integrative review on plastic and its management and post-consumer use that provides the current status quo globally as well as establishes where more resources should be channeled in order to mitigate the impacts of mismanaged plastic waste on humans, animals, and the environment.
  • To assess the possibility of reclaiming plastic waste that is currently circulating in the environment, both on land and in the marine environment.
  • To comparatively evaluate if alternative materials to traditional plastics are more environmentally sustainable and provide the potential associated consequences of replacing plastics.
  • To determine the strengths and shortcomings of some bio-based biodegradable plastics on the market as well as assess the areas of application where they are best suited.
  • To determine whether EPR and DRS are beneficial tools in plastic waste management.

2. Data Sources

A desktop review was conducted using selected relevant literature. A total of 108 peer-reviewed articles covering the scope of the study were used, while other information came from books, book chapters, and grey literature. For peer-reviewed articles, both research and review articles were considered, with initial screening done by assessing abstracts. The literature search was conducted between November 2019 and August 2020 with literature from the year 2000 to the present considered. Where other researchers reviewed a subject of interest, these were cited in the study. Due to the multi-faceted nature of this study, that is, dwelling on many aspects in one study, the list of reviewed articles per each reviewed aspect is not exhaustive.
The study also necessitated the need for accessing grey literature, as not all information could be located in academic databases. For example, information on declarations and conventions, bioplastics, some properties of biodegradable plastics, socio-economic impacts of mismanaging plastic waste, plastic bans, EPR, and DPR was acquired from grey literature. The authors also identified a number of gaps, which are highlighted at the conclusion of the paper. Table 2 shows the search engines, academic research databases, and search terms used in this study. Searches on biodegradable plastics were performed in the ScienceDirect database with and without the Boolean operators AND, OR, NOT, and the return of results was similar.

3. Inventory of Plastic Production and Its Waste Management

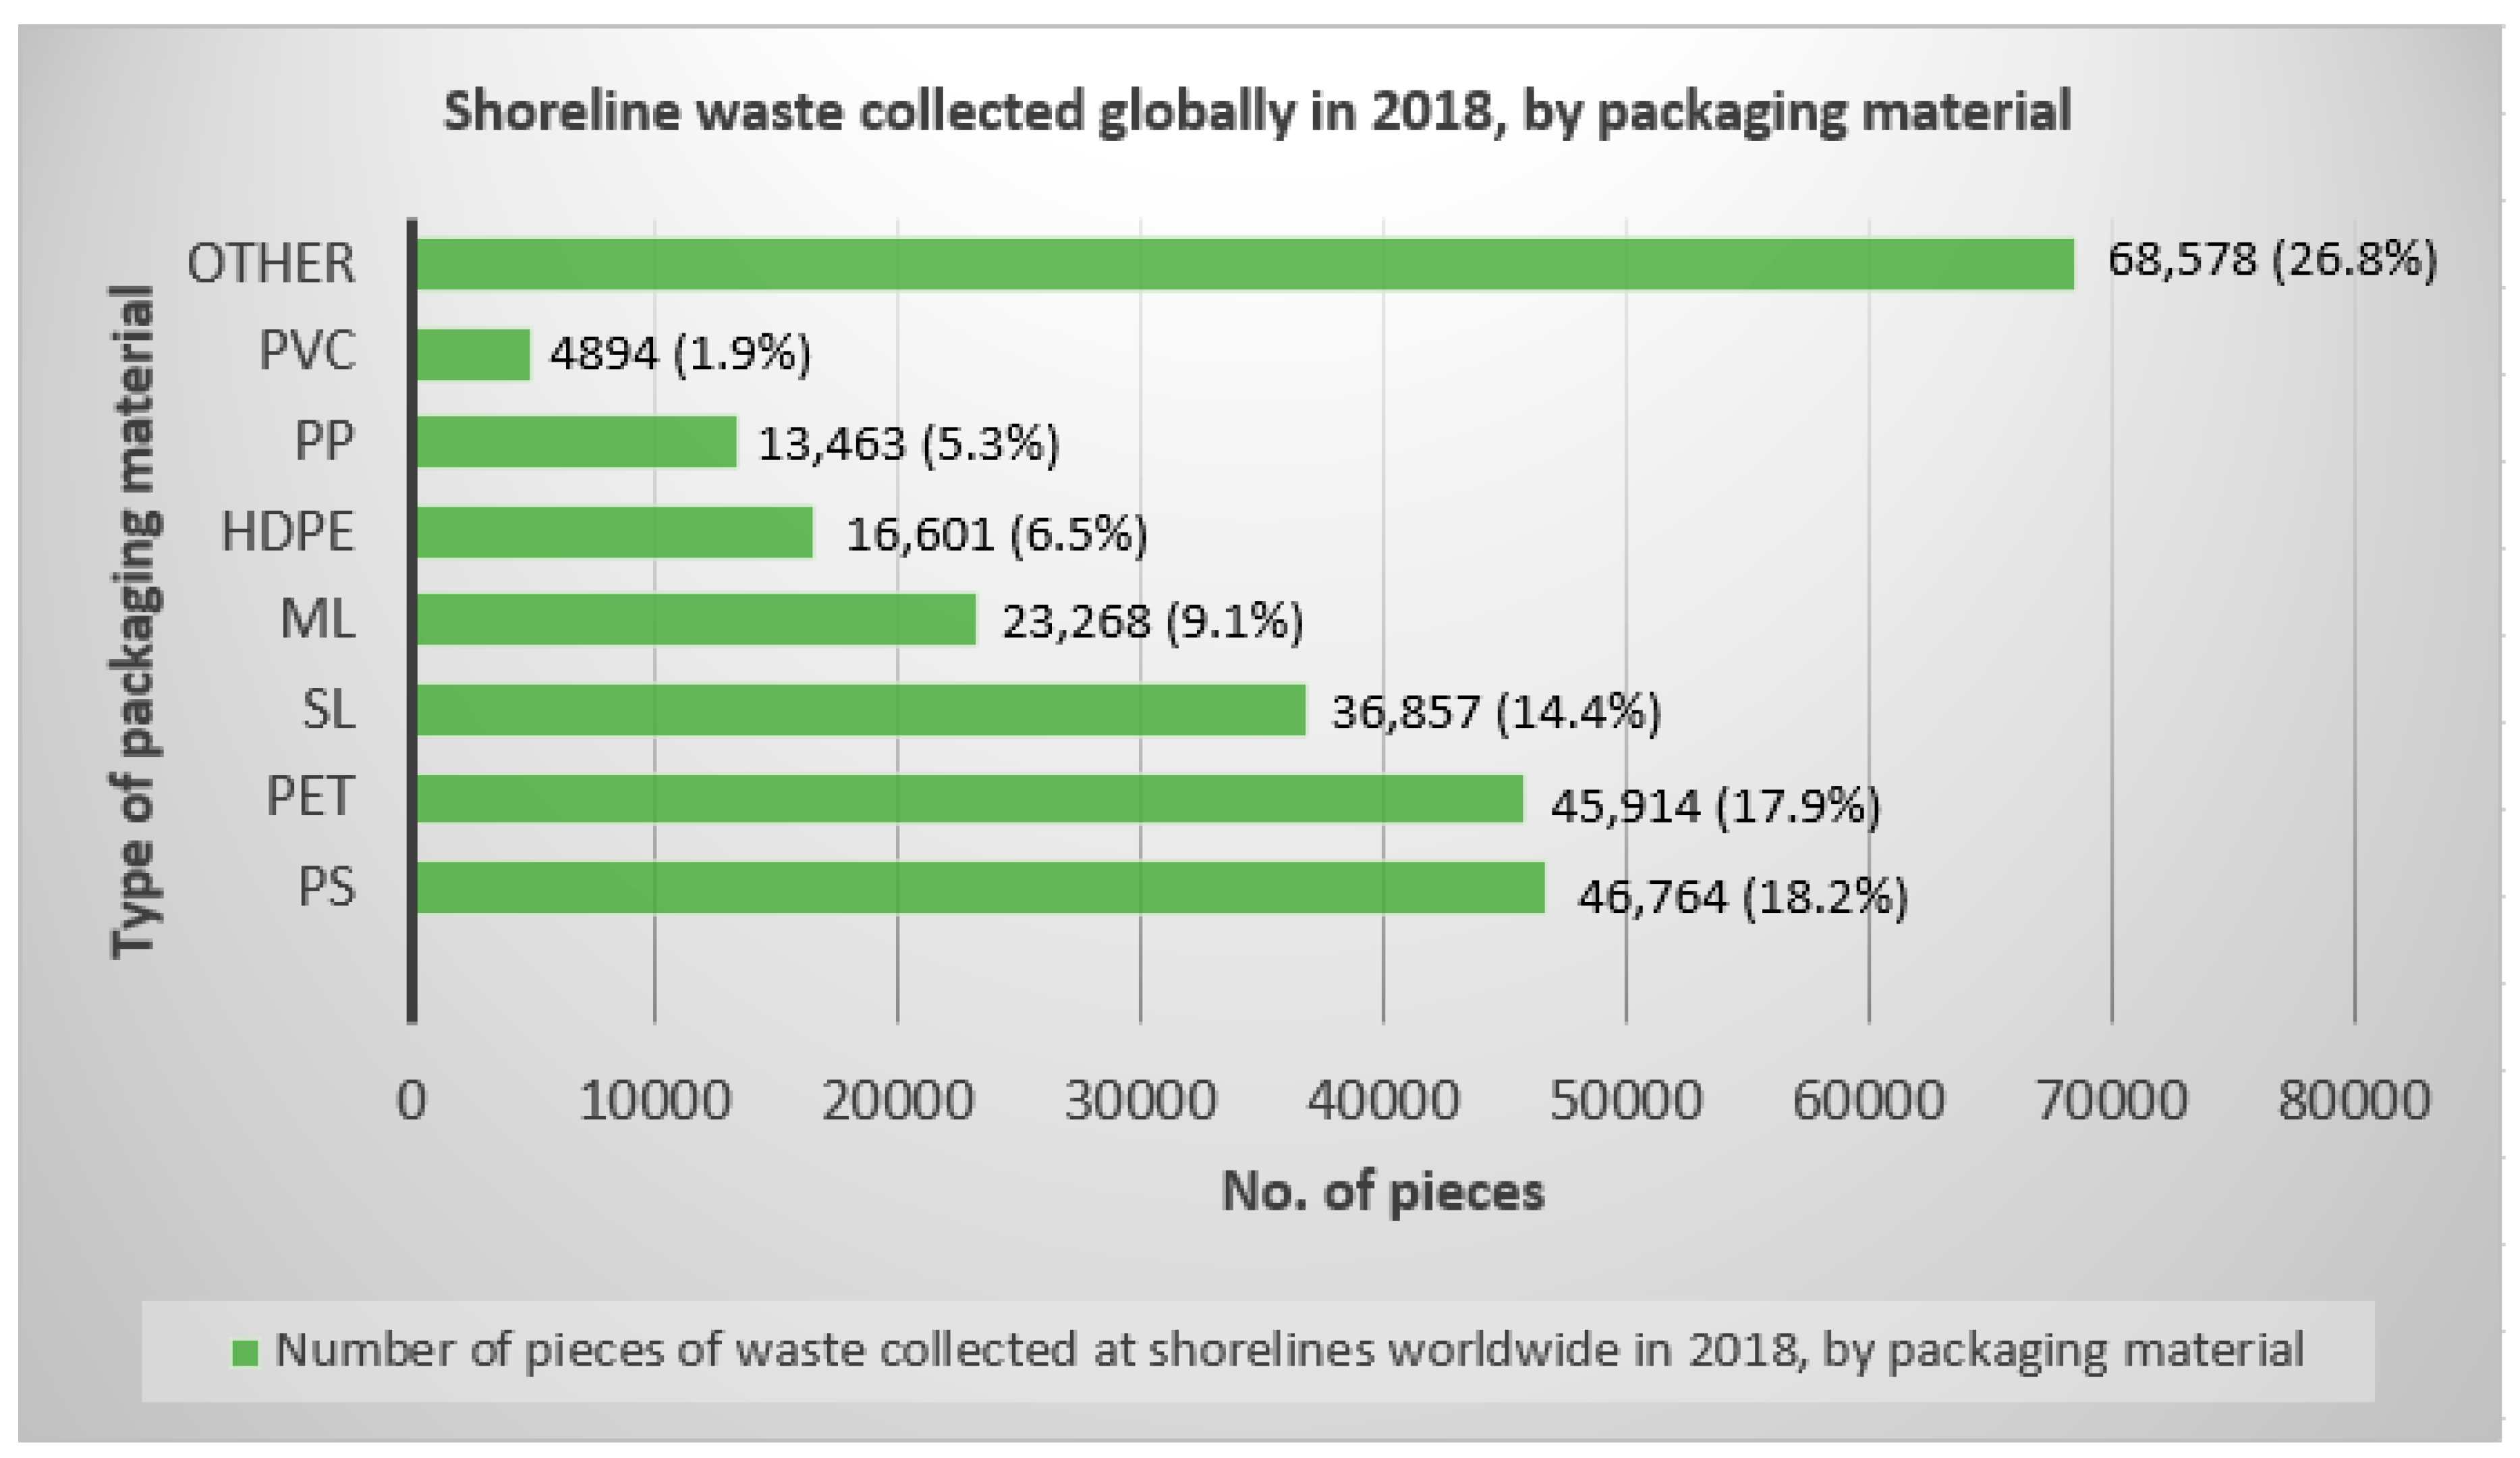
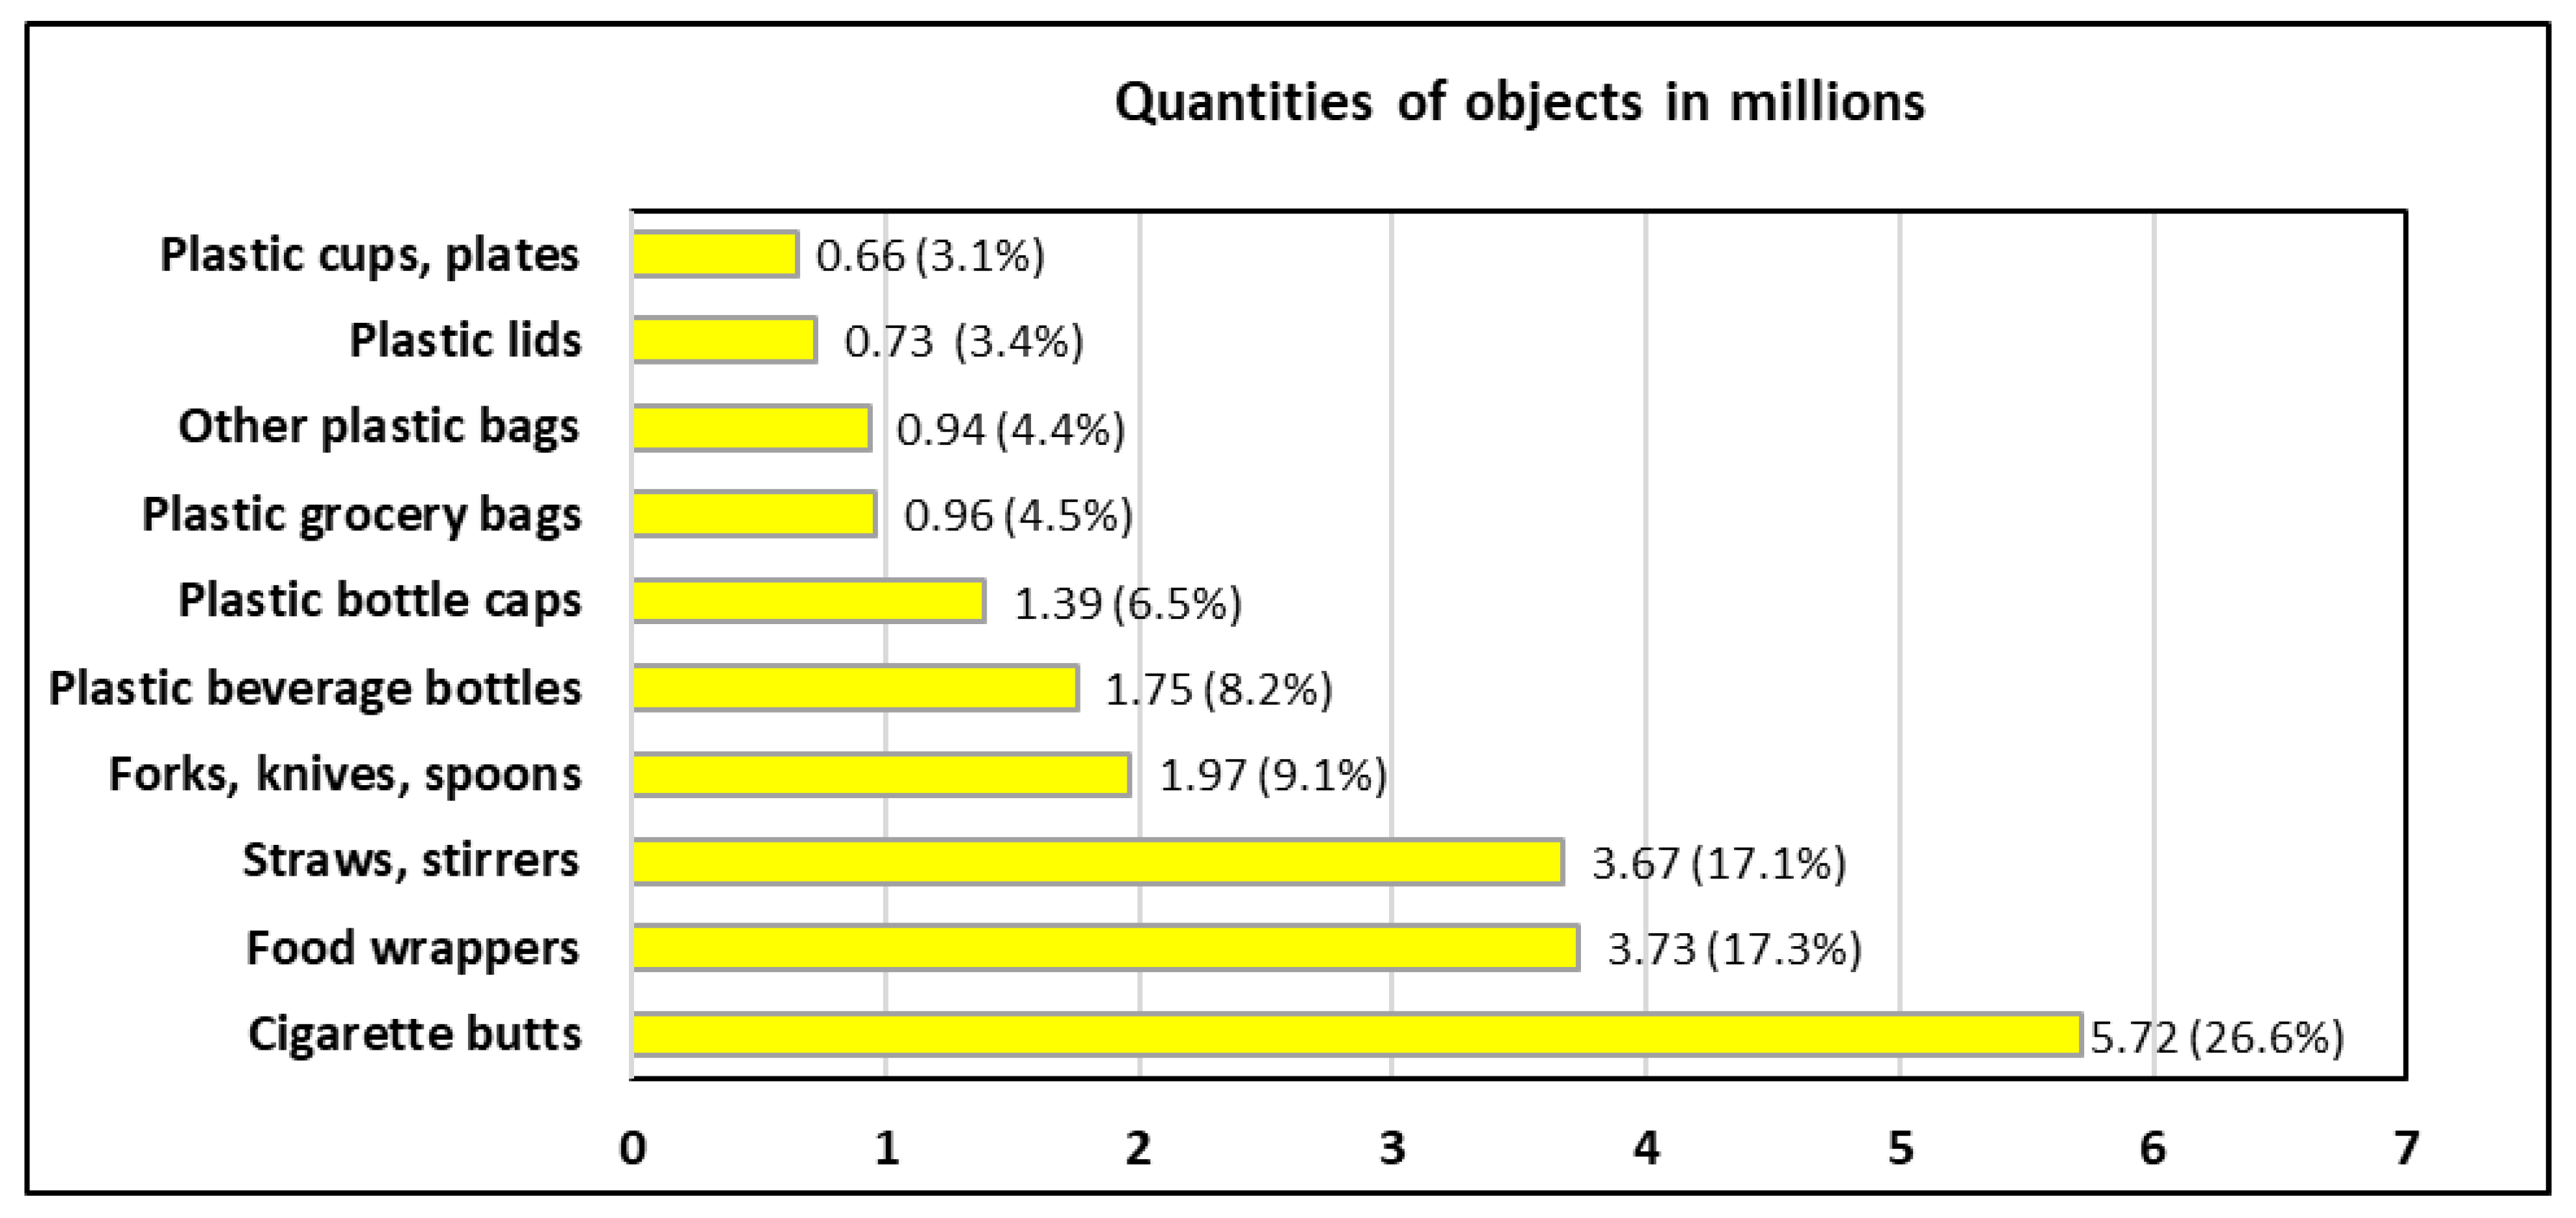
Figure 5 shows the number of plastic objects found globally on shorelines in 2018.
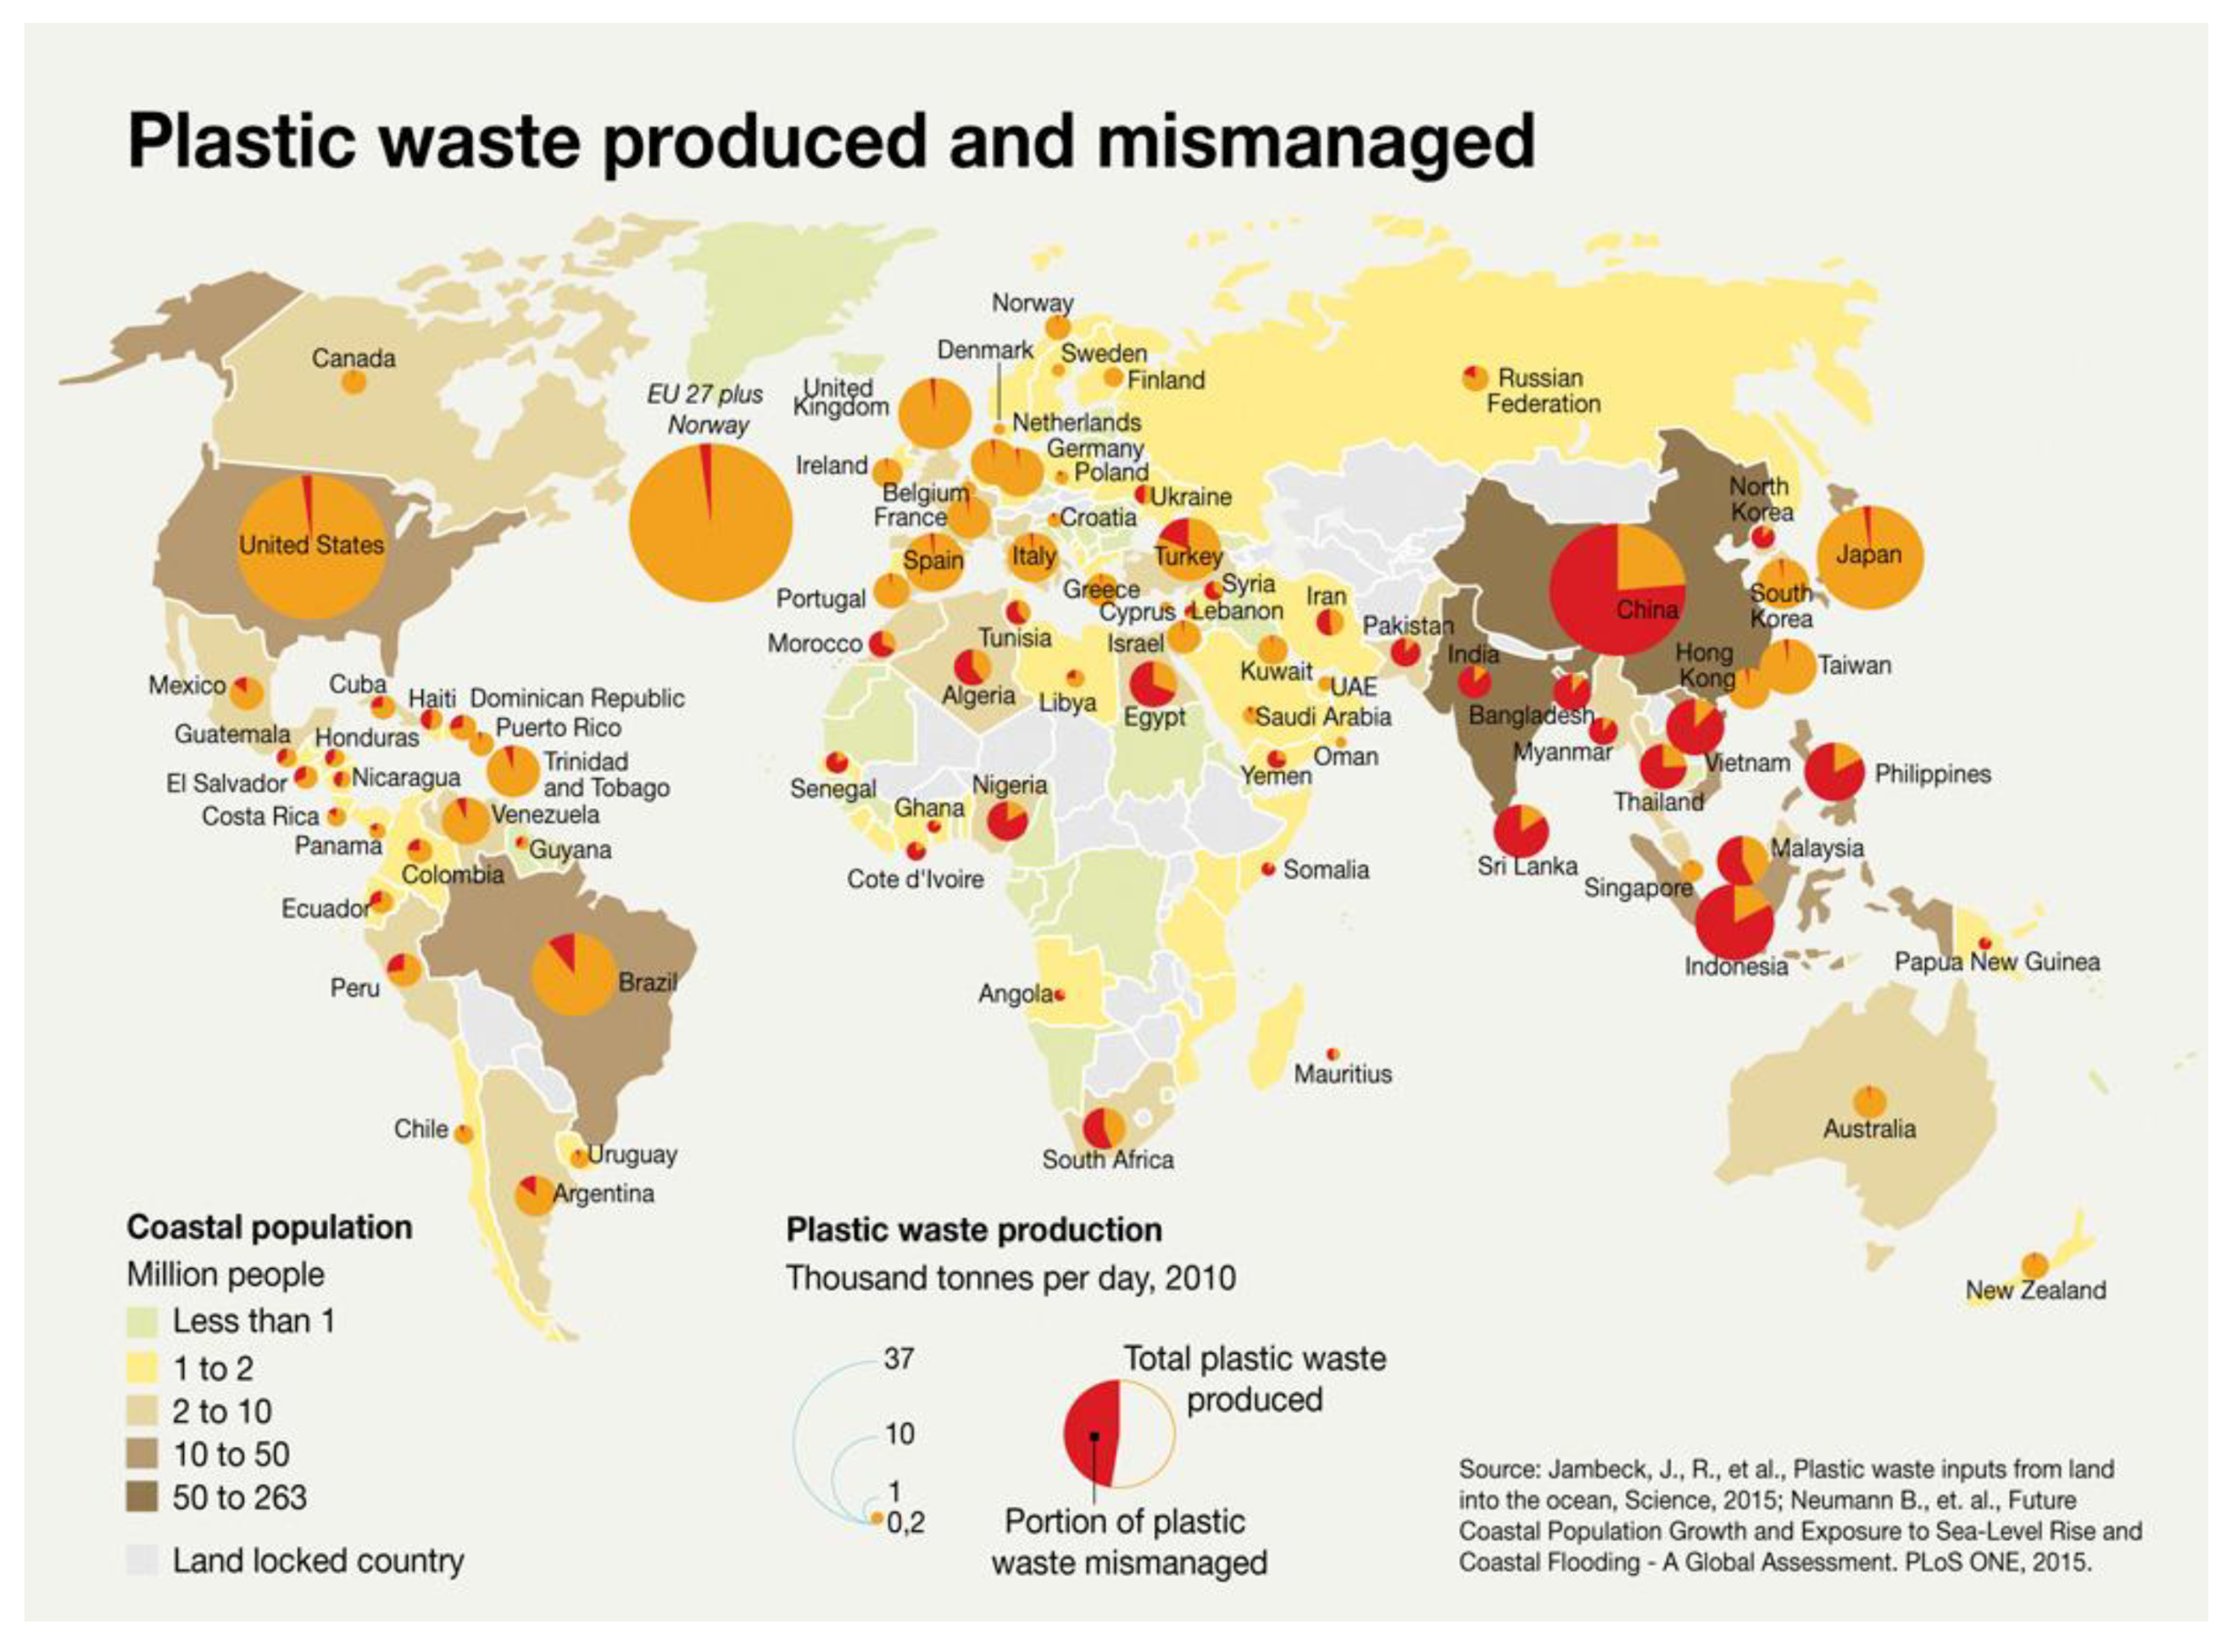
The amount of plastic generated per capita varies from country to country. Ritchie and Roser [7] reported that for high-income countries, this figure is higher compared to low income countries. However, despite this disparity, the most important aspect that determines how much plastic enters the environment as waste, are waste management systems utilized in various countries. Consequently, low income countries will not necessarily contribute less plastic waste compared to high income countries [7]. The authors reported that plastic waste management infrastructure is quite effective in high income countries and as such, their plastic waste leakage into oceans is rare.
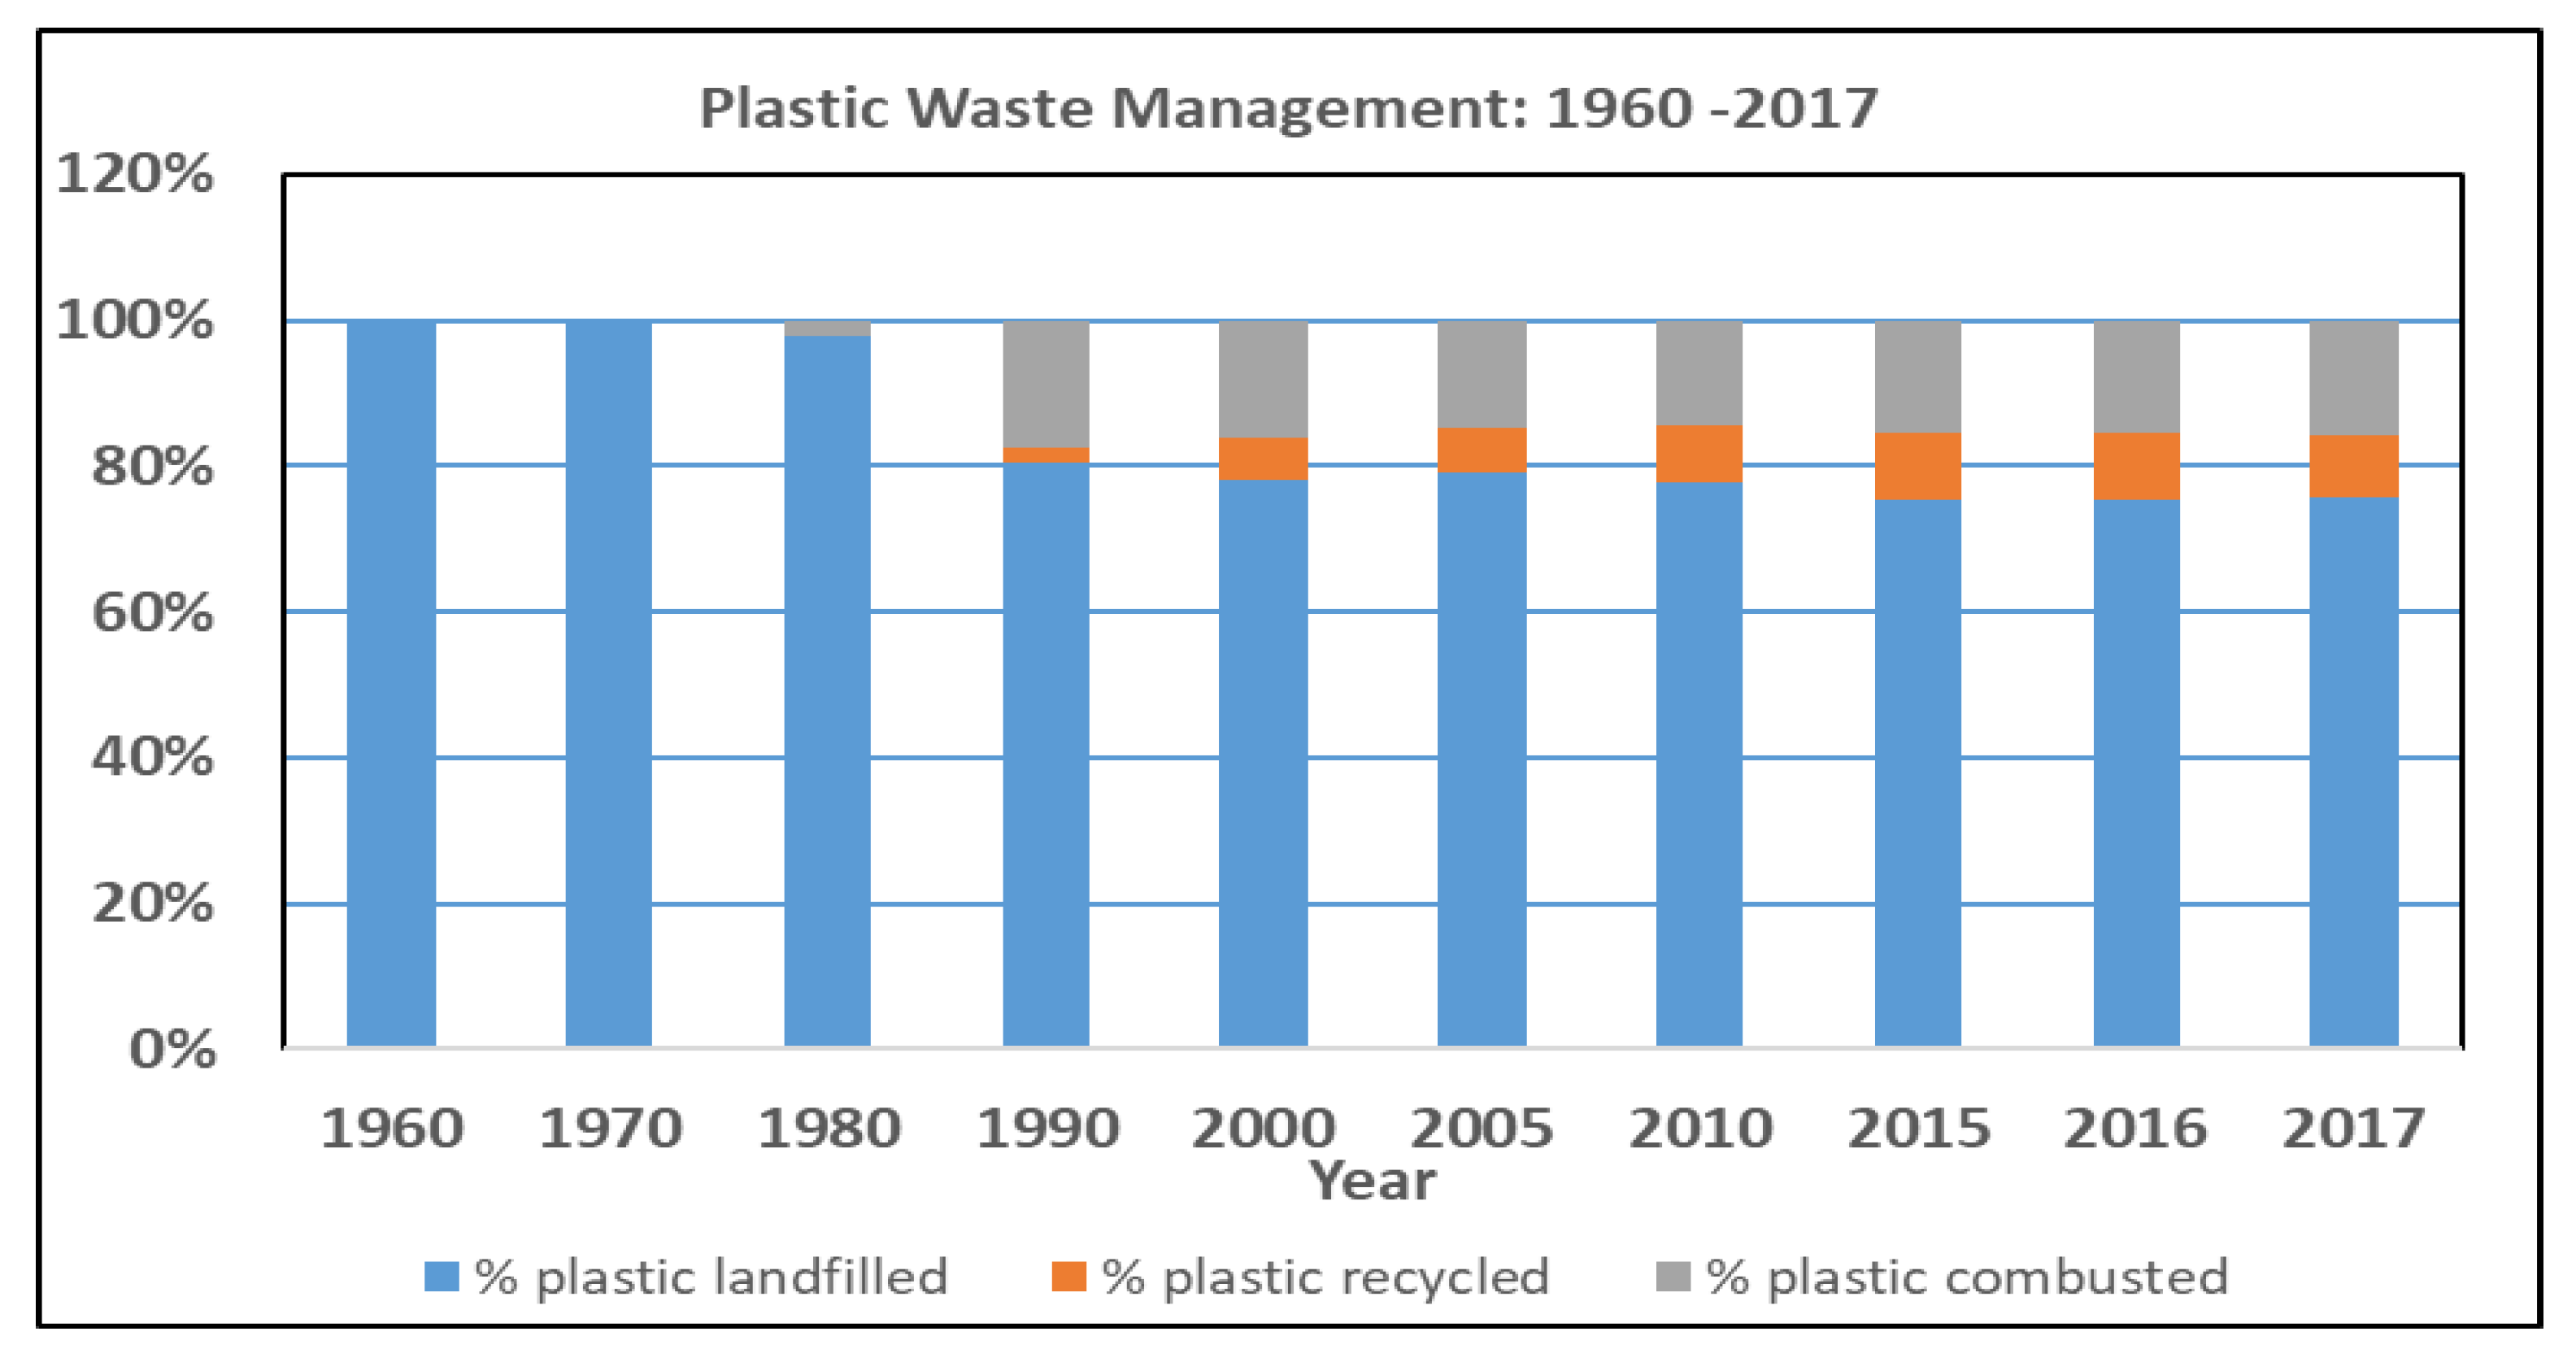
The authors also argue that, as any plastic in these countries that does not undergo recycling and incineration is put in closed landfills, no plastic waste can be classified as mismanaged. Figure 6 and Figure 7 also show lower plastic leakages for high income countries [33] but on the other hand Figure 8 shows that the United States of America (USA) landfilled 75.8% (24,330,695 metric tonnes) of its plastic waste from municipal solid waste, incinerated 15.8% (5,071,163 metric tonnes) for energy recovery, and only recycled 8.4% (2,685,267 metric tonnes) [34].
Therefore, the suggestion that high income countries are outperforming low income countries may not be an accurate narrative, because storing plastic waste in a landfill where it will degrade and eventually generate microplastics or even leach out potentially harmful chemicals, which can contaminate the soil and water [12], is merely delaying a problem and not solving it. Morin et al. [35] reported that plastic waste contributes the highest load of Bisphenol-A (BPA) in landfill leachate. In addition, plastic bags, which are light weight and balloon shaped, including Styrofoam, can also be blown away by the wind from landfills onto land or oceans [12].
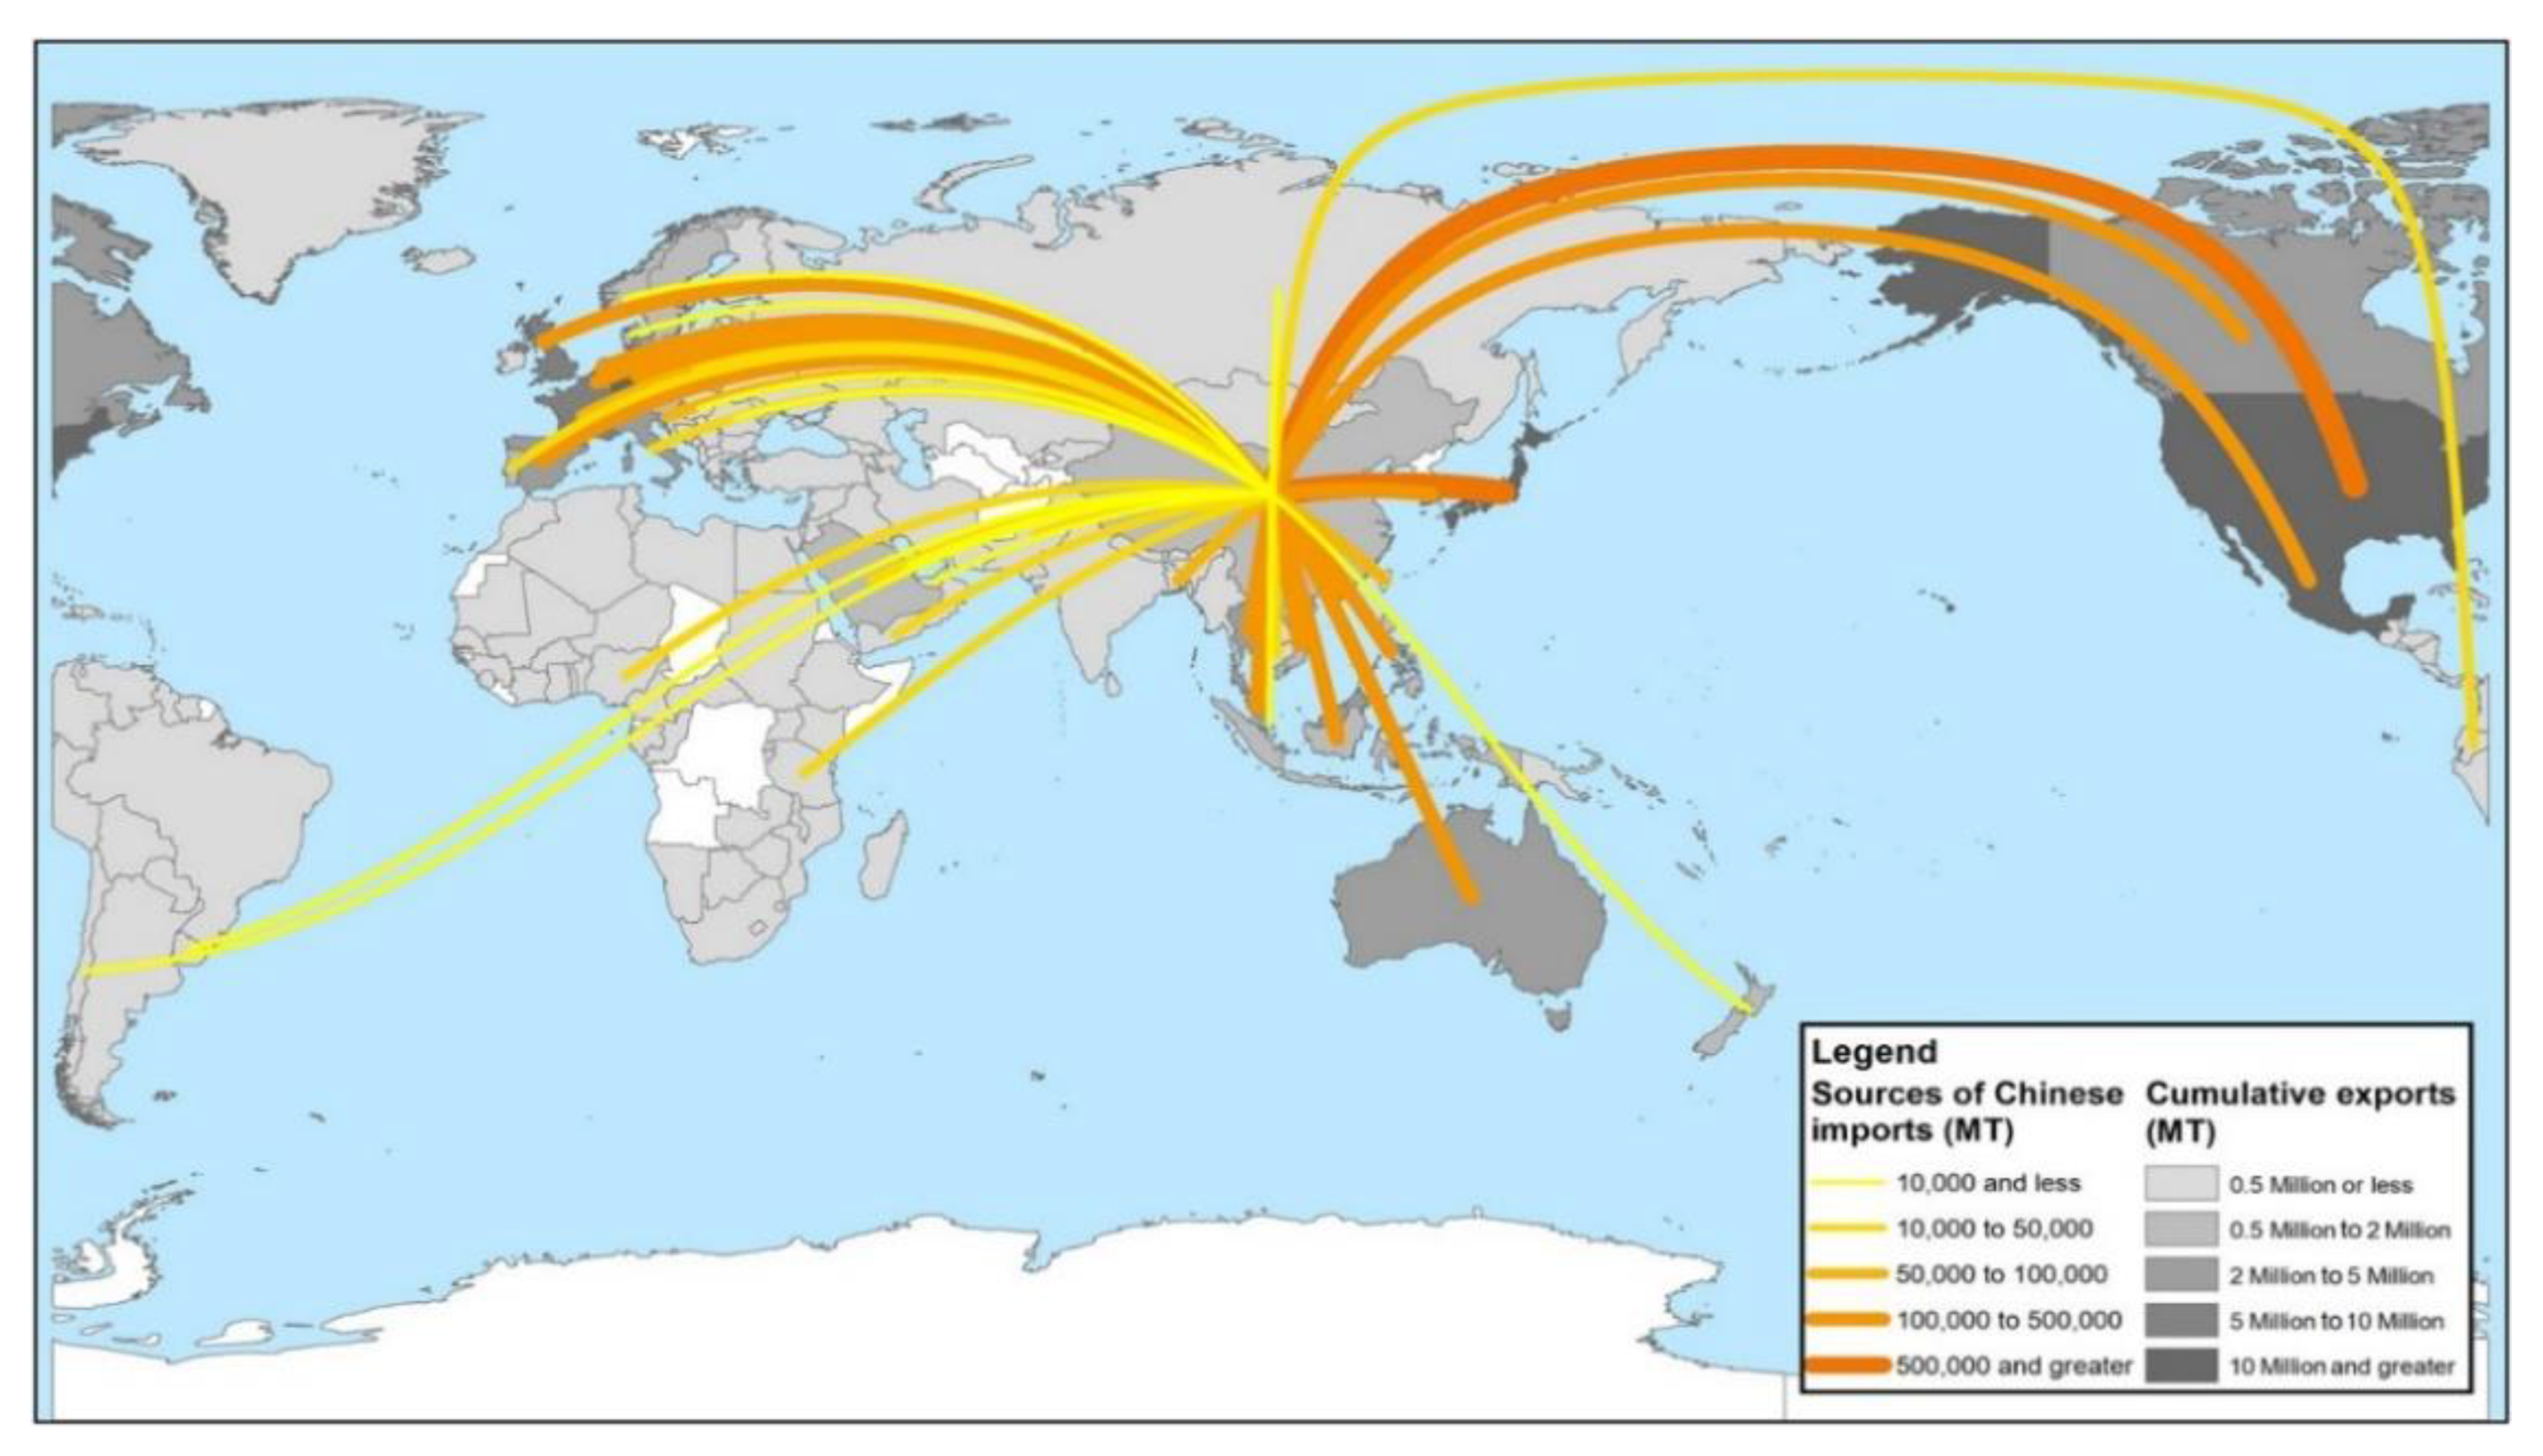
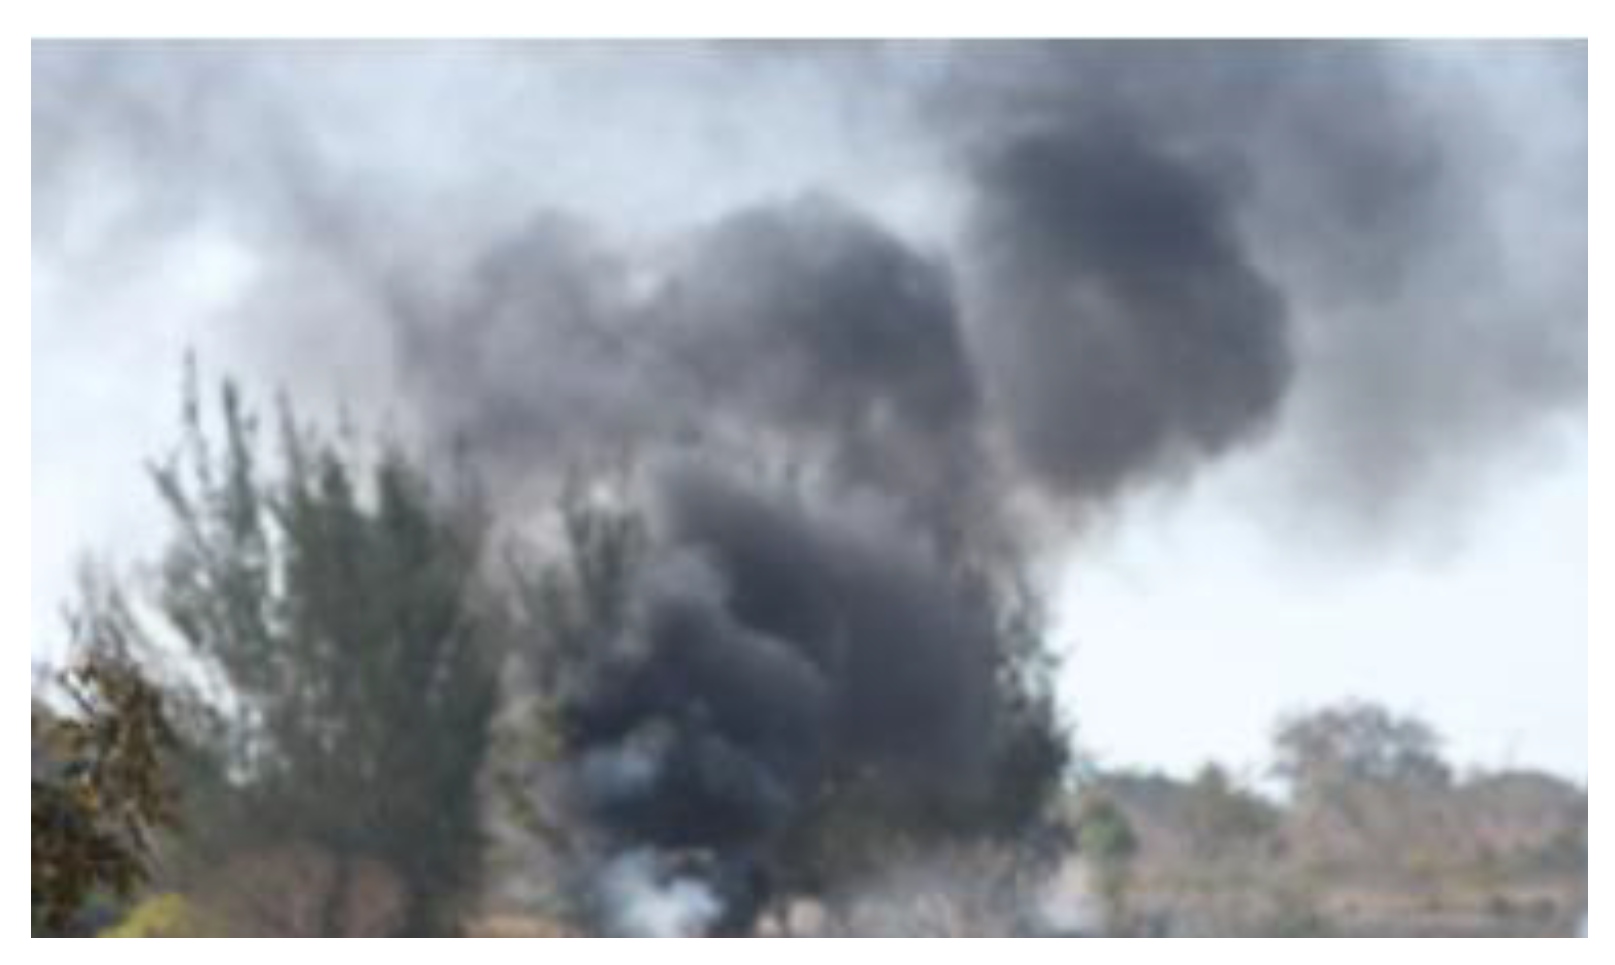
Furthermore, high-income countries were also shipping off their plastic waste into Asia, specifically China, for over 20 years [36], prior to China’s National Sword Policy implemented in 2018, as shown in Figure 9. China has imported 106 million tonnes of plastic waste since 1992, accounting for 45.1% of all cumulative imports, [37] which it repurposed into valuable synthetic products in order to meet the demands of its growing economy [5]. Other smaller Asian countries did not have as much capacity to handle such waste imports, which inevitably resulted in plastic waste mismanagement [5,38]. Therefore, the exporting of waste by countries may have also given an illusion that minimal leakage of plastic from high income countries is a consequence of effective waste management policies. According to the 5 Gyres institute, shipping of waste to developing countries is done because of the low prices of oil and lack of profitable markets for recycled plastics, making it more attractive to produce virgin plastics in developed countries. Hence, plastic waste is sent to developing countries, most of which do not have the recycling infrastructure to handle this waste, thus leading to its mismanagement [39]. A good example is the recent report by BBC, where waste from the United Kingdom was found illegally dumped and burnt on the roadside in Turkey [40].
The passing of the Sword Policy left many nations scrambling to deal with trash in their own backyards [41]. The 2019 amendment to the Basel Convention on the Control of Transboundary Movements of Hazardous Wastes and their Disposal to include contaminated plastic wastes will also make it more difficult for developed nations to export plastic waste to less developed ones, as this will require Prior Informed Consent (PIC) from the receiving country [42]. This legally binding framework will ensure that countries are held accountable for their own waste and will come into effect in January 2021.
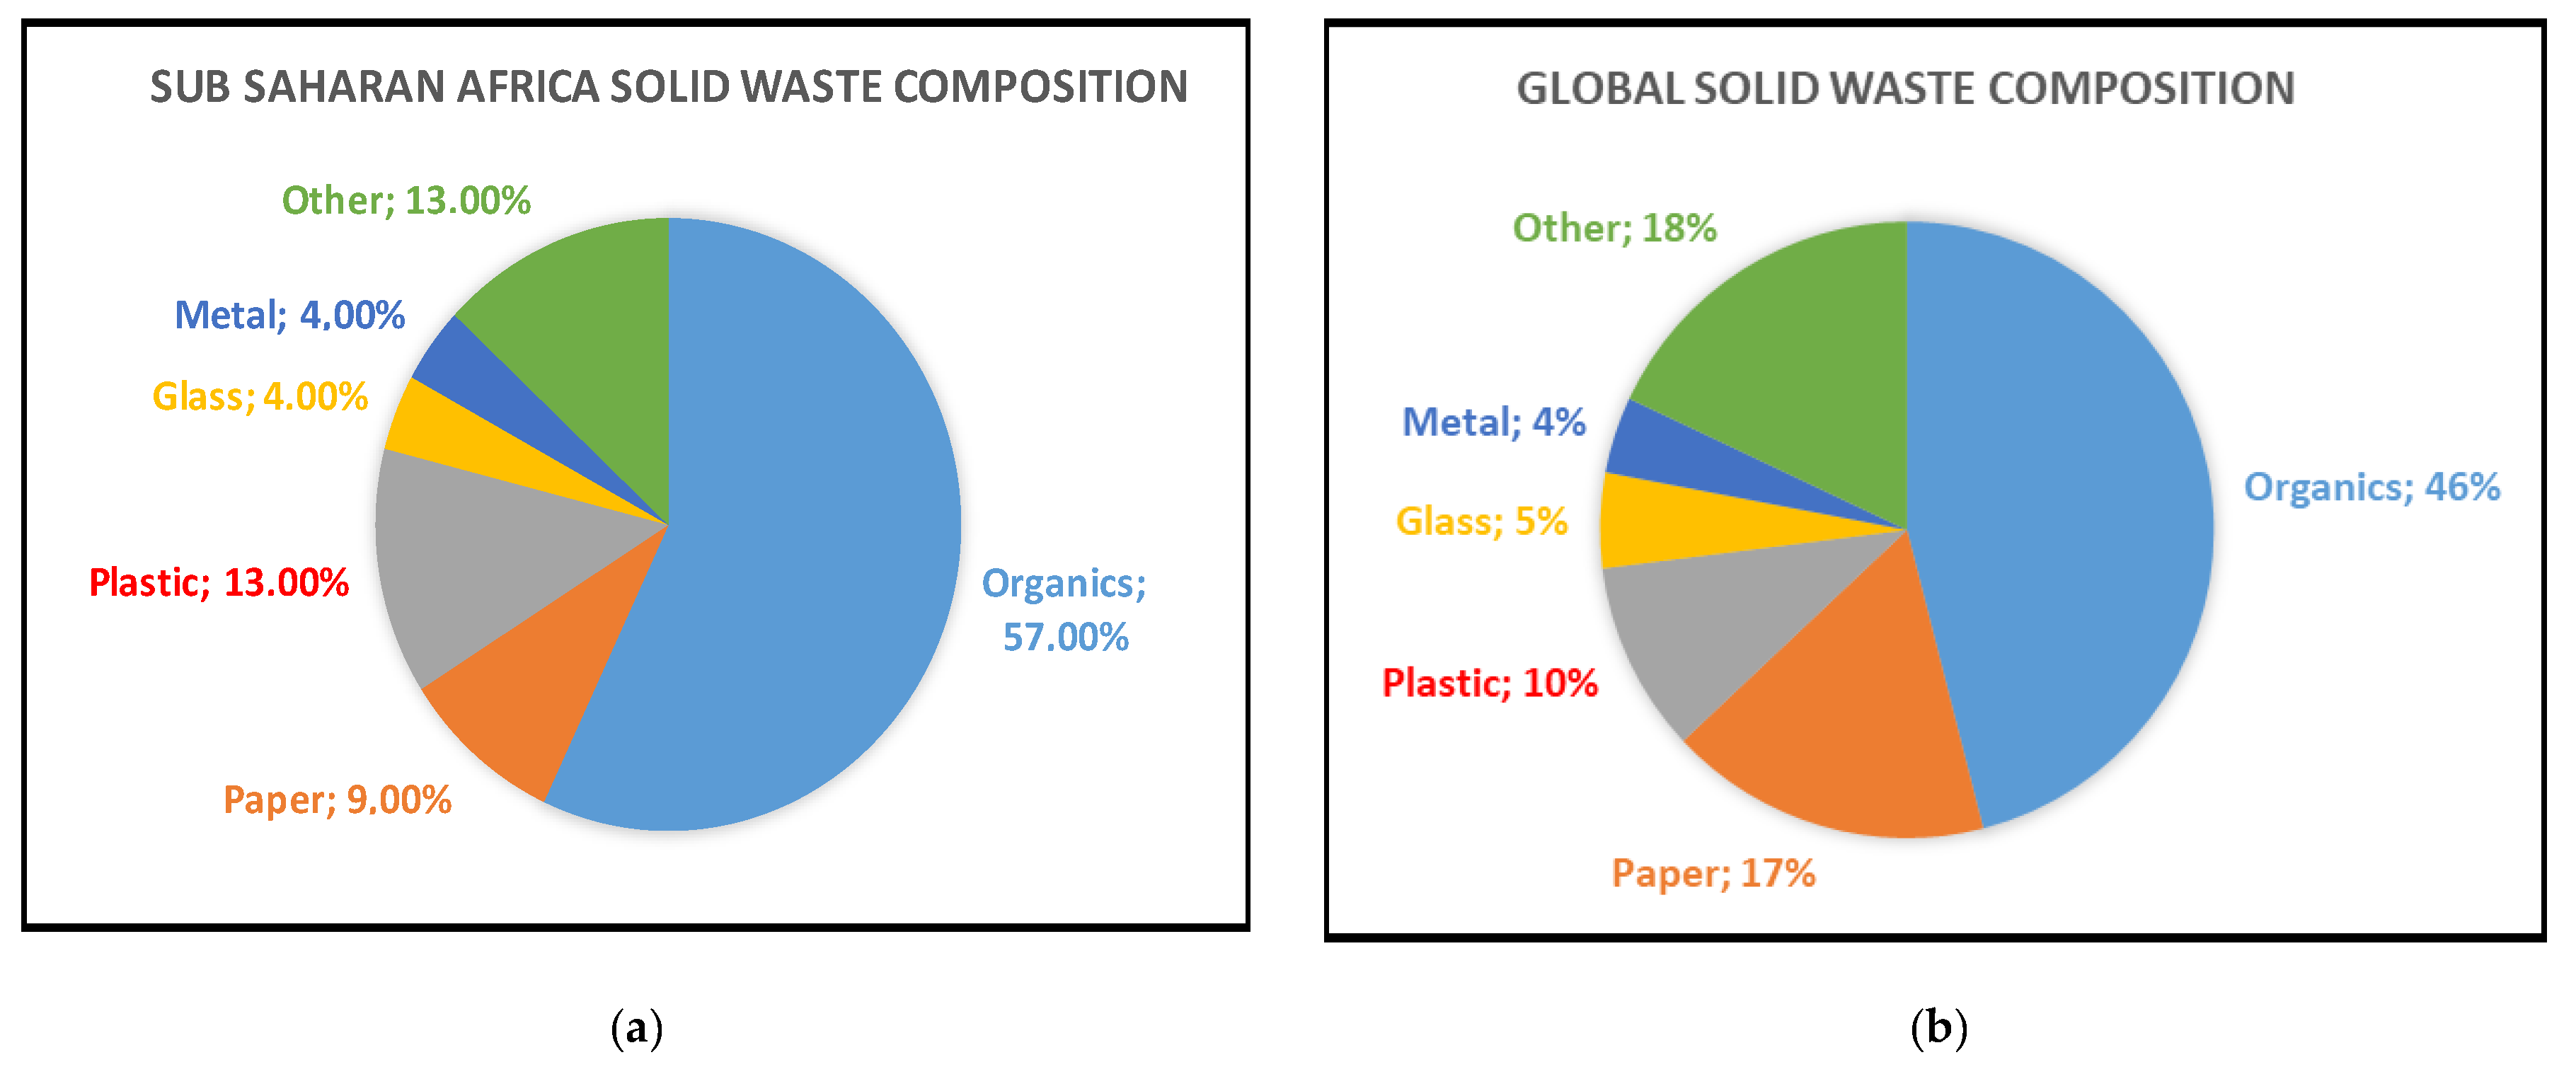
In Sub-Saharan Africa and globally, plastic waste in Municipal Solid Waste (MSW) accounts for about 13% and 10%, respectively [43], as shown in Figure 10.
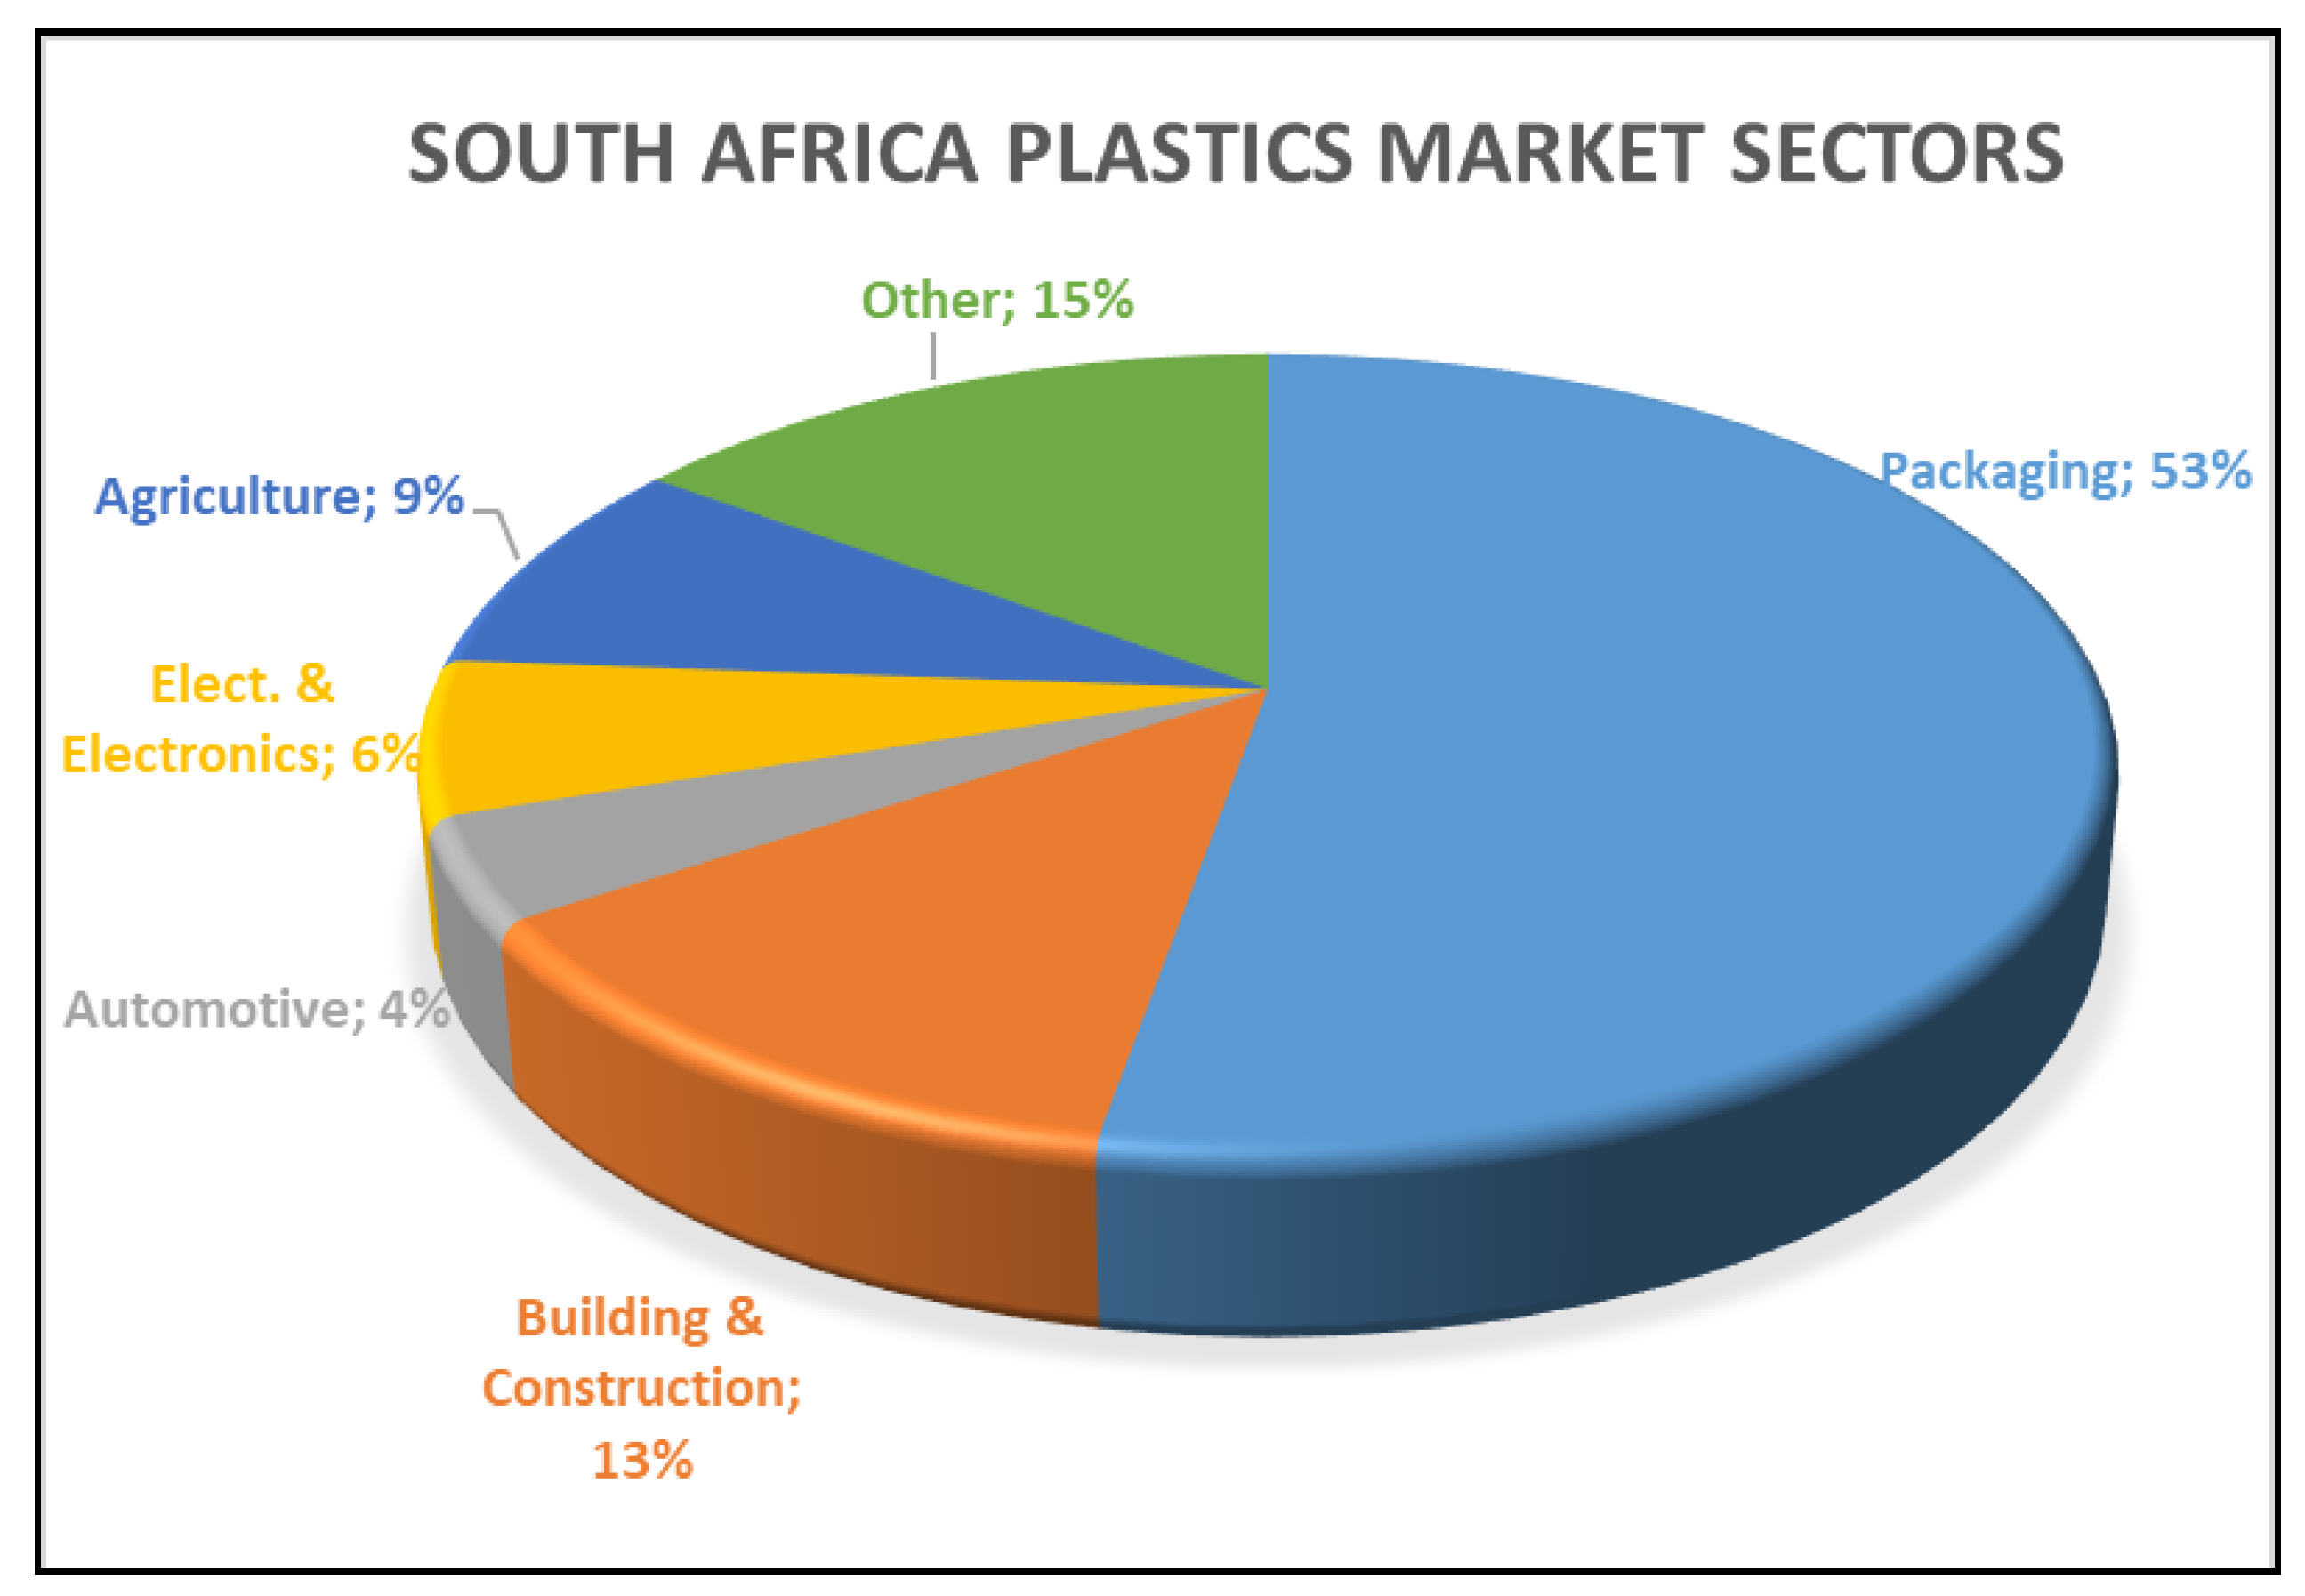
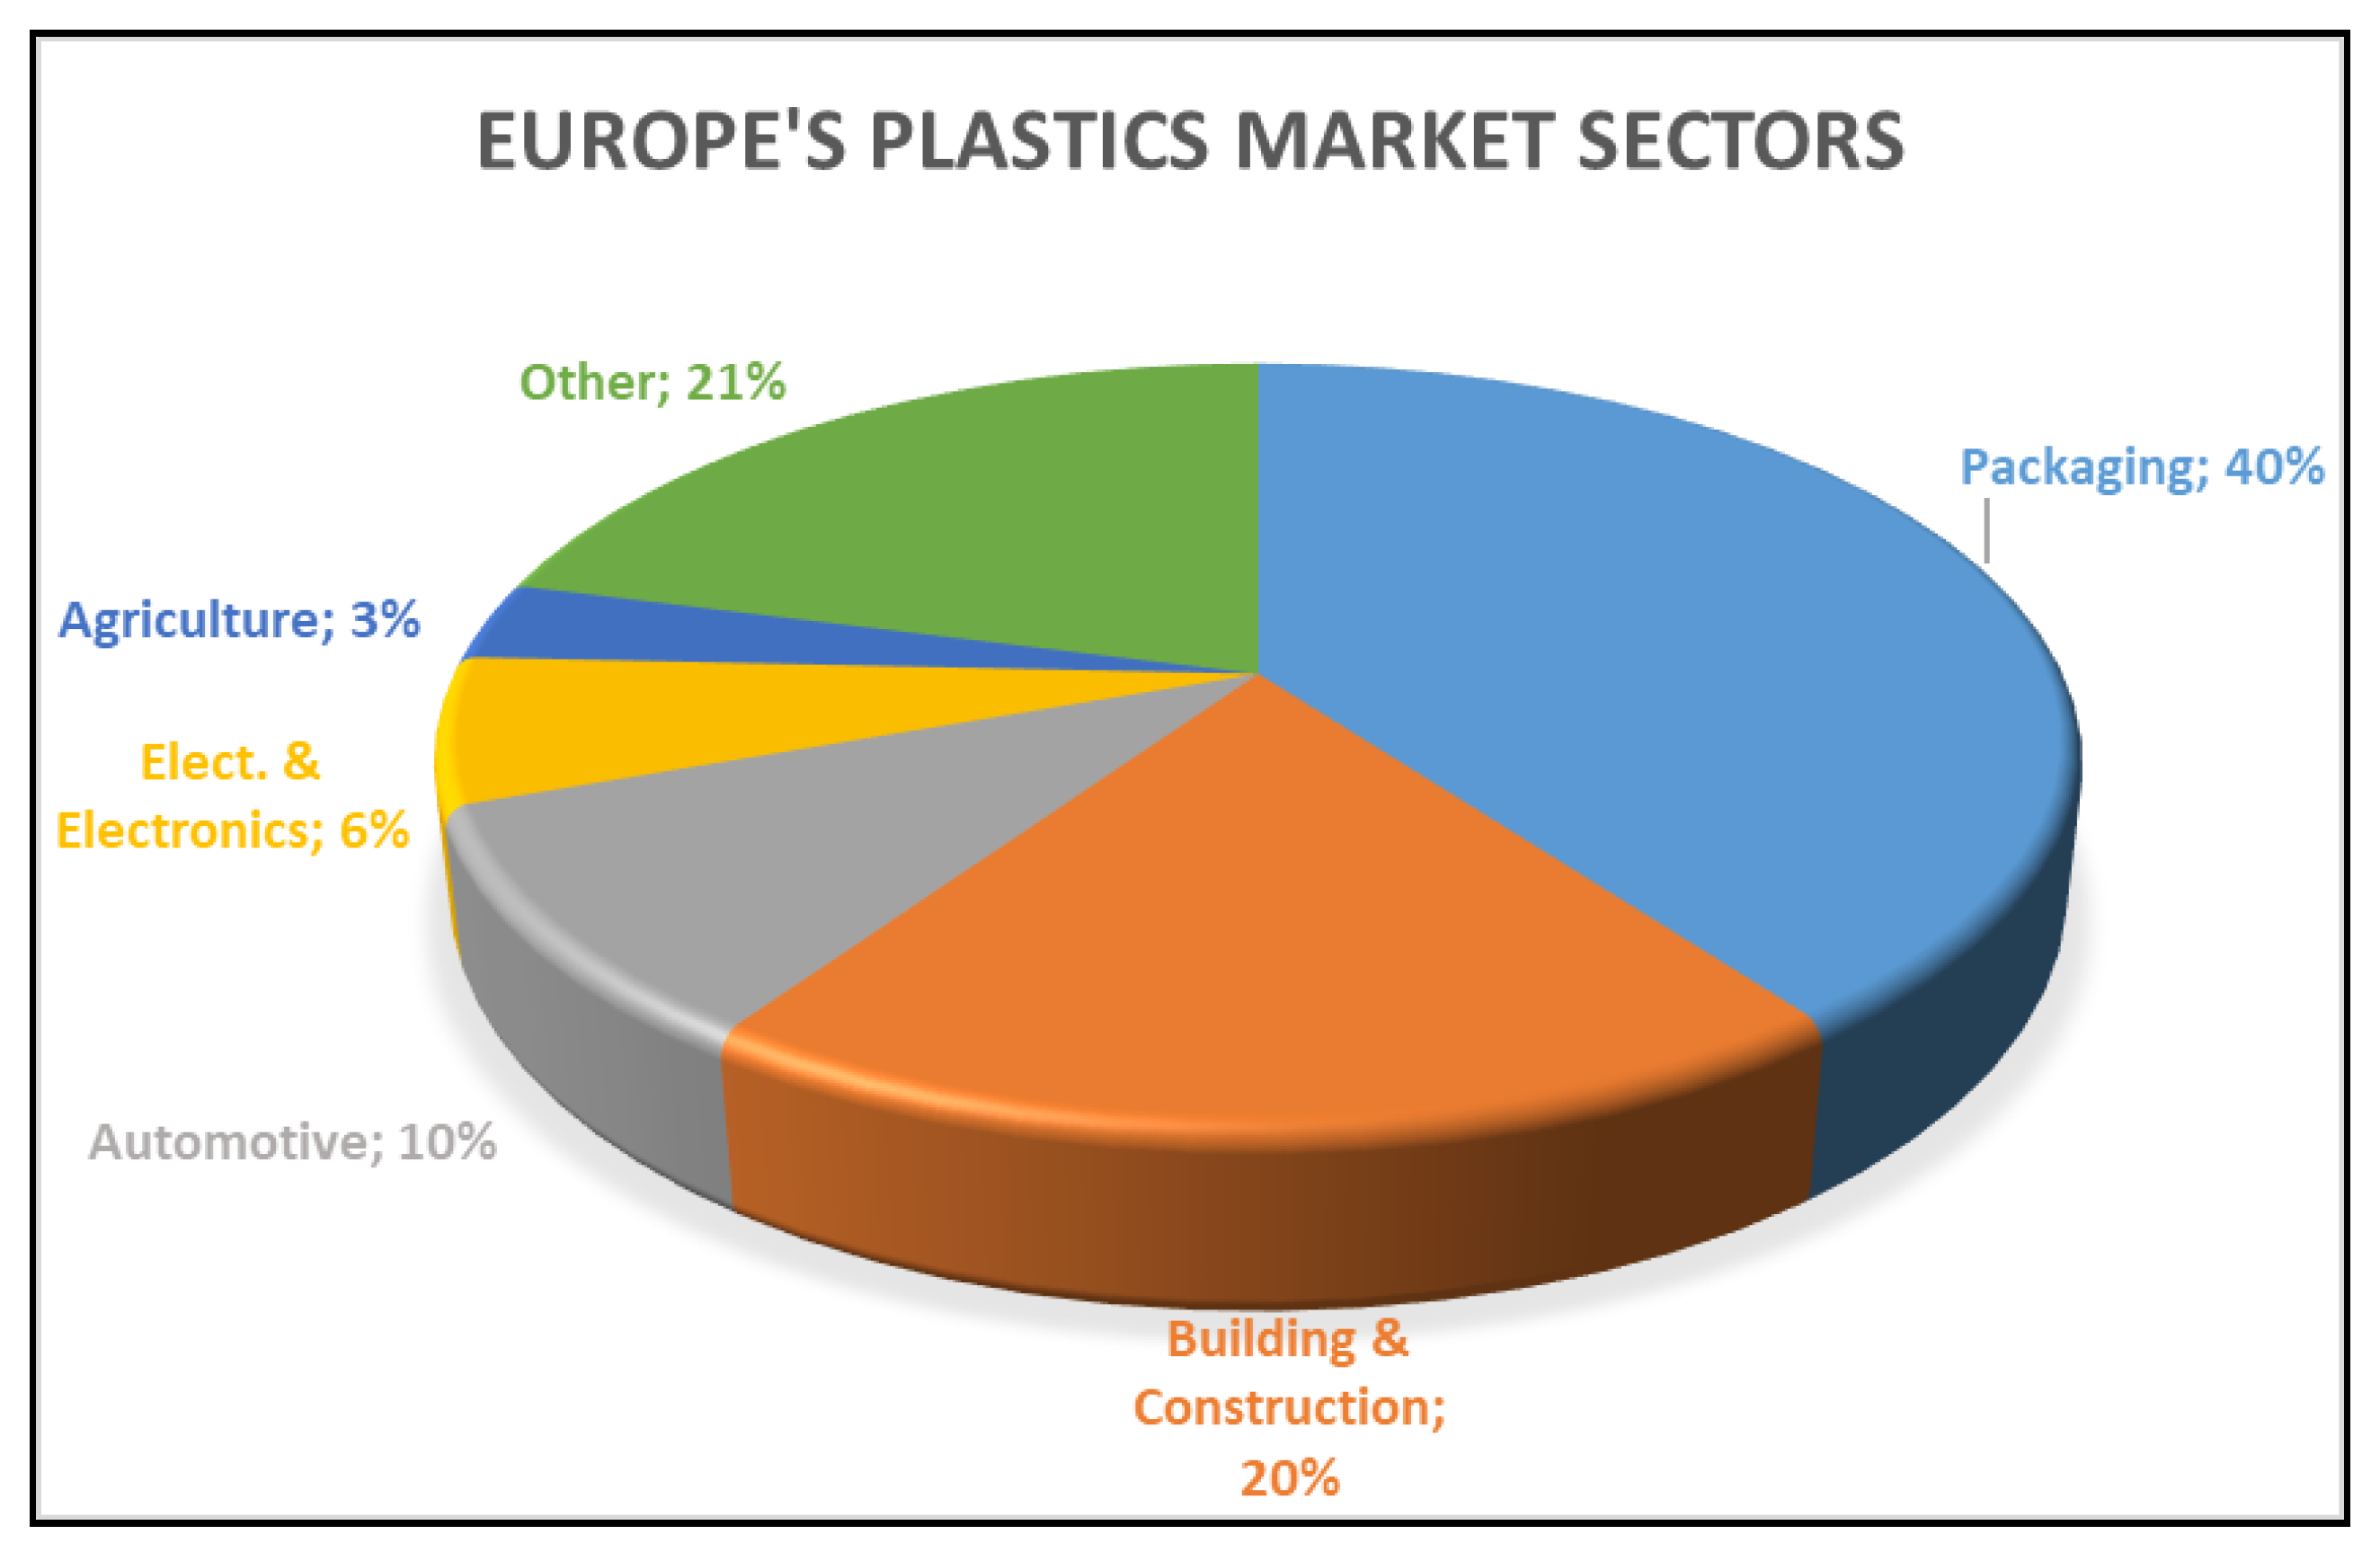
In South Africa, the largest share of plastic is channeled towards packaging [44], as evident in Figure 11. This is not only unique to South Africa, but Europe as well (Figure 12) [44], with South Africa utilizing 53%, compared to 39.9% for Europe in 2015.
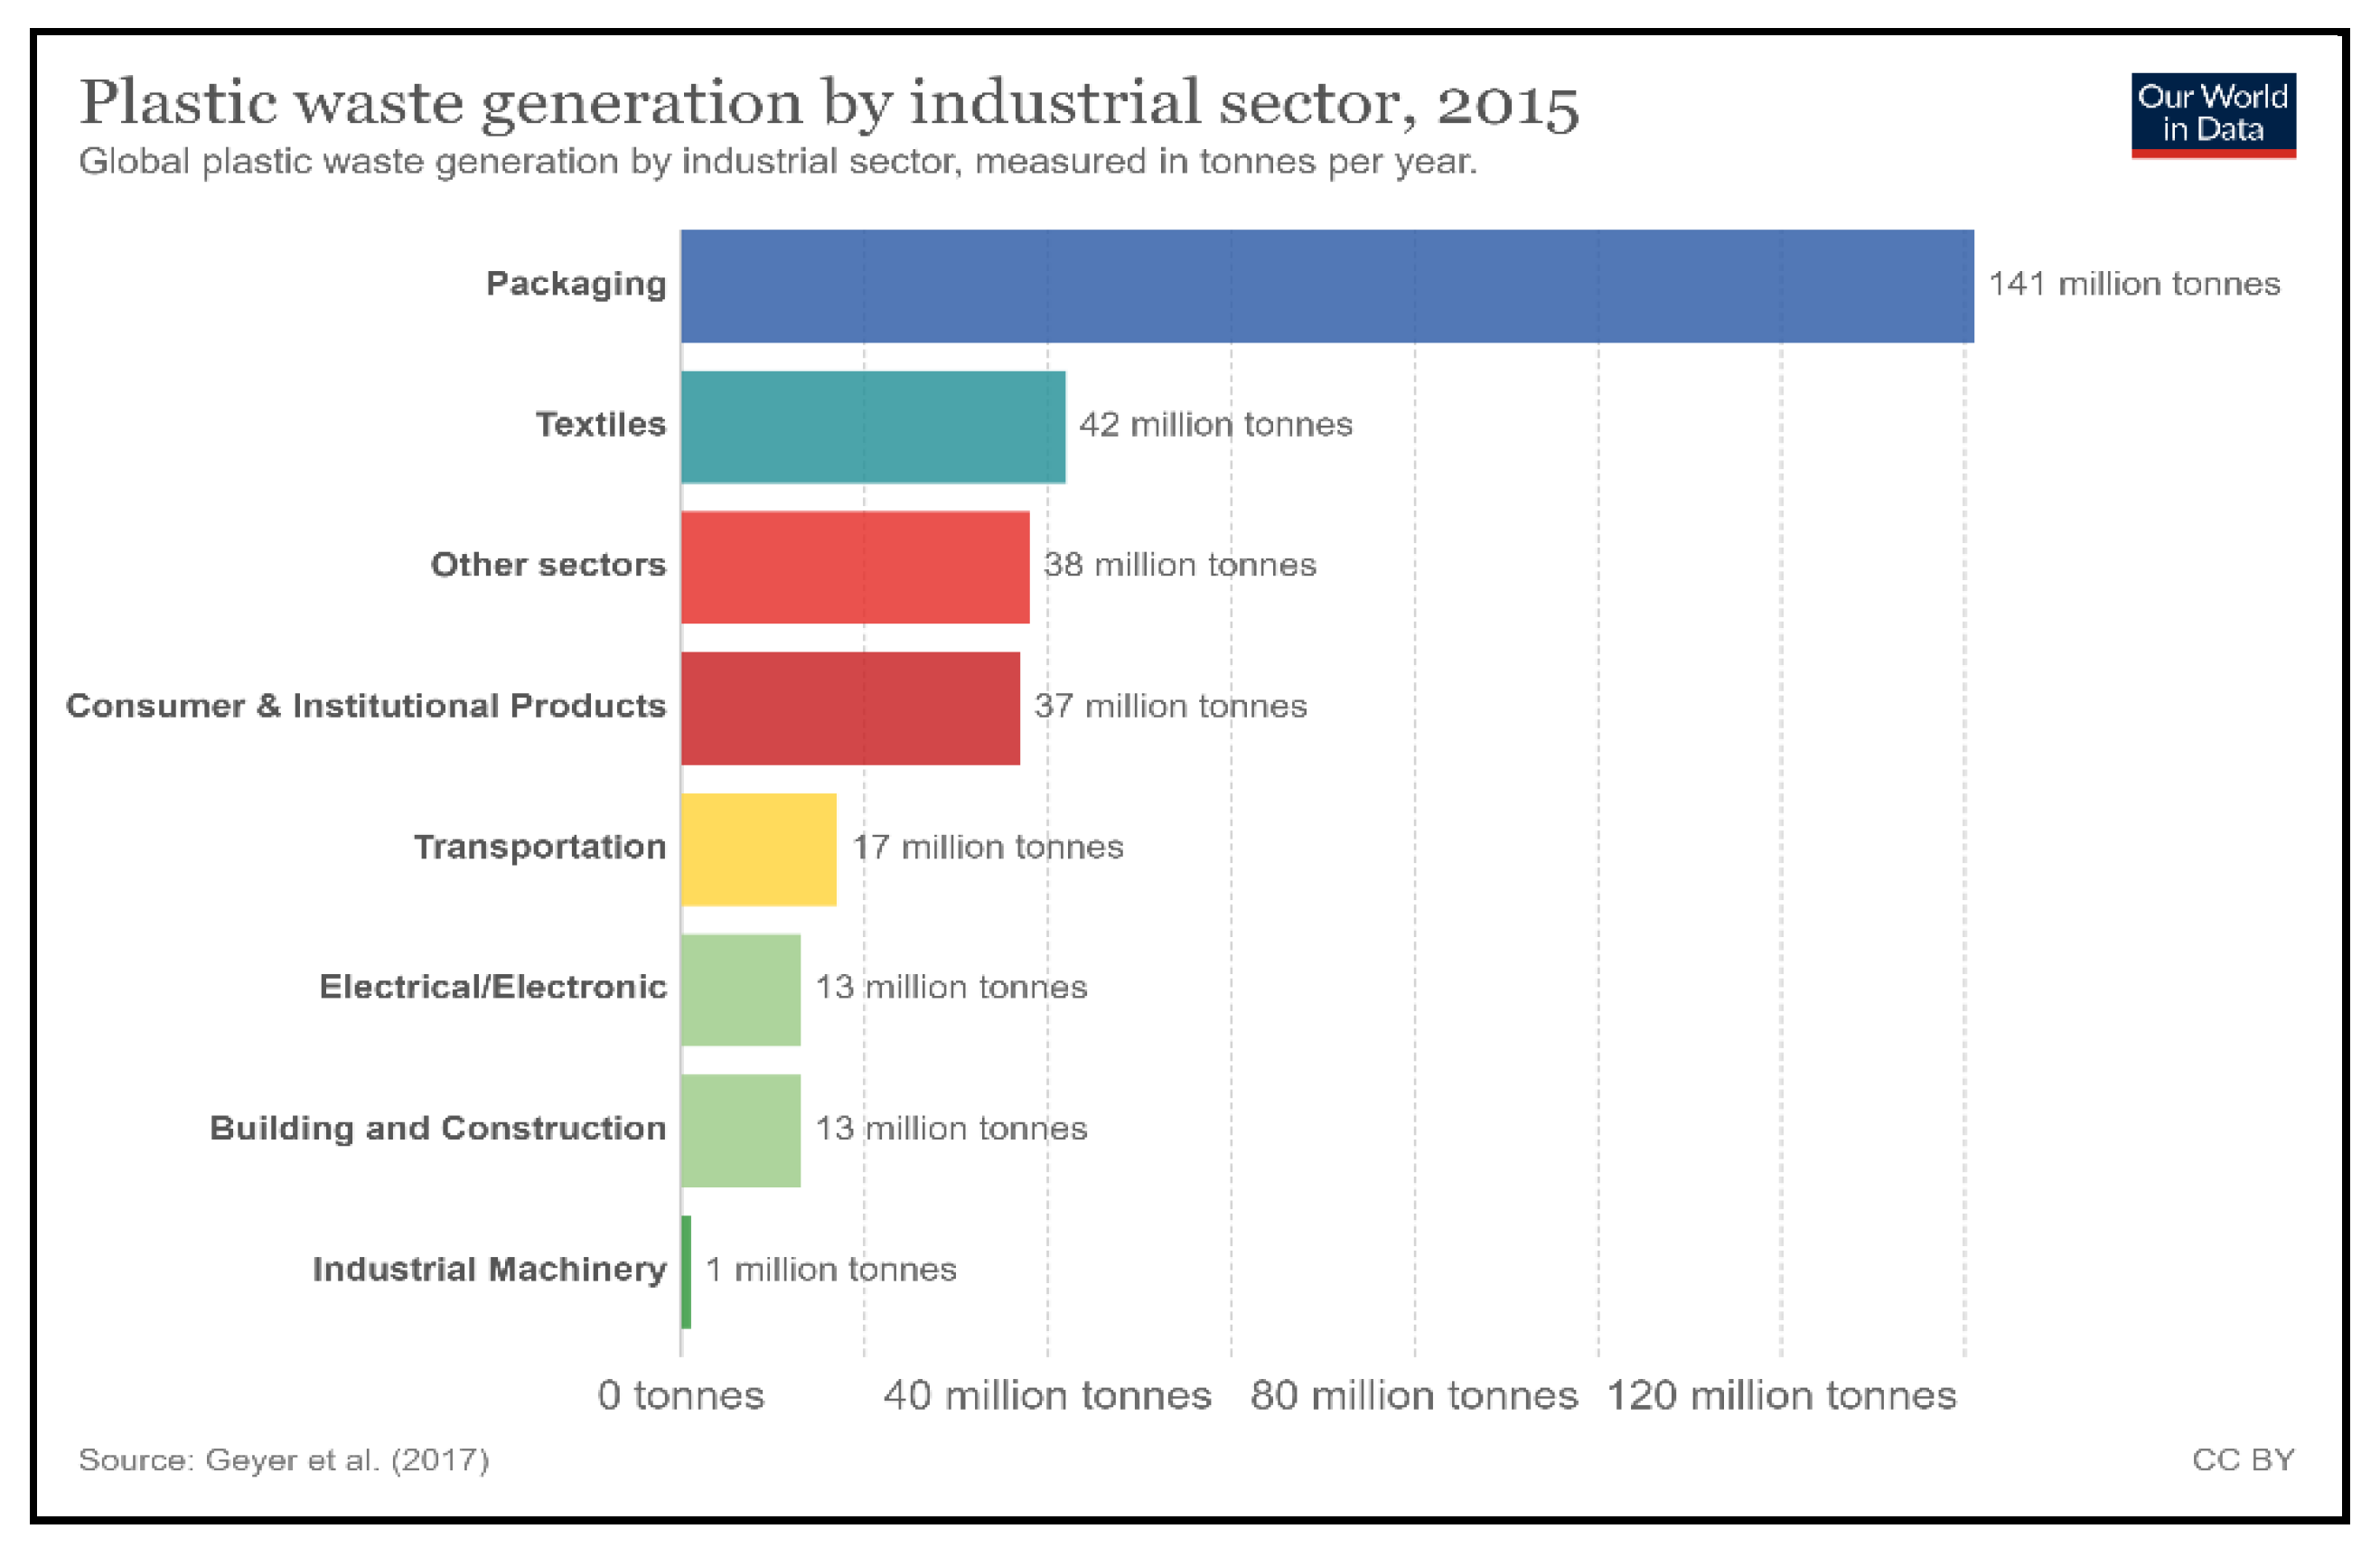
Globally, the outlook on plastic waste generated in 2015 is also consistent with the plastic packaging market share, with packaging contributing the most waste: 141 million tonnes [6] (Figure 13) out of the 146 million tonnes of packaging produced.
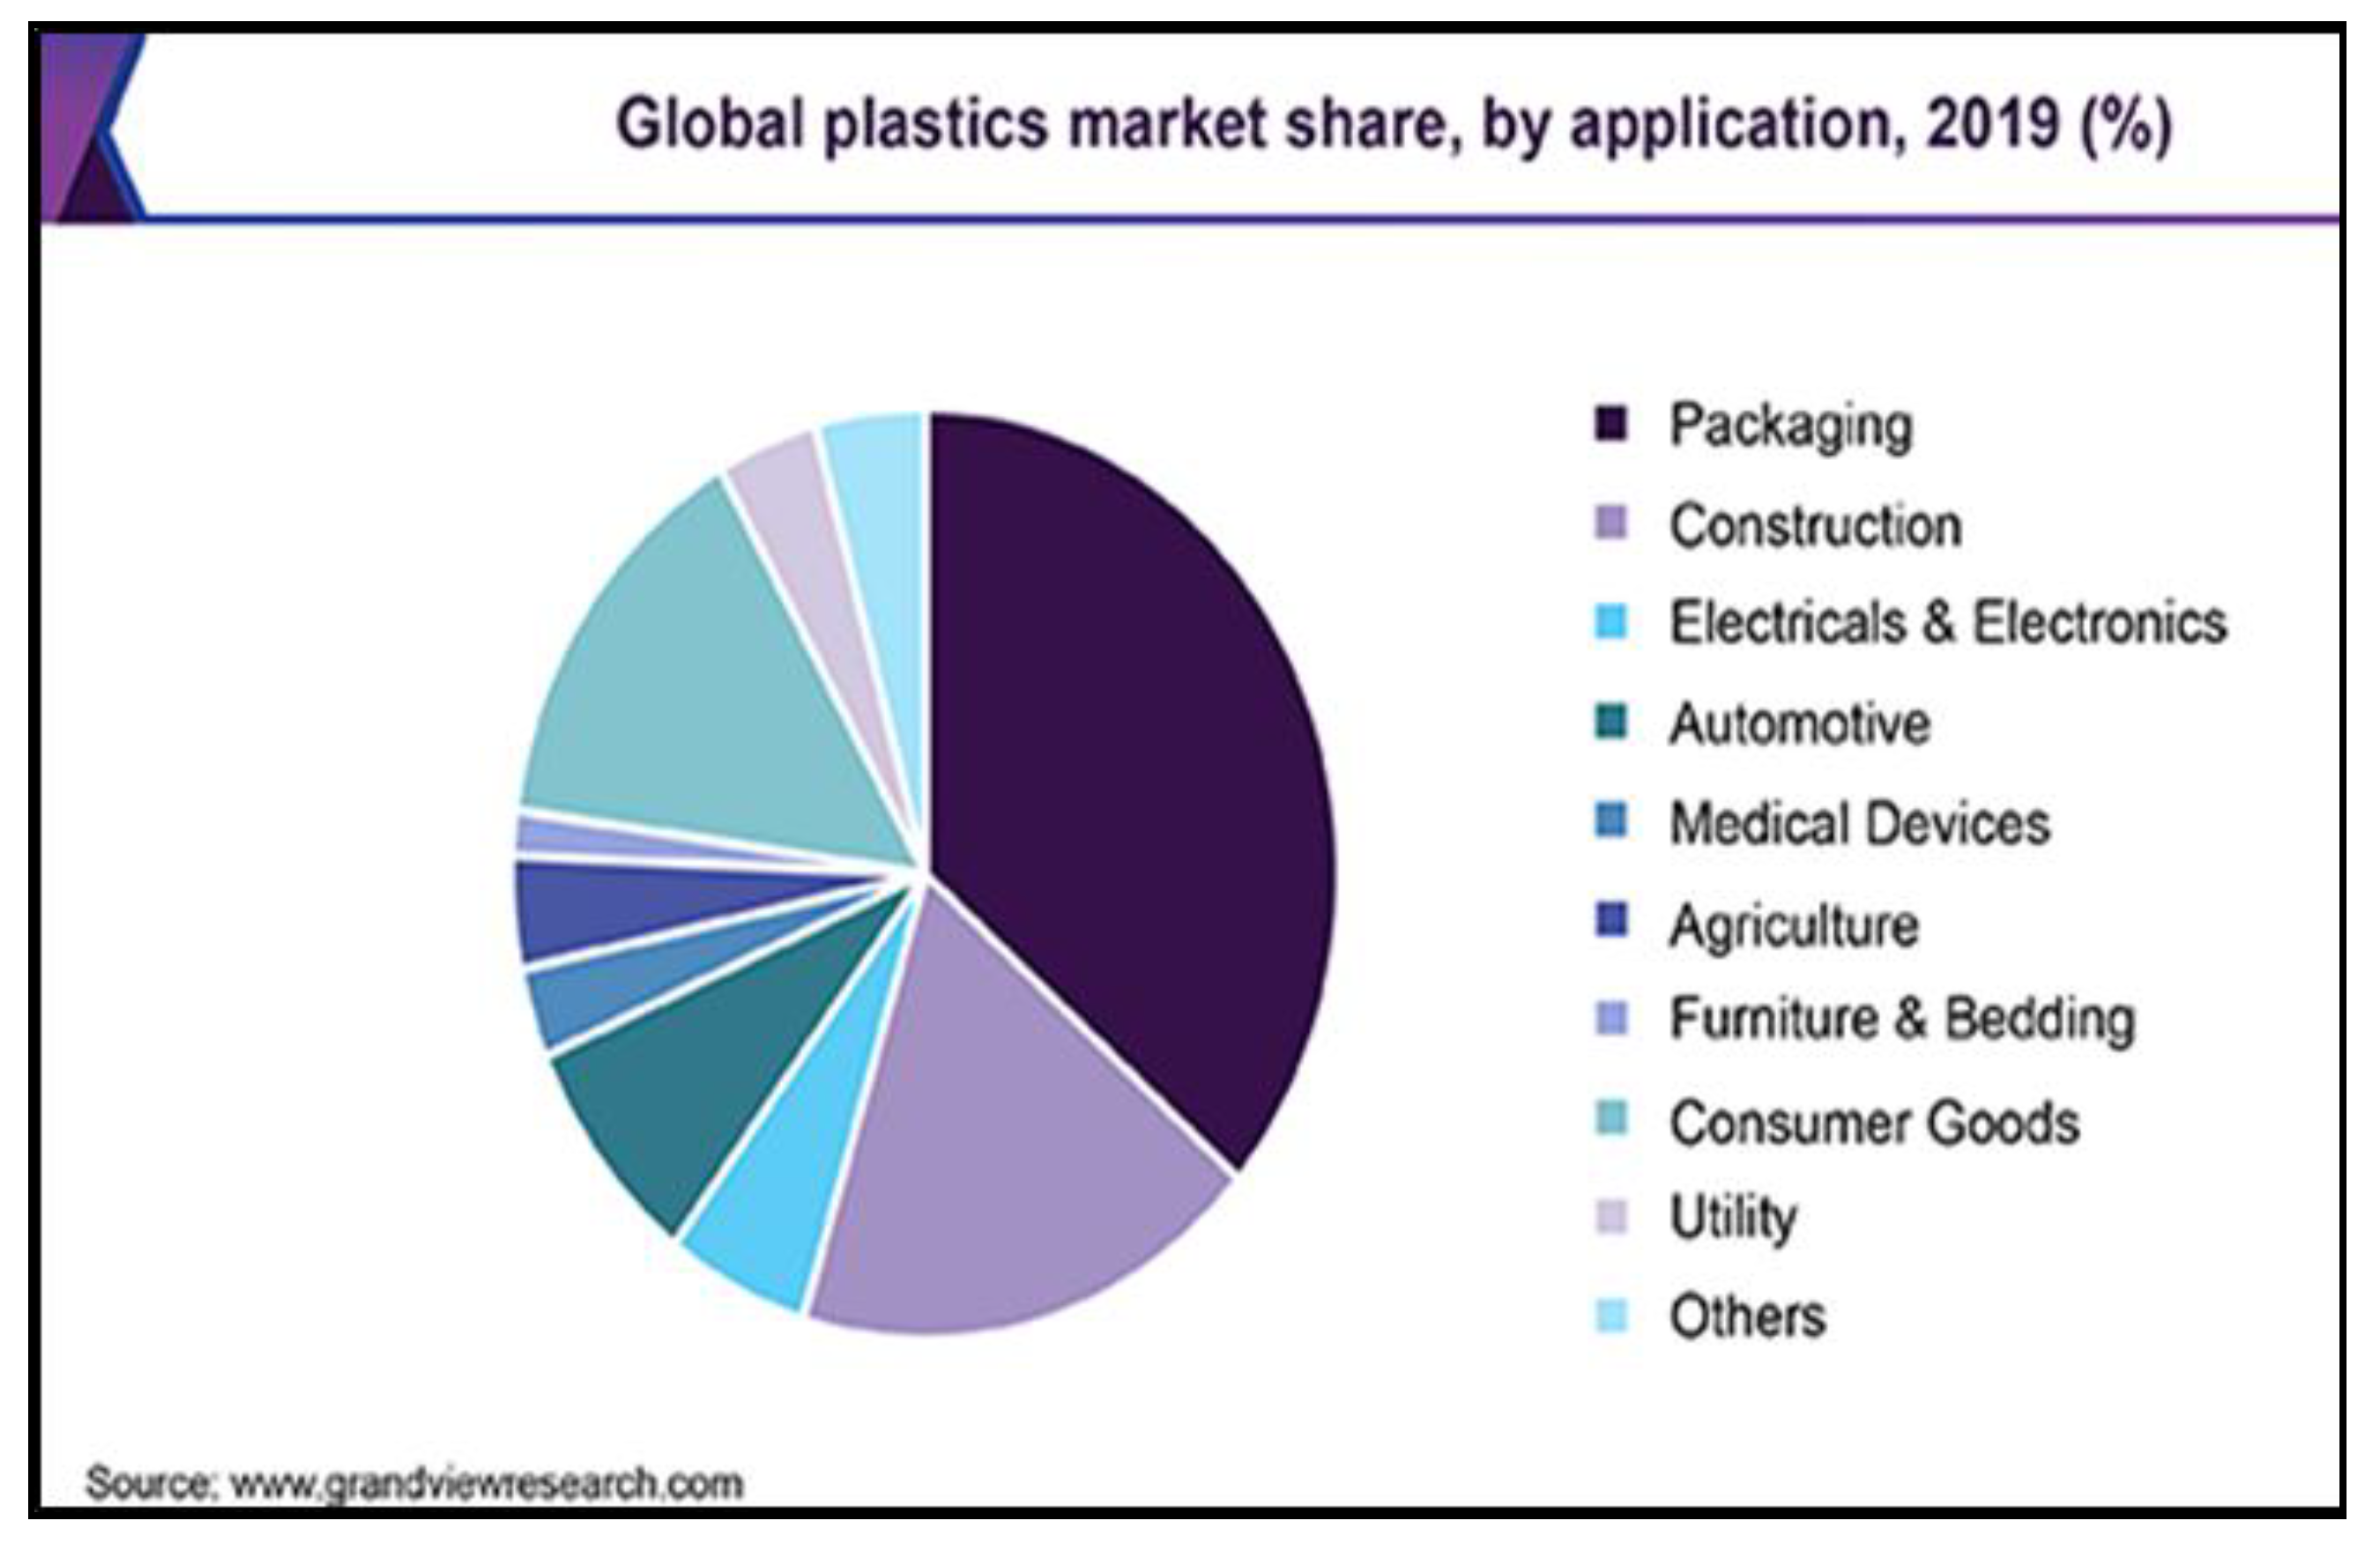
Current global trends for 2019, indicated in Figure 14, also confirm that packaging contributes to the bulk of plastics ever manufactured [45].
Denkstatt [46] attributes the prominence of packaging to its ability to preserve foods by extending their shelf life, thereby preventing food wastage. The author argues that the environmental benefits of packaging outweigh the environmental costs. Plastic packaging such as Styrofoam does present a huge challenge in the management of plastic pollution. Often, it is contaminated with organic material after short-term use, making its recycling unfeasible and uneconomical [12]. This results in huge volumes of plastic packaging ending up in landfills or indiscriminately dumped, burnt, or buried [10], creating a never-ending vicious cycle of plastic pollution. Approximately US$80–120 billion, which represents 95% of plastic packaging value, is lost to the economy yearly as a result. According to the Ellen MacArthur Foundation [10], as much as 40% of packaging is landfilled, and 32% leaks into the environment [10].

4. Marine Environment

Various interventions have long been proposed by nations to try to prevent plastic waste pollution in the marine environment. In 1972, the OSLO Dumping Convention [47] and the London Convention [48] were drafted. This was followed by the MARPOL [49], Paris [50], and Barcelona Conventions [51] in 1973, 1974, and 1976, respectively. Almost 50 years later, more conventions, together with commitments and declarations, have been drafted, as well as amendments made to older conventions. This is commendable and an indication that the world is well aware of the need to contain plastic waste.
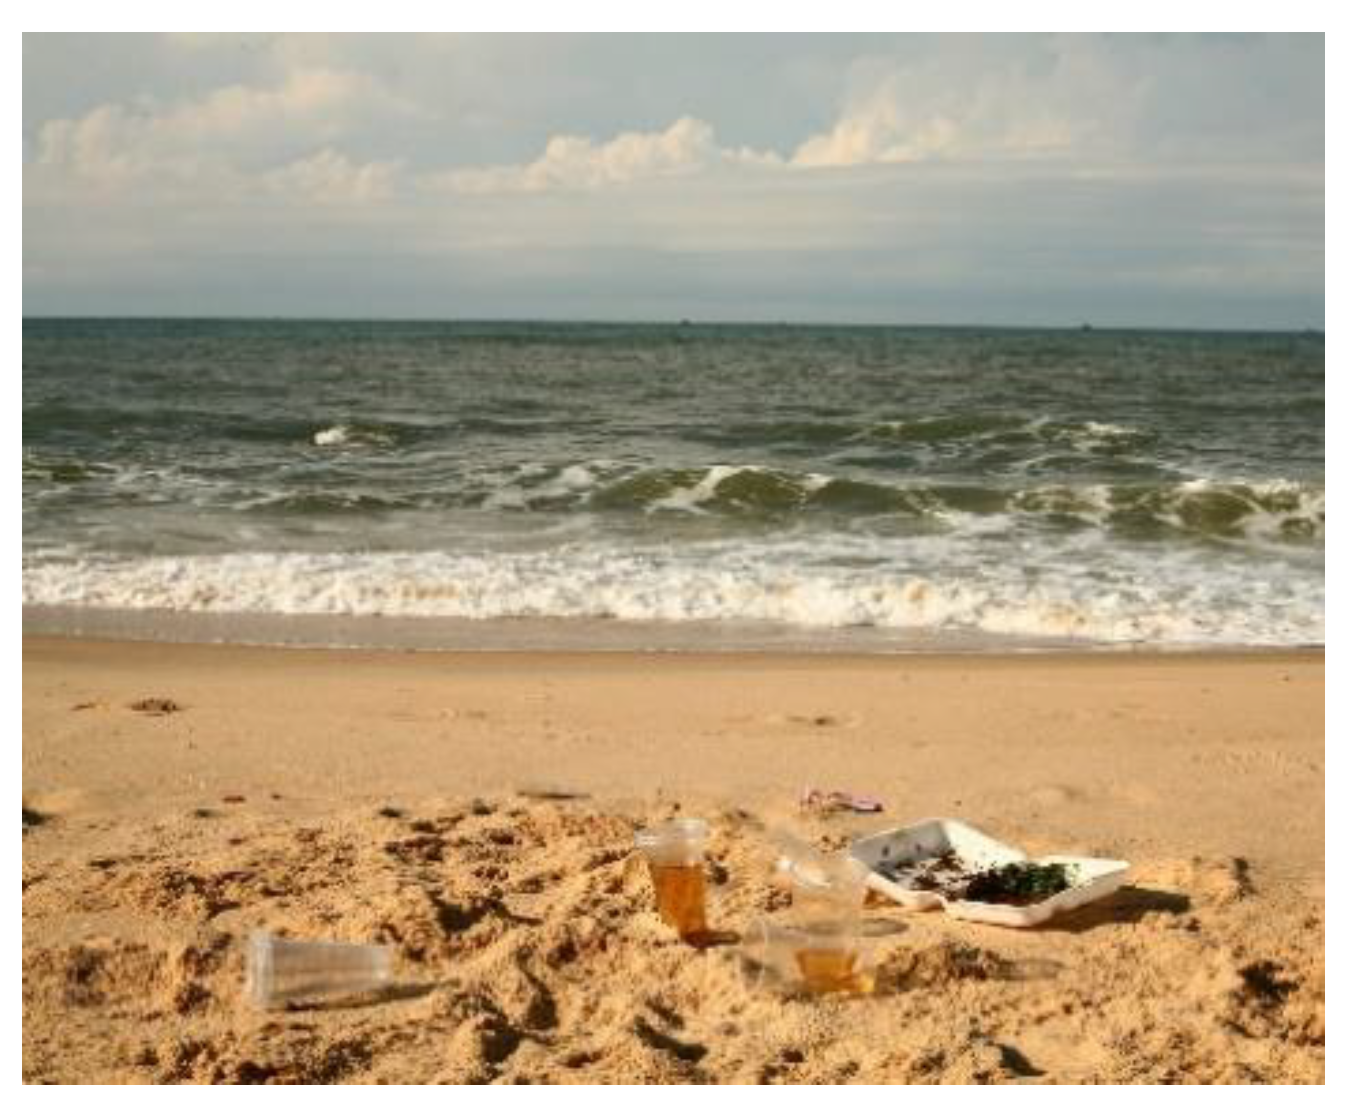
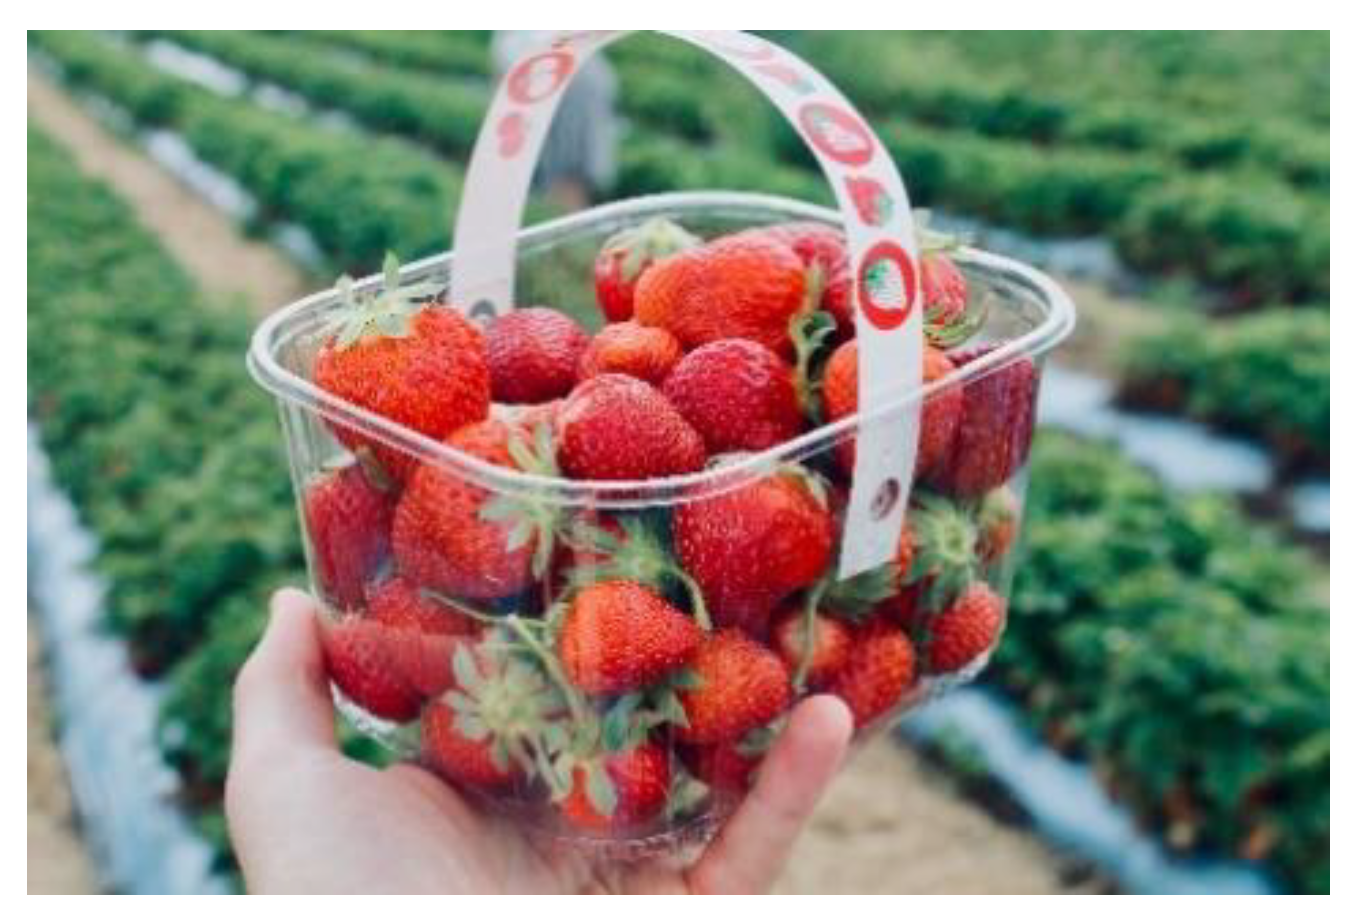
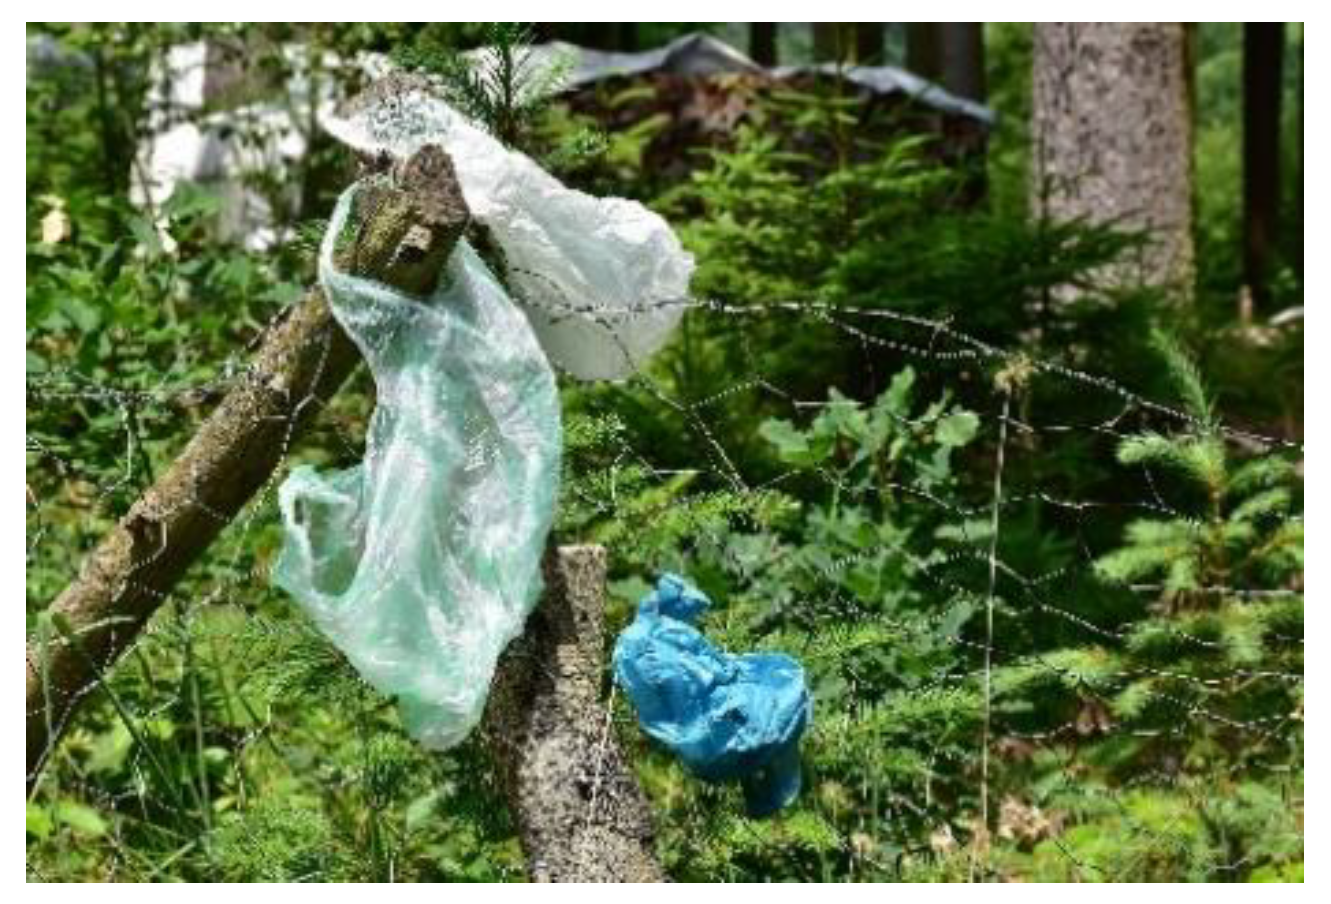
There has however been concern about the continued leakage of single use plastics such as straws, cotton bud sticks, lollipop sticks and wrappers, beverage bottles and lids, cigarette butts, disposable cutlery, food packaging, and wrappers [52,53,54], as well as condiment packages and milk carton seals, as shown in Figure 15, Figure 16, Figure 17, Figure 18, Figure 19, Figure 20, Figure 21, Figure 22, Figure 23, Figure 24, Figure 25, Figure 26 and Figure 27 [53]. Five patches of garbage, formed from rotating currents referred to as gyres, have been identified in the North and South Pacific, the North and South Atlantic, and the Indian Ocean. These patches contain both microplastics and macroplastics, and the largest is commonly referred to as the Great Pacific Garbage Patch, in the Pacific Ocean [55]. Marine sources such as fishing ropes, lines, and nets also account for 28% of that plastic waste and make up 50% of the waste in the Great Pacific Garbage Patch (GPGP) [55]. In 2016, it was estimated that there were 17,760 pieces of plastic per square kilometer floating in the ocean [20].
Overall, 8 million tonnes of plastic reportedly enters the oceans annually, adding to the 150 million tonnes of plastic already in the marine environment [53]. UNEP [26], however, gives a figure of 10 to 20 million tonnes of plastic entering the oceans every year [26]. At this rate, the United Nations’ Sustainable Development Goal (SDG) 14 target to prevent and reduce marine pollution by 2025 may not be met. Furthermore, oceans must be protected, because they absorb 30% of the carbon dioxide produced by humans, thereby mitigating the global warming effects [56]. It is reported that plankton in the oceans are crucial in absorbing carbon dioxide from the atmosphere and water and sequestering it deep under the ocean. However, their survival is also being threatened by microplastics [57]. Cole et al. [57] studied the effect of microplastic ingestion on copepods, belonging to the class of zooplanktons, and found that microplastics decreased the ingestion rate of carbon by these organisms. Furthermore, when exposed to microplastics for a long period, copepods release smaller eggs, which have a lower successful hatching rate (increased mortality). The authors therefore concluded that microplastics in marine environments affect copepod feeding even at concentrations as low as 75 microplastics mL−1 [57]. Although the extent of impacts is currently under investigation [57], such evidence cannot be ignored. In addition, oceans also provide a means for survival to more than three billion people [56].

Alternatives to Conventional or Single Use Plastics

Judging by the top 10 materials commonly littered worldwide [53], it suffices to say that single use plastics have propagated a “throw-away culture”. Solutions are required to ensure that this problem does not continue unabated. Materials such as paper, biodegradable polymers, reusable plastic, raffia (made from raffia palm tree), cotton [58], steel, and glass [59] are some alternatives that have been studied as potential replacements for fossil-based single use plastics, while in other studies, thicker or more durable conventional plastics have been proposed as replacements instead [60]. Harding et al. [61] conducted a life cycle assessment (LCA) by studying the production processes for two conventional plastics: polypropylene (PP) and polyethylene (PE), as well as polyhydroxy-β-butyrate (PHB), a biodegradable polymer. The authors reported that PHB outperformed polypropylene across all the environmental impact categories analyzed. Although PE had lower environmental impacts in the acidification and eutrophication categories than PHB, the biodegradable polymer was more beneficial in all the remaining categories. Harding et al. [61] did not analyze these three plastics from cradle to grave, but argued that, even if this were to be done, PHB would still have the least environmental impact.
On the other hand, Ross et al. [60] conducted life cycle sustainable assessments to determine the most sustainable alternative to single-use plastic bags in South Africa. The authors looked at socio-economic (impact on employment and affordability) and environmental aspects of 16 carrier bags; 12 being single use and four reusable bags. Of the 12 single use bags; one was made of paper, five were HDPE bags of 24 µm thickness with 100%, 75%, 50%, 25% and 0% recycled content, while the 7th bag was made of LDPE with 0% recycled content. The remaining single use bags were made of HDPE but with a bio-additive, composites of poly butyl succinate (PBS) and polybutylene adipate terephthalate (PBAT) and composites of PBAT and starch.
The reusable fossil-based plastics were composed of HDPE with 100% recycled content (70 µm thick), polypropylene with 0% recycled content, and woven and non-woven polyester with 100% and 85% recycled PET, respectively. In their assessment, Ross et al. [60] made the assumption that the single use bags would be used once, while reusable bags would be used 52 times during the year. The authors found that for the South Africa scenario, reusable bags had the most favorable outcomes, with the 70 µm HDPE bag being the best. The authors also however highlighted that the higher the recycled content in a bag and the more the number of times that a bag can be used, including those meant for once-off use, the less its impact on the environment [60]. Therefore, in such a case, single use plastics would be more favorable when compared to reusable plastics, as reusable plastics are made with more material, which leads to higher environmental impact.
In this study, although the four biodegradable plastic bags had the lowest persistence indicator in the environment due to their ability to decompose under the right conditions, the bags ranked poorly overall. Out of the 16 bags tested, PBAT/starch imported composite was at position 7 followed by PBAT/starch local composite, PBAT/PBS imported composite, and PBAT/PBS local composite at positions 12, 15, and 16, respectively. Paper had a low persistence indicator as well as the most job creation opportunities but ranked 14th overall out of all the 16 carrier bags assessed [60].
In another LCA study, commissioned by the Danish Environmental Protection Agency [EPA] [62], 14 carrier bags comprising of four variants of LDPE (40–50 µm thick), recycled PET (600 µm), virgin polyester (100 µm), woven (350 µm) and non-woven PP (500 µm), 1 biopolymer (40 µm), bleached and unbleached paper (120 µm), traditional cotton (930 µm) and organic cotton (1400 µm), and a 700 µm composite (jute, cotton, PP) were compared. In contrast to the study by [60], the authors concluded that low density polyethylene bags were the most favorable environmentally, even after one-off primary reuse.
Woven PP bags, non PP bags, PET bags, polyester bags, biopolymer bags, unbleached paper, bleached paper, organic cotton, conventional cotton, and composite bags would have to be reused a minimum of 45 times, 84 times, 35 times, 42 times, 43 times, 43 times, 20,000 times, 7100 times and 870 times, respectively, for them to have the same low environmental impacts as LDPE when all environmental indicators are considered. The authors also reiterate that if the LDPE bag is reused more than once, the minimum number of times of reuse for the other bags would increase. Two other life cycle assessments carried out by the UK Environment Agency and the Quebec government found that plastic bags resulted in lower environmental impact compared to alternatives, with paper the worst performing, as it had the highest global warming potential [63,64].
Chitaka et al. [59] carried out an LCA study to determine the best drinking straw to use in South Africa. The authors assessed single use straws made of PP, paper, and polylactide (PLA), as well as reusable variants made from stainless steel and glass. Paper had the least environmental impact among the one-off use straws, while among the reusable straws, glass outperformed stainless steel. The authors attribute the high impact of polypropylene on climate change, due to the use of coal in PP production; hence, these results may not be the same as other regions (Europe and USA), which use crude oil or natural gas in PP manufacturing [59].
Bentley Waste Management Consultants [65], who conducted a socio-economic study on the impact of different carrier bag materials in South Africa, also reported that differences in project scope parameters, methods used, and objectives of the project, as well as differences in geographical and environmental aspects, made it impossible to infer conclusions from outcomes of studies done in Europe and America, and that any such attempts to make comparisons produces flawed results. In a review carried out by Walker and Rothman [31], the authors could not draw conclusions on the best performing polymer between bio-based and petroleum-based polymers due to the many variations in methodology in all the studies conducted. Based on these studies, it can be concluded that any material can potentially be sustainable, depending on the weighting of impacts considered to be more important by a country or region. However, the scope of this review paper covers bio-based biodegradable plastics only in order to gain more understanding of their uses, advantages, and disadvantages, as well as the various raw materials that can be used in their manufacturing that have been proposed and or reviewed in various studies.

5. Bioplastics

Bioplastics comprise three categories, which are either bio-based and biodegradable, bio-based and non-biodegradable, or lastly fossil-based and biodegradable. Bio-based biodegradable bioplastics include polylactide (PLA), polyhydroxyalkanoates (PHAs), starch blends, bio-based polycarbonate, and poly butyl succinate. Bio-based non-biodegradable bioplastics include bio-based or partially bio-based variants of PET, polypropylene (PP), and polyethylene (PE), which are referred to as “drop-in solutions”. These bio-based (drop-in) plastics have properties like their fossil-based counterparts and can be recycled in the existing mechanical recycling lines [66,67]. A good example of a partially bio-based PET bottle is Coca Cola’s plant bottle made from monoethylene glycol derived from sugarcane and terephthalic acid from petrochemicals [68]. Other non-biodegradable bioplastics include polyethylene furanoate (PEF), polytrimethylene terephthalate (PTT), and polyamide (PA) [69]. Polycaprolactone (PCL) is an example of a fossil-based biodegradable plastic [70]. One advantage of bio-based polymers is that they do not make use of non-renewable fossil fuel stocks; consequently, in the future when fossil fuel depletion becomes a determining factor, there will be a shift towards bioplastics and away from conventional plastics [61,71,72].
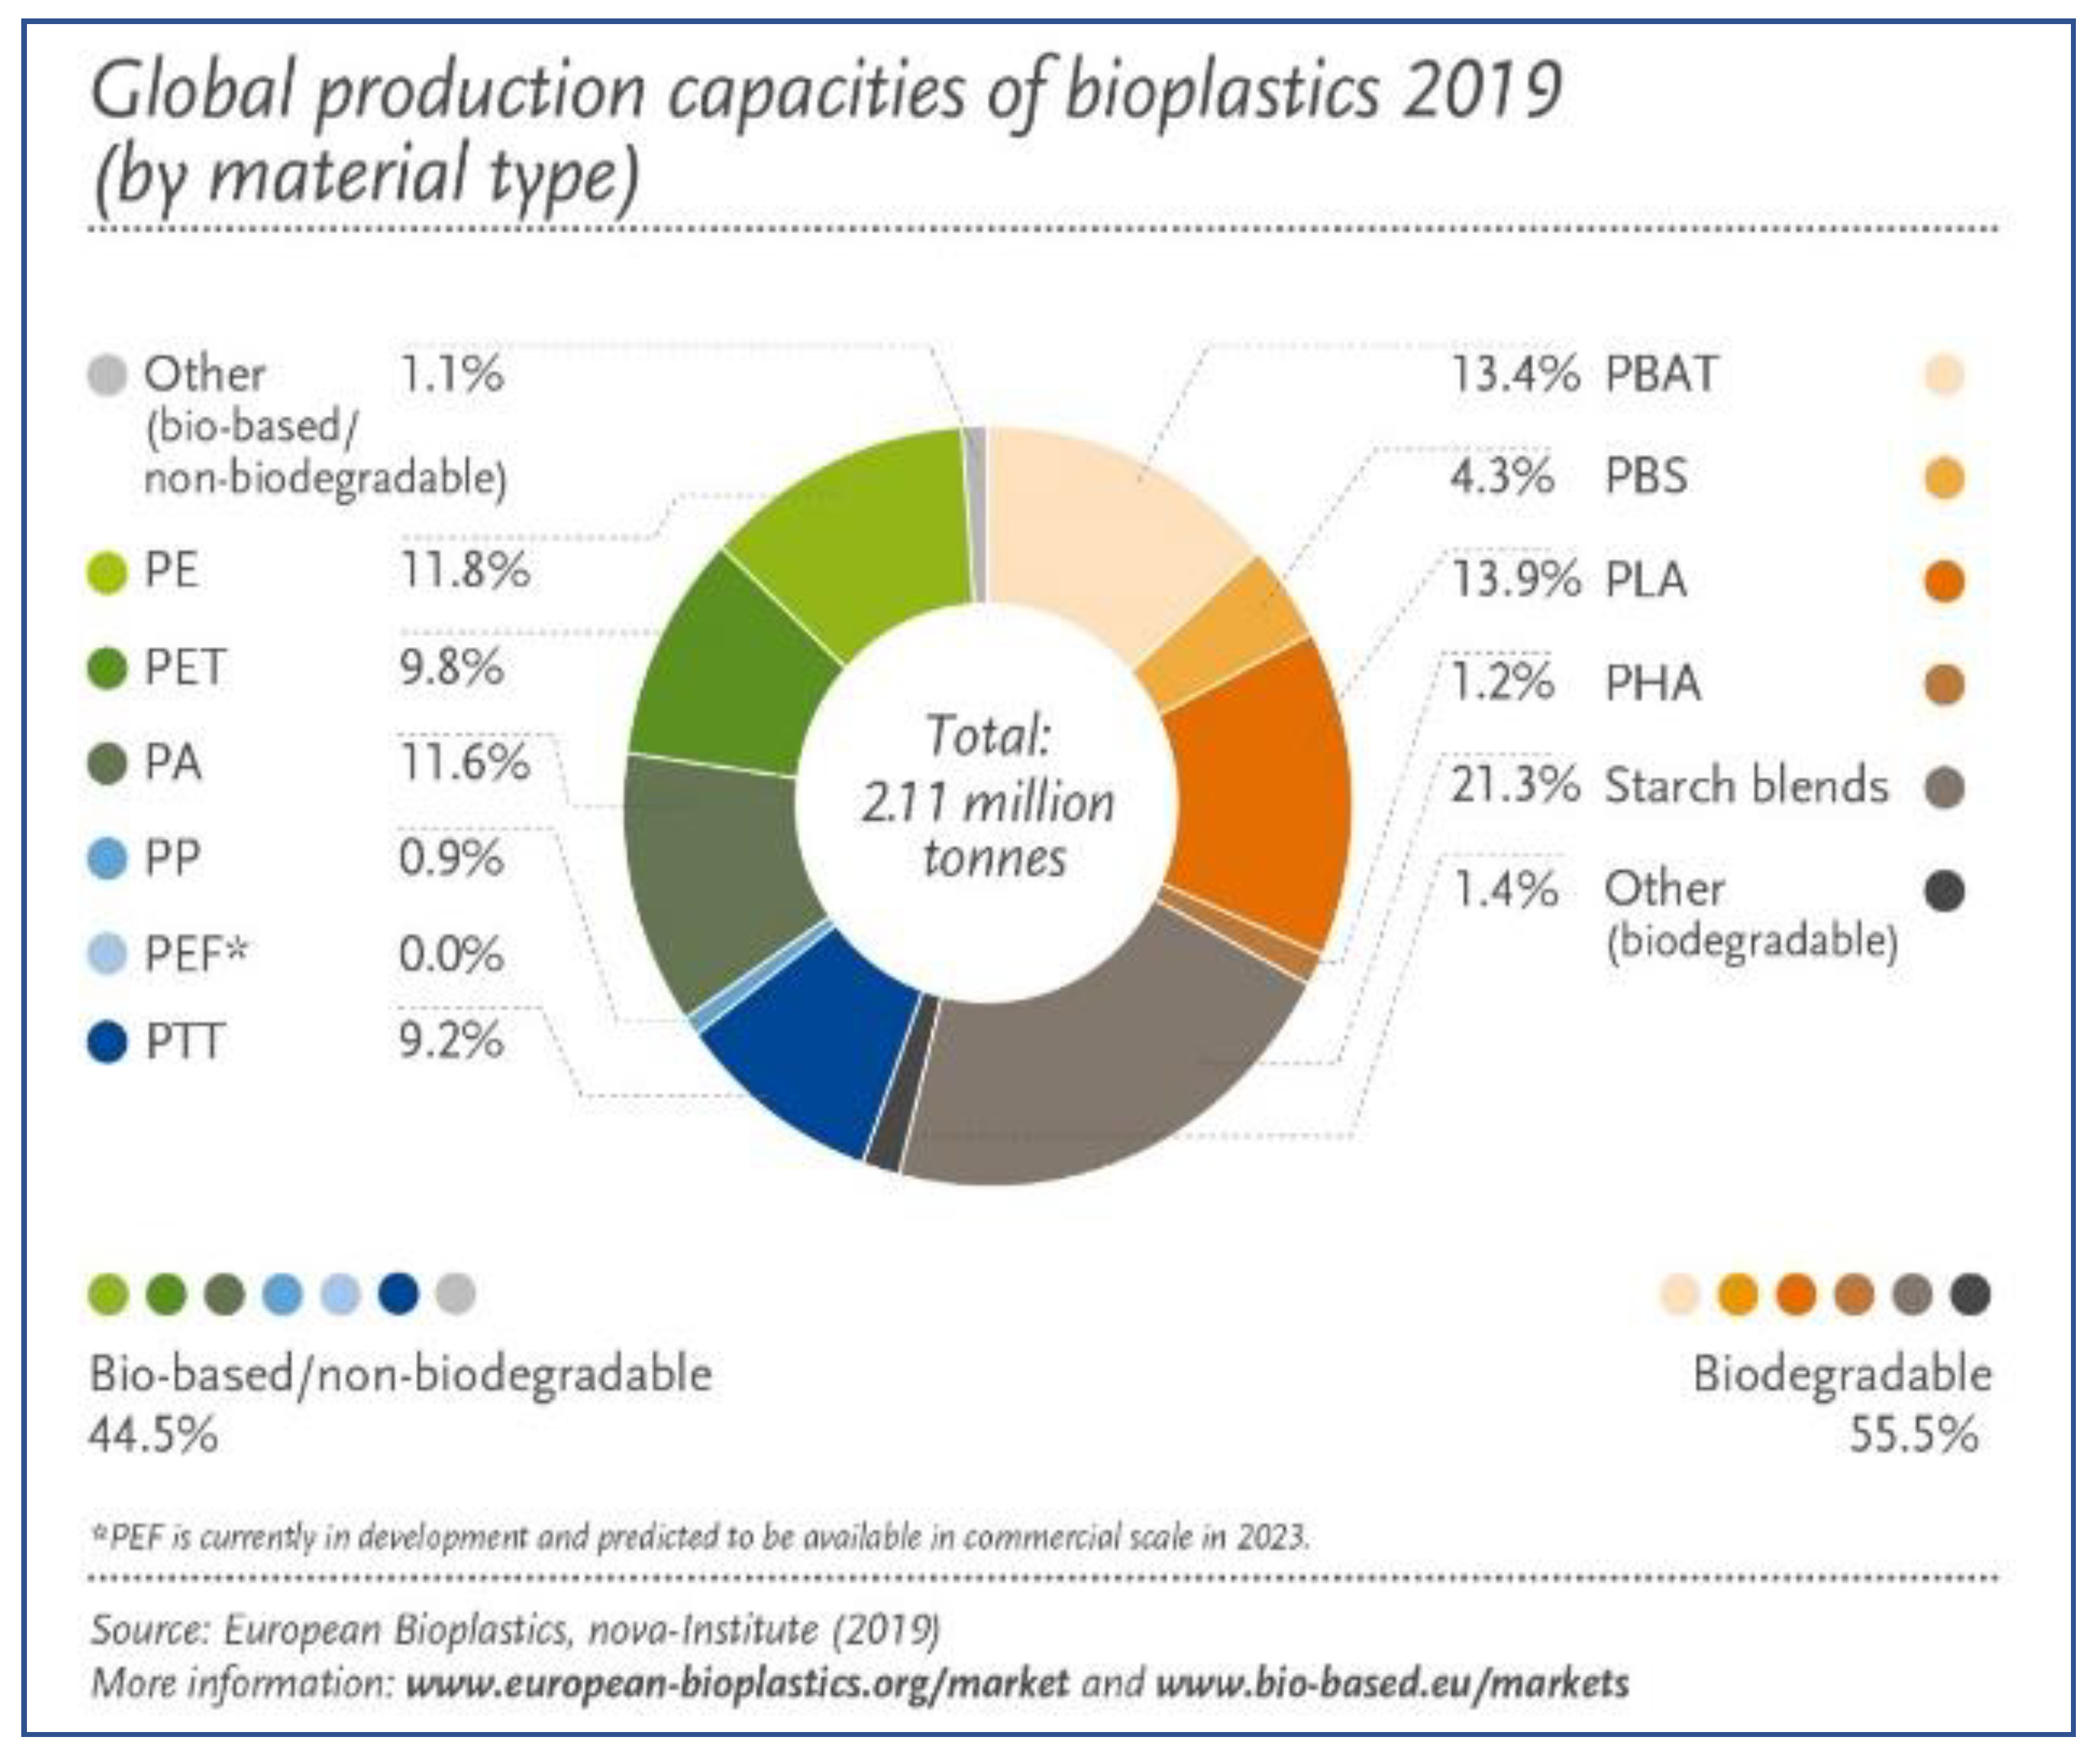
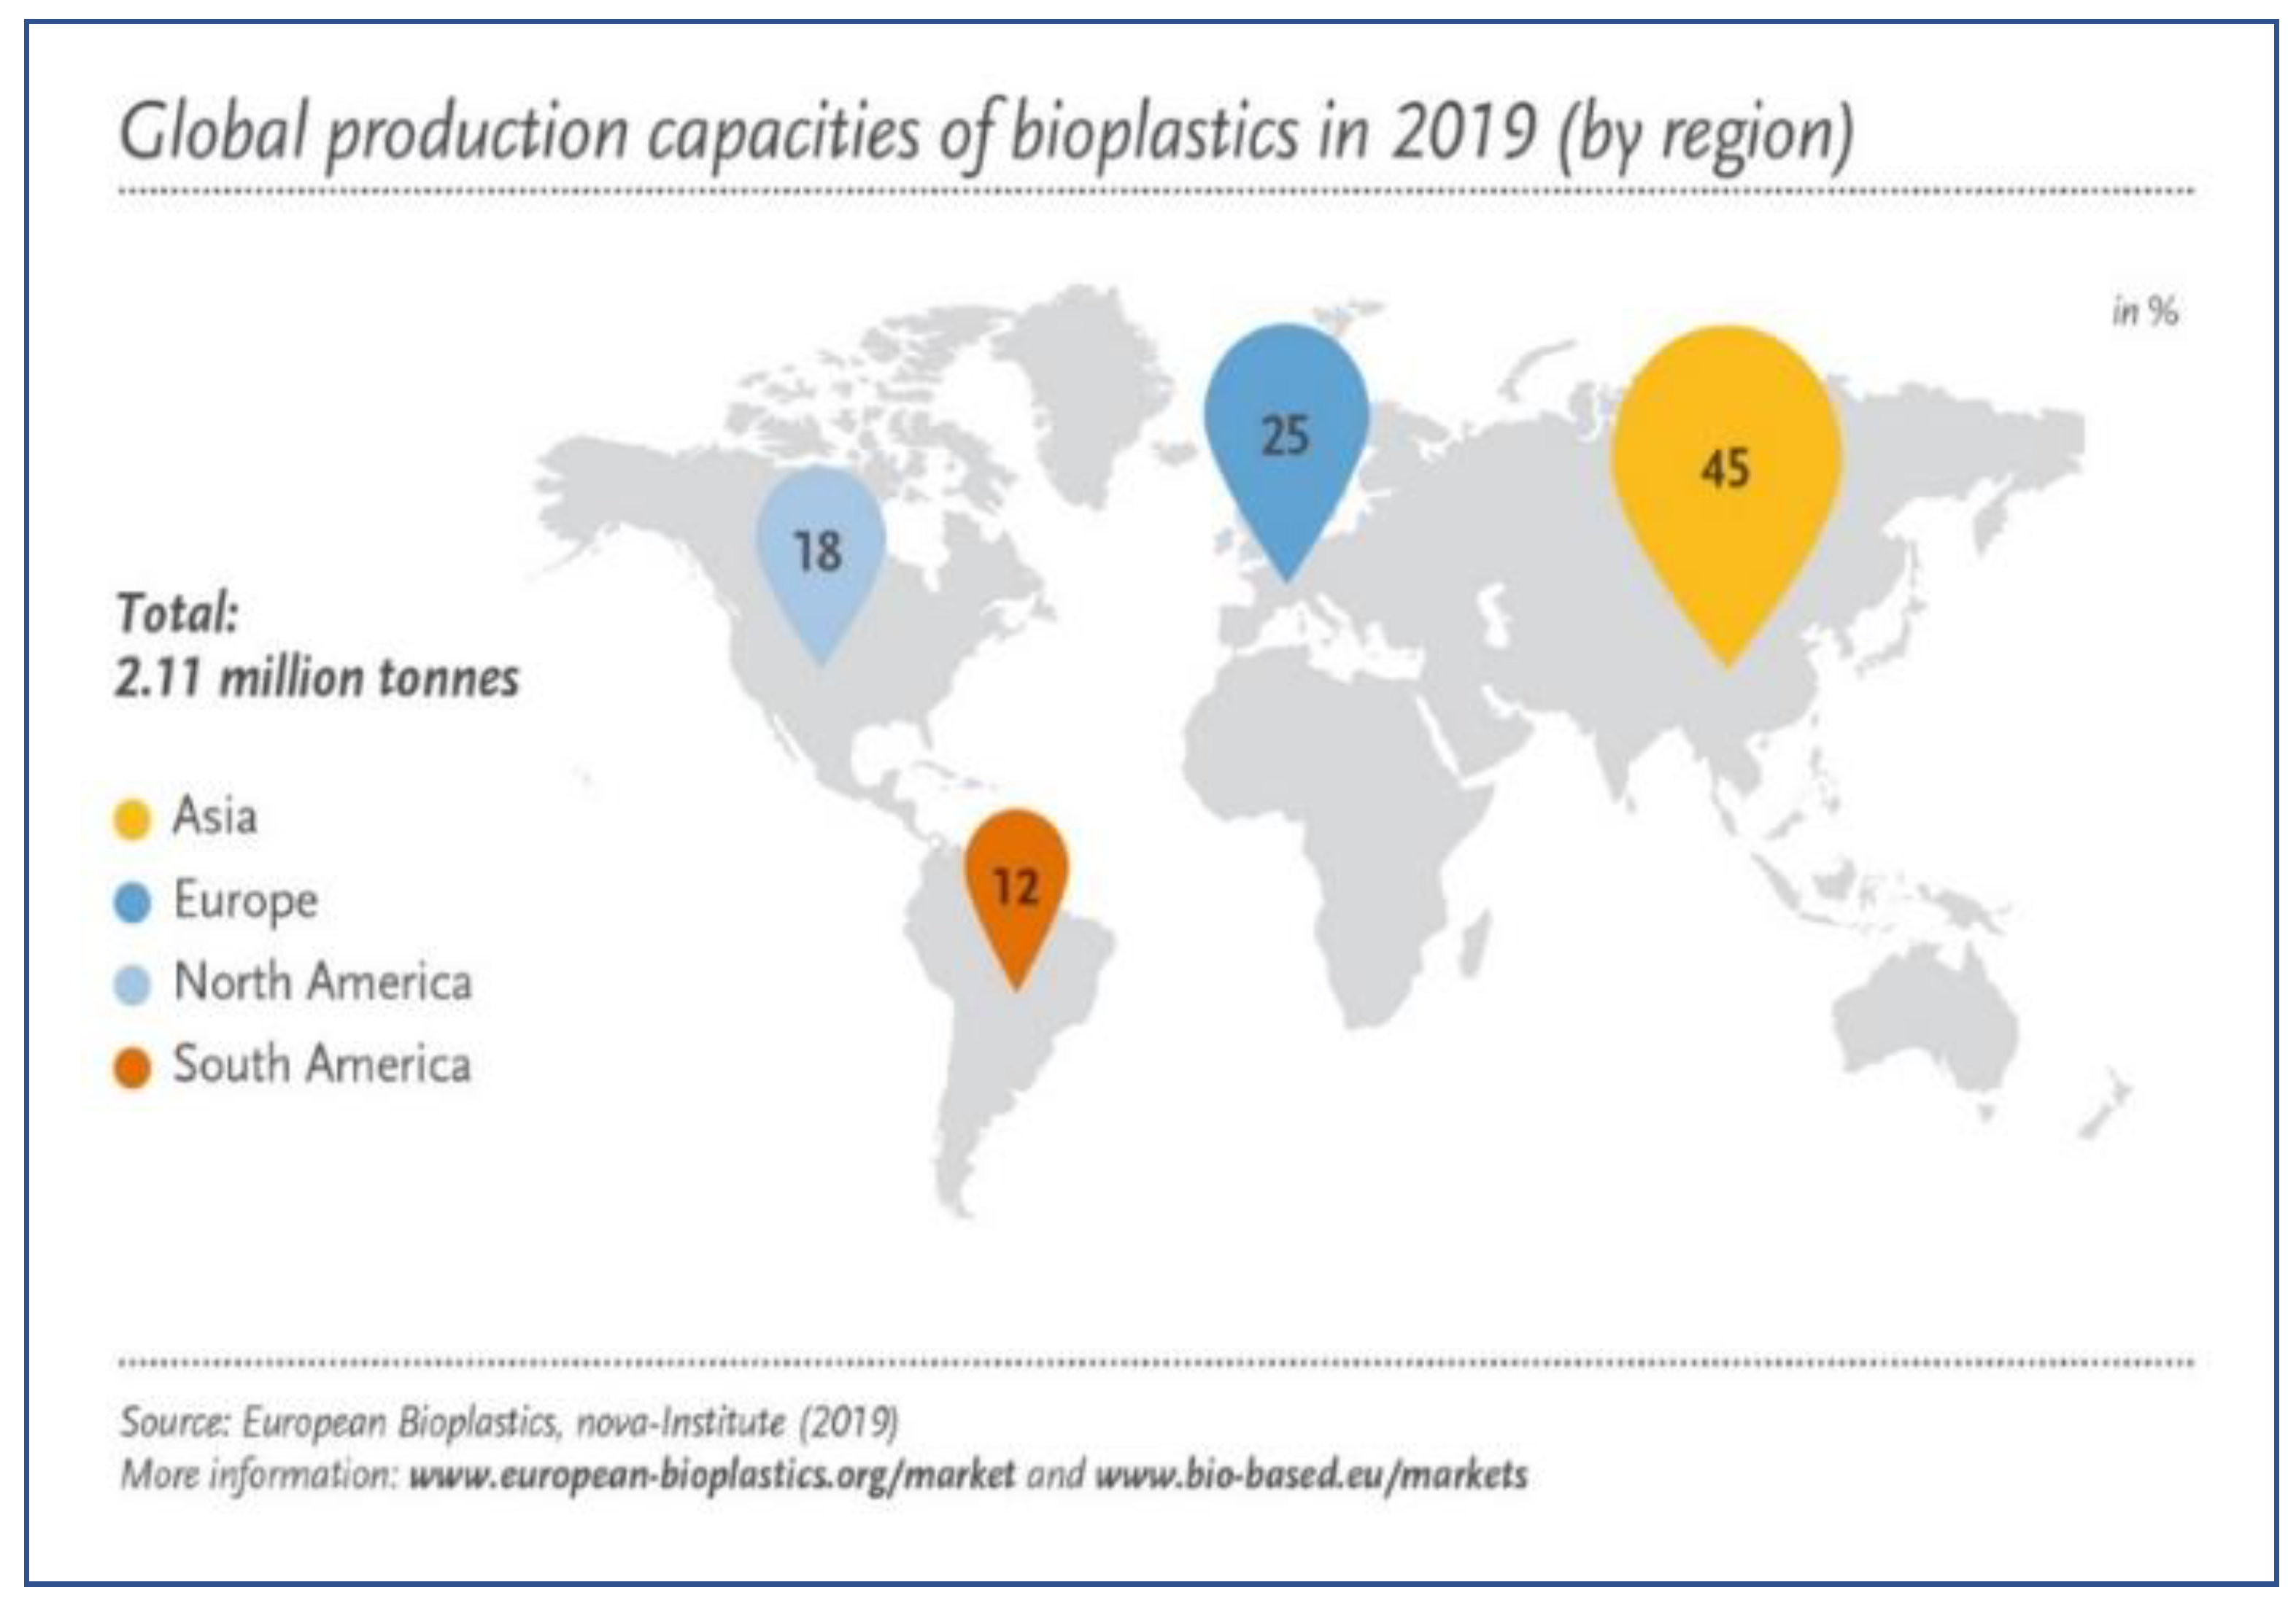
Figure 28 indicates the bioplastics production in 2019; with bio-based non-biodegradable plastics accounting for 44.5% (0.94 million tonnes) of the total production of bioplastics in 2019 versus 55.5% (1.17 million tonnes) for both bio-based and fossil-based biodegradable plastics. From the 55.5% bio-based biodegradable plastics, PLA, PHA, starch blends, and PBS account for 40.7% (0.48 million tonnes) [69]. In addition, in terms of production capacities in the same year, Asia was the top producer of bioplastics with 45%, followed by Europe, North America, and South America with 25%, 18%, and 12%, respectively (Figure 29) [69], while consumption per region was 55%, 25%, 19%, and 1% for Western Europe, Asia and Oceania, North America, and the rest of the world, respectively [73]. The Institute for Bioplastics and Bio-composites (IFBB) projects the bioplastics production share in 2022 for Asia, Europe, North America, South America, and Australia/Oceania to be 65.3%, 20.4%, 9.3%, 4.8%, and 0.2%, respectively [74]. No data for Africa could be found indicating the need for documentation of African statistical data such that a clear picture can be ascertained.

5.1. Need for Review of Bio-Based Biodegradable Plastics

The focus on bio-based biodegradable plastics in this study stems from the growing interest in these plastics as potential replacements for conventional plastics. This is a result of countries across the globe continuing to tighten regulations on the use of single use fossil-based plastics such as plastic bags and straws, the need to reduce consumption of fossil fuels by governments, as well as the consumer’s need to use sustainably manufactured products [75,76]. Furthermore, South Africa is currently in the process of launching a US$1.8 million, Japan-funded bioplastics manufacturing project in collaboration with the United Nations Industrial Development Organization (UNIDO) [77,78]. Therefore, this review is also expected to contribute to the implementation of the project initiative. In addition, the project is also expected to be rolled out to other countries in the Southern African Development Community (SADC) region [78]; consequently, these countries will benefit from the study findings as they plan toward their country specific bioplastics manufacturing projects. The review also arrives with the backdrop of the South African Plastics Pact, an initiative launched on 3 February 2020 by the World Wide Fund for Nature (WWF-SA), the South African Plastics Recycling Organization (SAPRO), and the Waste and Resources Action Programme (WRAP), based in the United Kingdom (UK) [79], which manages the United Kingdom (UK) Plastics Pact [80]. The goal of the pact is to push for a circular economy in South Africa as outlined in the broader Global Plastics Pact by the Ellen MacArthur foundation, and the replacement of single use plastics (SUPs) is high on the agenda. Besides tackling SUPs, the pact’s other targets are as follows: by 2025, all packaging used must be reusable, recyclable, and compostable, 70% of packaging should be recycled, and all packaging must contain approximately 30% recycled material [79]. A lot of effort is required to ensure that these ambitious targets are met within five years.
The biodegradable plastics market value is expected to increase from US$3.02 billion in 2018 to US$12.4 billion in 2027, representing a four-fold increase, evidence that there is indeed movement in this industry, as shown in Figure 30 [81]. The increasing demand for biodegradable packaging for fruits and vegetables, water and beverages, dried snacks and sweets, and baked goods has resulted in significant growth in the packaging sector. Another sector that is growing rapidly is agriculture and horticulture, where biodegradable plastics are used as mulch [82] for conserving soil moisture, reducing the growth of weeds, maintaining favorable soil temperature, and improving soil health, fertility, and aesthetics [82,83]. Biodegradable mulches also reduce labor and disposal costs, as they can be ploughed back into the soil after their use [71,76].
Biodegradation is the process by which matter is broken down by microorganisms either in the presence of oxygen (aerobic digestion) or absence of oxygen (anaerobic digestion) into water, biomass, and gas (either methane or carbon dioxide) [84,85]. According to Hackett [86], some biodegradable plastics may decompose in backyard bins, soil, freshwater, and sea water, while the majority require controlled conditions in industrial composting facilities. The need for such facilities together with infrastructure for the collection of these plastics is crucial for the benefits of these plastics to be realized [87].
The following conditions are necessary for biodegradation to occur [88]:
  • The presence of microorganisms such as bacteria, fungi, and actinomycetes
  • Oxygen (aerobic environment), moisture, and mineral nutrients
  • Temperature range 20 °C to 60 °C (55–60 °C for industrial composting)
  • Frequent mixing
  • A pH between 5 and 8
Further, there are also other factors that influence the rate of the biodegradation process, which can take anywhere from several days to years, and these include polymer morphology, its crystallinity, molecular weight, flexibility, presence of functional groups, blends or copolymers, hydrophobicity, tacticity (repeated arrangement of units), additives, and environment (climate, geographical situation, or steps taken by households in home composting) [72,88,89].

5.1.1. Polyhydroxyalkanoates (PHAs)

PHAs are polyesters [90] that are produced through bacterial fermentation of sugars or oils (lipids) [91,92]. Various types of PHAs can be produced from the over 150 monomers available from this polymer group [91,92]. More than 300 bacterial species can be used during the synthesis of PHAs as carbon and energy reserves [93]. PHAs are formed as granules in cells; this, however, complicates the recovery process, making the whole process expensive [91]. Israni and Shivakumar [94] report that the production costs for PHAs are 5 to 10 times higher than those of petroleum-based plastics, thus hampering their large scale production. Israni and Shivakumar [94] attributed 50% of the cost to the feedstock, thus highlighting the need for alternative feedstocks [95]. Ivanov et al. [90] attributed the high costs currently associated with PHA production to the use of pure cultures (aseptic cultures) where sterile conditions are required, expensive carbon sources, and the use of organic solvents [90]. Poly-3-hydroxybutyrate (P3HB) is the most common variant of PHAs [91,96,97]. It offers good barrier properties to moisture and aroma, thus making it an excellent choice for food packaging [91,96].
The density of P3HB ranges from 1.18 to 1.26 g/cm3, and its melting point varies from as low as 40 °C [96] to 180 ˚C, while thermal degradation temperature is 185 °C; therefore, it cannot be used in high temperature applications. Although its mechanical properties are almost equivalent to polypropylene (PP) [98], P3HB is stiff and is less ductile, with its elongation to break at 5% compared to PP, which is approximately 400% [91,95]. However, the flexibility and impact strength of this polymer can be improved by increasing valeric acid content during production to form a copolymer of hydroxybutyrate and hydoxyvalerate [91,99]. This enables its use in flexible packaging [91]. This copolymer also reportedly degrades faster than the homopolymer hydoxybutyrate [91,99].
Blends of PHAs can be used to simulate the properties of low density polyethylene (LDPE), poly vinyl chloride (PVC), as well as polystyrene (PS) [91]; as a result, this polymer has varied applications in the biomedical (implants, bone and blood vessel replacements, engineered heart valves, sutures, controlled drug release devices), agricultural, and packaging sectors (disposable films). However, the most common is in the production of flexible packaging [91,92,97]. Compared to other bioplastics, PHAs are more resistant to photodegradation. Polyhydroxyalkanoates undergo biodegradation either aerobically or anaerobically (slower) in home and industrial composting, soil, and marine or fresh water. The rate of degradation is influenced by microbial concentration, polymer crystallinity, temperature (60 °C maximum), moisture content, surface area exposed, pH, and molecular weight [91,99,100,101]. According to Rudnik [100], 85% of PHAs biodegraded within seven weeks. In aquatic environments, the timelines could be longer due to low levels of oxygen and lower temperatures [102]. For example, in a study conducted in Lake Lugano in Switzerland with temperatures below 6 °C, biodegradation took approximately 36 weeks. However, this study also attests to the fact that PHAs are biodegradable over wide temperature ranges [102]. In addition, degradation of PHAs occurs faster than that of PLA. A market growth in 2025 from 29,500 tonnes to 53,100 tonnes is expected [91].

Shortcomings of PHAs

The ability to use PHA polymers in varied applications where fossil-based plastics are leading may also present a challenge in that although fossil-based plastics already have waste management systems in place (collection and recycling), PHA polymers lack such infrastructure. This may inevitably lead to contamination of the well-established recycling streams of conventional plastics by PHAs. In addition, due to PHAs’ brittle nature, they cannot be used in the construction and automotive industries where load carrying is necessary. Furthermore, in food packaging where thermal sterilization may be required, PHAs may not be suitable due to their low melting point [96]. Moreover, the cost of PHA granules ranges between US$2000 to US$4500 per tonne [91] compared to about $1200 per tonne for polypropylene [103].
Table 3 shows the various feedstocks that have been tested and proposed by various researchers.

5.1.2. Polybutylene Succinate (PBS)

Bio-based succinic acid and 1,4-butanediol are used to produce biodegradable PBS via fermentation of microorganisms on renewable feedstocks. PBS is a thermoplastic with high ductility (elongation to break is 560%), impact strength, chemical resistance, high yield strength, and good thermal stability [88,133,134,135]. Its yield strength is 3.64 and 1.1 times higher than that of LDPE and polypropylene, respectively [136]. The melting point of PBS is around 112–116 °C, and thermal degradation occurs around 200 °C [133]. The properties of PBS are almost like low density polyethylene [134], and it can be processed using the existing process equipment for conventional plastics [137]. PBS is commonly utilized in the agricultural industry for mulching and in retail for manufacture of supermarket bags and food packaging films [133]. It is also used in the manufacture of compostable bags [108], catering products, and foam, as cited by [97]. Due to its excellent melt processability, PBS is used in the textile industry to produce nonwoven fabric [135], whose high absorbency makes it ideal for filtration applications, sanitary towels, and disposable diapers [138].

Shortcomings of PBS

A drawback of PBS is its poor stiffness [139]. Its modulus of elasticity is between 500 and 700 MPa, which is significantly lower than its biodegradable counterpart, PLA, at 3500 to 4150 MPa [88]. In addition, PBS has a low melt viscosity (flow behavior), slow degradation rate (especially in natural compost, sea, and water) [136], and low tensile strength [129,139,140], which further limits its applications. The high price of PBS is also prohibitive [88] at US$4660 per tonne [76], compared to approximately US$1000 per tonne for LDPE [141]. In addition, PBS lacks good gas barrier properties, which may limit its use in the food industry. Ingress of gases such as oxygen into the packaging may lead to deterioration or degradation of the packaged food [142].
Some of the feedstocks that have been proposed by various researchers are shown in Table 4.

5.1.3. Polylactide/Polylactic Acid (PLA)

Biodegradable polylactide, also referred to as polylactic acid, is synthesized from bio-based lactic acid through bacterial fermentation of carbohydrate or sugars. Corn starch, tapioca roots, and sugar cane are mainly used as feedstocks in the United States, Asia, and the rest of the world, respectively [157]. Sustainably sourced lactic acid has the following advantages [158]:
  • Environmental impact is minimal
  • Production costs are reduced
  • Reduced dependency on petroleum
  • Reduced carbon dioxide emissions
  • The process uses a biocatalyst
The melting temperature of this polymer is between 150 and 175 °C, and its mechanical properties reportedly lie between those of polystyrene and PET, although comparatively similar to PET [91,159]. The first use of PLA was in the manufacture of bio-medical devices due to its excellent biocompatibility properties [30,160]. In the human body, PLA takes 6 to 24 months to degrade into lactic acid, which is not toxic to humans [82]. PLA is also used in the food industry for the manufacture of tea bags, take away food containers, flexible packaging, disposable cups and other utensils; in the agro-industry, it is used for mulching and planter boxes, in the hygiene industry for sanitary towels and disposable diapers, and for 3D printing in various sectors due to its ease of processing and low temperature requirement [82,91,161,162]. With PLA packaging, the shelf life of foods such as vegetables and fruits can be extended, as food is kept fresh for an extended period [76,162]. Under industrial composting conditions, PLA takes 3 to 6 months to degrade [82]. Other end of life options that can be used for PLA are anaerobic digestion, mechanical or chemical recycling, and energy recovery [162]. According to Hagen [163], PLA also has an added advantage in that it can be manufactured using the existing equipment for fossil-based plastics; as a result, resin manufacturers do not need to make significant modifications to their plants. The only change that is required is the drying of PLA resin granulate, as it can quickly degrade in the presence of moisture and temperatures up to 240 °C.

Shortcomings of PLA

A concern in the use of PLA is its similarity to PET, which makes it difficult to separate during mechanical recycling using density separation. PLA has a density of 1.24 g/cm3 versus 1.38 g/cm3 for PET. Therefore, advanced sorting technologies such as near infrared (NIR) are required, and these may not be available in low income countries where hand and density sorting are prevalent. Contamination of the PET stream by PLA renders the whole stream unrecyclable [91].
In addition, the degradation of PLA progresses faster above its glass transition temperature, which is around 55 to 60 °C [163,164,165], with high moisture content and microbes. Therefore, under home composting it degrades slowly, which necessitates the need for controlled conditions in an industrial composting setup [88,91] for its end of life disposal. This also means that in landfills and aquatic environments, degradation rates are also slow as a consequence of low levels of oxygen, temperature, or microorganisms [91]. However, PLA blends with PCL, and some of its copolymers have higher rates of degradation in home composts and other environments [88,91]. PLA will biodegrade in an industrial compost at 58 °C and 65% relative humidity, faster than PBS [88], although PBS can degrade at temperatures as low as 35 °C and below [88].
The cost of PLA resin ranges from US$3500 to US$4500 per tonne [91], which may be prohibitive when compared to PET at around US$1000 per tonne in 2019 [166]. The other drawbacks of PLA are its high brittleness, with an elongation at break of 4 to 7% compared to PET with 20% [167], and low heat distortion temperature of 55 °C versus 116 °C for PET [88,167], which limit the areas of application of this polymer. Furthermore, due to the polymer’s low glass transition temperature, it cannot be used where stiffness at high temperatures is needed, for example, in the manufacture of containers for hot drinks or automotive industry [165]. Hence, it is blended with other bio-based and/or biodegradable plastics to improve its properties. Although PLA packaging is suitable for fruits and vegetables, its low water vapor barrier property renders it unsuitable for bottled water [76].
Table 5 shows the various potential renewable feedstocks that can be used to produce PLA. These were reviewed by [161].

5.1.4. Polycarbonates (PCs)

The manufacture of polycarbonate commonly involves the use of Bisphenol-A (BPA) and phosgene (COCl2) [189,190]. There have been ongoing debates on the safety of BPA exposure in humans in low doses [191], with studies showing that the chemical affects the reproductive system of laboratory animals by acting as a hormone [192]. Furthermore, Ribeiro et al. [191] reported that occupational exposure to BPA resulted in similar outcomes as those reported for the laboratory animals investigated. For pregnant women, this also caused low birth weight in babies. The authors concluded that these risks associated with occupational exposure to BPA should be thoroughly considered. Industry has begun removing polycarbonates from children’s products such as milk bottles [193]. Regarding phosgene, although the process has been attractive on the basis of ease of processing of the polymer, low cost of production, as well as the generation of polycarbonates with exceptional properties and some advantages including easy synthesis and reasonable reaction conditions, it is toxic [189]. It is formed from heating chlorine containing hydrocarbons at high temperatures, is also used in the manufacture of pesticides. This chemical exists as a poisonous gas at room temperature. The Center for Disease Prevention and Control (CDC) [194] reports that this chemical was used during World War 1 as a choking medium and caused the majority of deaths. Accidental release of phosgene can cause breathing difficulties, pulmonary edema (water in the lungs), heart failure, chronic bronchitis, and emphysema. Some symptoms may occur up to 48 h after exposure, while some occur due to long term exposure [194].
Based on the above, bio-based polycarbonates could provide a much safer product than their current counterpart. The potential pathway for synthesis of bio-based polycarbonate involves using renewable feedstocks such as crops and their residues, food waste, and by-products from industrial processes together with carbon dioxide [195].
Generally, polycarbonate is transparent, has high impact resistance, is dimensionally stable, has exceptional flammability resistance, and thermally degrades beyond 135 °C [196,197]. Therefore, due to its versatility, polycarbonate has wide ranging applications. It is used in the construction (safety helmets, power tools, windows, skylights, stadium roofs) and automobile industry (headlamp lenses, wheel covers, bumpers), manufacturing of glasses and eye lenses due to its transparent nature, food packaging, table ware (plastic plates, bowls, cups, cutlery), and polycarbonate polyols (coatings, adhesives, elastomers/urethanes) [195,196,197,198,199,200]. Its transparent nature also offers a better alternative to glass, which can easily break and become a danger to people [193].
Considering the above, the bio-polycarbonate to substitute the fossil-based polycarbonates has to have similar or superior properties. The bio-polycarbonates market is still in its infancy, and the bulk of research that has been done is at laboratory scale [195]. Approximately 20,000 tonnes of this polymer were produced in 2019 by a Japanese company, Mitsubishi. However, interest in bio-polycarbonates as a potential replacement of BPA polycarbonates has been growing, not only due to its biodegradability, but also its excellent biocompatibility, which may enable its use in drug delivery devices and tissue engineering [190]. Furthermore, the release of carbon dioxide and water upon degradation, which are not acidic and therefore will not promote harmful reactions in the body as well as the low rates of degradation of these carbonates, have increased their interest in the medical field. Moreover, the absence of BPA and phosgene will once more attract its use in the food packaging industry. Another advantage of bio-polycarbonates is their resistance to photodegradation due to the absence of benzene rings, which implies that no discoloration can occur.

Shortcomings of Bio-Polycarbonates

Cui et al. [195], highlight the need to improve thermal and mechanical properties of bio-polycarbonates to similar levels as their fossil-based counterparts, although some promising ones have been produced at laboratory scale [195]. For example, Park et al. (Year) successfully produced a bio-polycarbonate that is reportedly superior to the conventional polycarbonate in terms of transparency, strength, and other physical properties, which were shortcomings of the biopolymers [193]. The tensile strength of this new bio-polycarbonate is 93 MPa versus 55 to 75 MPa for the fossil-based polycarbonate and 64 to 79 MPa for the existing bio-based variant currently on the market. Therefore, this material can be used in all the afore mentioned applications where the petroleum-based polycarbonates are being used as well, as in baby products and food packaging. Toxicity tests conducted in mice showed that the plastic did not pose a risk in mice [193]. Park et al. [193], however, do not address the end of life disposal/treatment option for their generated polycarbonate. In addition, rate of biodegradation is slow [195], and studies in that area are lacking. Increase in productivity of bio-polycarbonates will also be crucial [195] to meeting the demand of millions of tonnes of fossil-based polycarbonates currently being produced annually on a global scale.
A breakdown of potential feedstocks to produce bio-polycarbonates as reviewed by Cui et al. [195] is given in Table 6.

6. Extended Producer Responsibility (EPR)

Extended producer responsibility (EPR) is a policy initiative where the producer is given responsibility for their products from cradle to grave, thus shifting the burden from municipalities [217,218]. In other words, the producer is accountable for financially and/or physically treating, recycling, or disposing of products at the end of their life [217]. Therefore, EPR seeks to ensure that products are produced and managed in a sustainable manner, consequently reducing their impact on the environment. This encourages producers to design their products with end of life management methods in mind [218], for example by manufacturing durable, recyclable, or reusable products [219]. EPR may either be on a voluntary basis or mandatory [217].
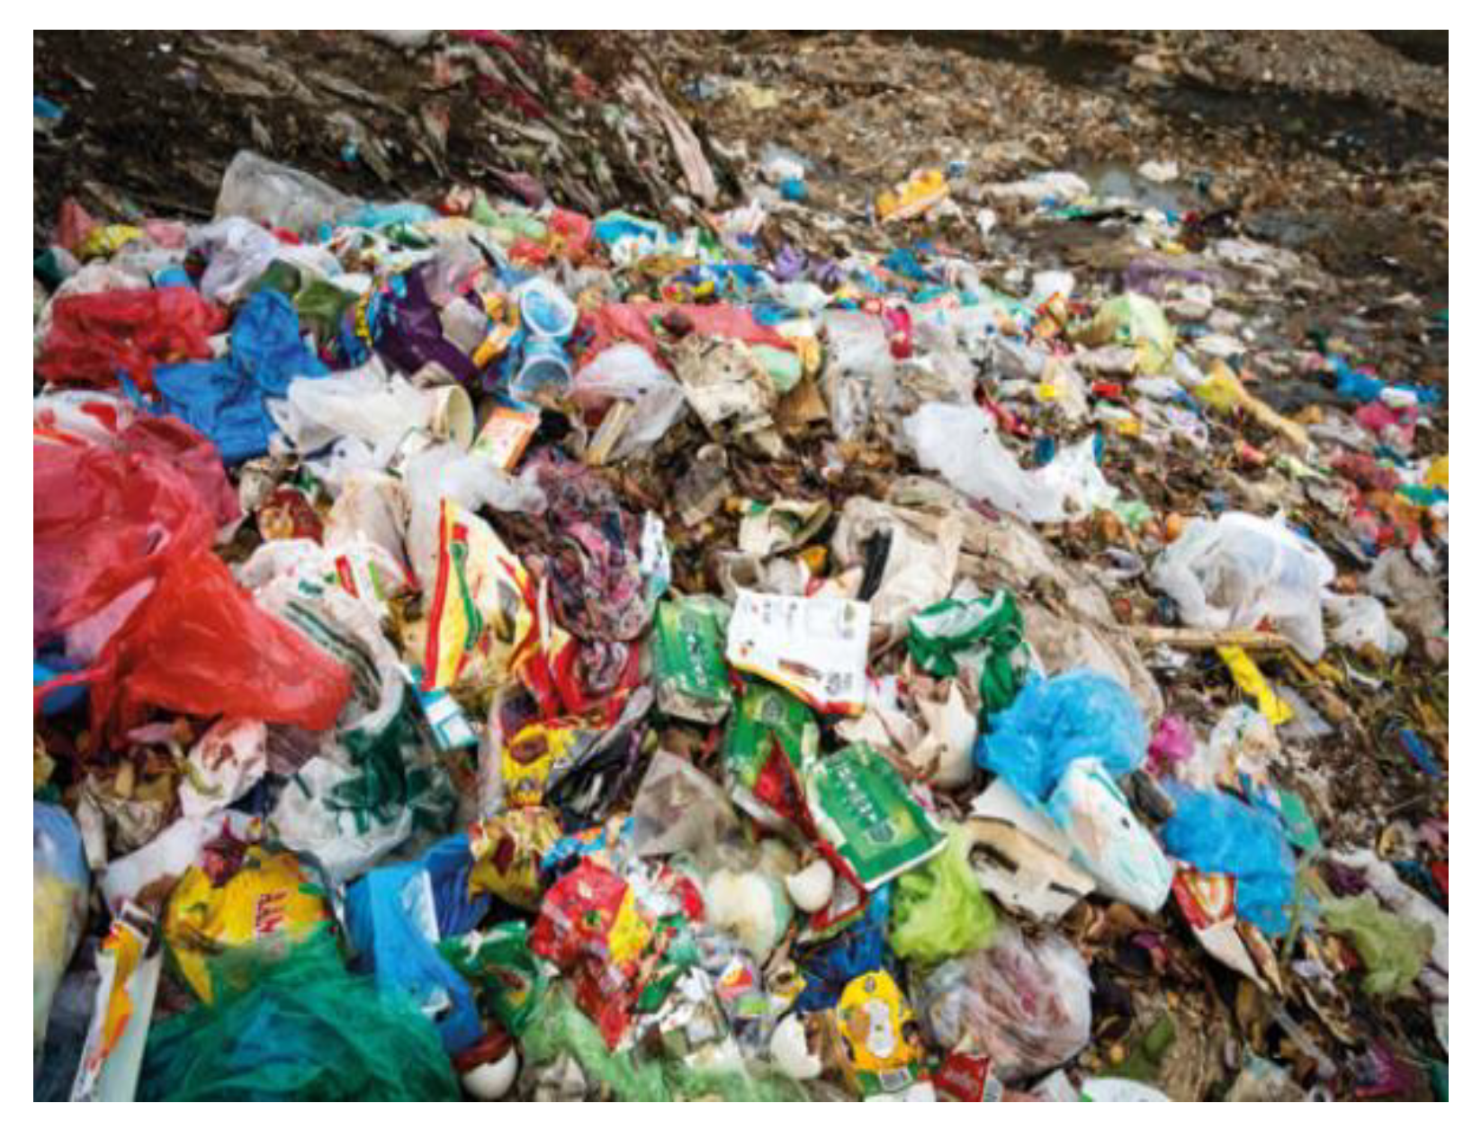
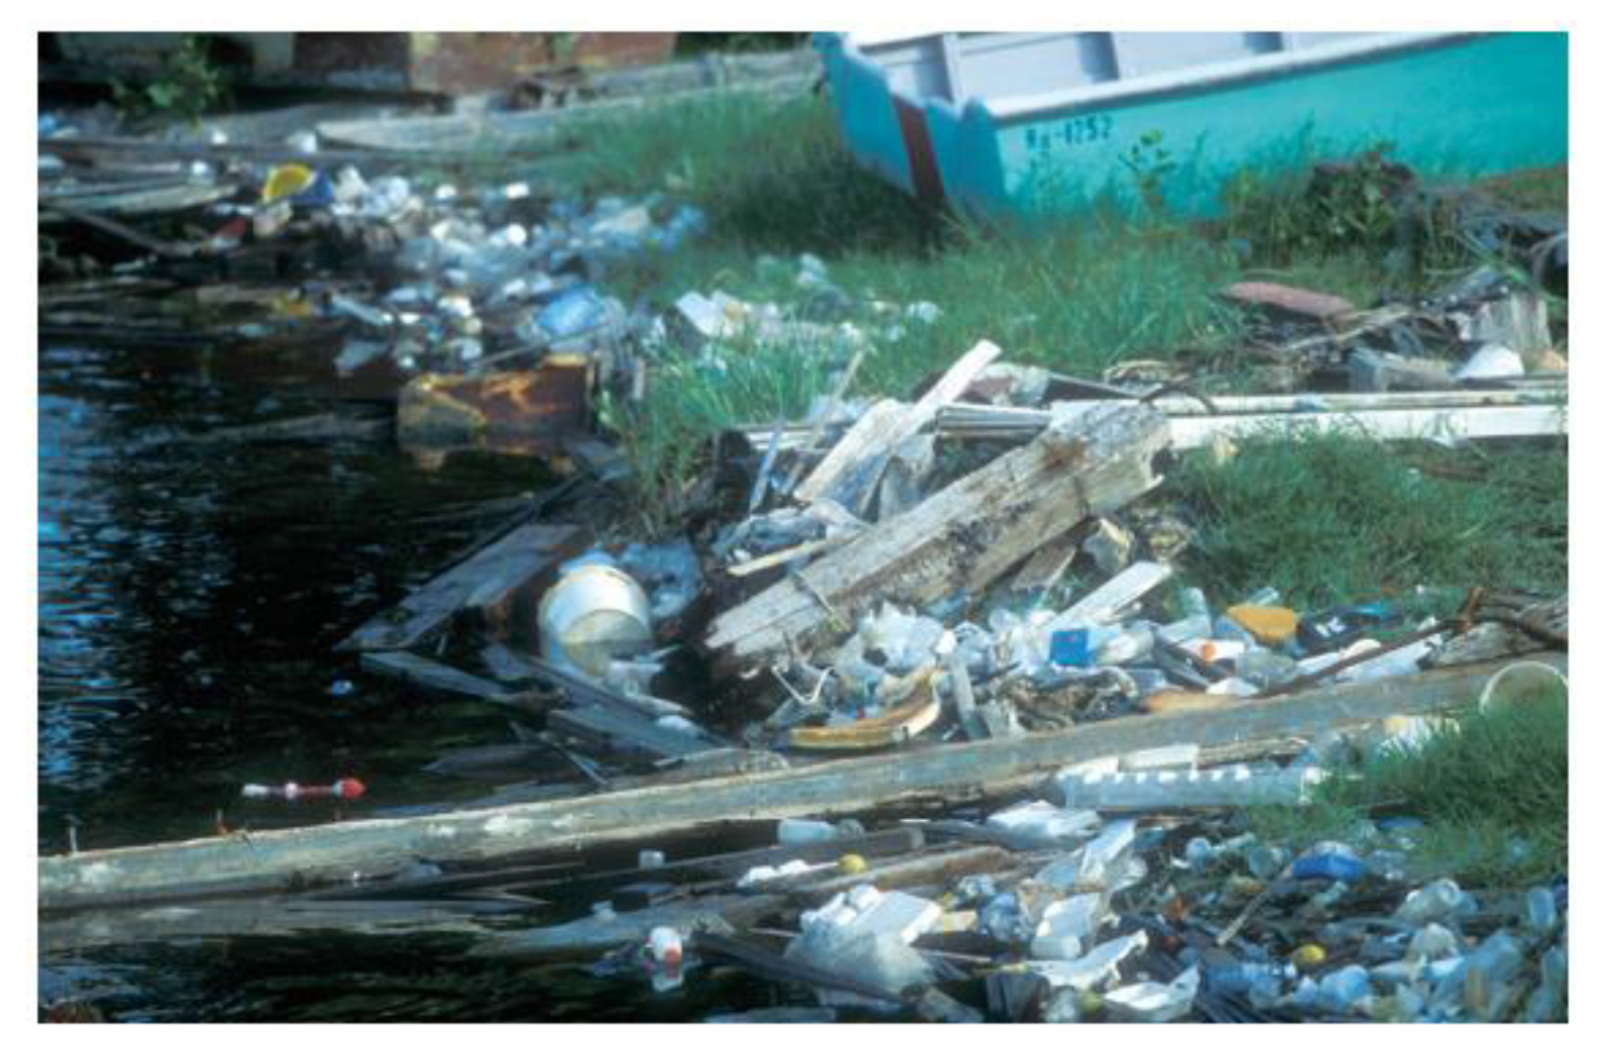
It is estimated that 2 billion people worldwide (one in four people globally) lack waste collection services and as a result resort to illegal dumping on either roads, vacant land, or drains, while for another 1 billion people, waste is collected but disposed unsafely due to the absence of disposal systems/facilities. This constitutes 93% of waste for low income countries and only 2% of waste for high income countries that is indiscriminately dumped or buried [13]. In 2016, 61% of the total waste that leaked into the oceans was attributed to uncollected waste while the balance of 39% came from mismanaged waste after collection. This share of uncollected waste is set to increase to 70% in 2040 in a business as usual scenario [220]. Scenes such as those depicted in Figure 31, Figure 32, Figure 33, Figure 34 and Figure 35 show the reality of what is currently transpiring in low income countries and this will remain all too prevalent in the absence of rubbish collection or its safe disposal.
However, an EPR policy could help to curb plastic waste pollution and its associated impacts, especially in low income countries, through companies providing the required investment for waste management [9,24]. The impacts of dengue fever (caused by mosquitoes) in an area reportedly decrease by 95% when there is adequate water and/or waste management [13].
Although the Organization for Economic Co-operation and Development (OECD) [217] reports the difficulties encountered in trying to determine the benefits of an EPR scheme, for example due to lack of data as well as the presence of many EPR schemes in different industries, which makes comparisons difficult to make, several countries that have implemented EPR schemes have attested to their success. In Australia, the National Television and Computer Recycling Scheme, in which companies that manufacture these products (e-waste) fund the collection and recycling services of end of life televisions and computers, has resulted in a reduction in amount of e-waste sent to landfills through increased recycling as well as a recovery of valuables that would have otherwise been disposed of. Recycling opportunities have also increased, covering all regions of Australia including rural areas [221].
In Japan, the Packaging Recycling Act, which targets plastic and paper packaging, aluminum tins, glass bottles, and PET containers, has resulted in a decrease in the amount of waste packaging that is disposed in landfills. This is a positive outcome for Japan, where land to construct new landfills is scarce. In addition, this has also incentivized producers to develop a number of mechanical and chemical recycling technologies for waste packaging [222].
In France, which had 14 EPR schemes as of 2014, over 3000 jobs and 30 plants were created through the Waste Electrical and Electronic Equipment (WEEE) recycling scheme. Furthermore, EPR has capacitated recycling startups as well as making such activities sustainable financially by injecting a steady flow of money until the business can sustain itself. EPR schemes in the country have also removed financial burden from the municipalities as well as the public (taxpayers) [223].
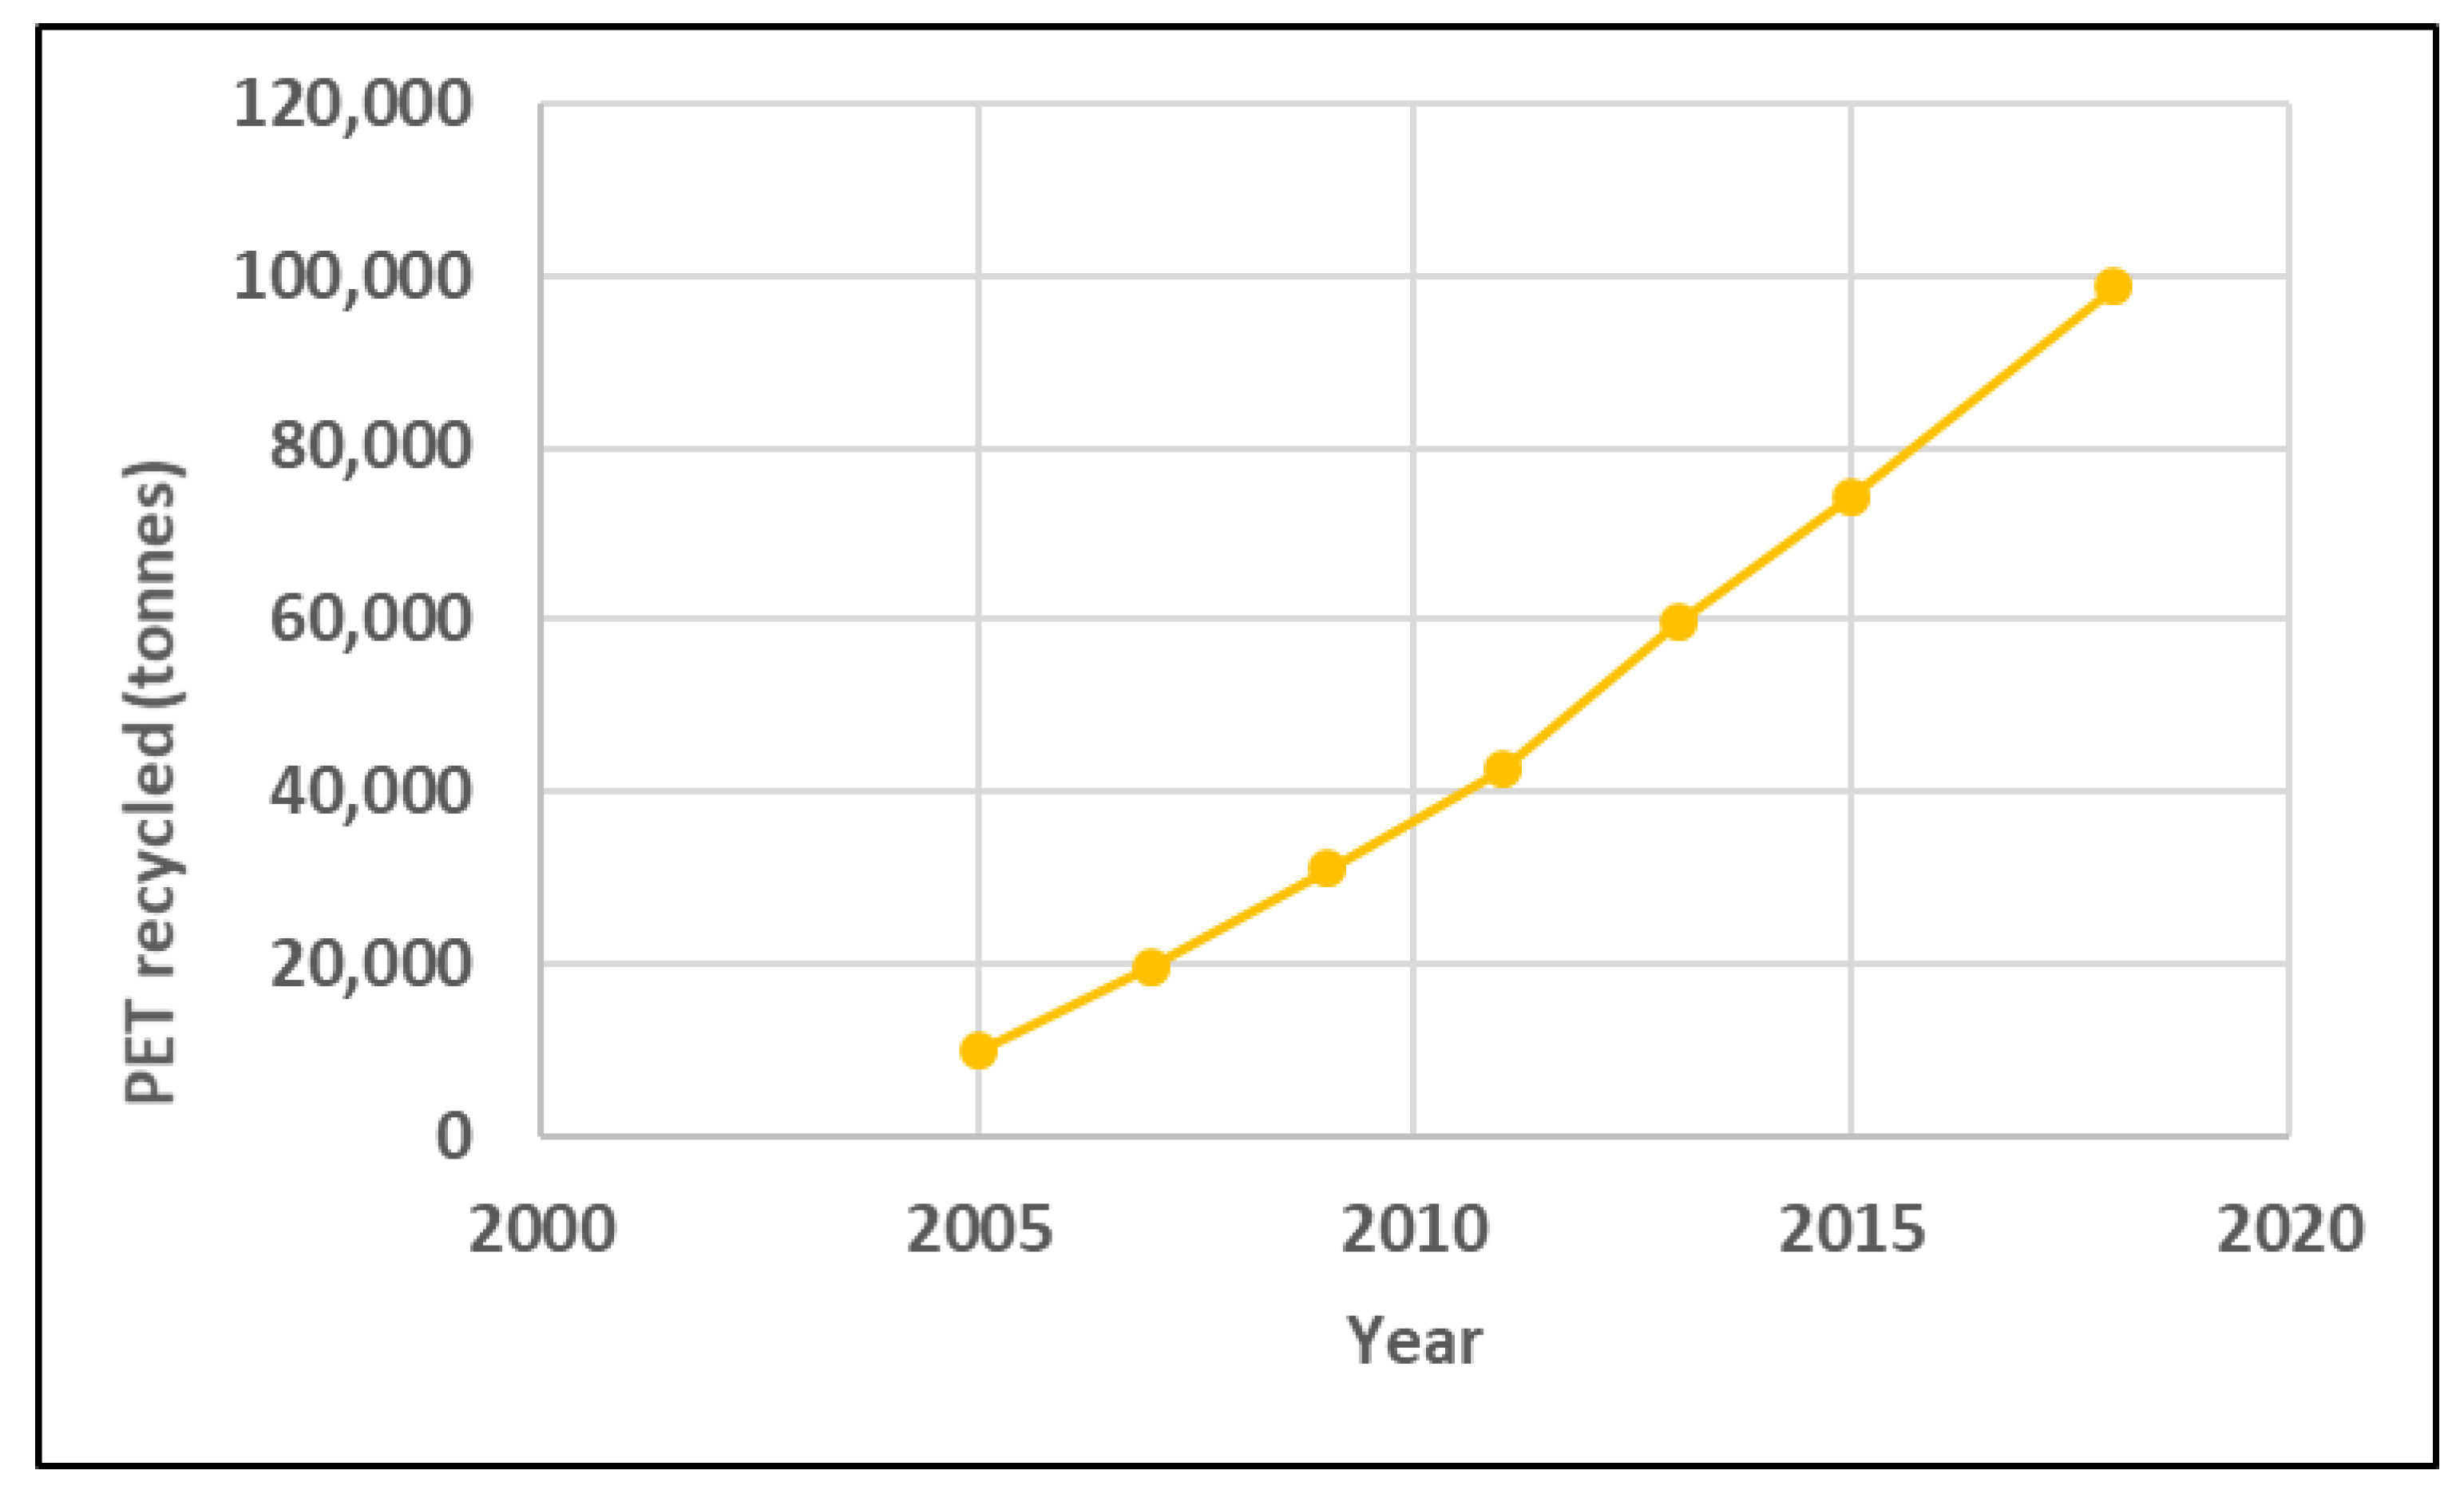
In South Africa, the launching of the PET Recycling Company (PETCO) in 2004 to act as an industry led producer responsibility organization (PRO) or voluntary EPR initiative, which manages the collection and recycling of polyethylene terephthalate (PET), boosted the rates of PET recycling in the country significantly, Figure 36. The organization also funds recyclers when there is a need, such as depressed market prices of PET recyclables [224,225]. Bottle manufacturers pay a non-mandatory recycling fee, while subsidies are paid by brand owners, retailers, and producers of PET resin [224].

Deposit Refund Scheme

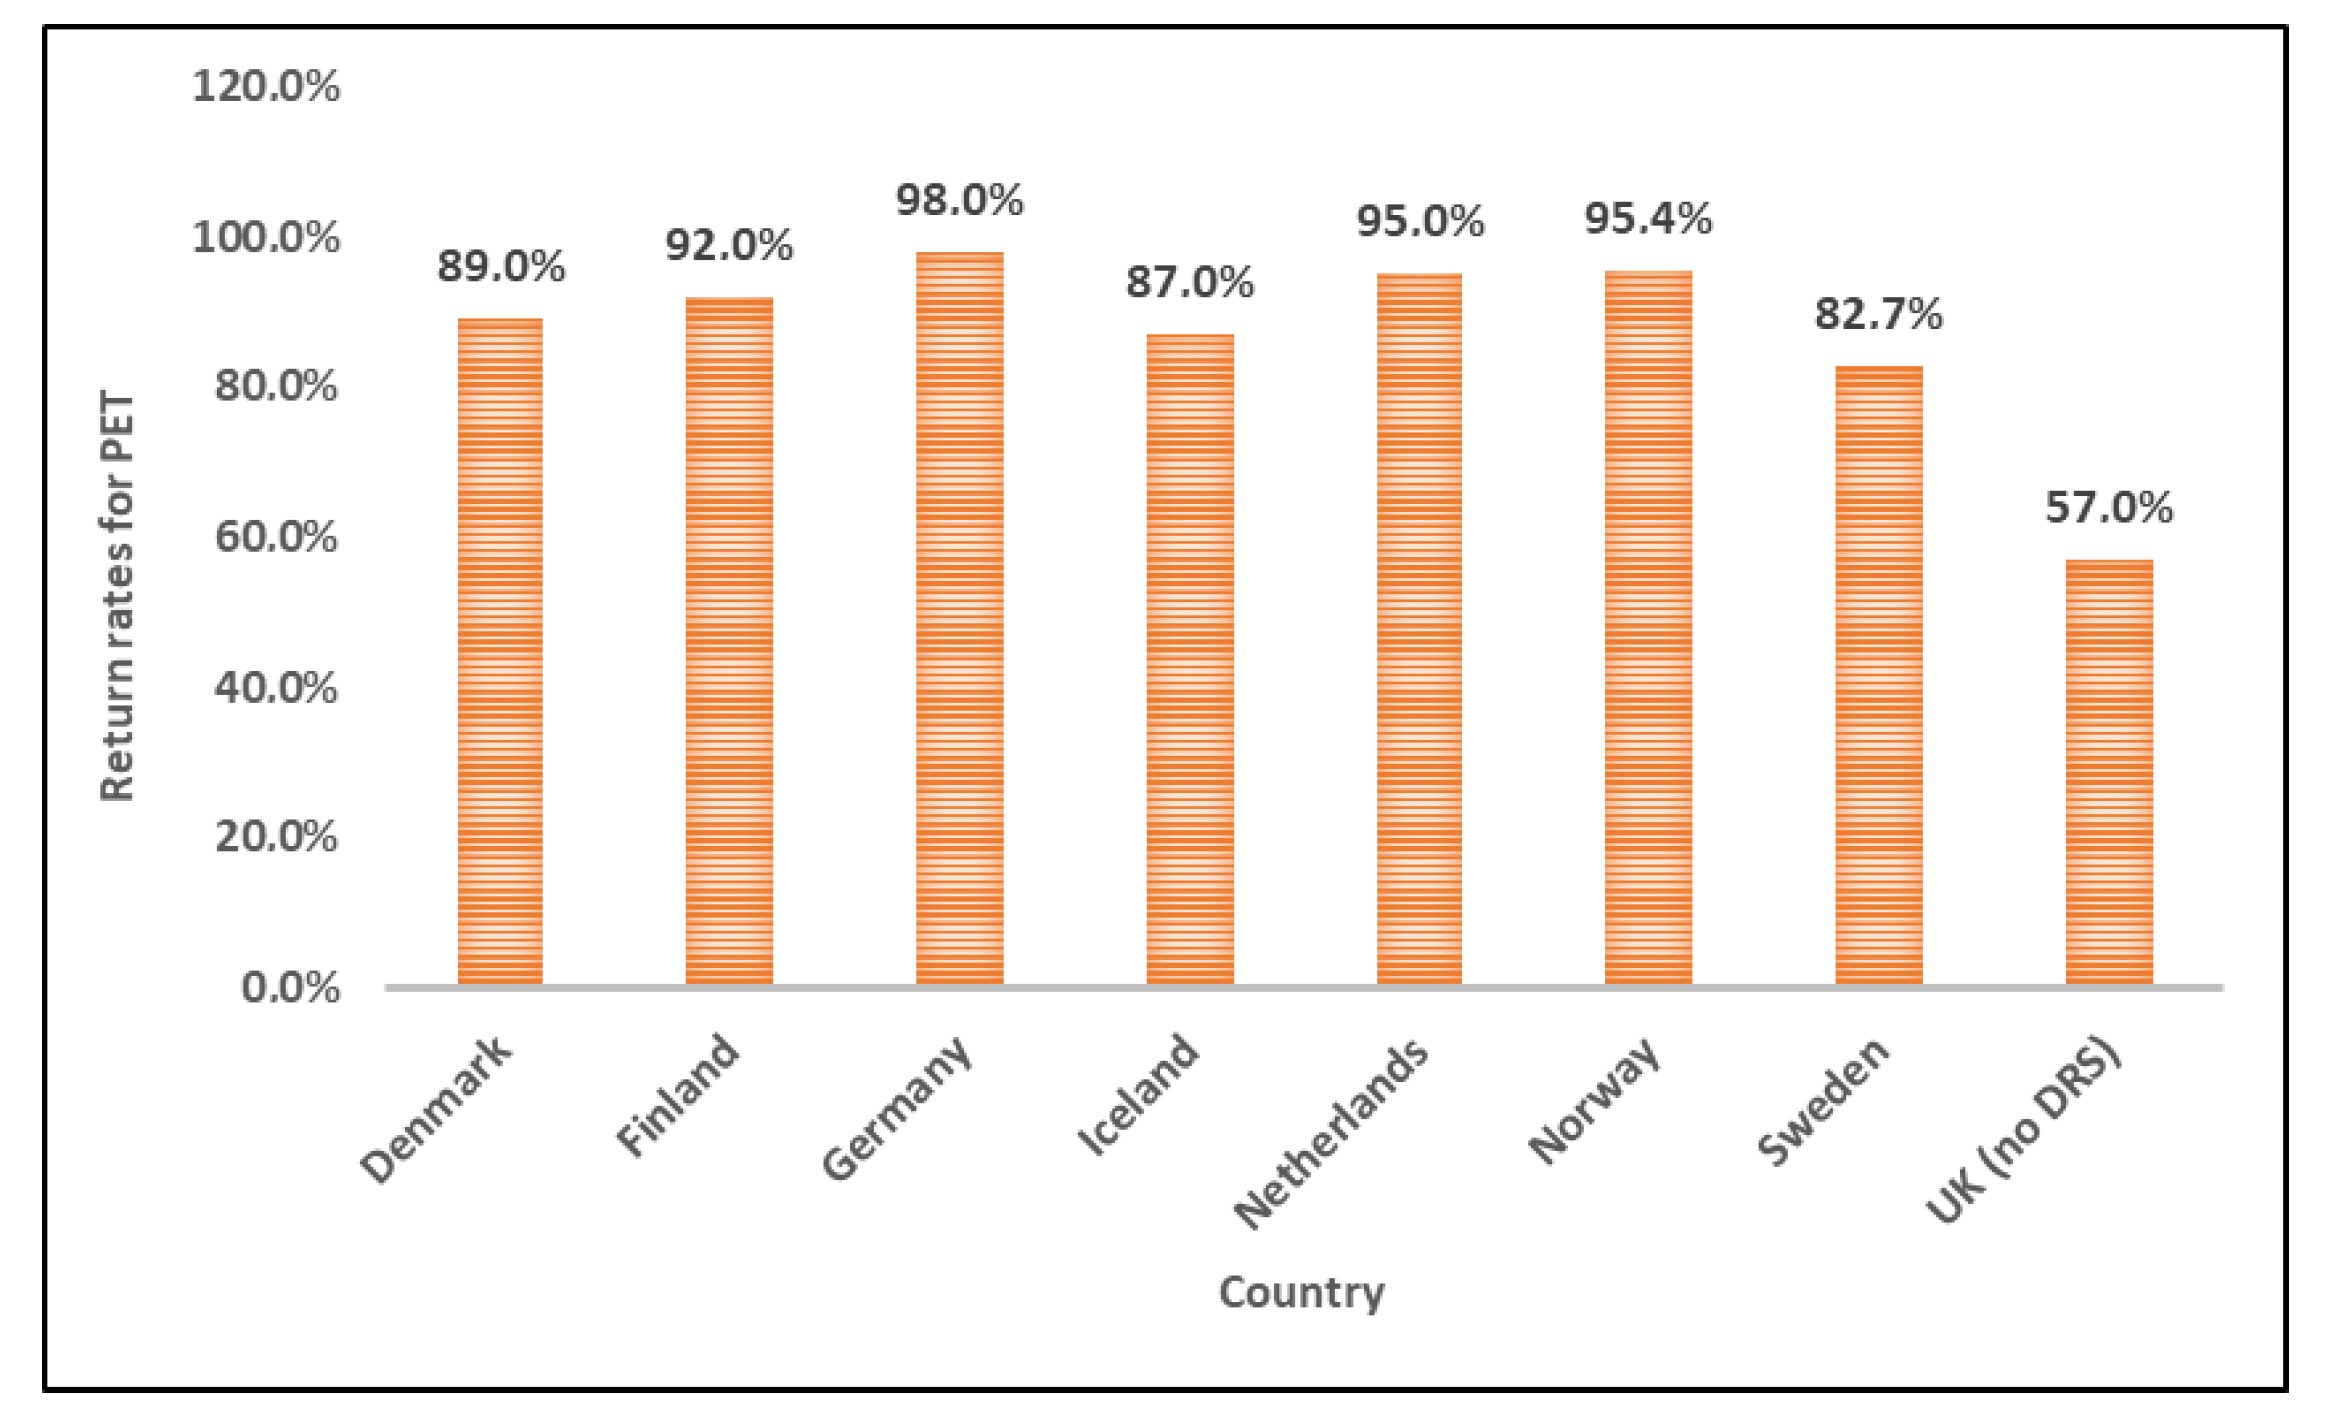
A number of tools can be used in the implementation of an EPR scheme, and these include deposit refund schemes, instituting advance disposal fees on products (paid by the consumer), as well as product take-back programs, or a mix of these [217]. This paper will briefly discuss the DRS, which has been around for over 40 years, is practiced in over 38 countries globally, and has an estimated 350 million people using this scheme [226]. In the DRS, a deposit is paid upfront during the purchase of a product, and once the container is returned by the buyer, a refund is given. DRS has the following advantages as observed in countries where it is practiced: it increases the capture rate of the targeted plastic material (Figure 37), especially when recycling rates have stalled, thereby also promoting conservation of resources through reducing the volume of virgin plastics required, minimizing contamination of the target stream of plastic, and reducing littering, probably by altering littering behavior, as the public recognizes the value in plastic waste that they would have otherwise thrown away [226].
Priestland et al. [227] cite Infinitum, which also attests to the effectiveness of DRS in Norway, which started in 1999 for beverage bottles and cans, where the public returns the empties and is paid through reverse vending machines. This has reportedly reduced GHG emissions by 185,000 tonnes through reduction in virgin plastics production. In Germany, return and recycling rates for PET bottles are at 98.5%, compared to 43–54% from household recycling systems [227]. In Ecuador, recycling rates increased from 30% in 2011 to 80% in 2012, while in South Australia and New Territories states (Australia), beverage bottles constitute 2.9% (three-fold reduction) and 2.8% of litter, respectively [226]. A cost benefit analysis conducted in Israel in 2010, 9 years after DRS’ introduction, showed that the total benefits of DRS outweighed the total costs incurred by approximately 35%, with greater margins expected for larger bottles [228]. On the other hand, in UK, where DRS is not practiced, 700,000 plastic bottles are littered on a daily basis, while of the 13 billion plastic bottles used in the country annually, only 57% (7.5 billion), Figure 37 are recycled. From the balance of 5.5 billion plastic bottles, 2.5 billion plastic bottles are landfilled and 3 million incinerated [229].
Therefore, as this scheme could lower the risk of plastic leakage into the environment, such a model could work in countries where waste collection services are limited [228]. Furthermore, although SA has voluntary EPR in the PET sector, and managed to recycle 61.4% of PET bottles in the year 2019, if the DRS system could also be implemented, this should improve their recycling rates further, potentially to 80% or higher as observed in countries implementing the system. Consequently, scenes such as those depicted in Figure 38 taken in a suburb in South Africa may not be a common sight. The littering of macroplastics such as plastic containers has been reported to encourage further littering of smaller items as it normalizes such a behavior [229].
Coca-Cola South Africa has recently rolled out a deposit refund scheme for its 2 L PET bottles in the Eastern Cape, Northern Gauteng, Limpopo, and Mpumalanga Provinces. In this scheme, the consumers will pay about US$0.52 (R9) extra to the price of the beverage, then upon returning the container to participating retailers, the same amount is deducted from their next purchase [230,231]. The costs associated with bottle manufacture, collection, washing, and refilling are included in the purchase price of the beverage. This program is expected to be rolled out to the rest of the country in five years [231], and its effectiveness will be exposed as time progresses.
Despite the aforementioned benefits of implementing EPR and DPR schemes, the authors are cognizant of the fact that implementation of EPR and its associated tool of DRS are not without challenges and would require an in-depth study [232], but lessons can certainly be learned from countries that have had outstanding achievements in this regard.

7. Summary of Mismanaged Plastic Waste Impacts

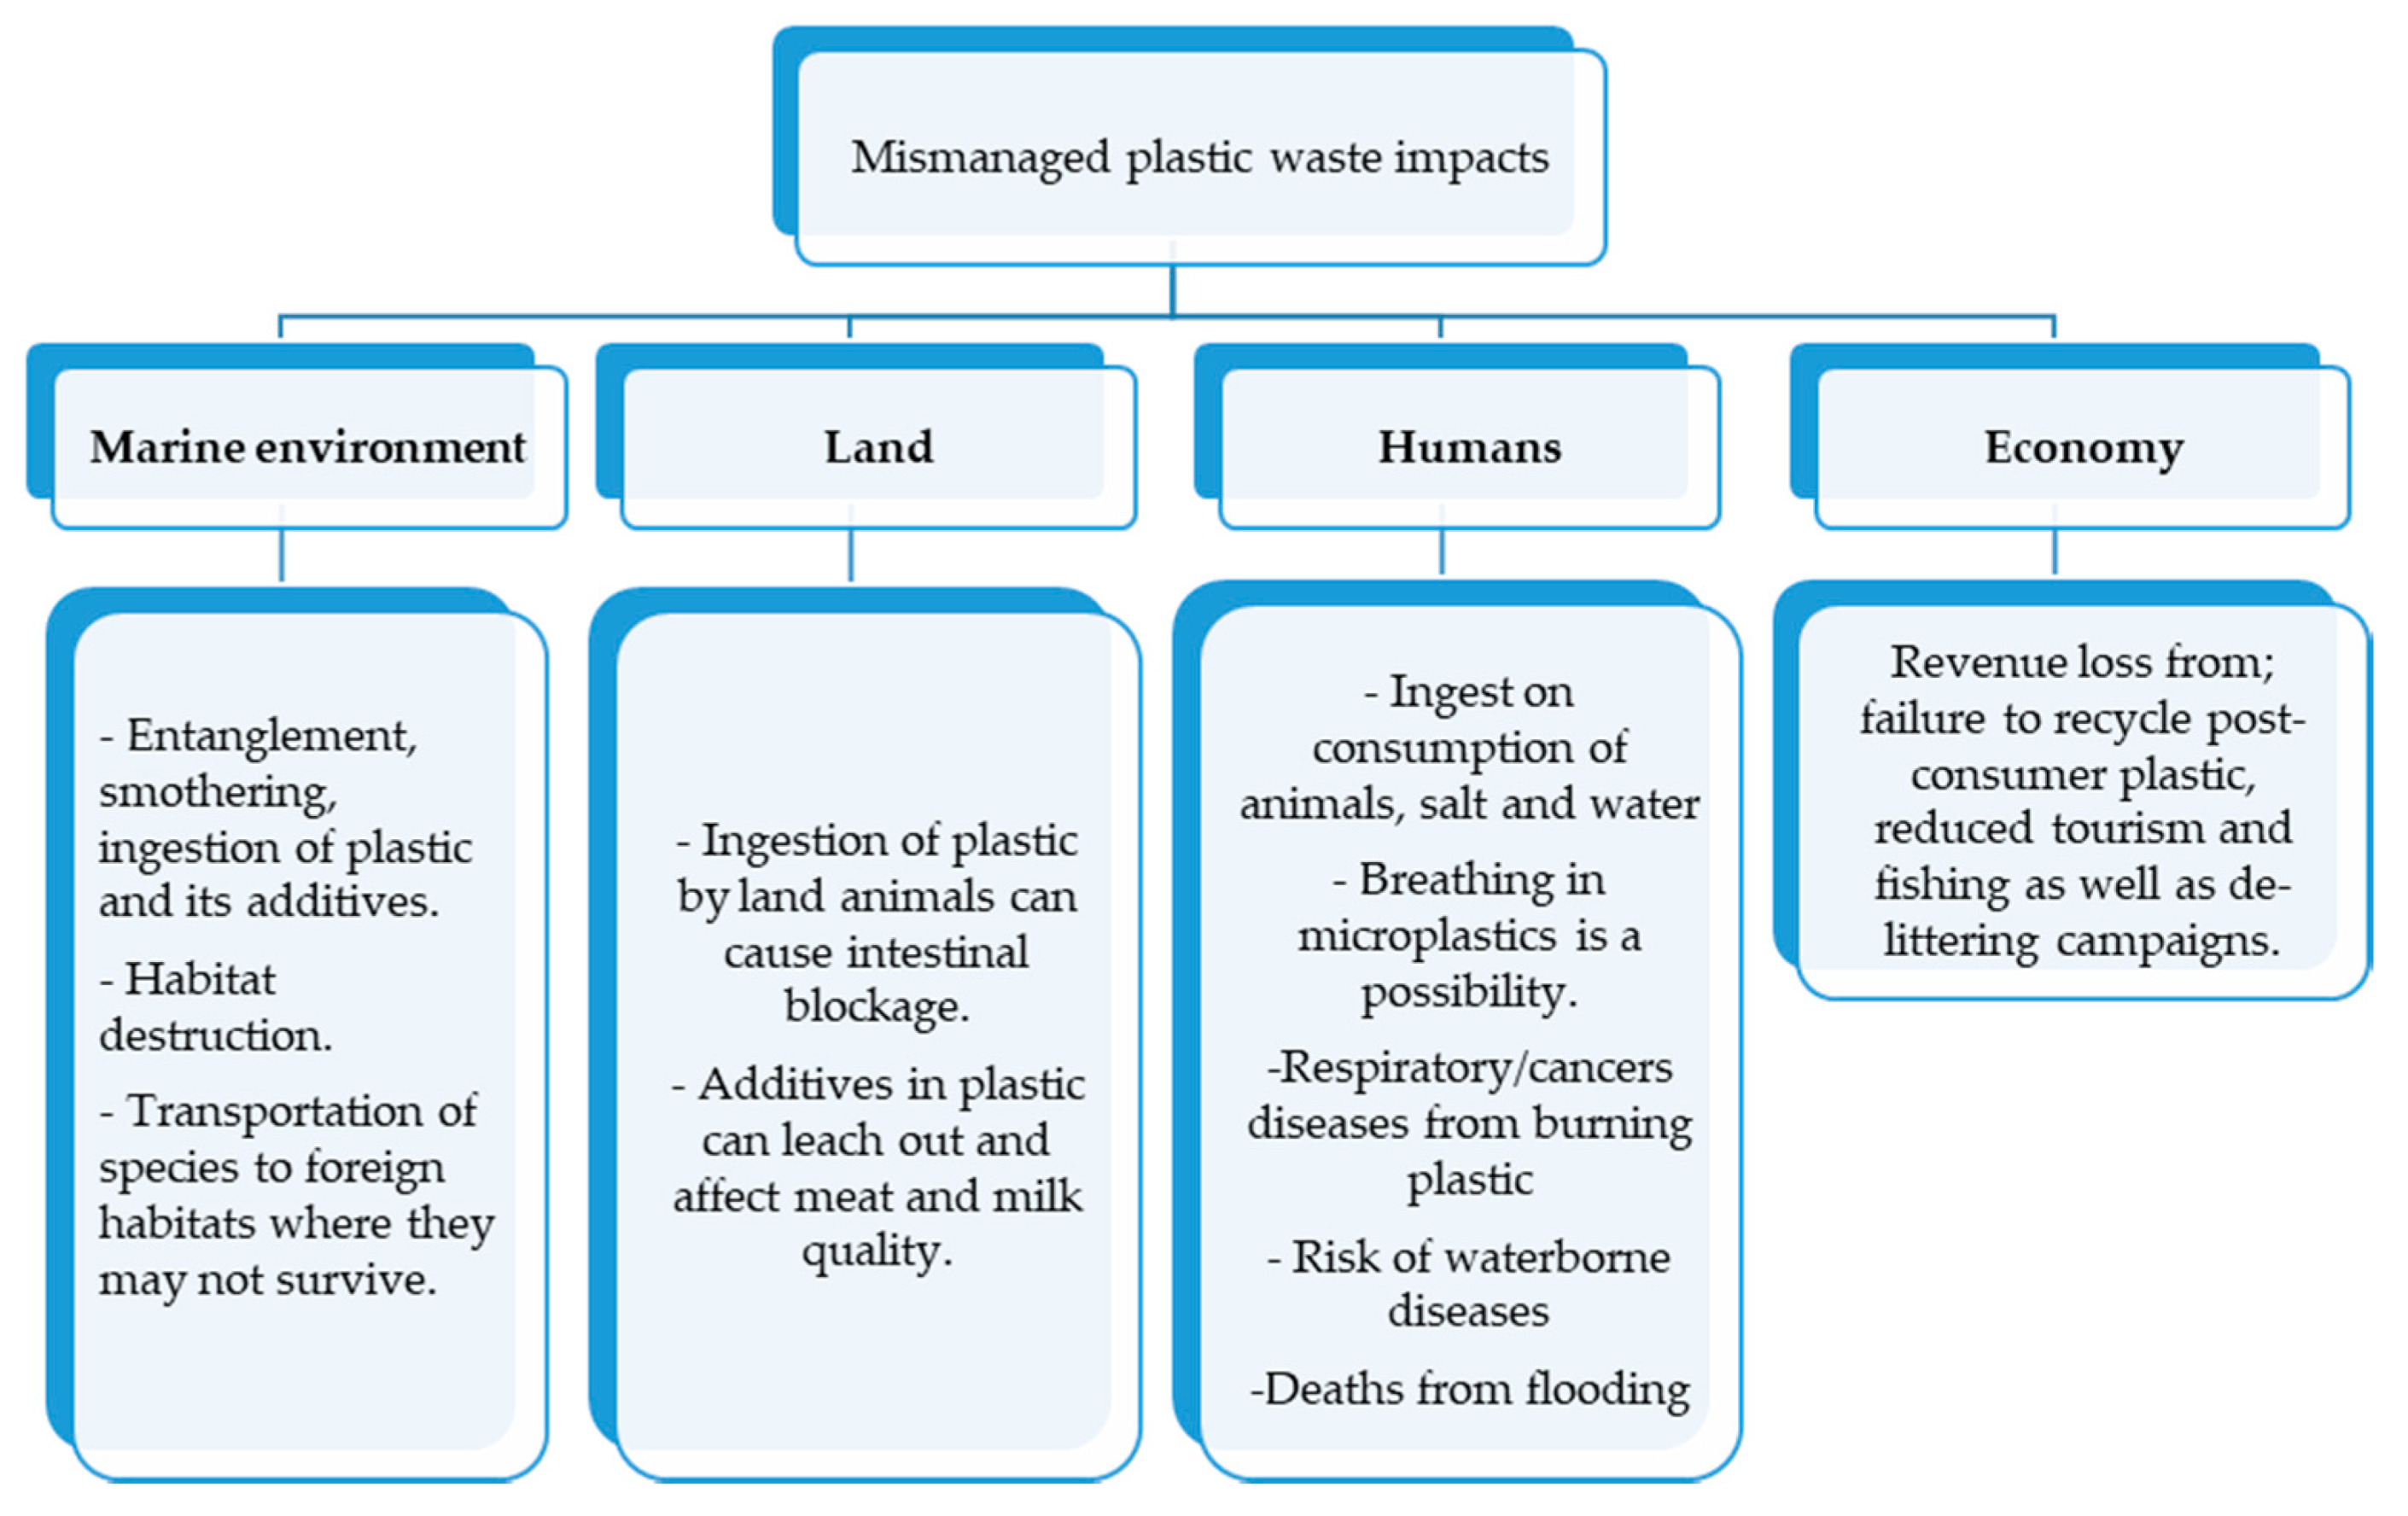
Mismanaged plastic waste is detrimental, not only to flora and fauna, but to humans too. In the marine environment, plastic debris can result in entanglement, which can immobilize an animal and eventually result in its death by starvation or predators, smothering of both marine animals and plants, as well as plastic ingestion, which may also result in death. Harmful additives that are sometimes added to plastics, as well as the toxins absorbed by plastics from water, can either accumulate in or be lethal to marine animals. Destruction of habitats is also possible, as well as transportation of species to areas where they will not survive, see Figure 39.
On land, animals such as cattle, donkeys, sheep, and goats face a similar danger of plastic ingestion, which blocks the gastrointestinal tract leading to death. Chemicals from plastic may also leach out and affect the meat and milk from cattle and possibly goats [25], see Figure 40.
Humans are exposed to plastic through consumption of animals and salt as well as water, Figure 41. Breathing in microplastics has also been discussed by various researchers as another pathway to human exposure [233]. However, the health impacts on humans upon consumption of such chemicals from plastic and microplastics are not yet understood.
In addition, the likelihood of water-borne diseases is increased, as the plastic waste becomes a breeding ground for pathogens, flooding from blocked drainage systems, and respiratory diseases from indiscriminate burning of this waste. Revenue losses are also incurred through failure to recycle post-consumer plastic, reduced tourism, and fishing, as well as de-littering campaigns.

8. Discussion and Conclusions

The statistics on the management of post-consumer plastics are quite concerning, with a meagre 9% of the 8.3 billion tonnes of plastics ever produced having been recycled by 2015. Plastic waste leakage is a symptom of the failure to draw out value from post-consumer plastics in the form of the material itself or energy recovery, see Figure 42 [54].
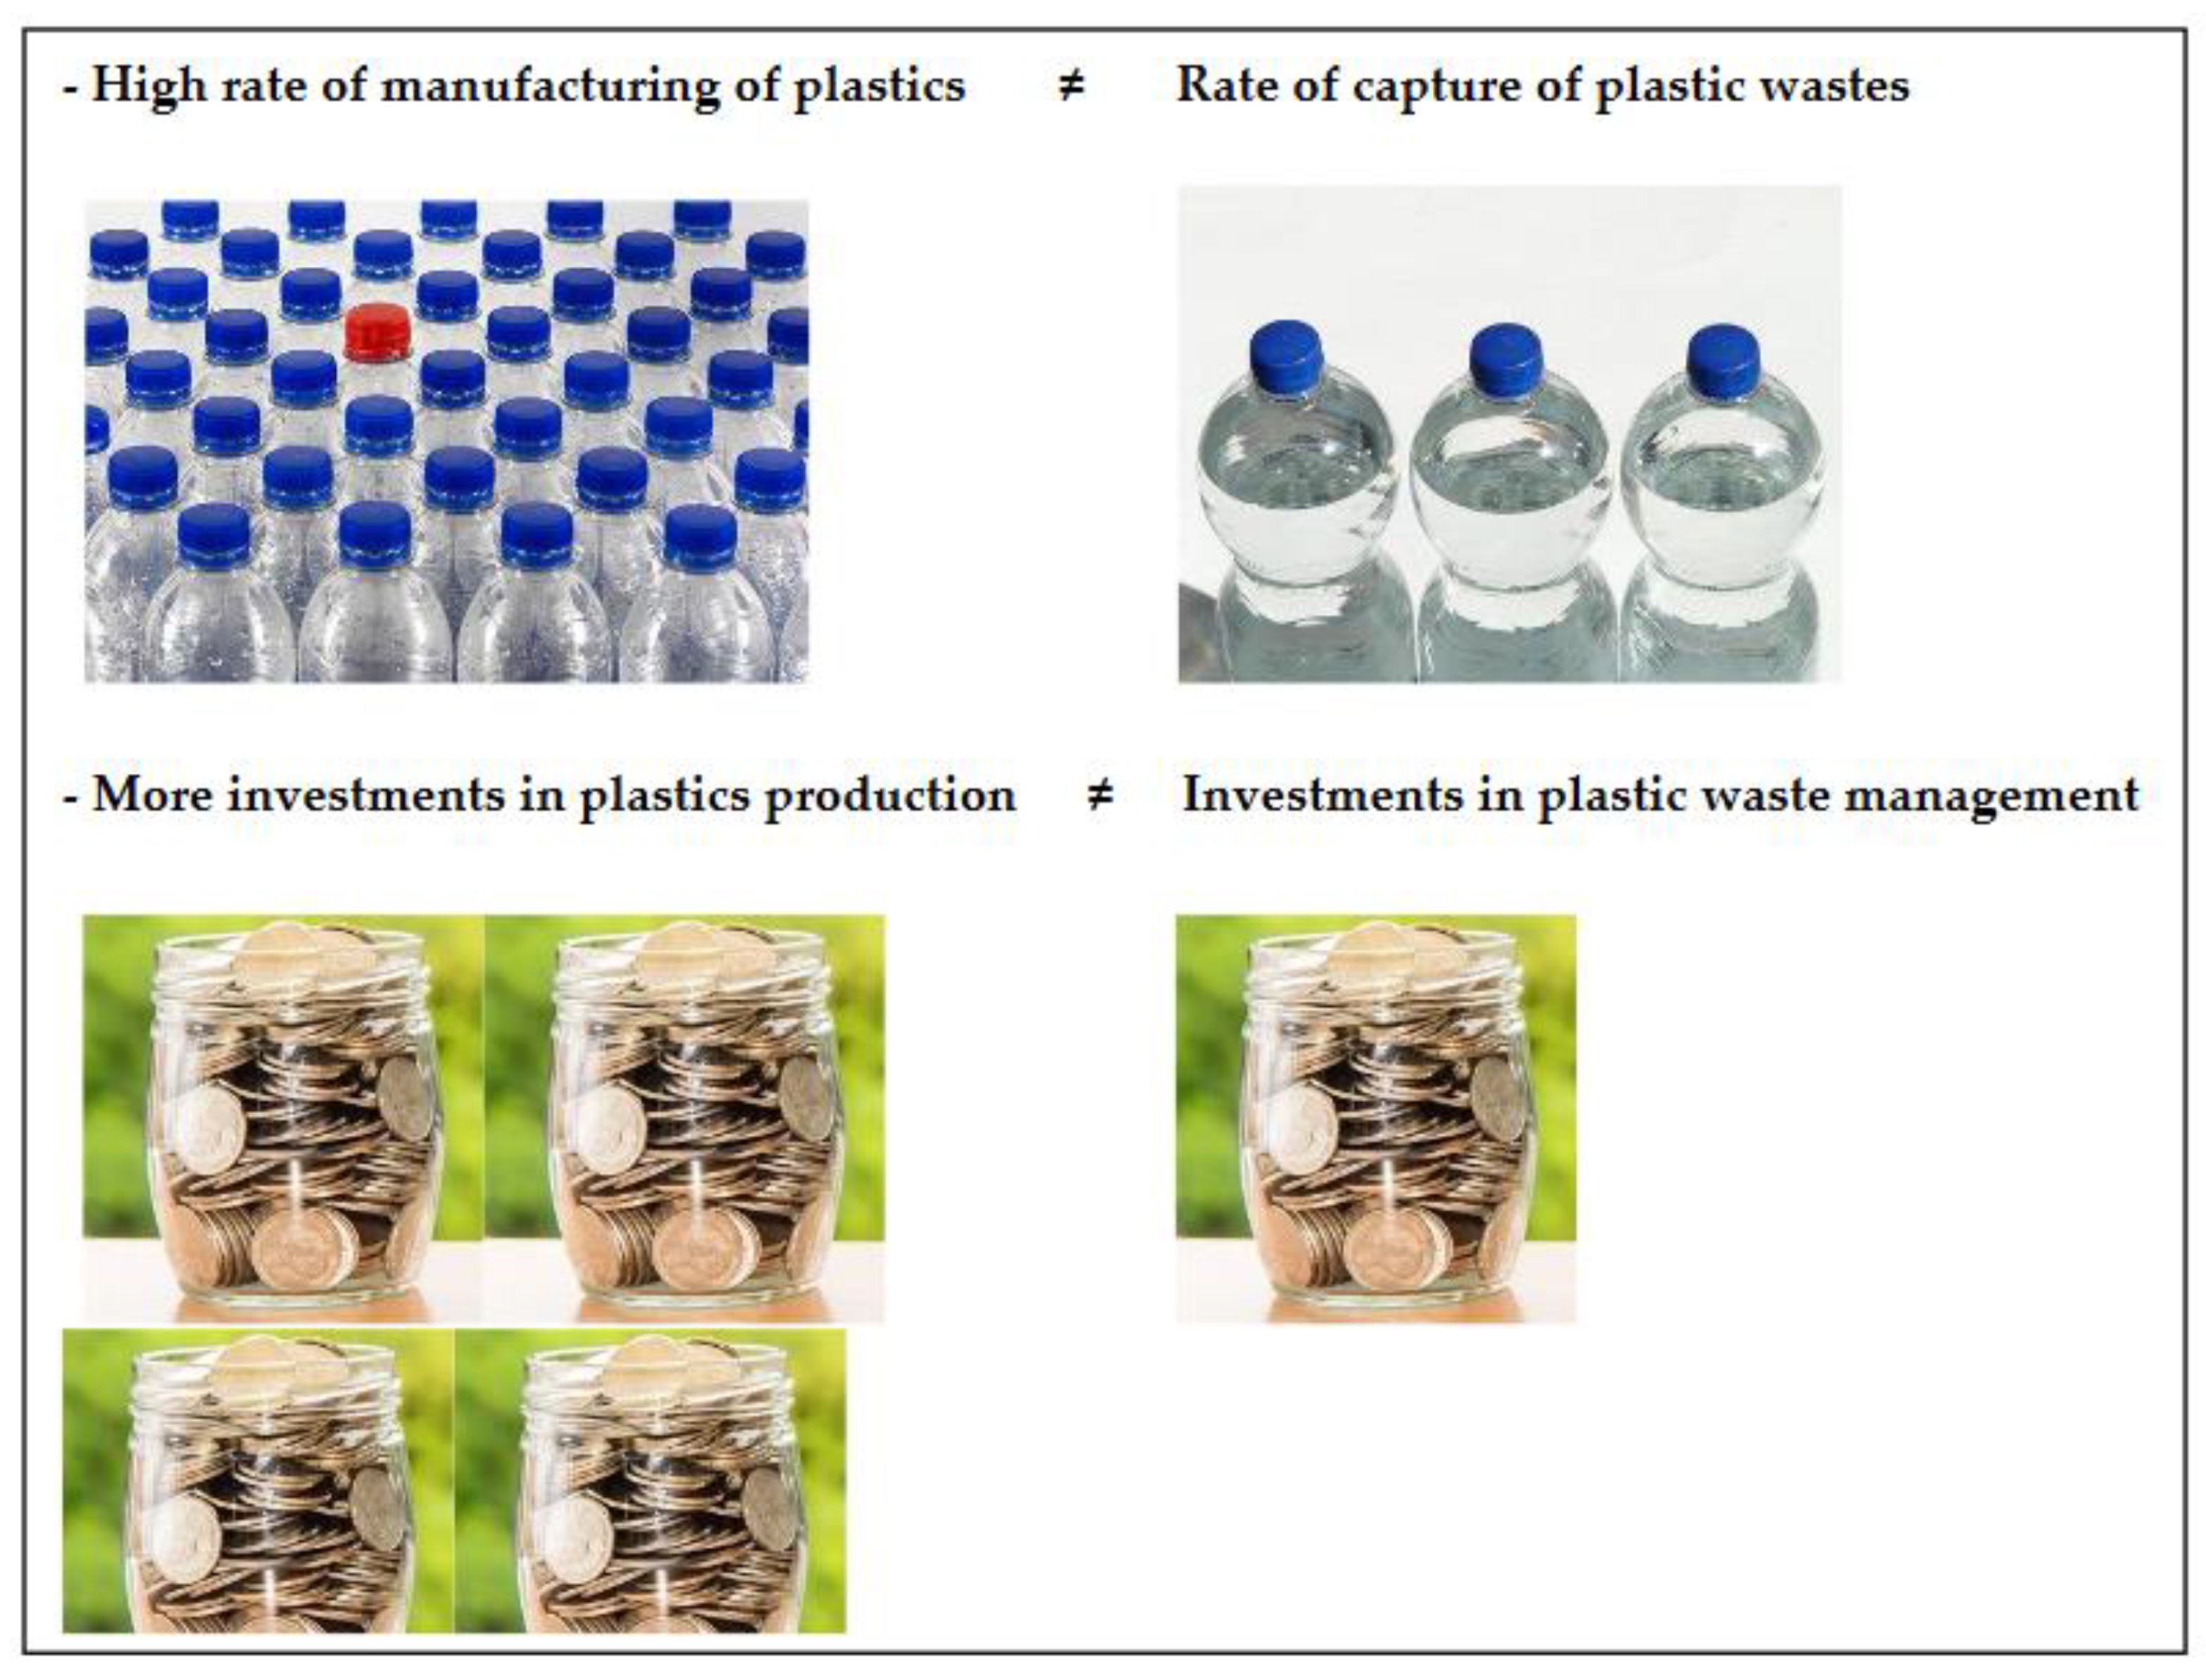
In addition, the rate of manufacturing of these plastics is not on par with the rate of capture of plastic wastes through various means, and this leads to overflows [54]. This further demonstrates that although significant investments are being made in plastic production, less money is spent in managing plastic waste, see Figure 43.
The side effects of poor plastic waste mismanagement have mostly been felt in low- and middle-income countries, where infrastructure is limited, and therefore priority should be given to assist these countries [13]. Currently, in low income countries, only 20% is allocated towards the municipalities’ budget, which results in their failure to provide comprehensive waste collection services or a safe waste disposal infrastructure. In addition, for countries at war, fighting for survival becomes top priority and not plastic waste management, which poses a huge challenge. This, coupled with the absence of trash capture technologies in storm water systems and water/wastewater treatment, littering, and wind transport of lightweight plastic products, among other pathways, aggravates the problem. However, channeling sufficient resources towards waste management is less costly than mitigating plastic waste pollution health and environmental impacts [234]. Furthermore, a fully functioning waste management infrastructure can significantly contribute to the uplifting of such economies through job creation for their citizens. A good example of this is the Solid Waste Collection and Handling (SWACH) cooperative in Pune, India, which was formed by waste pickers. This cooperative signed an agreement with the municipality to carry out door to door collections of waste and recyclables, and to date has provided jobs to over 3000 people. Further, the program has led to a saving of around US$7.9 million per annum by the municipality [13].
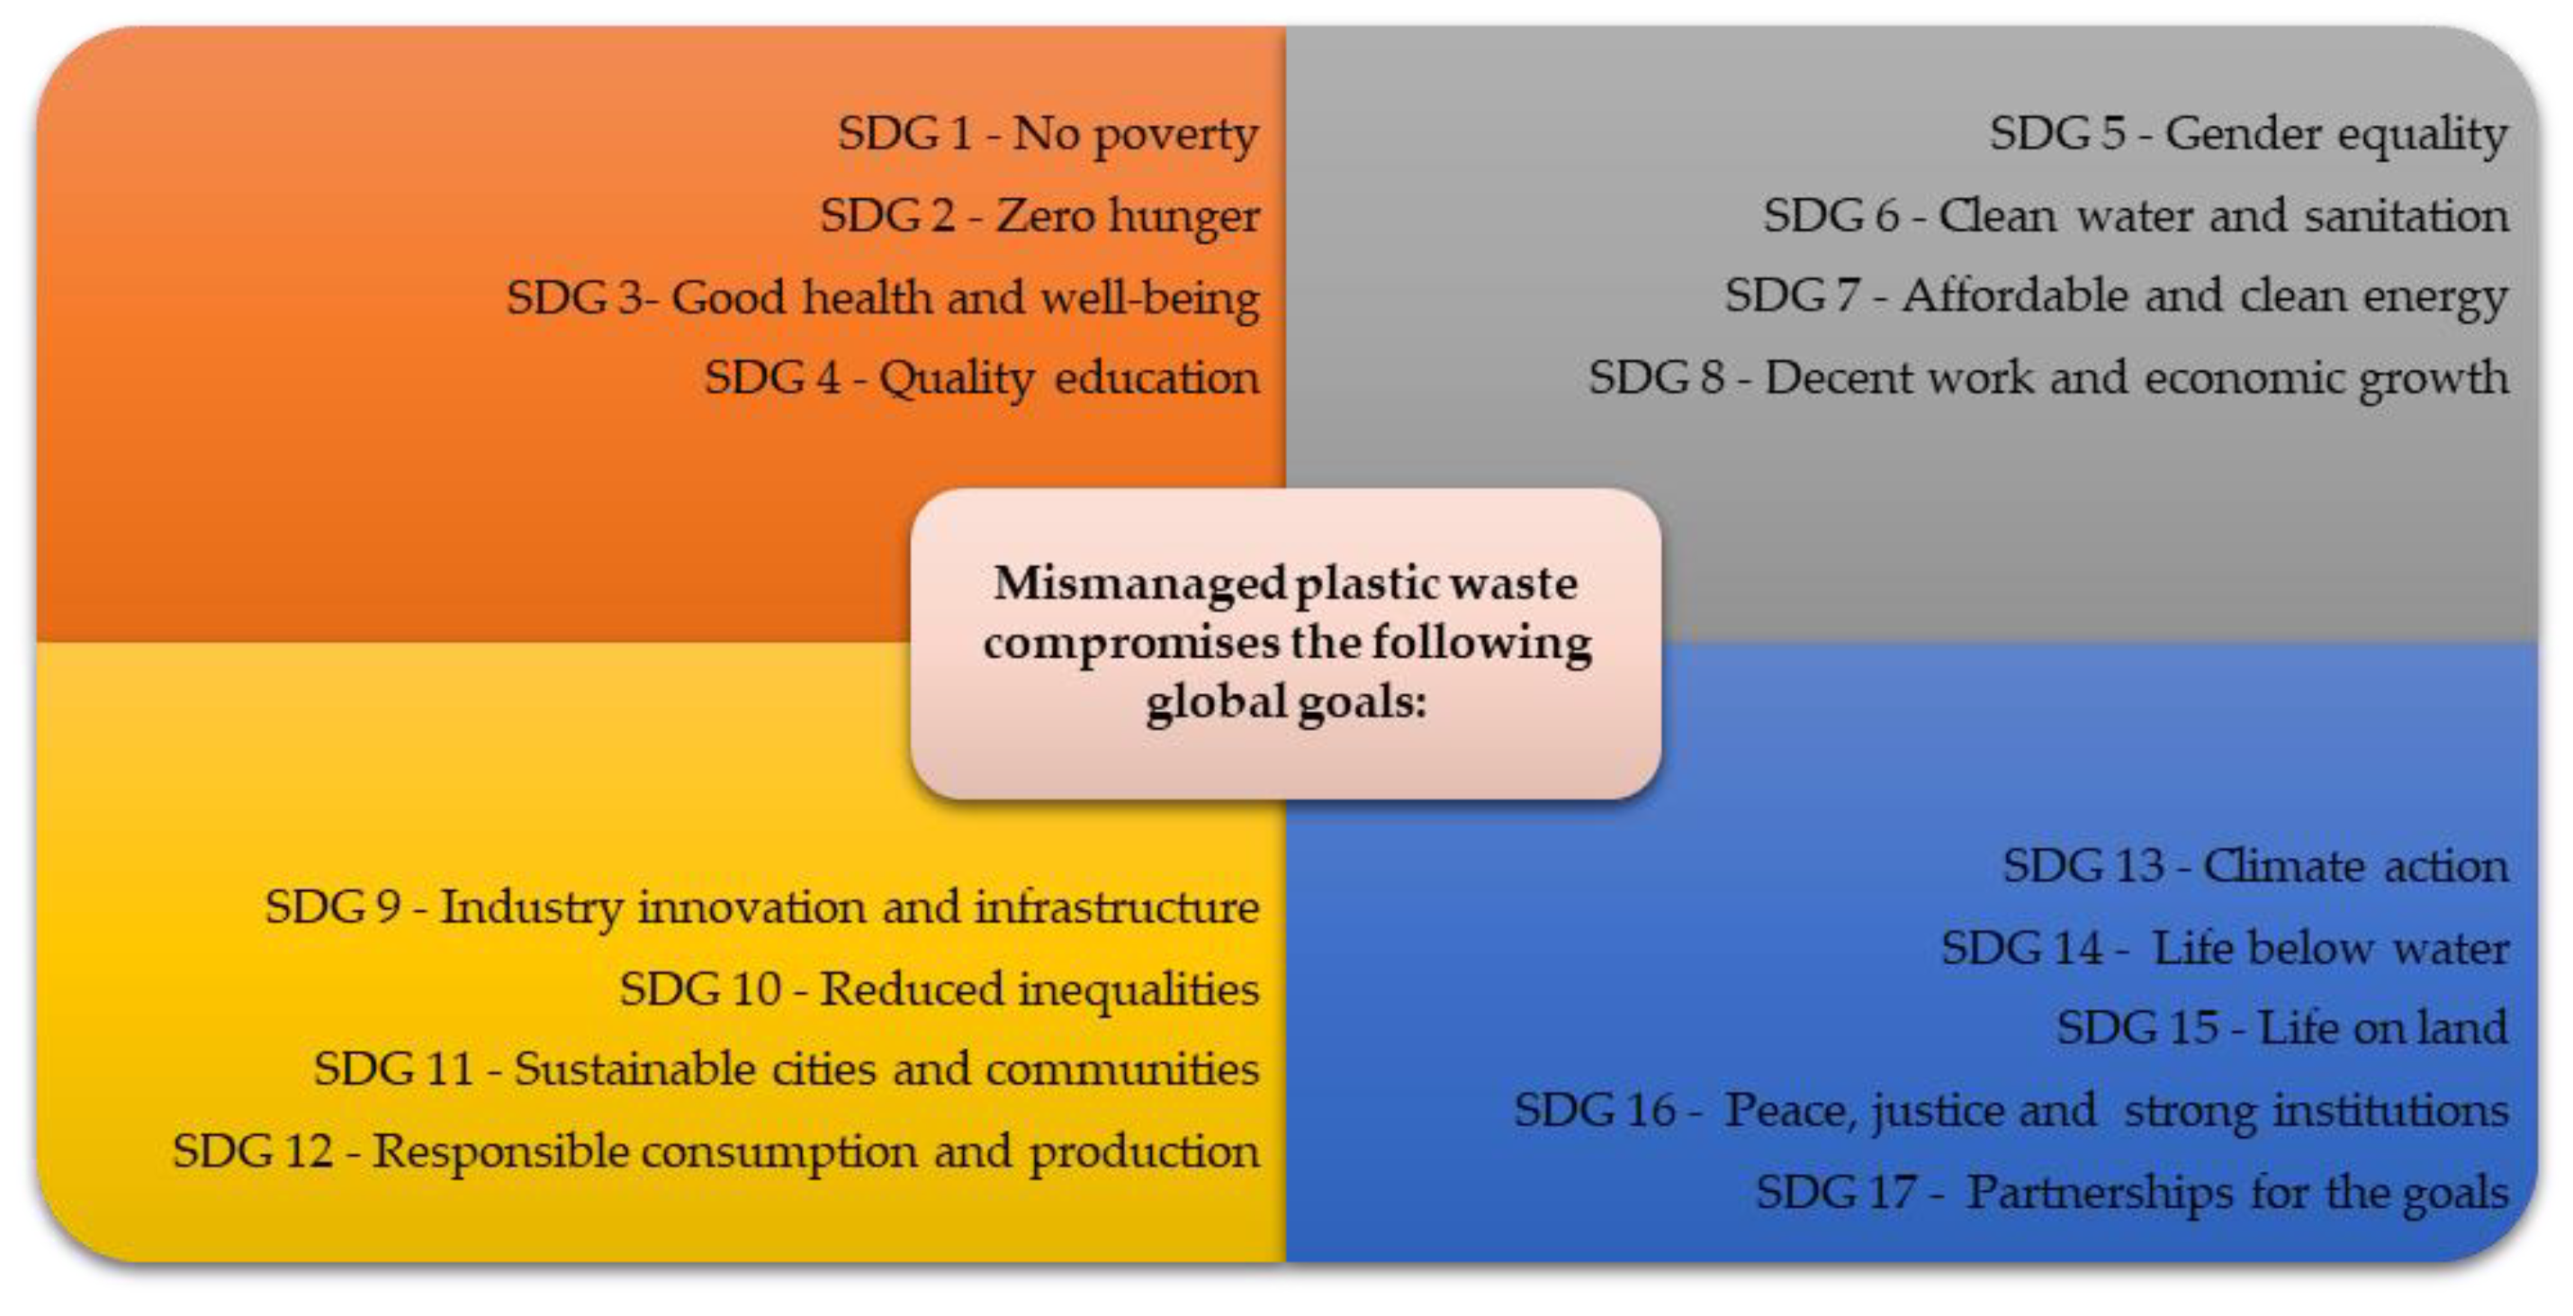
If plastic pollution is not curtailed, then severe socio-economic and environmental impacts will result, as summarized in Figure 44.
In addition, all of the UN’s 17 sustainable development goals, as shown in Figure 45, will also not be achieved [13].

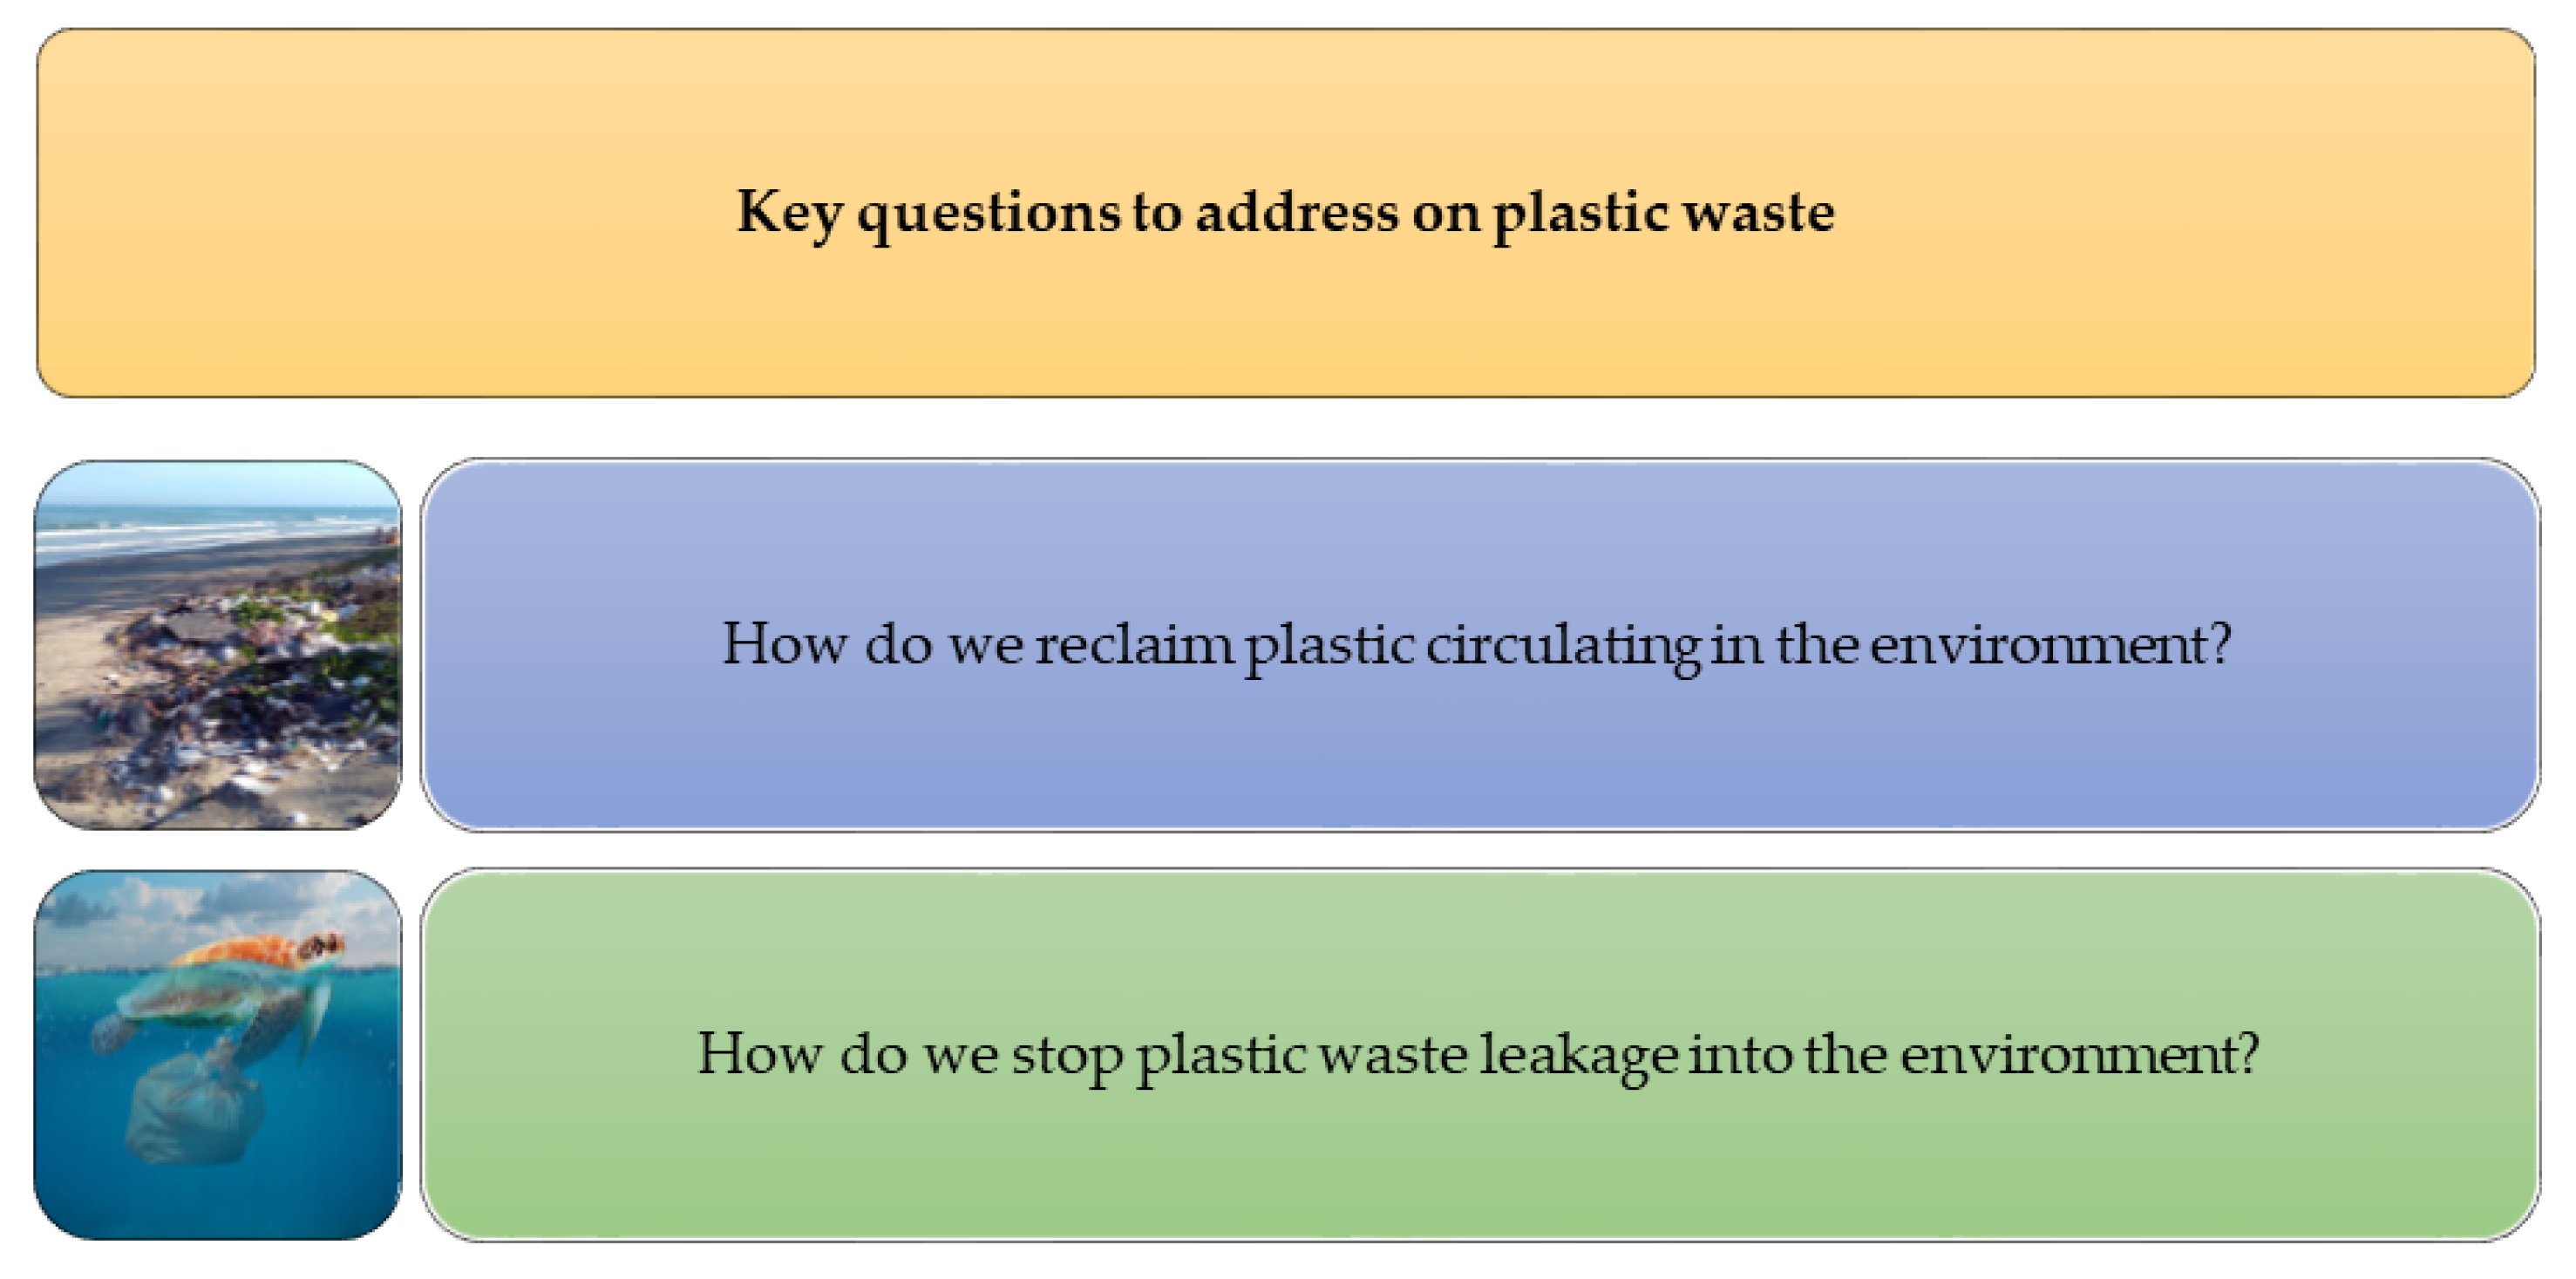
8.1. Key Questions to Address in Plastic Waste Management

Figure 46, shows two key questions that nedd to be addressed in plastic waste management.

8.2. Potential Mitigation Measures and Challenges Expected

Plastic waste management is a complex problem that requires, a confluence of methods/techniques to address it, and some of these measures and associated challenges are discussed below.

8.2.1. Mechanical Recycling

In mechanical recycling, post-consumer plastics are recovered and processed to produce feedstock for various plastic products. This feedstock can also be blended with virgin plastic resin material to make products with a certain percentage of recycled content. Therefore, increasing the quantity of post-consumer plastic that is recycled, beyond the current 9% level, will go a long way in reducing the amount of plastic that is lost to the environment. However, mechanical recycling has its inherent limitations. For example, mechanical recycling does not represent the finality of plastic waste, as plastic cannot be recycled infinitely [6]. Most plastics can only be recycled once or twice before they are either landfilled, incinerated, or downcycled (made into lower value products). The repetitive nature of thermal treatment in the recycling process degrades the polymer structure over time [235]. It is estimated that, globally, a mere 10% of plastic has been recycled more than once, beyond which it is either incinerated, landfilled, or ends up in the environment [6]. In addition, there is also a misconception that mechanical recycling reduces the generation of more plastic waste; however, this can only be true if it reduces the production of new plastics, which is not always the case. For example, in the food packaging industry, virgin products instead of recycled products are used to ensure food safety [76].
Moreover, this type of recycling is hampered significantly by contamination. Contamination could be due to organics such as food waste or from other plastic wastes and is propagated by ineffective separation of waste at source or the lack thereof, as well as unwashed post-consumer plastics [235]. Sometimes there are inadequate markets for recycled material, and, as a result, not all material that is collected will be accepted by the recycling centers. Therefore, demand and quality of recyclables become limiting factors. Furthermore, there are some plastics that are unrecyclable due to design. For example, in South Africa, multi-layered plastic packaging such as detergent bags, dog food bags, and packets for wipes are not recycled and therefore make up a fraction of municipal solid waste that is disposed of in landfills [236,237]. Multi-layered plastics are either made of different plastic types or are bonded to a thin sheet of aluminum foil. Countries such as Belgium, Denmark, Norway, and the United States of America are resorting to incineration for energy in addition to mechanical recycling and landfilling [34,238]. This is in contrast to developing countries like South Africa, where incineration of plastic waste for energy is not practiced [239]. In its National Waste Management Strategy, South Africa emphasizes that mechanical recycling is the preferred method of dealing with post-consumer plastic. However, as energy recovery supersedes landfilling in the country’s waste hierarchy, discussions between the government and various stakeholders on its possible implementation are currently underway [240].

8.2.2. Reclamation of Plastic Waste from Land and Marine Environments

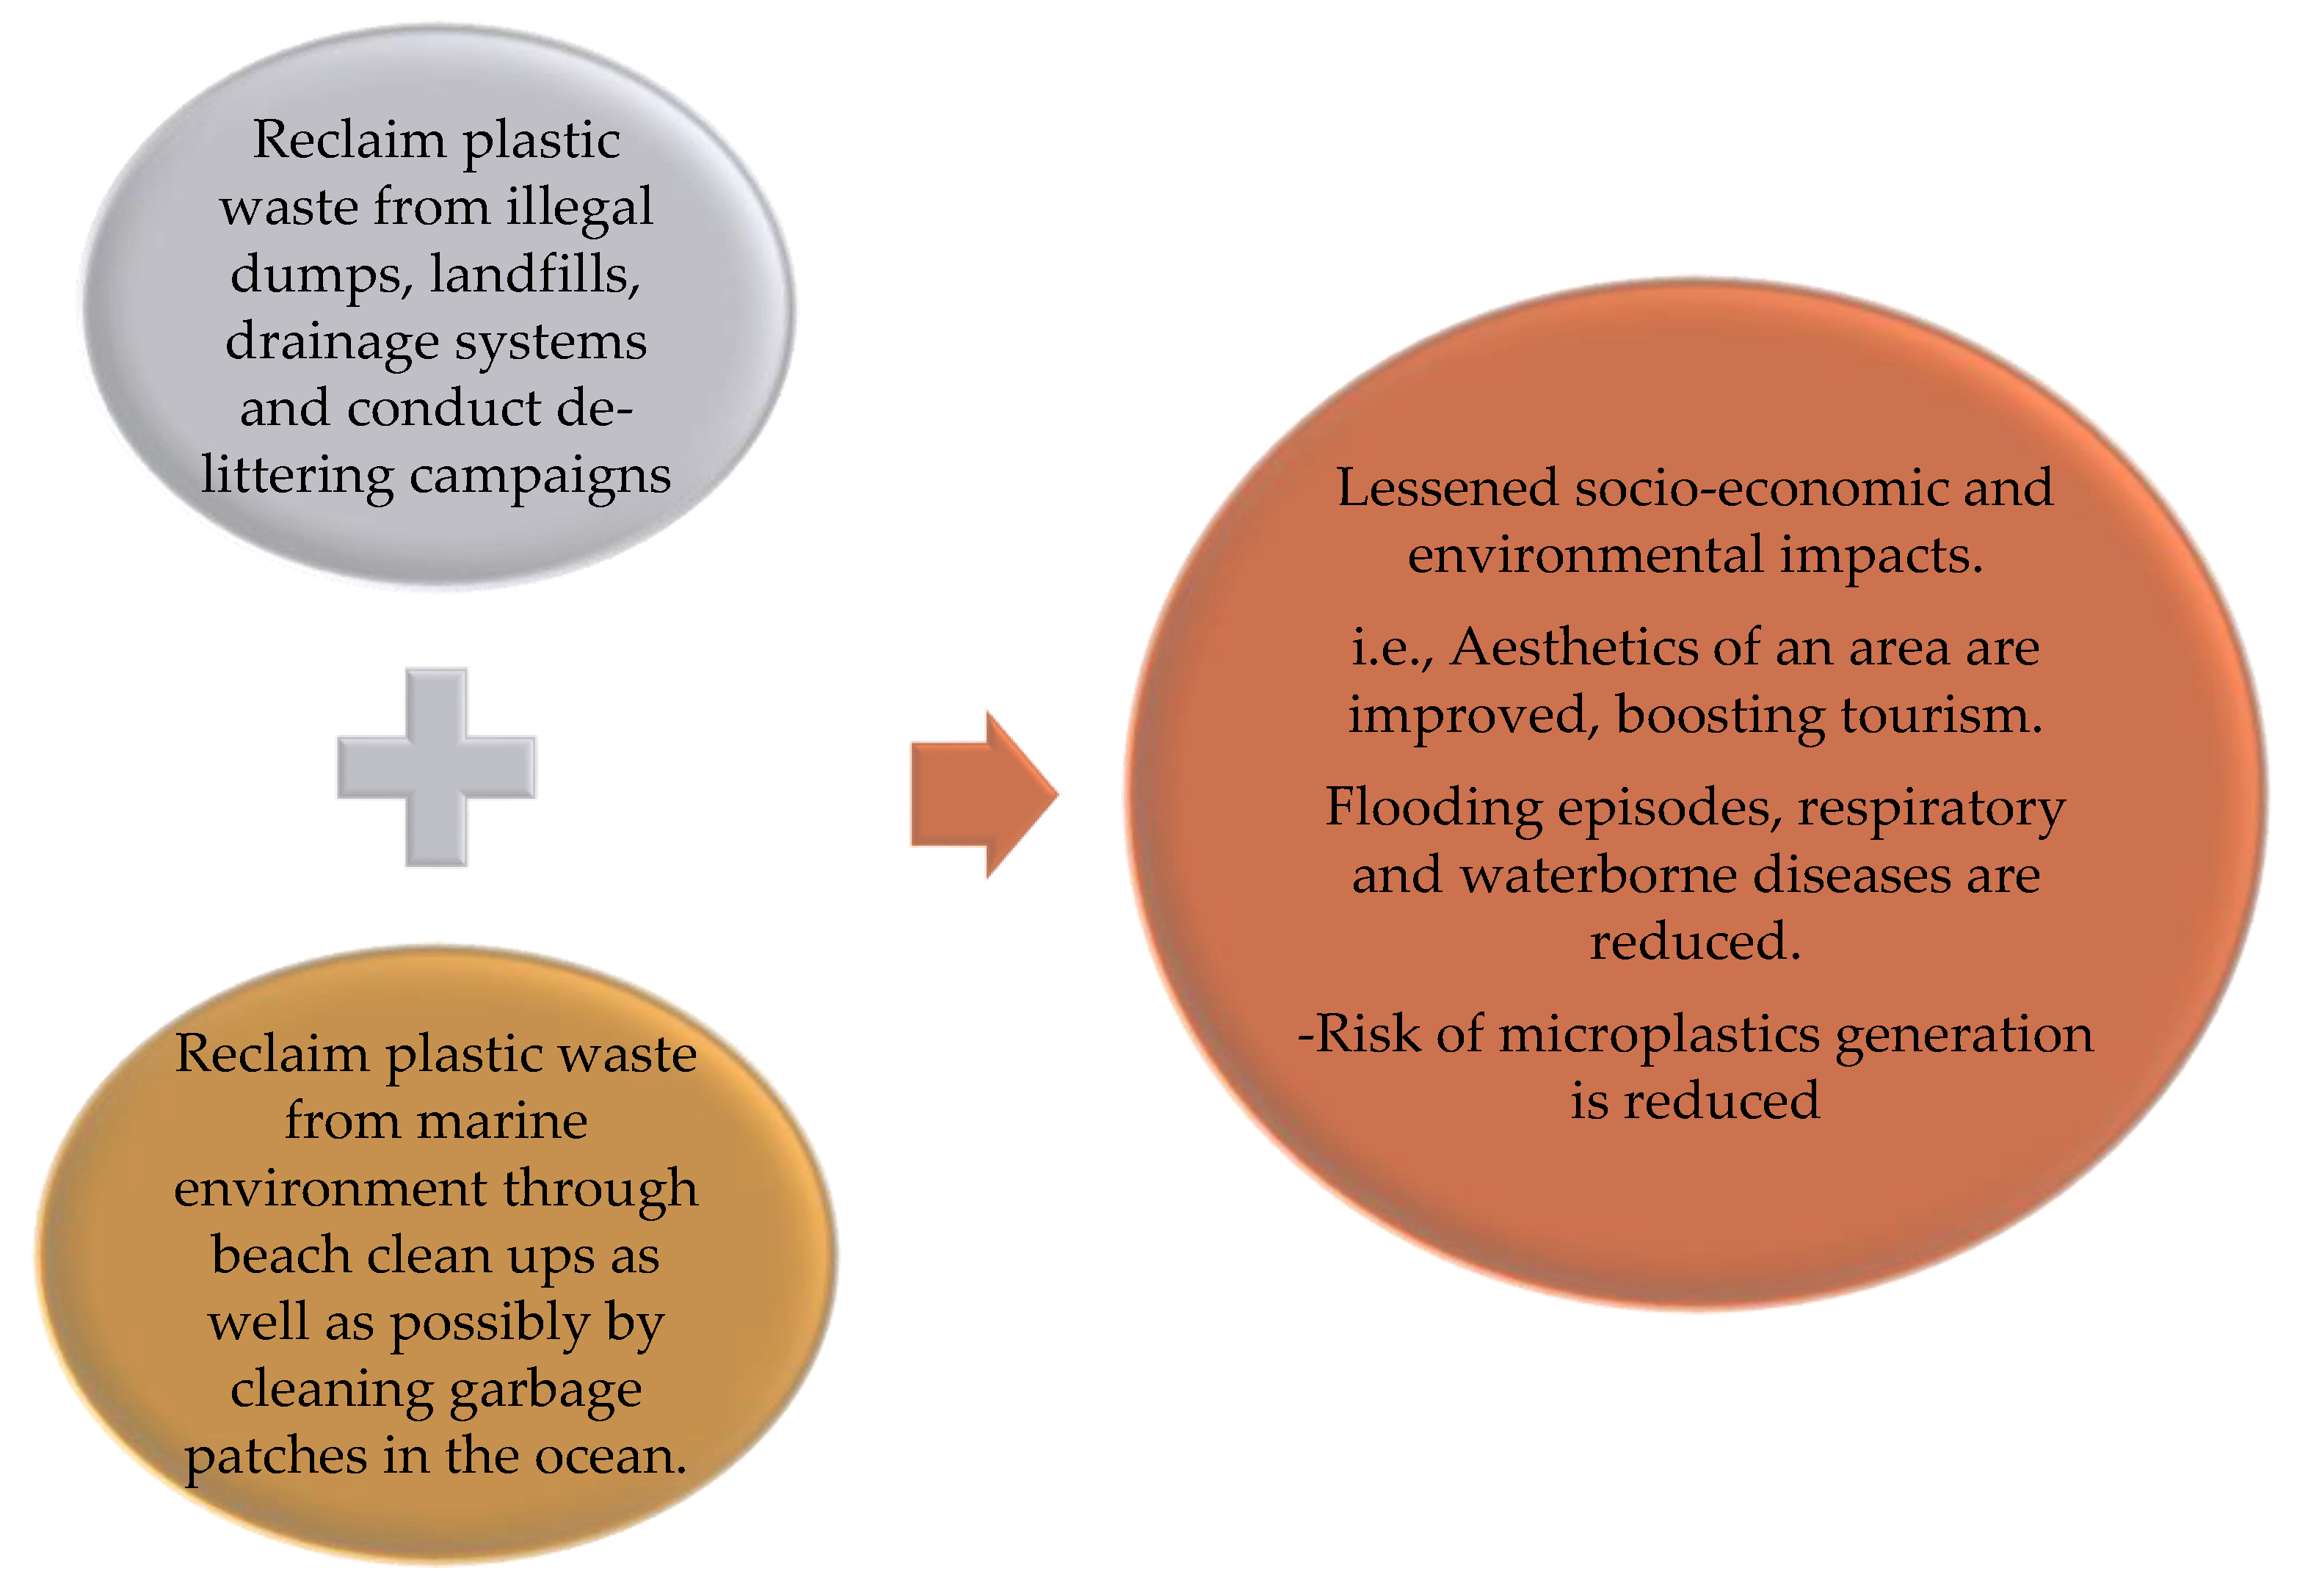
Waste plastics on land could be reclaimed from illegal dumps or landfills when it is deemed safe, as is common practice in South Africa [241], as well as conducting de-littering campaigns. Drainage channels and canals may also harbor significant plastic waste, and therefore these can also be targeted. Evidence of this is the flooding incident in Surulere, Nigeria, which occurred in June 2020 and washed out piles of plastic waste from drainage channels, leaving the suburb submerged in plastic waste [242]. Cleaning of drainage systems will in turn prevent flooding episodes, which are rampant in low income countries. Further, if there is no mismanaged plastic waste, this not only mitigates socio-economic impacts but also reduces the burning associated with respiratory diseases or cancers and incidences of stagnant water such that diseases causing pathogens will not have a breeding ground.
On the other hand, the removal of plastic waste from the oceans presents its own challenges, and attempts to do so have also not been without controversy. The Ocean Clean Up is an organization [243] aiming to clean the Great Pacific Garbage patch using a floating boom [7,243]. After conducting several trials from 2018, the organization is preparing to launch the final ocean clean-up system in 2021 [243]. However, reservations that this system may be harmful to marine ecosystems have also been raised, due to the possibility of the boom entangling or trapping marine species, as well as the likelihood of invasive species being transported with the captured plastic [244]. The Ocean Clean Up has also designed and is currently piloting an equipment known as Interceptors which targets the removal of plastic waste in rivers before it reaches the oceans. Conducting beach clean ups to remove plastic waste that has washed ashore can also help to rid the oceans of some plastic. It is urgent that similar investments as those made in the production of plastic are also made toward post-consumer initiatives such as these. This could possibly lower the impact of traditional plastics on the environment as summarized in Figure 47. The reclamation of plastic wastes from the environment and subsequent processing will require producers to also contribute financially towards these initiatives.
However, it should also be noted that, even if the problems associated with generation of microplastics from plastics were to be solved, there remain other contributors such as tires, dust, road markings, and marine coatings [16].

8.2.3. Banning of Problematic Plastics

Banning of difficult to recycle single use plastics such as mulches, plastic bags, and multilayered plastics, as well as those plastics used in areas where the likelihood of contamination with organic waste is high, has been touted as an option to consider [245]. Several countries are instituting or have bans on plastic bags and other single use items. In Oceania, Australia has a target to ban SUPs by 2025 as outlined in its National Waste Policy Action Plan of 2019 [246], while Papua New Guinea has a ban on non-biodegradable plastic bags [12]. In North America, Canada is also set to follow suit in banning some single use plastics in 2021 [247], while some states in USA, such as California and Maine, have bans on plastic bags and Styrofoam containers, respectively [248]. Styrofoam contains styrene and benzene, which may leach into food and drinks. These chemicals are known carcinogens, and can also damage reproductive organs, the nervous system, and lungs [12]. In Asia, Bangladesh has introduced a ban on plastic bags. At the local level, some states in India and Indonesia have also introduced plastic bag bans [12].
Karnataka (2016) and New Delhi (2017) in India have gone a step further by also banning plastic cutlery [249,250]. Africa, the world’s second most populous continent [251], stands out as the continent that has introduced the most plastic bag bans, by 25 countries in 2018. These countries include Benin, Burkina Faso, Cameroon, Kenya, Rwanda, and South Africa, among others [12]. South Africa banned plastic bags of sizes less than 30 µm, and the country is also aiming to replace all SUPs by 2025 through the South African Plastic Pact initiative. Countries like Zimbabwe have also banned Styrofoam. In Europe, a ban has been proposed on some of the top 10 single use plastics found on its beaches by 2021 in a bid to reduce littering and consequently marine litter from its region. It is estimated that the region will save US$27.45 billion through environment protection and prevent 3.4 million tonnes of carbon dioxide (CO2) equivalent emissions by 2030. The plastics to be banned include earbud and balloon sticks, disposable cutlery, plates, straws, and stirrers. The initiative is also expected to create jobs through the production of alternative materials [252].
However, bans are only as good as their enforcement. For example, despite the plastic bag ban in Bangladesh, single use plastic bags are still being used and mismanaged due to lack of enforcement by responsible authorities [12]. In other instances, cheap imports may still find their way into the country illegally, and when consumers are not given alternative options to use or when these options are unaffordable, this may compound the problem [12].

8.2.4. Feasibility of Replacing Fossil-Based Plastics with Alternatives

As various reviewed LCA studies have shown, there is no hard and fast rule that can be applied to the decision of whether to replace conventional plastics or not. Each material, fossil-based plastic, biodegradable plastic, metal, glass, or wood, has its own environmental impacts [76], and the outcome depends on which factors a study weights the most. What is also clear from these studies is that the more times that an item is reused, the less its environmental impact, regardless of its material of manufacture [59,60,61,62]. This view is also supported by Herberz et al. [253], who highlight that all single use products are unsustainable, because they cannot be used for long periods of time and are discarded after a few minutes upon use. However, it is also not always a guarantee that consumers will reuse their plastic items in a sustainable manner. McLellan [254], highlighted that many people in South Africa were not reusing their plastic bags but instead were using them as bin liners, a practice that takes away the benefit of producing thicker plastic bags, since they end up being landfilled after a single use [254], the reason being, recyclers in the country are not keen on accepting contaminated bags. Therefore, the production of thicker bags and increased price did not result in behavioral change by consumers [254]. However, in Denmark, where incineration is used in waste management, the secondary use of carrier bags as bin bags reportedly lessens the environmental impact of the bag, an indication that available end of life options for single use post-consumer plastic items also have an influence when determining the best performing material. Given the above, in countries where incineration is not part of solid waste management, as is the case in South Africa, using non-biodegradable plastic bags as bin bags may not be beneficial.
Overall, since all alternative materials including plastic are currently using non-renewable energy sources at some point in their life cycle [162] either during raw material acquisition, product manufacturing, or post-consumer use management, efforts should also be channeled into improving energy efficiencies and lowering the environmental impacts of products.

8.3. Bio-Based Biodegradable Plastics Analysis

The ability to use biomass together with carbon dioxide [255] in the manufacture of biodegradable plastics points to the sustainability of this industry. This preserves the limited fossil fuel reserves, which can then be used in applications where their actual value or fundamental properties are utilized rather than being thrown away after one-off use [256], as is the case with small sized food packaging such as chewing gum wrappers and condiment packets that can easily leak through the waste management chain if there is no dedicated collection [54]. The same also applies to earbuds and candy sticks, bread and milk carton seals, straws, and beverage lids. Biodegradable plastics may also reduce the amount of waste to landfill, as they can be composted, which is beneficial, especially in areas where land availability is limited [86]. Some biodegradable plastics such as polylactide play an important role in the biomedical field due to their biocompatibility and biodegradable nature. Biodegradable plastics used in mulching have also been reported to reduce labor costs compared to polyethylene (PE) mulches, as they do not need to be removed after the cropping season and can be ploughed back into the soil. PE mulches also have to be made thicker than is necessary, in order to enable ease of removal after use [76]; this potentially increases their environmental impact if they cannot be reused. Oever et al. [76] also cite Roma [257], who reported in 2016 that if engineering plastics such as acrylonitrile butadiene styrene (ABS) were replaced by bio-based polycarbonate in a Renault Clio’s dashboard part, this would result in a saving of US$0.47 per part. However, these savings may not always hold true, as they are detected by crude oil prices [76]. A summary of the potential benefits of bio-based biodegradable plastics is shown in Figure 48.
Despite the aforementioned potential benefits of biodegradable plastics, a lot of groundwork is required for the benefits of biodegradable plastics to be realized. First, there is a need for proper infrastructure for their sorting, collection, recycling, and composting [258]. The high cost of setting up end of life options for the biodegradable plastics is also reportedly restricting the growth in demand for biodegradable plastics [73]. This infrastructure is critical in order to avoid comingling with fossil-based plastics, which may lead to contamination of existing recycling streams where differentiating between the plastics during sorting is not easy [39]. However, another school of thought mentions that recyclates in general are not 100% pure and contain 10% to 15% of other plastics notwithstanding the sorting method (manual or automated); therefore, contamination with small quantities of biodegradable plastics such as PLA should not hinder the mechanical recycling process [76]. Oever et al. [76] studied the effect of adding 10% PLA in a recyclate blend and found that there were no negative changes to the properties of the recyclate. The impact strength of the blend increased instead. The authors [76] also argue that currently, the amount of PLA on the market is not high enough to result in significant contamination. PLA was also found not to be detrimental to the quality of recycled PET unlike poly vinyl chloride (PVC) [76]. It would also be important to investigate the effects of contamination beyond 10%, as well for other biodegradable plastics, which could be a possibility as the demand for these plastics increases. In addition, without proper collection and end of life options, these plastics may end up in landfills, polluting or persisting in the environment where they end up generating microplastics or posing a risk to marine animals similarly to their traditional counterparts [60,259].
There are also concerns that, similarly to the fossil-based plastics, biodegradable plastics may also contain additives such as stabilizers, antioxidants, and antimicrobial agents meant to enhance their physical properties and make them versatile enough to be used in varied applications. For example, additives can reduce the brittleness of PLA by increasing the elongation at break of PLA to above 10%, while plasticizers also improve its permeability and thermal stability. However, this reportedly may hinder their biodegradability when compared to the pure polymer, and consequently leads to the generation of microplastics as the plastics degrade through other means such as photodegradation. Moreover, these additives, which can be toxic, may leach into the soil and water [260].
There are also concerns that the introduction of biodegradable plastic products may worsen littering behavior if the public are of the view that these plastics have less or no environmental impact than the conventional plastic and in turn neglect to act responsibly for the benefit of the environment and the society around them [84]. Furthermore, the release of greenhouse gases during decomposition of these plastics adds on to the negative environmental impacts [87].
Other drawbacks associated with biodegradable plastics are their high cost of manufacture and less superior properties [84] in some instances when compared to the conventional plastics, and this has also limited their use in high temperature applications and areas where gas barrier or mechanical strength is required [261]. Inferior gas barrier can result in changes in taste and quality of food, including a short shelf life for the packaged products [261]. A summary of limitations of bio-based biodegradable plastics is shown in Figure 49. Studies are underway to investigate potential biodegradable polymer blends that have improved properties. In order to narrow the scope of the review, these have not been reviewed in this paper.

What Will Drive Growth in the Industry?

Aside from the availability of infrastructure, the continued growth of the biodegradable plastics market will depend on the economic sustainability of the manufacturing process, which can improve with an increase in demand [76], availability of raw materials [258] that do not compromise food security in contradiction to the United Nations’ Sustainable Development Goal 2 of “Zero Hunger” or require large tracts of land to meet demand, and crude oil prices [258], because when they are low, manufacturing costs for fossil-based plastics will be competitive over biodegradable plastics manufacture. Competition with food is not expected, because only 5% of the harvested biomass will be consumed at the peak of bioplastics production. Using bio-wastes and inedible plant matter will also reduce this percentage [76]. With regards to land usage, in 2017, bioplastics accounted for 0.016% of the agricultural area available globally, and this is expected to grow slightly to 0.021% in 2022 [262].
We have also seen that in some countries, waste management services for conventional plastics, which is the bare minimum required, are already lacking. Therefore, any benefits attributable to biodegradable plastics will not be realized if they are introduced prematurely. Capacitating waste management systems in low-and middle-income countries will promote growth in the biodegradable plastics industry. This can be achieved through implementing mandatory Extended Producer Responsibility schemes to ensure that companies also contribute towards the management of their products post-consumer use [13].

8.4. Socio-Economic and Environmental Benefits of Fossil-Based Plastics and Effects of Their Ban

There is also no doubt that conventional plastics have brought about significant socio-economic benefits by creating employment for millions of people worldwide. In the transportation sector, due to the lightweight nature of fossil-based plastics, the carbon footprint of these products during transportation is low compared to alternative bulkier materials such as glass, as fewer cars are required to transport them [263]. Furthermore, these plastics have resulted in the growth of the clean energy sector where wind turbines and solar panels are utilized. In the health sector, fossil- based plastics have proved vital in saving countless lives through their use in the manufacture of drug delivery devices such as syringes or drips, artificial organs, and mosquito nets [54]. In light of this, it is clear that and abrupt ban of some traditional plastics, albeit seemingly rational, could result in previously unforeseen negative outcomes [264].
First, job losses in the plastics industry may occur [265]. Ross et al. [60] found that single use plastic bags resulted in more jobs compared to reusable variants, which require fewer bags to be manufactured. Other potential consequences include higher environmental impacts of alternative materials such as paper or cotton unless they are reused many times [60,62,63], cross contamination of food with bacteria such as Escherichia coli and other pathogens in the case of replacing single use plastic bags with reusable bags [266], and increased food waste [267], which is currently at 30% for cereals, 40–50% for root crops, fruits, and vegetables, 20% for oilseeds, 30% for meat and dairy, and 30% for fish [268].
Reductions in sales have been observed in areas where bans are effected, especially in the case of plastic bags, with shoppers opting to buy in other regions [264] or limiting their purchases to whatever can be accommodated by reusable bags [265]. In addition, some plastics may be cheaper to manufacture compared to alternatives such as aluminum or paper, and this not only increases the production costs incurred by businesses, but also makes the product more expensive for consumers [264].
It is therefore critical that such information is communicated to policy makers when they draft or make changes to existing conventions, commitments, and declarations [269,270,271,272,273,274,275,276,277,278,279,280,281,282,283,284,285,286,287,288], which are outlined in greater detail in Table 7.

8.5. Key Lessons for South Africa’s Bioplastics Manufacturing Project

This review article has shown that there is a wide choice of potential renewable feedstocks that can be used. Local shops such as Pick n Pay have introduced carrier bags made of maize and potato starch that biodegrade within three to six months under home composting conditions [289]. However, in South Africa, composting industries and waste management services for post-consumer biodegradable plastics are limited; as a result, such plastics are not attractive for waste pickers. This results in biodegradable plastics either being disposed of in landfills as part of MSW or being mismanaged [290]. For this project to be successful, the following is recommended:
  • Setting up of adequate infrastructure for these plastics to avoid leakages is critical.
  • Labels or pictograms indicating home or industrial composting suitability should be put on products in order to avoid consumer confusion [76].
  • Provision for compost bins or gardens to facilitate home composting as well as areas of application for the generated compost [291].
  • Both the consumers and composters should be educated about these materials and how to prevent contamination of the compost by non-biodegradable material.
  • Trials should also be done on all products before introduction onto the market to ensure that they do not only partially decompose under the stated conditions [76].
  • Biodegradable plastic blends should also be evaluated.
This review article has looked at the global plastic landscape to date and the state of the art of some bio-based biodegradable plastics that have been studied with the aim of gaining a broader understanding of the subject matter and proposing solutions, identifying areas for further research, as well as contributing toward South Africa’s nascent bioplastics manufacturing project. The world is facing a plastic waste problem, with low-and middle-income countries more hard-hit than high-income countries. However, once plastic waste is in the marine environment, its origins may not matter, as it is transported by ocean currents to other places, causing uncountable devastation along the way. Therefore, the fight against plastic pollution requires a concerted effort between governments from all countries and stakeholders such as plastic resin manufacturers, convertors, and product manufacturing companies through funding provision in order to strengthen waste management infrastructure and services in low- and middle-income countries where the bulk of mismanaged plastic waste has been generated. Furthermore, the investments made in plastics production currently outweigh those in plastic waste management, and this has led to a reduced rate of capture of plastic wastes. Increasing recycling rates, reclaiming plastic waste from the environment, implementing bans, or replacing problematic plastics are some of the ways that are being used to lessen the negative impacts of fossil-based plastics. However, each one has its own challenges, which need to be taken into account before implementation. For example, replacing traditional plastics with alternatives in the absence of country-specific cradle-to-grave life cycle assessments may result in unintended consequences. With regards to biodegradable plastics, although they have shortcomings, they also have advantages that can be explored so that they complement their fossil-based counterparts. Lastly, EPR and DPR schemes can be implemented in plastic waste management as add-ons, as they have been shown to be effective in reducing landfilling and littering, improving recycling rates, job creation, and expansion of waste collection services.

9. Directions for Future Research

While previous studies have focused on a single or a few of the aspects that have been covered within the scope of this paper, our study distinguishes itself in that it is an integrated review looking at many crucial aspects in plastic waste management, thereby resulting in an encyclopedia that other researchers can build on. Although the list of references used in our study is not exhaustive, the following gaps have been identified:
  • No data on bioplastics production and consumption patterns in Africa could be found during the review. Without properly documented African statistical data, a clear picture cannot be ascertained for the continent.
  • Research on bio-based polycarbonates including end of life options and their properties when compared to their traditional counterparts is still limited.
  • More research on the negative impacts of reclaiming plastic waste from the marine environment is also required.
  • Research pertaining to presence of additives in biodegradable plastics is also lacking.
  • More peer-reviewed research is required on the socio-economic and environmental impacts of replacing fossil-based plastics as well as the effectiveness of plastic bans.
  • Africa-based LCA studies on plastic waste incineration for energy are lacking.

Author Contributions

Z.S.M. conceptualized the work and undertook a review study under the supervision of E.M. and M.B. and guidance of T.A.M. and T.N. Z.S.M. did the write-up, with E.M., T.N., and T.A.M. giving guidance regarding the methodology and discussion of findings. Z.S.M. prepared the original draft, with E.M., T.N., and T.A.M. reviewing, critiquing, and editing the script until it was ready for submission. E.M. and M.B. assisted with the acquisition of research funding. All authors have read and agreed to the published version of the manuscript.

Funding

This research was funded by the University of Johannesburg and Botswana International University of Science and Technology.

Acknowledgments

The authors are grateful to the University of Johannesburg and the Botswana International University of Science and Technology for the financial and technical support.

Conflicts of Interest

No conflict of interest declared.

References

  1. Thompson, R.C.; Swan, S.H.; Moore, C.J.; Vom Saal, F.S. Our plastic age. Phil. Trans. R. Soc. B 2009, 364, 1973–1976. [Google Scholar] [CrossRef] [PubMed] [Green Version]
  2. American Chemical Society. Leo Hendrick Baekeland and the Invention of Bakelite. Available online: https://www.acs.org/content/acs/en/education/whatischemistry/landmarks/bakelite.html (accessed on 21 September 2020).
  3. Gowariker, V.R.; Viswanathan, N.V.; Sreedhar, J. Polymer Science, 1st ed.; New Age International: New Delhi, India, 2005; pp. 9–14. [Google Scholar]
  4. Britannica. Available online: https://www.britannica.com/science/polymerization (accessed on 5 April 2020).
  5. Mazhandu, Z.S.; Muzenda, E. Global Plastic Waste Pollution Challenges and Management. In Proceedings of the 7th International Renewable and Sustainable Energy Conference, Agadir, Morocco, 27–30 November 2019. [Google Scholar]
  6. Geyer, R.; Jambeck, J.R.; Law, K.L. Production, use, and fate of all plastics ever made. Sci. Adv. 2017, 3, e1700782. [Google Scholar] [CrossRef] [PubMed] [Green Version]
  7. Ritchie, H.; Roser, M. Plastic Pollution. Available online: https://ourworldindata.org/plastic-pollution (accessed on 1 April 2020).
  8. Andrady, A.L.; Neal, M.A. Applications and societal benefits of plastics. Phil. Trans. R. Soc. B 2009, 364, 1977–1984. [Google Scholar] [CrossRef]
  9. Tuladhar, R.; Yin, S. Sustainability of using recycled plastic fiber in concrete. In Use of Recycled Plastics in Eco-efficient Concrete; Woodhead Publishing Series in Civil and Structural Engineering; Elsevier BV: Amsterdam, The Netherlands, 2019; pp. 441–460. [Google Scholar]
  10. Ellen MacArthur Foundation. The New Plastics Economy: Rethinking the Future of Plastics and Catalysing Action. Available online: https://www.ellenmacarthurfoundation.org/assets/downloads/publications/PEC-Hybrid_English_22-11-17_Digital.pdf (accessed on 1 July 2020).
  11. Zheng, J.; Suh, S. Strategies to reduce the global carbon footprint of plastics. Nat. Clim. Chang. 2019, 9, 374–378. [Google Scholar] [CrossRef]
  12. United Nations Environment Programme. UNEP. Single-Use Plastics: A Roadmap for Sustainability. Available online: https://www.unenvironment.org/resources/report/single-use-plastics-roadmap-sustainability (accessed on 5 June 2018).
  13. Williams, M.; Gower, R.; Green, J.; Whitebread, E.; Lenkiewicz, Z.; Schröder, P.; Fauna and Flora International (FFI); Waste Aid and The Institute of Development Studies (IDS). No Time to Waste. Tackling the Plastic Pollution Crisis before It’s Too Late. Available online: https://www.ids.ac.uk/publications/no-time-to-waste-tackling-the-plastic-pollution-crisis-before-its-too-late/ (accessed on 14 May 2019).
  14. Lusher, A.L.; Hernandez-Milian, G.; O’Brien, J.; Berrow, S.; O’Connor, I.; Officer, R. Microplastic and macroplastic ingestion by a deep diving, oceanic cetacean: The True’s beaked whale Mesoplodon mirus. Environ. Pollut. 2015, 199, 185–191. [Google Scholar] [CrossRef]
  15. United Nations Environment Programme. The Missing Science: Could Our Addiction to Plastic Be Poisoning Us? Available online: https://www.unenvironment.org/news-and-stories/story/missing-science-could-our-addiction-plastic-be-poisoning-us (accessed on 4 June 2018).
  16. Armstrong, M.; Statista. Where Do the Oceans’ Microplastics Come From? Available online: https://0-www-statista-com.ujlink.uj.ac.za/chart/17957/where-the-oceans-microplastics-come-from/ (accessed on 10 May 2019).
  17. Statista. Global Species with Records of Marine Debris Ingestion. 2015. Available online: https://www.statista.com/statistics/596991/share-of-species-with-with-records-of-marine-debris-ingestion/ (accessed on 16 August 2016).
  18. De Stephanis, R.; Giménez, J.; Carpinelli, E.; Gutierrez-Exposito, C.; Cañadas, A. As main meal for sperm whales: Plastics debris. Mar. Pollut. Bull. 2013, 69, 206–214. [Google Scholar] [CrossRef] [Green Version]
  19. Statista. Global Animal Species with Records of Marine Debris Entanglement 2015. Available online: https://www.statista.com/statistics/596960/share-of-species-with-with-records-of-entanglement-in-marine-debris/ (accessed on 16 August 2016).
  20. Facts and Figures on Marine Pollution. Available online: http://www.unesco.org/new/en/natural-sciences/ioc-oceans/focus-areas/rio-20-ocean/blueprint-for-the-future-we-want/marine-pollution/facts-and-figures-on-marine-pollution/ (accessed on 1 April 2020).
  21. Mato, Y.; Isobe, T.; Takada, H.; Kanehiro, H.; Ohtake, C.; Kaminuma, T. Plastic resin pellets as a transport medium for toxic chemicals in the marine environment. Environ. Sci. Technol. 2001, 35, 318–324. [Google Scholar] [CrossRef]
  22. Tanaka, K.; Takada, H.; Yamashita, R.; Mizukawa, K.; Fukuwaka, M.A.; Watanuki, Y. Accumulation of plastic-derived chemicals in tissues of seabirds ingesting marine plastics. Mar. Pollut. Bull. 2013, 69, 219–222. [Google Scholar] [CrossRef]
  23. Gallo, F.; Fossi, C.; Weber, R.; Santillo, D.; Sousa, J.; Ingram, I.; Nadal, A.; Romano, D. Marine litter plastics and microplastics and their toxic chemicals components: The need for urgent preventive measures. Environ. Sci. Eur. 2018, 30, 13. [Google Scholar] [CrossRef] [PubMed]
  24. Smith, M.; Love, D.C.; Rochman, C.M.; Neff, R.A. Microplastics in seafood and the implications for human health. Curr. Environ. Health Rep. 2018, 5, 375–386. [Google Scholar] [CrossRef] [Green Version]
  25. Priyanka, M.; Dey, S. Ruminal impaction due to plastic materials—An increasing threat to ruminants and its impact on human health in developing countries. Vet. World 2018, 11, 1307–1315. [Google Scholar] [CrossRef] [Green Version]
  26. United Nations Environment Programme. Valuing Plastic: The Business Case for Measuring, Managing and Disclosing Plastic Use in the Consumer Goods Industry. 2014. Available online: http://wedocs.unep.org/handle/20.500.11822/9238 (accessed on 3 April 2020).
  27. Mazhandu, Z.; Muzenda, E.; Belaid, M.; Mamvura, T. Potential Impact of the Covid-19 Pandemic on Plastic Medical Waste Management in South Africa. S. Afr. J. Sci. 2020. [Google Scholar]
  28. Alabi, O.A.; Ologbonjaye, K.I.; Awosolu, O.; Alalade, O.E. Public and environmental health effects of plastic wastes disposal: A Review. J. Toxicol. Risk Assess. 2019, 5, 021. [Google Scholar]
  29. Narancic, T.; O’Connor, K.E. Plastic waste as a global challenge: Are biodegradable plastics the answer to the plastic waste problem? Microbiology 2019, 165, 129–137. [Google Scholar] [CrossRef] [PubMed]
  30. Cheng, Y.; Deng, S.; Chen, P.; Ruan, R. Polylactic acid (PLA) synthesis and modifications: A review. Front. Chem. 2009, 4, 259–264. [Google Scholar] [CrossRef]
  31. Walker, S.; Rothman, R. Life cycle assessment of bio-based and fossil-based plastic: A review. J. Clean. Prod. 2020, 261. [Google Scholar] [CrossRef]
  32. Branded. Break Free from Plastic. Available online: https://www.breakfreefromplastic.org/wp-content/uploads/2018/10/BRANDED-Report-2018-FINAL.pdf (accessed on 23 March 2020).
  33. Jambeck, J.R.; Geyer, R.; Wilcox, C.; Siegler, T.R.; Perryman, M.; Andrady, A.; Narayan, R.; Law, K.L. Plastic waste inputs from land into the ocean. Science 2015, 347, 768–771. [Google Scholar] [CrossRef]
  34. United States Environmental Protection Agency. Facts and Figures about Materials, Waste and Recycling. Available online: https://www.epa.gov/facts-and-figures-about-materials-waste-and-recycling/plastics-material-specific-data (accessed on 10 April 2020).
  35. Morin, N.; Arp, H.P.H.; Hale, S.E. Bisphenol A in solid waste materials, leachate water, and air particles from Norwegian waste-handling facilities: Presence and partitioning behavior. Environ. Sci. Technol. 2015, 49, 7675–7683. [Google Scholar] [CrossRef]
  36. Carlini, G. Centre for International Environmental Law. One Small Edit for a Legal Text, One Giant Leap for Addressing Plastic Pollution: A New Plastic Waste Proposal for the Basel Convention. 2018. Available online: https://www.ciel.org/plastic-waste-proposal-basel-convention/ (accessed on 8 April 2020).
  37. Brooks, A.L.; Wang, S.; Jambeck, J.R. The Chinese import ban and its impact on global plastic waste trade. Sci. Adv. 2018, 4, eaat0131. [Google Scholar] [CrossRef] [Green Version]
  38. Parker, L. National Geographic. China’s Ban on Trash Imports Shifts Waste Crisis to Southeast Asia. Available online: https://www.nationalgeographic.com/environment/2018/11/china-ban-plastic-trash-imports-shifts-waste-crisis-southeast-asia-malaysia/ (accessed on 8 April 2020).
  39. 5 Gyres. Frequently Asked Questions. Available online: https://www.5gyres.org/faq (accessed on 1 July 2020).
  40. Crawford, A.; BBC News. Why Is UK Recycling Being Dumped by Turkish Roadsides? Available online: https://www.bbc.com/news/av/uk-53181948 (accessed on 1 July 2020).
  41. Reeves, S.; Phys Org. China plastic Waste Ban Throws Global Recycling into Chaos. 2019. Available online: https://phys.org/news/2019-04-china-plastic-global-recycling-chaos.html (accessed on 8 April 2020).
  42. Basel Convention. Available online: http://www.basel.int/TheConvention/Overview/tabid/1271/Default.aspx (accessed on 1 April 2020).
  43. Daniel Hoornweg, D.; Bhada-Tata, P. What a Waste: A Global Review of Solid Waste Management. Available online: https://openknowledge.worldbank.org/handle/10986/17388 (accessed on 7 April 2020).
  44. Plastics SA. Overview of the Plastics Industry in South Africa. Available online: https://www.thedti.gov.za/parliament/2014/Plastics_part1.pdf (accessed on 7 April 2020).
  45. Grand View Research. Market Research Report. 2020. Available online: https://www.grandviewresearch.com/industry-analysis/global-plastics-market (accessed on 7 April 2020).
  46. Denkstatt. How Packaging Contributes to Food Waste Prevention. Specific Examples from Austrian Stakeholder Projects, Including Carbon Footprint Assessments. Available online: https://www.save-food.org/cgi-bin/md_interpack/lib/all/lob/return_download.cgi/3_Interpack_2017_denkstatt_Packaging_Food_Waste_Prevention_V1.0.pdf?ticket=g_u_e_s_t&bid=5684&no_mime_type=0 (accessed on 2 August 2020).
  47. United Nations—Treaty Series. Multilateral Convention for the Prevention of Marine Pollution by Dumping from Ships and Aircraft. Signed at Oslo on 15 February 1972. Available online: https://treaties.un.org/doc/Publication/UNTS/Volume%20932/volume-932-I-13269-English.pdf (accessed on 18 March 2020).
  48. United States Environmental Protection Agency. Ocean Dumping: International Treaties. Available online: https://www.epa.gov/ocean-dumping/ocean-dumping-international-treaties (accessed on 18 March 2020).
  49. International Maritime Organization. International Convention for the Prevention of Pollution from Ships (MARPOL). Available online: http://www.imo.org/en/About/Conventions/ListOfConventions/Pages/nternational-Convention-for-the-Prevention-of-Pollution-from-Ships-(MARPOL).aspx (accessed on 26 March 2020).
  50. United Nations—Treaty Series. Multilateral. Convention for the Prevention of Marine Pollution from Land-Based Sources (with Annexes). Concluded at Paris on 4 June 1974. Available online: https://treaties.un.org/doc/Publication/UNTS/Volume%201546/volume-1546-I-26842-English.pdf (accessed on 26 March 2020).
  51. European Commission. The Barcelona Convention for the Protection of the Marine Environment and the Coastal Region of the Mediterranean Adopted in 1995. Available online: https://ec.europa.eu/environment/marine/international-cooperation/regional-sea-conventions/barcelona-convention/index_en.htm (accessed on 23 March 2020).
  52. Chitaka, T.Y.; von Blottnitz, H. Accumulation and characteristics of plastic debris along five beaches in Cape Town. Mar. Pollut. Bull. 2019, 138, 451–457. [Google Scholar] [CrossRef]
  53. The Beach and Beyond. International Coastal Cleanup. 2018. Available online: https://oceanconservancy.org/wp-content/uploads/2019/09/Final-2019-ICC-Report.pdf (accessed on 9 April 2020).
  54. Gómez, F.; Rima, S. World Economic Forum. Setting the Facts Straight on Plastics. 4 October 2019. Available online: https://www.weforum.org/agenda/2019/10/plastics-what-are-they-explainer/ (accessed on 30 July 2020).
  55. Lebreton, L.; Slat, B.; Ferrari, F.; Sainte-Rose, B.; Aitken, J.; Marthouse, R.; Hajbane, S.; Cunsolo, S.; Schwarz, A.; Levivier, A.; et al. Evidence that the Great Pacific Garbage Patch is rapidly accumulating plastic. Sci. Rep. 2018, 8, 1–15. [Google Scholar] [CrossRef] [PubMed] [Green Version]
  56. United Nations. Sustainable Development Goals. Goal 14: Conserve and Sustainably Use the Oceans, Seas and Marine Resources. Available online: https://www.un.org/sustainabledevelopment/oceans/ (accessed on 23 March 2020).
  57. Cole, M.; Lindeque, P.; Fileman, E.; Halsband, C.; Galloway, T.S. The impact of polystyrene microplastics on feeding, function and fecundity in the marine copepod Calanus helgolandicus. Environ. Sci. Technol. 2015, 49, 1130–1137. [Google Scholar] [CrossRef] [PubMed]
  58. Civancik-Uslu, D.; Puig, R.; Hauschild, M.; Fullana-i-Palmer, P. Life cycle assessment of carrier bags and development of a littering indicator. Sci. Total Environ. 2019, 685, 621–630. [Google Scholar] [CrossRef] [PubMed]
  59. Chitaka, T.Y.; Russo, V.; von Blottnitz, H. In pursuit of environmentally friendly straws: A comparative life cycle assessment of five straw material options in South Africa. Int. J. Life Cycle Assess. 2020, 25, 1818–1832. [Google Scholar] [CrossRef]
  60. Russo, V.; Stafford, W.; Nahman, A. Comparing Grocery Carrier Bags in South Africa from an Environmental and Socio-Economic Perspective. In Waste Research Development and Innovation Roadmap Research Report; Department of Science and Innovation: Pretoria, South Africa, 2020. [Google Scholar]
  61. Harding, K.G.; Dennis, J.S.; Von Blottnitz, H.; Harrison, S.T.L. Environmental analysis of plastic production processes: Comparing petroleum-based polypropylene and polyethylene with biologically-based poly-β-hydroxybutyric acid using life cycle analysis. J. Biotechnol. 2007, 130, 57–66. [Google Scholar] [CrossRef] [PubMed]
  62. Bisinella, V.; Albizzati, P.F.; Astrup, T.F.; Damgaard, A.; Government of Denmark LCA. Life Cycle Assessment of Grocery Carrier Bags. 2018. Available online: https://www2.mst.dk/Udgiv/publications/2018/02/978-87-93614-73-4.pdf (accessed on 14 July 2020).
  63. Edwards, C.; Fry, J.M. Life Cycle Assessment of Supermarket Carrier Bags 2011. Environment Agency, Horizon House, Deanery Road, Bristol, BS1 5AH. Available online: https://assets.publishing.service.gov.uk/government/uploads/system/uploads/attachment_data/file/291023/scho0711buan-e-e.pdf (accessed on 14 July 2020).
  64. Government of Quebec LCA. Available online: https://monsacintelligent.ca/wp-content/uploads/2018/03/ENGLISH_FINAL-Quebec-LCA-Full- (accessed on 14 July 2020).
  65. Bentley West Management Consultants. Socio—Economic Impact of the Proposed Plastic Bag Regulations. Available online: https://www.google.com/url?sa=t&rct=j&q=&esrc=s&source=web&cd=&ved=2ahUKEiZvZ2iiZXsAhVVH7cAHRL5BT4QFjAAegQIAxAC&url=http%3A%2F%2Fnew.nedlac.org.za%2Fwp-content%2Fuploads%2F2014%2F10%2FSocioEconomicImpactPlasticExecSummary.pdf&usg=AOvVaw16A4P31dqb3mQIgmO_4vt9 (accessed on 14 July 2020).
  66. European Bioplastics. Biobased Plastics. Available online: https://www.european-bioplastics.org/bioplastics/materials/biobased/#:~:text=Biobased%20or%20partially%20biobased%20durable,reduce%20a%20product%27s%20carbon%20footprint (accessed on 14 July 2020).
  67. European Bioplastics. Bioplastics Facts and Figures. Available online: https://docs.european-bioplastics.org/publications/EUBP_Facts_and_figures.pdf (accessed on 14 July 2020).
  68. Bioplastics Guide. What Are Bioplastics? Available online: http://www.bioplastics.guide/ref/bioplastics/what-are-bioplastics/ (accessed on 11 July 2020).
  69. European Bioplastics. Bioplastics Market Data. 2019. Available online: https://www.european-bioplastics.org/market/ (accessed on 10 April 2020).
  70. Rudin, A.; Choi, P. The Elements of Polymer Science and Engineering, 3rd ed.; Elsevier: Waltham, MA, USA, 2013; pp. 521–535. [Google Scholar]
  71. Höfer, R.; Selig, M. Green chemistry and green polymer chemistry. In Polymer Science: A Comprehensive Reference; Polymers for a Sustainable Environment and Green Energy; Matyjaszewski, K., Möller, M., McGrath, J.E., Hickner, M.A., Höfer, R., Eds.; Elsevier BV: Amsterdam, The Netherlands, 2012. [Google Scholar] [CrossRef]
  72. Polymer Properties Database. Biodegradable Bioplastics. Available online: https://polymerdatabase.com/polymer%20classes/Bioplastics.html (accessed on 11 July 2020).
  73. Bioplastics Magazine. Biodegradable Polymers Market Forecast to Rise Sharply by 2023. Available online: https://www.bioplasticsmagazine.com/en/news/meldungen/2018-July-27-Biodegrable-plastics-market-forcast-to-rise-sharply-by-2023.php (accessed on 11 July 2020).
  74. Institute for Bioplastics and Biocomposites. Available online: https://www.ifbb-hannover.de/en/facts-and-statistics.html (accessed on 11 July 2020).
  75. Allied Market Research. Available online: https://www.alliedmarketresearch.com/biodegradable-plastic-market#:~:text=Biodegradable%20plastic%2C%20by%20Application,to%20the%20growing%20environmental%20awareness (accessed on 5 June 2020).
  76. Van den Oever, M.; Molenveld, K.; van der Zee, M.; Bos, H. Bio-Based and Biodegradable Plastics: Facts and Figures: Focus on Food Packaging in the Netherlands; Wageningen Food and Biobased Research: Wageningen, The Netherlands, 2017. [Google Scholar]
  77. Barrett, A.; Bioplastics News. Japan Funds Bioplastics Industry in South Africa. Available online: https://bioplasticsnews.com/2019/08/01/japan-funds-bioplastics-industry-in-south-africa/ (accessed on 12 July 2020).
  78. United Nations Industrial Development Organization. Japan Funds UNIDO Project in South Africa to Find Alternatives to Single-Use Plastic. Available online: https://www.unido.org/news/japan-funds-unido-project-south-africa-find-alternatives-single-use-plastic (accessed on 10 May 2020).
  79. The SA Plastics Pact. Available online: https://www.saplasticspact.org.za/why/ (accessed on 10 May 2020).
  80. Regional Plastics Pact for Australia, New Zealand, and the Pacific Island Nations. Available online: https://www.ellenmacarthurfoundation.org/news/regional-plastics-pact-for-australia-new-zealand-and-the-pacific-island-nations (accessed on 14 May 2020).
  81. Statista. Market Value of Biodegradable Plastics Worldwide from 2018 to 2027. Available online: https://www.statista.com/statistics/979050/global-market-value-of-biodegradable-plastics/ (accessed on 10 April 2020).
  82. Globe Newswire. Global Biodegradable Plastics Market Is Expected to Reach USD 8.57 Billion by 2025: Fior Markets. Available online: https://www.globenewswire.com/news-release/2019/07/29/1892673/0/en/Global-Biodegradable-Plastics-Market-is-Expected-to-Reach-USD-8-57-Billion-by-2025-Fior-Markets.html (accessed on 24 July 2020).
  83. Wikipedia. Mulch. Available online: https://en.wikipedia.org/wiki/Mulch#:~:text=A%20mulch%20is20a%20layer,visual%20appeal%20of%20the%20area (accessed on 3 August 2020).
  84. Harrison, J.P.; Boardman, C.; O’Callaghan, K.; Delort, A.M.; Song, J. Biodegradability standards for carrier bags and plastic films in aquatic environments: A critical review. R. Soc. Open Sci. 2018, 5. [Google Scholar] [CrossRef] [Green Version]
  85. Joshi, S.; Sharma, U.; Goswami, G. Bio-Plastic from Waste Newspaper. In Proceedings of the International Conference on Emerging Trends of Research in Applied Sciences and Computational Techniques, Rajasthan, India, 21–22 February 2014. [Google Scholar]
  86. Hackett, M.; IHS Markit. Biodegradable Polymers Market Value. Available online: https://ihsmarkit.com/research-analysis/biodegradable-polymers-market-value.html (accessed on 12 July 2020).
  87. Song, J.H.; Murphy, R.J.; Narayan, R.; Davies, G.B.H. Biodegradable and compostable alternatives to conventional plastics. Philos. Trans. R. Soc. B Biol. Sci. 2009, 364, 2127–2139. [Google Scholar] [CrossRef]
  88. Su, S.; Kopitzky, R.; Tolga, S.; Kabasci, S. Polylactide (PLA) and its blends with poly (butylene succinate) (PBS): A brief review. Polymers 2019, 11, 1193. [Google Scholar] [CrossRef] [Green Version]
  89. Artham, T.; Doble, M. Biodegradation of aliphatic and aromatic polycarbonates. Macromol. Biosci. 2008, 8, 14–24. [Google Scholar] [CrossRef]
  90. Ivanov, V.; Stabnikov, V.; Ahmed, Z.; Dobrenko, S.; Saliuk, A. Production and applications of crude polyhydroxyalkanoate-containing bioplastic from the organic fraction of municipal solid waste. Int. J. Environ. Sci. Technol. 2014, 12, 725–738. [Google Scholar] [CrossRef] [Green Version]
  91. Van Hille, R.; Zietsman, G.; van Hille, N. Biodegradable and Compostable Packaging: A Review of the South African Landscape. Available online: https://www.researchgate.net/publication/340310328_Biodegradable_and_Compostable_Packaging_A_review_of_the_South_African_landscape (accessed on 24 July 2020).
  92. Bioplastics News. Polyhydroxyalkanoates or PHA. Available online: https://news.com/polyhydroxyalkanoates-or-pha/ (accessed on 24 July 2020).
  93. Coats, E.R.; Loge, F.J.; Wolcott, M.P.; Englund, K.; McDonald, A.G. Synthesis of polyhydroxyalkanoates in municipal wastewater treatment. Water Environ. Res. 2007, 79, 2396–2403. [Google Scholar] [CrossRef] [PubMed] [Green Version]
  94. Israni, N.; Shivakumar, S. Polyhydroxyalkanoate (PHA) biosynthesis from directly valorized ragi husk and sesame oil cake by Bacillus megaterium strain Ti3: Statistical optimization and characterization. Int. J. Biol. Macromol. 2020, 148, 20–30. [Google Scholar] [CrossRef]
  95. Surendran, A.; Lakshmanan, M.; Chee, J.Y.; Sulaiman, A.M.; Van Thuoc, D.; Sudesh, K. Can Polyhydroxyalkanoates Be Produced Efficiently from Waste Plant and Animal Oils? Front. Bioeng. Biotechnol. 2020, 8, 169. [Google Scholar] [CrossRef]
  96. Meraldo, A. Introduction to bio-based polymers. In Multilayer Flexible Packaging, 2nd ed.; Wagner, J.R., Ed.; William Andrew Publishing: Norwich, NY, USA, 2016; pp. 47–52. [Google Scholar] [CrossRef]
  97. Gigli, M.; Fabbri, M.; Lotti, N.; Gamberini, R.; Rimini, B.; Munari, A. Poly (butylene succinate)-based polyesters for biomedical applications: A review. Eur. Polym. 2016, 75, 431–460. [Google Scholar] [CrossRef]
  98. Kachrimanidou, V.; Kopsahelis, N.; Webb, C.; Koutinas, A.A. Bioenergy technology and food industry waste valorization for integrated production of polyhydroxyalkanoates. In Bioenergy Research: Advances and Applications; Elsevier BV: Amsterdam, The Netherlands, 2014; pp. 419–433. [Google Scholar]
  99. Voinova, O.; Gladyshev, M.; Volova, T.G. Comparative study of PHA degradation in natural reservoirs having various types of ecosystems. In Macromolecular Symposia; WILEY-VCH: Weinheim, Germany, 2008; Volume 269, pp. 34–37. [Google Scholar] [CrossRef]
  100. Rudnik, E. Compostable Polymer Materials, 2nd ed.; Elsevier: Amsterdam, The Netherlands, 2019; p. 213. [Google Scholar]
  101. Ghanem, N.B.; Mabrouk, M.E.; Sabry, S.A.; El-Badan, D.E. Degradation of polyesters by a novel marine Nocardiopsis aegyptia sp. nov: Application of Plackett-Burman experimental design for the improvement of PHB depolymerase activity. J. Gen. Appl. Microbiol. 2005, 51, 151–158. [Google Scholar] [CrossRef] [PubMed] [Green Version]
  102. Dudek, S.; Coskun, M.C. Biopolymer Compounds for Applications Requiring Marine Degradation. Available online: https://www.semanticscholar.org/paper/Biopolymer-Compounds-for-Applications-Requiring-Dudek-Coskun/866c08c107749cd8fdc58f1f7a04aab69da5bea9#citing-papers (accessed on 23 July 2020).
  103. Fibre to Fashion. Polypropylene Market Report and Price Trend. Available online: https://www.fibre2fashion.com/market-intelligence/textile-market-watch/polypropylene-price-trends-industry-reports/20/ (accessed on 23 July 2020).
  104. Rojas-Rosas, O.; Villafana-Rojas, J.; Lopez-Dellamary, F.A.; Nungaray-Arellano, J.; Gonzalez-Reynoso, O. Production and characterization of polyhydroxyalkanoates in Pseudomonas aeruginosa ATCC 9027 from glucose, an unrelated carbon source. Can. J. Microbiol. 2007, 53, 840–851. [Google Scholar] [CrossRef] [PubMed]
  105. Bengtsson, S.; Werker, A.; Christensson, M.; Welander, T. Production of polyhydroxyalkanoates by activated sludge treating a paper mill wastewater. Bioresour. Technol. 2008, 99, 509–516. [Google Scholar] [CrossRef] [PubMed]
  106. Beccari, M.; Bertin, L.; Dionisi, D.; Fava, F.; Lampis, S.; Majone, M.; Valentino, F.; Vallini, G.; Villano, M. Exploiting olive oil mill effluents as a renewable resource for production of biodegradable polymers through a combined anaerobic–aerobic process. J. Chem. Technol. Biotechnol. Int. Res. Process Environ. Clean Technol. 2009, 84, 901–908. [Google Scholar] [CrossRef]
  107. Mannina, G.; Presti, D.; Montiel-Jarillo, G.; Suárez-Ojeda, M.E. Bioplastic recovery from wastewater: A new protocol for polyhydroxyalkanoates (PHA) extraction from mixed microbial cultures. Bioresour. Technol. 2019, 282, 361–369. [Google Scholar] [CrossRef]
  108. Albuquerque, M.G.E.; Torres, C.A.V.; Reis, M.A.M. Polyhydroxyalkanoate (PHA) production by a mixed microbial culture using sugar molasses: Effect of the influent substrate concentration on culture selection. Water Res. 2010, 44, 3419–3433. [Google Scholar] [CrossRef]
  109. Bengtsson, S.; Pisco, A.R.; Reis, M.A.; Lemos, P.C. Production of polyhydroxyalkanoates from fermented sugar cane molasses by a mixed culture enriched in glycogen accumulating organisms. J. Biotechnol. 2010, 145, 253–263. [Google Scholar] [CrossRef] [PubMed]
  110. Wong, Y.M.; Brigham, C.J.; Rha, C.; Sinskey, A.J.; Sudesh, K. Biosynthesis and characterization of polyhydroxyalkanoate containing high 3-hydroxyhexanoate monomer fraction from crude palm kernel oil by recombinant Cupriavidus necator. Bioresour. Technol. 2012, 121, 320–327. [Google Scholar] [CrossRef] [PubMed] [Green Version]
  111. Muhr, A.; Rechberger, E.M.; Salerno, A.; Reiterer, A.; Schiller, M.; Kwiecień, M.; Adamus, G.; Kowalczuk, M.; Strohmeier, K.; Schober, S.; et al. Biodegradable latexes from animal-derived waste: Biosynthesis and characterization of mcl-PHA accumulated by P. citronellolis. React. Funct. Polym. 2013, 73, 1391–1398. [Google Scholar] [CrossRef]
  112. Poomipuk, N.; Reungsang, A.; Plangklang, P. Poly-β-hydroxyalkanoates production from cassava starch hydrolysate by Cupriavidus sp. KKU38. Int. J. Biol. Macromol. 2014, 65, 51–64. [Google Scholar] [CrossRef] [PubMed]
  113. Korkakaki, E.; Mulders, M.; Veeken, A.; Rozendal, R.; van Loosdrecht, M.C.; Kleerebezem, R. PHA production from the organic fraction of municipal solid waste (OFMSW): Overcoming the inhibitory matrix. Water Res. 2016, 96, 74–83. [Google Scholar] [CrossRef]
  114. Duque, A.F.; Oliveira, C.S.; Carmo, I.T.; Gouveia, A.R.; Pardelha, F.; Ramos, A.M.; Reis, M.A. Response of a three-stage process for PHA production by mixed microbial cultures to feedstock shift: Impact on polymer composition. New Biotechnol. 2014, 31, 276–288. [Google Scholar] [CrossRef]
  115. Oliveira, C.S.; Silva, C.E.; Carvalho, G.; Reis, M.A. Strategies for efficiently selecting PHA producing mixed microbial cultures using complex feedstocks: Feast and famine regime and uncoupled carbon and nitrogen availabilities. New Biotechnol. 2017, 37, 69–79. [Google Scholar] [CrossRef]
  116. Carvalho, G.; Pedras, I.; Karst, S.M.; Oliveira, C.S.; Duque, A.F.; Nielsen, P.H.; Reis, M.A. Functional redundancy ensures performance robustness in 3-stage PHA-producing mixed cultures under variable feed operation. New Biotechnol. 2018, 40, 207–217. [Google Scholar] [CrossRef]
  117. Colombo, B.; Calvo, M.V.; Sciarria, T.P.; Scaglia, B.; Kizito, S.S.; D’Imporzano, G.; Adani, F. Biohydrogen and polyhydroxyalkanoates (PHA) as products of a two-steps bioprocess from deproteinized dairy wastes. Waste Manag. 2019, 95, 22–31. [Google Scholar] [CrossRef]
  118. Salamanca-Cardona, L.; Scheel, R.A.; Bergey, N.S.; Stipanovic, A.J.; Matsumoto, K.I.; Taguchi, S.; Nomura, C.T. Consolidated bioprocessing of poly (lactate-co-3-hydroxybutyrate) from xylan as a sole feedstock by genetically-engineered Escherichia coli. J. Biosci. Bioeng. 2016, 122, 406–414. [Google Scholar] [CrossRef]
  119. Elain, A.; Le Grand, A.; Corre, Y.M.; Le Fellic, M.; Hachet, N.; Le Tilly, V.; Loulergue, P.; Audic, J.L.; Bruzaud, S. Valorisation of local agro-industrial processing waters as growth media for polyhydroxyalkanoates (PHA) production. Ind. Crops Prod. 2016, 80, 1–5. [Google Scholar] [CrossRef]
  120. Ray, S.; Prajapati, V.; Patel, K.; Trivedi, U. Optimization and characterization of PHA from isolate Pannonibacter phragmitetus ERC8 using glycerol waste. Int. J. Biol. Macromol. 2016, 86, 741–749. [Google Scholar] [CrossRef] [PubMed]
  121. Padovani, G.; Emiliani, G.; Giovanelli, A.; Traversi, M.L.; Carlozzi, P. Assessment of glycerol usage by five different purple non-sulfur bacterial strains for bioplastic production. J. Environ. Chem. Eng. 2018, 6, 616–622. [Google Scholar] [CrossRef]
  122. Azizi, N.; Najafpour, G.; Younesi, H. Acid pretreatment and enzymatic saccharification of brown seaweed for polyhydroxybutyrate (PHB) production using Cupriavidus necator. Int. J. Biol. Macromol. 2017, 101, 1029–1040. [Google Scholar] [CrossRef] [PubMed]
  123. Sawant, S.S.; Salunke, B.K.; Kim, B.S. Consolidated bioprocessing for production of polyhydroxyalkanotes from red algae Gelidium amansii. Int. J. Biol. Macromol. 2018, 109, 1012–1018. [Google Scholar] [CrossRef] [PubMed]
  124. Ghosh, S.; Gnaim, R.; Greiserman, S.; Fadeev, L.; Gozin, M.; Golberg, A. Macroalgal biomass subcritical hydrolysates for the production of polyhydroxyalkanoate (PHA) by Haloferax mediterranei. Bioresour. Technol. 2019, 271, 166–173. [Google Scholar] [CrossRef] [PubMed]
  125. Tůma, S.; Izaguirre, J.K.; Bondar, M.; Marques, M.M.; Fernandes, P.; da Fonseca, M.M.R.; Cesário, M.T. Upgrading end-of-line residues of the red seaweed Gelidium sesquipedale to polyhydroxyalkanoates using Halomonas boliviensis. Biotechnol. Rep. 2020, 27, e00491. [Google Scholar] [CrossRef] [PubMed]
  126. Wijeyekoon, S.; Carere, C.R.; West, M.; Nath, S.; Gapes, D. Mixed culture polyhydroxyalkanoate (PHA) synthesis from nutrient rich wet oxidation liquors. Water Res. 2018, 140, 1–11. [Google Scholar] [CrossRef] [PubMed]
  127. Arumugam, A.; Senthamizhan, S.G.; Ponnusami, V.; Sudalai, S. Production and optimization of polyhydroxyalkanoates from non-edible Calophyllum inophyllum oil using Cupriavidus necator. Int. J. Biol. Macromol. 2018, 112, 598–607. [Google Scholar] [CrossRef]
  128. Kovalcik, A.; Kucera, D.; Matouskova, P.; Pernicova, I.; Obruca, S.; Kalina, M.; Enev, V.; Marova, I. Influence of removal of microbial inhibitors on PHA production from spent coffee grounds employing Halomonas halophila. J. Environ. Chem. Eng. 2018, 6, 3495–3501. [Google Scholar] [CrossRef]
  129. Al-Battashi, H.; Annamalai, N.; Al-Kindi, S.; Nair, A.S.; Al-Bahry, S.; Verma, J.P.; Sivakumar, N. Production of bioplastic (poly-3-hydroxybutyrate) using waste paper as a feedstock: Optimization of enzymatic hydrolysis and fermentation employing Burkholderia sacchari. J. Clean. Prod. 2019, 214, 236–247. [Google Scholar] [CrossRef]
  130. Porras, M.A.; Ramos, F.D.; Diaz, M.S.; Cubitto, M.A.; Villar, M.A. Modeling the bioconversion of starch to P (HB-co-HV) optimized by experimental design using Bacillus megaterium BBST4 strain. Environ. Technol. 2019, 40, 1185–1202. [Google Scholar] [CrossRef] [PubMed]
  131. Saratale, R.G.; Saratale, G.D.; Cho, S.K.; Kim, D.S.; Ghodake, G.S.; Kadam, A.; Kumar, G.; Bharagava, R.N.; Banu, R.; Shin, H.S. Pretreatment of kenaf (Hibiscus cannabinus L.) biomass feedstock for polyhydroxybutyrate (PHB) production and characterization. Bioresour. Technol. 2019, 282, 75–80. [Google Scholar] [CrossRef] [PubMed]
  132. Sohn, Y.J.; Kim, H.T.; Baritugo, K.A.; Song, H.M.; Ryu, M.H.; Kang, K.H.; Jo, S.Y.; Kim, H.; Kim, Y.J.; Choi, J.I.; et al. Biosynthesis of polyhydroxyalkanoates from sucrose by metabolically engineered Escherichia coli strains. Int. J. Biol. Macromol. 2020, 149, 593–599. [Google Scholar] [CrossRef] [PubMed]
  133. Xu, J.; Guo, B.H. Microbial Succinic Acid, Its Polymer Poly (butylene succinate), and Applications. In Plastics from Bacteria; Springer: Berlin/Heidelberg, Germany, 2010; Volume 14. [Google Scholar]
  134. Suchao-in, K.; Koombhongse, P.; Chirachanchai, S. Starch grafted poly (butylene succinate) via conjugating reaction and its role on enhancing the compatibility. Carbohydr. Polym. 2014, 102, 95–102. [Google Scholar] [CrossRef]
  135. Okamoto, K.; Sinha Ray, S.; Okamoto, M. New poly (butylene succinate)/layered silicate nanocomposites. II. Effect of organically modified layered silicates on structure, properties, melt rheology, and biodegradability. J. Polym. Sci. B Polym. Phys. 2003, 41, 3160–3172. [Google Scholar] [CrossRef]
  136. Fujimaki, T. Processability and properties of aliphatic polyesters, ‘BIONOLLE’, synthesized by polycondensation reaction. Polym. Degrad. Stab. 1998, 59, 209–214. [Google Scholar] [CrossRef]
  137. Liu, L.; Yu, J.; Cheng, L.; Qu, W. Mechanical properties of poly (butylene succinate) (PBS) biocomposites reinforced with surface modified jute fibre. Compos. Part A Appl. Sci. Manuf. 2009, 40, 669–674. [Google Scholar] [CrossRef]
  138. Hagewood, J. Technologies for the manufacture of synthetic polymer fibers. In Advances in Filament Yarn Spinning of Textiles and Polymers; Woodhead Publishing, Elsevier: Oxford, UK, 2014; pp. 48–71. [Google Scholar]
  139. Zhang, K.; Mohanty, A.K.; Misra, M. Fully biodegradable and biorenewable ternary blends from polylactide, poly (3-hydroxybutyrate-co-hydroxyvalerate) and poly (butylene succinate) with balanced properties. ACS Appl. Mater. Interfaces 2012, 4, 3091–3101. [Google Scholar] [CrossRef]
  140. Zhou, J.; Wang, X.; Hua, K.; Zhang, W.; Ji, J.; Yang, X. Enhanced mechanical properties and degradability of poly (butylene succinate) and poly (lactic acid) blends. Iran. Polym. J. 2013, 22, 267–275. [Google Scholar] [CrossRef]
  141. Polyestertime. LDPE polyethylene prices Europe. Available online: https://www.polyestertime.com/ldpe-polyethylene-prices-europe/ (accessed on 26 July 2020).
  142. Sangroniz, A.; Zhu, J.B.; Tang, X.; Etxeberria, A.; Chen, E.Y.X.; Sardon, H. Packaging materials with desired mechanical and barrier properties and full chemical recyclability. Nat. Commun. 2019, 10, 1–7. [Google Scholar] [CrossRef] [PubMed] [Green Version]
  143. Wan, C.; Li, Y.; Shahbazi, A.; Xiu, S. Succinic acid production from cheese whey using Actinobacillus succinogenes 130 Z. In Biotechnology for Fuels and Chemicals; Finkelstein, M., McMillan, J.D., Davison, B.H., Eds.; Humana Press: Totowa, NJ, USA, 2007; pp. 111–119. [Google Scholar] [CrossRef]
  144. Liu, Y.P.; Zheng, P.; Sun, Z.H.; Ni, Y.; Dong, J.J.; Zhu, L.L. Economical succinic acid production from cane molasses by actinobacillus succinogenes. Bioresour. Technol. 2008, 99, 1736–1742. [Google Scholar] [CrossRef] [PubMed]
  145. Zheng, P.; Dong, J.J.; Sun, Z.H.; Ni, Y.; Fang, L. Fermentative production of succinic acid from straw hydrolysate by Actinobacillus succinogenes. Bioresour. Technol. 2009, 100, 2425–2429. [Google Scholar] [CrossRef] [PubMed]
  146. Dorado, M.P.; Lin, S.K.C.; Koutinas, A.; Du, C.; Wang, R.; Webb, C. Cereal-based biorefinery development: Utilisation of wheat milling by-products for the production of succinic acid. J. Biotechnol. 2009, 143, 51–59. [Google Scholar] [CrossRef]
  147. Chen, K.Q.; Li, J.; Ma, J.F.; Jiang, M.; Wei, P.; Liu, Z.M.; Ying, H.J. Succinic acid production by Actinobacillus succinogenes using hydrolysates of spent yeast cells and corn fiber. Bioresour. Technol. 2011, 102, 1704–1708. [Google Scholar] [CrossRef]
  148. Chen, K.; Zhang, H.; Miao, Y.; Wei, P.; Chen, J. Simultaneous saccharification and fermentation of acid-pretreated rapeseed meal for succinic acid production using Actinobacillus succinogenes. Enzym. Microb. Technol. 2011, 48, 339–344. [Google Scholar] [CrossRef]
  149. Wang, C.; Yan, D.; Li, Q.; Sun, W.; Xing, J. Ionic liquid pretreatment to increase succinic acid production from lignocellulosic biomass. Bioresour. Technol. 2014, 172, 283–289. [Google Scholar] [CrossRef]
  150. Carvalho, M.; Roca, C.; Reis, M.A. Improving succinic acid production by Actinobacillus succinogenes from raw industrial carob pods. Bioresour. Technol. 2016, 218, 491–497. [Google Scholar] [CrossRef]
  151. Shen, N.; Wang, Q.; Zhu, J.; Qin, Y.; Liao, S.; Li, Y.; Zhu, Q.; Jin, Y.; Du, L.; Huang, R. Succinic acid production from duckweed (Landoltia punctata) hydrolysate by batch fermentation of Actinobacillus succinogenes GXAS137. Bioresour. Technol. 2016, 211, 307–312. [Google Scholar] [CrossRef]
  152. Patsalou, M.; Menikea, K.K.; Makri, E.; Vasquez, M.I.; Drouza, C.; Koutinas, M. Development of a citrus peel-based biorefinery strategy for the production of succinic acid. J. Clean. Prod. 2017, 166, 706–716. [Google Scholar] [CrossRef]
  153. González-García, S.; Argiz, L.; Míguez, P.; Gullón, B. Exploring the production of bio-succinic acid from apple pomace using an environmental approach. Chem. Eng. J. 2018, 350, 982–991. [Google Scholar] [CrossRef]
  154. Gowman, A.; Wang, T.; Rodriguez-Uribe, A.; Mohanty, A.K.; Misra, M. Bio-poly (butylene succinate) and its composites with grape pomace: Mechanical performance and thermal properties. ACS Omega 2018, 3, 15205–15216. [Google Scholar] [CrossRef] [PubMed] [Green Version]
  155. Huang, M.; Cheng, J.; Chen, P.; Zheng, G.; Wang, D.; Hu, Y. Efficient production of succinic acid in engineered Escherichia coli strains controlled by anaerobically-induced nirB promoter using sweet potato waste hydrolysate. J. Environ. Manag. 2019, 237, 147–154. [Google Scholar] [CrossRef] [PubMed]
  156. Olajuyin, A.M.; Yang, M.; Thygesen, A.; Tian, J.; Mu, T.; Xing, J. Effective production of succinic acid from coconut water (Cocos nucifera) by metabolically engineered Escherichia coli with overexpression of Bacillus subtilis pyruvate carboxylase. Biotechnol. Rep. 2019, 24, e00378. [Google Scholar] [CrossRef] [PubMed]
  157. Bioplastics News. Polylactic Acid or Polylactide (PLA). Available online: https://bioplasticsnews.com/polylacticacid-or-polylactide-pla/ (accessed on 24 July 2020).
  158. Lunelli, B.H.; Andrade, R.R.; Atala, D.I.P.; Wolf Maciel, M.R.; Maugeri Filho, F.; Maciel Filho, R. Production of lactic acid from sucrose: Strain selection, fermentation, and kinetic modeling. Appl. Biochem. Biotechnol. 2010, 161, 227–237. [Google Scholar] [CrossRef] [PubMed]
  159. Ibarra, V.G.; Sendón, R.; de Quirós, A.R.B. Antimicrobial food packaging based on biodegradable materials. In Antimicrobial Food Packaging; Academic Press, Elsevier: Amsterdam, The Netherlands, 2016; pp. 363–384. [Google Scholar]
  160. Jamshidian, M.; Tehrany, E.A.; Imran, M.; Jacquot, M.; Desobry, S. Poly-lactic acid: Production, applications, nanocomposites, and release studies. Compr. Rev. Food Sci. Food Saf. 2010, 9, 552–571. [Google Scholar] [CrossRef]
  161. Djukić-Vuković, A.; Mladenović, D.; Ivanović, J.; Pejin, J.; Mojović, L. Towards sustainability of lactic acid and poly-lactic acid polymers production. Renew. Sustain. Energy Rev. 2019, 108, 238–252. [Google Scholar] [CrossRef]
  162. Morão, A.; de Bie, F. Life cycle impact assessment of polylactic acid (PLA) produced from sugarcane in Thailand. J. Polym. Environ. 2019, 27, 2523–2539. [Google Scholar] [CrossRef] [Green Version]
  163. Hagen, R. Polylactic Acid. In Polymer Science: A Comprehensive Reference, 1st ed.; Moeller, M., Matyjaszewski, K., Eds.; Elsevier Science: Amsterdam, The Netherlands, 2012; Volume 10, pp. 231–236. [Google Scholar] [CrossRef]
  164. Wilfred, O.; Tai, H.; Marriott, R.; Liu, Q.; Tverezovskiy, V.; Curling, S.; Tai, H.; Fan, Z.; Wang, W. Biodegradation of polylactic acid and starch composites in compost and soil. Int. J. Nano Rech 2018, 1, 1–11. [Google Scholar]
  165. Coltelli, M.B.; Mallegni, N.; Rizzo, S.; Cinelli, P.; Lazzeri, A. Improved impact properties in poly (lactic acid) (PLA) blends containing cellulose acetate (CA) prepared by reactive extrusion. Materials 2019, 12, 270. [Google Scholar] [CrossRef] [Green Version]
  166. Polyestertime. US Polyethylene Terephthalate PET Contract Prices. Available online: https://www.polyestertime.com/us-polyethylene-terephthalate-pet/ (accessed on 24 July 2020).
  167. Polymer Database. Poly (Ethylene Terephthalate) (PET). Thermo-Physical Properties. Available online: https://polymerdatabase.com/Commercial%20Polymers/PET.html (accessed on 24 July 2020).
  168. Wang, L.; Zhao, B.; Liu, B.; Yu, B.; Ma, C.; Su, F.; Hua, D.; Li, Q.; Ma, Y.; Xu, P. Efficient production of l-lactic acid from corncob molasses, a waste by-product in xylitol production, by a newly isolated xylose utilizing Bacillus sp. strain. Bioresour. Technol. 2010, 101, 7908–7915. [Google Scholar] [CrossRef] [PubMed]
  169. Coelho, L.F.; De Lima, C.J.B.; Bernardo, M.P.; Contiero, J. D(−)-lactic acid production by Leuconostoc mesenteroides B512 using different carbon and nitrogen sources. Appl. Biochem. Biotechnol. 2011, 164, 1160–1171. [Google Scholar] [CrossRef] [PubMed]
  170. Taskin, M.; Esim, N.; Ortucu, S. Efficient production of l-lactic acid from chicken feather protein hydrolysate and sugar beet molasses by the newly isolated Rhizopus oryzae TS-61. Food Bioprod. Process. 2012, 90, 773–779. [Google Scholar] [CrossRef]
  171. Flores-Albino, B.; Arias, L.; Gómez, J.; Castillo, A.; Gimeno, M.; Shirai, K. Chitin and L (+)-lactic acid production from crab (Callinectes bellicosus) wastes by fermentation of Lactobacillus sp. B2 using sugar cane molasses as carbon source. Bioproc. Biosyst. Eng. 2012, 35, 1193–1200. [Google Scholar] [CrossRef]
  172. Djukić-Vuković, A.P.; Mojović, L.V.; Vukašinović-Sekulić, M.S.; Nikolić, S.B.; Pejin, J.D. Integrated production of lactic acid and biomass on distillery stillage. Bioproc. Biosyst. Eng. 2013, 36, 1157–1164. [Google Scholar] [CrossRef]
  173. Nguyen, C.M.; Kim, J.S.; Nguyen, T.N.; Kim, S.K.; Choi, G.J.; Choi, Y.H.; Jang, K.S.; Kim, J.C. Production of land d-lactic acid from waste Curcuma longa biomass through simultaneous saccharification and cofermentation. Bioresour. Technol. 2013, 146, 35–43. [Google Scholar] [CrossRef]
  174. Li, Y.; Wang, L.; Ju, J.; Yu, B.; Ma, Y. Efficient production of polymer-grade d-lactate by Sporolactobacillus laevolacticus DSM442 with agricultural waste cottonseed as the sole nitrogen source. Bioresour. Technol. 2013, 142, 186–191. [Google Scholar] [CrossRef]
  175. Wang, Y.; Li, K.; Huang, F.; Wang, J.; Zhao, J.; Zhao, X.; Garza, E.; Manow, R.; Grayburn, S.; Zhou, S. Engineering and adaptive evolution of Escherichia coli W for l-lactic acid fermentation from molasses and corn steep liquor without additional nutrients. Bioresour. Technol. 2013, 148, 394–400. [Google Scholar] [CrossRef]
  176. Zhang, L.; Li, X.; Yong, Q.; Yang, S.T.; Ouyang, J.; Yu, S. Simultaneous saccharification and fermentation of xylo-oligosaccharides manufacturing waste residue for l-lactic acid production by Rhizopus oryzae. Biochem. Eng. J. 2015, 94, 92–99. [Google Scholar] [CrossRef]
  177. Bai, Z.; Gao, Z.; He, B.; Wu, B. Effect of lignocellulose-derived inhibitors on the growth and D-lactic acid production of Sporolactobacillus inulinus YBS1-5. Bioproc. Biosyst. Eng. 2015, 38, 1993–2001. [Google Scholar] [CrossRef]
  178. Wang, Y.; Chen, C.; Cai, D.; Wang, Z.; Qin, P.; Tan, T. The optimization of L-lactic acid production from sweet sorghum juice by mixed fermentation of Bacillus coagulans and Lactobacillus rhamnosus under unsterile conditions. Bioresour. Technol. 2016, 218, 1098–1105. [Google Scholar] [CrossRef] [PubMed]
  179. Zheng, Y.; Wang, Y.; Zhang, J.; Pan, J. Using tobacco waste extract in pre-culture medium to improve xylose utilization for l-lactic acid production from cellulosic waste by Rhizopus oryzae. Bioresour. Technol. 2016, 218, 344–350. [Google Scholar] [CrossRef] [PubMed]
  180. Pleissner, D.; Neu, A.K.; Mehlmann, K.; Schneider, R.; Puerta-Quintero, G.I.; Venus, J. Fermentative lactic acid production from coffee pulp hydrolysate using Bacillus coagulans at laboratory and pilot scales. Bioresour. Technol. 2016, 218, 167–173. [Google Scholar] [CrossRef] [Green Version]
  181. de Oliveira Moraes, A.; Ramirez, N.I.B.; Pereira, N. Evaluation of the fermentation potential of pulp mill residue to produce D(−)-Lactic acid by separate hydrolysis and fermentation using Lactobacillus coryniformis subsp. torquens. Appl. Biochem. Biotechnol. 2016, 180, 1574–1585. [Google Scholar] [CrossRef] [PubMed]
  182. Oonkhanond, B.; Jonglertjunya, W.; Srimarut, N.; Bunpachart, P.; Tantinukul, S.; Nasongkla, N.; Sakdaronnarong, C. Lactic acid production from sugarcane bagasse by an integrated system of lignocellulose fractionation, saccharification, fermentation, and ex-situ nanofiltration. J. Environ. Chem. Eng. 2017, 5, 2533–2541. [Google Scholar] [CrossRef]
  183. Wang, Y.; Cao, W.; Luo, J.; Wan, Y. Exploring the potential of lactic acid production from lignocellulosic hydrolysates with various ratios of hexose versus pentose by Bacillus coagulans IPE22. Bioresour. Technol. 2018, 261, 342–349. [Google Scholar] [CrossRef]
  184. Liu, P.; Zheng, Z.; Xu, Q.; Qian, Z.; Liu, J.; Ouyang, J. Valorization of dairy waste for enhanced D-lactic acid production at low cost. Process. Biochem. 2018, 71, 18–22. [Google Scholar] [CrossRef]
  185. Mladenović, D.; Pejin, J.; Kocić-Tanackov, S.; Djukić-Vuković, A.; Mojović, L. Enhanced lactic acid production by adaptive evolution of Lactobacillus paracasei on agroindustrial substrate. Appl. Biochem. Biotechnol. 2018, 187, 753–769. [Google Scholar] [CrossRef]
  186. Balakrishnan, R.; Tadi, S.R.R.; Sivaprakasam, S.; Rajaram, S. Optimization of acid and enzymatic hydrolysis of kodo millet (Paspalum scrobiculatum) bran residue to obtain fermentable sugars for the production of optically pure D (−) lactic acid. Ind. Crops. Prod. 2018, 111, 731–742. [Google Scholar] [CrossRef]
  187. Qiu, Z.; Gao, Q.; Bao, J. Engineering Pediococcus acidilactici with xylose assimilation pathway for high titer cellulosic L-lactic acid fermentation. Bioresour. Technol. 2018, 249, 9–15. [Google Scholar] [CrossRef]
  188. Pejin, J.; Radosavljević, M.; Pribić, M.; Kocić-Tanackov, S.; Mladenović, D.; Djukić-Vuković, A.; Mojović, L. Possibility of L-(+)-lactic acid fermentation using malting, brewing, and oil production by-products. Waste Manag. 2018, 79, 153–163. [Google Scholar] [CrossRef] [PubMed]
  189. Takeuchi, K. Polycondensation. In Polymer Science: A Comprehensive Reference, 1st ed.; Moeller, M., Matyjaszewski, K., Eds.; Elsevier Science: Amsterdam, The Netherlands, 2012. [Google Scholar]
  190. Gregory, G.L.; Kociok-Köhn, G.; Buchard, A. Polymers from sugars and CO2: Ring-opening polymerisation and copolymerisation of cyclic carbonates derived from 2-deoxy-d-ribose. Polym. Chem. 2017, 8, 2093–2104. [Google Scholar] [CrossRef] [Green Version]
  191. Ribeiro, E.; Ladeira, C.; Viegas, S. Occupational exposure to bisphenol A (BPA): A reality that still needs to be unveiled. Toxics 2017, 5, 22. [Google Scholar] [CrossRef] [PubMed] [Green Version]
  192. Centres for Disease Control and Prevention. CDC. National Biomonitoring Program. Available online: https://www.cdc.gov/biomonitoring/BisphenolA_FactSheet.html (accessed on 19 July 2020).
  193. Park, S.A.; Eom, Y.; Jeon, H.; Koo, J.M.; Lee, E.S.; Jegal, J.; Hwang, S.Y.; Oh, D.X.; Park, J. Preparation of synergistically reinforced transparent bio-polycarbonate nanocomposites with highly dispersed cellulose nanocrystals. Green Chem. 2019, 21, 5212–5221. [Google Scholar] [CrossRef]
  194. Centres for Disease Control and Prevention. Emergency Preparedness and Response Facts about Phosgene. Available online: https://emergency.cdc.gov/agent/phosgene/basics/facts.asp (accessed on 19 July 2020).
  195. Cui, S.; Borgemenke, J.; Liu, Z.; Li, Y. Recent advances of “soft” bio-polycarbonate plastics from carbon dioxide and renewable bio-feedstocks via straightforward and innovative routes. J. CO2 Util. 2019, 34, 40–52. [Google Scholar] [CrossRef]
  196. British Plastics Federation. Polycarbonate PC. Available online: https://www.bpf.co.uk/plastipedia/polymers/polycarbonate.aspx (accessed on 19 July 2020).
  197. Polymer Properties Database. Polycarbonates. Available online: https://polymerdatabase.com/polymer%20classes/Polycarbonate%20type.html (accessed on 18 July 2020).
  198. Ebrary.net. Polycarbonate Polyols. Available online: https://ebrary.net/14328/environment/polyols#:~:text=Relative%20to%20other%20polyols%2C%20the,coatings%2C%20elastomers%2C%20and%20adhesives (accessed on 19 July 2020).
  199. Begum, S.A.; Rane, A.V.; Kanny, K. Applications of compatibilized polymer blends in automobile industry. In Compatibilization of Polymer Blends; Elsevier: Amsterdam, The Netherlands, 2020; pp. 563–593. [Google Scholar]
  200. Building with Chemistry. Polycarbonate in Building and Construction. Available online: https://buildingwithchemistry.org/chemistry-in-bc/polycarbonate-in-building-and-construction/#:~:text=Polycarbonate%20is%20a%20high%2Dperforming,exterior%20elements%20for%20LED%20lighting (accessed on 19 July 2020).
  201. Shen, Z.; Chen, X.; Zhang, Y. New catalytic systems for the fixation of carbon dioxide, 2. Synthesis of high molecular weight epichlorohydrin/carbon dioxide copolymer with rare earth phosphonates/triisobuty-aluminium systems. Macromol. Chem. Phys. 1994, 195, 2003–2011. [Google Scholar] [CrossRef]
  202. Bell, B.M.; Briggs, J.R.; Campbell, R.M.; Chambers, S.M.; Gaarenstroom, P.D.; Hippler, J.G.; Hook, B.D.; Kearns, K.; Kenney, J.M.; Kruper, W.J.; et al. Glycerin as a renewable feedstock for epichlorohydrin production. The GTE process. Clean Soil Air Water 2008, 36, 657–661. [Google Scholar] [CrossRef]
  203. Nozaki, K.; Nakano, K.; Hiyama, T. Optically active polycarbonates: Asymmetric alternating copolymerization of cyclohexene oxide and carbon dioxide. J. Am. Chem. Soc. 1999, 121, 11008–11009. [Google Scholar] [CrossRef]
  204. Mmongoyo, J.A.; Mgani, Q.A.; Mdachi, S.J.M.; Pogorzelec, P.J.; Cole-Hamilton, D.J. Synthesis of a kairomone and other chemicals from cardanol, a renewable resource. Eur. J. Lipid Sci. Technol. 2012, 114, 1183–1192. [Google Scholar] [CrossRef]
  205. Winkler, M.; Romain, C.; Meier, M.A.R.; Williams, C.K. Renewable polycarbonates and polyesters from 1,4-cyclohexadiene. Green Chem. 2015, 17, 300–306. [Google Scholar] [CrossRef] [Green Version]
  206. Nakano, K.; Kamada, T.; Nozaki, K. Selective formation of polycarbonate over cyclic carbonate: Copolymerization of epoxides with carbon dioxide catalyzed by a Cobalt (III) Complex with a piperidinium end-capping arm. Angew. Chem. Int. Ed. 2006, 45, 7274–7277. [Google Scholar] [CrossRef] [PubMed]
  207. Zhang, M.; Yu, Y. Dehydration of ethanol to ethylene. Ind. Eng. Chem. Res. 2013, 52, 9505–9514. [Google Scholar] [CrossRef]
  208. Zhang, X.H.; Wei, R.J.; Zhang, Y.Y.; Du, B.Y.; Fan, Z.Q. Carbon dioxide/epoxide copolymerization via a nanosized zinc–cobalt (III) double metal cyanide complex: Substituent effects of epoxides on polycarbonate selectivity, regioselectivity and glass transition temperatures. Macromolecules 2015, 48, 536–544. [Google Scholar] [CrossRef]
  209. Mohsenzadeh, A.; Zamani, A.; Taherzadeh, M.J. Bioethylene production from ethanol: A review and technoeconomical evaluation. Chem. Biol. Eng. 2017, 4, 75–91. [Google Scholar] [CrossRef] [Green Version]
  210. Hu, Y.; Qiao, L.; Qin, Y.; Zhao, X.; Chen, X.; Wang, X.; Wang, F. Synthesis and Stabilization of Novel Aliphatic Polycarbonate from Renewable Resource. Macromolecules 2009, 42, 9251–9254. [Google Scholar] [CrossRef]
  211. Hilf, J.; Scharfenberg, M.; Poon, J.; Moers, C.; Frey, H. Aliphatic polycarbonates based on carbon dioxide, furfuryl glycidyl ether, and glycidyl methyl ether: Reversible functionalization and cross-linking. Macromol. Rapid Commun. 2015, 36, 174–179. [Google Scholar] [CrossRef]
  212. Mutlu, H.; Meier, M.A.R. Castor oil as a renewable resource for the chemical industry. Eur. J. Lipid Sci. Technol. 2010, 112, 10–30. [Google Scholar] [CrossRef]
  213. Li, C.; Sablong, R.J.; Koning, C.E. Synthesis and characterization of fully-biobased α,ω-dihydroxyl poly(limonene carbonate)s and their initial evaluation in coating applications. Eur. Polym. J. 2015, 67, 449–458. [Google Scholar] [CrossRef]
  214. Hauenstein, O.; Agarwal, S.; Greiner, A. Bio-based polycarbonate as synthetic toolbox. Nat. Commun. 2016, 7, 11862–11869. [Google Scholar] [CrossRef]
  215. Hauenstein, O.; Rahman, M.M.; Elsayed, M.; Krause-Rehberg, R.; Agarwal, S.; Abetz, V.; Greiner, A. Biobased polycarbonate as a gas separation membrane and “breathing glass” for energy saving applications. Int. J. Adv. Mater. Technol. 2017, 2. [Google Scholar] [CrossRef]
  216. Shaarani, F.W.; Bou, J.J. Synthesis of vegetable-oil based polymer by terpolymerization of epoxidized soybean oil, propylene oxide and carbon dioxide. Sci. Total Environ. 2017, 598, 931–936. [Google Scholar] [CrossRef] [PubMed] [Green Version]
  217. The Organisation for Economic Co-operation and Development (OECD) OECD Policy Highlights—Extended Producer Responsibility. Guidance for Efficient Waste Management. Available online: https://www.oecd.org/environment/waste/Extended-producer-responsibility-Policy-Highlights-2016-web.pdf (accessed on 4 August 2020).
  218. Pouikli, K. Concretising the role of extended producer responsibility in European Union waste law and policy through the lens of the circular economy. In ERA Forum; Springer: Berlin/Heideberg, Germany, 2020; Volume 20, pp. 491–508. [Google Scholar]
  219. Arvanitoyannis, I.S.; Tserkezou, P. Presentation and Comments on USA and Canada Legislation Related to Food Industries-Environment Interactions. Available online: http://hdl.handle.net/11615/25923 (accessed on 4 August 2020).
  220. The Pew Charitable Trusts and SYSTEMIQ. Breaking the Plastic Wave Thought Partners. A Comprehensive Assessment of Pathways towards Stopping Ocean Plastic Pollution. Available online: https://www.google.com/url?sa=t&rct=j&q=&esrc=s&source=web&cd=&cad=rja&uact=8&ved=2ahUKEwiGzIisqpXsAhXJ7HMBHag3Aq8QFjAAegQIBRAC&url=https%3A%2F%2Fwww.pewtrusts.org%2F-%2Fmedia%2Fassets%2F2020%2F07%2Fbreakingtheplasticwave_report.pdf&usg=AOvVaw3zhkyDhDNRl86-PTsNjw0o (accessed on 4 August 2020).
  221. The Organisation for Economic Co-operation and Development (OECD). Available online: http://www.oecd.org/environment/waste/Australia%20NTCRS%20OECD%20case%20study.pdf (accessed on 4 August 2020).
  222. Yamakawa, H. The Packaging Recycling Act: The Application of EPR to Packaging Policies in Japan. Available online: http://www.oecd.org/environment/waste/EPR_Japan_packagingFinal%20orrected0502.pdf (accessed on 4 August 2020).
  223. 20 years of EPR in France: Achievements, Lessons Learned and Challenges Ahead. French Ministry of Environment. Available online: https://www.google.com/url?sa=t&rct=j&q=&esrc=s&source=web&cd=cad=rja&uact=8&ved=2ahUKEwjF5IzYqpXsAhXh6XMBHRGoAp8QFjAAegQIBhAC&url=https%3A%2F%2Fwww.oecd.org%2Fenvironment%2Fwaste%2FFrance%2520(final).pdf&usg=AOvVaw1ykU8ZACvWWZowcBuccrV- (accessed on 29 July 2020).
  224. PETCO. An Industry-Driven and Industry-Financed Environment Solution for PET. Available online: https://petco.co.za/who-we-are/ (accessed on 1 May 2020).
  225. Nahman, A. Extended producer responsibility for packaging waste in South Africa: Current approaches and lessons learned. Resour. Conserv. Recycl. 2010, 54, 155–162. [Google Scholar] [CrossRef]
  226. SUEZ Recycling and Recovery. How a Deposit Return Scheme for “on the Go’ Could Be Designed for the UK. Available online: https://www.google.com/url?sa=t&rct=j&q=&esrc=s&source=web&cd=&cad=ja&uact=8&ved=2ahUKEwi78aH7qpXsAhXh8HMBHaVEBywQFjAAegQIBhAC&url=https%3A%2F%2Fwww.suez.co.uk%2F-%2Fmedia%2Fsuez-uk%2Ffiles%2Fpublication%2Fdrs-onthego-report-uk-1803.pdf&usg=AOvVaw0y8tpVMWjKiFItBGGjoo5y (accessed on 24 June 2020).
  227. Seas at Risk. Single-Use Plastics and the Marine Environment. Available online: https://seas-at-risk.org/24-publications/800-single-use-plastic-and-the-marine-environment.html (accessed on 24 June 2020).
  228. The Organisation for Economic Co-operation and Development (OECD). Deposit Refund Schemes. Available online: https://www.oecd.org/stories/ocean/deposit-refund-schemes-58baff8c (accessed on 4 August 2020).
  229. House of Commons. Environmental Audit Committee. Plastic bottles: Turning Back the Plastic Tide. First Report of Session. Available online: https://www.google.com/url?sa=t&rct=j&q=&esrc=s&source=web&cd=&ved=2ahUKEwj37J3Jq5XsAhWV7HMBHZ4sDcEQFjAAegQIBRAC&url=https%3A%2F%2Fpublications.parliament.uk%2Fpa%2Fcm201719%2Fcmselect%2Fcmenvaud%2F339%2F339.pdf&usg=AOvVaw2AHvvC4FgkmPs9ln6dJtll (accessed on 31 July 2020).
  230. Coca Cola South Africa. Coca-Cola Beverages South Africa Reduces Plastic by Launching New 2l Returnable Pet Plastic Bottles. Available online: https://www.coca-cola.co.za/stories-and-press/launch-of-refpet-in-eastern-cape (accessed on 30 July 2020).
  231. Bhengu, C. You’ll Be Able to Return a 2-litre Coca-Cola Bottle & Get R9 Back. Available online: https://www.timeslive.co.za/sunday-times/lifestyle/food/2020-07-16-youll-be-able-to-return-a-2-litre-coca-cola-bottle-get-r9-back-herere-the-deets/ (accessed on 30 July 2020).
  232. Deposit-Refund System (DRS). Facts and Myths. Available online: https://www2.deloitte.com/content/dam/Deloitte/pl/Documents/Brochures/pl_DRS_Brochure_Deloitte.pdf (accessed on 4 August 2020).
  233. Gasperi, J.; Wright, S.L.; Dris, R.; Collard, F.; Mandin, C.; Guerrouache, M.; Langlois, V.; Kelly, F.J.; Tassin, B. Microplastics in air: Are we breathing it in? Curr. Opin. Environ. Sci. Health 2018, 1, 1–5. [Google Scholar] [CrossRef] [Green Version]
  234. The World Bank. What a Waste: An Updated Look into the Future of Solid Waste Management. Available online: https://www.worldbank.org/en/news/immersive-story/2018/09/20/what-a-waste-an-updated-look-into-the-future-of-solid-waste-management (accessed on 20 August 2020).
  235. Ritchie, H. FAQs on Plastics. Available online: https://ourworldindata.org/faq-on-plastics#how-long-does-it-take-plastics-to-break-down (accessed on 10 August 2020).
  236. Pikitup. Available online: http://www.pikitup.co.za/mandatory-separation-at-source-frequently-asked-questions/ (accessed on 10 August 2020).
  237. Green Cape. Available online: https://www.greencape.co.za/assets/Uploads/GreenCape-Market-Intelligence-Report-2015-Waste.pdf (accessed on 10 August 2020).
  238. Plastics—The Facts 2018. Plastic Europe. Available online: https://www.google.com/url?sa=t&rct=j&q=&esrc=s&source=web&cd=&cad=rja&uact=8&ved=2ahUKEwjz97zNrJXsAhVHILcAHTxUCSQQFjAAegQIAxAC&url=https%3A%2F%2Fwww.plasticseurope.org%2Fapplication%2Ffiles%2F6315%2F4510%2F9658%2FPlastics_the_facts_2018_AF_web.pdf&usg=AOvVaw1t7xHOizx9qFw5yMuNs_en (accessed on 11 August 2020).
  239. South African Plastics Recycling Organisation. PETCO Position Papers. Available online: https://www.plasticrecyclingsa.co.za/position-papers/ (accessed on 11 August 2020).
  240. Department of Environmental Affairs. Available online: https://www.gov.za/sites/default/files/gcis_document/201912/42879gon1561.pdf (accessed on 11 August 2020).
  241. South Africa Plastics Recycling Organisation. Available online: https://www.plasticrecyclingsa.co.za/ (accessed on 6 August 2020).
  242. Fox News. Heavy Rain Leads to Garbage-Filled Neighborhood in Nigeria, Lagos Officials Vow Crackdown. Available online: https://www.foxnews.com/world/nigeria-rain-heavy-garbage-flood-neighborhood-lagos-crackdown (accessed on 6 August 2020).
  243. The Ocean Clean up. Available online: https://theoceancleanup.com/ (accessed on 3 April 2020).
  244. Martini, K.; Goldstein, M. The Ocean Cleanup, Part 2: Technical Review of the Feasibility Study. Available online: http://www.deepseanews.com/2014/07/the-ocean-cleanup-part-2-technical-review-of-the-feasibility-study/ (accessed on 6 August 2020).
  245. Dilkes-Hoffman, L.S.; Pratt, S.; Lant, P.A.; Laycock, B. The role of biodegradable plastic in solving plastic solid waste accumulation. In Plastics to Energy; Al-Salem, S.M., Ed.; Elsevier: Oxford, UK, 2019; pp. 469–505. [Google Scholar] [CrossRef]
  246. Australian Government. Available online: https://www.environment.gov.au/system/files/resources/b86c9f8-074e-4d66-ab11-08bbc69da240/files/national-waste-policy-action-plan-2019.pdf (accessed on 11 August 2020).
  247. Parker, L. Canada Aims to Ban Single-Use Plastics by 2021. Available online: https://www.nationalgeographic.com/environment/2019/06/canada-single-use-plastics-ban-2021/ (accessed on 11 August 2020).
  248. Gibbens, S. See the Complicated Landscape of Plastic Bans in the U.S. Available online: https://www.nationalgeographic.com/environment/2019/08/map-shows-the-complicated-landscape-of-plastic-bans/ (accessed on 11 August 2020).
  249. Calderwood, I.; Global Citizen. 16 Times Countries and Cities Have Banned Single-Use Plastics. Available online: https://www.globalcitizen.org/en/content/plastic-bans-around-the-world/ (accessed on 20 April 2020).
  250. Nicholls, F.; Greenpeace. 6 Amazing Plastic Bans from around the World. Available online: https://www.greenpeace.org/international/story/7390/6-amazing-plastic-bans-from-around-the-world/ (accessed on 20 April 2020).
  251. World Population Review. Available online: https://worldpopulationreview.com/continents/africa-population (accessed on 13 August 2020).
  252. European Commission. Available online: https://ec.europa.eu/commission/presscorner/detail/en/P_19_2631 (accessed on 13 August 2020).
  253. Herberz, T.; Barlow, C.Y.; Finkbeiner, M. Sustainability Assessment of a Single-Use Plastics Ban. Sustainability 2020, 12, 3746. [Google Scholar] [CrossRef]
  254. McLellan, H. Banning the Plastic Shopping Bag in South Africa—An Idea Whose Time has Come, Two Oceans Aquarium. In Proceedings of the 20th Waste Conference, Somerset West, Cape Town, South Africa, 6–10 October 2014. [Google Scholar]
  255. Ye, S.; Wang, S.; Lin, L.; Xiao, M.; Meng, Y. CO2 derived biodegradable polycarbonates: Synthesis, modification and applications. Adv. Ind. Eng. Polym. Res. 2019, 2, 143–160. [Google Scholar] [CrossRef]
  256. McGrath, J.E.; Hickner, M.A.; Höfer, R. Introduction: Polymers for a Sustainable Environment and Green Energy. In Polymers for a Sustainable Environment and Green Energy; Elsevier BV: Amsterdam, The Netherlands, 2012; pp. 1–3. [Google Scholar]
  257. Roma, A. Biosourced materials; a future for the car industry. In Proceedings of the 11th Bioplastics Conference, Berlin, Germany, 29–30 November 2016. [Google Scholar]
  258. Hatti-Kaul, R.; Nilsson, L.J.; Zhang, B.; Rehnberg, N.; Lundmark, S. Designing biobased recyclable polymers for plastics. Trends Biotechnol. 2020, 38, 50–67. [Google Scholar] [CrossRef]
  259. De Bie, F. Update on Corbion-Total JV Bringing Innovation to the PLA Market. Available online: https://bioplasticsnews.com/2017/05/30/corbion-total-jv-bringing-innovation-to-the-pla-market-francois-de-bie/ (accessed on 20 August 2020).
  260. Lambert, S.; Wagner, M. Environmental performance of bio-based and biodegradable plastics: The road ahead. Chem. Soc. Rev. 2017, 46, 6855–6871. [Google Scholar] [CrossRef]
  261. Siracusa, V.; Genovese, L.; Ingrao, C.; Munari, A.; Lotti, N. Barrier properties of poly (propylene cyclohexanedicarboxylate) random eco-friendly copolyesters. Polymers 2018, 10, 502. [Google Scholar] [CrossRef] [Green Version]
  262. Ißbrücker, C. Available online: https://www.european-bioplastics.org/how-much-land-do-we-really-need-to-produce-bio-based-plastics/#:~:text=According%20to%20the%20estimation%20published,to%20grow%20food%20and%20feed (accessed on 20 August 2020).
  263. McGrath, M.; BBC. BP: Plastic Ban Could Have Unintended Consequences. Available online: https://www.bbc.com/news/science-environment-47255249#:~:text=Last%20November%2C%20researchers%20at%20Heriot,Buckland%2C%20who%20led%20the%20study (accessed on 20 August 2020).
  264. Economics. How Plastic Bag Bans Impact the Economy. Available online: https://www.thisisplastics.com/economics/how-plastic-bag-bans-impact-the-economy/ (accessed on 20 August 2020).
  265. Caliendo, H.; Plastics Today. The Economic Effect of Plastic Bag Bans. 6 February 2013. Available online: https://www.plasticstoday.com/business/economic-effect-plastic-bag-bans (accessed on 6 August 2020).
  266. Williams, D.L.; Gerba, C.P.; Maxwell, S.; Sinclair, R.G. Assessment of the potential for cross-contamination of food products by reusable shopping bags. Food Prot. Trends 2011, 31, 508–513. [Google Scholar]
  267. Askew, K.; Food Navigator. Food Waste and Plastic Pollution. Available online: https://www.foodnavigator.com/Article/2020/07/31/Food-waste-and-plastic-pollution-The-two-key-sustainability-drivers-are-carbon-and-circularity (accessed on 20 August 2020).
  268. UN Environment. Worldwide Food Waste. Available online: https://www.unenvironment.org/thinkeatsave/get-informed/worldwide-food-waste (accessed on 20 August 2020).
  269. G20 Information Centre. G20 Action Plan on Marine Litter. Available online: http://www.g20.utoronto.ca/2017/2017-g20-marine-litter.html (accessed on 26 March 2020).
  270. Convention on the Conservation of Migratory Species of Wild Animals. Available online: https://www.cms.int/ (accessed on 18 March 2020).
  271. The Abidjan Convention. Available online: https://abidjanconvention.org/ (accessed on 1 April 2020).
  272. United Nations Convention on the Law of the Sea. Available online: https://www.un.org/Depts/los/convention_agreements/texts/unclos/unclos_e.pdf (accessed on 18 March 2020).
  273. Cartagena Convention. Available online: http://cep.unep.org/cartagena-convention (accessed on 18 March 2020).
  274. The Nairobi Convention. Available online: https://www.nairobiconvention.org/ (accessed on 23 March 2020).
  275. Secretariat of the Pacific Regional Environment Programme. Available online: https://www.sprep.org/convention-secretariat/noumea-convention (accessed on 23 March 2020).
  276. The Commission on the Protection of the Black Sea against Pollution. Available online: http://www.blacksea-commission.org/_convention.asp (accessed on 10 March 2020).
  277. OSPAR Commission. OSPAR Convention. Available online: https://www.ospar.org/convention (accessed on 10 March 2020).
  278. HELCOM. The Helsinki Convention. Available online: https://helcom.fi/about-us/convention/ (accessed on 23 March 2020).
  279. Biodiversity. Convention on the Protection of the Marine Environment of the Baltic Sea Area (Helsinki Convention). Available online: https://www.biodiversitya-z.org/content/convention-on-the-protection-of-the-marine-environment-of-the-baltic-sea-area-helsinki-convention (accessed on 23 March 2020).
  280. Regional Action Plan on Marine Litter Management (Rapmali) for the Wider Caribbean Region. Available online: https://www.cbd.int/doc/meetings/mar/mcbem-2014-03/other/mcbem-2014-03-115-en.pdf (accessed on 18 March 2020).
  281. The Global Partnership on Marine Litter. The Honolulu Strategy: A Global Framework for Prevention and Management of Marine Debris. Available online: Marinelitternetwork.engr.uga.edu/global-projects/strategy/ (accessed on 26 March 2020).
  282. United Nations Environment Programme. The Honolulu Strategy. Available online: https://www.unenvironment.org/resources/report/honolulu-strategy (accessed on 26 March 2020).
  283. United Nations Environment Programme. Manilla Declaration. Available online: http://wedocs.unep.org/bitstream/handle/20.500.11822/12347/ManillaDeclarationREV.pdf?sequence=1&isAllowed=y (accessed on 26 March 2020).
  284. Rio Ocean Declaration. Available online: http://www.unesco.org/new/fileadmin/MULTIMEDIA/HQ/SC/pdf/pdf_Rio_Ocean_Declaration_2012.pdf (accessed on 26 March 2020).
  285. United Nations Environment Programme. Available online: Wedocs.unep.org (accessed on 26 March 2020).
  286. Talmon, S. German Practice in International Law. Towards an Agreement to Combat MARINE Litter. 2017. Available online: https://gpil.jura.uni-bonn.de/2017/09/towards-agreement-combat-marine-litter/ (accessed on 10 March 2020).
  287. Convention on Biological Diversity. Available online: https://www.cbd.int/doc/decisions/cop-13/cop-13-dec-10-en.pdf (accessed on 10 March 2020).
  288. Osaka Blue Ocean Vision G20 Implementation Framework for Actions on Marine Plastic Litter. Available online: https://papersmart.unon.org/resolution/uploads/for_projection_g20_osaka_blue_ocean_vision_and_g20_implementation_framework_moej.pdf (accessed on 10 March 2020).
  289. De Villiers, J. Business Insider SA. The New Pick n Pay ‘Plastic’ Bag Can be Used as Compost in Your Garden—This Is What It Looks Like. Available online: https://www.businessinsider.co.za/pick-n-pay-introduce-new-plastic-bags-which-are-compostable-degradable-international-plastic-bag-free-day-2018-7 (accessed on 15 August 2020).
  290. Consumer Goods Council of South Africa. Biodegradable and Compostable Packaging Key Considerations. Available online: https://www.plasticsinfo.co.za/wp-content/uploads/2019/11/Alliance-Biodegradable-position-paper.pdf (accessed on 20 August 2020).
  291. Bioplastics News. What Is the Difference between Biodegradable, Compostable and OXO Biodegradable? Available online: https://bioplasticsnews.com/2019/04/13/what-is-the-difference-between-biodegradable-compostable-and-oxo-degradable/ (accessed on 27 July 2020).
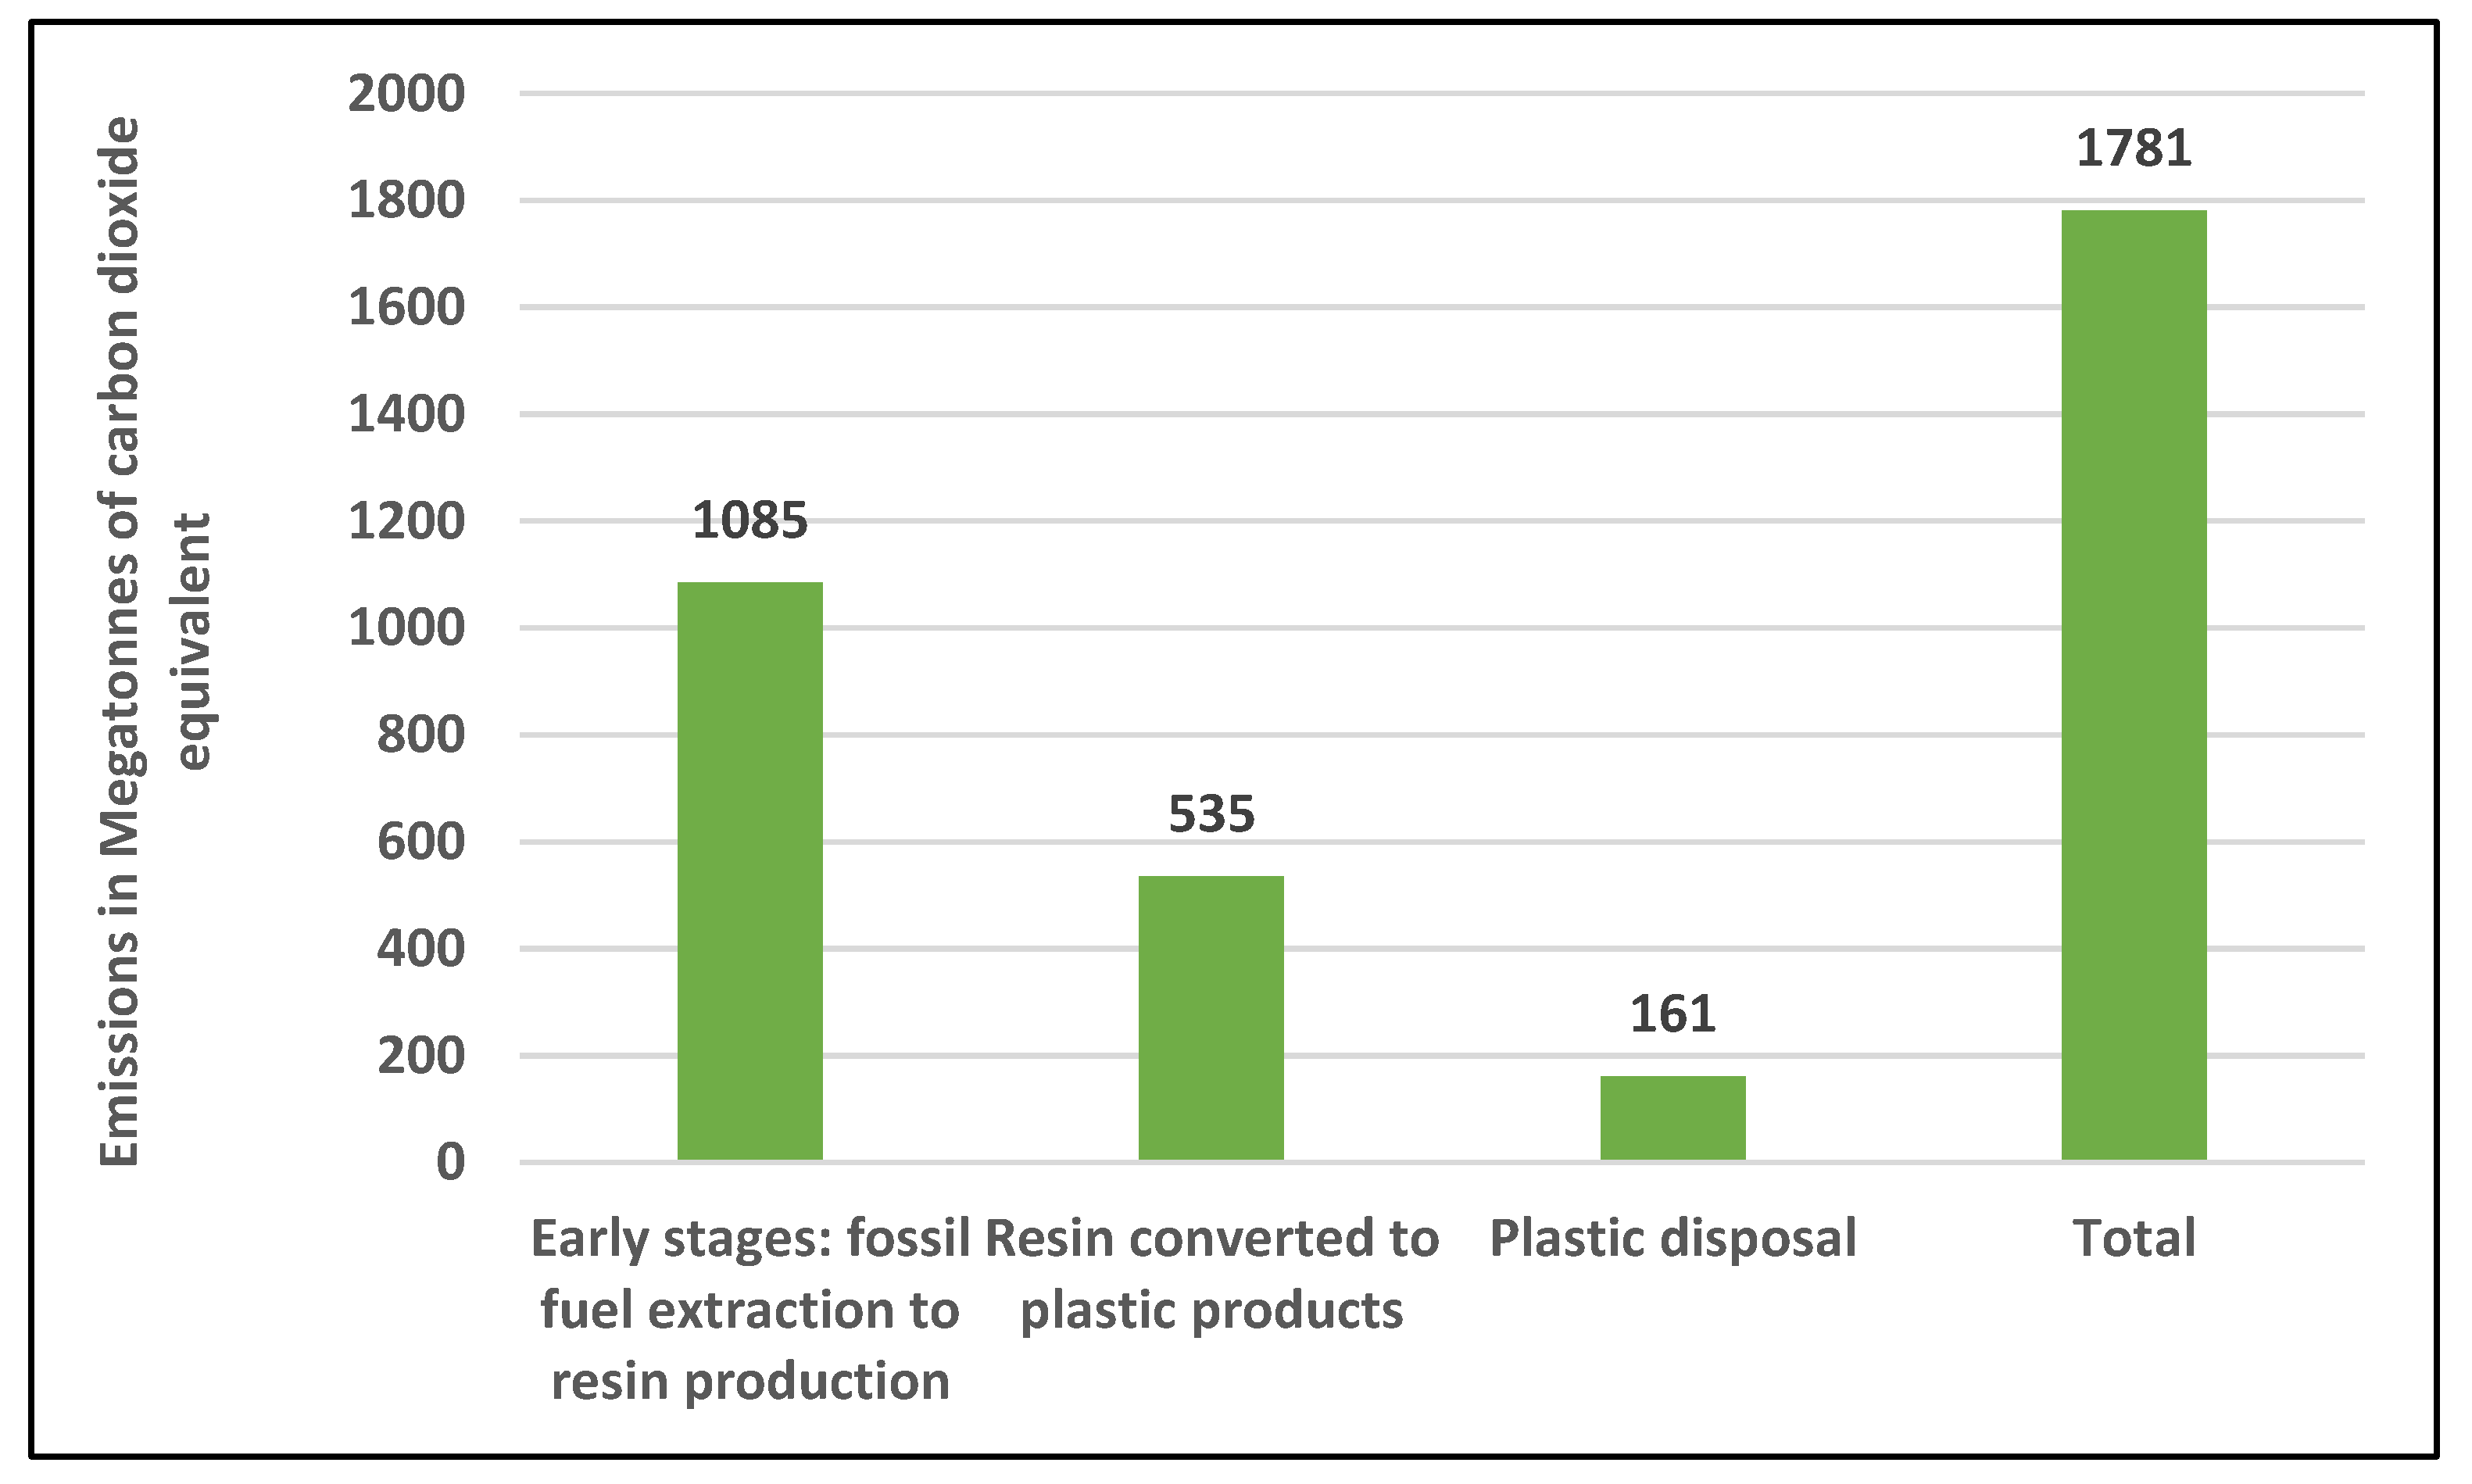
Figure 1. Emissions of carbon dioxide equivalent in 2015, based on data from [11].
Sustainability 12 08360 g001
Figure 2. Plastic degradation timeline, based on data from [7].
Sustainability 12 08360 g002
Figure 3. Share of species that have ingested plastic waste in 2015, based on data from [17].
Sustainability 12 08360 g003
Figure 4. Share of species that have been entangled in plastic waste in 2015, based on data from [19].
Sustainability 12 08360 g004
Figure 5. Number of plastic waste objects found globally on shorelines by packaging material, based on data from [32].
Sustainability 12 08360 g005
Figure 6. Plastic waste produced and mismanaged globally, 2010 [33], credit: Maphoto/Riccardo Pravettoni (https://www.grida.no/resources/6931).
Sustainability 12 08360 g006
Figure 7. Share of global mismanaged waste, 2010, image from [7].
Sustainability 12 08360 g007
Figure 8. Plastic Waste Management in USA: 1960–2017, image from [34].
Sustainability 12 08360 g008
Figure 9. Sources of plastic waste imports into China in 2016 and cumulative plastic waste export tonnage (in million tonnes) in 1988–2016. White represents countries with no reported exported plastic waste. Image from [37].
Sustainability 12 08360 g009
Figure 10. (a) Composition of Municipal Solid Waste in Sub-Saharan Africa and (b) Composition of Municipal Solid Waste Globally, based on data from [43].
Sustainability 12 08360 g010
Figure 11. SA Plastics Market Sectors, based on data from [44].
Sustainability 12 08360 g011
Figure 12. Europe Plastics Market Sectors, based on data from [44].
Sustainability 12 08360 g012
Figure 13. Waste per sector, 2015, image from [6].
Sustainability 12 08360 g013
Figure 14. Global plastics market share in 2019, image from [45].
Sustainability 12 08360 g014
Figure 15. Straws.
Figure 15. Straws.
Sustainability 12 08360 g015
Figure 16. Cotton bud sticks.
Sustainability 12 08360 g016
Figure 17. Lollipop sticks and wrappers.
Sustainability 12 08360 g017
Figure 18. Beverage bottles.
Sustainability 12 08360 g018
Figure 19. Lids.
Figure 19. Lids.
Sustainability 12 08360 g019
Figure 20. Disposable cups.
Sustainability 12 08360 g020
Figure 21. Cigarette butts.
Sustainability 12 08360 g021
Figure 22. Polystyrene clamshells and disposable cups.
Sustainability 12 08360 g022
Figure 23. Disposable cutlery.
Sustainability 12 08360 g023
Figure 24. Plastic wrap.
Sustainability 12 08360 g024
Figure 25. Food packaging.
Sustainability 12 08360 g025
Figure 26. Plastic bags.
Sustainability 12 08360 g026
Figure 27. Most common items found in the International Coastal Ocean Clean up in 2018, based on data from [53].
Sustainability 12 08360 g027
Figure 28. Global bioplastics production in 2019 by market segment, image from [69].
Sustainability 12 08360 g028
Figure 29. Global bioplastics production in 2019 by region, image from [69].
Sustainability 12 08360 g029
Figure 30. Market value of biodegradable plastics worldwide from 2018 to 2027 in billion U.S. dollars, based on data from [81].
Sustainability 12 08360 g030
Figure 31. Smoke from burning rubbish in Mocuba District, Mozambique. Credit: Ralph Hodgson [13].
Sustainability 12 08360 g031
Figure 32. Plastic waste burning. Credit: Hazel Thompson [13].
Sustainability 12 08360 g032
Figure 33. Tejipio River, in Recife Brazil, clogged with plastic waste. Credit: Moises Lucas Lopes da Silva [13].
Sustainability 12 08360 g033
Figure 34. More plastic pollution. Credit: Hazel Thompson [13].
Sustainability 12 08360 g034
Figure 35. Plastic pollution in Guatemala. Credit: Juan Pablo Moreiras [13].
Sustainability 12 08360 g035
Figure 36. PET Recycled between 2005 and 2018. Data sourced from [224].
Sustainability 12 08360 g036
Figure 37. Comparison of recycling rates between countries with a DRS and the United Kingdom, which does not have a DRS system for PET in 2016 [226] (based on data from CM Consulting).
Sustainability 12 08360 g037
Figure 38. (ac): Typical sightings of Littered beverage bottles in Johannesburg, South Africa (credit: Mazhandu).
Sustainability 12 08360 g038
Figure 39. Plastic in the marine environment (generated by the authors).
Sustainability 12 08360 g039
Figure 40. Plastic on land (generated by the authors).
Sustainability 12 08360 g040
Figure 41. Some sources of microplastics in humans (credit: unsplash.com). (a) Expossure to microplastics from drinking water; (b) Exposure to microplastics from salt; (c) Exposure to microplastics from seafood.
Sustainability 12 08360 g041
Figure 42. Post-consumer plastic value (generated by the authors).
Sustainability 12 08360 g042
Figure 43. Comparisons between manufacturing and capture rate and investments made (generated by the authors).
Sustainability 12 08360 g043
Figure 44. Socio-economic and environmental impacts from mismanaged plastic waste (generated by the authors).
Sustainability 12 08360 g044
Figure 45. Effect of mismanaged plastic waste on the global goals (generated by the authors).
Sustainability 12 08360 g045
Figure 46. Key questions to be answered (generated by the authors).
Sustainability 12 08360 g046
Figure 47. Summary of benefits of reclaiming plastic (generated by the authors).
Sustainability 12 08360 g047
Figure 48. Summary of potential benefits of bio-based biodegradable plastics (generated by the authors).
Sustainability 12 08360 g048
Figure 49. Summary of limitations of bio-based biodegradable plastics (generated by the authors).
Sustainability 12 08360 g049
Table 1. Global plastic statistics from 1950 to 2015, based on data from [6].
Total plastic production in 1950 (million tonnes)2
Total plastic production in 2015 (million tonnes)380
Cumulative plastic production up to 2015 (billion tonnes)8.3
Cumulative plastics that outlived usefulness and became waste (billion tonnes) between 1950 to 20156.3
Percent of plastics sitting in landfills/natural environment79
Percent of plastics incinerated12
Percent of plastics recycled9
Table 2. Search engines, academic databases, and key words/phrases used.
Search Engines and DatabaseKey Words and Phrases
Search Engines
  • Google
  • Google scholar
Academic Research Databases
  • American Chemical Society (ACS) Publications
  • MDPI
  • National Center for Biotechnology Information (NCBI)
  • ScienceDirect
  • Scopus
  • SpringerLink
  • Statista
  • Wiley Online Library
  • global plastics trends,
  • plastic pollution impacts,
  • single use plastics,
  • marine litter,
  • plastic waste management,
  • bioplastics, bio-based polymers,
  • biodegradable plastics,
  • advantages and disadvantages of biodegradable plastics,
  • synthesis and feedstocks of biodegradable plastics,
  • biodegradable polycarbonates synthesis feedstocks,
  • biosynthesis characterization feedstock for PHA,
  • synthesis of polylactic acid from agricultural residues,
  • Extended producer responsibility,
  • Deposit refund scheme,
  • mechanical recycling,
  • plastic pollution declarations, agreements and conventions.
Table 3. Polyhydroxyalkanoates (PHAs) feedstocks as reviewed by the authors.
Polyhydroxyalkanoates (PHAs)
FeedstockYearAuthors
Glucose2007[104]
Paper mill wastewater2008[105]
Fermented olive oil mill wastewater2009
2019
[106]
[107]
Fermented sugar cane molasses2010
2010
[108]
[109]
Crude palm kernel oil2012[110]
Tallow2013[111]
Cassava starch2014[112]
Municipal solid waste2016[113]
Fermented cheese whey2014
2017
2018
2019
[114]
[115]
[116]
[117]
Xylan2016[118]
Leguminous and fruit processing water2016[119]
Crude glycerol from bio-diesel production2016
2018
[120]
[121]
Macroalga (seaweed)2017
2018
2019
2020
[122]
[123]
[124]
[125]
Primary & secondary municipal wastewater sludge and Food waste2018[126]
Calophyllum inophyllum (native to Asia & Wallacea)-a large ever-green plant.2018[127]
Spent coffee grounds2018[128]
Wastepaper from municipal solid waste2019[129]
Corn starch2019[130]
Kenaf (Hibiscus cannabinus)
Grows in the wild in Africa. India, Thailand and China are leading producers.
2019[131]
Ragi husks (finger millet), sesame oil cake2020[94]
Sucrose2020[132]
Table 4. Polybutylene succinate (PBS) feedstocks, as reviewed by the authors.
Polybutylene Succinate (PBS)
FeedstockYearAuthors
Cheese whey2007[143]
Sugar cane molasses2008[144]
Straw2009[145]
Wheat2009[146]
Corn fiber2011[147]
Rapeseed meal2011[148]
Pinewood2014[149]
Carob pods2016[150]
Duckweed2016[151]
Citrus peels2017[152]
Apple pomace (solid waste from cider & apple juice making)2018[153]
Grape pomace (main by-product of the wine & grape juice industries)2018[154]
Sweet potato waste2019[155]
Coconut water2019[156]
Table 5. Polylactide (PLA) feedstocks, information acquired from [161].
Polylactide (PLA)
FeedstockYearAuthors
Corn cob molasses2010[168]
Sugar cane juice2011[169]
Sugar cane beet2012[170]
Crustacean waste2012[171]
Bread Stillage2013[172]
Waste Curcuma longa biomass2013[173]
Cotton seed2013[174]
Sugar cane molasses2013[175]
Xylo-oligosaccharides2015[176]
Corn stover2015[177]
Sweet sorghum juice2016[178]
Tobacco waste2016[179]
Coffee pulp2016[180]
Pulp mill residue2016[181]
Sugar cane bagasse2017[182]
Corn cob2018[183]
Dairy waste2018[184]
Potato stillage2018[185]
Kodo millet bran residue2018[186]
Wheat straw2018[187]
Brewer’s spent grain2018[188]
Table 6. Polycarbonates (PCs) feedstocks, information acquired from [195].
Polycarbonates (PCs)
FeedstockYearAuthors
Glycerol1994
2008
[201]
[202]
Plant oils1999
2012
2015
[203]
[204]
[205]
Lignocellulosic biomass, corn, sugar cane2006
2013
2015
2017
[206]
[207]
[208]
[209]
Oats, sugar cane, bagasse2009
2015
[210]
[211]
Castor oil plant2010[212]
Citrus oils, oak and pine tree2015
2016
2017
[213]
[214]
[215]
Crude glycerol, plant oils, food wastes2017[216]
Table 7. Global Frameworks, Declarations and Conventions Signed to Date to Protect the Marine Environment.
Framework/Declaration/CommitmentDate Signed/LaunchedNo. of Signatories/PartiesTargets/GoalAdditional Comments
London Convention on the Prevention of Marine Pollution by Dumping of Wastes and Other Matter [48]1972As of March 2018, there are 87 Contracting Parties to the London ConventionTo control sea pollution through marine dumpingThe United States of America is a contracting party
OSLO Dumping Convention [47]197213 signatoriesConvention for the Prevention of Marine Pollution by Dumping from Ships and Aircraftcontrol dumping of harmful substances from ships and aircraft into the sea, including plastic
International Convention for the Prevention of Marine Pollution from Ships, 1973 (MARPOL 73/78) and its revised Annex V [49,269]1973174 Member States and 3 Associate Members.prevention of pollution of the marine environment by ships from operational or accidental causes.complete ban imposed on the disposal into the sea of all forms of plastics.
Paris Convention [50,269]197413 countries for the prevention of marine pollution from land-based sourcesReplaced by OSPAR Convention of 1992
Barcelona Convention (The Convention for the Protection of the Mediterranean Sea against Pollution) [51,269]Initially adopted in 1976 and amended in 1995.22 countries as signatories (a)To reduce or eliminate marine pollution from sea and land-based sources.Legally Binding Regional Plan on Marine Litter Management.
After amendment in 1995, it became known as “Convention for the Protection of the Marine Environment and the Coastal Region of the Mediterranean”
Convention on Migratory Species of Wild Animals (Bonn Convention) [270]1979129 member statespreservation of wildlife and habitatsMarine animals such as turtles & cetaceans are included.
The Convention for Cooperation in the Protection, Management and Development of the Marine and Coastal Environment of the Atlantic Coast of the West, Central and Southern Africa Region (Abidjan Convention) 1981 [271]22 signatoriesTo protect the marine area from Mauritania to South Africa which (14,000 km).Provides an inclusive legal framework for all programmes in West, Central and Southern Africa
United Nations Convention on the Law of the Sea [269,272]1982168 parties& European UnionPrevention and control of marine pollutionIt is an international agreement birthed during the third United Nations Conference on the Law of the Sea (UNCLOS III)
Cartagena Convention for the Protection and Development of the Marine Environment of the Wider Caribbean Region [273]198326 parties out of 28 countriesPrevent, reduce and control marine pollution from various activities.It is legally binding.
Nairobi Convention [274]198510 contracting partiesTo protect the Western Indian Ocean RegionIt is a regional legal framework
The Convention for the Protection of Natural Resources and Environment of the South Pacific Region (Noumea Convention/SPREP Convention) [275]198612 Pacific Island Countriesumbrella agreement for the protection, of the marine and coastal environment of the South Pacific Region.Regional legal framework of the Action Plan for managing the Natural Resources and Environment of the South Pacific adopted in 1982.
Basel Convention on the Control of Transboundary Movements of Hazardous Wastes and their Disposal [42,269]1992187 members, 53 signatories. Haiti and America signed but yet to ratify.Minimise movement of hazardous waste between countries, especially from developed countries to less developed ones.Amended in 2019 in to include contaminated plastic waste.
Bucharest Convention [269,276]19926 countries (Bulgaria, Georgia, Romania, Russia, Turkey, Ukraine)Convention on the Protection of the Black Sea Against PollutionTo control land-based pollution sources, waste dumping and working jointly, and to clean accidents.
OSPAR Convention [269,277]199215 signatories plus the EUThe Convention for the Protection of the Marine Environment of the North-East AtlanticCombined the Oslo and Paris Conventions (1972 & 1974 respectively).
Helsinki Convention [269,278,279]199210 contracting partiesTo prevent and eradicate marine pollution in the Baltic Sea areaAlso known as the Convention on the Protection of the Marine Environment of the Baltic Sea Area
Regional action plan on marine litter management (RAPMALI) for the wider Caribbean region [280]2008 Management of litter in the Caribbean regionA regional framework.
Honolulu Strategy [269,281,282]2011Endorsed by 64 governments and the European CommissionIt is a framework for a comprehensive and global effort to prevent, reduce and control marine litter.Has three goals and associated strategies
Manilla Declaration [283]201265 Governments and the European CommissionProtection of the Marine Environment from Land-based ActivitiesGlobal Programme of Action
Rio +20 Declaration [20,269,284]2012over 375 participants from 169 organizations and 46 countriesSignificant reduction of marine litterAlso referred to as Rio Ocean Declaration
United Nations Environment Assembly Resolution 1/6 (UNEA I) [285]2014 Marine plastic debris and microplasticsFollowed by another resolution 2/11 (UNEA II) in 2016 also addressing similar issues.
G7 Action Plan to Combat Marine Litter [286]2015 7 countriesCombating marine litter, specifically plastic.This was followed by another Action Plan in 2017 by G20 countries.
CONVENTION ON BIOLOGICAL DIVERSITY (CBD) XIII/10 [269,287]2016196 states Addressing impacts of marine debris.anthropogenic underwater noise on marine and coastal biodiversity is also assessed
G7 Ise-Shima Leaders’ Declaration [269]20167 countriesprevention and reduction of marine litter, specifically plastic, from land-based sources.Advocating for efforts on resource efficiency and the 3Rs (Reduce, Reuse, Recycle)
G20 Action Plan on Marine Litter [269]201719 countries and the European Union.To significantly reduce and prevent marine litter by 2025 in support of the United Nations’ SDG 14 target.It is voluntary, not legally binding, countries do not feel compelled to act.
Global Network of the Committed (GNC) [269]201719 countries and the European Union.A platform to assist in the implementation of the G20 Action Plan. Its goal is to address marine litterVoluntary. Its linked to the UNEP´s Global Partnership on Marine Litter (GPML)
Osaka Blue Ocean Vision G20 [288]201919 countries and the European Union.To reduce additional pollution by marine plastic litter to zero by 2050 through a comprehensive life-cycle approachBuilds on to the 2017 Action Plan. Remains voluntary. The importance of plastic is also acknowledged.