To What Extent Can the Green Belts Prevent Urban Sprawl?—A Comparative Study of Frankfurt am Main, London and Seoul


Abstract
:1. Introduction
- Has designation of the green belts as urban growth management tools significantly affected urban sprawl even in strict implementations of the policy?
- To what extent have the different urban growth pressures affected the green belt’s efficacy in preventing urban sprawl?
2. Data and Methodology
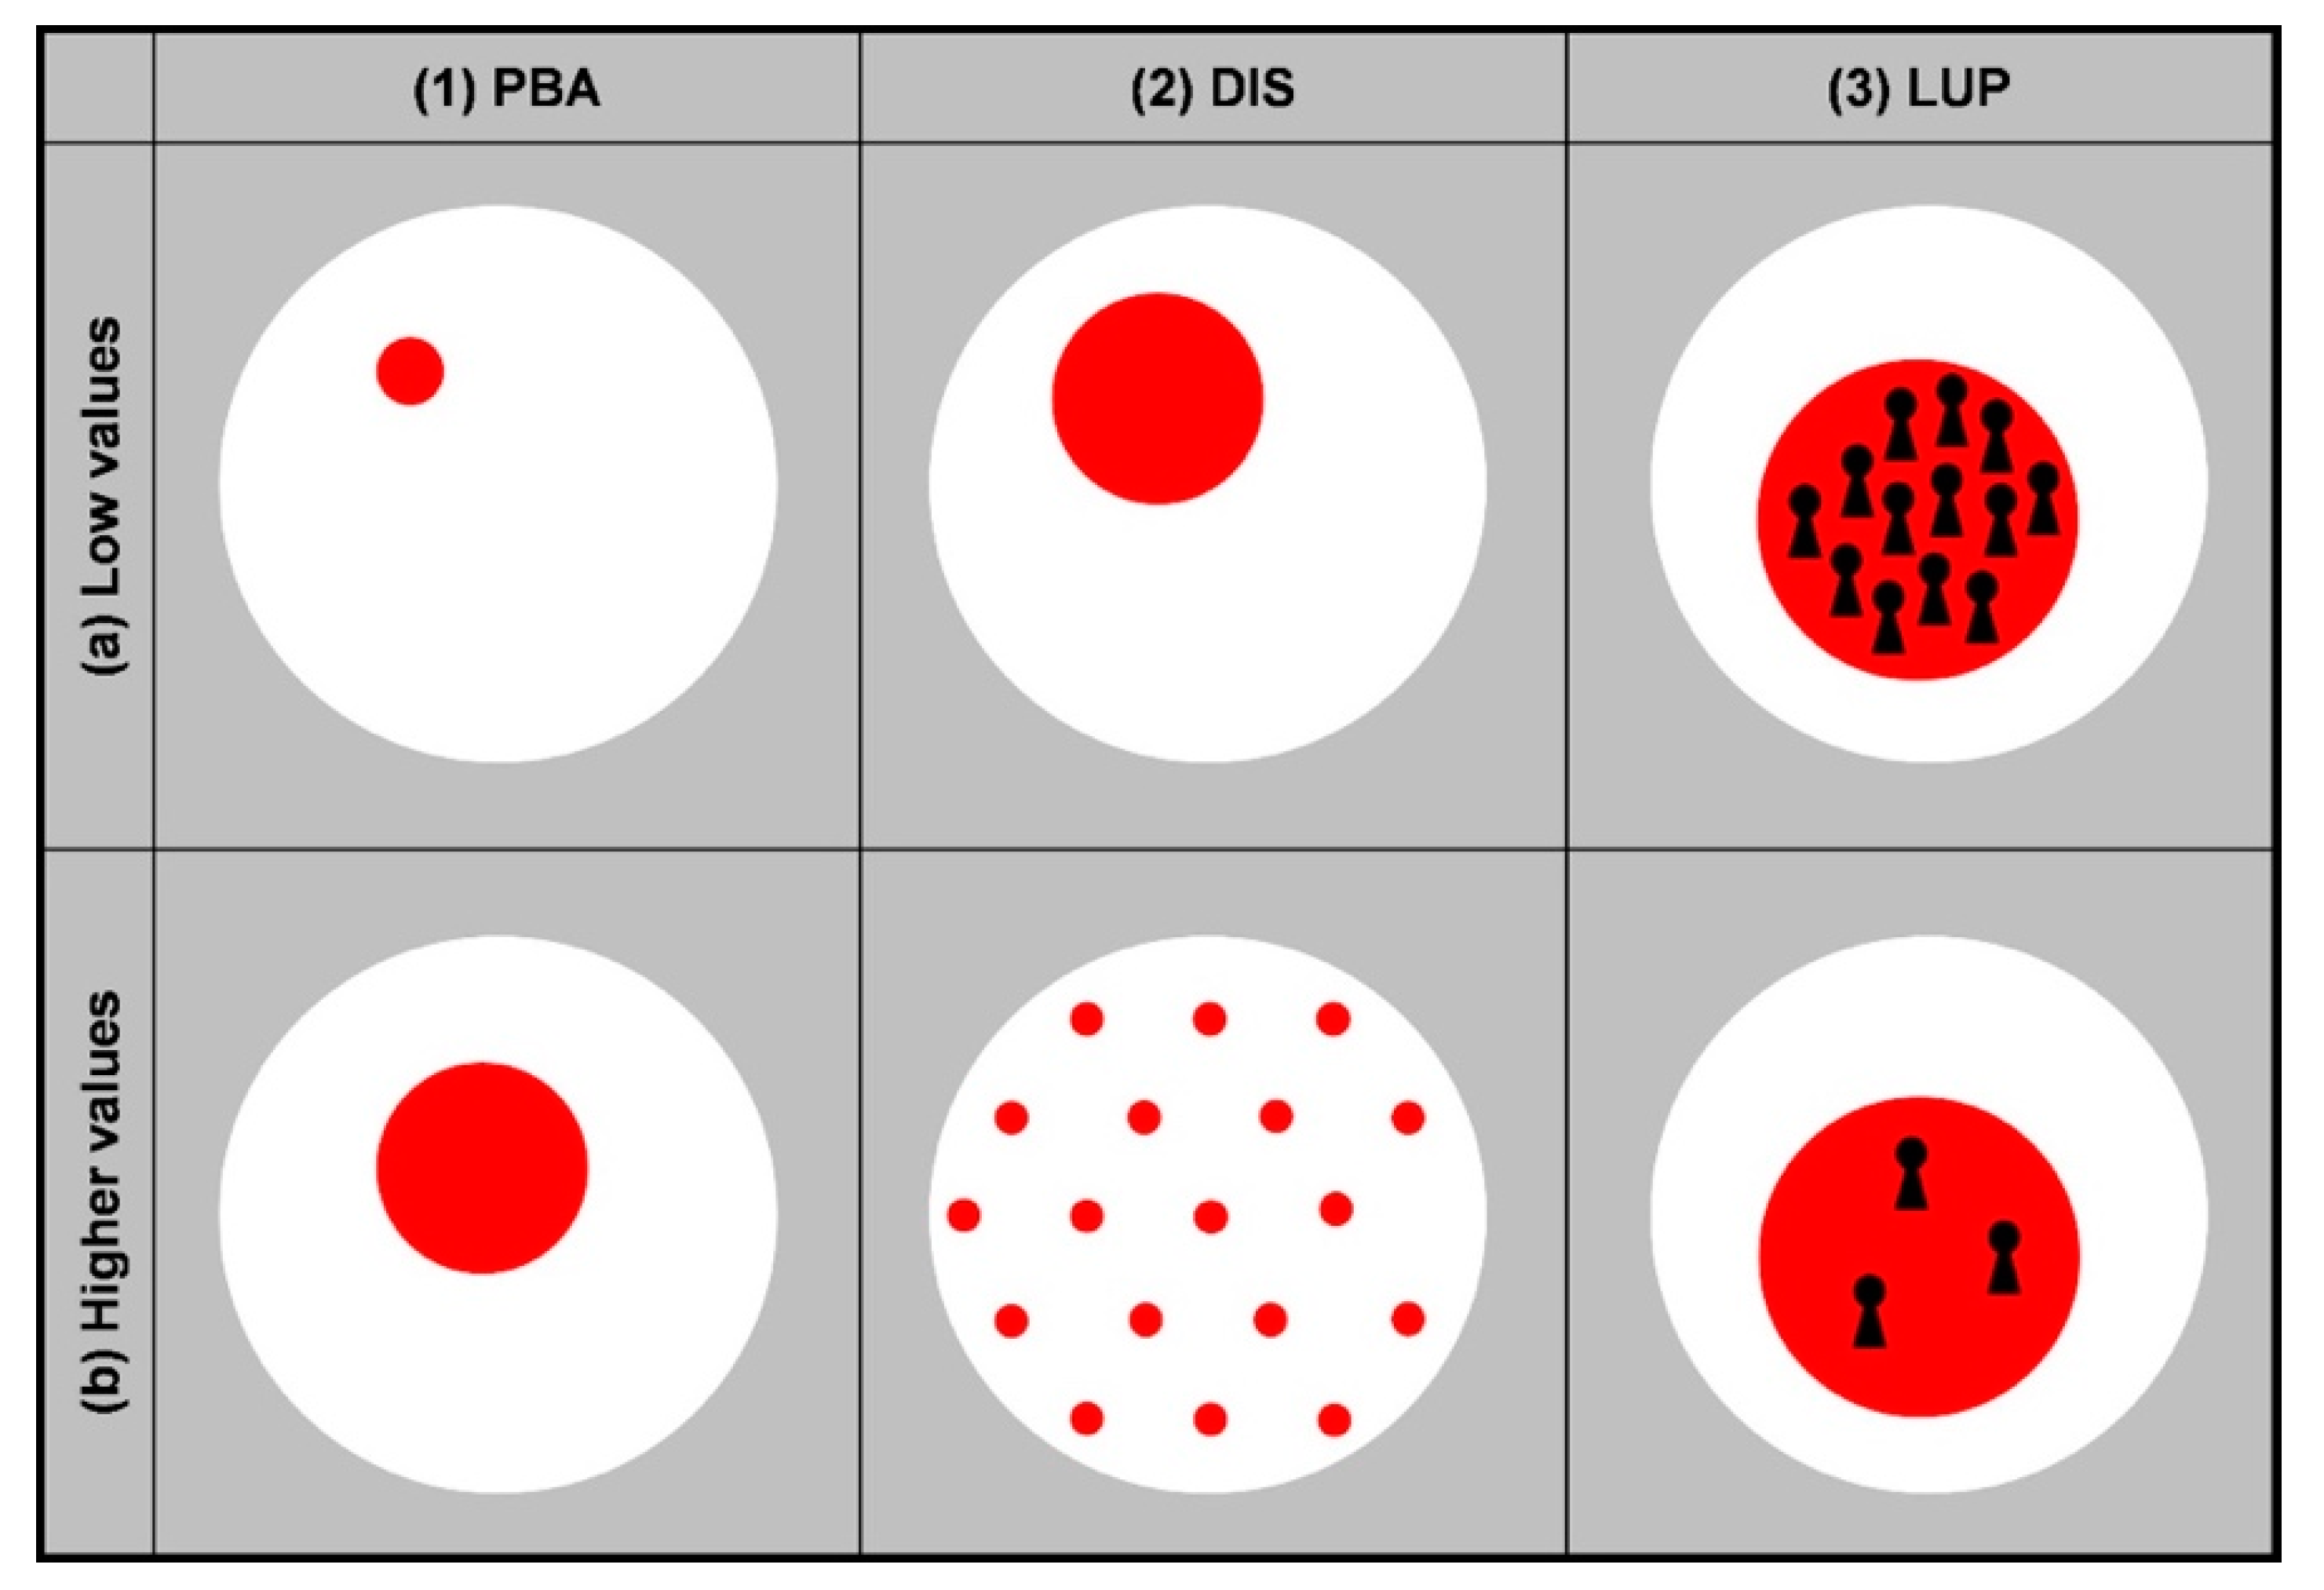
2.1. Methodological Framework
2.2. Input Data and Data Processing
2.3. Data Processing
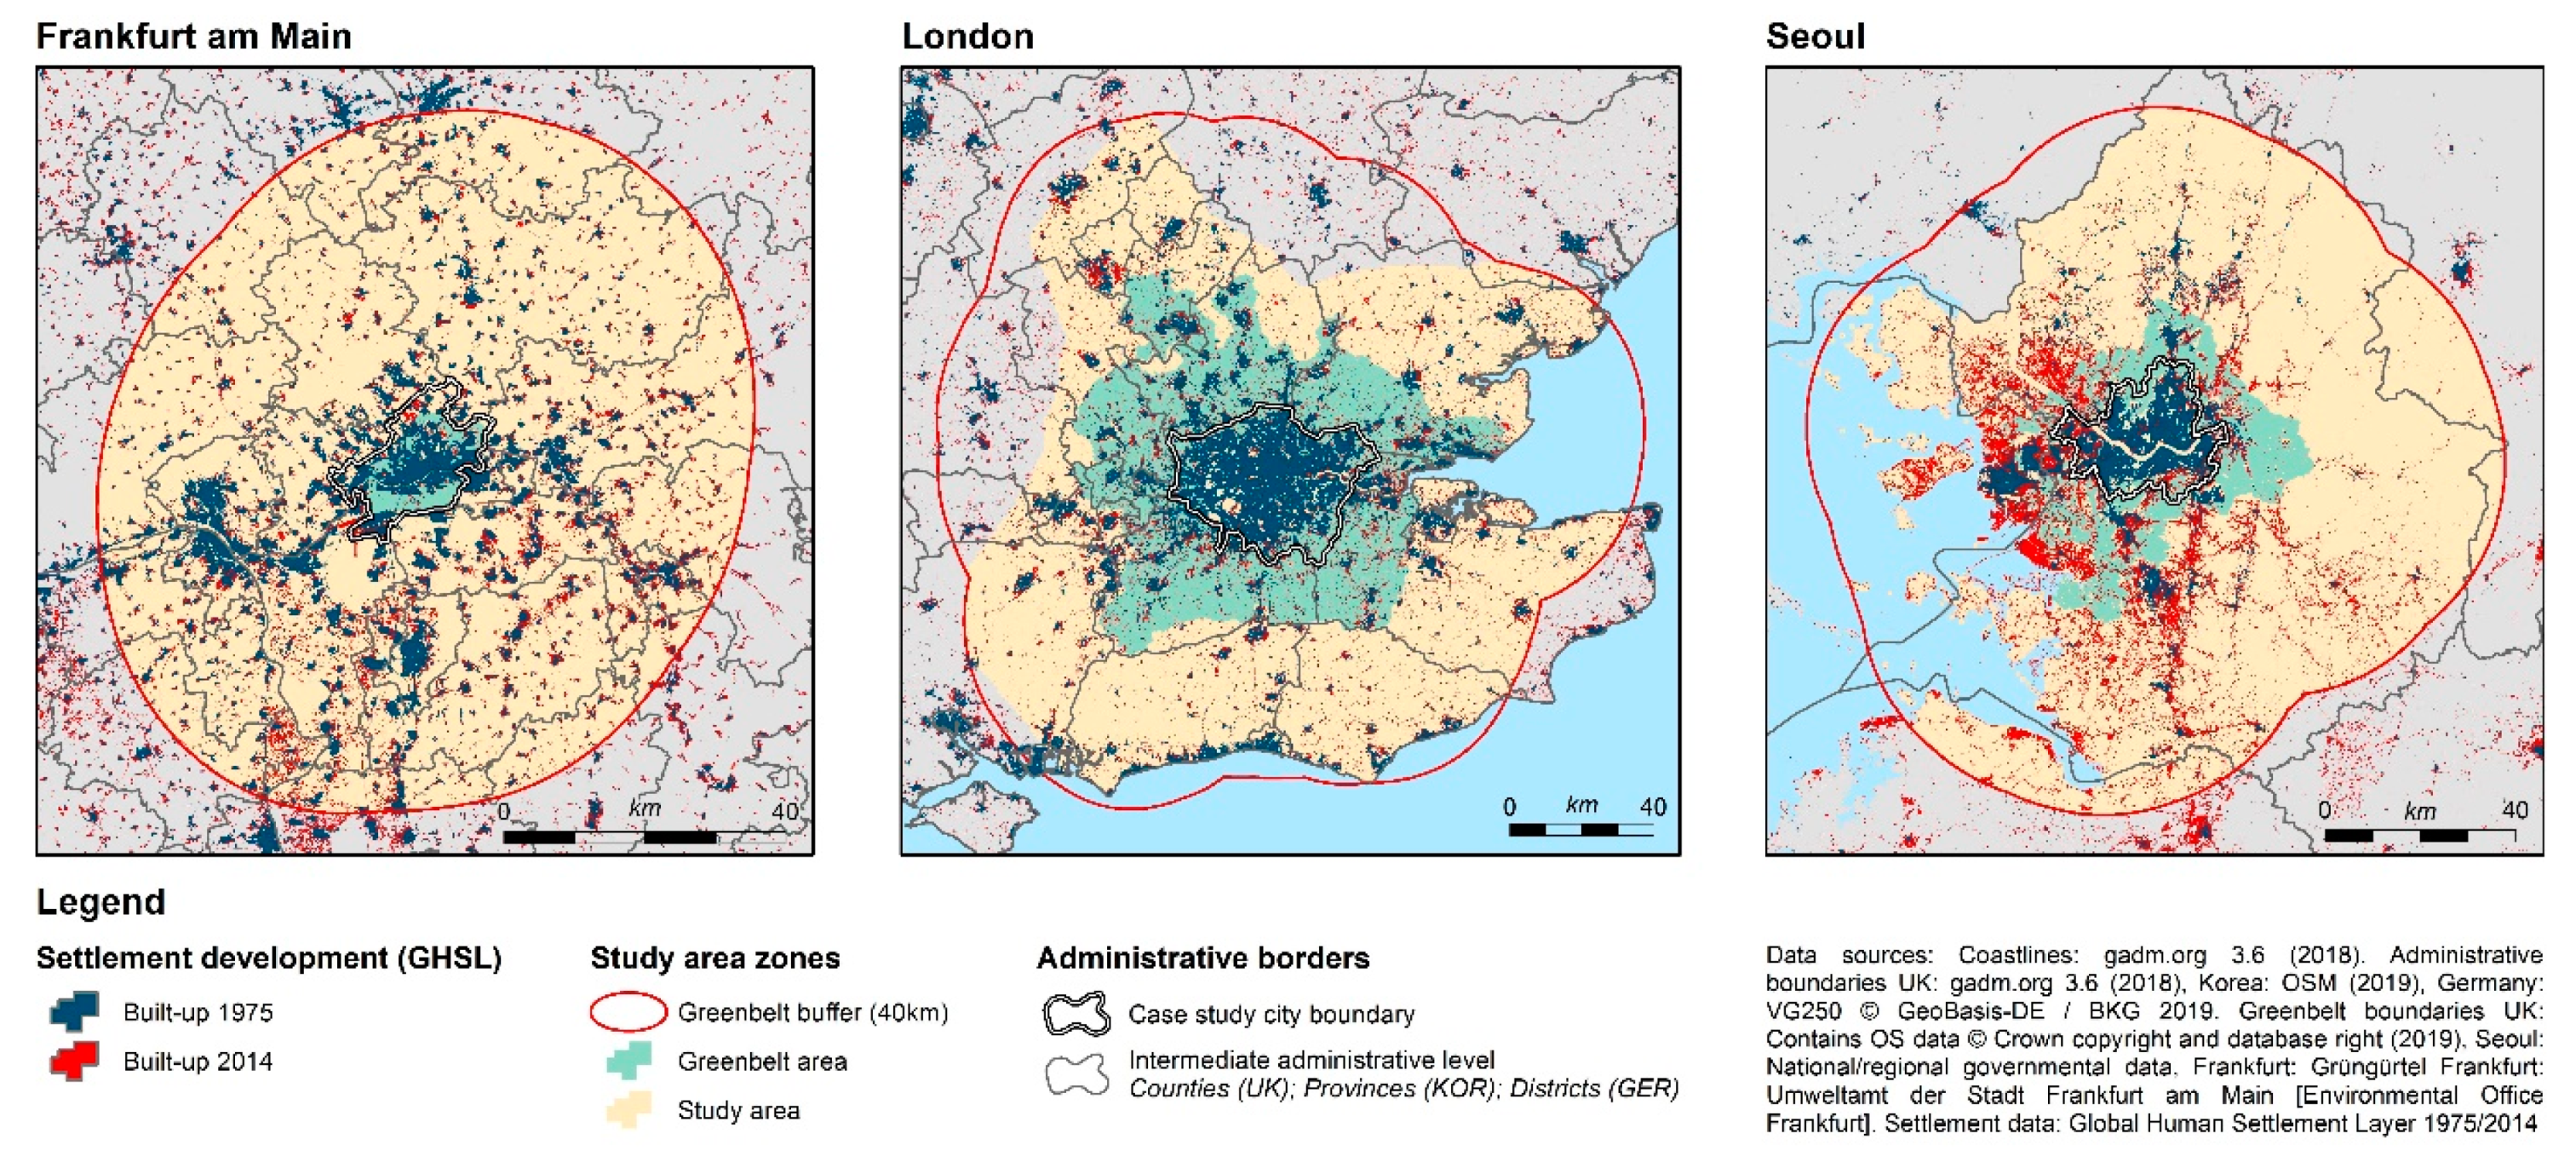
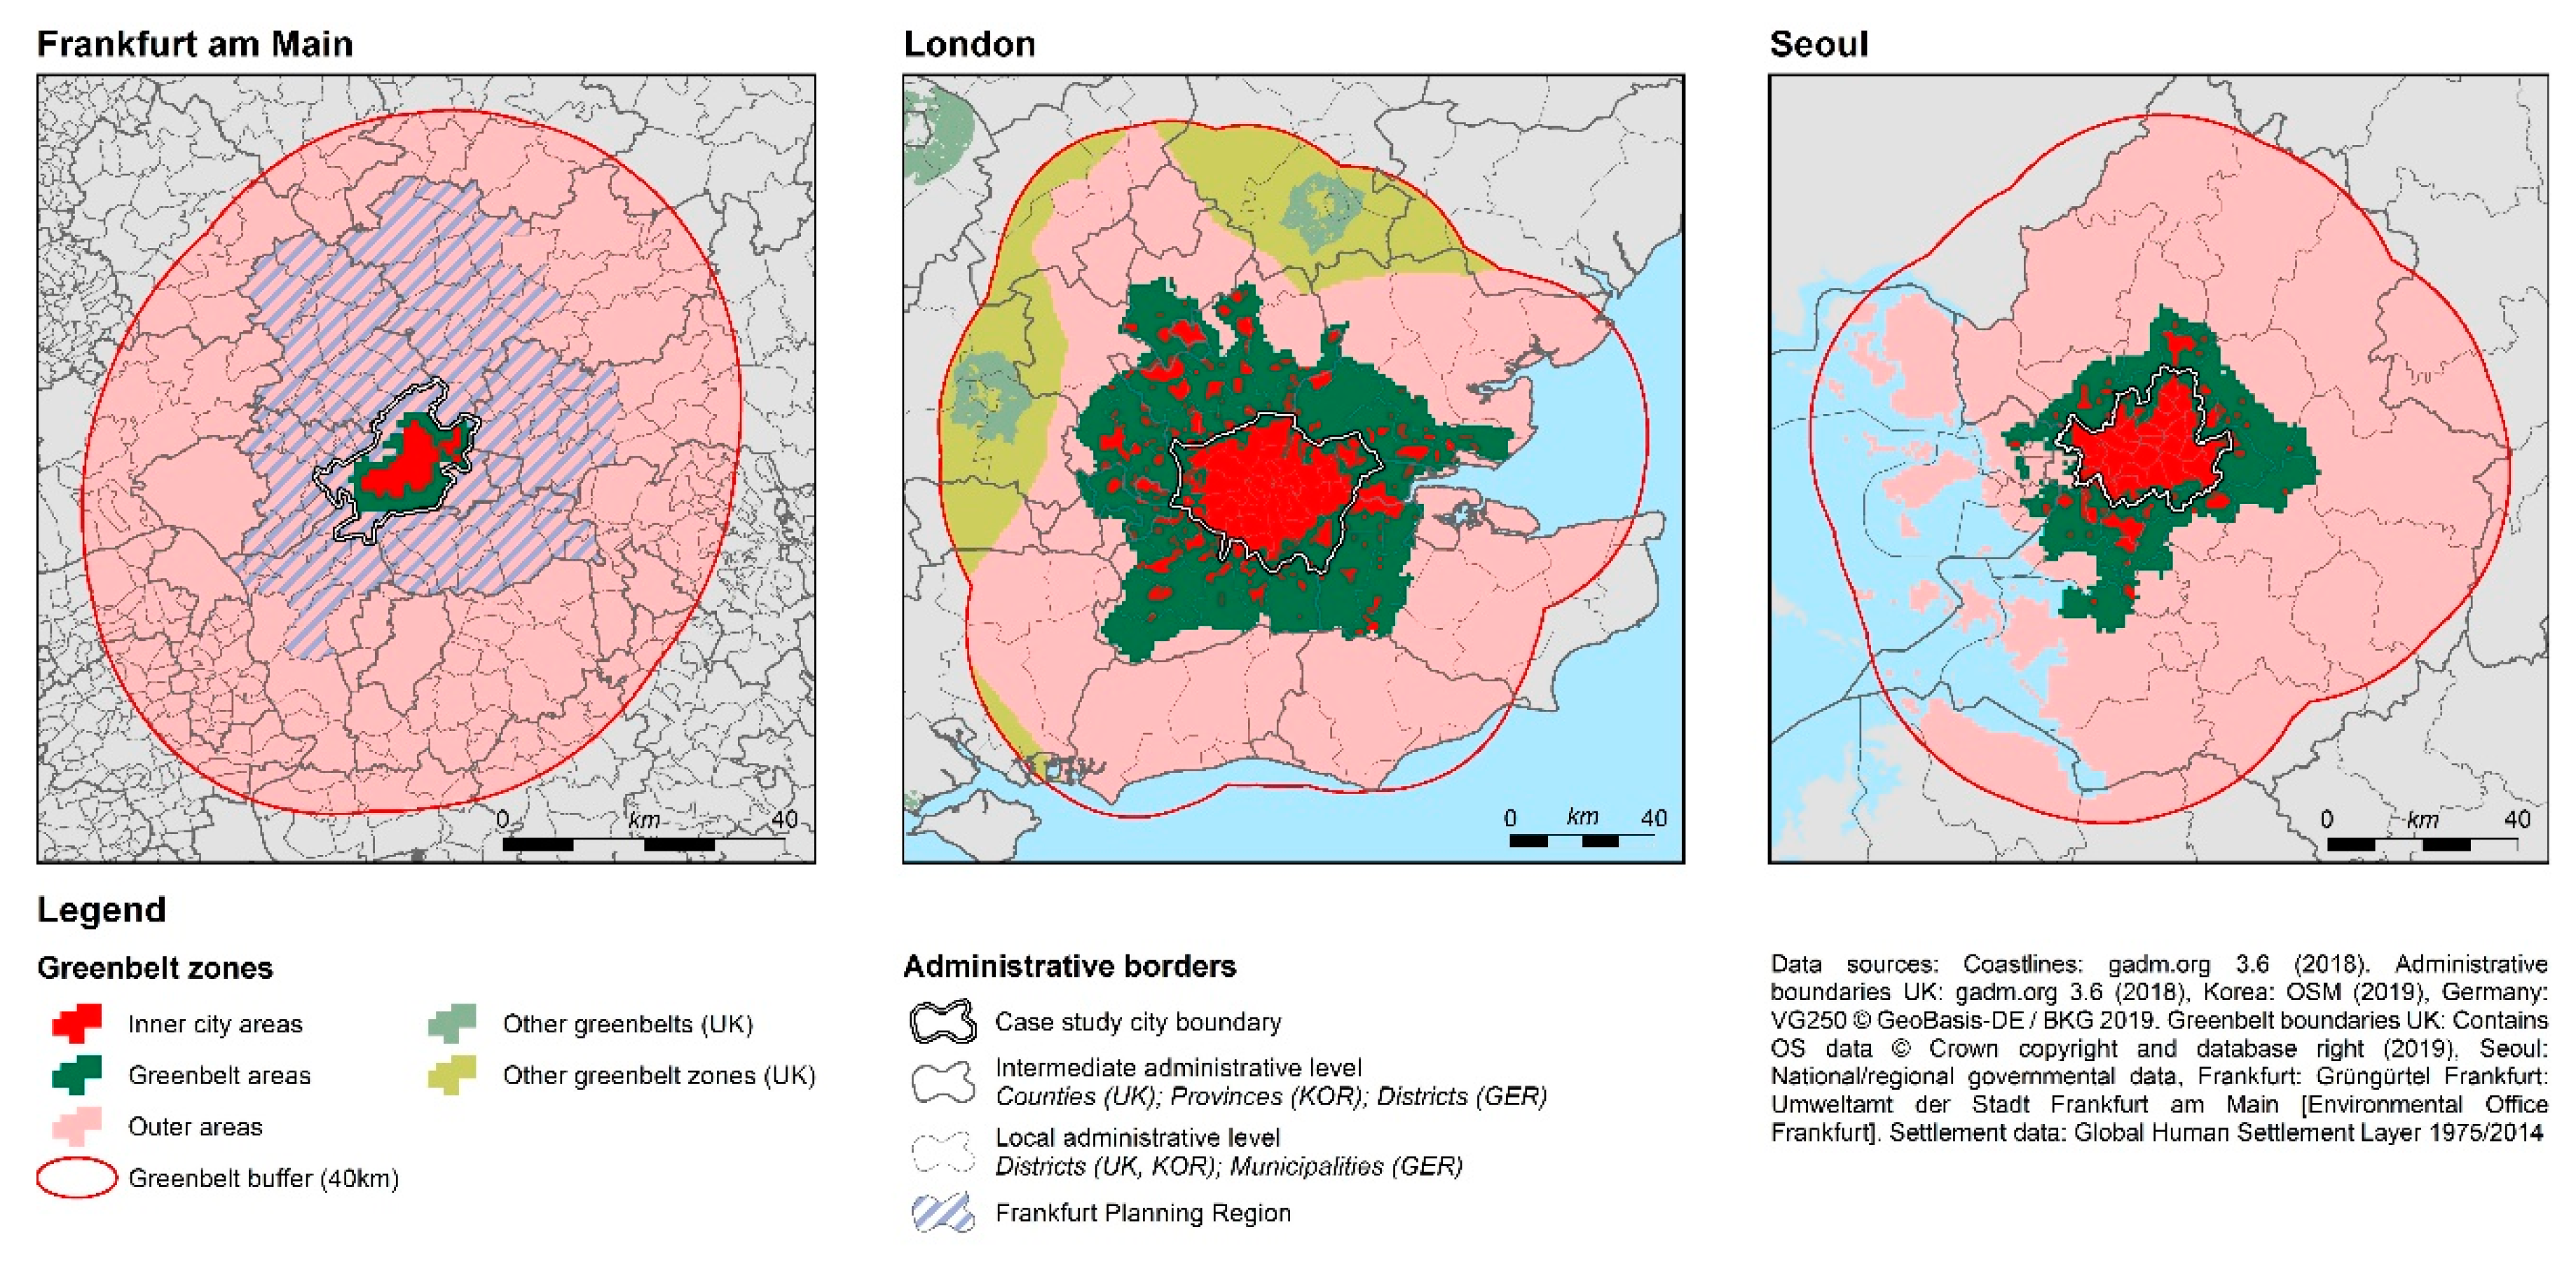
3. The Green Belts in Frankfurt am Main, London, and Seoul
3.1. The Frankfurt Green Belt
3.2. The London Green Belt
3.3. The Seoul Green Belt
4. Results
5. Conclusions
Author Contributions
Funding
Conflicts of Interest
References
- European Environment Agency (EEA). Urban Sprawl in Europe: The Ignored Challenge; Office for Official Publications of the European Communities: Luxembourg, 2006. [Google Scholar]
- Petty, W. Another essay in Political Arithmetick, concerning the growth of the city of London with the measures, periods, causes, and consequences thereof. In The Economic Writings of Sir William Petty, together with The Observations upon Bills of Mortality, More Probably by CAPTAIN; Graunt, J., Hull, C.H., Eds.; Cambridge University Press: Cambridge, UK, 1899. [Google Scholar]
- Claudius, J. Hints on breathing places for metropolis, and for country towns and villages, on fixed principles. Gard. Mag. 1829, 5, 686–690. [Google Scholar]
- Howard, E. Garden Cities of To-morrow, 2nd ed.; S. Sonnenschein & Co: London, UK, 1902; pp. 2–7. [Google Scholar]
- MacKaye, B. The New Exploration: A Philosophy of Regional Planning; University of Illinois Press: Chicago, IL, USA, 1928. [Google Scholar]
- Amati, M. Urban Green Belts in the Twenty-First Century; Ashgate Publishing Company Press: Hampshire, UK, 2008. [Google Scholar]
- Kim, J.; Kim, T.K. Issues with green belt reform in the Seoul metropolitan area. In Urban Green Belts in the Twenty-first Century; Amati, M., Ed.; Ashgate Publishing Company Press: Hampshire, UK, 2008; pp. 37–57. [Google Scholar]
- Watanabe, T.; Amati, M.; Endo, K.; Yokohari, M. The Abandonment of Tokyo’s Green Belt and the Search for a New Discourse of Preservation in Tokyo’s Suburbs. In Urban Green Belts in the Twenty-first Century; Amati, M., Ed.; Ashgate Publishing Company Press: Hampshire, UK, 2008; pp. 21–37. [Google Scholar]
- Morita, T.; Nakagawa, Y.; Morimoto, A.; Maruyama, M.; Hosokawa, Y. Changes and Issues in Green Space Planning in the Tokyo Metropolitan Area: Focusing on the Capital Region Plan. Int. J. GEOMATE 2012, 2, 191–196. [Google Scholar] [CrossRef]
- Freestone, R. Sydney’s green belt 1945-1960: Stop laughing this is serious. Aust. Plan. 1992, 30, 70–77. [Google Scholar] [CrossRef]
- Hall, P. London 2000; Faber & Faber: London, UK, 1963. [Google Scholar]
- Town and Country Planning Association (TCPA). London under Stress: A Study of the Planning Policies Proposed for London and its Region; TCPA: London, UK, 1970. [Google Scholar]
- Hall, P.; Thomas, R.; Gracey, H.; Drewett, R. The Containment of Urban England; Sage Publications: London, UK, 1973. [Google Scholar]
- Breheny, M.; Hall, P. The People-Where Will They Go? TCPA: London, UK, 1996. [Google Scholar]
- Town and Country Planning Association (TCPA). Green Belt-TCPA Policy Statement; TCPA: London, UK, 2002. [Google Scholar]
- Son, J.-Y.; Kim, K.-H. Analysis of urban land shortages: The case of Korean cities. J. Urban Econ. 1998, 43, 362–384. [Google Scholar] [CrossRef]
- Bae, C.-H.C. Korea’s greenbelts: Impacts and options for change. Pac. Rim Law Policy J. 1998, 7, 479–502. [Google Scholar]
- Lee, C.-M.; Linneman, P. Dynamics of the greenbelt amenity effect on the land market: The case of Seoul’s greenbelt. Real Estate Econ. 1998, 26, 107–129. [Google Scholar] [CrossRef]
- Nelson, A.C. An empirical note on how regional urban containment policy influences an interaction between greenbelt and exurban land markets. J. Am. Plan. Assoc. 1988, 54, 178–184. [Google Scholar] [CrossRef]
- Lee, C.-M.; Fujita, M. Efficient configuration of a greenbelt: Theoretical modeling of the greenbelt amenity. Environ. Plan. A Econ. Space 1997, 29, 1999–2017. [Google Scholar] [CrossRef]
- Dawkins, C.J.; Nelson, A.C. Urban containment policies and housing prices: An international comparison with implications for future research. Land Use Policy 2002, 19, 1–12. [Google Scholar] [CrossRef]
- Monk, S.; Whitehead, C.M.E. Evaluating the economic impact of planning controls in the United Kingdom: Some implications for housing. Land Econ. 1999, 75, 74–93. [Google Scholar] [CrossRef]
- Holmans, A. More Households to be Housed: Where is the Increase in Households Coming from: Technical Document; Cambridge Centre for Housing and Planning Research: Cambridge, UK, 2006. [Google Scholar]
- Elson, M.J. Green Belts: Conflict Mediation in the Urban Fringe; Heinemann: London, UK, 1986. [Google Scholar]
- Siedentop, S.; Fina, S.; Krehl, A. Greenbelts in Germany’s regional plans: An effective growth management policy? Landsc. Urban Plan. 2016, 145, 71–82. [Google Scholar] [CrossRef]
- Kim, J.I.; Hyun, J.Y.; Lee, S.G. The effects of releasing greenbelt restrictions on land development in the case of medium-sized cities in Korea. Sustainability 2019, 11, 630. [Google Scholar] [CrossRef] [Green Version]
- Bengston, D.N.; Youn, Y.C. Urban containment policies and the protection of natural areas: The case of Seoul’s greenbelt. Ecol. Soc. 2006, 11, 3. Available online: http://www.ecologyandsociety.org/vol11/iss1/art3/ (accessed on 5 September 2019). [CrossRef]
- Angel, S.; Blei, A.M.; Parent, J.; Lamson-Hall, P.; Sánchez, N.G.; Civco, D.L.; Lei, R.Q.; Thom, K. Atlas of Urban Expansion-2016 Edition; Volume 1: Areas and Densities. 2016. Available online: https://www.lincolninst.edu/sites/default/files/pubfiles/atlas-of-urban-expansion-2016-volume-1-full.pdf (accessed on 5 September 2019).
- Available online: https://statistik.hessen.de/ (accessed on 5 September 2019).
- Available online: https://data.london.gov.uk/dataset/population-change-1939-2015 (accessed on 5 September 2019).
- Korean Statistical Information Service. Available online: http://www.index.go.kr/potal/main/ (accessed on 12 August 2019).
- Jaeger, J.A.G.; Bertiller, R.; Schwick, C.; Cavens, D.; Kienast, F. Urban permeation of landscapes and sprawl per capita: New measures of urban sprawl. Ecol. Indic. 2010, 10, 427–441. [Google Scholar] [CrossRef]
- Jaeger, J.A.G.; Schwick, C. Improving the measurement of urban sprawl: Weighted Urban Proliferation (WUP) and its application to Switzerland. Ecol. Indic. 2014, 38, 294–308. [Google Scholar] [CrossRef]
- Schwick, C.; Jaeger, J.A.G.; Hersperger, A.; Cathomas, G.; Muggli, R. Measuring and Limiting Urban Sprawl-Measures and Targets for Switzerland, its Cantons, and its Municipalities (German title: Zersiedelung messen und Begrenzen-Massnahmen und Zielvorgaben für Die Schweiz, ihre Kantone und Gemeinden); Haupt-Verlag: Bern, Switzerland, 2018. [Google Scholar]
- Swiss Federal Statistical Office, Section Environment, Sustainable Development, Territory. MONET 2030: Urban sprawl. Available online: https://www.bfs.admin.ch/bfs/en/home/statistics/sustainable-development/monet-2030/all-indicators/11-villes-communautes/urban-sprawl.html. (accessed on 5 September 2019).
- Pesaresi, M.; Melchiorri, M.; Siragusa, A.; Kemper, T. Atlas of the Human Planet 2016. Mapping Human Presence on Earth with the Global Human Settlement Layer; Science for Policy report; Publications Office of the European Union: Luxembourg, 2016; Available online: http://publications.jrc.ec.europa.eu/repository/bitstream/JRC103150/atlas%20of%20the%20human%20planet_2016_online.pdf (accessed on 5 September 2019).
- Pesaresi, M.; Ehrlich, D.; Ferri, S.; Florczyk, A.J.; Freire, S.; Halkia, M.; Julea, A.; Kemper, T.; Soille, P.; Syrris, V. Operating Procedure for the Production of the Global Human Settlement Layer from Landsat Data of the Epochs 1975, 1990, 2000, and 2014; Joint Research Centre Technical, JRC977052016. 2016. Available online: http://publications.jrc.ec.europa.eu/repository/handle/JRC97705 (accessed on 5 September 2019).
- Florczyk, A.J.; Corbane, C.; Ehrlich, D.; Freire, S.; Kemper, T.; Maffenini, L.; Melchiorri, M.; Pesaresi, M.; Politis, P.; Schiavina, M.; et al. GHSL Data Package 2019; EUR 29788 EN; Publications Office of the European Union: Luxembourg, 2019; ISBN 978-92-76-08725-0. Available online: https://ghsl.jrc.ec.europa.eu/documents/GHSL_Data_Package_2019.pdf (accessed on 5 September 2019). [CrossRef]
- Available online: https://gadm.org/data.html (accessed on 5 September 2019).
- Available online: http://www.ordnancesurvey.co.uk/business-and-government/licensing/using-creating-data-with-os-products/os-opendata.html. (accessed on 5 September 2019).
- Available online: https://data.gov.uk/dataset/d7fcc345-6028-4266-836c-1d7cc6b034c5/english-local-authority-green-belt-dataset. (accessed on 5 September 2019).
- Available online: https://www.frankfurt.de/sixcms/detail.php?id=2805. (accessed on 13 December 2019).
- Available online: https://www.friedrichvonborries.de/de/projekte/strahlen-und-speichen. (accessed on 13 December 2019).
- Available online: https://www.regionalpark-rheinmain.de. (accessed on 13 December 2019).
- Thomas, D. London’s Green Belt: The Evolution of an Idea. Geogr. J. 1963, 129, 14–24. [Google Scholar] [CrossRef]
- Available online: https://londongreenbeltcouncil.org.uk. (accessed on 14 December 2019).
- Kwon, Y.; Park, J. A Study on the Transition Stages of the Green Belt in Korea. Geogr. J. Korea 2012, 46, 363–374. [Google Scholar]
- Ministry of Works (MOW). Urban Planning Act; MOW: Seoul, Korea, 1971.
- The Government of Seoul (GOS). The Management Plan on Restricted Development Zones; GOS: Seoul, Korea, 2016.
- The Government of Gyeonggi-do (GOGG). A Guideline on Restricted Development Zones; GOGG: Suwon, Korea, 2016. [Google Scholar]
- European Environment Agency (EEA), und Swiss Federal Office for the Environment, (FOEN). Urban sprawl in Europe; Joint EEA-FOEN report. EEA Report No. 11. 2016. Available online: http://www.eea.europa.eu/publications/urban-sprawl-in-europe (accessed on 5 September 2019).
- Kim, C.-B. Unplanned Urban Sprawl, Aju Economy. 17 October. Available online: https://www.ajunews.com/util/popPrint.php?nid=20171017140649329 (accessed on 13 December 2019).
- Kim, T.-J.; Sakong, H.-S. Determinants of Urban Sprawl in Seoul Metropolitan Region. Seoul Stud. 2006, 7, 95–116. [Google Scholar]


| City | Zones | Built-up Area [km²] | Population [Millions] | PBA% | LUPp [m²/Person] | DIS [UPU/m²] | WUPp [UPU/m²] | ||||||
|---|---|---|---|---|---|---|---|---|---|---|---|---|---|
| 1975 | 2014 | 1975 | 2015 | 1975 | 2014 | 1975 | 2015 | 1975 | 2014 | 1975 | 2015 | ||
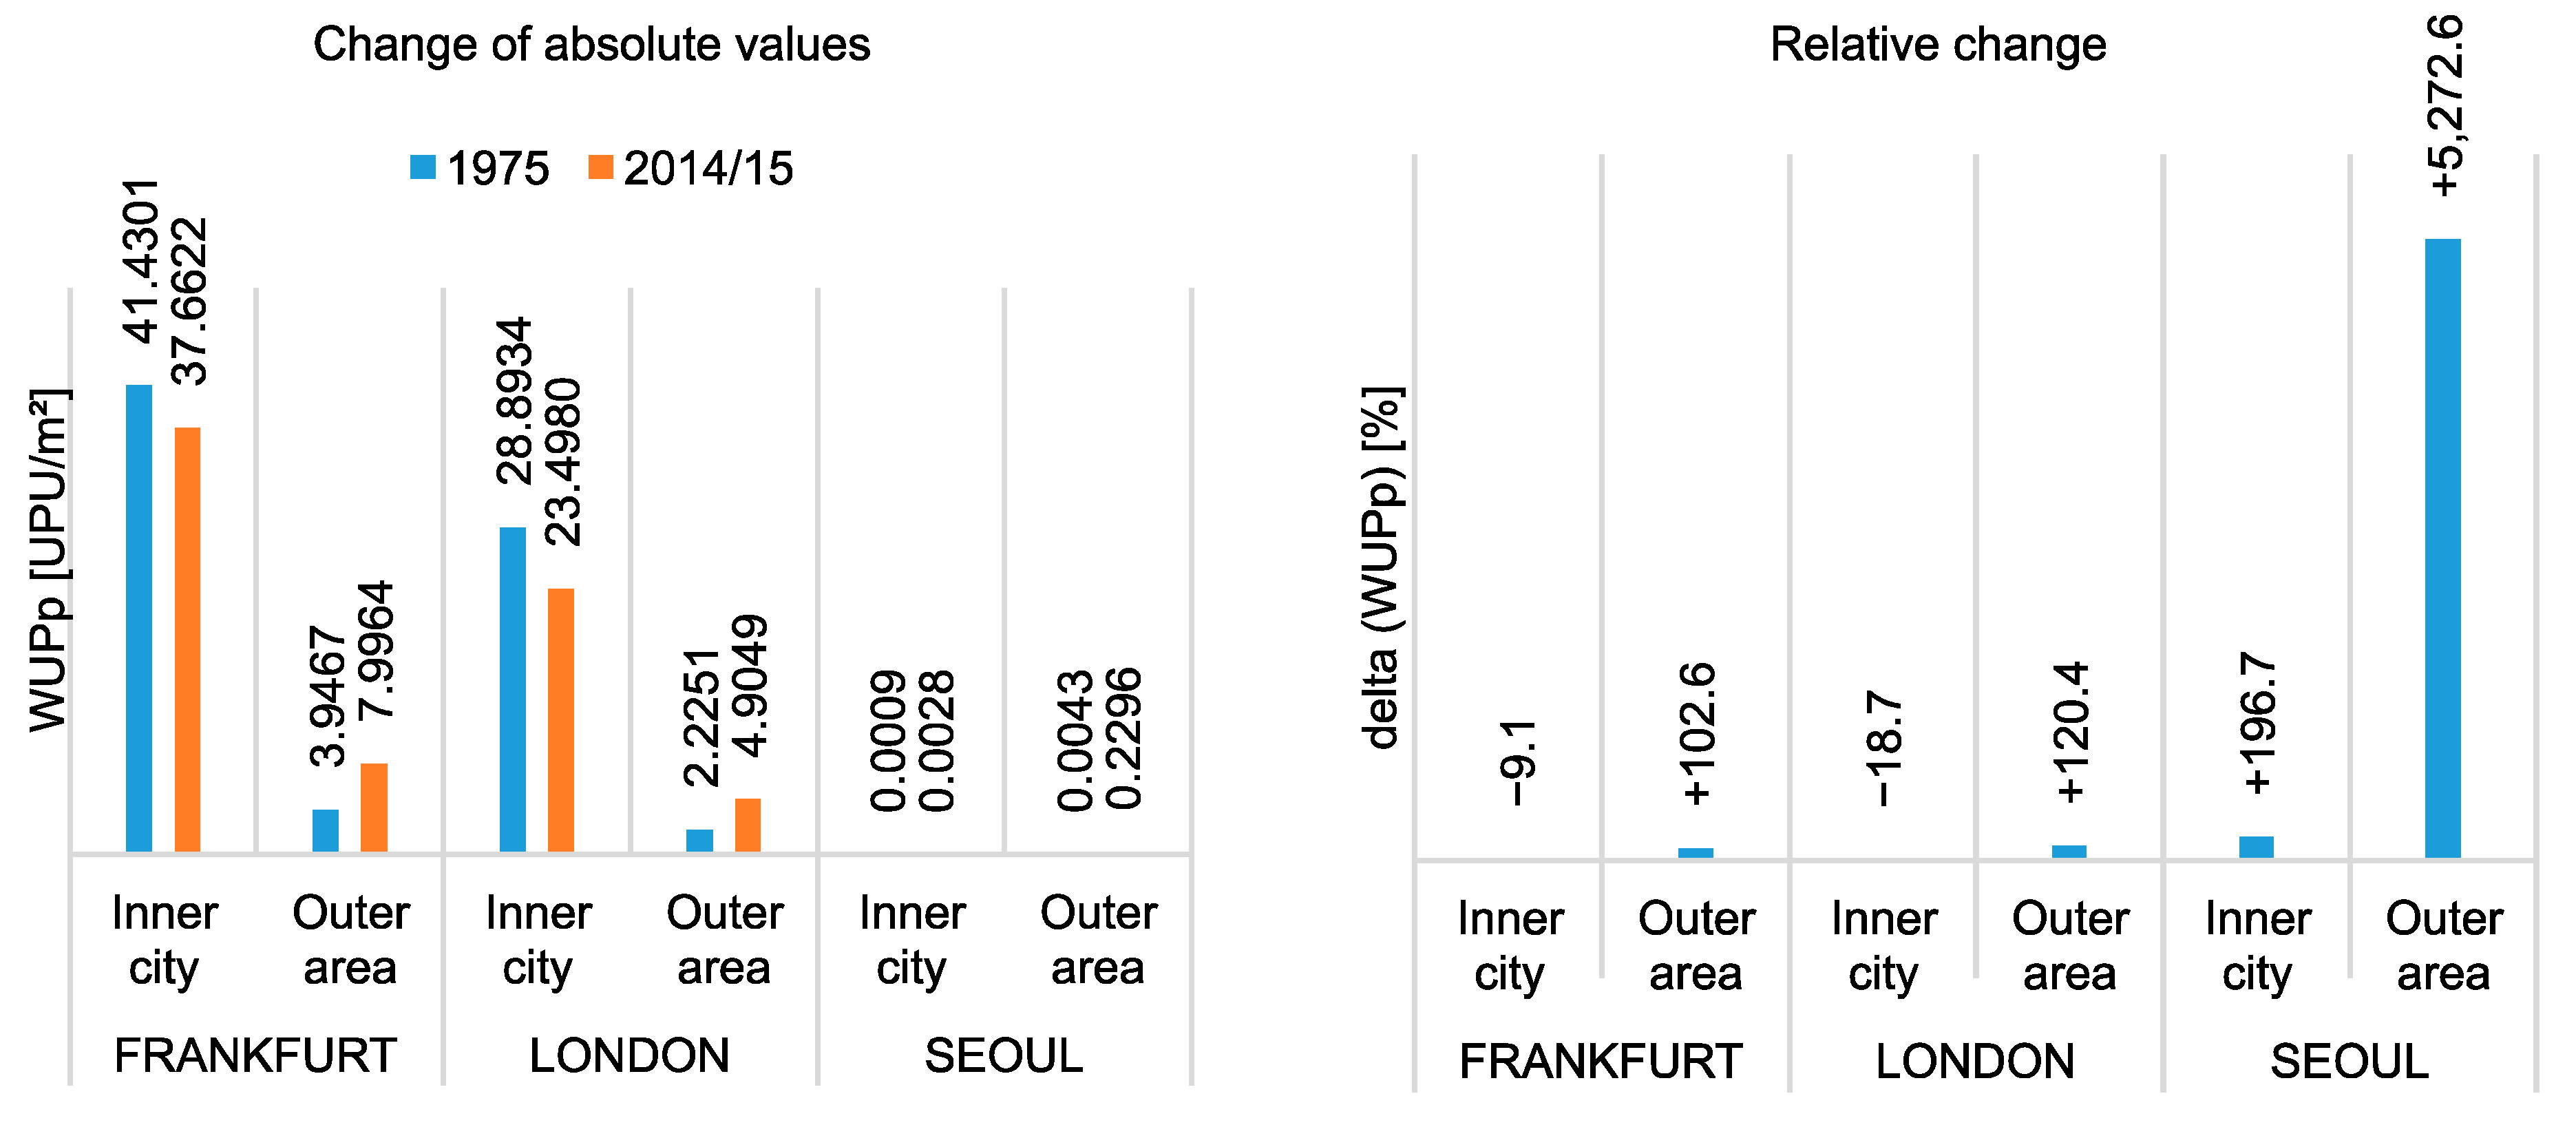
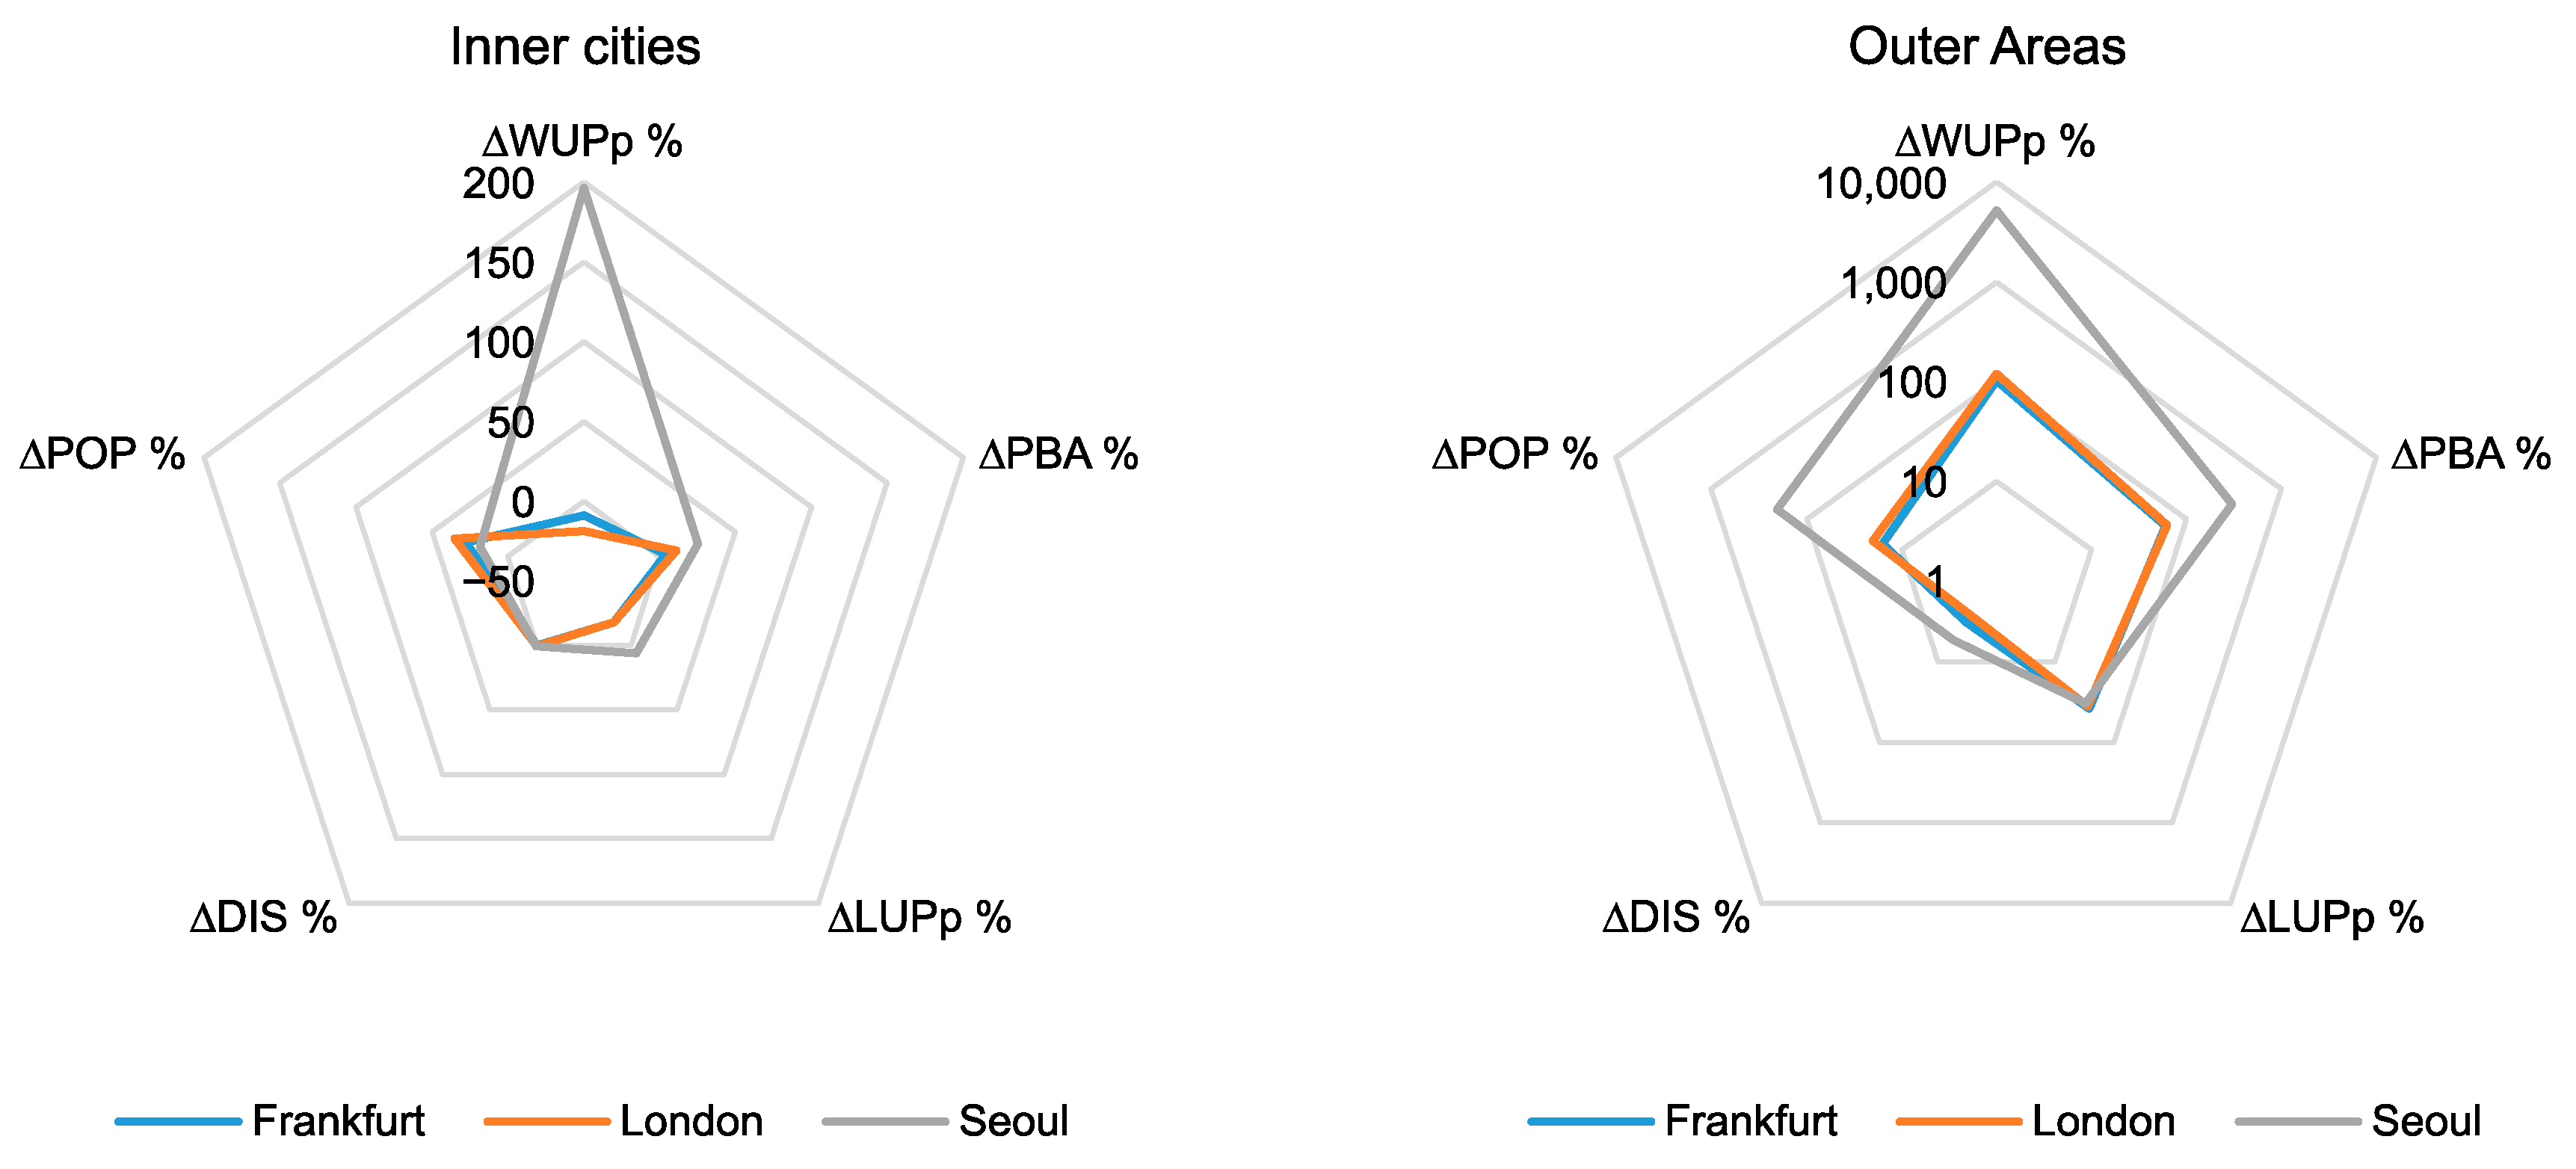
| Frankfurt am Main | Inner-city | 52.9 | 55.3 | 0.232 | 0.297 | 8.8 | 14.4 | 227.5 | 186.4 | 48.785 | 48.851 | 41.430 | 37.662 |
| +27.4% | +4.4% | −18.1% | +0.1% | −9.1% | |||||||||
| Outer area | 740.0 | 1189.5 | 3.285 | 3.806 | 8.8 | 14.4 | 225.3 | 312.6 | 44.780 | 46.235 | 3.947 | 7.996 | |
| +15.9% | +60.7% | +38.7% | +3.2% | +102.6% | |||||||||
| London | Inner-city | 1336.2 | 1484.7 | 7.601 | 10.264 | 70.3 | 78.1 | 175.8 | 144.6 | 48.378 | 48.531 | 28.893 | 23.498 |
| +35.0% | +11.1% | −17.7% | +0.3% | −18.7% | |||||||||
| Outer area | 893.0 | 1459.4 | 4.878 | 5.864 | 6.5 | 10.6 | 183.1 | 248.9 | 45.275 | 46.493 | 2.225 | 4.905 | |
| +20.2% | +63.4% | +36.0% | +2.7% | +120.4% | |||||||||
| Seoul | Inner-city | 337.7 | 423.9 | 8.1 | 9.6 | 8.8 | 14.4 | 41.7 | 44.3 | 48.426 | 48.676 | 0.001 | 0.003 |
| +18.3% | +25.5% | +6.1% | +0.5% | +196.7% | |||||||||
| Outer area | 232.0 | 940.8 | 3.7 | 11.1 | 8.8 | 14.4 | 63.2 | 84.4 | 44.961 | 47.381 | 0.004 | 0.230 | |
| +203.7% | +305.5% | +33.5% | +5.4% | +5272.6% | |||||||||
© 2020 by the authors. Licensee MDPI, Basel, Switzerland. This article is an open access article distributed under the terms and conditions of the Creative Commons Attribution (CC BY) license (http://creativecommons.org/licenses/by/4.0/).
Share and Cite
Xie, X.; Kang, H.; Behnisch, M.; Baildon, M.; Krüger, T. To What Extent Can the Green Belts Prevent Urban Sprawl?—A Comparative Study of Frankfurt am Main, London and Seoul. Sustainability 2020, 12, 679. https://doi.org/10.3390/su12020679
Xie X, Kang H, Behnisch M, Baildon M, Krüger T. To What Extent Can the Green Belts Prevent Urban Sprawl?—A Comparative Study of Frankfurt am Main, London and Seoul. Sustainability. 2020; 12(2):679. https://doi.org/10.3390/su12020679
Chicago/Turabian StyleXie, Xiaoping, Hanna Kang, Martin Behnisch, Martin Baildon, and Tobias Krüger. 2020. "To What Extent Can the Green Belts Prevent Urban Sprawl?—A Comparative Study of Frankfurt am Main, London and Seoul" Sustainability 12, no. 2: 679. https://doi.org/10.3390/su12020679
APA StyleXie, X., Kang, H., Behnisch, M., Baildon, M., & Krüger, T. (2020). To What Extent Can the Green Belts Prevent Urban Sprawl?—A Comparative Study of Frankfurt am Main, London and Seoul. Sustainability, 12(2), 679. https://doi.org/10.3390/su12020679