1. Introduction
For Natural World Heritage Sites (NWHSs), being inscribed on the World Heritage List is not the end of the story. As recommended by the World Heritage Committee in 1997, the State Parties should conduct periodic monitoring services by taking appropriate technical, administrative, and financial measures to reach the ultimate goal of protecting the outstanding universal value (OUV) of the heritage site from any direct or indirect damage [
1,
2]. It has turned out that most of the listed NWHSs contain at least one OUV with landscape aesthetic value (criteria vii) out of the total four standards [
3], making landscape monitoring an essential aspect for NWHS protection.
Landscapes provide an outstanding ecosystem service value. For nature-based reserves, a healthy landscape is the direct expression of a sound habitat system, and it can also attract tourists for sightseeing with its aesthetic value [
4]. For the NWHSs, according to the International Union for Conservation of Nature and Natural Resources (IUCN), the landscape aesthetic value of a NWHS is identified as “superlative natural phenomena, exceptional natural beauty and aesthetic importance” [
5]; thus, during landscape monitoring for NWHSs, it is necessary to take both intuitive beauty phenomena and potential ecological factors that produce scenic beauty into account. In existing natural heritage, there are about ten covered landscape types, including lakes, waterfalls, coastlines, panoramas, geology and geomorphology, deserts, mountains, forests, meteorology, and wildlife, which are all monitored for tracking the general health of the NWHS. Unique features of these landscape types and their combinations that compose the “superlative natural phenomena and exceptional beauty” of the NWHS should be at the core of monitoring. The elements that make up scenic beauty (e.g., vegetation growth, water area) and possible factors that disturb scenic beauty (e.g., pests and diseases, illegal human activities) should be monitored as well.
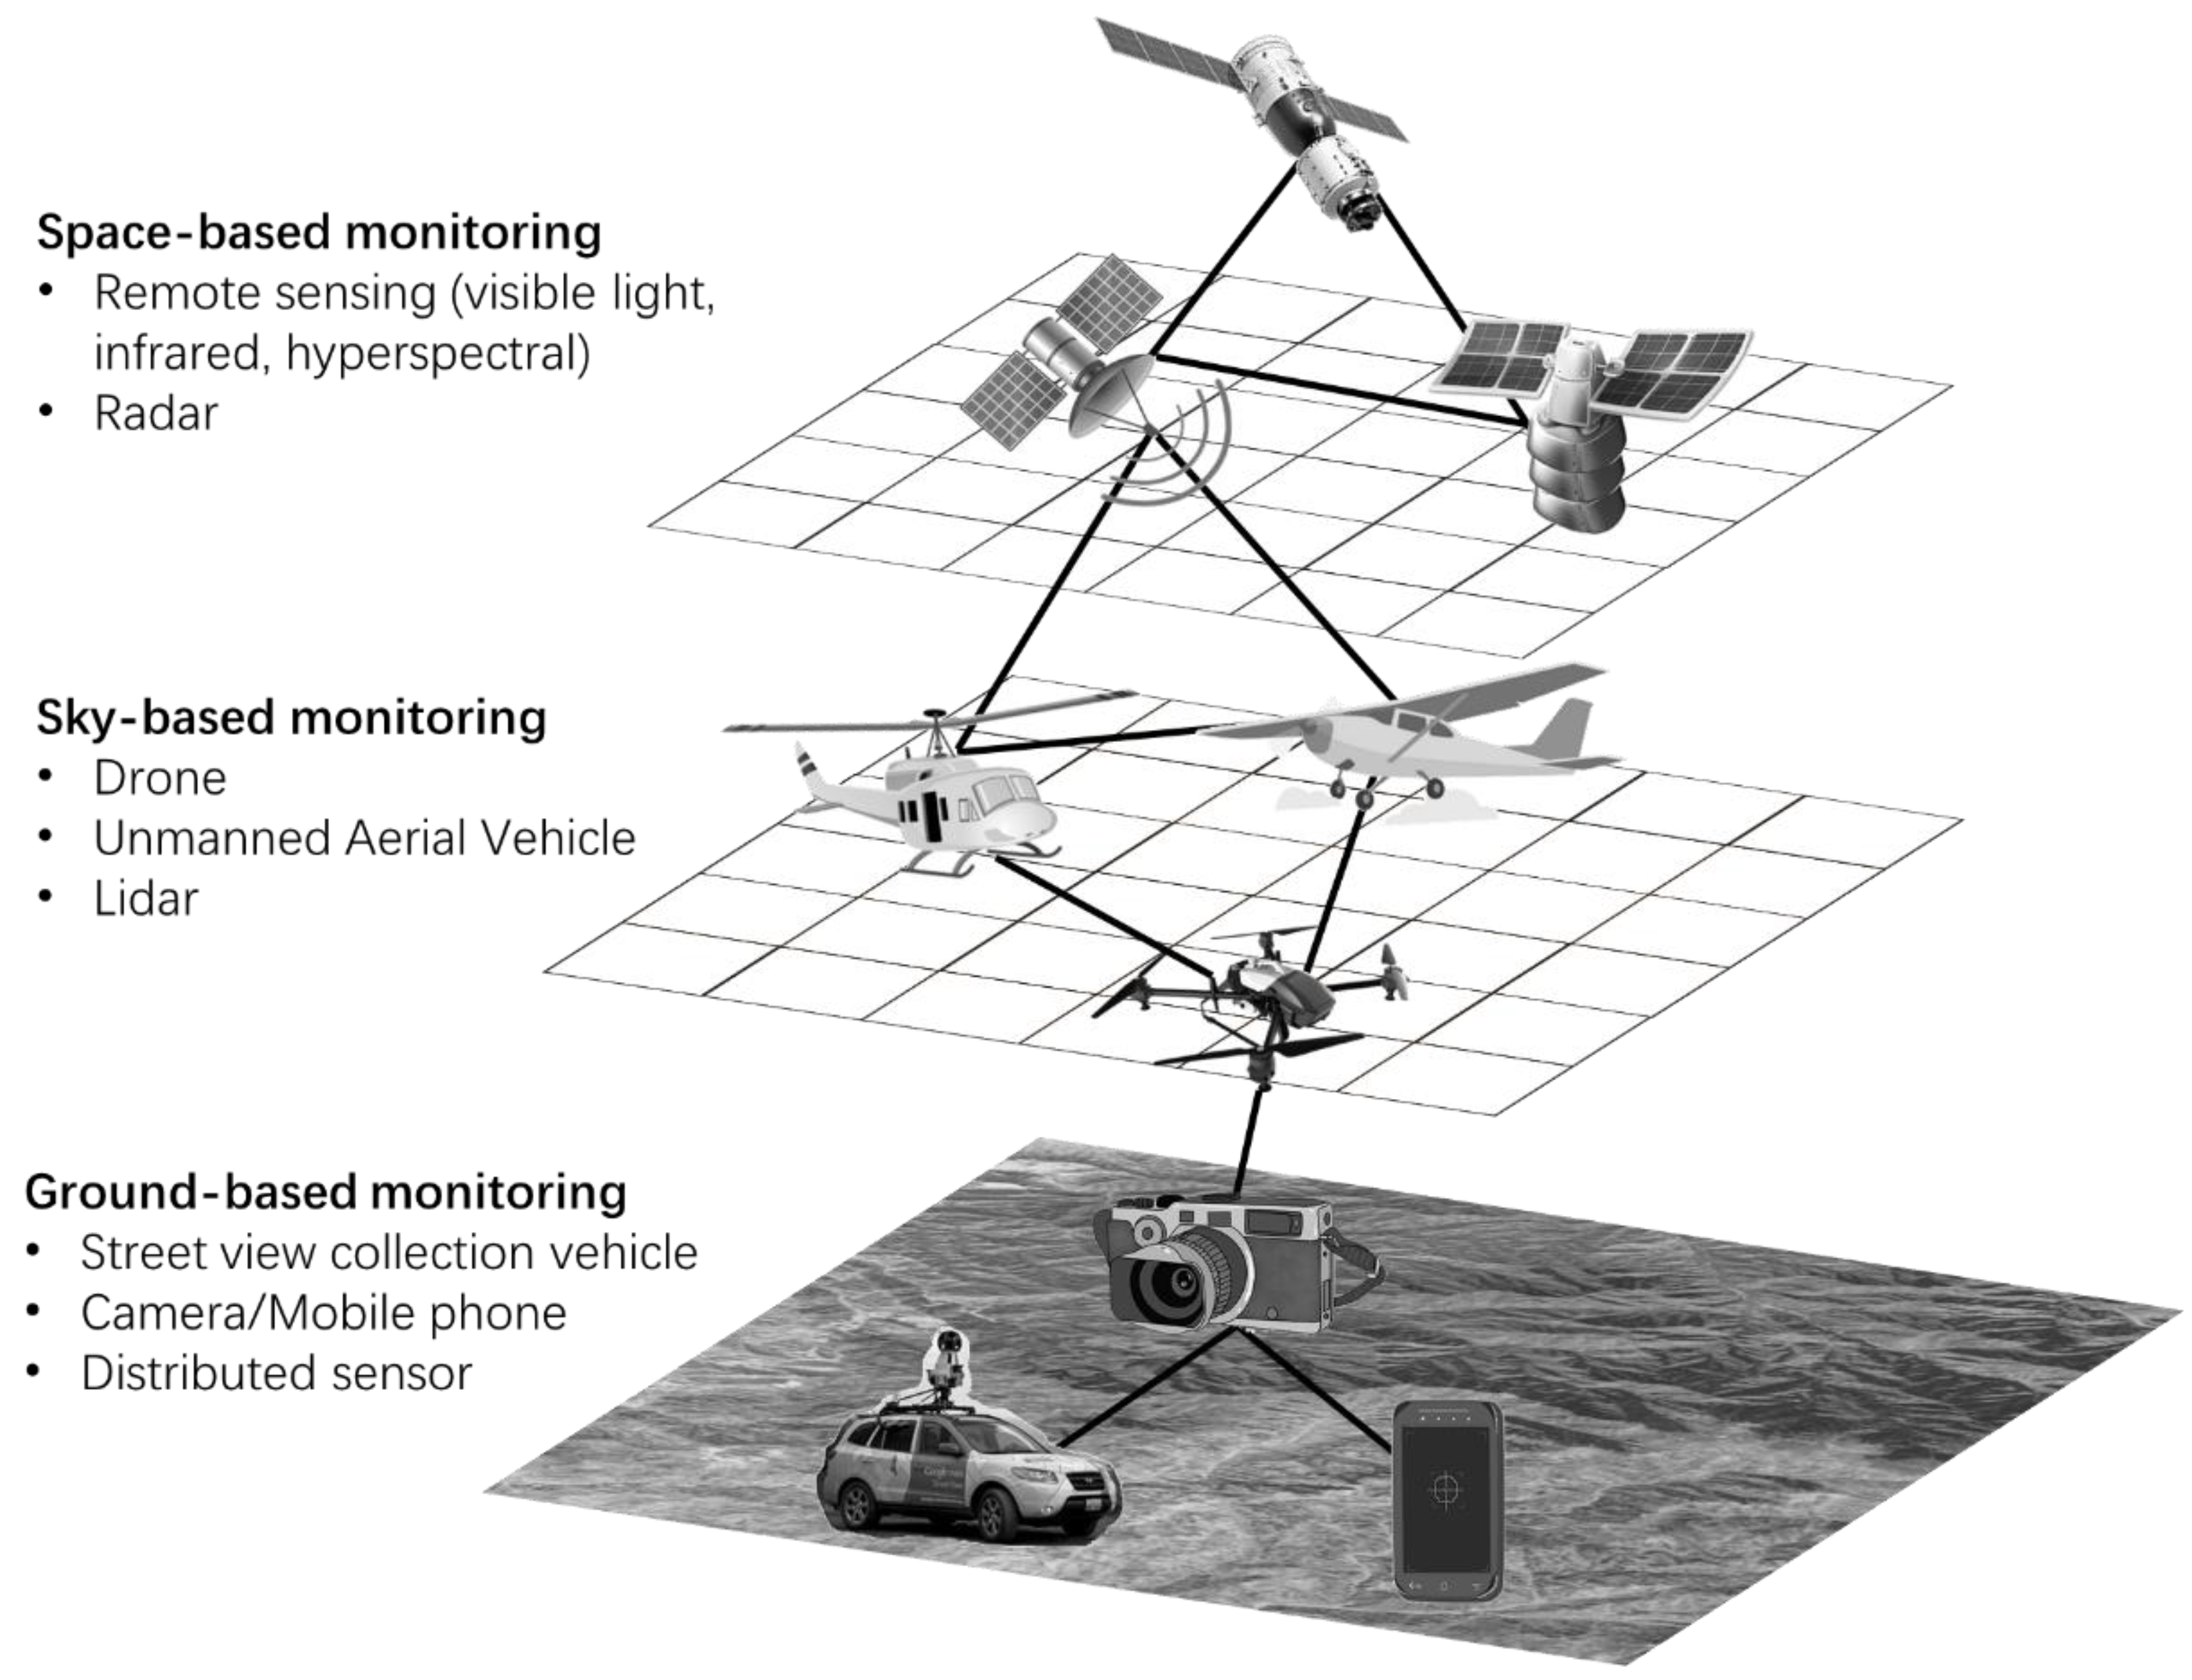
In the existing research of landscape monitoring, most studies have discussed spatial distribution characteristics [
6] or their temporal changes [
7,
8]. However, studies from the perspective of monitoring tools has been neglected. There is also a lack of related research on monitoring effects by different types of devices. We have combed inquiries for landscape monitoring in the last ten years, and we have found there are basically three types of monitoring tools. These tools correspond to three vertical layers, from high altitude to the ground, and are woven into a large monitoring net to describe the features of landforms and landscapes (
Figure 1).
The space-based monitoring tools are mainly represented by satellite remote sensing and radar remote sensing. Currently, the widely used remote sensing products in landscape monitoring include Landsat data (USGS Earth Explorer), ESA’s Sentinel Mission data (European Space Agency), NOAA CLASS data (National Oceanic and Atmospheric Administration), and NASA Reverb data (National Aeronautics and Space Administration). Low-cost satellite remote sensing data could realize the macroscopic and rapid identification of landscape elements of underground mats and could also facilitate the evaluation of long-term landscape pattern changes in sites. Different from the satellite remote sensing data, radar remote sensing data such as SLR (side-looking radar) and SAR (synthetic aperture radar) have outstanding advantages in surveying and mapping urban and marine landscapes as they can penetrate vegetation, snow, and dry sand to obtain information below the ground. Related studies have demonstrated that satellite data combined with GIS techniques have significant potential in spatial-temporal dynamic analyses of landscapes, which applies to both natural background landscapes [
9,
10] and landscapes disturbed by human activities [
11,
12,
13].
Sky-based monitoring tools are superior because of their instant monitoring performance, flexible space movement, low cost, and low risk. Tools such as drones and unmanned aerial vehicles (UAVs) enable the creation of high-precision models of the actual landscape with appropriate information density and position reference, especially in the vertical dimension [
14]. It has been found that drones equipped with lidar can acquire close-to-real 3D information with high efficiency [
15,
16]. Photogrammetry through UAVs equipped with pure color and infrared imagers has significant advantages of high-speed data collection and affordability [
17].
The ground-based monitoring tools are of the highest spatial resolution compared to the former two types of monitoring tools. Devices such as street view collection vehicles, cameras, and mobile phones have more flexible movement; thus, they have a high time resolution because they are distributed among tourists or professional monitoring staff. Related research has proved that repeat photography is a valuable tool for documenting and communicating landscape changes [
18]; moreover, the use of photographs can reflect the observers’ subjective preference for the landscape and are justified by a strongly significant correlation with the real quality of landscapes [
19]. The utilization of panoramic photography stitched from multiple pictures at full zoom helps improve the monitoring efficiency to riparian areas, wildlife, and invasive species in conventional rangeland at a very high resolution [
20].
The selection of different types of landscape monitoring tools depends on the geomorphological types and environmental conditions of the object. For example, monitoring tools for forest landscapes differ according to where they are located. The landscape of a contiguous rainforest growing in a natural environment is commonly monitored with remote sensing data for its temporal area and coverage changes [
9], while, for urban forests, which are segmented by urban landcover and predominantly comprised of individual or small patches of trees, Landsat images with a 30 m spatial resolution are not able to track the growth history [
21]. In order to optimize the monitoring results, it is necessary to evaluate the suitability of monitoring tools to find their optimal scope of application in spatial distribution.
This study aims to find out the spatial suitability of different types of monitoring tools in landscape monitoring. The research is based on a comprehensive three-dimensional monitoring system of space-based monitoring, sky-based monitoring, and ground-based monitoring and it is conducted in a particular area of mountainous NWHSs. Thus, this study would theoretically fill in the research gaps in landscape monitoring from the perspective of monitoring tools, and it could be referenced by other mountainous NWHSs. In practice, this research could guide local NWHS managers in decision making for efficient landscape monitoring, including the scope and frequency of monitoring, the monitoring site selection, and the corresponding configuration of monitoring tools.
2. Study Area
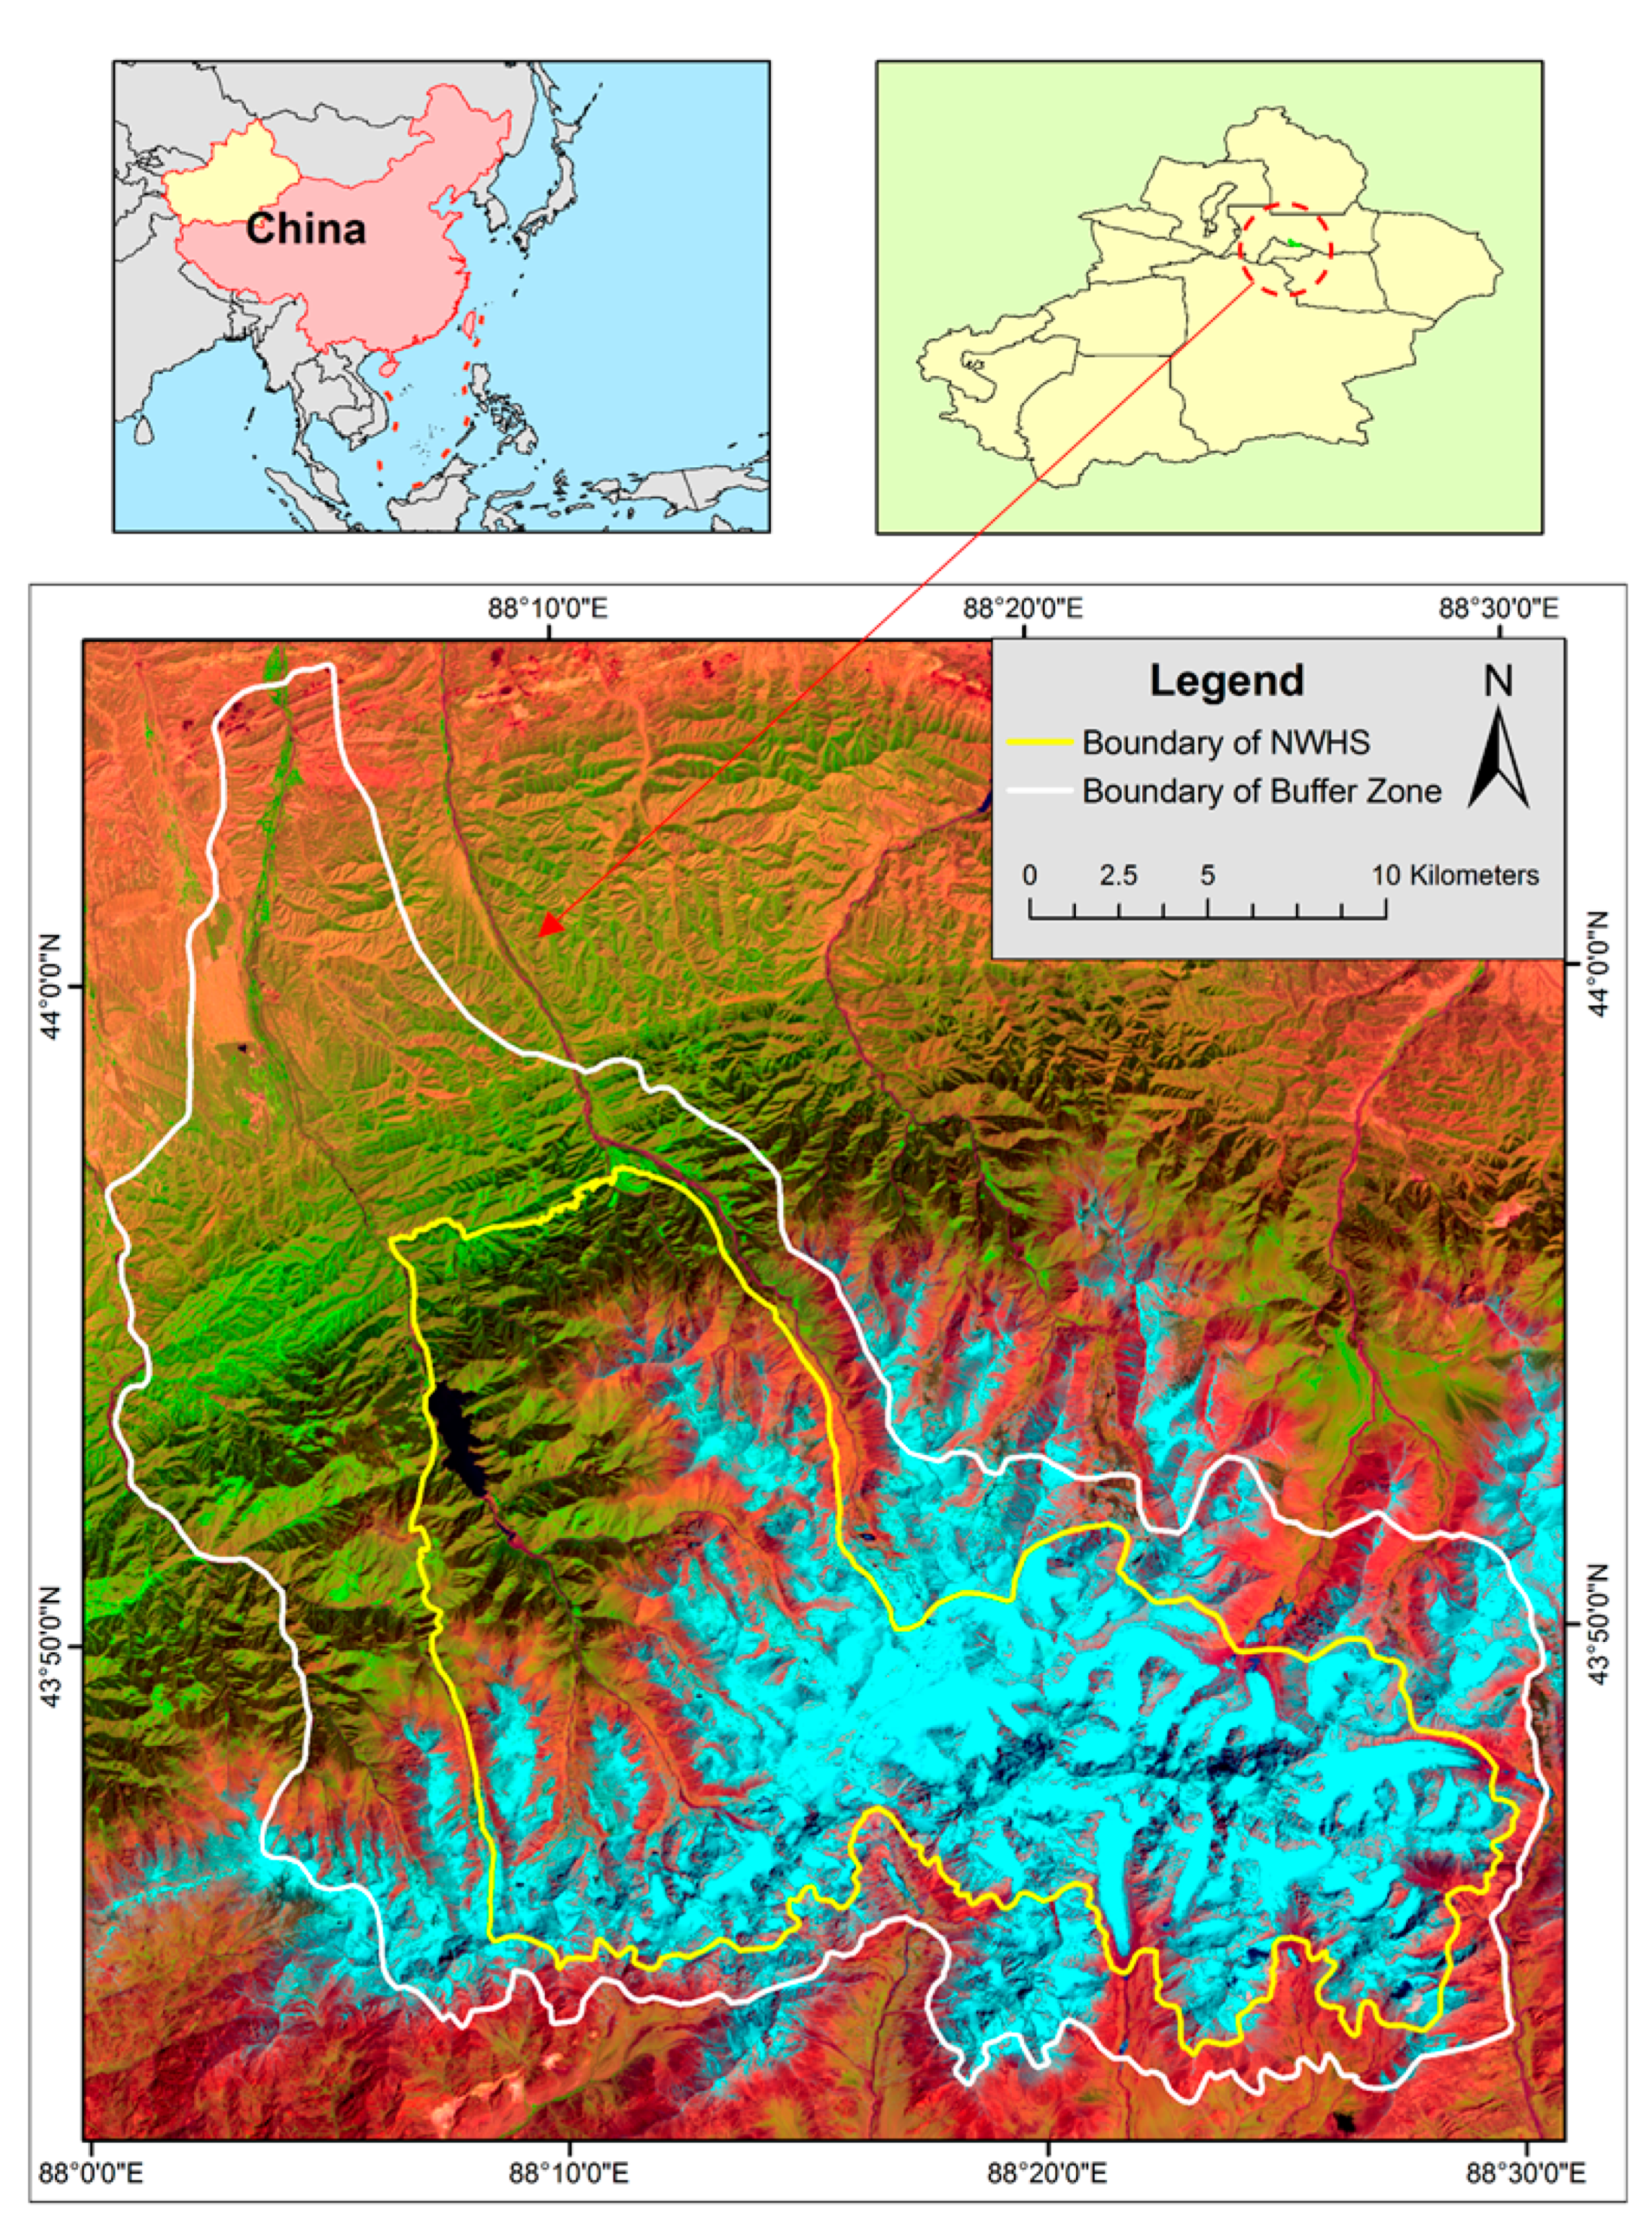
The Bogda component of Tianshan is located in Urumqi city and Fukang county of Xinjiang, China, with a property area of 387.39 km
2 and a buffer zone of 415.47 km
2 (
Figure 2), it was engraved in the World Heritage List in 2013 as it is the most typical representative of vertical mountain zones in the world’s temperate arid zones [
22]. The component has vast landscape aesthetic value for its ideal alpine lakes and glacier landscapes. In the high mountains above 3500 meters, it has developed abundant glacial landforms: U-shaped valleys, corner peaks, blade ridges, stone seas and rivers, and inverted rock piles are integrated with glaciers. In the east side of mountain Maja, clusters of stone forests of various shapes have been developed.
Bogda is located on the north slope of Tianshan, and in the eastern part of Xinjiang Tianshan, the overall terrain gradually rises from north to south, with an altitude between 1380 m and 5445 m. The climate here is of the typical continental temperate zone; however, given its location on the windward slope of the Atlantic Ocean and the Arctic Ocean, the heritage site is a “wet island” with a relatively humid climate affected by distinct zonal distribution. This site is formed by six complete vertical natural belts that, from high to low, are ice and snow belt (3700–5445 m), mountainous vegetation belt (3300–3700 m), alpine meadow belt (2900–3300 m), subalpine meadow belt (2700–2900 m), mountain coniferous forest belt (1650–2700 m), and mountain grassland belt (1380–1650 m).
There are eight vegetation types, 18 vegetation subtypes, and 27 flora systems in Bogda, and the snow ridge spruce is one of the common types of the local mountain evergreen coniferous forest. There are 127 species of animals listed in the Red List of IUCN Species (2010), including lynx, roe deer, red-billed duck, and so on. There are 113 modern glaciers with a total area of 101.42 km2 in the Bogda Peak region, making the component a natural, stable reservoir and the birthplace of many rivers, in which the Sangong River is the main stream of the whole water system. The river is about 60 km long with a drainage area of 310 km2. There are 12 lakes in the site, including ten small alpine eroded lakes. The Tianchi 5A national scenic area is located in the upper reaches of the Sangong River, with a total area of 2.48 km2. The landscapes of snow mountains, forests, rivers, and meadows in the scenic area together constitute a fascinating view of a mountainous lake area, and it is the concentrated embodiment of the Xinjiang Tianshan water scenery. Given the convenient traffic conditions and well-preserved natural landscapes, the Tianchi of Bogda attracts millions of visitors every year, forming a coordinated development trend between the nature and community, lifting local residents out of poverty, and boosting local financial revenues.
3. Materials and Methods
3.1. Conceptual Approach
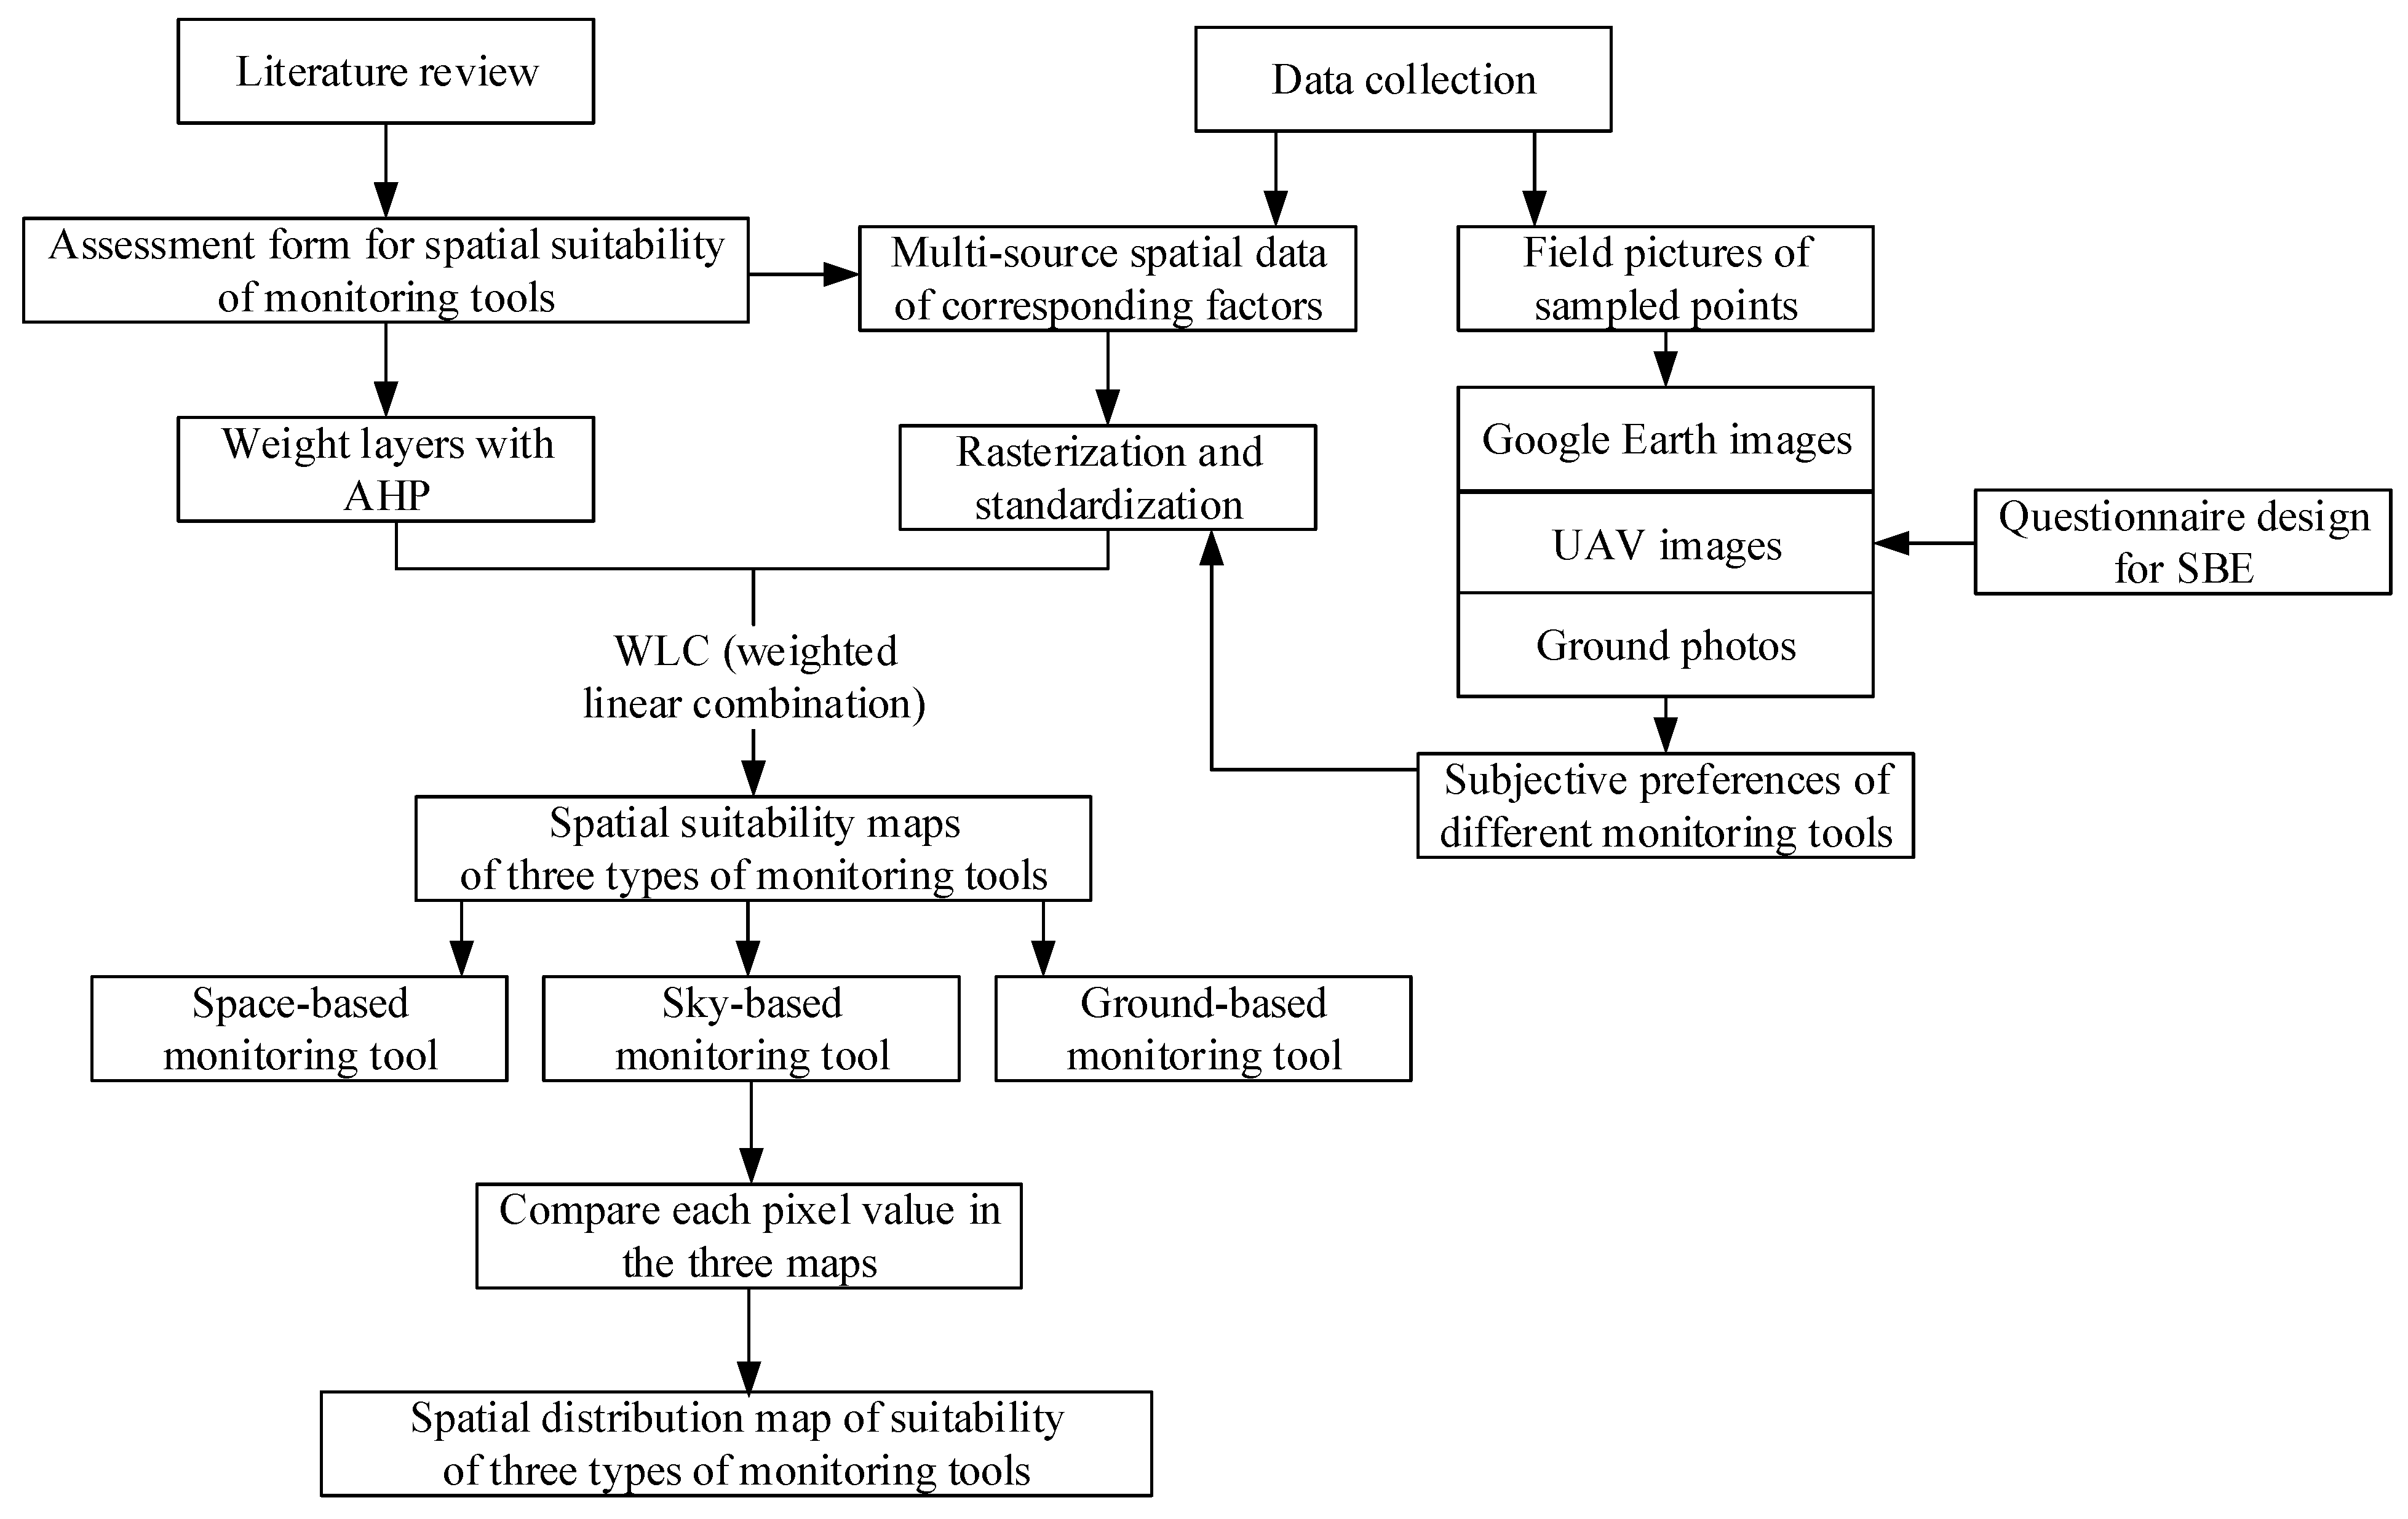
As shown in
Figure 3, we have designed a research framework to conduct a suitability assessment of the three types of landscape monitoring tools.
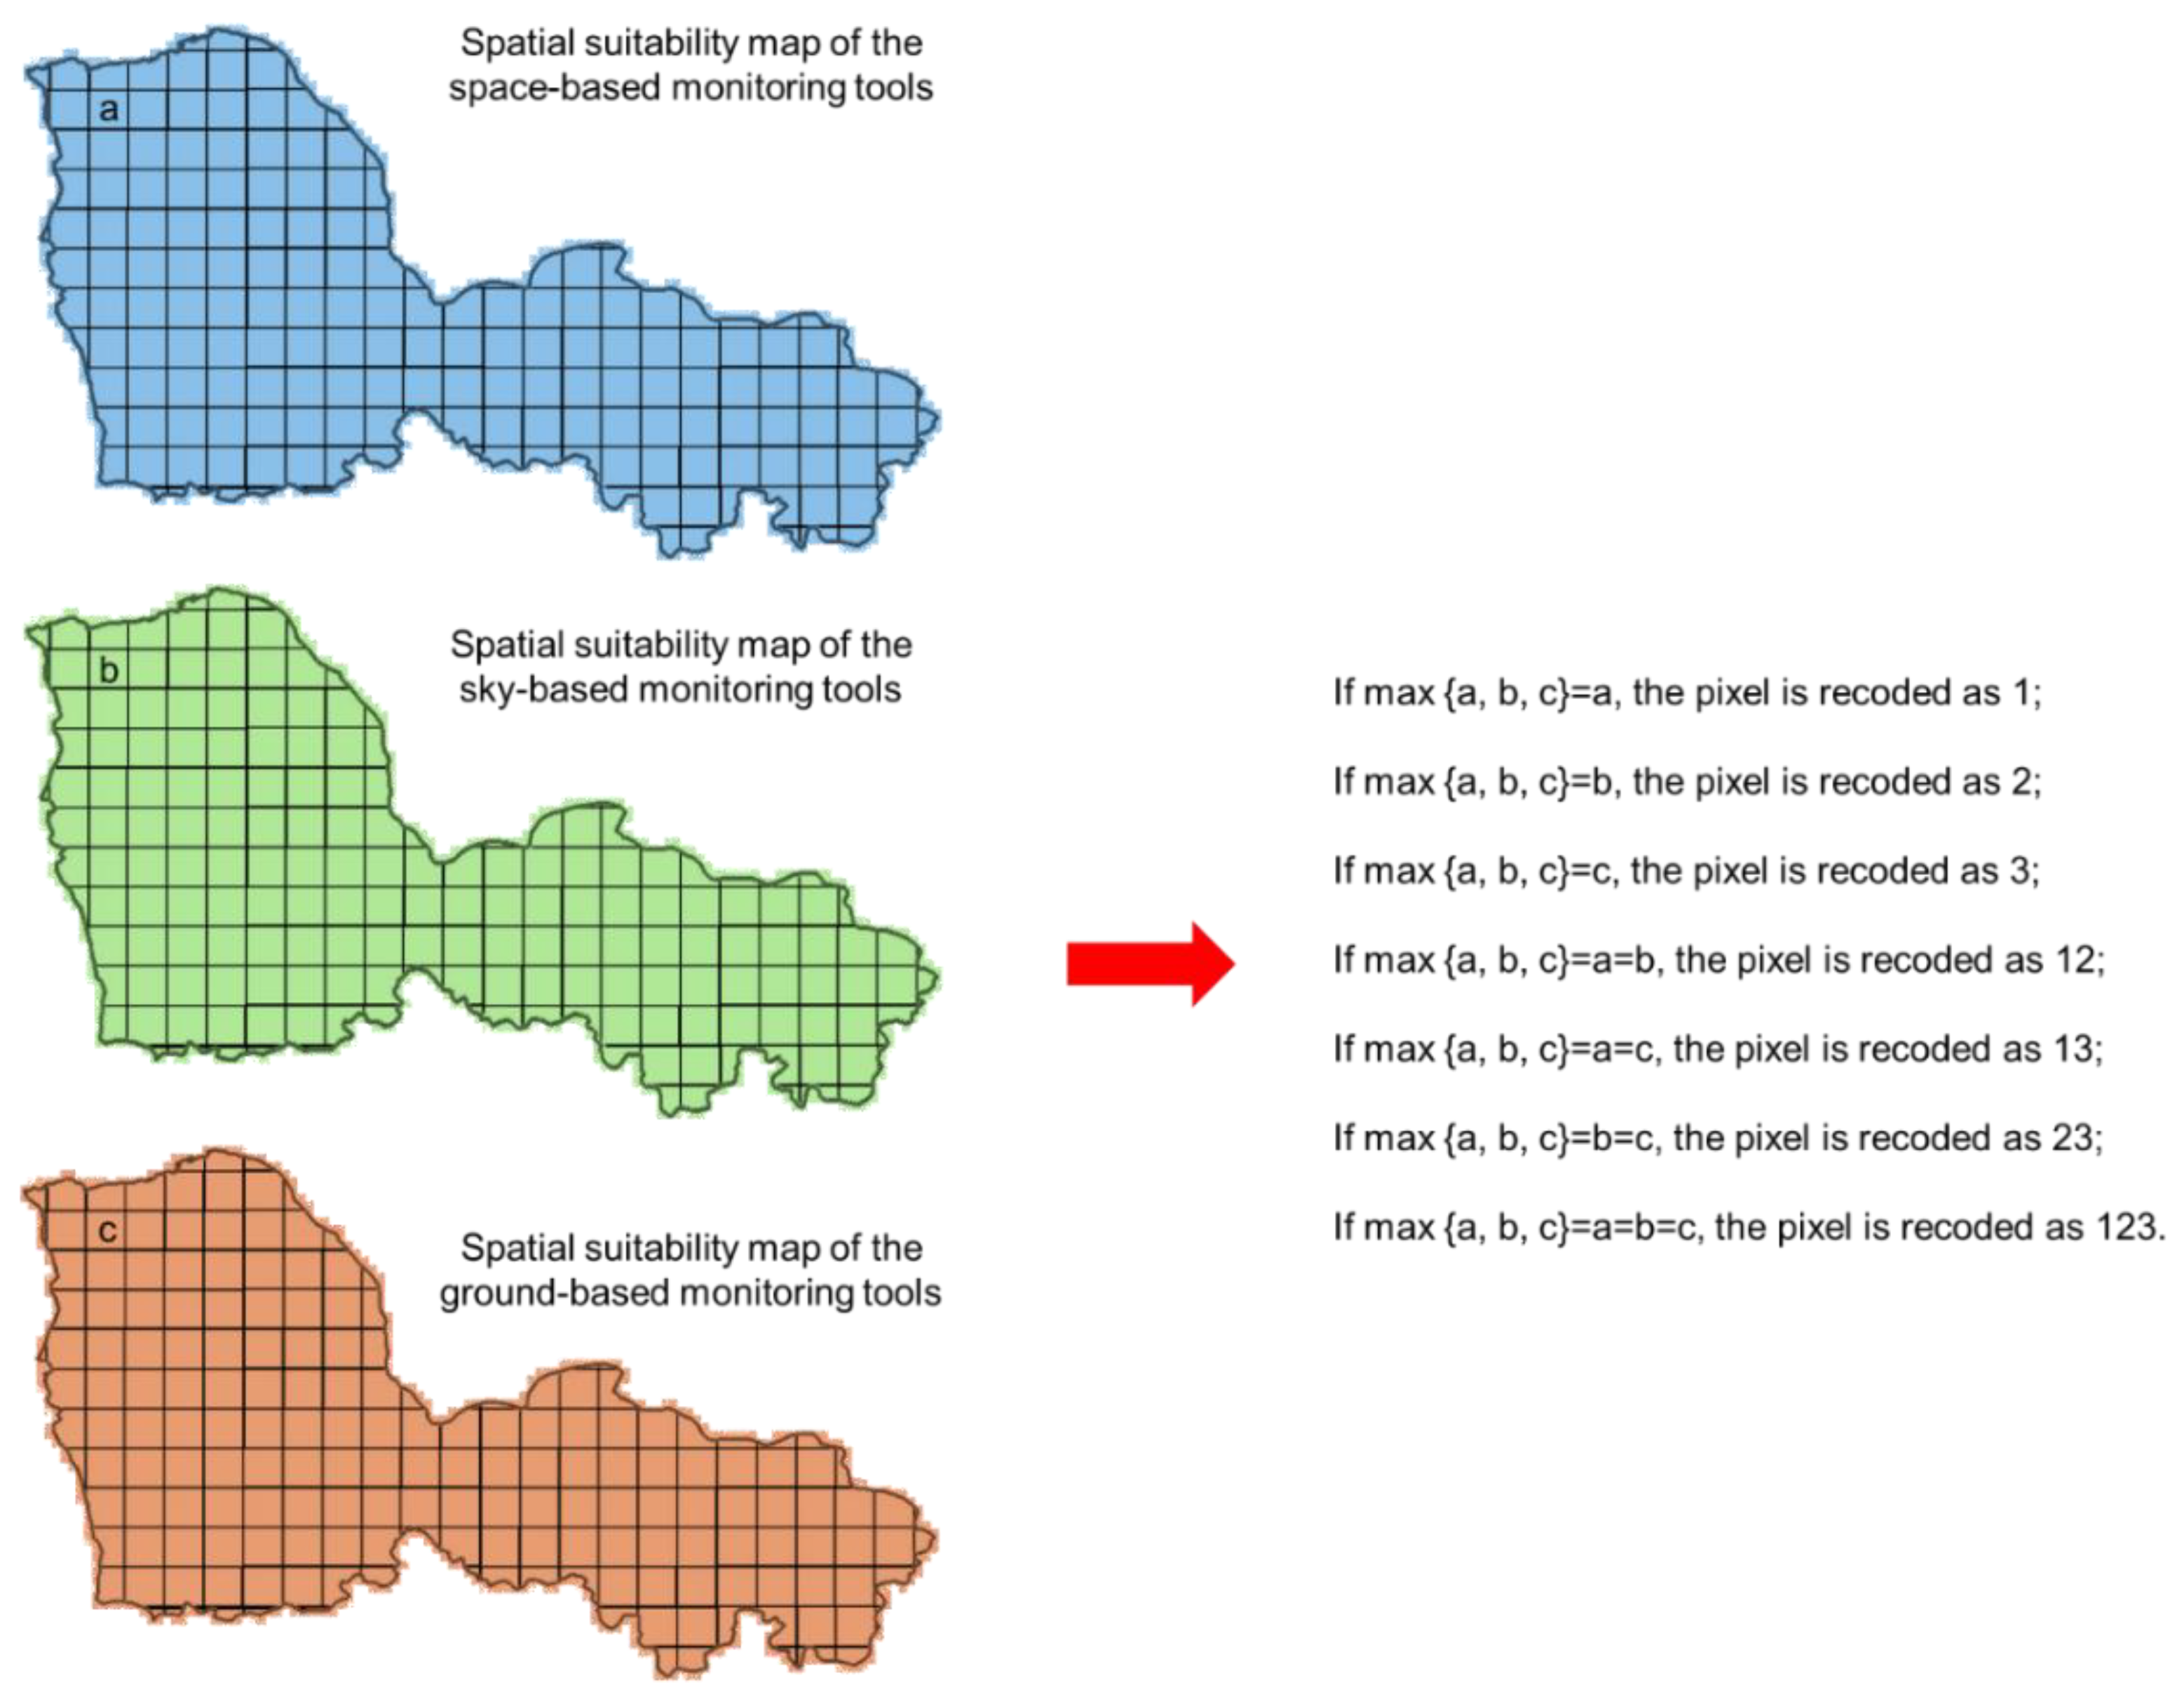
We firstly combed the case studies of landscape monitoring conducted under the relevant three types of monitoring tools to summarize their working characteristics and to discover the differences of their working environment, which were eventually identified as factors in the suitability evaluation form. The elements were determined to be altitude, slope, proximity to roads, proximity to artificial activity sites, presence of wild animals, land protection level, landscape uniqueness, landscape diversity, and subjective landscape aesthetic preference. Then, the multi-source spatial data of the nine factors were prepared, in which the individual landscape aesthetic preference for each type of monitoring tool was spatially visualized based on the classified landscape unit map. There were two points selected to represent each landscape unit, and three types of pictures (Google Earth images, UAV images, ground photos) were collected as a group to evaluate scenery beauty with a designed questionnaire. A thematic map of the nine spatially visualized factors in the case study area was resampled for a unified 30 m resolution and was rasterized through ArcGIS. It was necessary to standardize their values from 0–1 to eliminate any different dimensions. There were three fields corresponding to the three types of monitoring tools added into the property list of each thematic map. The assignment of each field was done according to the applicability of each instrument in landscape monitoring to the nine factors, which were elaborated within themselves with assigned scores by a group of specialists. The score ranged from 1–5, with “1” being “the least suitable” and “5” being “the most suitable”. The group of specialists consisted of landscape researchers, NWHS managers, and tourists who also participated in weight assignments of the nine factors through the AHP (Analytic Hierarchy Process) method. Then, the nine thematic map layers of each factor were combined based on the weighted linear combination (WLC) method and were further used to create three spatial suitability maps of the corresponding three types of tools: the space-based monitoring tool, the sky-based monitoring tool, and ground-based monitoring tool. Last, the eventual assessment result was visualized to a spatial distribution map to show the application scope of the three types of monitoring tools, as shown in
Figure 4. This process was achieved through pixel value comparisons between the three maps. The comparison result was spatially visualized by coding, through which the optimal effect of the three types of tools and their combinations in NWHS landscape monitoring could be obtained. For example, a pixel coded as “1” means the landscape of this region is suitable for spatial-based monitoring tools; a pixel coded as “23” means the combination of sky-based and ground-based instruments would realize the best landscape monitoring effect.
This study used the Delphi method to select and score the nine useful indicators in two rounds. The approach was described as a unique method to elicit or refine group judgment based on the expert group’s knowledge [
23]. It does well in dealing with questions that are complicated and do not have a settled conclusion [
24]. In the first round, the approach was chosen to establish the indicator system for suitability assessment with a group of specialists, consisting of the three types of people involved in landscape observation: the landscape researchers who had participated in the Tianshan heritage application, the staff of the scenic area management committee, and tourists in Bogda. There were six persons (two representatives per group) invited in this process; they were of the same gender ratio and ranged in age from 31 to 53 years old. The selected tourists had a bachelor’s degree or above and had visited the scenic area twice or more in the past year. The first-round Delphi survey helped us to adjust and delete some unreasonable criteria as well as add significant indicators for the suitability assessment based on the high-frequency indicators, which were screened out from numerous related studies. In the second round, an evaluation was carried out to determine the suitability of the three types of tools in landscape monitoring. The same four people in the two groups of landscape researchers and scenic area managers were asked to assign scores for each factor that had been selected in the first-round survey. The scores for each element assigned by the four experts were averaged and then rounded to the integer to give the final score.
3.2. Criteria Used for Landscape Monitoring Suitability Analysis
Through the literature review, it could be concluded that the three types of tools had their own advantages and disadvantages in landscape monitoring. The space-based tool had the most extensive monitoring range and was only slightly disturbed by the terrain and meteorological conditions but produced the coarsest resolution. The sky-based tool monitored landscapes at a higher accuracy than the space-based tool and was more efficient than the ground-based tool; however, it was sensitive to environmental factors such as cold temperatures and strong winds, which will restrict its availability. The ground-based tool was able to identify sophisticated landscape features and community structures (e.g., herbaceous and woody types in the sampled plot) and helped analyze the factors and mechanisms of landscape disturbance; however, it had a small monitoring range and, thus, was time-consuming and laborious. We have summarized that three aspects of differentiation exist among the three types of tools in landscape monitoring: monitoring environment, monitoring object, and monitoring effect, which are identified as the three criteria and further refined into nine indicators for their suitability analysis (
Table 1).
First, the environment of the monitored region influenced the selection of monitoring tool with five restricted factors. (1) Altitude: As the altitude increases, the wind gradually strengthens, and the temperature and air pressure gradually decrease, limiting the feasibility of sky-based monitoring and ground-based monitoring. Strong wind affects the flight stability of the aircraft, and the low temperature increases battery consumption both for the camera and UAV. In addition, the high-altitude, mountainous environment challenges the physical fitness of personnel. Based on meteorological monitoring data over the years in Bogda, we divided the altitude into six levels. There were significant meteorological differences between each level, which therefore influenced the availability of the two types of monitoring tools. (2) Slope: Given Bogda is a mountainous NWHS, steep regions with a large gradient will affect the accessibility of the monitoring personnel; based on previous studies regarding hiking suitability analysis [
25], combined with practical experience in field investigation in Bogda, we divided the slope into six levels. (3) Convenience: The convenience represented by the proximity to roads mainly affects the selection of sky-based and ground-based monitoring tools. According to the flight parameters of the UAV used for the experiment, the UAV has a 30-minute battery life and a 5000-meter maximum flight distance. Thus, the values of proximity to roads for suitability analysis ranged from 0–5000 m and were divided into five levels according to the physical endurance of personnel in their hiking experience in Bogda. (4) Land protection level: In China, protection of NWHSs is implemented under legally binding zoning management. In Bogda, three levels of protected land have been established, and the protection level, from low to high, is in order of exhibition zone, restricted zone, and prohibited zone. The exhibition zone is an area for tourist sightseeing and the production and life of the original inhabitants; ground-based monitoring is allowed here. For the prohibited zone, which is the core area of a NWHS with a high heritage value and extreme vulnerability, ground-based tracking should only be conducted by scientific research personnel. Monitoring is limited to defined routes and sites, and any human involvement beyond that is prohibited. (5) Specially protected area: Regions where wildlife is present are not suitable for ground-based and sky-based monitoring, as the noise, litter, and even odors from human activities would interfere with their habitats.
Second, the selection of monitoring tools is determined by what they monitor as well. For NWHSs, landscape monitoring is embodied in the tracking of its landscape aesthetic value, which consists of the following three aspects. (1) Landscape uniqueness: This could be expressed as the “exceptional natural beauty” of the NWHS. In this study, we chose to use a distribution map of the landscape resources to represent the regions with landscape uniqueness. Differentiation in the suitability of the three types of tools in landscape monitoring, which determine their selection, is mainly reflected by the distribution area of the landscape resource regions they monitor. For landscapes with small areas, ground-based monitoring with the highest resolution would realize the best effect; landscape combinations or community structures in medium-sized areas should be monitored by sky-based monitoring tools; and large-scale landscape belts can only achieve optimal monitoring results by remote sensing. (2) Landscape diversity: It has been proven that landscape diversity provides more scenery combinations and, thus, performs better and has higher aesthetic preference [
26]. Regions with high landscape diversity are represented by complex landform combination or community combinations, requiring high-resolution monitoring, otherwise there could be loss of information. Differentiation between monitoring resolution characteristics of the three types of tools involves incorporating this indicator into suitability evaluations. (3) Interference elements: NWHSs are the world’s most important protected areas, and the unique landscapes should be particularly preserved as close to natural as possible [
27]. Thus, it is vital to monitor human activities that may interfere with the landscape aesthetic value, such as illegal tourism, grazing, logging, and mining. Selection of the three types of tools depends on the proximity to the artificial activity sites: the smaller the range, the higher the resolution of the device required to monitor the damage to the naturalness of the NWHS.
Third, the monitoring effects should be considered in tool selection, which is represented by observers’ subjective preferences. It has been proven that the landscape aesthetic experience is produced by both physiological and psychological human processes [
35]. In addition, further processing and analysis are eventually conducted by a human. Thus, it is recommended that the monitored products should be easy to identify and have high clarity and subjective preference. Different from the above eight factors being scored by the Delphi method, the metric of this factor was assigned based on the evaluation score through the scenic beauty evaluation (SBE) method.
In the regions where the factor was determined as “Not Suitable”, the value was taken as “0” in the calculation process; these cases are reflected in the availability of the sky-based tool at the highest altitude and the ground-based tool in areas of 3000 meters away from roads. In addition, due to the lack of photo collection by UAV and ground shooting caused by inaccessibility, the subjective preferences of landscape units of bare rocks, glaciers, and lakes in the ice snow belt were also counted as “0”.
The weight of each factor was determined by its relative degree of importance in landscape monitoring, and this process was conducted by the same group of specialists who assigned weight scores in the range of 1–10 (with “1” being the least important and “10” being the most important). Then, the means of the assigned values of each factor by each specialist were calculated, and the percentage weight of each factor was deduced according to its share of the total. The eventual weights of the nine factors were determined by their weighted scores by the total score and were rounded (
Table 2).
3.3. Data Collection and Processing
The designed suitability assessment form requires a database including a set of thematic maps of the case study area of Bogda, the digital elevation model (DEM) data, and the remote sensing data used for land cover map interpretation [
36]. The nine layers of thematic maps were processed with a unified WGS-1984-UTM coordinate system and 30 m spatial resolution. As shown in
Table 3, a group of comprehensive data processing methods was adopted to produce spatialized and standardized layers corresponding to each factor.
Among all factors, the ninth factor was the one needing pre-processing for spatial visualization to quantify the observers’ subjective preference in landscape monitoring products of the three types of tools. The process was divided into three steps.
Determining the landscape units: The landscape in Bogda was firstly classified into six types—lake, grassland, meadow (low-coverage pasture), forest, snow and ice, and bare rock—based on the Chinese national standard for land use classification. Then, the elevation was used to divide Bogda into landscape super-units. The elevation groups were subclassified according to the description in the heritage manuscript as 2200 m and below, 2200 m to 2800 m, 2800 m to 3200 m, 3200 m to 3800 m, and 3800 m and above. Through the overlaid analysis with ArcGIS, the study area was divided into 17 landscape units.
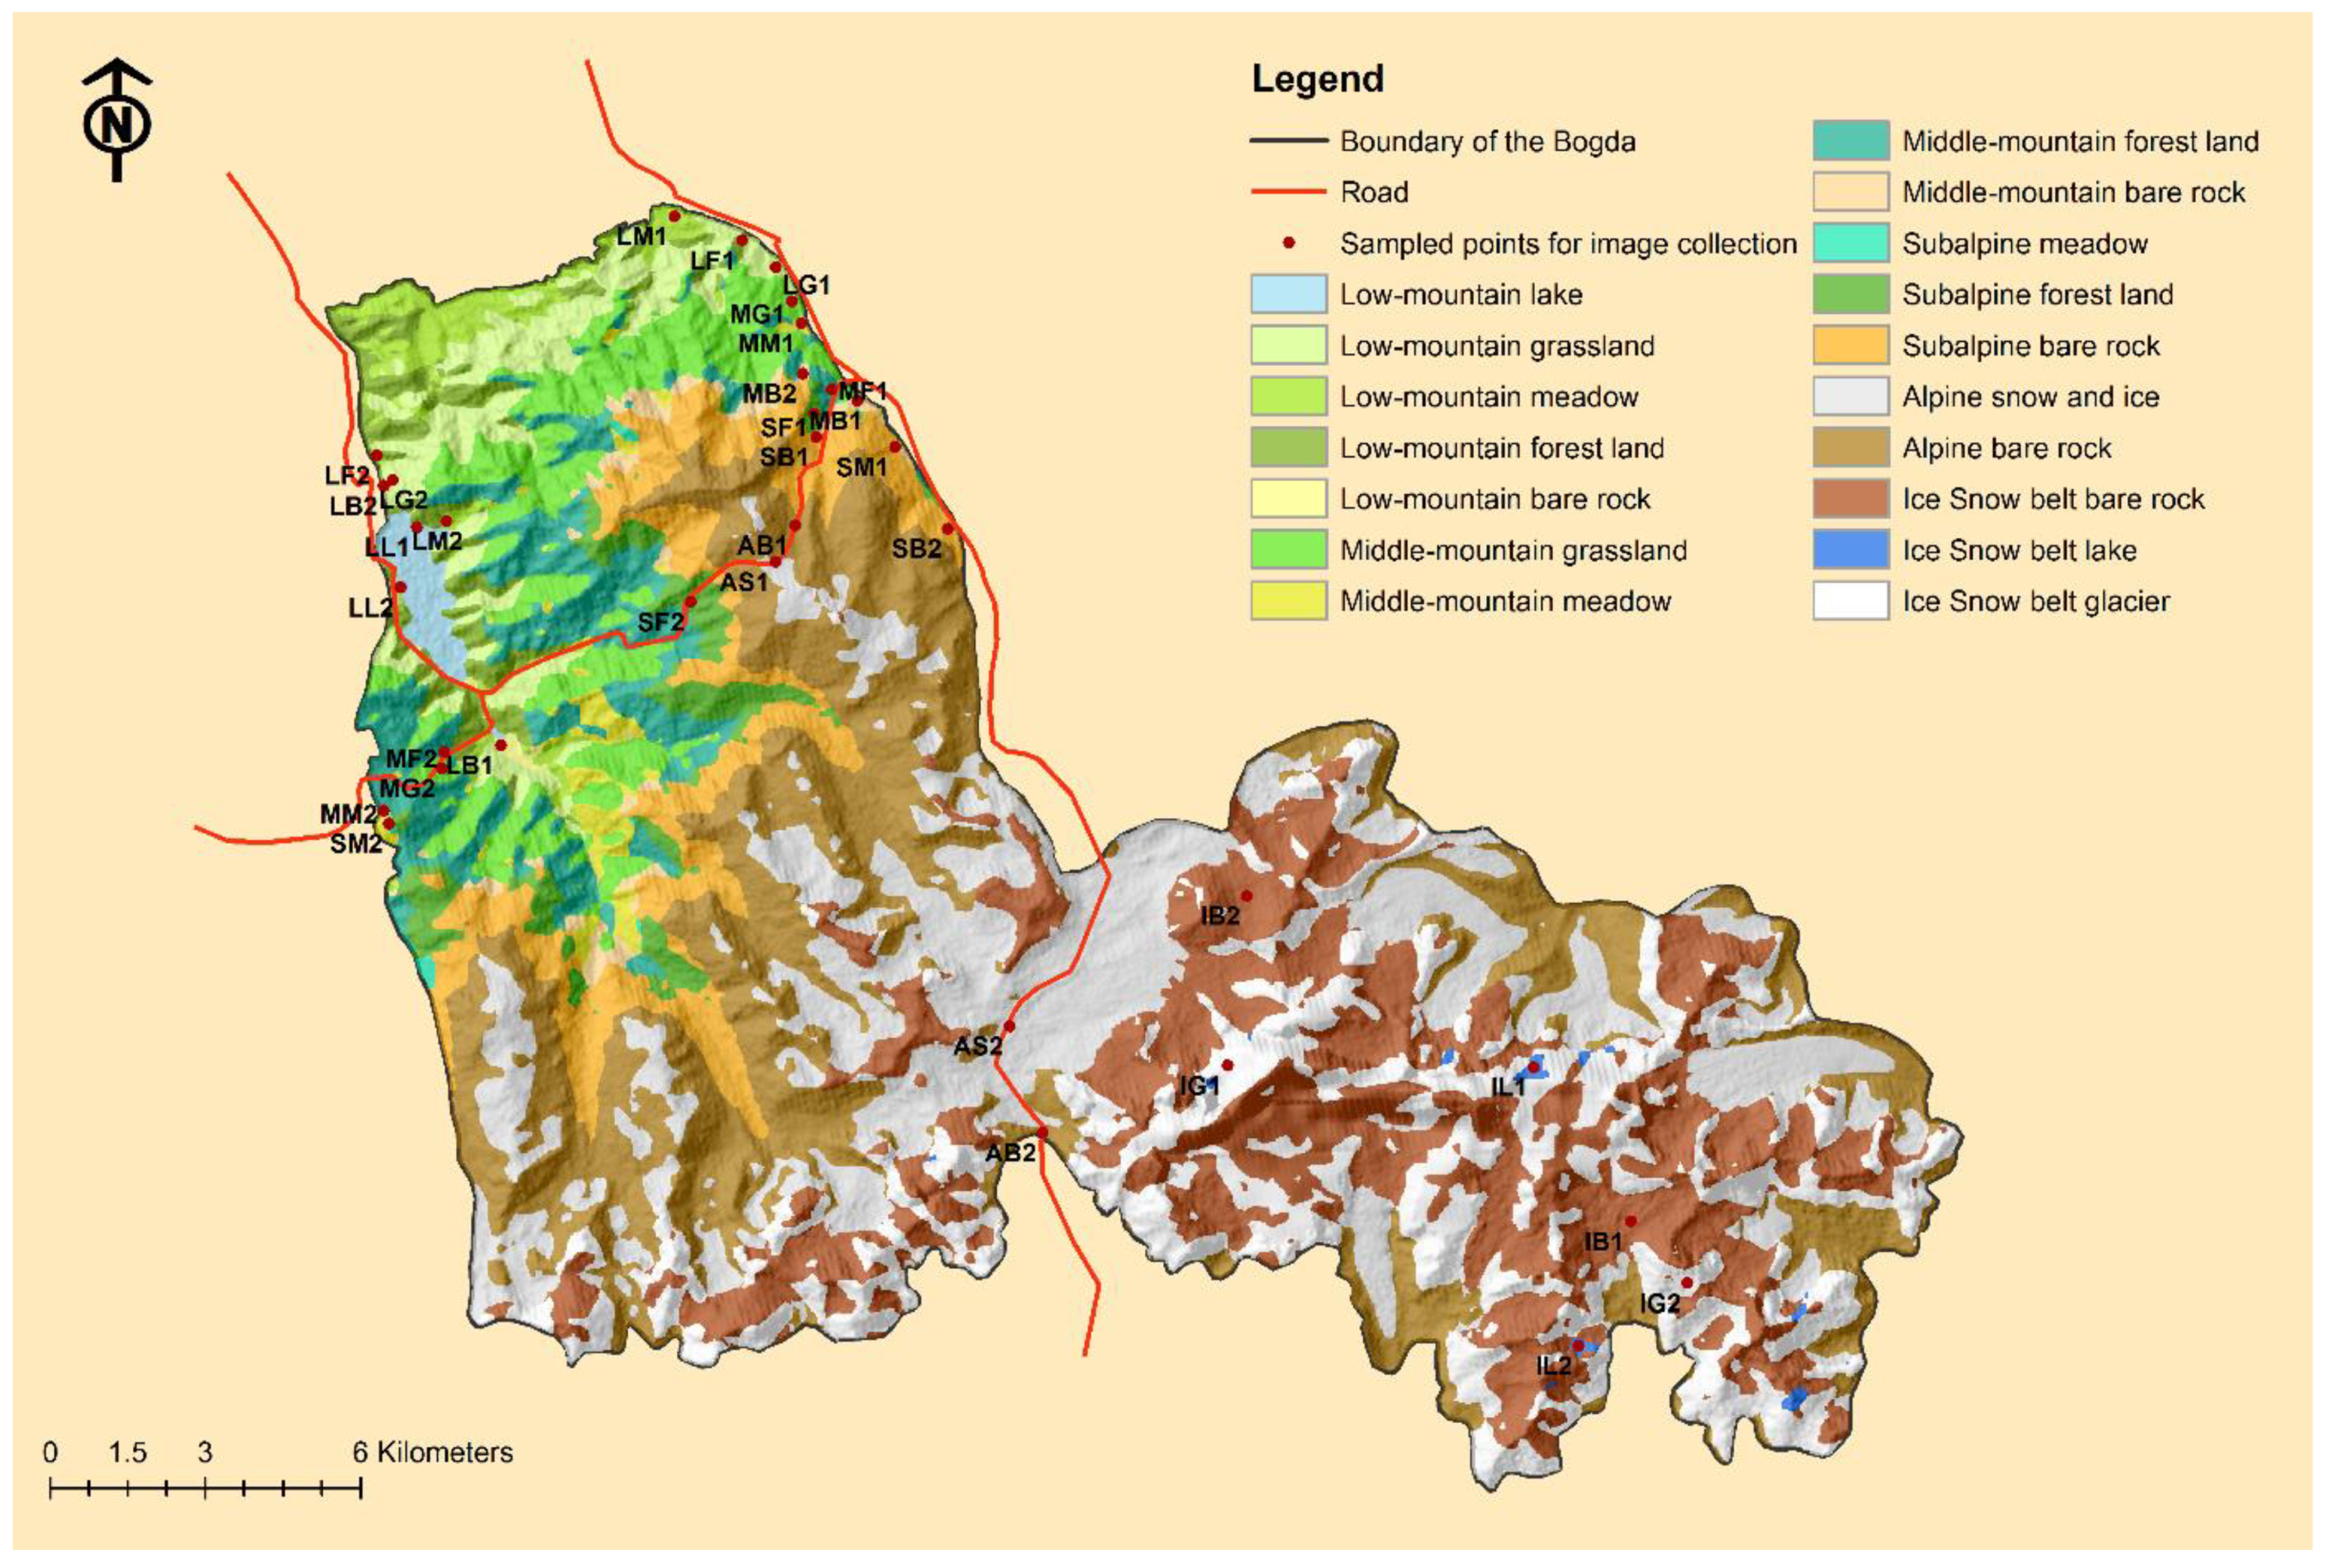
Image collection: We assumed that different types of landscape units monitored by different kinds of tools produce different effects; thus, we selected two sample points representing each landscape unit for image collection to test the landscape recognition preference of observers in the monitoring products using the three types of tools. Eventually, there were 34 sampled points selected, of which Google Earth images, UAV images, and ground shooting photos were collected to represent the monitoring products of the space-based tool, sky-based tool, and ground-based tool, respectively. Google Earth images were collected at the 15th level with a scale of 1:25,000; the UAV images and ground shooting photos were collected in August, 2018. In order to avoid different evaluation results caused by image quality, the data were collected under the same shooting conditions with the same flying height of 150 m and same oblique imaging using the UAV DJI PHANTOM 4 PRO V2.0 [
17,
37]. The ground photos were shot with the same wide-angle lens using the same camera (Nikon AF-S 16-35mm).
Figure 5 shows the classification results of the 17 landscape units and the distribution of the 34 sampled points.
Questionnaire design and scenic beauty evaluation: We invited 120 people to give evaluations for the collected 90 images, which were made into slides and shown randomly. The respondents were asked to assess each of the pictures from two aspects: (a) What type of landscape do you think this picture represents? and (b) Do you recommend using this monitoring tool to monitor the scene here? The two aspects were evaluated as a single choice. The number of people who answered correctly on question a and supported question b were counted, and their percentages were calculated as the score for the corresponding aspect, which was averaged to represent the SBE result of each picture. The final subjective preference of each landscape unit monitored by each type of tool was valued by the averaged SBE score of the two sampled points, and then it was visualized by adding fields to the property sheet to assign values of each landscape unit in ArcGIS.
4. Results
4.1. The Subjective Preference in Landscape Units Monitoring
As seen in
Table 4, the 120 respondents invited for the evaluation of the subjective preference in landscape units monitoring had almost equal gender distribution; most of them were under 50 years of age (76.66%), and most had a high educational background level, whereby 85% respondents graduated with college diploma. The majority of respondents (60.83%) have previously been to the Tianchi scenic area, which is the exhibition zone of the Bogda, and had certain landscape recognition experience.
According to the designed questionnaire, the subjective preferences of landscape units monitoring using different types of tools were evaluated from two aspects: the identifiability of the monitored landscape and the observer’s choices for the used monitoring tools. Scores were averaged as the final score and processed ranging from 1 to 5 to adapt to the scoring system of the assessment form, the 5-point Likert scale [
38].
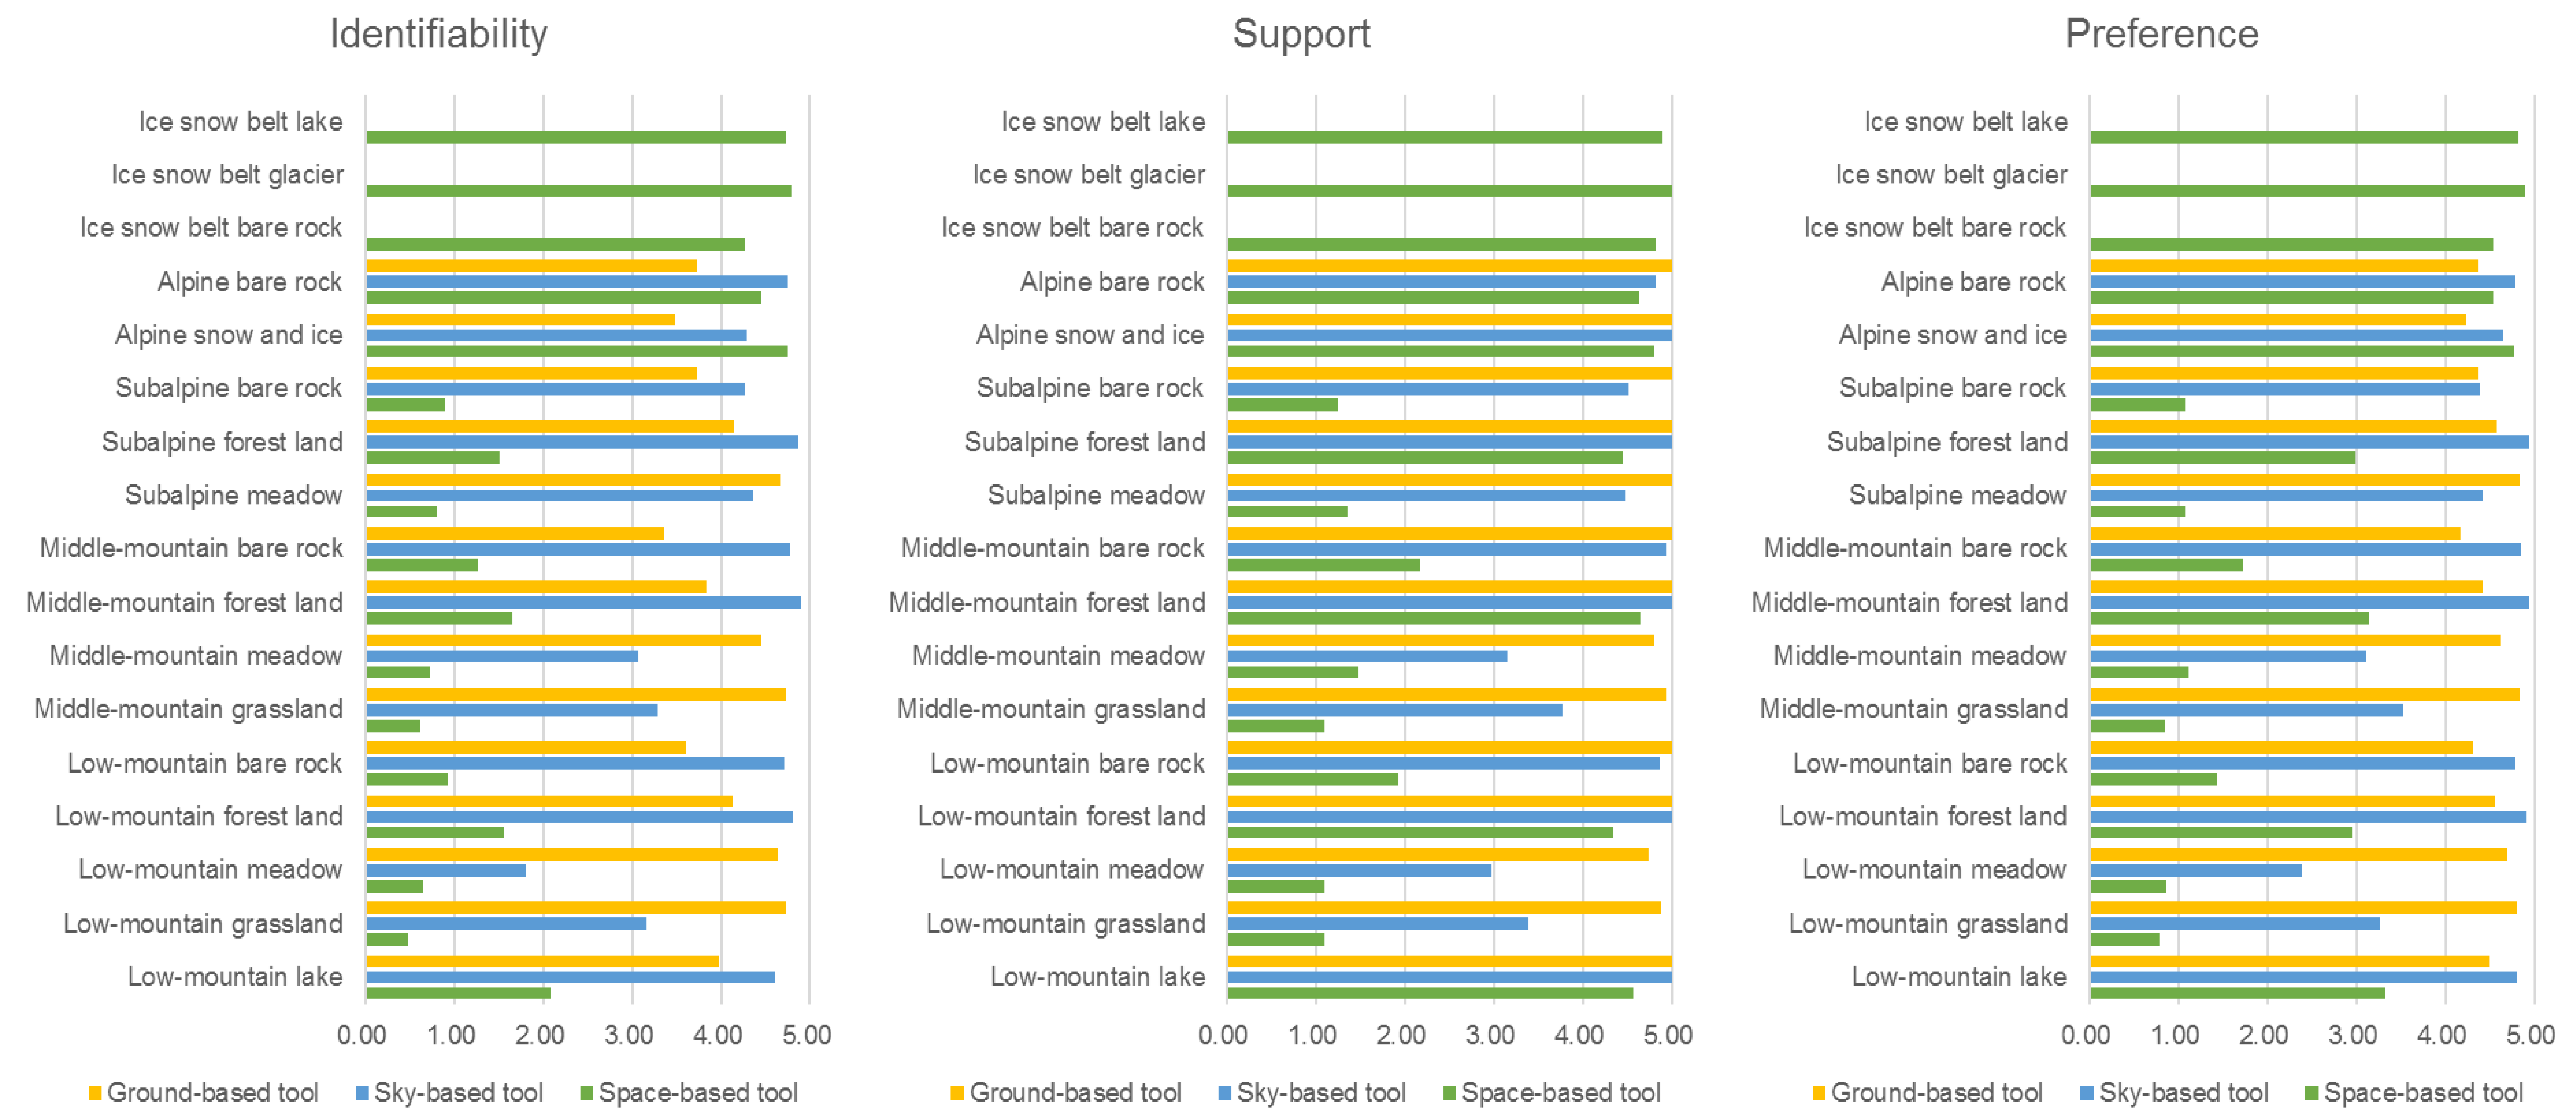
As shown in
Figure 6, differentiations existed in landscape identifiability using different types of monitoring tools. The space-based tool produced photos representing landscape units in the ice and snow belt with the highest identifiability, given that there were no photos available for evaluation shots using the sky-based and ground-based monitoring tools. For monitoring other landscape unit types, the space-based tool presented products with the most negative monitoring effect. Most of the respondents failed to recognize the real landscape types, except for the landscape units of lake and forest in the low-mountain belt and the woods in the middle-mountain belt and subalpine belt; the identifiability values of these landscape units were still lower than those scored by respondents for sky-based and ground-based tools. For the photos shot by the ground-based tool, all landscape unit types except for those in the ice and snow belt were recognized with the highest identifiability when compared to the values scored according to the photos shot by the other two types of monitoring tools. For the sky-based tool, the landscape units of grassland and meadow in the low-mountain belt and middle-mountain belt were of a relatively low monitoring effect, as nearly half of the respondents failed to distinguish the coverage differences because of the low resolution. In terms of support, more than half of the respondents approved of monitoring the landscape in Bogda using the ground-based tool, especially for landscape units of grasslands and meadows in the low-mountain belt and middle-mountain belt as well as subalpine meadow. The ground-based tool had much higher supportive scores than those of the other two types of monitoring tools. For the sky-based tool, it had the highest support among the three types of tools for monitoring the landscapes of lake, forest, and barren rock in the low-mountain belt, the wood and bare rock in the middle-mountain belt, the forest in the subalpine belt, and the alpine bare rock. Similar to the score distribution of identifiability, monitoring landscapes in the regions above the alpine belt using the space-based tool had high application support. Correlation could be found between the identifiability and support for tools selection on landscape monitoring. The monitoring tools by which the landscape units could be correctly identified generally had high support for use by observers in landscape monitoring. However, for the space-based tool, although it had good effects on monitoring lakes and forest land, most of the respondents were not supportive of using it in monitoring these types of landscape units.
According to the final scores of the subjective preference for landscape unit monitoring, it could be concluded that different types of tools have their own advantages in monitoring different types of landscapes. The space-based tool was good at monitoring landscapes at high altitudes, which could fill the gap of the other two monitoring tools. The sky-based tool had exceptional advantages in monitoring specific landscape types including lakes and forest land. The ground-based tool was basically of high preference in monitoring all types of landscapes except for high-altitude regions.
4.2. Suitability of the Three Types of Monitoring Tools
Based on the nine layers of map that were rasterized and normalized, the three fields representing the three types of tools were added to the attribute table of each thematic map according to their assignments in the suitability assessment form (
Table 1). Then, a suitability distribution map of the corresponding three types of tools in landscape monitoring was obtained by overlaying these nine criteria layers by their weights. As shown in
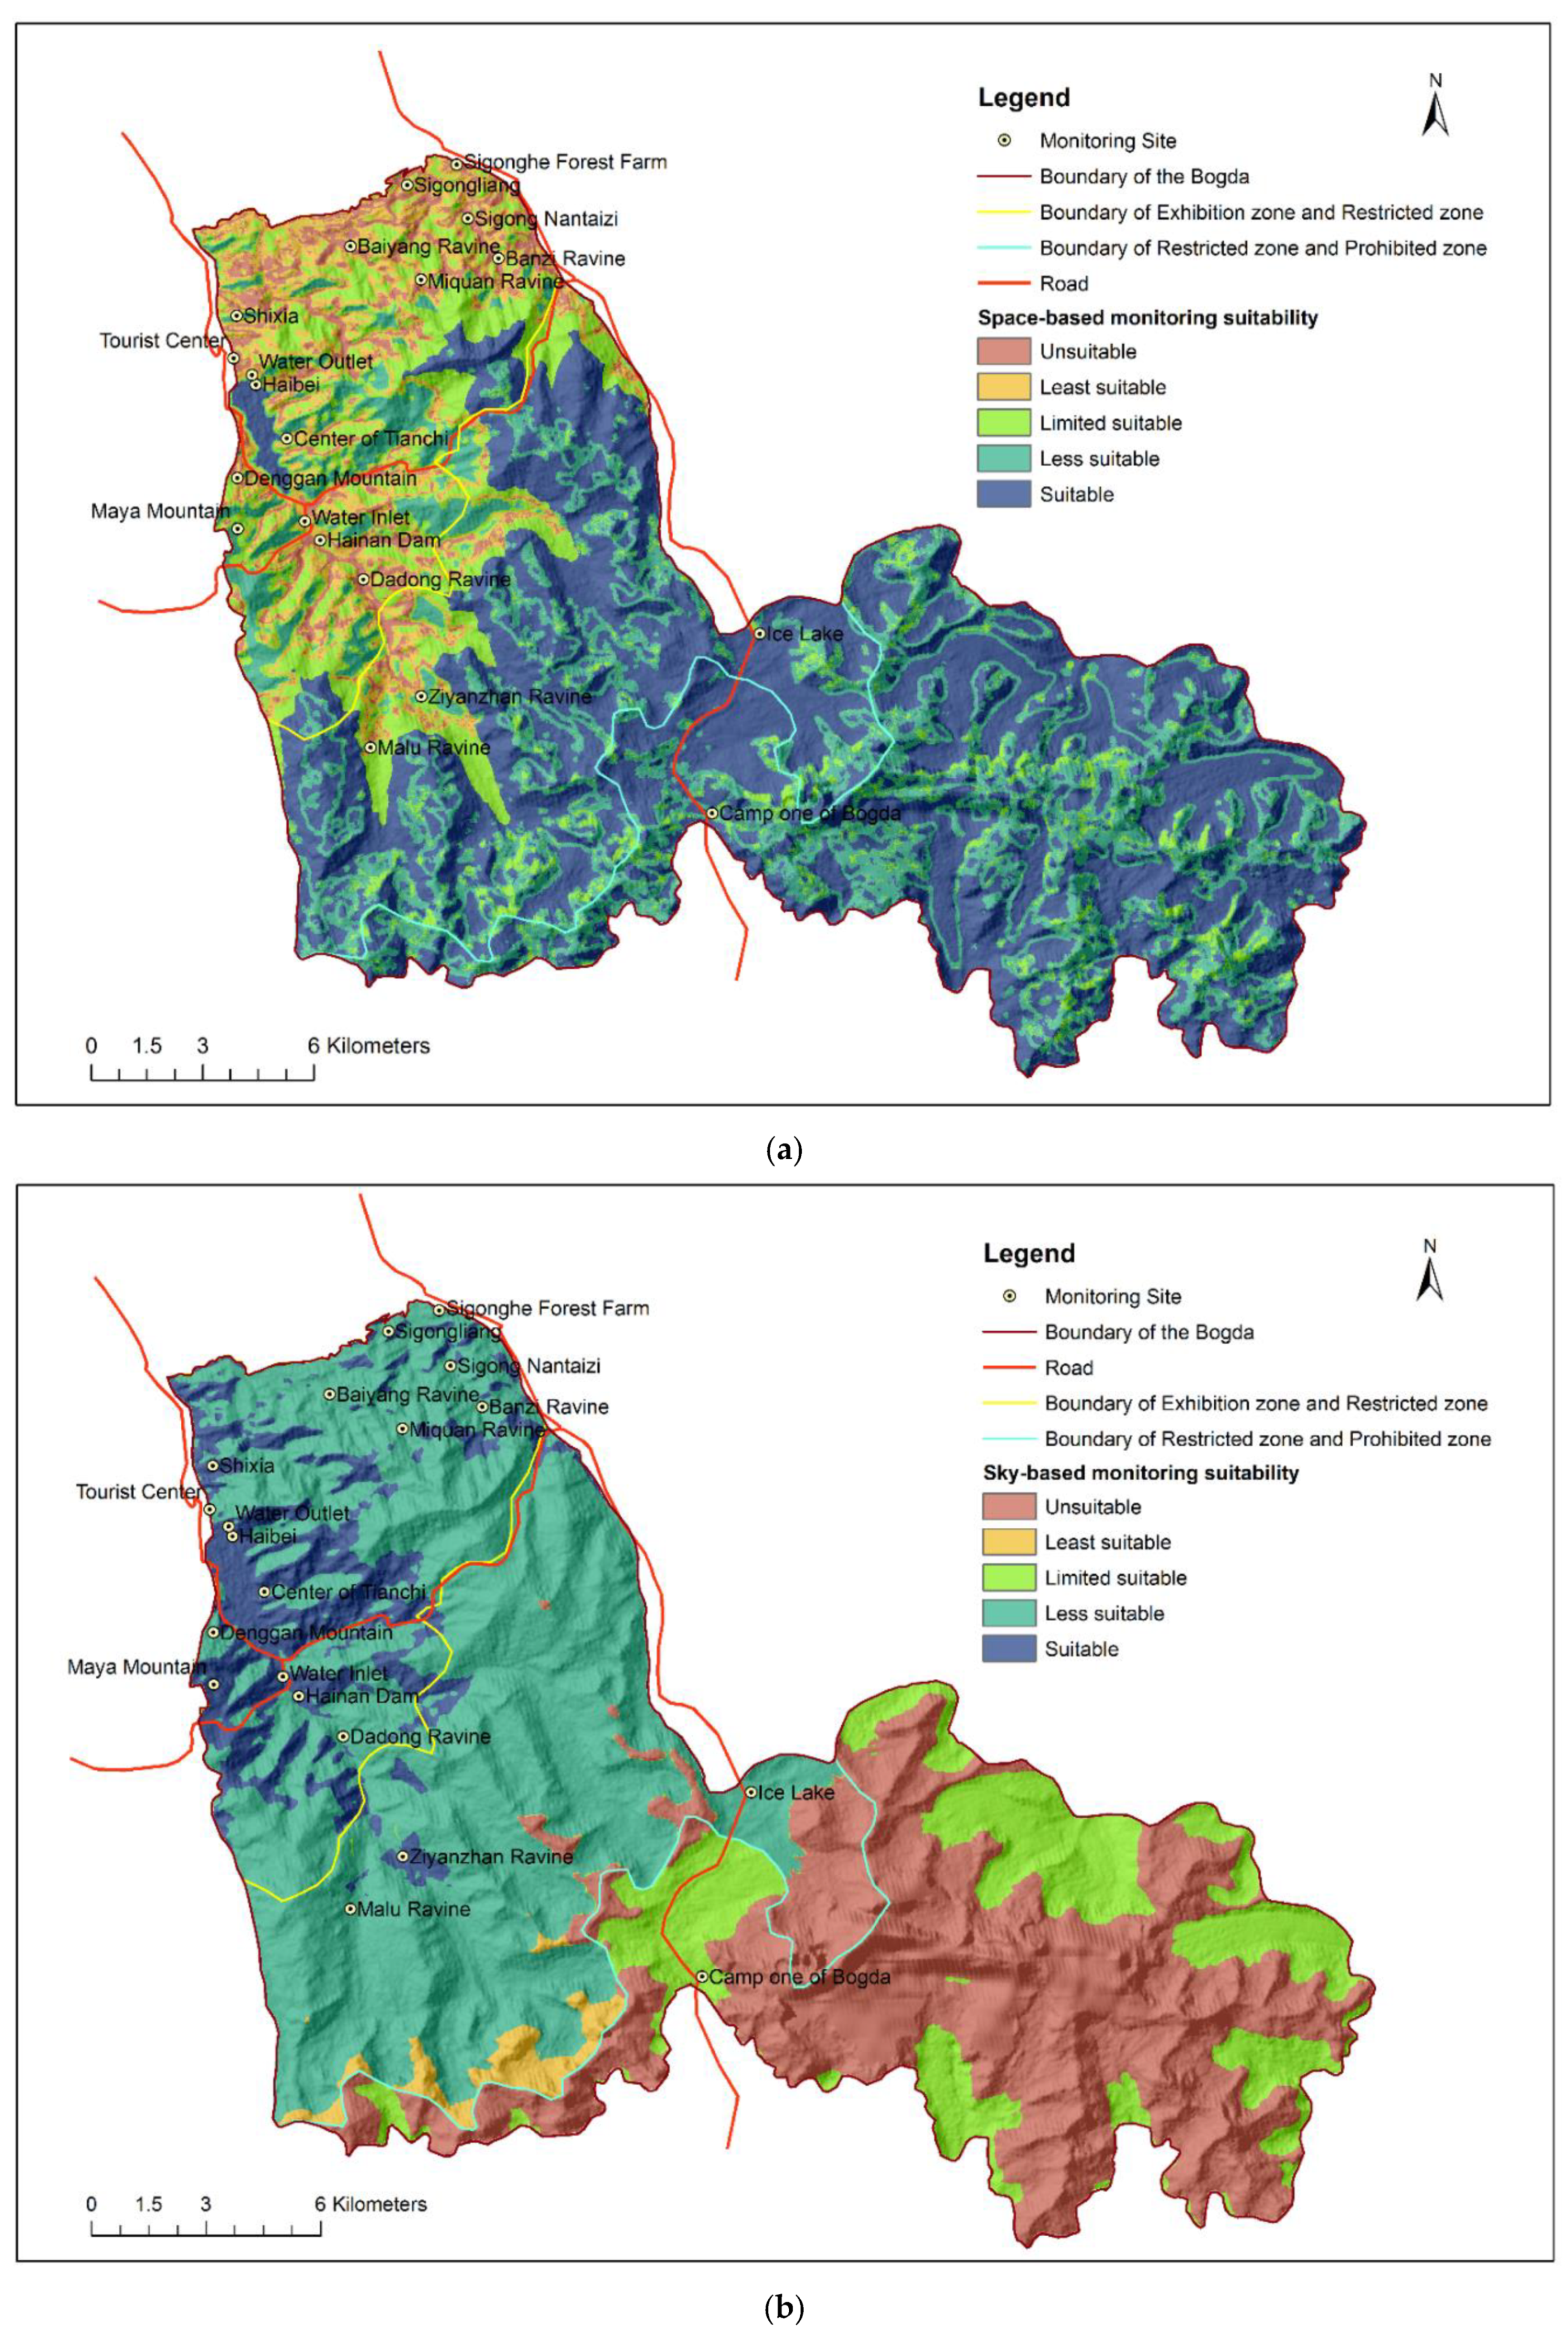
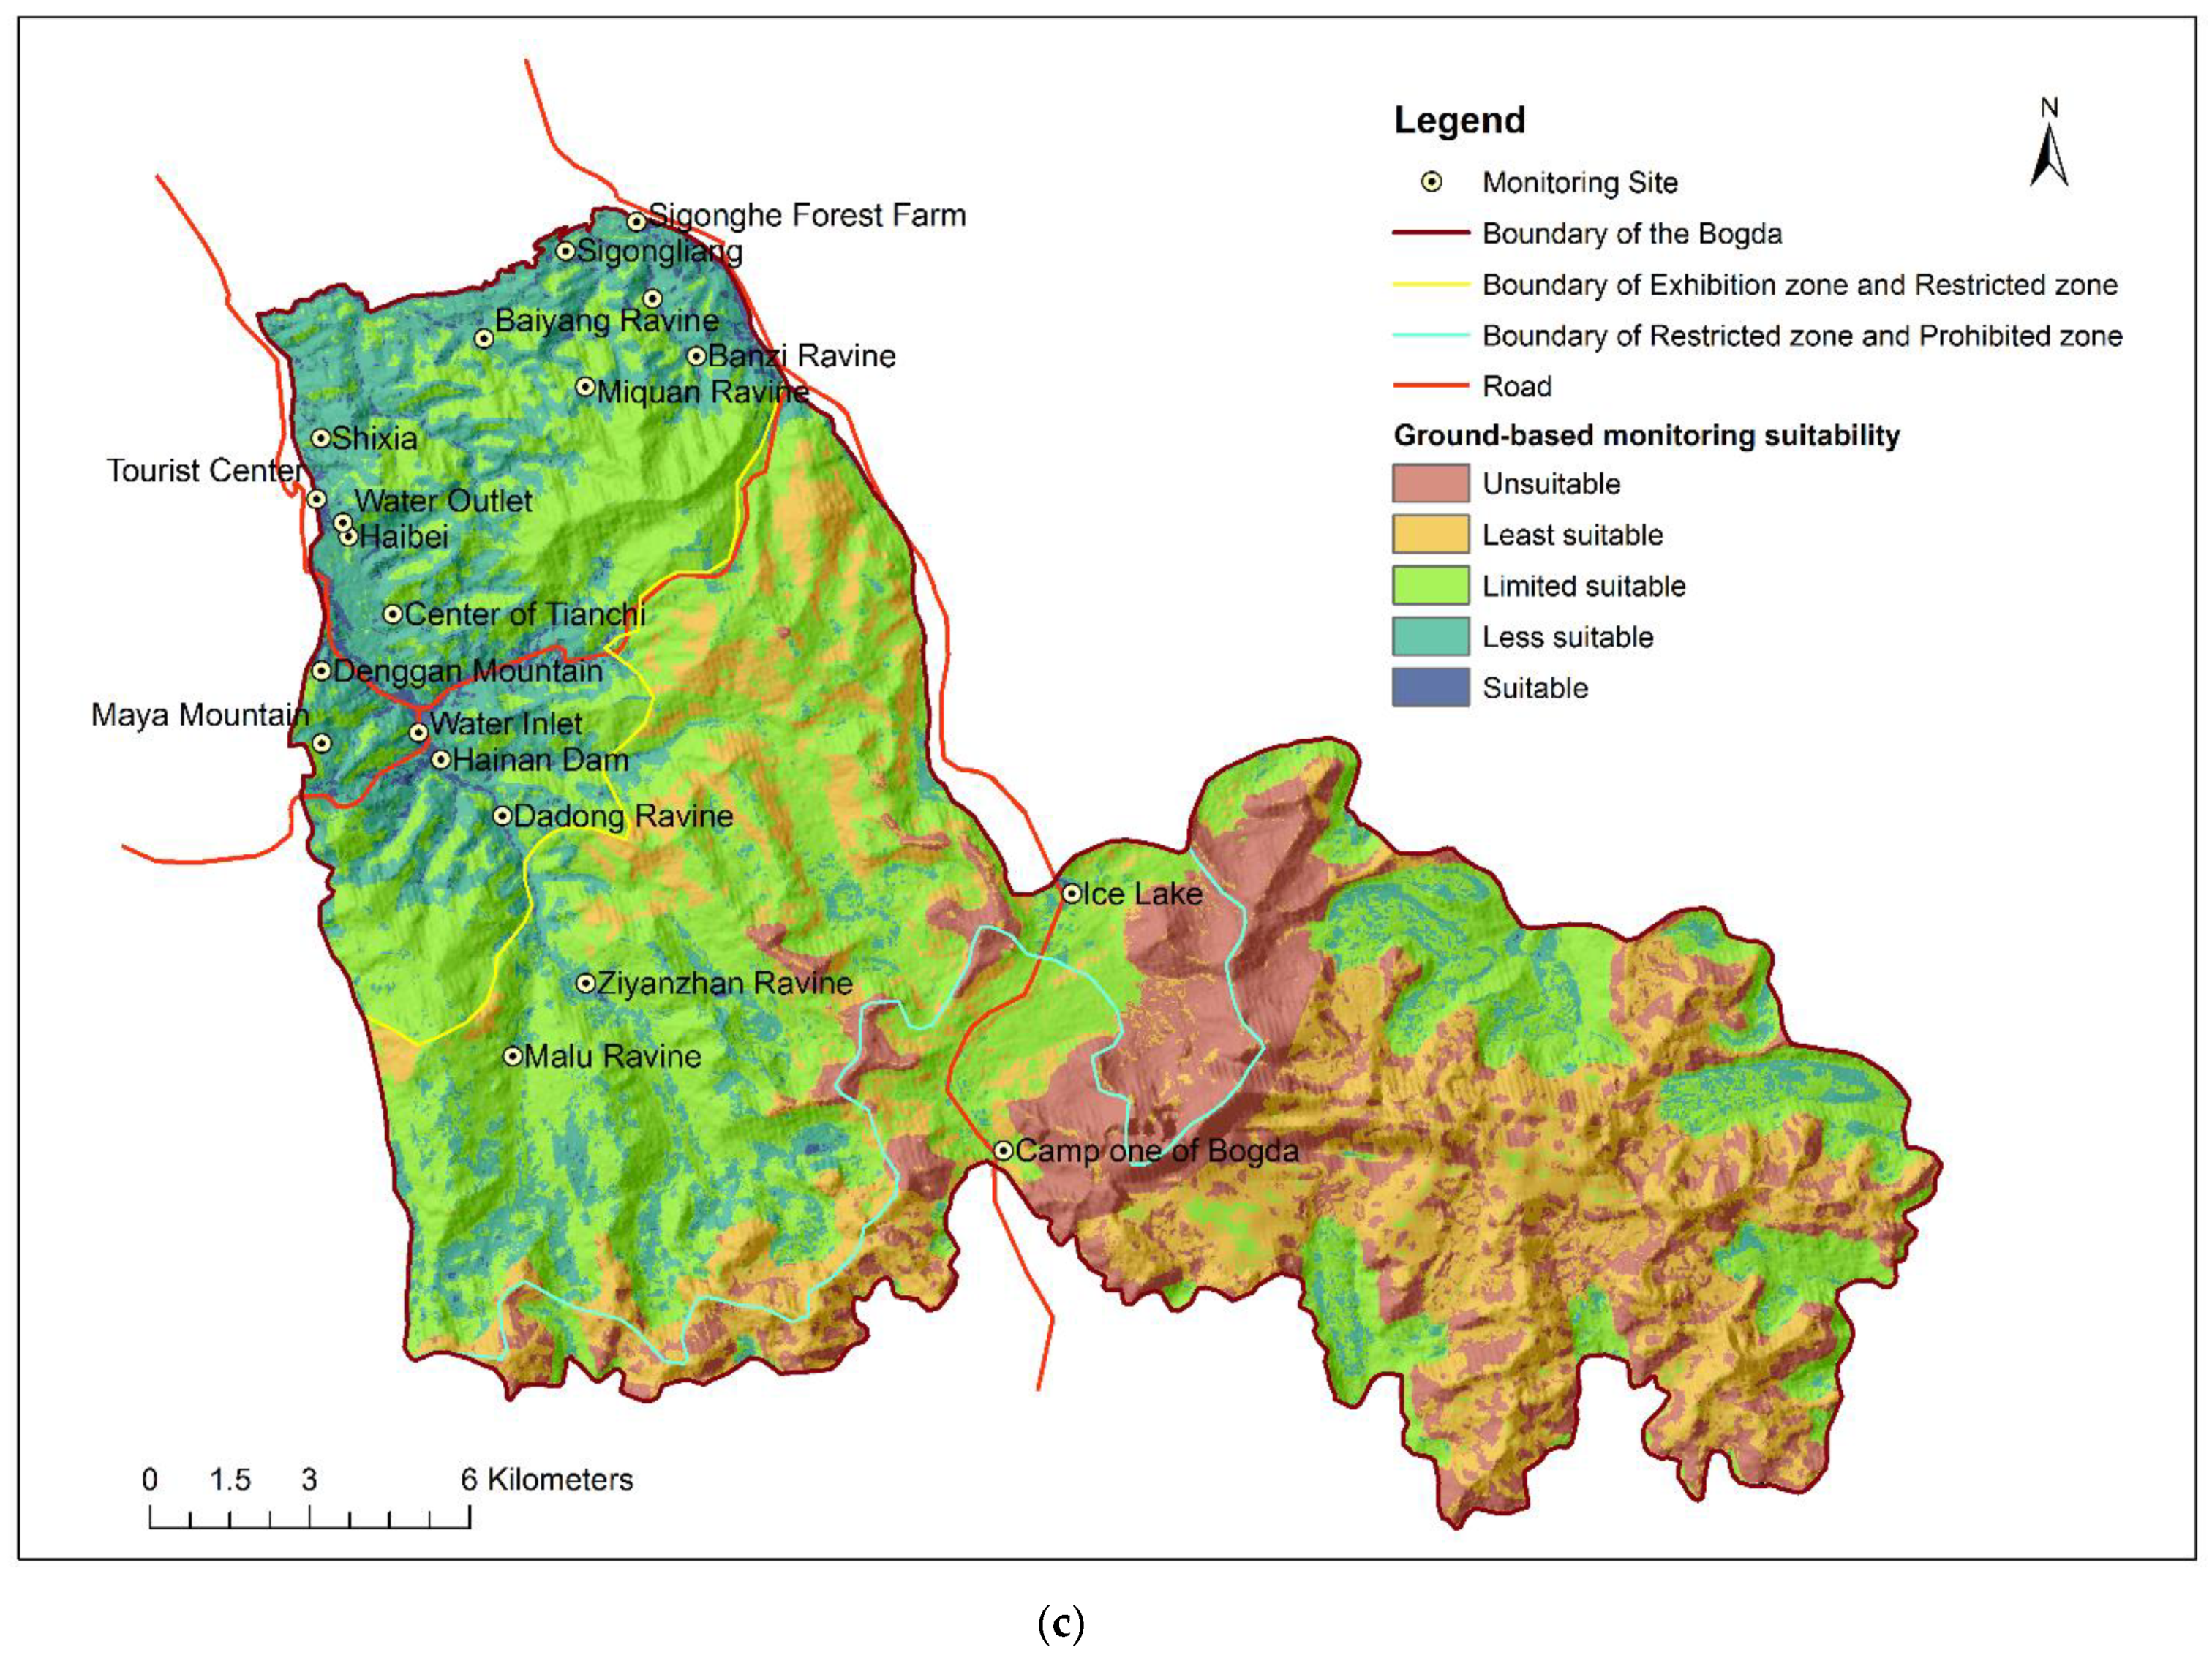
Figure 7, the results of monitoring suitability were classified into five categories after normalization: unsuitable (0–0.2), least suitable (0.2–0.4), limited suitability (0.4–0.6), less suitable (0.6–0.8), and suitable (0.8–1).
There were spatial distribution differentiations on the application suitability in landscape monitoring among the three types of tools. As the terrain of the Bogda increases from northwest to southeast, it was found that, obviously different from the other two types of tools, the space-based tool had high suitability in monitoring landscapes in the high-altitude region. The sky-based and ground-based tools were both good at monitoring landscapes in the low-altitude regions. The suitability degree the of sky-based tool was particularly polarized because there were a few regions belonging to the least suitable and limited suitability categories in landscape monitoring under this type of tool. These characteristics are proven by the statistical results in
Table 5.
Table 5 shows differentiations of area proportion distribution for the three types of tools in the 5-degree landscape monitoring suitability. For the space-based tool, its “Suitable” area occupied the most significant proportion of 43.37%, which was also of the most prominent area of “Suitable” regions among the three types of monitoring tools. As the monitoring suitability degree declined, the area proportion shrank, and the “Unsuitable” region occupied the smallest area proportion of 4.86%, showing that the space-based tool has a general suitability in landscape monitoring. For the sky-based tool, it had the biggest “Unsuitable” area compared to the other two types of tools, occupying nearly one-third of the field of Bogda, and the regions were basically covered by high-mountain landscapes. The “Less Suitable” region for monitoring landscape using this type of tool accounted for 43.68% of the area. It also had the most significant area proportion in this region type among the three types of monitoring tools. For the ground-based tool, the area proportion distributions of the 5-degree suitability in landscape monitoring presented a normal distribution, where the “Limited Suitability” region occupied the biggest area of 40.84%, followed by the “Least Suitable” region (22.23%), “Less Suitable” region (18.92%), “Unsuitable” region (16.53%), and “Suitable” region (1.49%), which was also of the smallest area proportion of “Suitable” regions among the three types of monitoring tools.
The spatial applicability distribution characteristics of the three monitoring tools were also reflected by their area allocation ratio in different levels of protection zones. As shown in
Table 6, in the exhibition zone of Bogda, the space-based and ground-based tools occupied far less proportion in “Suitable” regions than the sky-based tool, whose suitable monitoring region held 33.95% of the whole exhibition zone. For the space-based instrument, it had the most prominent “Unsuitable” area proportion of 17.53% in the exhibition zone, as there was no unsuitable region in the exhibition zone for landscape monitoring using the other two types of tools. In the prohibited zone of Bogda, the situation was reversed: the space-based tool had the biggest “Suitable” area proportion in landscape monitoring with more than half of the area of the prohibited zone (57.11%), whereas for the other two types of tools, their suitable monitoring regions in the prohibited zone were almost zero. For the sky-based device, it had the most prominent “Unsuitable” area in landscape monitoring, with a proportion of 67.66% in the prohibited zone. For the ground-based tool, the “Unsuitable”, “Least Suitable”, and “Limited Suitability” regions in landscape monitoring in the prohibited zone accounted for similar area proportions, and they covered the vast majority of this zone. In the restricted zone, the space-based tool, whose “Suitable” region occupied 51.93% of the area in the whole restricted zone, presented a much more extensive range of applications in landscape monitoring than the other two types of tools. The suitability of the sky-based tool in monitoring landscapes in the restricted zone was second only to the space-based monitoring tool; its “Less Suitable” region in landscape monitoring occupied the majority (81.32%) of the restricted area.
The comparison of the three types of devices in landscape monitoring suitability was conducted from the perspective of the existing monitoring sites in Bogda as well. As shown in
Table 7, most of the monitoring sites in Bogda were over the "Limited Suitability" degree for landscape monitoring using the sky-based tool and ground-based tool, forming a stark contrast with the space-based tool, with which a limited number of monitoring sites were suitable for landscape monitoring. The situation is consistent with the original intention of these monitoring stations, which are used to monitor landscape areas with high diversity (e.g., Ziyanzhan Ravine, Maya Mountain, Haibei, and Shixia) and regions that are significantly disturbed by human activities (e.g., Tourist Center, Water Inlet, Water Outlet, and Hainan Dam), where the coarse-resolution remote sensing images cannot achieve good monitoring results. Moreover, the site selection of these stations has also taken accessibility into consideration, as the workers and managers of scenic areas have regular monitoring data collection tasks. However, one monitoring site recommends using the space-based tool, the Ice Lake. The reason is greatly because of its location at a high altitude and its significant slope, reducing the suitability of sky-based and ground-based monitoring tools, which are of low operability in field work by humans. It could be concluded that the design of existing monitoring sites is prone to sky-based and ground-based monitoring modes, whereas, for most of the remaining areas where monitoring points have not been installed, it is necessary to conduct an optimal suitability evaluation for the three types of monitoring tools.
4.3. The Three-Dimensional Monitoring System in Bogda
The three distribution maps of the landscape monitoring suitability corresponding to the three types of tools in
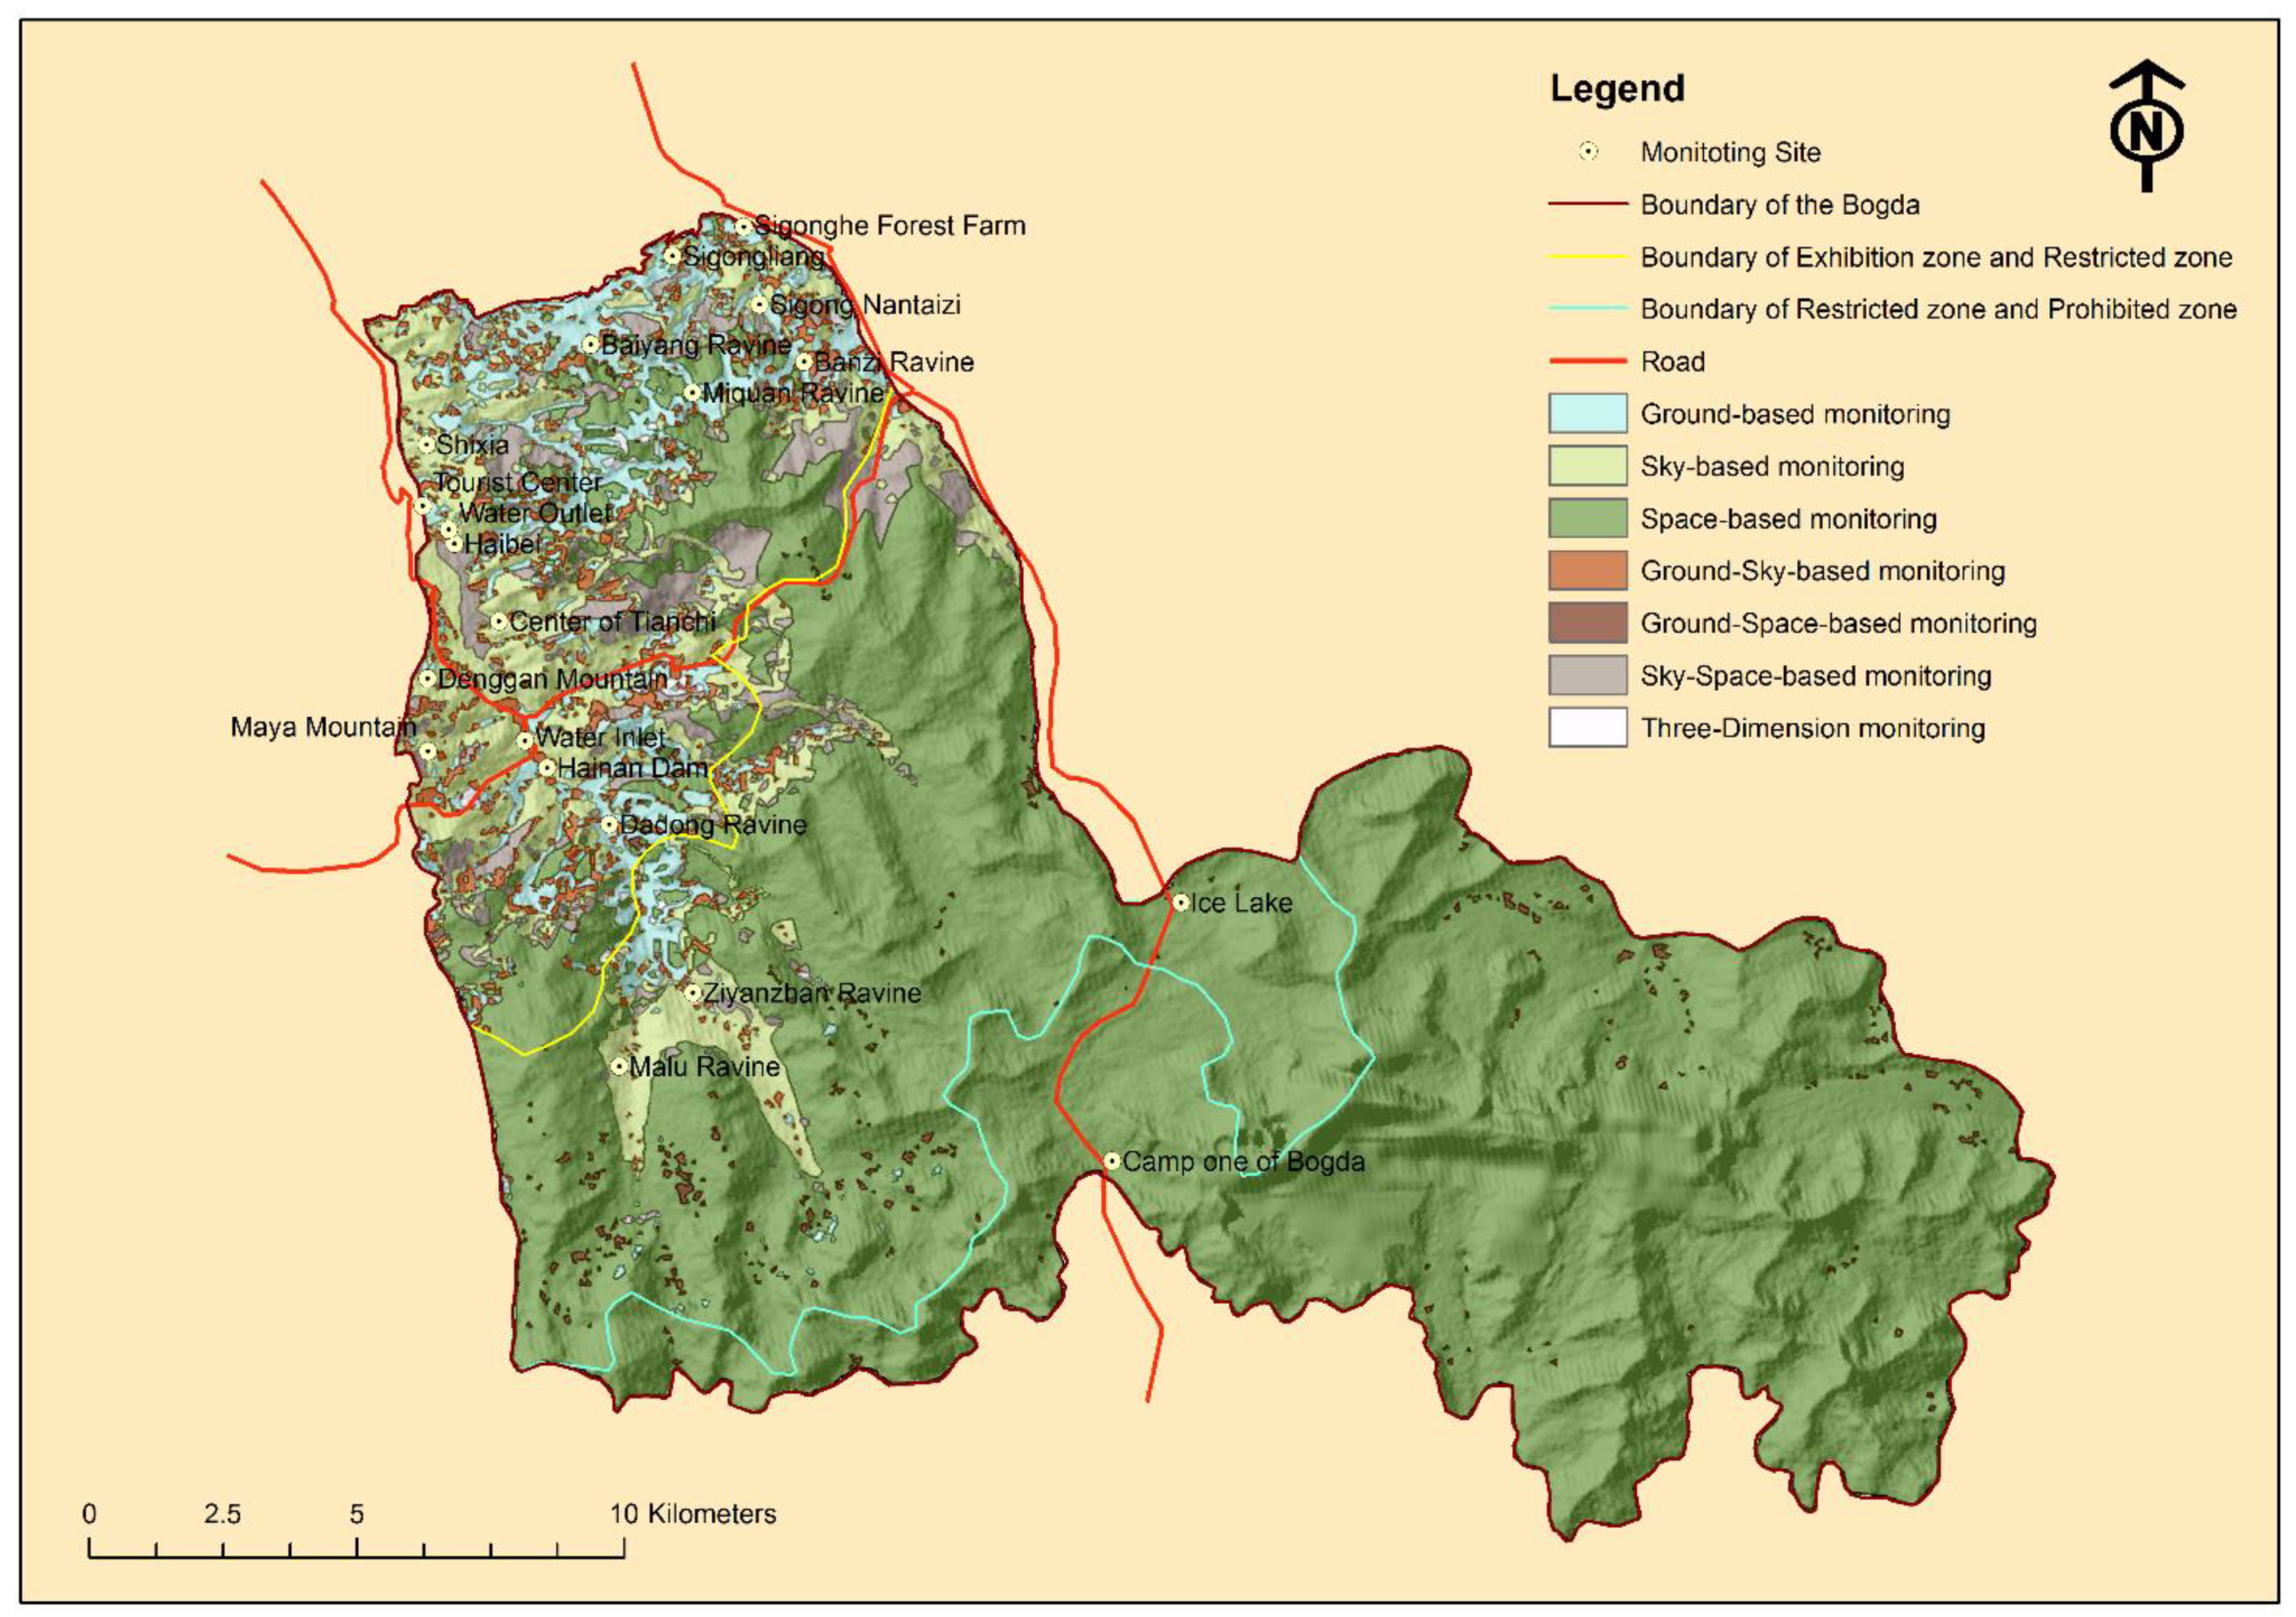
Figure 7 were combined on the basis of the intersection function module in ArcGIS. Then, a field representing the optimal monitoring method was added into the attribute table of the intersected and rasterized final map. The value of each pixel was assigned by the field calculator according to the maximum value comparison result of the 5-level suitability of the three types of monitoring tools. Through this process, a final distribution map of the optimal landscape monitoring modes in the whole region of Bogda was obtained. As shown in
Figure 8, there were seven categories of monitoring methods including three types of monitoring tools and their combinations.
It has been shown that the richness of the optimal landscape monitoring modes lessens with decreasing altitude. In the northwest of Bogda, all seven types of optimal modes exist, while in the southeast part with high altitude, the optimal approach is mainly represented by space-based monitoring, as the elevation and slope become the dominant factors limiting accessibility for ground field work and UAVs. The distribution features could be further explained by the statistic results of the area proportions in the 3-level protected zones. As shown in
Table 8, in the prohibited zone, there were only two optimal monitoring modes, the space-based and the ground-space-based monitoring modes, in which the former occupied the vast majority of the area, with a proportion of 99.45%. In the restricted zone, the space-based monitoring mode was still dominant in landscape monitoring and was the main selected mode, with an area proportion of 83.99% in this zone. More optimal modes exist in landscape monitoring than in the prohibited zone: the sky-based monitoring mode occupied the second largest area with a 8.09% proportion, followed by the sky-space-based monitoring mode with a percentage of 3.16%. Landscape monitoring under the three-dimension tools was still optimal accounting for the smallest area in this zone. In the exhibition zone, all seven optimal landscape monitoring modes also existed; however, their area allocations in space differed from that in the other two zones. The sky-based monitoring mode occupied the most extensive area, with 29.92% of the zone, followed by the space-based monitoring mode and ground-based monitoring mode with similar area proportions of 21.43% and 20.36%, respectively. The area proportion of the preferential modes for landscape monitoring generated by the combination of the three monitoring tools was 28.29%, which was the highest among the 3-level protected zone, indicating that landscape monitoring in this zone tended to be more comprehensive than in the other two zones. For all of Bogda, the optimal landscape monitoring mode using the space-based tool occupied the most extensive area, at nearly three-quarters, followed by the sky-based monitoring mode with a proportion of 10.01%. The three-dimension monitoring modes and the ground-space-based monitoring mode occupied the smallest area among all seven optimal modes, accounting for proportions of 0.65% and 0.89%, respectively.
Furthermore, the distribution results of the seven types of optimal monitoring modes could guide the construction and material allocation of existing monitoring sites. According to
Table 9, there were two sites located in the region of space-based monitoring mode, four sites located in the region of sky-based monitoring mode, eight sites located in the region of optimal monitoring mode using the ground-based tool, and six sites located in the region of the ground-sky-based monitoring mode. For the sites located in the space-based monitoring zone, station construction should place emphasis on cooperating with remote sensing by being equipped with surveying and mapping tools for monitoring the surface elevation and land cover changes (ice lakes, ice, and glaciers). In terms of monitoring frequency, considering the low human accessibility, the frequency of ground-based monitoring is recommended to be twice a year (in the seasons of winter and summer). For the stations located in the ground-based monitoring zone, construction should focus on monitoring landscapes such as grasslands and woodlands in the low-mountain and middle-mountain belt, and human activities such as hot spots for visiting and illegal resource exploitation may damage the landscape aesthetics. Stations may be equipped with full-color cameras, panoramic cameras, printers, and so on, and probes should be installed within the reach of the monitoring staff. In addition, plot-based plant community surveys and sampling tools (e.g., GPS, specimen clips, measuring rulers, spectrometers, shovels, branch shears) should be prepared in the ground-based monitoring stations for monitoring the structural changes to the ecological landscape. Taking advantage of the good accessibility, the monitoring cycle for landscape changes is the shortest, and the monitoring frequency could even be three times a day (morning, noon, and night). For the stations in sky-based monitoring zones, UAV equipment is a basic requirement, as the existing air routes in Bogda prohibit drones from being used. As shown in
Figure 8, the four sites located in the sky-based monitoring zone are scattered and sparsely distributed; however, contiguous monitoring could be achieved by splicing the orthographic landscape belts through the optimized route design. The sky-based tool monitoring could make up for the inaccessibility and make measurements more efficient. In addition, the monitoring products have a higher resolution than those of the remote sensing products, which could realize the fine monitoring of plant community structures (e.g., the number and height of vegetation layers), landscape patterns (e.g., landscape area, perimeter, connectivity, and fragmentation), disasters (e.g., forest pests, pastures, and fires), and nighttime inspections equipped with an infrared cameras. The monitoring cycle has a more flexible design according to the characteristics of the monitoring object, such as the seasonal changes and tourism peaks.
5. Discussion and Conclusions
As requested by UNESCO, landscape monitoring is one crucial aspect for tracking the health of NWHSs. The monitoring process should be guaranteed to be more than sufficient and also efficient with the appropriate tools. Therefore, it is realistic to conduct a spatial suitability assessment for commonly used monitoring tools; this area of research is also lacking in current landscape monitoring research.
This paper presents a method and results of a spatial suitability evaluation of landscape monitoring using three types of tools: the space-based tool, the sky-based tool, and the ground-based tool. The method was verified using a case study in Bogda of Xinjiang Tianshan of China. The suitability assessment was conducted from three aspects combining subjectivity and objectivity—the monitoring environment, the monitoring object, and the monitoring effect—in which the three types of monitoring tools have typical differences from each other. There were nine indicators finalized. The former eight factors were classified and scored with objectivity by using the Delphi method based on their differentiations in landscape monitoring effects; subjectivity was considered in scoring the observer’s subjective preference of landscape monitoring products to quantify the monitoring effect of different landscape units monitored using different types of tools.
Landscapes are often seen as a resource with ecological and aesthetic values that attract visitors to nature-based scenic areas [
4]. Thus, the human subjective preferences for scenery have a defined weight in evaluating landscape monitoring effects, and this affects the selection of monitoring tools. In this study, a personal evaluation was conducted on both the identifiability of the different monitored landscape units and the preferences in using the various monitoring tools. The results showed that the optimal landscape monitoring effects of different landscape types were expressed by different types of monitoring tools. For example, the lakes and forest land monitored using the sky-based tool were of higher preference than when they were monitored using the space-based tool and ground-based tool. The result is in line with other research that has used UAVs to monitor the landscape changes of water bodies [
39,
40] and woodlands [
41,
42] and has achieved good monitoring results.
Through overlay analysis in ArcGIS, the suitability of the three types of monitoring tools and the final optimal suitability distribution of the three types of monitoring tools were obtained. The results showed an apparently stepped distribution characteristic with altitude, where the space-based monitoring zone was located in regions of high altitude, and the landscapes in low altitude regions had the best effects under ground-based and sky-based monitoring tools. The distribution characteristics were further analyzed in combination with the distribution characteristics of the 3-level protected zones and existing monitoring sites in Bogda. Results showed that in the most severely protected areas of the prohibited zone, the space-based monitoring mode occupied the vast majority of the area, which is basically consistent with the protection conditions where there is no occurrence of human activities. With the decline of the protection level, the monitoring methods tended to diversify, and landscape monitoring with the space-based tool was no longer the priority monitoring method. Especially in the exhibition zone, landscape monitoring tended to be integrated, that is, optimal landscape monitoring was realized by using a combination of three types of tools. It has also been shown that most of the 20 existing monitoring stations are located in the sky-based and ground-based monitoring zones, proving reliable and realistic suitability evaluation results. Their construction is mostly under the consideration of accessibility, and the usability of these sites is primarily for monitoring the multifarious landscapes and human activities, which are elements primarily found in the exhibition zone.
By spatially assessing the monitoring suitability for the first time from the perspective of the monitoring tools, it has been proven that the three-dimensional monitoring system is feasible to monitor the landscape status and changes in an NWHS. The availability of data allows this approach to be used universally in the future. Based on the suitability assessment form, all objective criteria are of high data availability because low-cost remote sensing images and a series of open and shared thematic maps were used. The results of the case study in Bogda may help planners and decision makers to strategically deploy monitoring sites as well as allocate advisable monitoring facilities and staff within the corresponding type of suitable monitoring zones. In addition, results are instructive to the establishment of sightseeing facilities. For example, the site selection of the viewing platform could refer to the distribution of the sky-based monitoring zone.
However, there also are several limitations in this study. First, remote sensing, UAVs, and cameras, which are the most commonly used tools in landscape monitoring and were selected for this case study, are not sufficiently representative of the three-dimensional monitoring system of the space-based, sky-based, the ground-based monitoring methods; thus, the assignment of indicators based on their differentiation in the suitability assessment form lacks versatility. Second, photo acquisition for subjective evaluation was requested for the same shooting conditions in order to avoid the unfair quality of imaging. However, the most beautiful presentation of different types of landscapes and their combinations could not be obtained under this approach. For instance, in the case where the UAV monitoring height is the same, different water body monitoring areas will have different effects. On the other hand, for the supervision of the same feature, when the shooting is under different wide angles and different flying heights, it may produce different aesthetic experiences for observers.
Correspondingly, there are two possible directions for further research based on our findings, First, a universal indicator system for the suitability assessment of monitoring tools should be established under a much more comprehensive comparison, which is to compare as many kinds of monitoring tools as possible in the three-dimensional monitoring system to extract their different performances in landscape monitoring. Second, we are going to conduct a refined work on the monitoring specification design for different types of landscapes by using various tools based on the classified landscape units, in which the pictures will be obtained under different shooting conditions. Furthermore, the analysis process in this study could be used in a more exciting field to analyze the suitability of tools in the three-dimension system for monitoring the beauty of the landscape. The study may be conducted by establishing a more subjective evaluation system and a more specific questionnaire to survey the observer’s visual experience and psychological feelings about the scenery (e.g., the rareness, magnificence, or combination degree).
In conclusion, this study provides a new perspective in the landscape monitoring research field. This is the first time tools in a three-dimension monitoring system have been used to evaluate their suitability in landscape monitoring. The series of data processing and analysis methods were conducted in a mountainous NWHS, and they are worthy of reference by national parks and nature reserves in other landform types. The evaluation system could be further improved by adding significant indicators and by regulating the values to adjust them to different landscape characteristics.
