Article

Environmental Impacts on the Performance of Solar Photovoltaic Systems

by
Ramadan J. Mustafa
1,
Mohamed R. Gomaa
2,3,
Mujahed Al-Dhaifallah
4,* and
Hegazy Rezk
5,6,*
1
Mechanical Department, Faculty of Engineering, Mutah University, Al-Karak 61710, Jordan
2
Mechanical Department, Benha Faculty of Engineering, Benha University, Benha 13512, Egypt
3
Mechanical Department, Faculty of Engineering, Al-Hussein Bin Talal University, Ma’an 71111, Jordan
4
Systems Engineering Department, King Fahd University of Petroleum & Minerals, Dhahran 31261, Saudi Arabia
5
College of Engineering at Wadi Addawaser, Prince Sattam Bin Abdulaziz University, Wadi Addawaser 11991, Saudi Arabia
6
Electrical Engineering Department, Faculty of Engineering, Minia University, Minya 61519, Egypt
*
Authors to whom correspondence should be addressed.
Sustainability 2020, 12(2), 608; https://doi.org/10.3390/su12020608
Submission received: 23 November 2019 / Revised: 2 January 2020 / Accepted: 5 January 2020 / Published: 14 January 2020

Abstract

:
This study scrutinizes the reliability and validity of existing analyses that focus on the impact of various environmental factors on a photovoltaic (PV) system’s performance. For the first time, four environmental factors (the accumulation of dust, water droplets, birds’ droppings, and partial shading conditions) affecting system performance are investigated, simultaneously, in one study. The results obtained from this investigation demonstrate that the accumulation of dust, shading, and bird fouling has a significant effect on PV current and voltage, and consequently, the harvested PV energy. ‘Shading’ had the strongest influence on the efficiency of the PV modules. It was found that increasing the area of shading on a PV module surface by a quarter, half, and three quarters resulted in a power reduction of 33.7%, 45.1%, and 92.6%, respectively. However, results pertaining to the impact of water droplets on the PV panel had an inverse effect, decreasing the temperature of the PV panel, which led to an increase in the potential difference and improved the power output by at least 5.6%. Moreover, dust accumulation reduced the power output by 8.80% and the efficiency by 11.86%, while birds fouling the PV module surface was found to reduce the PV system performance by about 7.4%.

1. Introduction

The increasing popularity of renewable energy over the last few decades has gained momentum owing to the continuing scarcity of fossil fuels. This has also pushed the significance of, and the need for, electrical energy. Against this backdrop, the photovoltaic (PV) industry has been continuously growing at a rapid rate. Photovoltaic (PV) systems can hold the world’s electricity production. One hundred gigawatts (GW) had been added during 2018; therefore, the total capacity of the installed PV systems reaches up to 505 GW worldwide [1]. During 2018, China alone added around 45 GW, and its total capacity increased to 176 GW.
Silicon crystalline PV modules are widely used around the world. Nowadays, new PV technologies with cheaper manufacturing costs than traditional silicon crystalline-based modules are available, such as amorphous silicon, copper indium selenide (CIS), and cadmium telluride. In addition, new standards and testing schemes are being developed to be compatible with the new or improved technologies. With the steady increase in electricity prices, domestic PV systems could be implemented and used with a low system cost. The noticeable drop in the cost of PV systems means that they could compete with electricity prices both nationally and regionally in locations with high irradiation, such as the solar belt regions. However, PV installations are mainly ground mounted. By contrast, in Germany, building integrated photovoltaic (BIPV) and roof top installations have a big role in PV projects, and ordinary Germans incur a benefit from these projects through a reduction in their energy bills. Photovoltaic power output depends on many factors, such as sun position, the intensity of solar irradiance, temperature, and load demand. Accordingly, the dynamic response of PV systems must be evaluated thoroughly for utility grid (UG) performance, since interconnecting a PV system with a UG may lead to instability [2]. The uncertainty of the PV performance models is still too high. The focus point of much of the existing current research on this subject has largely been on evaluating module performance rather than system performance.
The effect of dust accumulation on the performance of PV systems has been investigated in many studies. The results indicated that dust accumulating rate predominantly depends on the weather conditions of the site. For example, in Colorado, a dust deposition rate of 1–50 mg·m−2·day−1 was recorded by Boyle et al. [3]. In a similar work, Hegazy [4] reported a rate of 150–300 mg·m−2·day−1 in Egypt. The noticeable difference between these results was due to the varied weather conditions. Gholami et al. [5], in 2018, conducted an experimental work to study the impact of dust after 70 days without rain. The main finding proved that during the period of the experiment, dust surface density increased up to 6.0986 g/m2, which caused a 21.47% reduction in the power output. The impact of particle sizes and the tilt angle on the dust deposition characteristics of a PV system has been investigated by Lu and Zhao [6]. The maximum deposition rate has been observed for the 150 μm dust particles. For a tilt angle of 155°, the deposition rate is 9.78%. In the same direction, in 2019, Ricardo et al. [7] investigated the effect of soiling on the optimum tilt angle.
However, Kaldellis [8] investigated the effect of dust upon PV system output energy. Different air pollutants had been considered, and the results of the investigation proved that the energy output of a PV system was reduced. Such reduction depends upon the composition and the source of pollutants. A theoretical analysis was also subsequently carried out for studying and simulating the impact of air pollution on PV system performance. Ghazi [9] utilized a three-perspective technique/framework for investigating the impact of dust and different solid particle accumulations on PV system performance. This framework included simulation, experimental validation, and a statistical analysis of the effect of weather conditions on the system performance of two different PV plants. The first plant was located on the roofs of the Cockcroft Building. It included 132 PV modules tilted at 18° towards the southwest. Anodized water has been utilized for cleaning the PV modules twice yearly. The second system was located at One Brighton with a maximum capacity of 10 kWp. It included 40 PV modules, each having a 250 W rating with an orientation towards the south. The PV modules were regularly cleaned via pails of hot soapy water once annually. The results from both plants revealed that weather conditions (i.e., dust, relative humidity, rain, and snow) have a primarily negative effect on a PV panel’s performance. The effect of accumulated dust on the PV panels was lessened by the level of air pollution and the regional weather in Brighton, and was more affected by the bird droppings, which could cause hot spots on the panel resulting in a drop in efficiency. Sulaiman et al. [10] investigated the impact of dust on the performance and peak power of a 50 W PV panel. Clear plastic and two types of artificial dusts were scrutinized with constant solar radiation from a simulator inside the laboratory. The results showed that maximum power and efficiency were reduced by 18% and 50%, respectively, with slight differences in results obtained from mud and talcum. Similarly, Darwish [11] studied PV performance with different types of dust pollutants. A study of the existing literature identified 15 types of dust pollutants, with each having some form of impact on PV system performance. The main pollutant types, which have a significant influence on PV system performance are limestone, ash, and silica. Mehmet et al. [12] discussed only the effect of panel quality and strength on production efficiency (i.e., dust accumulation and water drops were not considered). They focused on studying the negative impact of energy losses in a PV system. The main finding confirmed that the effects of the errors in the energy losses of the PV system resulted in a low and clear energy efficiency of 0.96%. Additionally, solar energy losses represent only 4.26% of all fault energy losses. Thus, energy losses from failures account for 22.34% and 27.58% of net energy efficiency. Table 1 summarizes some previous investigations of the performance of photovoltaic power systems (PVPSs) worldwide.
By studying the related literature, one can note that there exist several environmental factors that have a detrimental impact on a PVPS’ performance, some of which possess positive effects, and others negative effects, on the system output. In addition, it can also be seen that numerous researchers have contributed to studying the environmental factors affecting PV systems, but have negated the combination of all those factors at once, as each study only selected a few of the factors that were mentioned. The environmental factors affecting PVPS performance, as shown in previous investigations, are collected in 
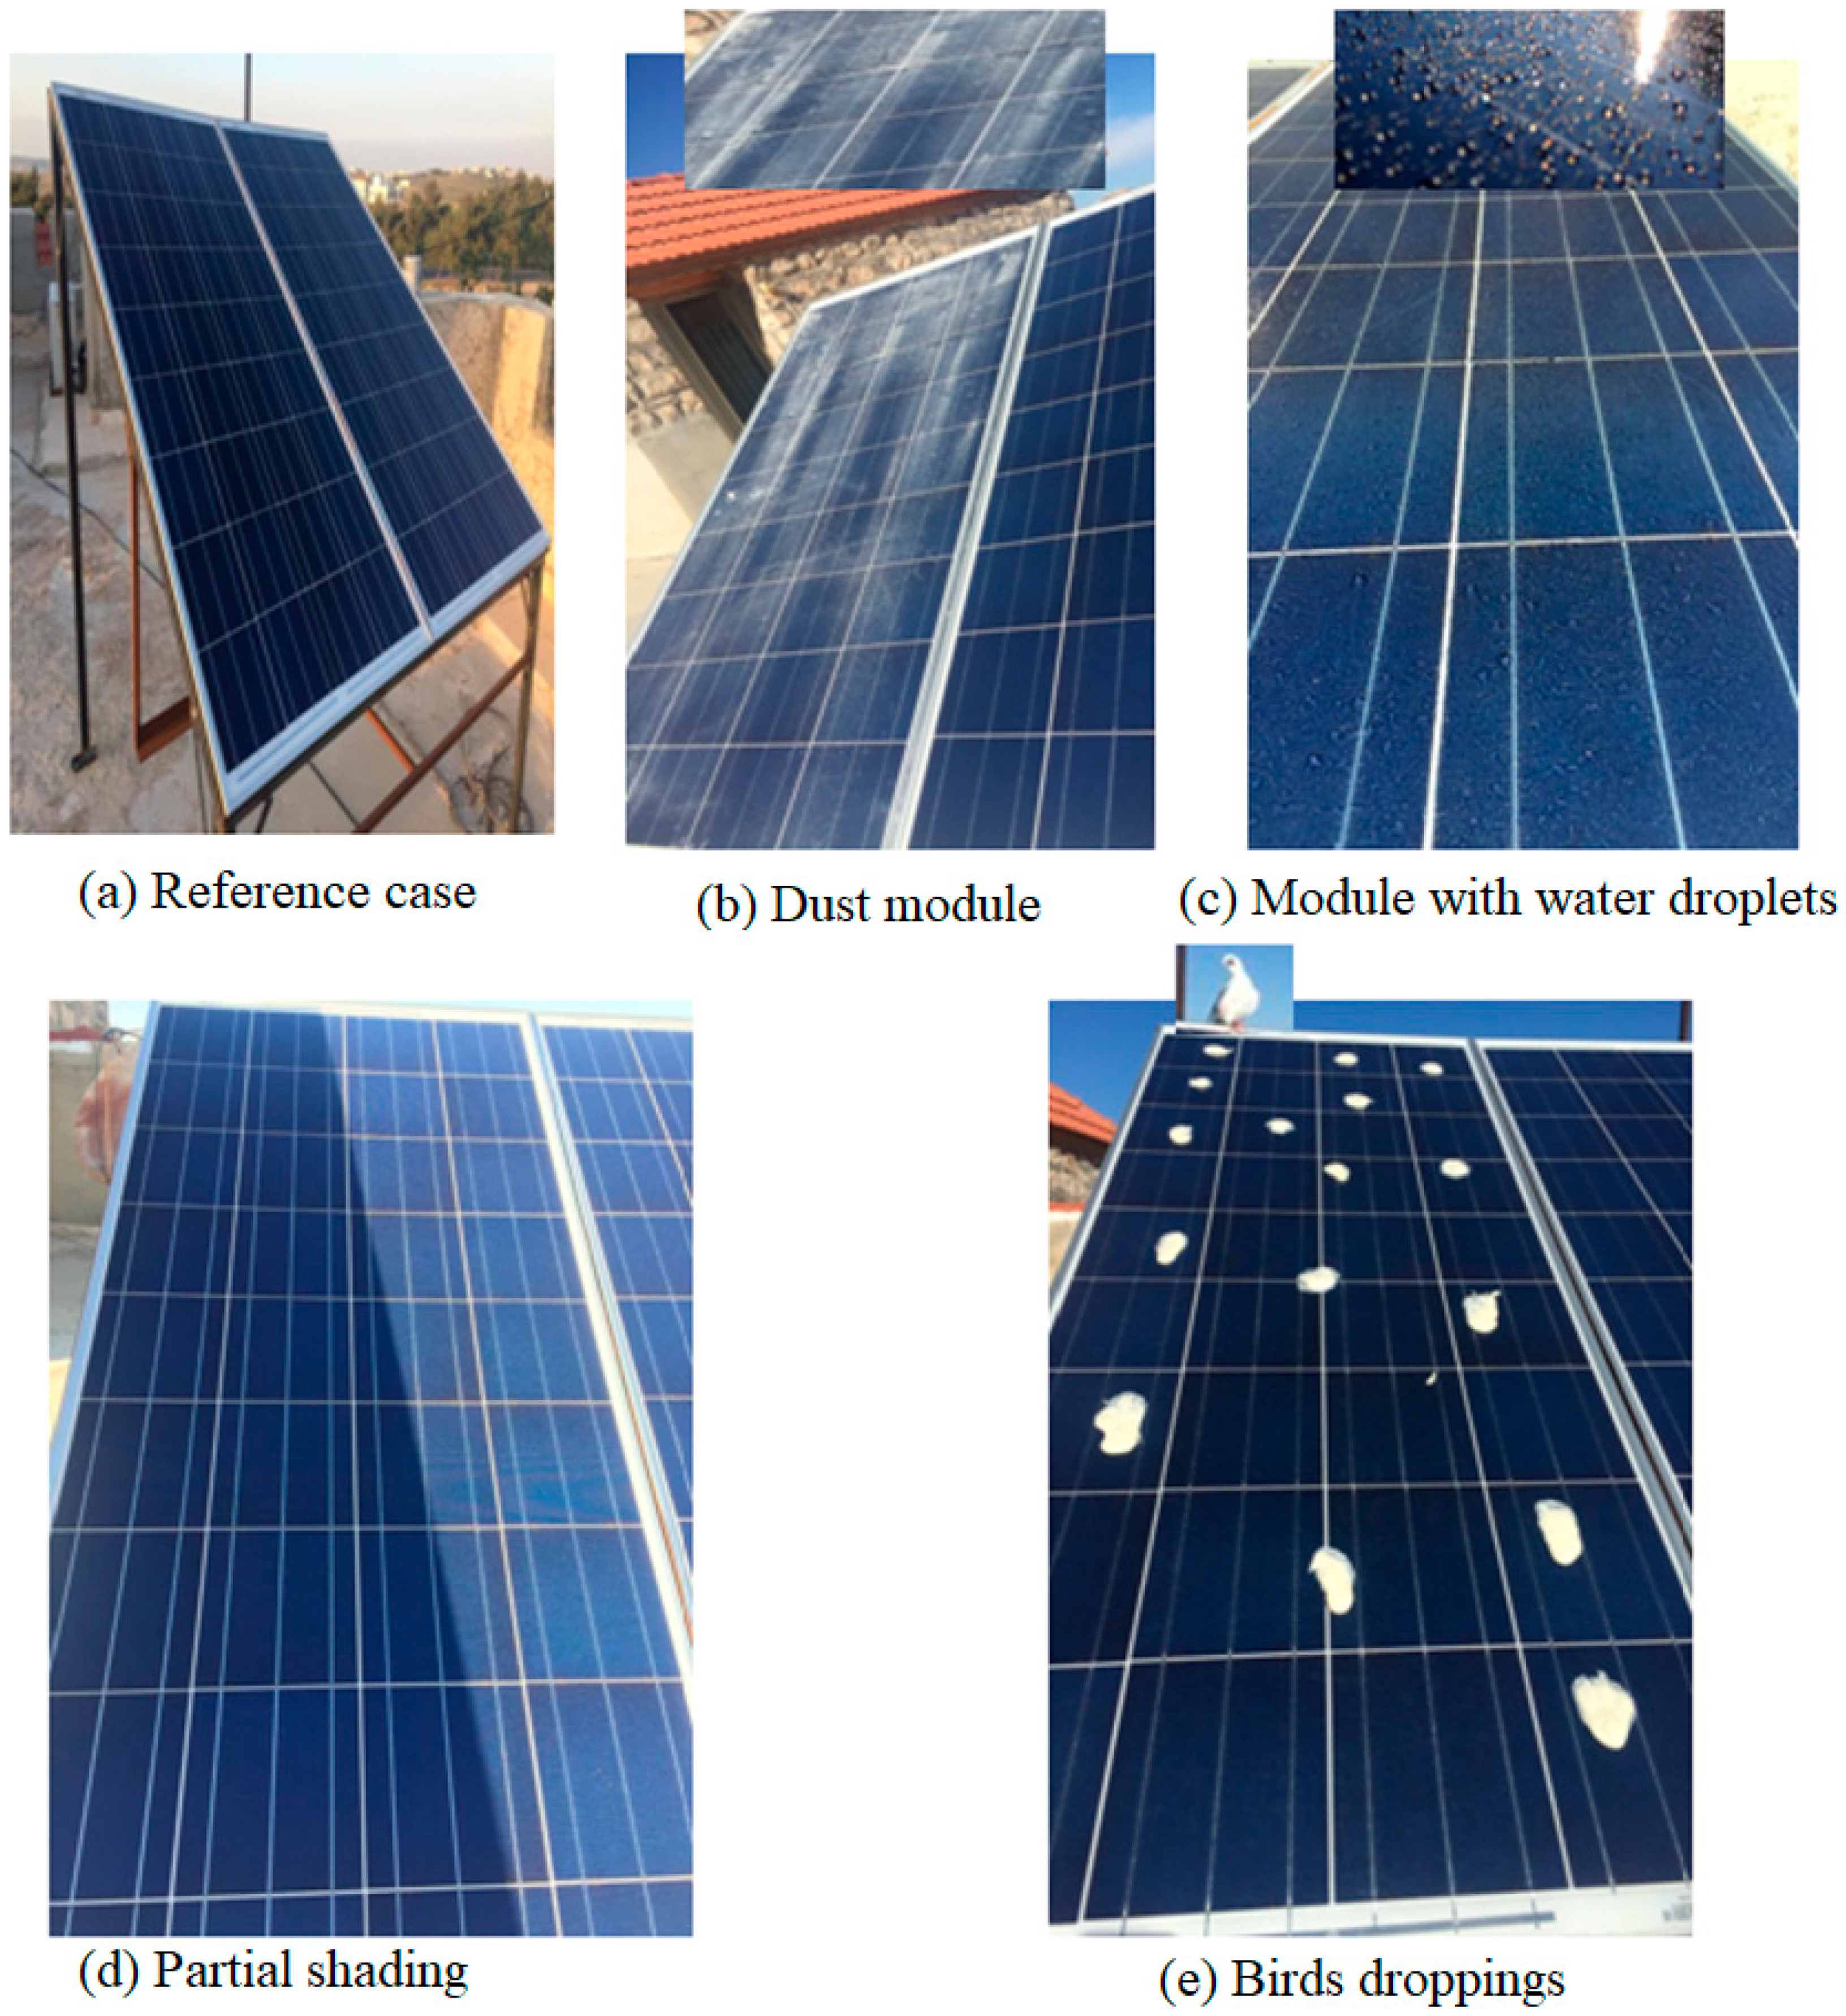
Table 2. This research integrates most of the environmental factors that have a detrimental impact on PVPS performance at once. Therefore, to overcome these deficiencies in the current study, an experimental work has been carried out to examine the impact of various environmental factors on a PV system’s performance. These include the impact of four common factors, such as the accumulation of dust, water droplets, birds’ droppings, and partial shading conditions on the system. This study will show the direct and quantitative effect of each factor on PVPS performance. The results obtained in this work may encourage future research by integrating numerous causal factors into one singular study. This eases the burden and tedious task of having to examine numerous texts, separate studies, and causal factors pertaining to the environmental factors affecting PVPS performance, while offering a more rounded and comprehensive understanding of the numerous factors that impede the system’s overall performance.
The remainder of the paper is organized as follows: the effects on PV system performance are discussed in Section 1. 
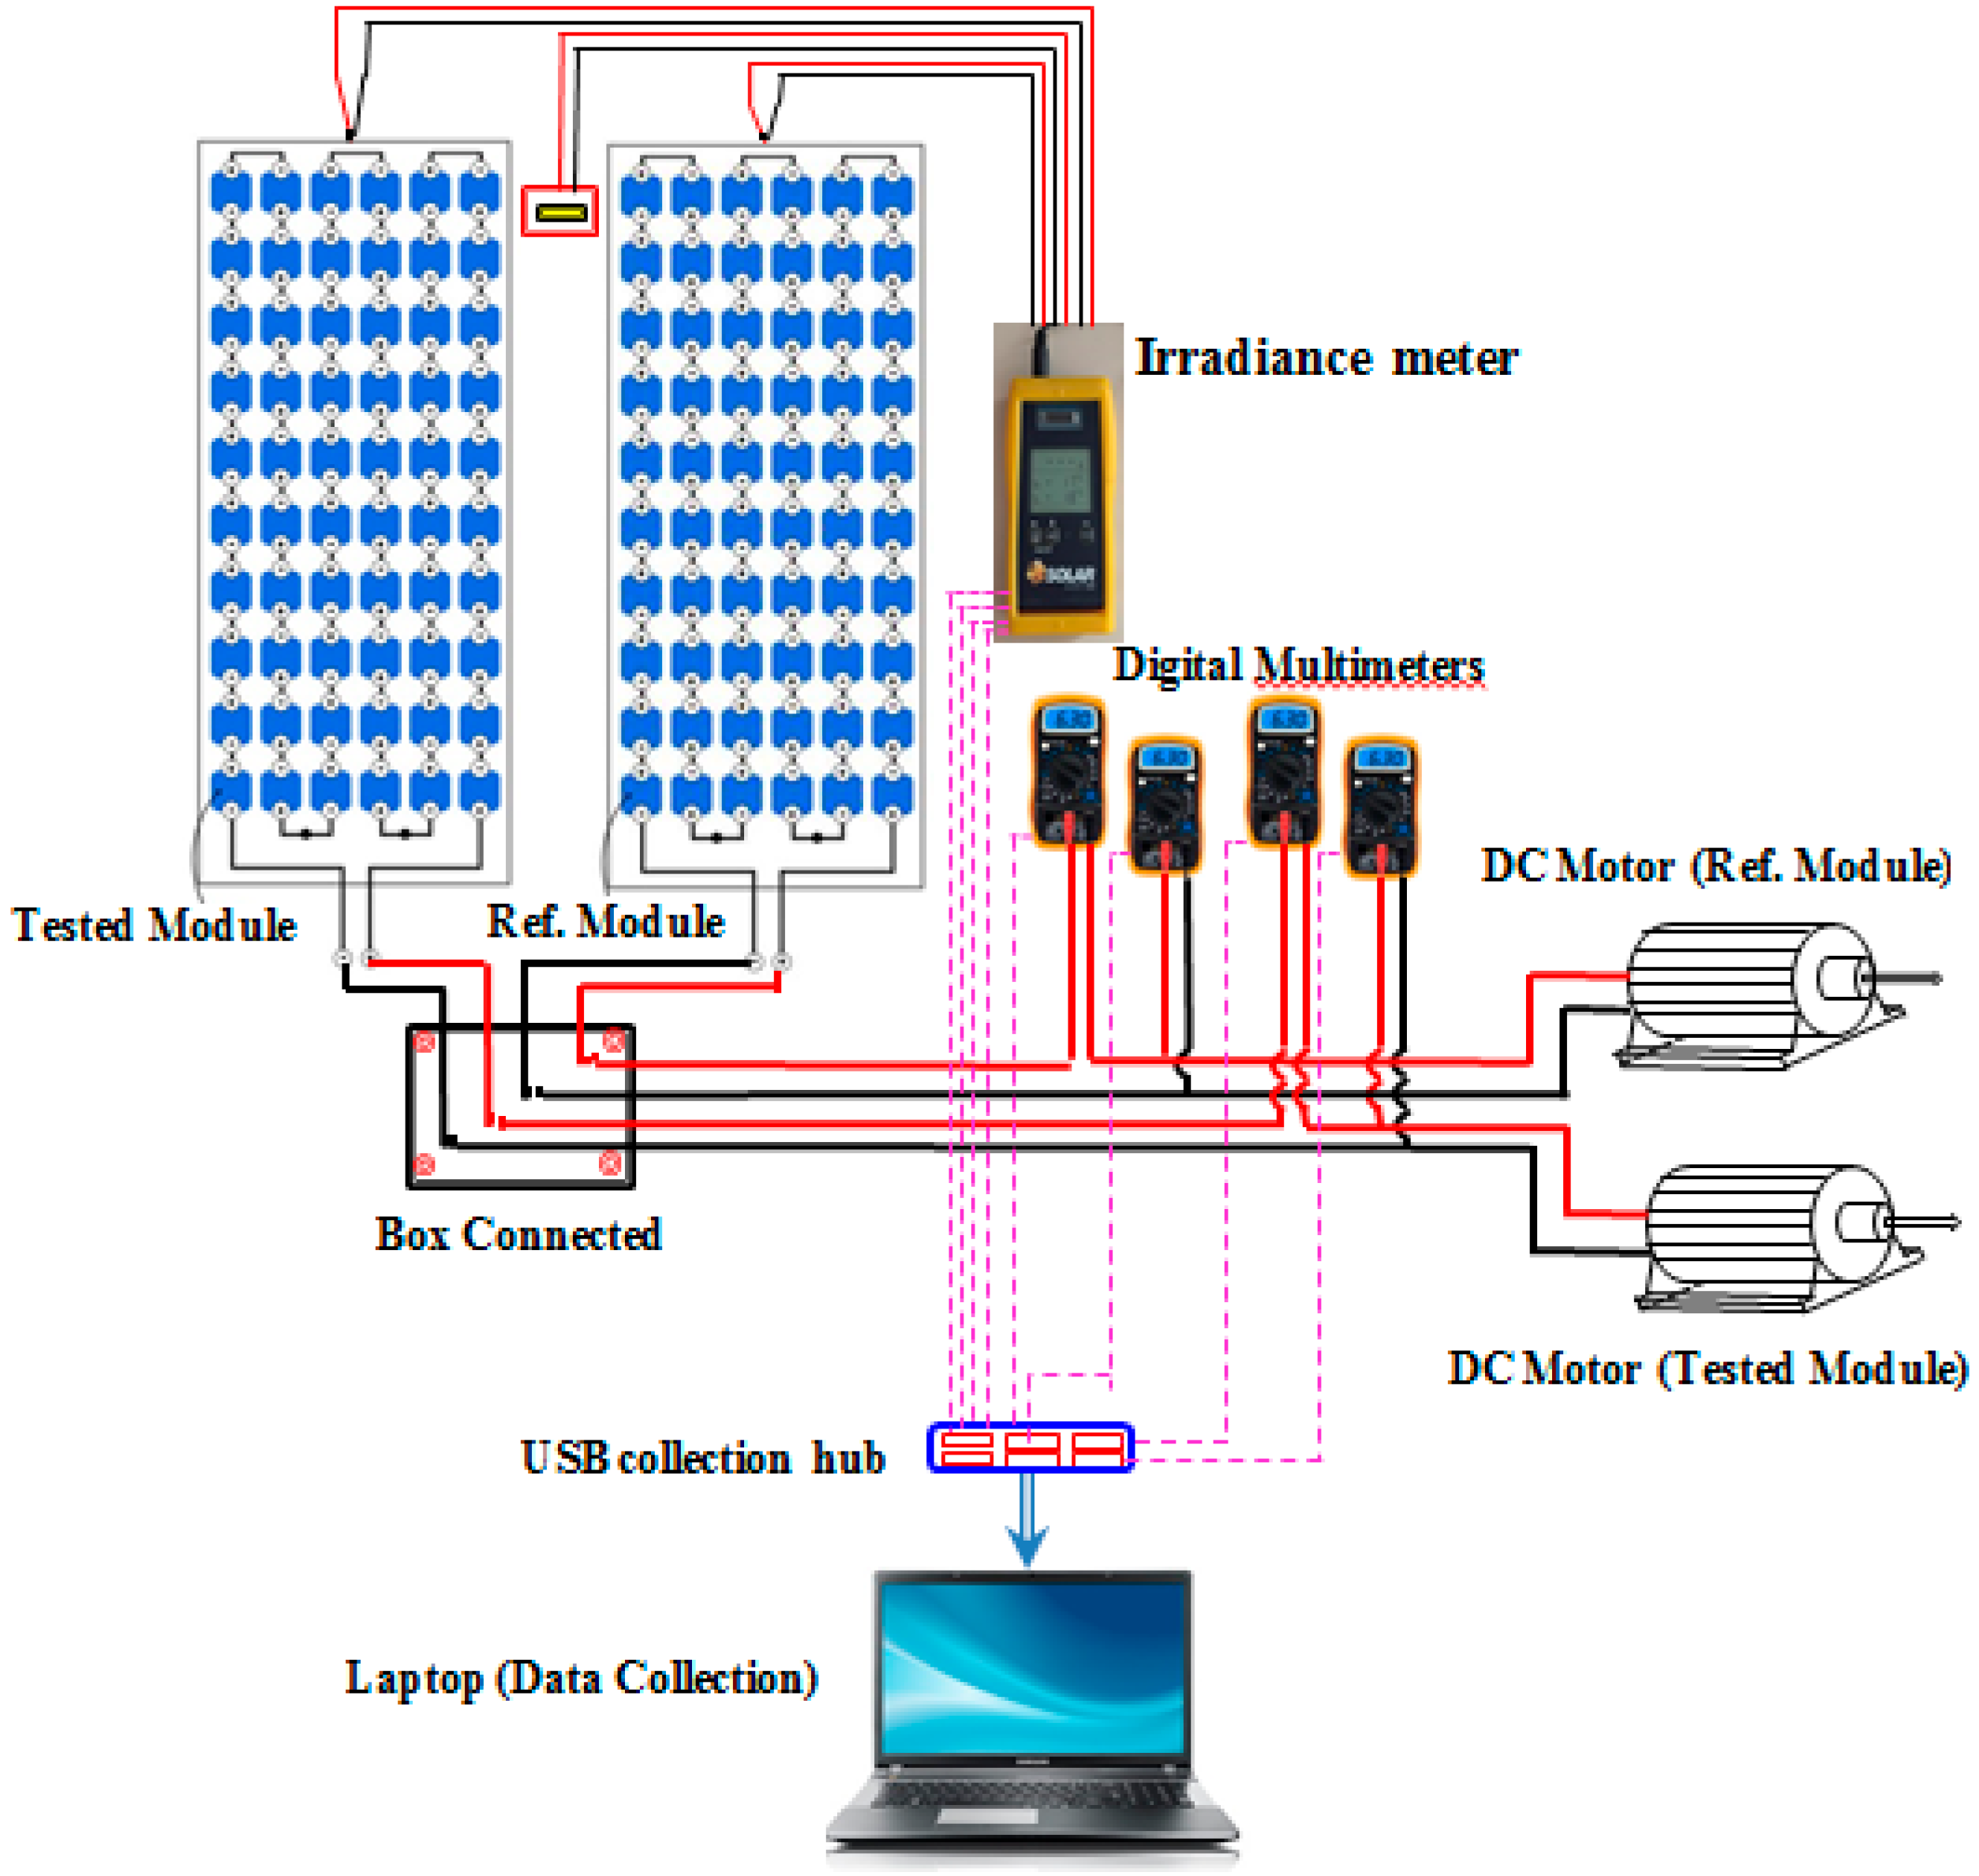
Section 2 describes the system components and the experimental procedure. The obtained results are shown and discussed in Section 3. Finally, Section 4 outlines the main findings.

2. System Description

2.1. PV Module and Load Profile

The experimental setup was situated on the roof of Mutah University’s faculty of engineering. The system comprises of two PV modules (Figure 1), each connected to a similar direct current (DC) motor. The characteristics of the photovoltaic modules that were utilized in experimental work are shown in Table 3. No tracking system has been considered, but the effect of ambient temperature is taken into account. The array slope angle is set to 31°, and the array azimuth is 0° directed towards the south.
This device, comprised of digital multi-meters, has been used for measuring the electrical parameters (current and voltage). The specification of multi-meters that are used in the present study is illustrated in Table A1 in Appendix A. The short circuit current (Isc) and load current (Iload) were monitored through a multi-meter with an accuracy of ±2% of a 20 A reading, and the open circuit voltage (Voc) and load voltage (Vload) were monitored using a multi-meter with an accuracy of ±0.5% of a 200 V reading. The load profile is modeled by a DC motor that converts electrical energy into mechanical energy. The Irradiance meter device (with a daily uncertainty <3%) was positioned beside the modules and under the same inclination in order to measure the effective irradiance and the ambient temperature (effective irradiance involves the global solar irradiance and the albedo/reflection fraction from the roofing system). The specification of solar the irradiance meter is illustrated in Table A2 in Appendix A. The infrared thermometer’s optical device is employed for measuring PV panel surface temperature; the electronic components convert information into a temperature reading, which is displayed on the display screen, with an accuracy of ±2 °C or 2%. The wind velocity and ambient temperature are measured by thermo anemometer with an accuracy of 3% (± 0.2·ms−1).

2.2. Solar Radiation

In the Jordanian southern province of Al Karak, the annual average global solar irradiation is about 5.9 kWh/m2/day, receiving 2600–3500 sunshine hours per year. The site under investigation is located at 31°9’49.25” N latitude and 35°45’43.34” E longitude. Figure 2 displays the solar irradiance, per year, of the site under study. It has been observed that the average solar irradiance changed from 3.36 kW/m2/day (December) to 7.89 kWh/m2/day (June) with a scaled annual average of 5.16 kW/m2/day. The annual average ambient temperature and clearness index was 24.5 °C and 0.57, respectively.

2.3. Experimental Procedure

This research was carried out from November to February. The readings were obtained in sequential days. Data collection during this period was difficult due to the winter seasonal period, in which rainfall and gray cloud obstruct clear skies. Two Polycrystalline PV modules were utilized in this study. Both were installed on an iron stand. One of the PV sets was used as a reference PV (RPV), possessing a clear surface with no obstructing factors on it, while the other, tested PV (TPV), was affected on its surface by the four environmentally induced factors discussed throughout this paper. These are dust accumulation, water drops, partial shading, and birds’ droppings (or fouling).
The amount of change in PV power output due to environmental effects was calculated from the measured electrical parameters of each module. The measurements of the temperatures, wind speed, humidity, and irradiance are presented. Figure 3 displays real pictures of the system under consideration with the various environmental conditions.

3. Results and Analysis

The results of two PV modules, for an average value of three weeks, are presented in order to study the environmental impacts on the efficiency of the PV system and to determine how these affect the power output.

3.1. Dust Accumulation

Two polycrystalline PV modules were tested for outdoor conditions for several weeks, and power output was monitored daily, every two hours. One of these modules (RPV) was cleaned before the results were collected, and the other (TPV) was exposed to dust accumulation conditions.
The daily PV module power output, short circuit current, and open circuit voltage for each PV module under investigation are illustrated in Figure 4.
This figure shows the difference in the load power output. The dust accumulated on the TPV module covers and blocks the solar irradiance reaching the panel surface, and this had influenced the TPVda current and power output. Therefore, the power output from the RPV is more than the TPVda that was affected by dust.
The reduction in power and efficiency of PV modules can be estimated as follows:
R e d u c t i o n   i n   p o w e r = P R P V     P T P V d a P R P V × 100 % ,
R e d u c t i o n   i n   e f f i c i e n c y = η R P V     η T P V da η R P V × 100 %
The power output for RPV at 11:30 is 136.1 W, while the output power for TPVda at the same time is 119.12 W; consequently, the reduction in output power is 12.47%. The calculated RPV efficiency is equal to 13.86%, and the efficiency of TPV is equal to 11.7%. Accordingly, the reduction in efficiency is equal to 11.86%. The results suggest that these reductions in power and efficiency were caused by decreasing the short circuit current of the PV module with dust accumulation; it seems that the dust particles disperse the sun rays falling on the PV module surface, thereby reducing the amount of power output. However, a larger reduction in efficiency was obtained by Mejia et al. [36] during 108 days in the summer season. During this period, efficiency decreased from 7.2% to 5.6% as a result of the accumulated dust on the PV module. However, during rainy events, the recovery of an efficiency loss of up to 7.1% was obtained. Higher reductions in PV module power production and efficiency of 92.11% and 89.0%, respectively, were obtained for accumulated dust [37]. Awwad et al. [38] illustrated that dust negatively affected the performance of PV systems in Jordan by reducing the power output of the PV modules. This is particularly detrimental in regions such as the Middle East, which receive year-round dusty atmospheric conditions. Therefore, further research and innovation for new and economically cost-effective cleaning technology is required.

3.2. Water Drops

Temperature is a significant determinant impacting the speed of electrical flows through any given electrical circuit. Consequently, engineers have sought to devise ways for improving PV system efficiency and their performance efficiency under non-optimal temperature conditions, e.g., devising cooling systems that utilize outside air and water. The daily power output, short circuit current, and open circuit voltage of each studied module exposed to water drops are illustrated in Figure 5. The figure shows the difference in power output between the RPV and TPVwd that is affected by water droplets.
From Figure 5, it is evident that the power output for the TPVwd is higher than that of the RPV (dry). The power output for RPV at 11:30 is equal to 130.2 W, and for TPVwd at the same time, power output is 137.9 W. The percentage of power improvement is 5.6%. The water droplets decrease the temperature of the PV module, which in turn increases the potential difference, thus improving the power output. In order to describe the impact of the temperature upon the efficiency of the PV module, the temperature coefficient is defined. For polycrystalline solar cell, when decreasing temperature by one degree Celsius, the corresponding voltage should be increased by 0.33%. Therefore, the temperature coefficient is 0.33%/°C. The output voltage of a PV module can be estimated at a certain temperature as follows:
V o c , a m b .   =   T e m p . c o e f f . × [ ( T S T C T a m b . ) ] + V o c , S T C
where Voc,amb denotes the open circuit voltage at ambient temperature Tamb, and Voc,STC and TSTC are the open circuit voltage and temperature at STC. Then, if V o c , a m b .   =   0.33 × ( 25 T a m b . ) + 22.06 , the relationship shows that, for low ambient temperature, a high voltage would be obtained. Running water onto the module’s surface has two benefits: cooling and cleaning the PV module in hot and dusty regions. The cooling rate for solar cells is 2 °C/min based on the concerned operating conditions [20]. The obtained results confirm that the efficiency of RPV is enhanced. This is because water falling onto the module’s surface has resulted in decreasing the surface temperature of the module; hence, the power output has increased. Accordingly, the overall efficiency of the module is enhanced, especially during summer and clear sky days. Therefore, it can be concluded that water sprinkling cooling systems provide an optimum solution for ensuring energy efficiency. However, the latter’s economic viability is dubious.

3.3. Partial Shading

Shading tends to be detrimental upon the performance of photovoltaic modules [39,40]. The cause of this owes to what is commonly referred to as ‘string design’, whereby one shaded module within the system or ‘string’ underperforms. This causes all modules within this ‘string’ to underperform, creating an interdependent dynamic similar to a domino effect [41]. Partial shading condition (PSC)has been considered one of the most considerable sources of loss in a photovoltaic plant. Several solutions can be adapted to overcome this problem, such as using an inverter integrated with global MPPT or using an inverter for each panel. The optimum solution is to avoid PSC wherever possible [41]. The impact of PSC on photovoltaic module performance depends on some parameters. Such parameters include the reduction level of solar irradiance, the distribution of shadows above panel surfaces, the presence of bypass diodes, and the configuration of the panels in the array. In this work, the experimental study determined the effect of quarter, half, and three quarters shading of the PV short-circuit current, open circuit voltage, and power output of the TPVPSC panel, as shown in Figure 6 and Figure 7.
Figure 6 shows that the PV short-circuit current for quarter, half, and three quarters shading decreases by 19.1% and 42.5%, unlike that of the RPV short-circuit current. The highest reduction in current occurred at three quarters shading, reaching values of 66.5%. The obtained results for the open PV circuit voltage have been shown to decrease when increasing the shading area. The value without any shaded effect (RPV) at 11:30 is 21.7 V, however, when the PV module was shaded in a sequence of a quarter, half, and three quarters of the surface area, the open circuit voltage decreased by 3.2%, 16.6%, and 25.3%, respectively. The corresponding PV power output, studied under various PSC patterns, is illustrated in Figure 7.
As shown in Figure 7, the power output reduced dramatically with the increase in the shading above the surface of the PV panel. For a quarter, half, and three quarters of shading, the amount of power reduction falls at 33.7%, 45.1%, and 92.6%, respectively. A reduction in the power output of approximately 30%, in the case of a 50% shaded area, was obtained by Hanitsch et al. [42], though it was only for one cell. This shows that a small shaded area can result in a dramatic loss of power.

3.4. Birds Droppings

Dirt, such as polluted rain water and birds’ droppings, for instance, may result in decreasing the performance of solar panels by reducing the transmittance of the glass cover on the PV panels. According to the national renewable energy (NREL) and individual retailer and dealer statistics, losses in the range 25–30% were reported by [43]. The effects of the birds’ droppings (fouling) on the power output of the PV module were also investigated. The obtained result, as depicted in Figure 8, suggests that bird droppings may be considered a form of ‘shading,’ which prevents sunrays from reaching the PV cells.
As seen in Figure 8, the reduction in the power output at 11:30 is equal to 7.4%. This illustrates that the droppings affected the efficiency of PV modules. This also indicates that these droppings have a small effect on the efficiency of the PV cell module in comparison to the much higher percentages obtained in NREL [43].

4. Data Uncertainty

The uncertainties of the experimental results from measuring errors in the electric power output are calculated according to the method ascribed by Kline and McClintock [44]. Such a technique is based on the careful specifications of the uncertainties in various primary experimental measurements and a consideration of the following equation:
δ R   =   [ j   =   1 M ( R X j δ X j ) 2 ] 1 2 ,
where j, M, δ R , and δ X j denote the specific parameter counter, the number of the independent variables, the uncertainties associated with the dependent (R) variable, and the uncertainties associated with the independent (Xj) variable, respectively.
The electric power is calculated as:
P   =   I × V ,
where V and I are measured as V = 16.7 V ± 0.5% and I = 7.04 A ± 2%. The nominal value of the power is equal to 117,568 W. The uncertainty in this value is calculated by applying Equation (4).
δ P   =   [ ( P V × δ V ) 2 + ( P I × δ I ) 2 ] 1 / 2
The uncertainty value for electric power output is found to be 2.423 W or 2.06%. This value is adequately acceptable as it lies within the standard limits.

5. Conclusions

The environmental impacts on the performance of solar photovoltaic systems are experimentally investigated. For the first time, four specific experiments under each subsequent category were carried out in one singular study. These categories of investigation included: dust accumulation, water drops, shading effects, and bird droppings (fouling). Each was developed and tested. The results obtained for the two PV modules show that dust accumulation reduces the power output by 8.80% and the efficiency by 11.86%. As such, solar cells should be cleaned regularly (once a week at a minimum and particularly in seasonal equinox) in accordance with the severity of the weather conditions of its applied geographical locale.
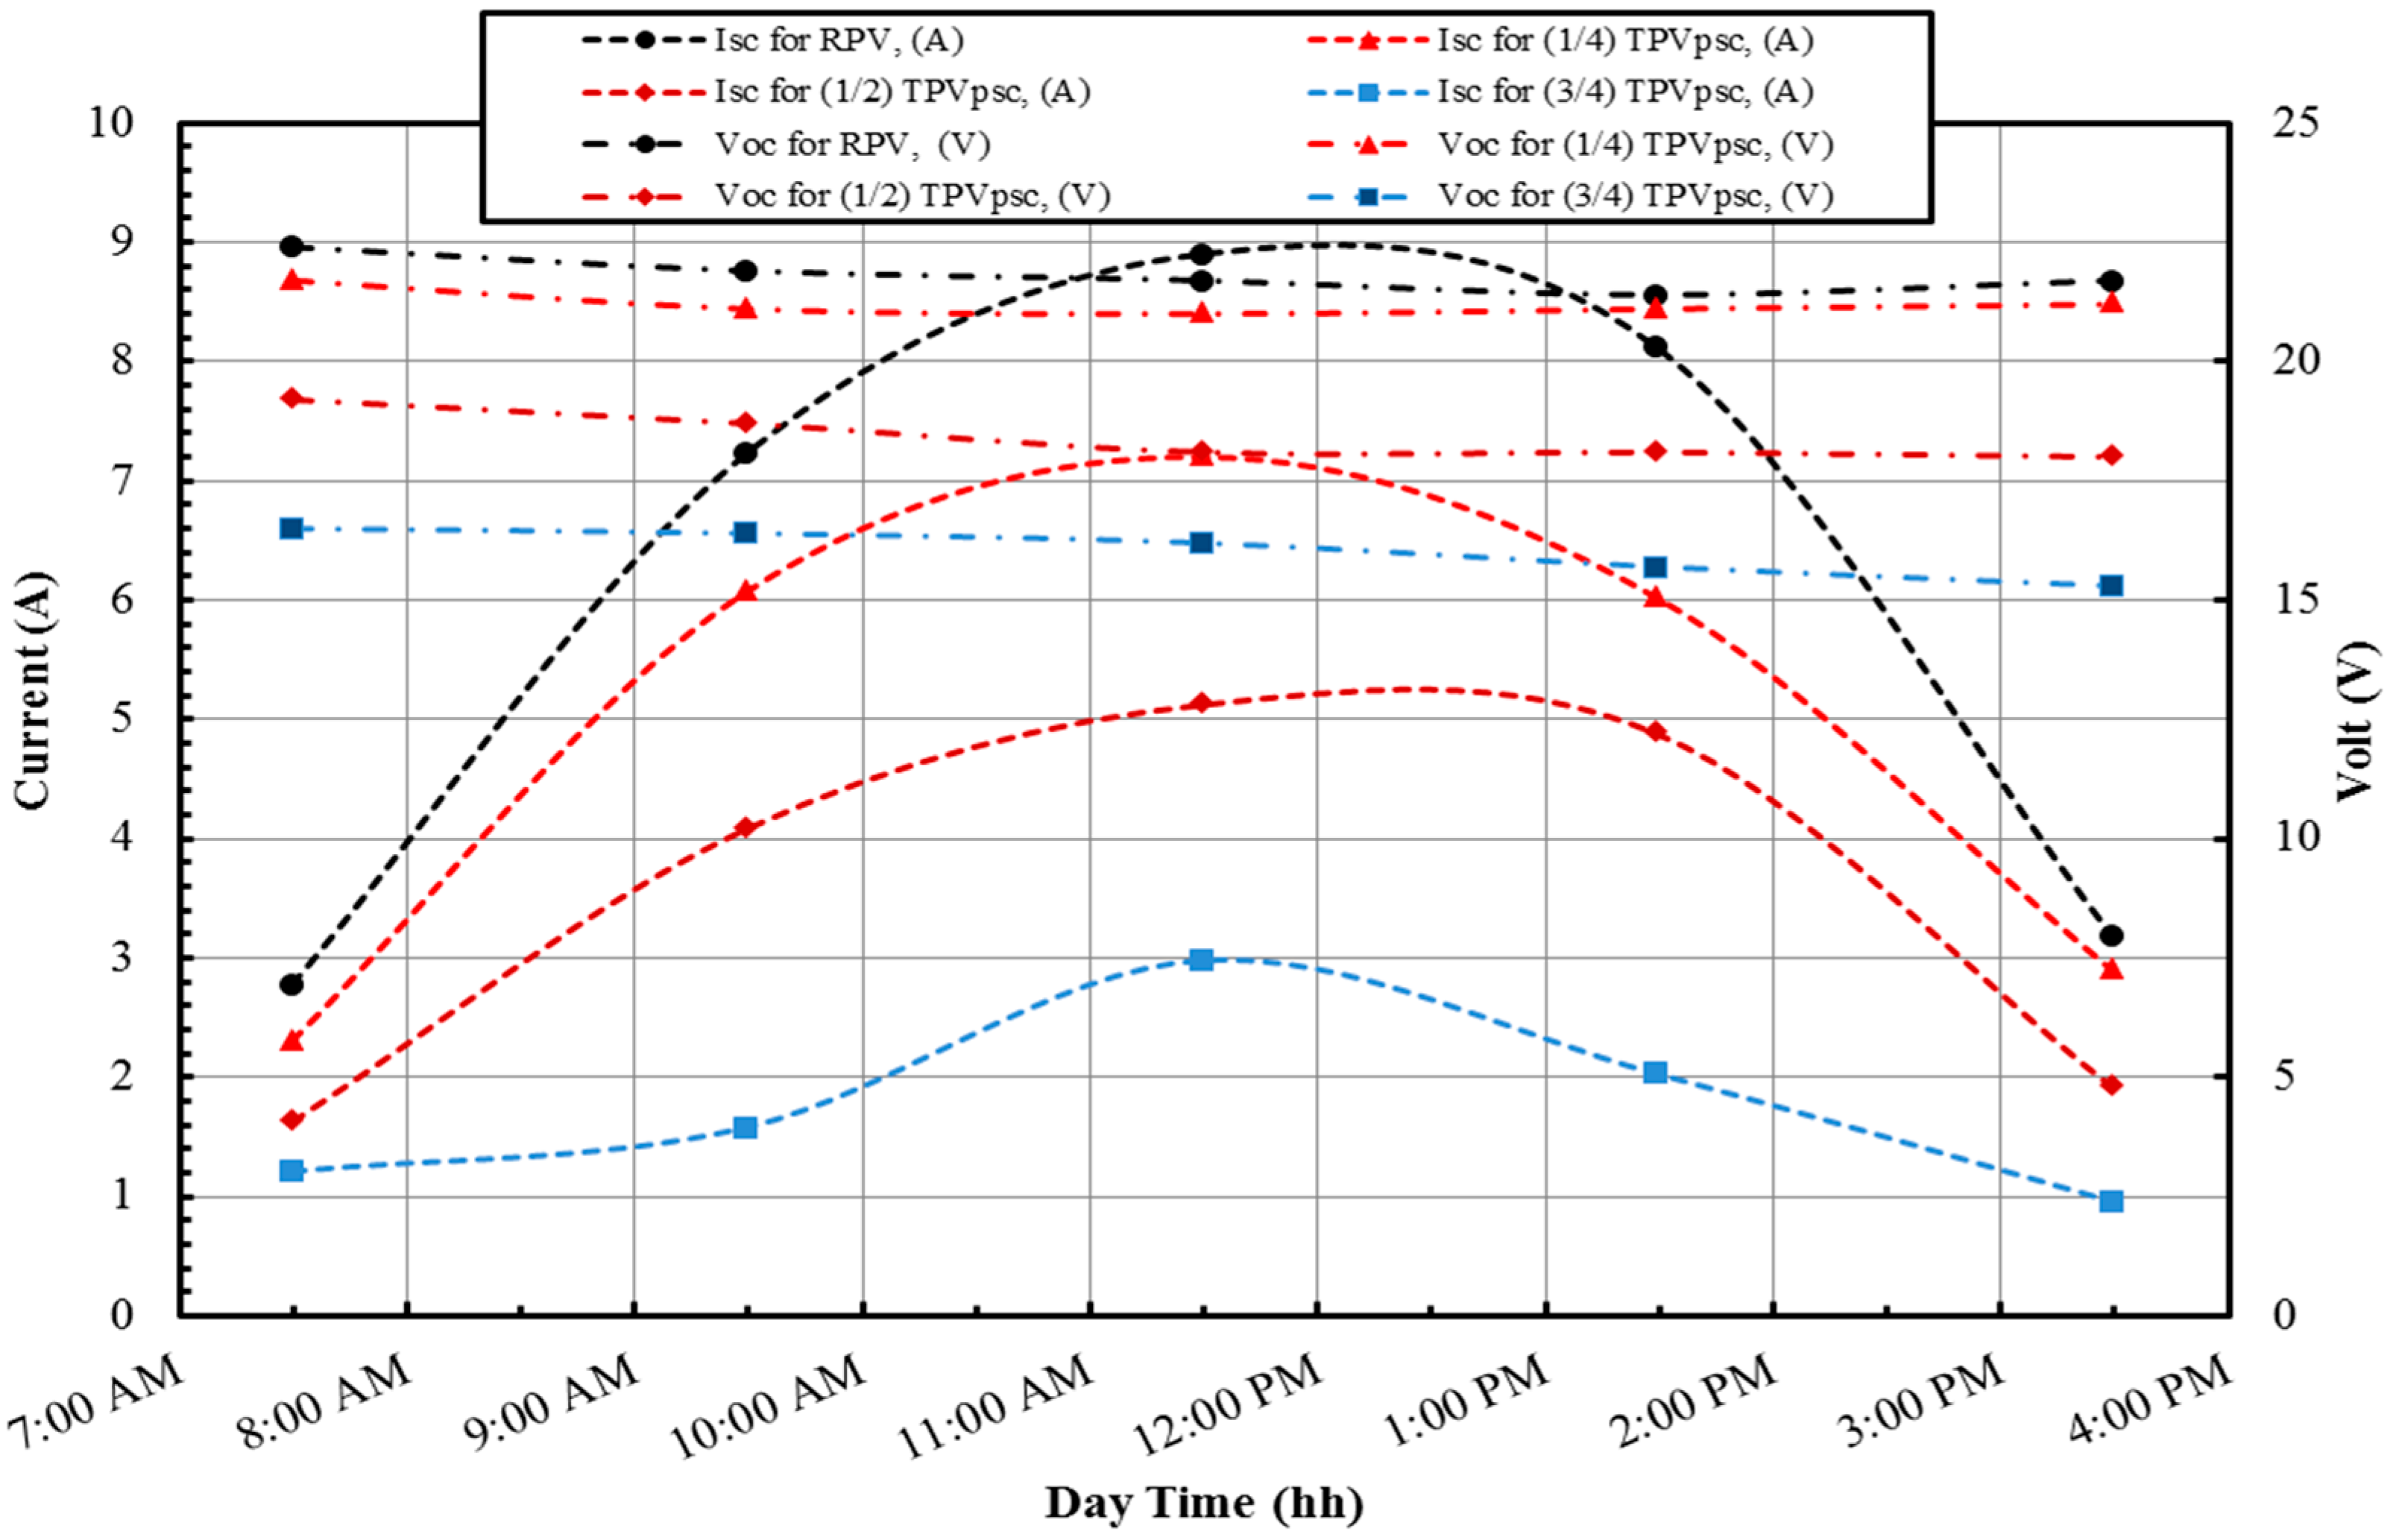
The harvested energy from the partially shaded PV system is much lower than that assumed from the mean solar irradiance, and the percentage of reduction increased by decreasing the area of PV modules that receive sunlight. The results show that the highest reductions occurred in the case of the three quarters shaded area, and the reductions in the short circuit current, open circuit voltage, and power output were 66.5%, 25.3%, and 92.6%, sequentially. The implication of this is that the PV system must be placed and installed in appropriate locations for maximum efficiency and avoiding shading conditions.
Results of tests on the impact of water droplets on a PV panel indicate an improvement in the power output of the PV module exposed to water droplets of at least 5.9%. Water droplets seem to decrease the temperature of the front and back surfaces of the PV panels (i.e., they seem to have a cooling effect) while increasing the PV voltage. It is also apparent that using water as a coolant on the PV panel surfaces can be an effective cooling process for such surfaces, and hence generate more energy, particularly on sunny days, when the sun is at more of a direct angle above the solar panels.
The PV module that was covered by bird droppings was found to reduce the output power of the PV system by about 7.4%. Therefore, the results suggest that the reduction in the power output of the PV modules depends on the quantity of bird droppings. Consequently, the importance of periodically cleaning the solar cells should not be overlooked when trying to attain a desired efficiency of a PV module system. The uncertainty value for the electric power output of the PV system is found to be 2.423 W or 2.06%, and this value is adequately acceptable as it lies within the standard limits.

Author Contributions

Conceptualization, R.J.M. and M.R.G.; methodology, M.R.G. and H.R.; software, M.A.-D. and H.R.; validation, R.J.M. and M.R.G.; formal analysis, R.J.M., M.R.G. and H.R.; investigation, M.R.G. and H.R.; resources, R.J.M., M.R.G., and M.A.-D.; data curation, R.J.M., M.R.G.; writing—original draft preparation, R.J.M., M.R.G., M.A.-D., and H.R.; writing—review and editing, R.J.M., M.R.G., M.A.-D., and H.R. All authors have read and agreed to the published version of the manuscript.

Funding

This research received no external funding.

Conflicts of Interest

The authors declare no conflict of interest.

Nomenclature

SymbolDescription
ILoadThe load current (A)
ImpCurrent at the maximum power point (A)
IscShort circuit current (A)
Isc,stcThe short circuit current of the PV module under the standard solar irradiance (A)
PLoadThe load power (W)
PmpMaximum PV power (W)
PmppPower at maximum power point (W)
TambAmbient temperature (°C)
TrefReference temperature (°C)
TstcTemperature at standard test conditions, 25 °C
VocOpen circuit voltage (V)
Voc, ambOpen circuit voltage at the ambient temperature (V)
Voc, STCOpen circuit voltage at standard testing conditions (V)

Abbreviations

AMAir Mass
ACAlternative Current
A-SiAmorphous Silicon
CdTeCadmiums Telluride
CIGSCopper Indium Gallium Selenide
m-SiMono-Crystalline Silicon
MPPMaximum Power Point.
NRELNational Renewable Energy Laboratory
OPVOrganic Photovoltaic
p-SiPolycrystalline or Multi-Crystalline Silicon
PVPhotovoltaic
PVPSPhotovoltaic Power System
PSCPartial Shading Condition
RPVReference Photovoltaic
STCStandard Test Conditions (25 °C, 1.5 AM, and 1000 W/m2 solar irradiance)
TPVTested Photovoltaic

Subscript/Superscript

AmbAmbient
bdBird droplets
daDust accumulation
seShading effect
WdWater droplets

Appendix A. Measurement Device Specifications

Table A1. Specification of multimeter with storage data (Intelligent Digital Multimeter).
SpecificationsRangeBest Accuracy
Model UT71B
DC Voltage (V)200 mV/2 V/20 V/200 V/1000 V±(0.05% + 5)
AC Voltage (V)2 V/20 V/200 V/1000 V±(0.6% + 40)
DC Current (A)200 μA/2000 μA/20 mA/200 mA/10 A±(0.15% + 20)
AC Current (A)200 μA/2000 μA/20 mA/200 mA/10 A±(0.8% + 15)
Resistance (Ω)200 Ω/2 kΩ/20 kΩ/200 kΩ/2 MΩ/20 MΩ±(0.4% + 20)
Capacitance (F)20 nF/200 nF/2 μF/20 μF/200 μF/2 mF/20 mF±(1.2% + 20)
Frequency (Hz)20 Hz–200 MHz±(0.1% + 15)
Temperature (°C)−40 °C~1000 °C±(1% + 30)
Temperature (°F)−40 °F~1832 °F±(1.5% + 50)
General Characteristics
Display Count20000
Auto power offyes
Data holdyes
Data storageyes (100 to feature 300)
USB interfaceyes
Power9 V Battery (6F22)
Standard accessoriesBattery, Test lead, USB interface cable, PC software CD, point contact temperature probe (option)
Table A2. Solar Irradiance Meter specifications.
ItemInformationItemSpecification
Item #39N146Irradiance Range50–1200 W/m2
BrandSEAWARDAmbient Temp. Range0 to 60 °C
Mfr. Model #SS200RModule Temp. Range0 to 70 °C
Country of OriginUnited KingdomCompass Bearing Range0 to 360°
Power SourceBatteryInclinometer Range0 to 90°
Power OffYesData LoggingYes
Display LCDAutoInterfaceUSB

References

  1. Renewables 2019 Global Status Report. 2019. Available online: http://www.ren21.net/status-of-renewables/global-status-report/ (accessed on 15 May 2019).
  2. Ayompe, L.; Duffy, A.; McCormack, S.; Conlon, M. Validated real-time energy models for small-scale grid-connected PV-systems. Energy 2010, 35, 4086–4091. [Google Scholar] [CrossRef] [Green Version]
  3. Boyle, L.; Flinchpaugh, H.; Hannigan, M.P. Natural soiling of photovoltaic cover plates and the impact on transmission. Renew. Energy 2015, 77, 166–173. [Google Scholar] [CrossRef]
  4. Hegazy, A.A. Effect of dust accumulation on solar transmittance through glass covers of plate-type collectors. Renew. Energy 2001, 22, 525–540. [Google Scholar] [CrossRef]
  5. Gholami, A.; Khazaee, I.; Eslami, S.; Zandi, M.; Akrami, E. Experimental investigation of dust deposition effects on photo-voltaic output performance. Sol. Energy 2018, 159, 346–352. [Google Scholar] [CrossRef]
  6. Hao, L.; Wenjun, Z. Effects of particle sizes and tilt angles on dust deposition characteristics of a ground-mounted solar photovoltaic system. Appl. Energy 2018, 220, 514–526. [Google Scholar]
  7. Conceiçao, R.; Silva, H.G.; Fialho, L.; Lopes, F.M.; Collares-Pereira, M. PV system design with the effect of soiling on the optimum tilt angle. Renew. Energy 2019, 133, 787–796. [Google Scholar] [CrossRef]
  8. Kaldellis, J.; Kapsali, M. Simulating the dust effect on the energy performance of photovoltaic generators based on experimental measurements. Energy 2011, 36, 5154–5161. [Google Scholar] [CrossRef]
  9. Ghazi, S.; Ip, K. The effect of weather conditions on the efficiency of PV panels in the southeast of UK. Renew. Energy 2014, 69, 50–59. [Google Scholar] [CrossRef]
  10. Sulaiman, S.A.; Hussain, H.H.; Leh, N.; Razali, M.S. Effects of dust on the performance of PV panels. World Acad. Sci. Eng. Technol. 2011, 58, 588–593. [Google Scholar]
  11. Darwish, Z.A.; Kazem, H.A.; Sopian, K.; Al-Goul, M.; Alawadhi, H. Effect of dust pollutant type on photovoltaic performance. Renew. Sustain. Energy Rev. 2015, 41, 735–744. [Google Scholar] [CrossRef]
  12. Tur, M.R.; Colak, İ.; Bayindir, R. Effect of faults in solar panels on production rate and efficiency. In Proceedings of the 2018 International Conference on Smart Grid (icSmartGrid), IEEE Xplore, Nagasaki, Japan, 4–6 December 2018. [Google Scholar] [CrossRef]
  13. Vasisht, M.S.; Srinivasan, J.; Ramasesha, S.K. Performance of solar photovoltaic installations: Effect of seasonal variations. Sol. Energy 2016, 131, 39–46. [Google Scholar] [CrossRef] [Green Version]
  14. Saber, E.M.; Lee, S.E.; Manthapuri, S.; Yi, W.; Deb, C. PV (photovoltaics) performance evaluation and simulation-based energy yield prediction for tropical buildings. Energy 2014, 71, 588–595. [Google Scholar] [CrossRef]
  15. Zitouni, H.; Merrouni, A.A.; Regragui, M.; Bouaichi, A.; Hajjaj, C.; Ghennioui, A.; Ikken, B. Experimental investigation of the soiling effect on the performance of monocrystalline photovoltaic systems. Energy Procedia 2019, 157, 1011–1021. [Google Scholar] [CrossRef]
  16. Javed, W.; Wubulikasimu, Y.; Figgis, B.; Guo, B. Characterization of dust accumulated on photovoltaic panels in Doha, Qatar. Sol. Energy 2017, 142, 123–135. [Google Scholar] [CrossRef]
  17. Abderrezek, M.; Fathi, M. Experimental study of the dust effect on photovoltaic panels’ energy yield. Sol. Energy 2017, 142, 308–320. [Google Scholar] [CrossRef]
  18. Walwil, H.M.; Mukhaimer, A.; Al-Sulaiman, F.; Said, S.A. Comparative studies of encapsulation and glass surface modification impacts on PV performance in a desert climate. Sol. Energy 2017, 142, 288–298. [Google Scholar] [CrossRef]
  19. Darwish, Z.A.; Kazem, H.A.; Sopian, K.; Alghoul, M.; Alawadhi, H. Experimental investigation of dust pollutants and the impact of environmental parameters on PV performance: An experimental study. Environ. Dev. Sustain. 2018, 20, 155–174. [Google Scholar] [CrossRef]
  20. Moharram, K.; Abd-Elhady, M.; Kandil, H.; El-Sherif, H. Influence of cleaning using water and surfactants on the performance of photovoltaic panels. Energy Convers. Manag. 2013, 68, 266–272. [Google Scholar] [CrossRef]
  21. Perers, B.; Furbo, S.; Han, J.; Kong, W.; Stergiakis, S. Long term testing and evaluation of PV modules with and without Sunarc antireflective coating of the cover glass. Energy Procedia 2015, 70, 311–317. [Google Scholar] [CrossRef] [Green Version]
  22. Yerli, B.; Kaymak, M.K.; İzgi, E.; Öztopal, A.; Şahin, A.D. Effect of derating factors on photovoltaics under climatic conditions of Istanbul. World Acad. Sci. Eng. Technol. 2010, 44, 1400–1404. [Google Scholar]
  23. Alquthami, T.; Menoufi, K. Soiling of photovoltaic modules: Comparing between two distinct locations within the framework of developing the photovoltaic soiling index (PVSI). Sustainability 2019, 11, 4697. [Google Scholar] [CrossRef] [Green Version]
  24. Fountoukis, C.; Figgis, B.; Ackermann, L.; Ayoub, M.A. Effects of atmospheric dust deposition on solar PV energy production in a desert environment. Sol. Energy 2018, 164, 94–100. [Google Scholar] [CrossRef]
  25. Emmott, C.J.; Moia, D.; Sandwell, P.; Ekins-Daukes, N.; Hösel, M.; Lukoschek, L.; Amarasinghe, C.; Krebs, F.C.; Nelson, J. In-situ, long-term operational stability of organic photovoltaics for off-grid applications in Africa. Sol. Energy Mater. Sol. Cells 2016, 149, 284–293. [Google Scholar] [CrossRef] [Green Version]
  26. Pozza, A.; Sample, T. Crystalline silicon PV module degradation after 20 years of field exposure studied by electrical tests, electroluminescence, and LBIC. Prog. Photovolt. Res. Appl. 2016, 24, 368–378. [Google Scholar] [CrossRef] [Green Version]
  27. Silverman, T.J.; Mansfield, L.; Repins, I.; Kurtz, S. Damage in monolithic thin-film photovoltaic modules due to partial shade. IEEE J. Photovolt. 2016, 6, 1333–1338. [Google Scholar] [CrossRef]
  28. Tanesab, J.; Parlevliet, D.; Whale, J.; Urmee, T.; Pryor, T. The contribution of dust to performance degradation of PV modules in a temperate climate zone. Sol. Energy 2015, 120, 147–157. [Google Scholar] [CrossRef] [Green Version]
  29. Hülsmann, P.; Weiss, K.-A. Simulation of water ingress into PV-modules: IEC-testing versus outdoor exposure. Sol. Energy 2015, 115, 347–353. [Google Scholar] [CrossRef]
  30. Bouraiou, A.; Hamouda, M.; Chaker, A.; Mostefaoui, M.; Lachtar, S.; Sadok, M.; Boutasseta, N.; Othmani, M.; Issam, A. Analysis and evaluation of the impact of climatic conditions on the photovoltaic modules performance in the desert environment. Energy Convers. Manag. 2015, 106, 1345–1355. [Google Scholar] [CrossRef]
  31. Sulaiman, S.A.; Singh, A.K.; Mokhtar, M.M.; Bou-Rabee, M.A. Influence of dirt accumulation on performance of PV panels. Energy Procedia 2014, 50, 50–56. [Google Scholar] [CrossRef] [Green Version]
  32. Ramli, M.A.; Prasetyono, E.; Wicaksana, R.W.; Windarko, N.A.; Sedraoui, K.; Al-Turki, Y.A. On the investigation of photovoltaic output power reduction due to dust accumulation and weather conditions. Renew. Energy 2016, 99, 836–844. [Google Scholar] [CrossRef]
  33. Bonkaney, A.; Madougou, S.; Adamou, R. Impacts of Cloud Cover and Dust on the Performance of Photovoltaic Module in Niamey. 2017. Available online: https://www.hindawi.com/journals/jre/2017/9107502/ (accessed on 15 May 2019).
  34. Sisodia, A.K.; Mathur, R.K. Impact of bird dropping deposition on solar photovoltaic module performance: A systematic study in Western Rajasthan. Environ. Sci. Pollut. Res. 2019, 26, 31119–31132. [Google Scholar] [CrossRef] [PubMed]
  35. Hussain, A.; Batra, A.; Pachauri, R. An experimental study on effect of dust on power loss in solar photovoltaic module. Renewables 2017, 4, 9. [Google Scholar] [CrossRef]
  36. Mejia, F.; Kleissl, J.; Bosch, J. The effect of dust on solar photovoltaic systems. Energy Procedia 2014, 49, 2370–2376. [Google Scholar] [CrossRef] [Green Version]
  37. Rajput, D.S.; Sudhakar, K. Effect of dust on the performance of solar PV panel. Int. J. ChemTech Res. 2013, 5, 1083–1086. [Google Scholar]
  38. Awwad, R.; Shehadeh, M.; Al-SAlaymeh, A. Experimental Investigation of Dust Effect on the Performance of Photovoltaic Systems in Jordan. 2013. Available online: https://www.academia.edu/5486676/Rund_Awwad_PV_Dust_Effect_Paper_Jordan_2013 (accessed on 15 May 2019).
  39. Mohamed, M.A.; Diab, A.; Rezk, H. Partial shading mitigation of PV systems via different meta-heuristic techniques. Renew. Energy 2019, 130, 1159–1175. [Google Scholar] [CrossRef]
  40. Abdalla, O.; Rezk, H.; Ahmed, E.M. Wind driven optimization algorithm based global MPPT for PV system under non-uniform solar irradiance. Sol. Energy 2019, 180, 429–444. [Google Scholar] [CrossRef]
  41. Ramabadran, R.; Mathur, B. Effect of shading on series and parallel connected solar PV modules. Modern Appl. Sci. 2009, 3, 32–41. [Google Scholar] [CrossRef]
  42. Hanitsch, R.; Schulz, D.; Siegfried, U. Shading Effects on Output Power of Grid Connected Photovoltaic Generator Systems. 2001. Available online: https://www.cder.dz/download/upec-12.pdf (accessed on 15 May 2019).
  43. Solar Facts and Advice. Available online: http://www.solar-facts-and-advice.com/ (accessed on 15 September 2019).
  44. Kline, S.J. Describing uncertainty in single sample experiments. Mech. Eng. 1953, 75, 3–8. [Google Scholar]
Figure 1. The experimental set-up: two PV modules, multi-meters, a radiation power density meter, and a DC motor.
Sustainability 12 00608 g001
Figure 2. Average daily solar irradiation incident on the PV surface, and the average ambient temperature.
Sustainability 12 00608 g002
Figure 3. Real pictures for the considered PV system with the various environmental conditions: (a) the reference case (two PV are cleaned), (b) dust module accumulation, (c) water droplets, (b) partial shading, and (e) birds’ droppings.
Sustainability 12 00608 g003
Figure 4. Daily power output, short circuit current, and open circuit voltage of each PV panel under dust accumulation conditions.
Sustainability 12 00608 g004
Figure 5. Daily power output, short circuit current, and open circuit voltage of each studied module under water drops conditions.
Sustainability 12 00608 g005
Figure 6. Effect of PSC upon the, PV short circuit current, and PV open circuit voltage.
Sustainability 12 00608 g006
Figure 7. Impact of PSC on the panel power output.
Sustainability 12 00608 g007
Figure 8. The effect of bird droppings (fouling) upon the power output of the PV module, short circuit current, and open circuit voltage.
Sustainability 12 00608 g008
Table 1. Prior investigations of the performance of PVPSs worldwide.
AuthorsLocation & YearSystem SizeGrid ConnectionMeasured Parameters Test DurationMain Result
Gholami et al. [5]Tehran (2018)14.5 kWpYesI–V characteristics, open circuit voltage, and short circuit current70 daysThe total loss in the harvested energy decreased by 21.47% after 70 days without rain. The amount of dust that accumulated on the PV panel surface was 6.0986 g/m3
Ghazi [9]UK Brighton 201410 kWpNoTemperature, wind speed, and humidity11 monthsStudying the effect of dust density to light transmittance
Vasisht [13]India 201620 kWpYesGlobal solar irradiance and module temperature2 yearsThe estimated capacity factor and performance ratio of the PV system are 16.5% and 85%, respectively
Saber [14]Singapore 2014190 kWpNoSolar irradiance, Module cell temperature, Output power, and Module efficiency39 monthsThe orientation of low-slope rooftop PV has an insignificant influence on the harvested energy. However, in case of PV external sunshade, east façade, a panel slope in the range 30°–40° is the most appropriate position and inclination
Zitouni et al. [15]Morocco (2019)100 kWpYesPower, current, voltage, and temperatureSix monthsThe total loss in the harvested energy is 124 kWh during the investigation period (6 months). During the dry period, the soiling rate is 0.32% per day that caused a reduction of energy by 2.7 kWh per day
Javed et al. [16]Doha, Qatar (2017)12 CdTe thin film frameless 90 WNoEnvironmental variable performance measurements, PV performance measurements, and Dust accumulation rate10 monthsDuring the first two months, the accumulated dust is approximately 100 mg/m2 per day. Calcium is the most abundant element in the accumulated dust
Abderrezek and Fathi [17]Algeria (2017)mono-Si 20 WNoAmbient condition, main parameters of PV module, dust type, and dust sizeThree different pollutants (soil, ash, and salt) are considered. Electrical power loss varied from 10% to 16% due to accumulated dust
Walwil et al. [18]Dhahran, Saudi Arabia (2017)6 Mono-Si 4.39–4.44 WNoAmbient condition, main parameters of the PV module, and module temperature with and without dust conditions10 monthsAfter 10 months without cleaning the PV panel, the dust fouling reduced the harvested energy by 40%
Darwish et al. [19]Sharjah, UAE (2016)polycrystalline module 125 WNoSolar radiation, wind velocity, humidity, temperature, and dust composition3 monthsThe exact correlation is a polynomial from the seventh degree for current, voltage, power and efficiency, the fourth degree for solar radiation and temperature, and the cubic degree for humidity and wind velocity
Moharram et al. [20] German University in Cairo, Egypt (2013)mono-Si (part of a 14 kW)YesOutput power and efficiency of the PV system1 yearThe efficacy of PV modules reduced by 50% after 45 days of cleaning with non-pressurized water. But it continued at a constant when a mixture of anionic and cationic surfactants was used for cleaning
Perers [21]Denmark 2015250WYesSolar radiation, outdoor temperature, cell temperature, and wind speed16 monthsThe Sunarc Glass treatment clearly enhance the long-term performance of the PV system
Yerli [22]Istanbul Turkey 2010750 WpNoDirect and diffuse solar irradiance, cell temperatures, and generated electricity5 monthsContinental and maritime climatic effects have been studied
Thamer & Karim [23] Egypt5 WNoshort circuit current, open circuit voltage, and powerthree weeksDeveloping the PV Soiling Index
Fountoukis et al. [24]Qatar NOEnergy yield, solar irradiance, and ambient temperatureone yearlow correlation between the observed concentrations of particulate matter for particles with diameters up to 10 μm and the change in harvested energy
Table 2. Environmental factors affecting PVPS performance as shown in previous investigations worldwide.
Si-NoAuthorsCountryPV TechnologyPeriodThe Studied Environmental Factors
Dust, Dust AccumulationShadowWater DropsBird Droppings
1W. Javed et al. [16]QatarCdTe10 months
2Abderrezek and Fathi [17]Algeriam-SiNA
3Walwil et al. [18]Saudi Arabiam-Si1 year 9 months
4Emmott et al. [25]AfricaOPV 15 months
5A. Pozza and T. Sample [26]Italyc-Si 120 years
6Silverman et al. [27]USACdTe 1, CIGS 1NA
7Tanesab et al. [28]Australiam-Si 1, p-Si 1 and a-Si 118 years
8Hülsmann and Weiss [29]Germanyc-Si1 year
9Bouraiou et al. [30]Algeriam-Si10 years
10Sulaiman et al. [31]indoor labm-SiNA
11Ramli et al. [32]Surabaya, Indonesiam-Si
12A. Bonkaney et al. [33]Niameym-SiMay to August
13Sisodia & Mathur [34]Western Rajasthanp-SiNA
14Hussain et al. [35]Indiap-SiNA
15Present work paperJordanPolycrystalline1 year
1 CdTe (cadmium telluride), CIGS (copper indium gallium selenide), m-Si (mono-crystalline silicon), p-Si (polycrystalline or multi-crystalline silicon), a-Si (amorphous silicon), and OPV (Organic photovoltaic).
Table 3. PV module characteristics at Standard Test Conditions (STC) (1000 W/m2, 25 °C, AM1.5).
Photovoltaic PS P36-150WModule
Maximum power (Pmp)150 + 3% W
Short circuit current ( I s c )8.90 A
Open circuit voltage ( V o c )23.22 V
Current at MPP8.38 A
Voltage at MPP17.90 V
Maximum system voltage1000 V
Maximum reverse current15 A
Module efficiency15%
Dimensions150 × 66 × 40 cm
Operating temperature−40 °C to 85 °C

