Article

Photovoltaic Plant Optimization to Leverage Electric Self Consumption by Harnessing Building Thermal Mass

1
School of Architecture, University of Navarra, 31009 Pamplona, Spain
2
IREC—Catalonia Institute for Energy Research, 08930 Barcelona, Spain
3
School of Mining and Metallurgical Engineering, National Technical University of Athens (NTUA), 15780 Athens, Greece
*
Author to whom correspondence should be addressed.
Sustainability 2020, 12(2), 553; https://doi.org/10.3390/su12020553
Submission received: 13 December 2019 / Revised: 3 January 2020 / Accepted: 8 January 2020 / Published: 11 January 2020

Abstract

:
The self-consumption without surplus to the grid is one of the aspects of the new Spanish law for prosumers. Increasing the share of renewable energy sources into the grid inherently leads to several constraints. The mismatch between the energy demand and the renewable energy production, which is intermittent in nature, is one of those challenges. Storage offers the possibility to decouple demand and supply, and therefore, it adds flexibility to the electric system. This research evaluates expanding electricity self-consumption without surplus to the grid by harnessing thermal mass storage in the residential sector. The methodology is investigated by using a variable refrigerant flow air conditioner system. Because there is no option to export the excess capacity to the grid, this research proposes an approach to profiting from this surplus energy by activating structural thermal mass, which is quantified from the information acquired using a building energy model. For this purpose, an EnergyPlus model of a flat in Pamplona (Spain) was used. The optimization analysis was based on a set-point modulation control strategy. Results show that under adequate climatological circumstances, the proposed methodology can reduce the total electric energy from the grid between by 60– 80 % .

1. Introduction and Motivation of the Work

Renewable energy plays a critical role in the new decarbonization era. People all over the world are pressing governments to continue the promotion of investments in clean generation technologies. Among the most promising of these technologies are photovoltaic panels (PV), but the massive Feed-In-Tariff (FIT) of the past are gone. Their modification is related to the massive price reduction by thorough technological achievements in the PV market [1] and the substantial burden that these supporting schemes caused on the tariffs of electricity. New tools and ideas should be developed to make renewable energy more affordable by reducing the amount of consumed resources involved in their implementation. The management of renewable energy sources is receiving more attention and should be maximized. Furthermore, other concepts that are related to the main role of prosumers, such as demand response, are becoming more popular and following this direction. There is an increasing need for new technological solutions to realize new ideas regarding a grid with more potential to consume renewable energy sources (RES) [2].
Among the technologies applied to meet the thermal energy needs of buildings, heat pumps (HPs) became commonly used devices for the air conditioning of buildings in many parts of Europe, especially in the Mediterranean area [3,4,5]. HPs are facilitating the introduction of RES to households and the movement toward zero-energy buildings [6,7,8,9] because they are electricity-driven and connected to the thermal energy demand, which has a significant impact on the decarbonization process of buildings. The combination of this technology with other renewable sources, such as geothermal, wind, or solar production, is becoming common practice for scientists, architects, engineers, manufacturers, and building owners, as well as for the marketplace in general.
The smart grid technological paradigm based on the increasing capacity of renewable electricity generators has produced an urgent need for flexibility. The flexibility concept can be defined as “the ability to manage its demand and generation according to local climate conditions, user needs, and energy network requirements”. Flexibility is suggested to be a possible solution to future challenges for the grid [10]. Within the framework of the demand response concept, buildings can supply flexible services, and among other flexibility capabilities of buildings, thermal mass is one possibility. All buildings have inherent thermal capacity storage embedded in their constructions, so it is possible to store a certain amount of energy. This thermal mass can help the building to delay heating or cooling for a certain time without jeopardizing comfort. Depending on the building, the exploitable thermal mass can last for a few hours or several days. These storage capacities can be used as a flexible service provided to the grid by aggregators [11,12].
An aggregator is an entity that controls low-voltage power that is transferred to the typical places of its consumption. It is in charge of purchasing electricity and metering and billing functionalities [2]. The aggregator is an example of new businesses based on the smart grid paradigm. Building management systems (BMS) can provide information to aggregators in order to determine whether a particular building or flat is a suitable candidate provider of energy flexibility and, therefore, able to be part of the portfolio of the aggregator. From that information, the aggregator makes an offer to prosumers with HPs. Thus, HPs have the potential to facilitate the introduction of energy flexibility services [10].
In a residential building sector aiming to decarbonize, HVAC systems should leverage the available solar irradiance. Especially in southern Europe, where days are longer and solar radiation is higher, a combination of HVAC and solar PV modules is a promising possible solution [3].
Different solar technologies are available. In several research studies, solar technologies based on absorption and adsorption systems were investigated [13,14,15]. The costs of these technologies are higher than those of conventional air conditioning systems. Another possibility is the combination of solar thermal panels and photovoltaic modules. This integration, called a photovoltaic-thermal module (PV-T), could be a feasible option in urban areas with limited space. This solution can generate electrical energy and heat simultaneously using the same surface. The system properties were discussed in a variety of papers [16,17,18].
Among the new ideas for improving the grid and the integration of more renewable energy is the microgrid ( μ G), which is related to the concept of single electrical power subsystems associated with a small number of distributed energy resources (DERs), which can be renewable or/and conventional with a cluster of loads [19,20,21]. In distributed microgeneration, many problems can occur, such as raising the local voltage and exceeding the thermal limits of certain lines and transformers [22]. Microgrids are potentially a better solution for reducing environmental pollution and mitigating global warming. Energy storage devices are a key element of a successful microgrid [23]. However, batteries are expensive devices, especially when they are connected to large loads, and lowering the capacity of batteries could contribute to the economic viability of microgrids. This paper presents the alternative possibility of using thermostatically heat-controlled loads to store energy in the building’s thermal mass. When there is available electricity from renewable energy sources, this extra energy will produce savings after sunset when no renewables can be used. Therefore, thermal mass, which has an infinite cycle of charging and discharging [24], is used to lower the use of the grid.
There is a clear trend of solar PV making major contributions to the electricity supply. In many countries, the decline in the feed-in tariff has promoted self-consumption, and it will play an important role in the calculation of return on investment (ROI) of solar PV installation. Therefore, estimating and predicting self-consumption can help potential adopters make informed judgments about their potential ROI by reducing the amount of electricity that they import from the grid. Better evidence-based research on self-consumption will support changes in the behavior of consumers so that they make use of PV generation, and this change will have a positive effect on grid demand. This knowledge is also critical for policymakers to calculate the appropriate feed-in tariff rate to achieve PV deployment targets [25].
The revised renewable energy directive [26] and the new Spanish law on self- consumption [27] focused on the concept of renewable energy communities. The modulation of the heating power through optimized set-points make this methodology very appropriate for collective self-consumption. The highest potential of the methodology is deployed when the optimization is performed with day-ahead weather forecast. This way, each member of the self-consumption cluster will be able to adapt their consumption pattern to the available energy. This research is within the SABINA H2020 project [28], where a Power-to-Heat solution based on the storage capacity of thermal mass to assess the potential of buildings to modulate electric heating power provided by a HP, when surplus energy is available from a renewable source. Optimized set-points define control strategies to exploit the building’s flexibility considering both energy and thermal comfort. For this purpose, renewable energy produced on-site is maximized to reduce the energy that is needed from the grid.
The control strategy for optimization is based on model predictive control (MPC) [29]. This type of control uses a building energy model (BEM) to estimate its control signals following an objective function in order to (i) improve its behavior, with a focus on many aspects, from storage to a demand response event [30]; (ii) reduce a building’s energy peak power, which contributes to the reduced use of the energy grid in the peak hours; (iii) prepare the building for a peak load event; or (iv) simply optimize the building’s energy consumption by adapting it to the system’s tariffs (using the building’s thermal inertia) [31].
In this paper, an approach is proposed that combines HPs with solar electricity production. For this application to take full advantage of the energy produced by PV panels, the thermal demand of the building should be concentrated in the hours of maximum solar radiation. The aim is to obtain the maximum coincidence between the building’s energy demand curve and the photovoltaic production curve. To this end, the model prediction control process works against a model and can, therefore, offer the building’s thermal inertia as an asset for storing energy. The results show that a certain level of thermal inertia plays a key role in the optimization capacity, reducing the energy consumption from the grid and increasing the penetration of renewable energy from the microgrid. Because thermal inertia, in contrast to batteries, is an infinite source, this solution is a step forward in making low-scale microgrids more sustainable. Microgrids provide flexibility to the grid, and thermal inertia provides flexibility to the microgrid. Therefore, the main innovation of the paper is the automatic control of the surplus renewable energy produced on site, by programming the optimal set-points based on weather forecast. This process could be implemented in the next generation of home energy management systems (HEMS).
This paper is organized as follows. Section 2 explains the methodology, which includes the simulation and the optimization environment and the sources of data used for implementation in the BEM, such as weather, PV panels, heating system and construction components. Section 3 is dedicated to the analysis of the results. Section 4 presents the conclusion and discusses future works.

2. Methodology

2.1. Building Energy Model (BEM)

This methodology uses detailed building energy models developed in OpenStudio [32] and EnergyPlus [33]. In particular, EnergyPlus is a whole building energy simulation program that enables obtaining the energy consumption (heating, cooling) taking into account many aspects, including the thermal mass. It is an appropriate simulation software since the purpose of this MPC application is to benefit from the thermal storage building’s capacity and use it as a thermal battery, therefore the BEM must represent complex phenomena as building’s thermal inertia [34], and for this reason detailed energy models are used. As is highlighted by Corbin et al. [35] “While many examples of model predictive control (MPC) use simplified building models exist in the literature, the use of a complex simulation model allows phenomena not easily captured in simplified models to be studied”. The detailed energy models provide a reliable basis for this kind of application, as they take into account the building’s physical aspects, its operational schemes and the weather conditions in a dynamic way.
For the application of this procedure, the BEM used in the optimization must be a calibrated energy model that accurately represents the building’s energy performance. Several authors of previous research described the calibration process for detailed energy models [36,37,38,39,40]. In this case, the model is synthetic, which means that it is assumed to fit perfectly to the real building. The use of synthetic models for exploring a new methodology is recommended by ASHRAE [41]. In addition, real weather data are used instead of forecast weather data because the purpose of this study is to show the maximum potential of using the thermal mass of a building as thermal storage. Analysis of the impact of introducing real weather forecast errors should be carried out as a complementary study.
The optimization was applied for an individual dwelling of 98.1 m 2 that is part of a block of apartments in Pamplona, Spain. The building has three facades facing southeast, southwest, and northwest. The northeast wall is a party wall with the adjacent dwelling (see Figure 1).
Table 1 shows the construction features of the model, and Figure 2 where each construction component is used in the BEM. The technical data (ventilation, occupation and operational schedules, values of the construction components) are taken from the Spanish Regulation Technical Building Code [42]. For the evaluation of the thermal mass as an overall value, a script in EnergyPlus runtime Language (Erl) was made to sum up the thermal storage of all the construction components.

2.2. Heating System

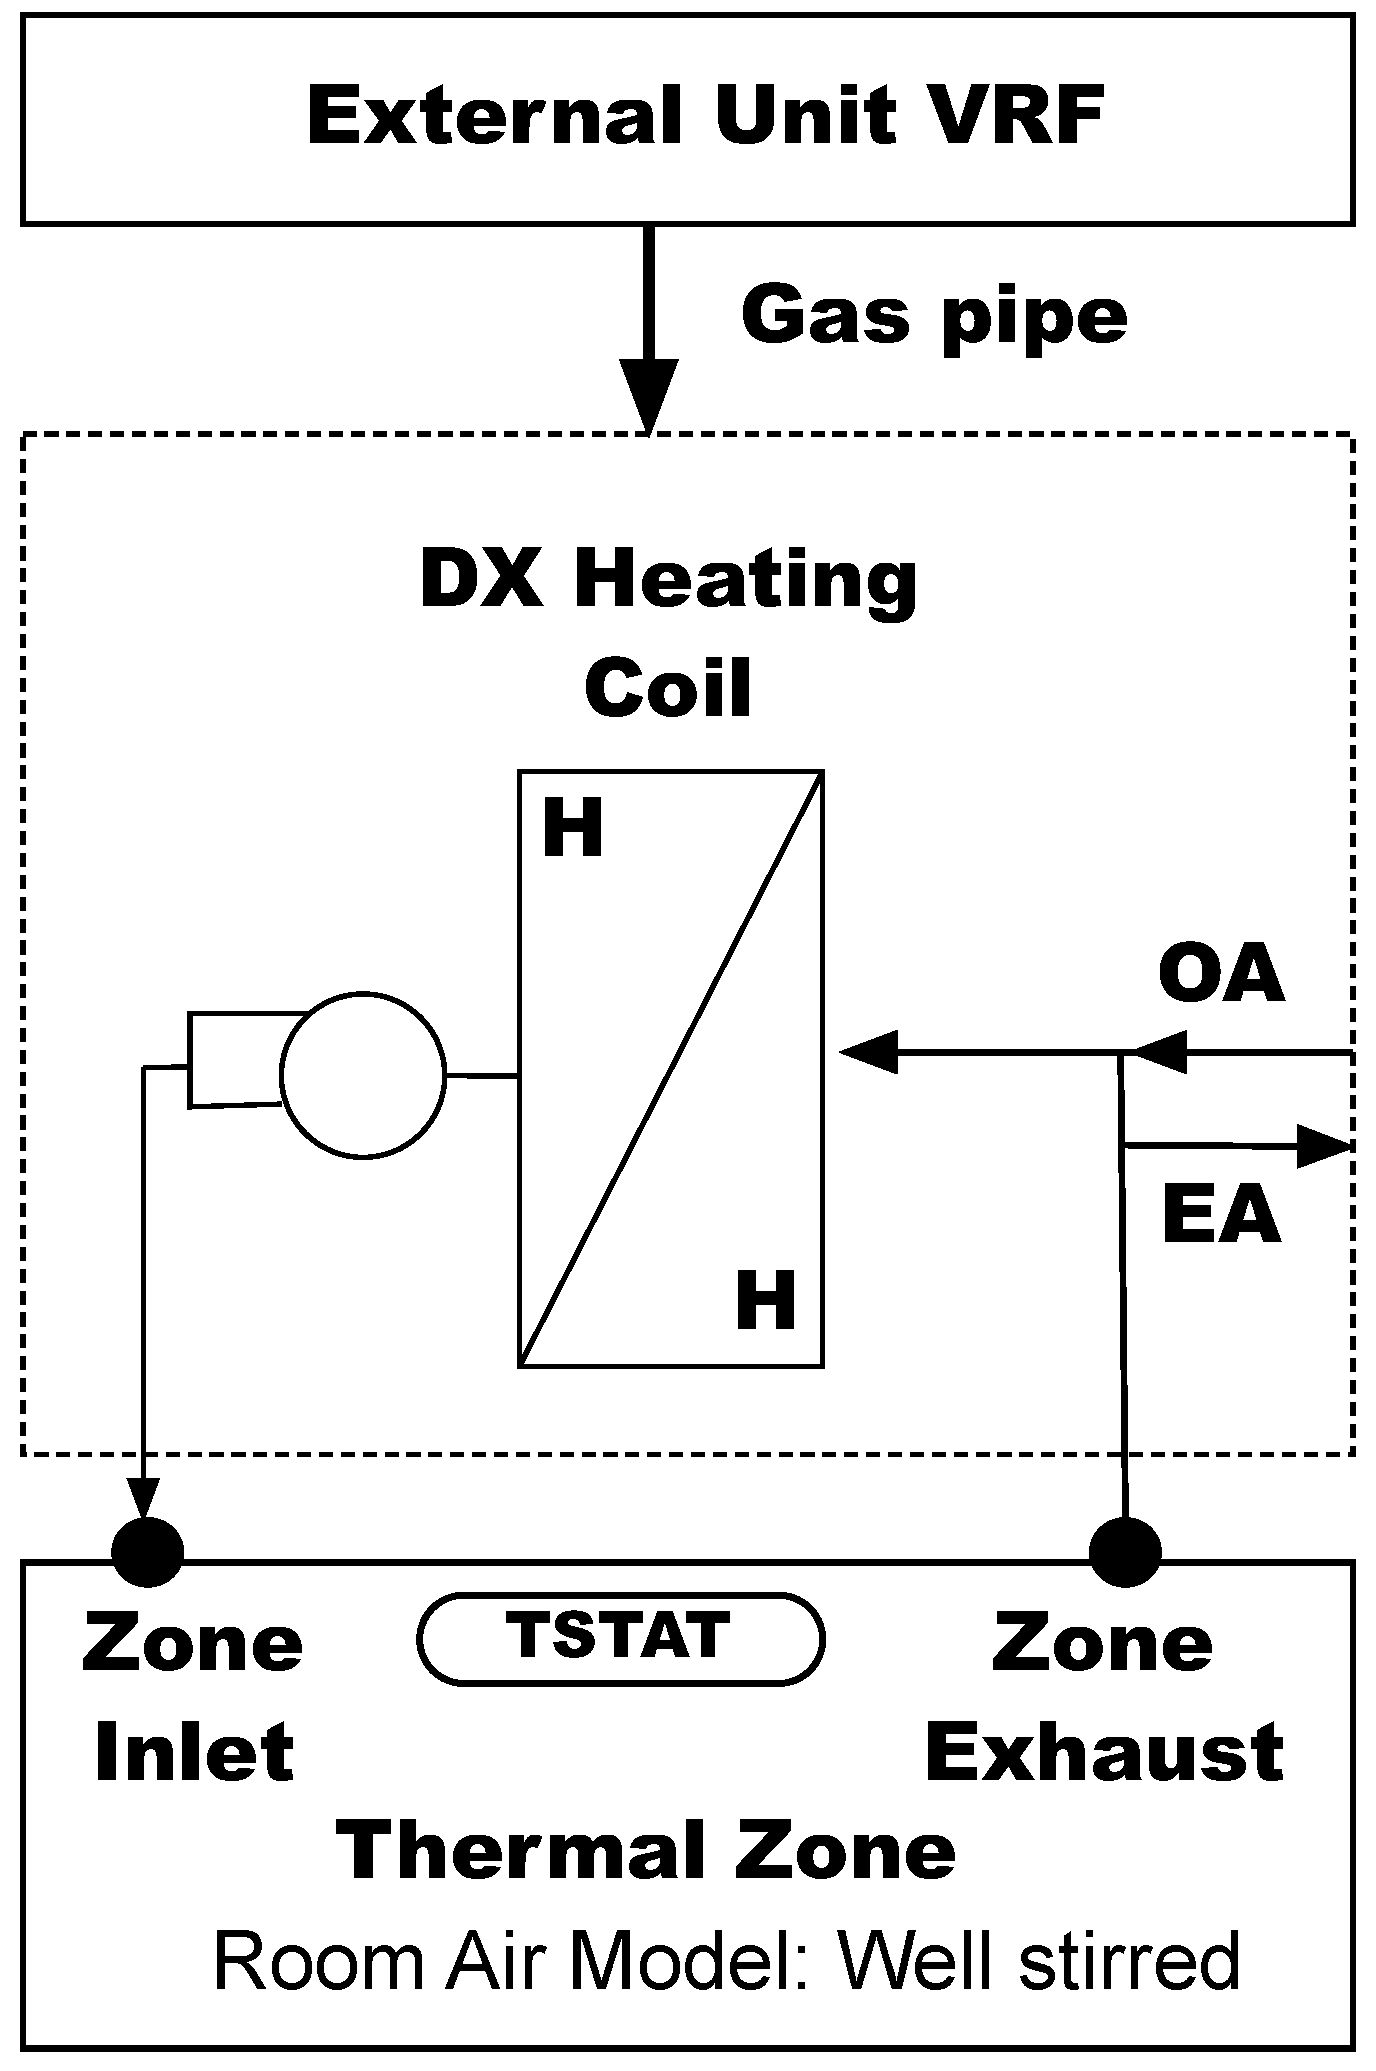
The HVAC system of the dwelling was simulated as a variable refrigerant flow (VRF) system. It is an off-the-shelf EnergyPlus component. A VRF system varies the refrigerant flow using variable speed compressor and electronic expansion valves. Among the two alternative models available in EnergyPlus, in this paper the System Curve Based Model was chosen. EnergyPlus provides several performance curves to describe system operation, and detail information can be checked at the EnergyPlus Engineering Reference book [43]. The terminal units operate to satisfy the heating load (only the winter case is implemented) in the conditioned thermal zones on the basis of the zone thermostat temperature set-point. In this case study, a unique thermostat is considered for all thermal zones. A schema of the main components for one single zone is shown in Figure 3. Table 2 shows the main characteristics of the VRF system.

2.3. Electric Building System

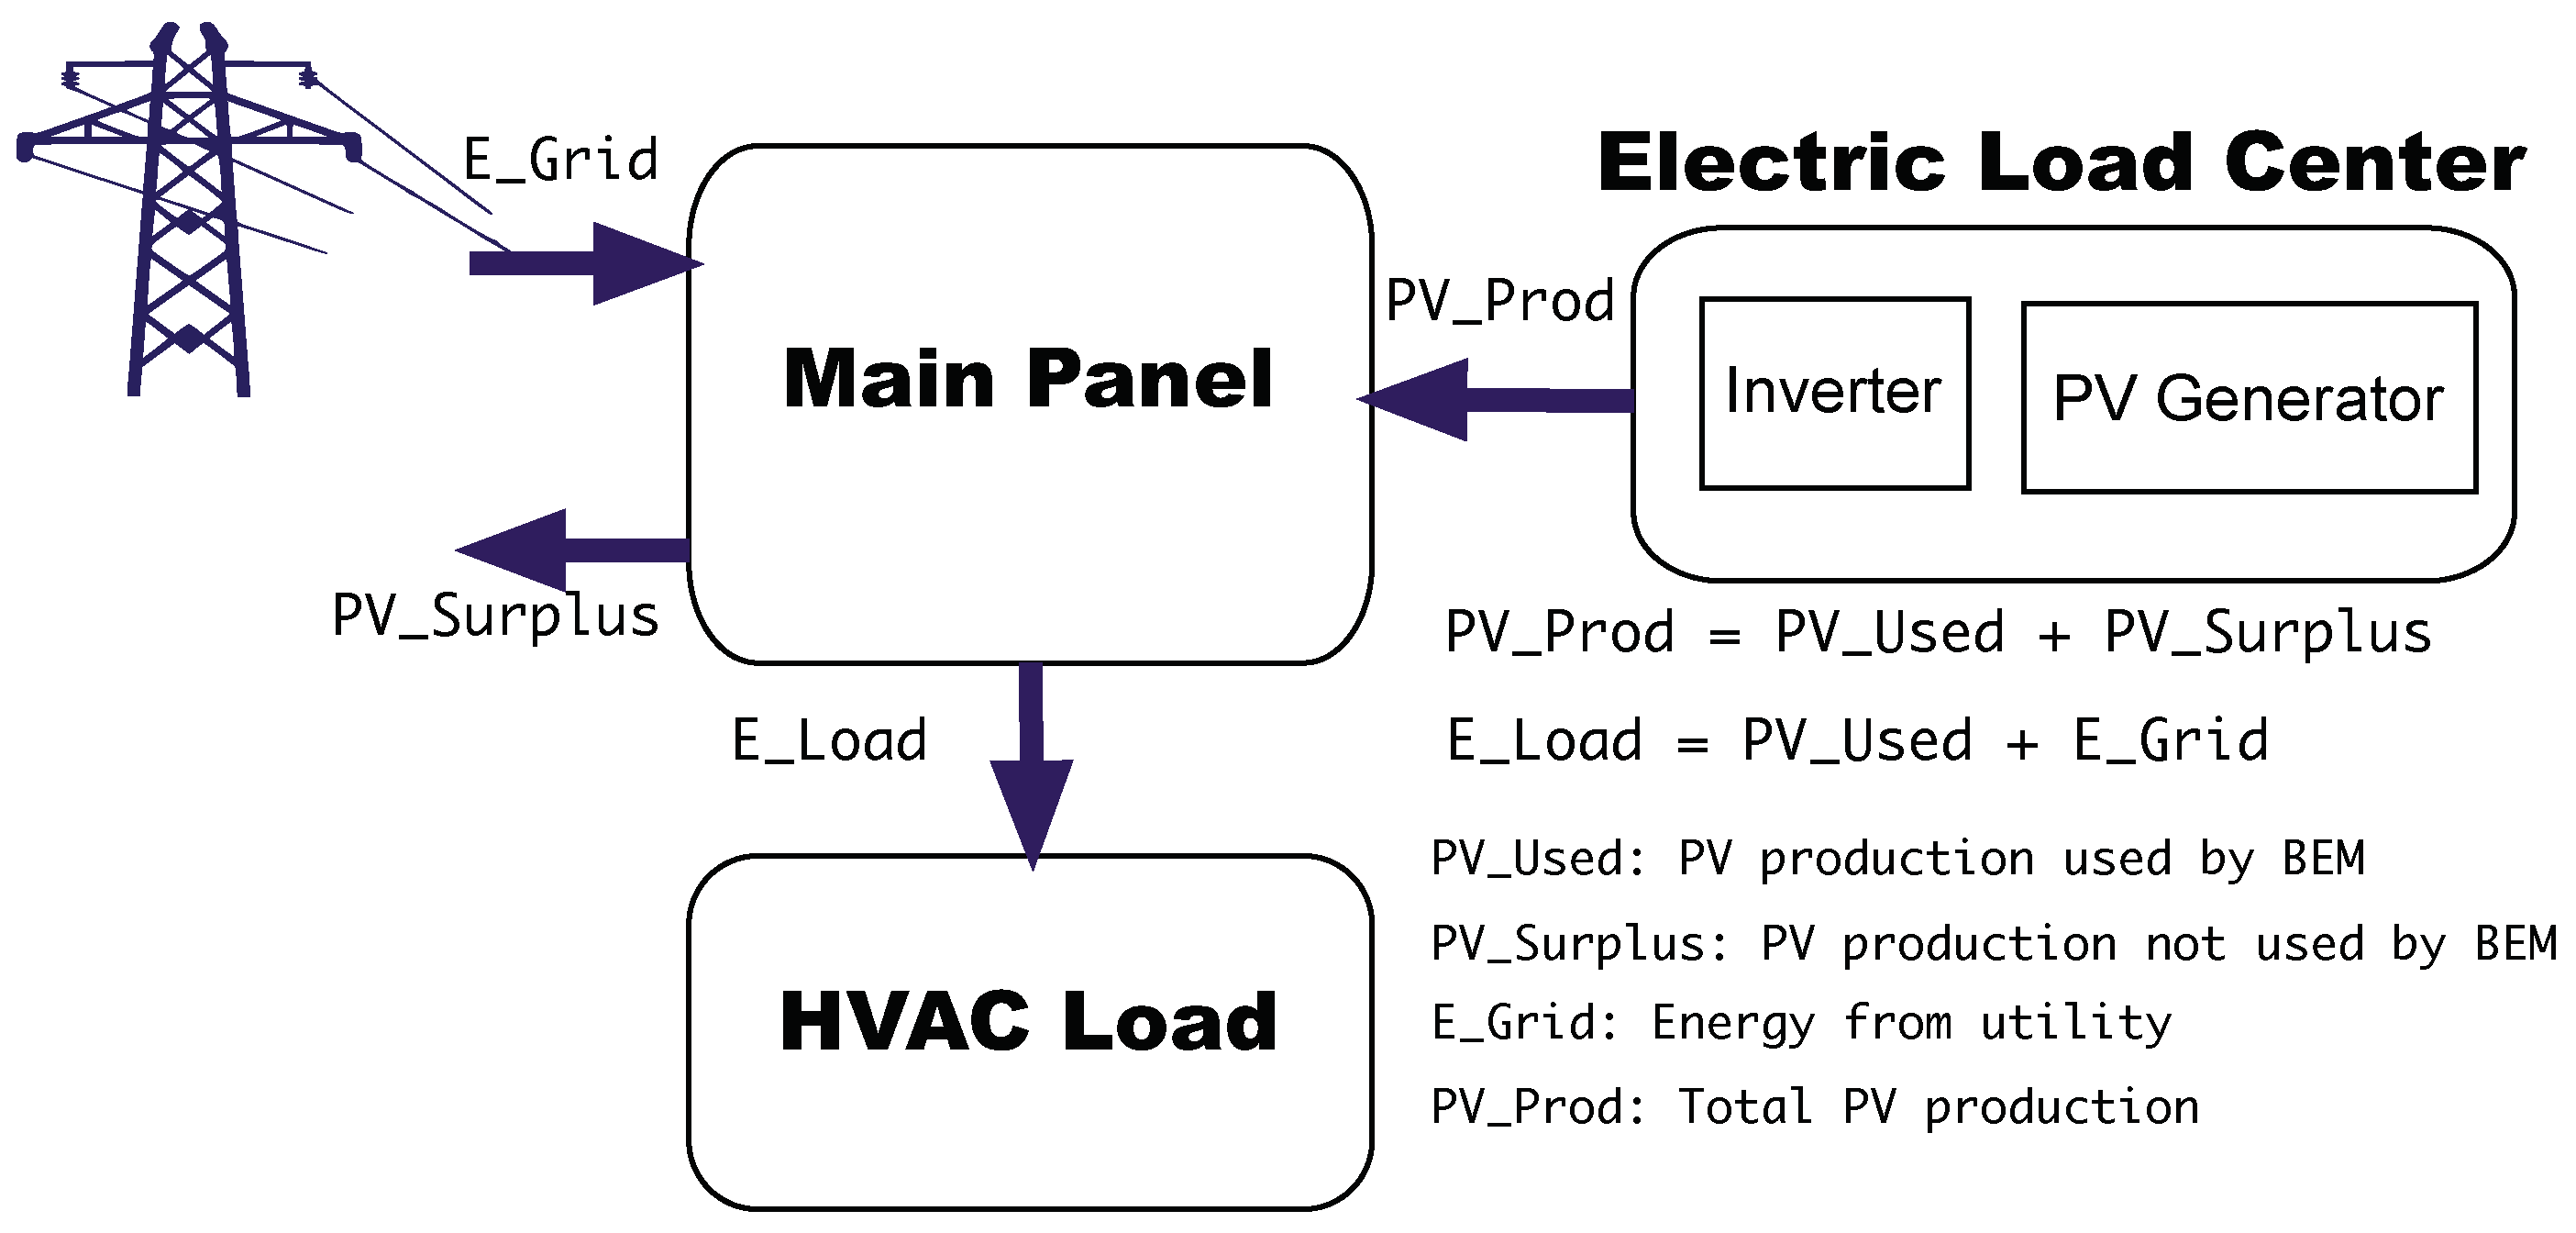
The building electric power service was simulated. These objects are required when on site generators produce electricity within the facility, for example solar photovoltaics panels. The PV panels are configured only to provide electric energy to the HVAC system. Therefore, the HVAC system is connected with both the PV panels and the grid working in parallel and they are summed in order to supply the total electrical energy demanded by the HVAC system (see Figure 4). For this case study, the PV panels are simulated directly in the EnergyPlus model as an object (Generator:Photovoltaic). The simple PV model object used (PhotovoltaicPerformance:Simple) since the purpose of these research is not the detailed simulation of the photovoltaic installation. This model is intended to be useful for design purposes to quickly get an idea of the levels PV production and peak power. The Figure 1 shows the building energy model where can be seen the surface of the PV installation on the roof (purple square). In this case study, the southeast roof was selected, which has an inclination of 20 , and is covered with 28 m 2 of PV panels facing 27 south with a cell efficiency of 15%. The system consists of sixteenth photovoltaic solar panels connected in parallel, each with a 240 W peak power output and a total output of 4000 W. In Table 3 main production results from the PV plant are shown. In the same way Figure 5 shows the hourly PV production for the days of study.

2.4. Weather Data

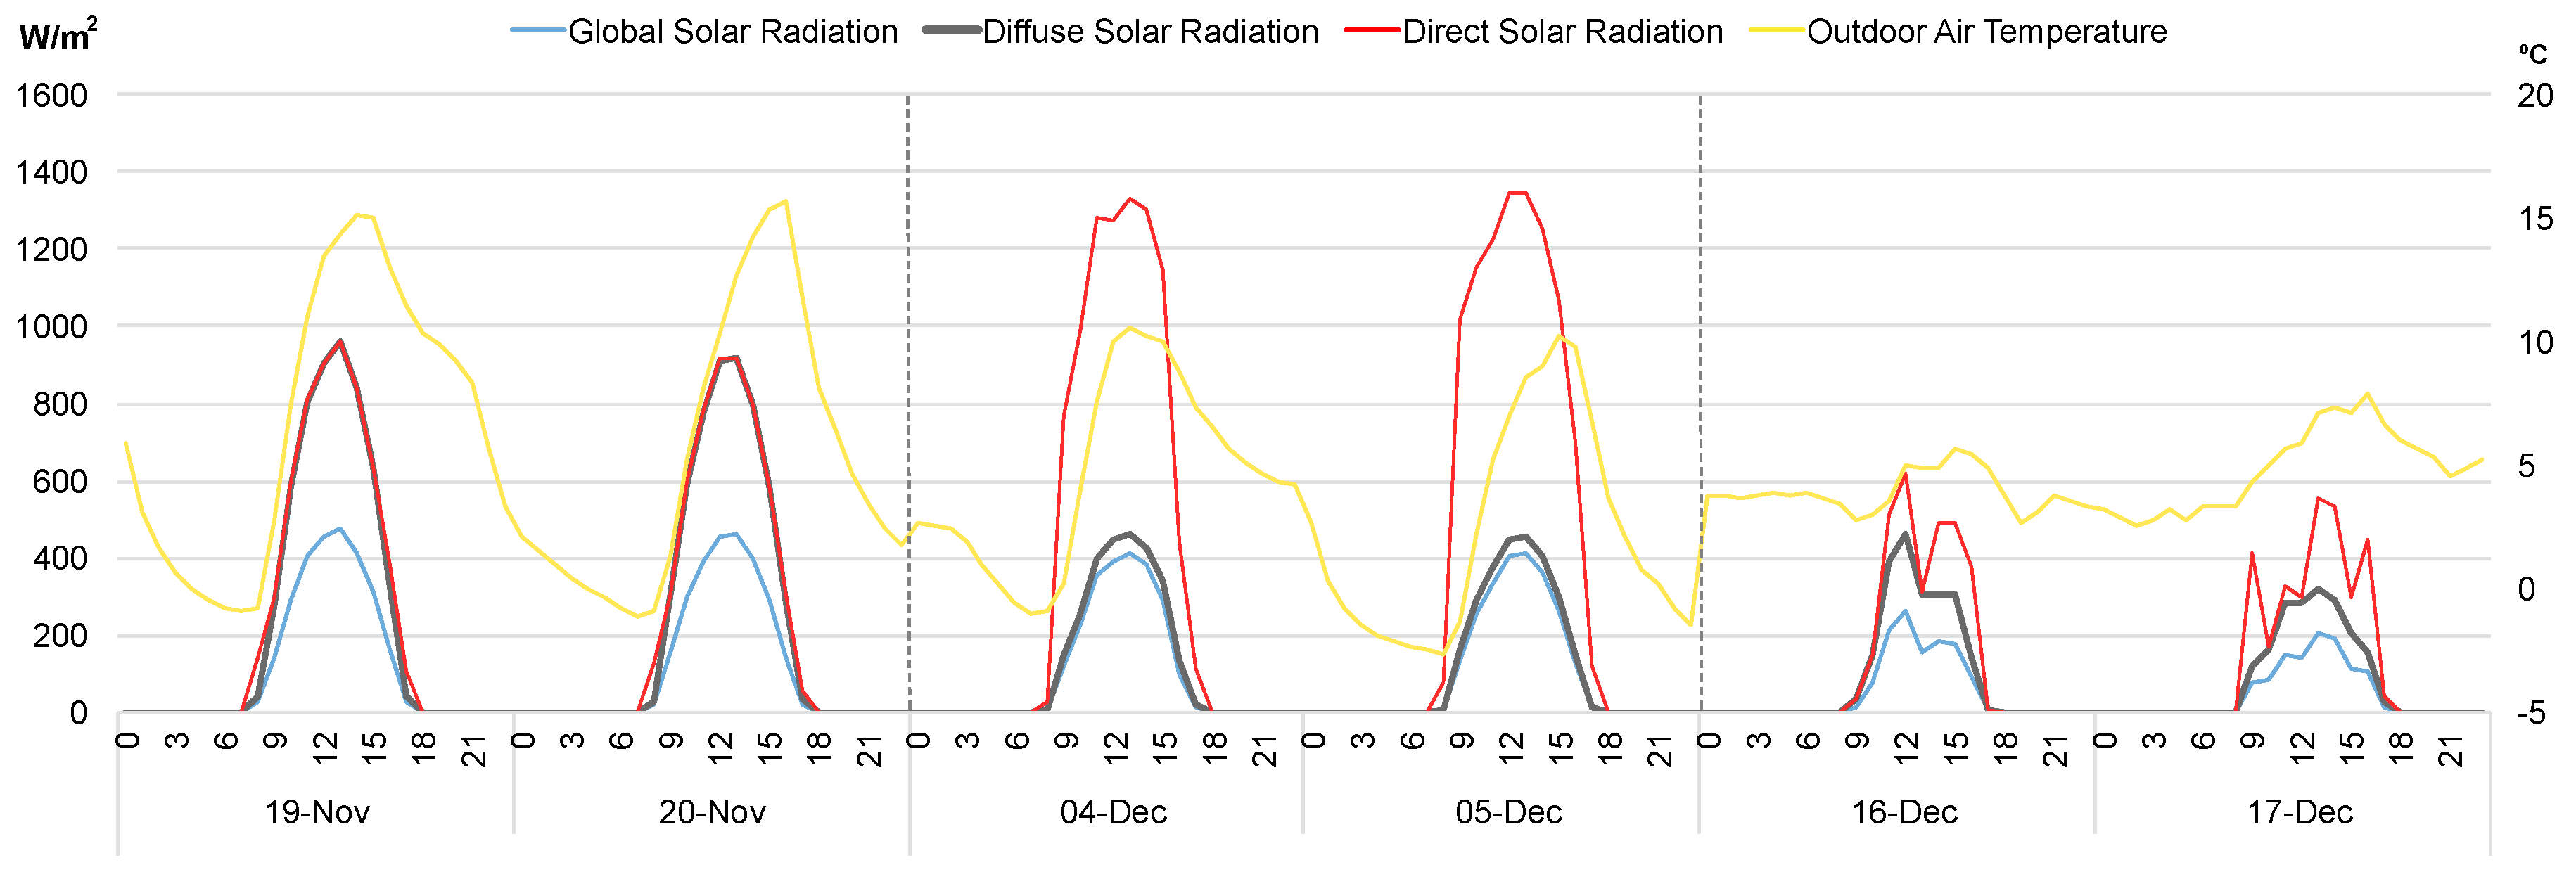
The external weather file used in this investigation contained real data for the year 2017 gathered by two nearby weather stations: one is located in the School of Architecture of the Universidad de Navarra, which is 2 km away, and provides outdoor temperature ( C), wind direction ( ), wind speed (m/s), and relative humidity (%); the other parameters are provided by a weather station belonging to the Navarra Government that is located 3 km away from the study test site, and it provides global solar radiation (W/m 2 ), diffuse solar radiation (W/m 2 ), rainfall (L/m 2 ), and atmospheric pressure (mbar). Figure 6 shows the main weather parameters related to the days of study and to the PV production shown in Figure 5. With that information a specific *.epw file was created to perform the simulations for the different scenarios. The direct global radiation is calculated by the program as it is explained in the EnergyPlus documentation [44].

2.5. Model Predictive Control (MPC) Strategy

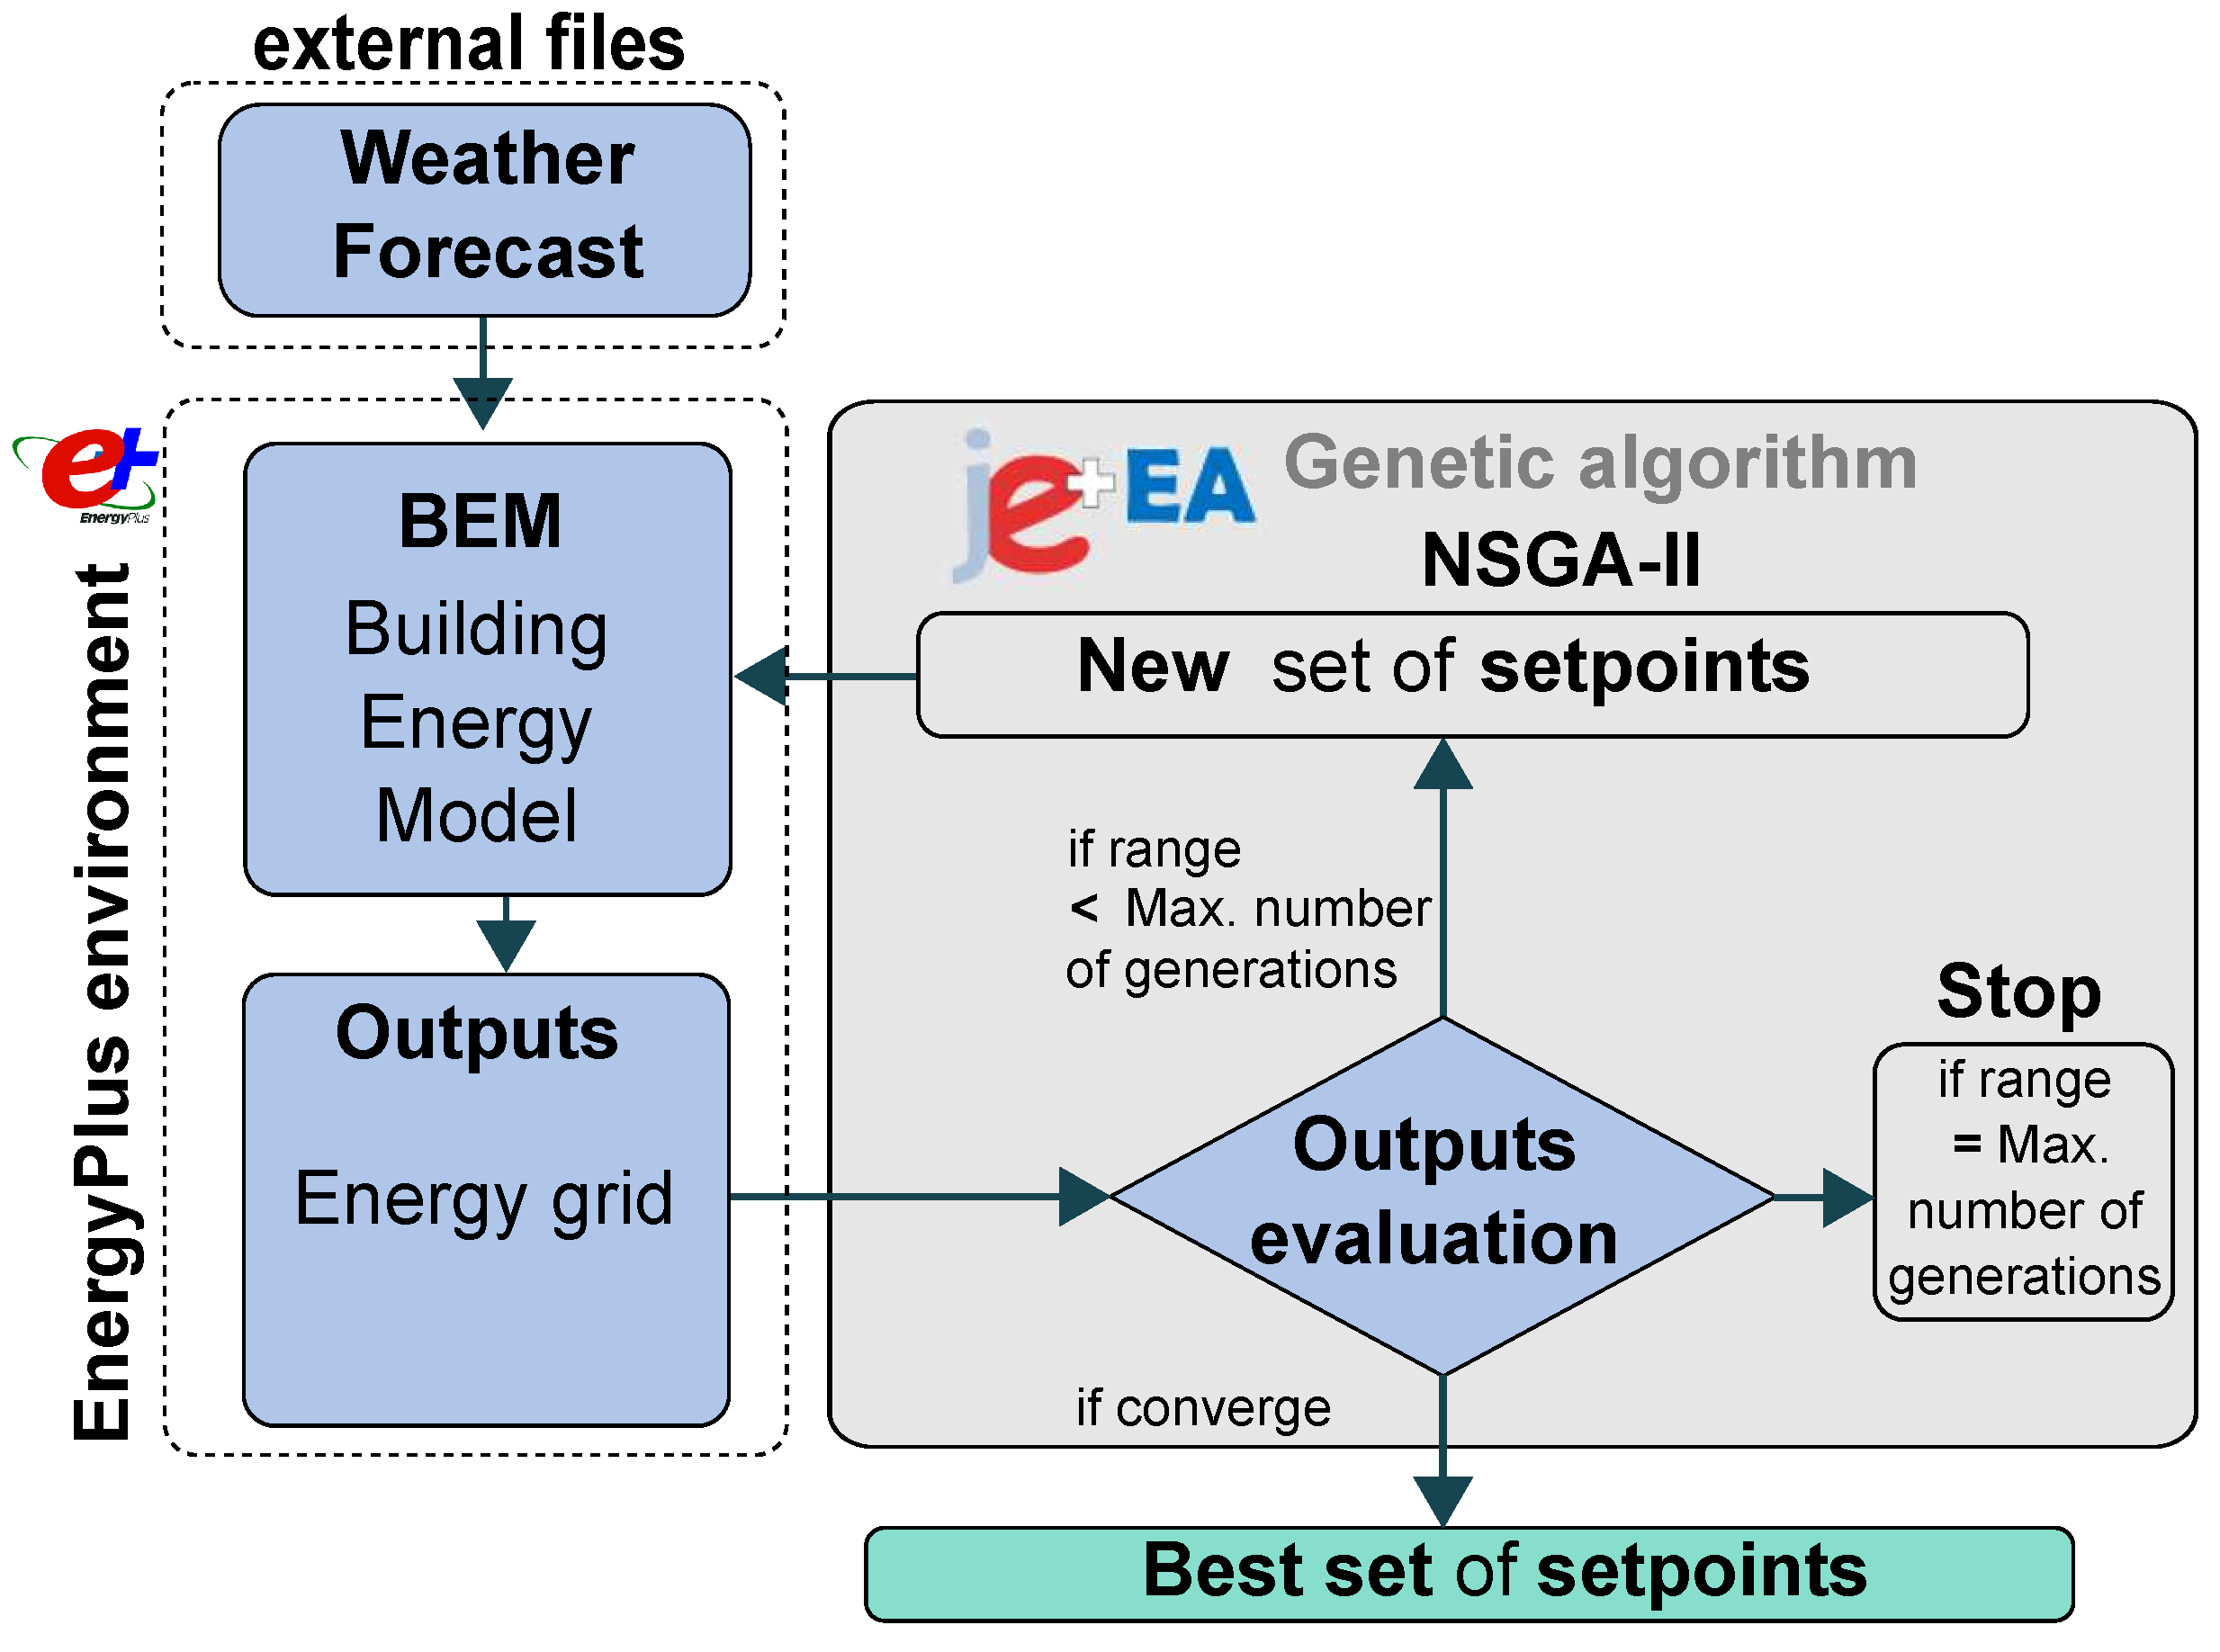
Figure 7 shows a general scheme of the optimization process. This is divided in two main parts: the simulation environment (left side) and the optimization environment (right side).
In this case, MPC will be used to obtain an optimal set of HVAC temperature set-points for the following hours with the objective of optimizing a PV system installation. The MPC methodology used in this study is described in a previous paper from the authors [45] and it is focused mainly on two aspects: the use of detailed Building Energy Models (BEM) as the best method to obtain building information (energy consumption, thermal zone temperatures, etc.), which will be used later as an objective function; and the reduction of the search space that allows the use of genetic algorithms to optimize these objectives so that the results can be obtained in a reasonable time. The following paragraphs explain the application of this MPC methodology for the purpose of this study.
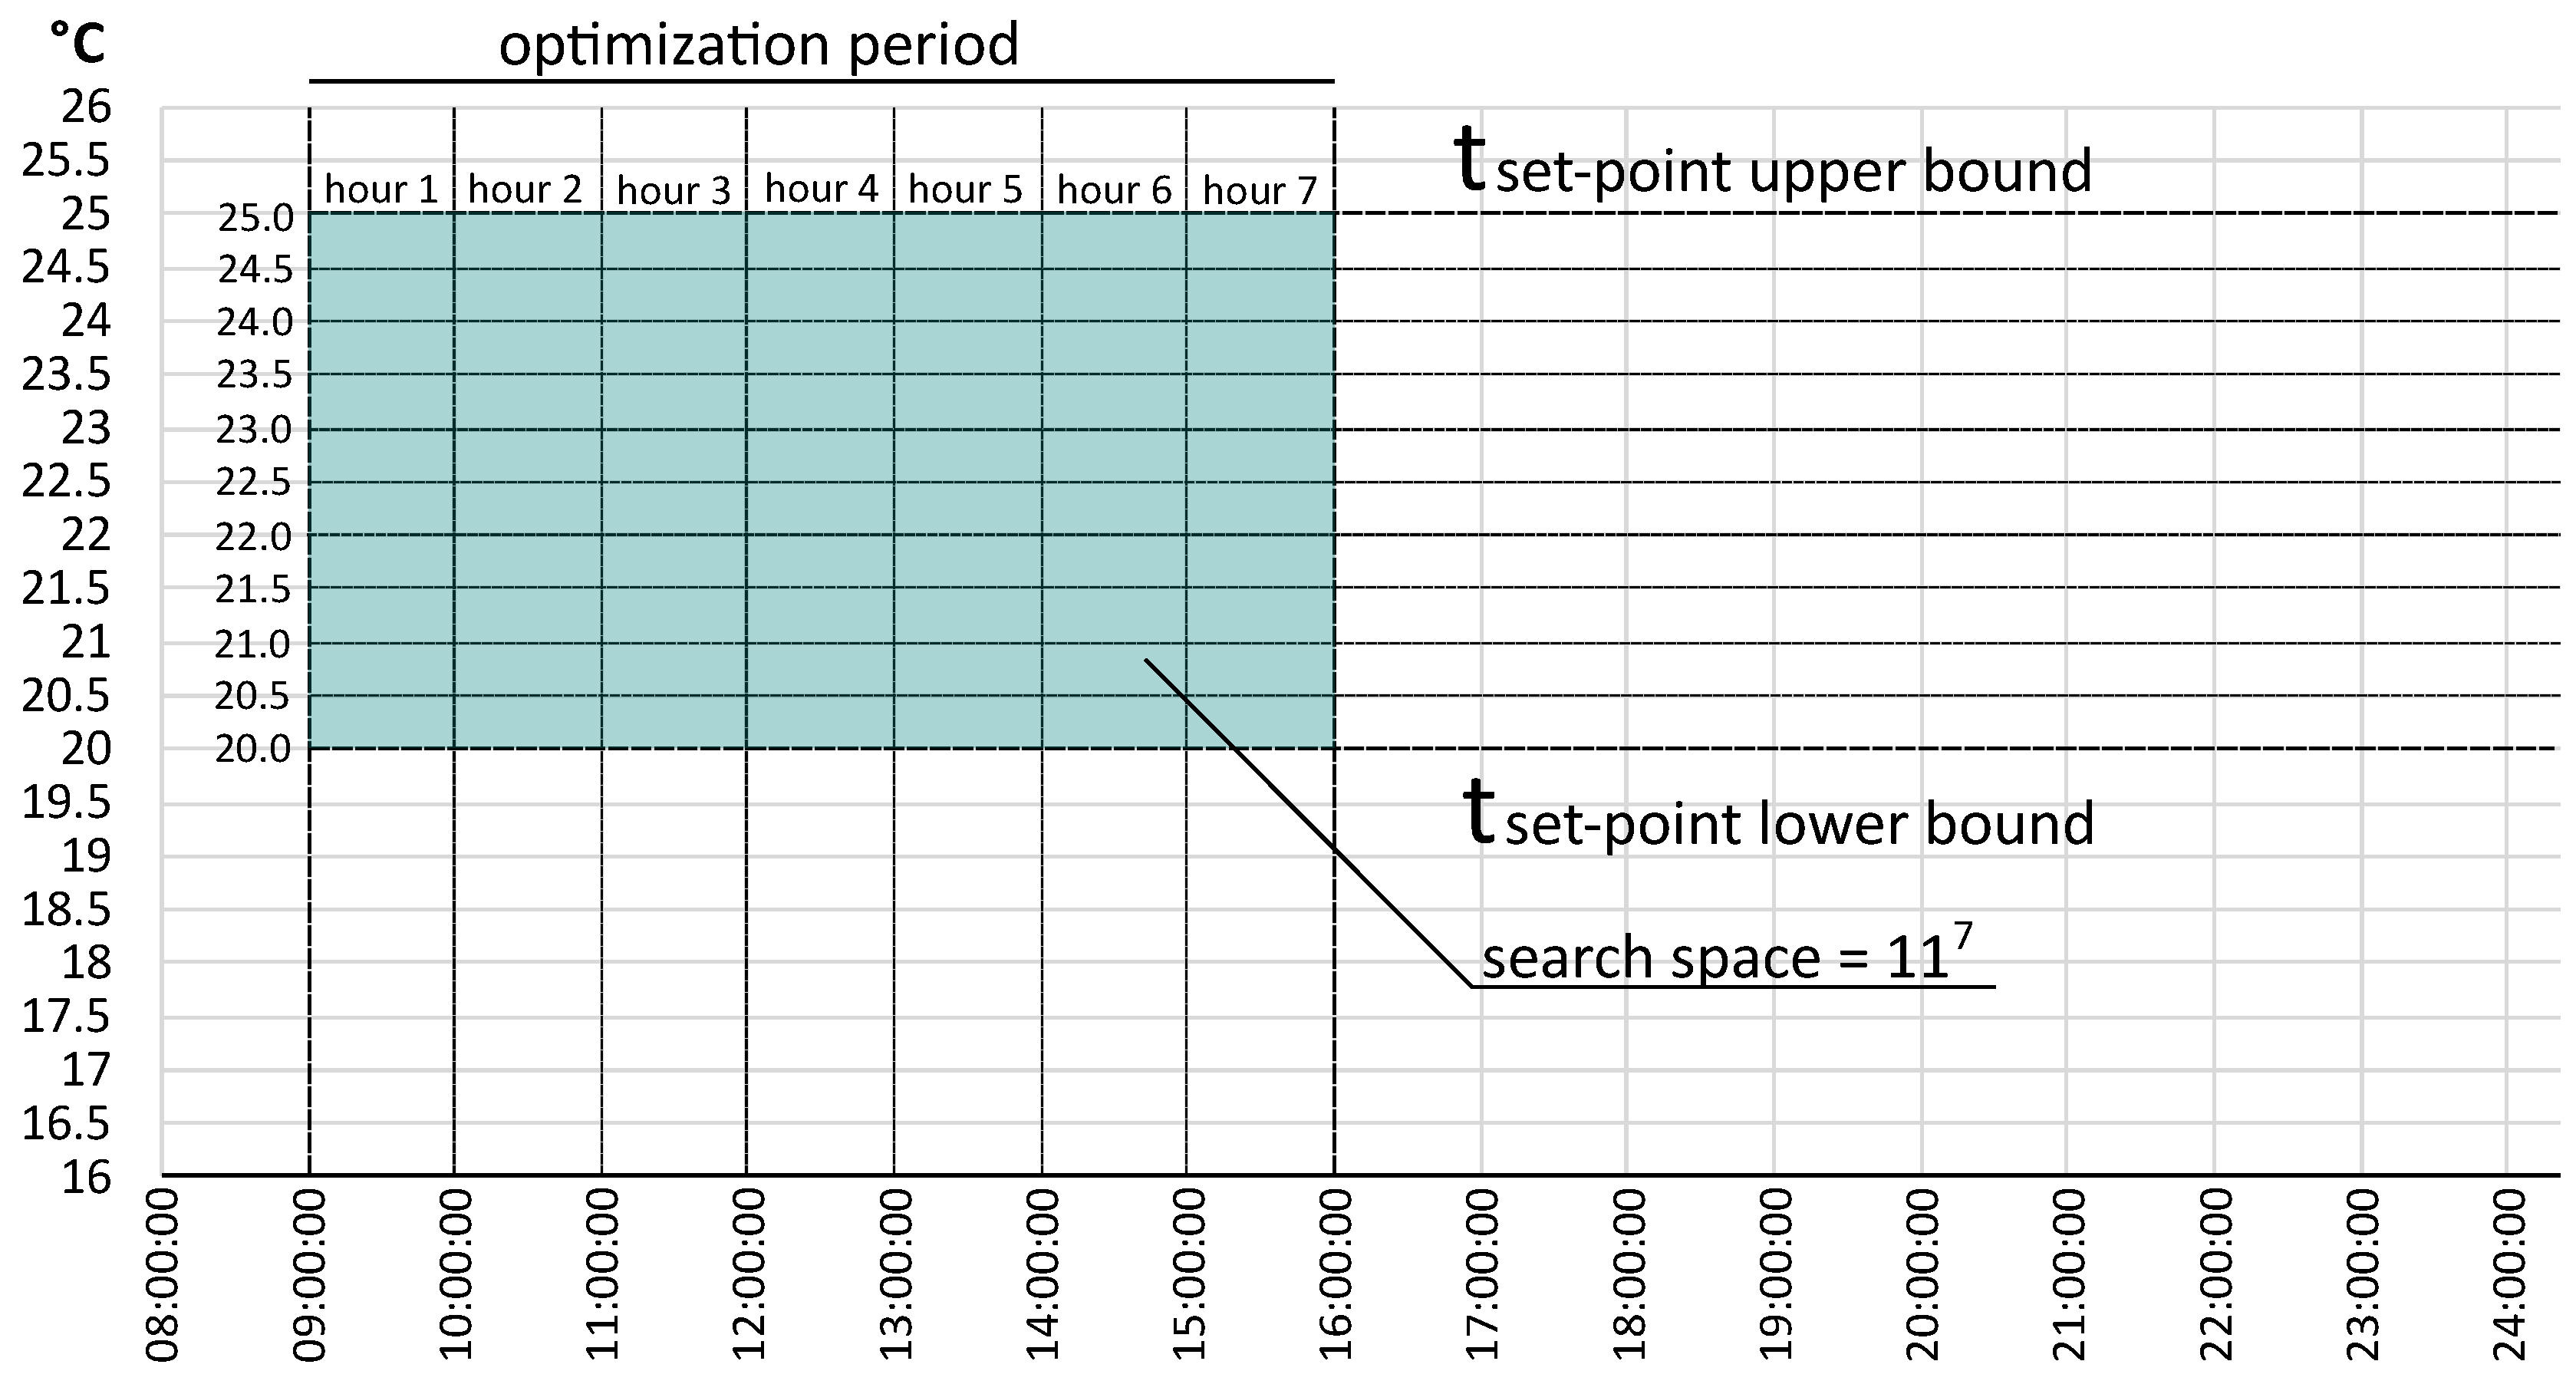
The software used to perform the optimization is JEplus+EA [46], which couples a genetic algorithm with EnergyPlus software. This software has a user-friendly interface that makes the optimization process very easy for non-experts. The algorithm is the non-dominated sorting genetic algorithm II (NSGA-II) [47], which is commonly used to perform optimizations [48]. When using this type of algorithm, it is necessary to have control of the search space because if it is too large, finding good solutions is closely related to the simulation time. For MPC optimization problems, in which time is a decisive factor, it is necessary to control this search space. In this optimization methodology, the search space of the problem is adjusted by using HVAC temperature set-points as discrete decision variables (in steps of 0.5 C) subject to lower and upper boundaries, optimizing the set-points only when the photovoltaic panels are producing electric energy and splitting this period into 1-hour blocks (see Figure 8). The search space is 11 7 , which allows good results to be obtained with a genetic algorithm configuration of 125 generations of 16 individuals.
The other key factor for any optimization problem is the definition of a suitable objective function to guide the algorithm in the optimization process. The objective function used is the reduction in electric energy from the grid. It is composed of HVAC electric consumption minus PV production. When PV production is greater than HVAC electric consumption, the goal is achieved. This is a direct output of the program, and therefore, it is very simple to implement because there is no need for any external computation. The algebraic relation of all the components can be seen in Figure 4.
Only the hours with PV production were part of the optimization, so only the HVAC temperature set-points related to this PV production period were used as the control variables. This period was divided into blocks of 1 h because for HVAC systems’ slow-moving processes (such as air temperature), hourly data is enough [49]. For a day of the study, the optimization time was formed by 7 samples (from 09:00 to 17:00). The evaluation of the objective functions accounted for 15 h (from 09:00 to 23:00). The search space was also defined by the degree-granularity of the temperature set-points. Half a degree was selected for each value within the optimization time. The search space was 11 7 (1.94 × 10⁷) simulations, so it was not feasible to perform them by computing all the possibilities.

2.6. Evaluation Criteria

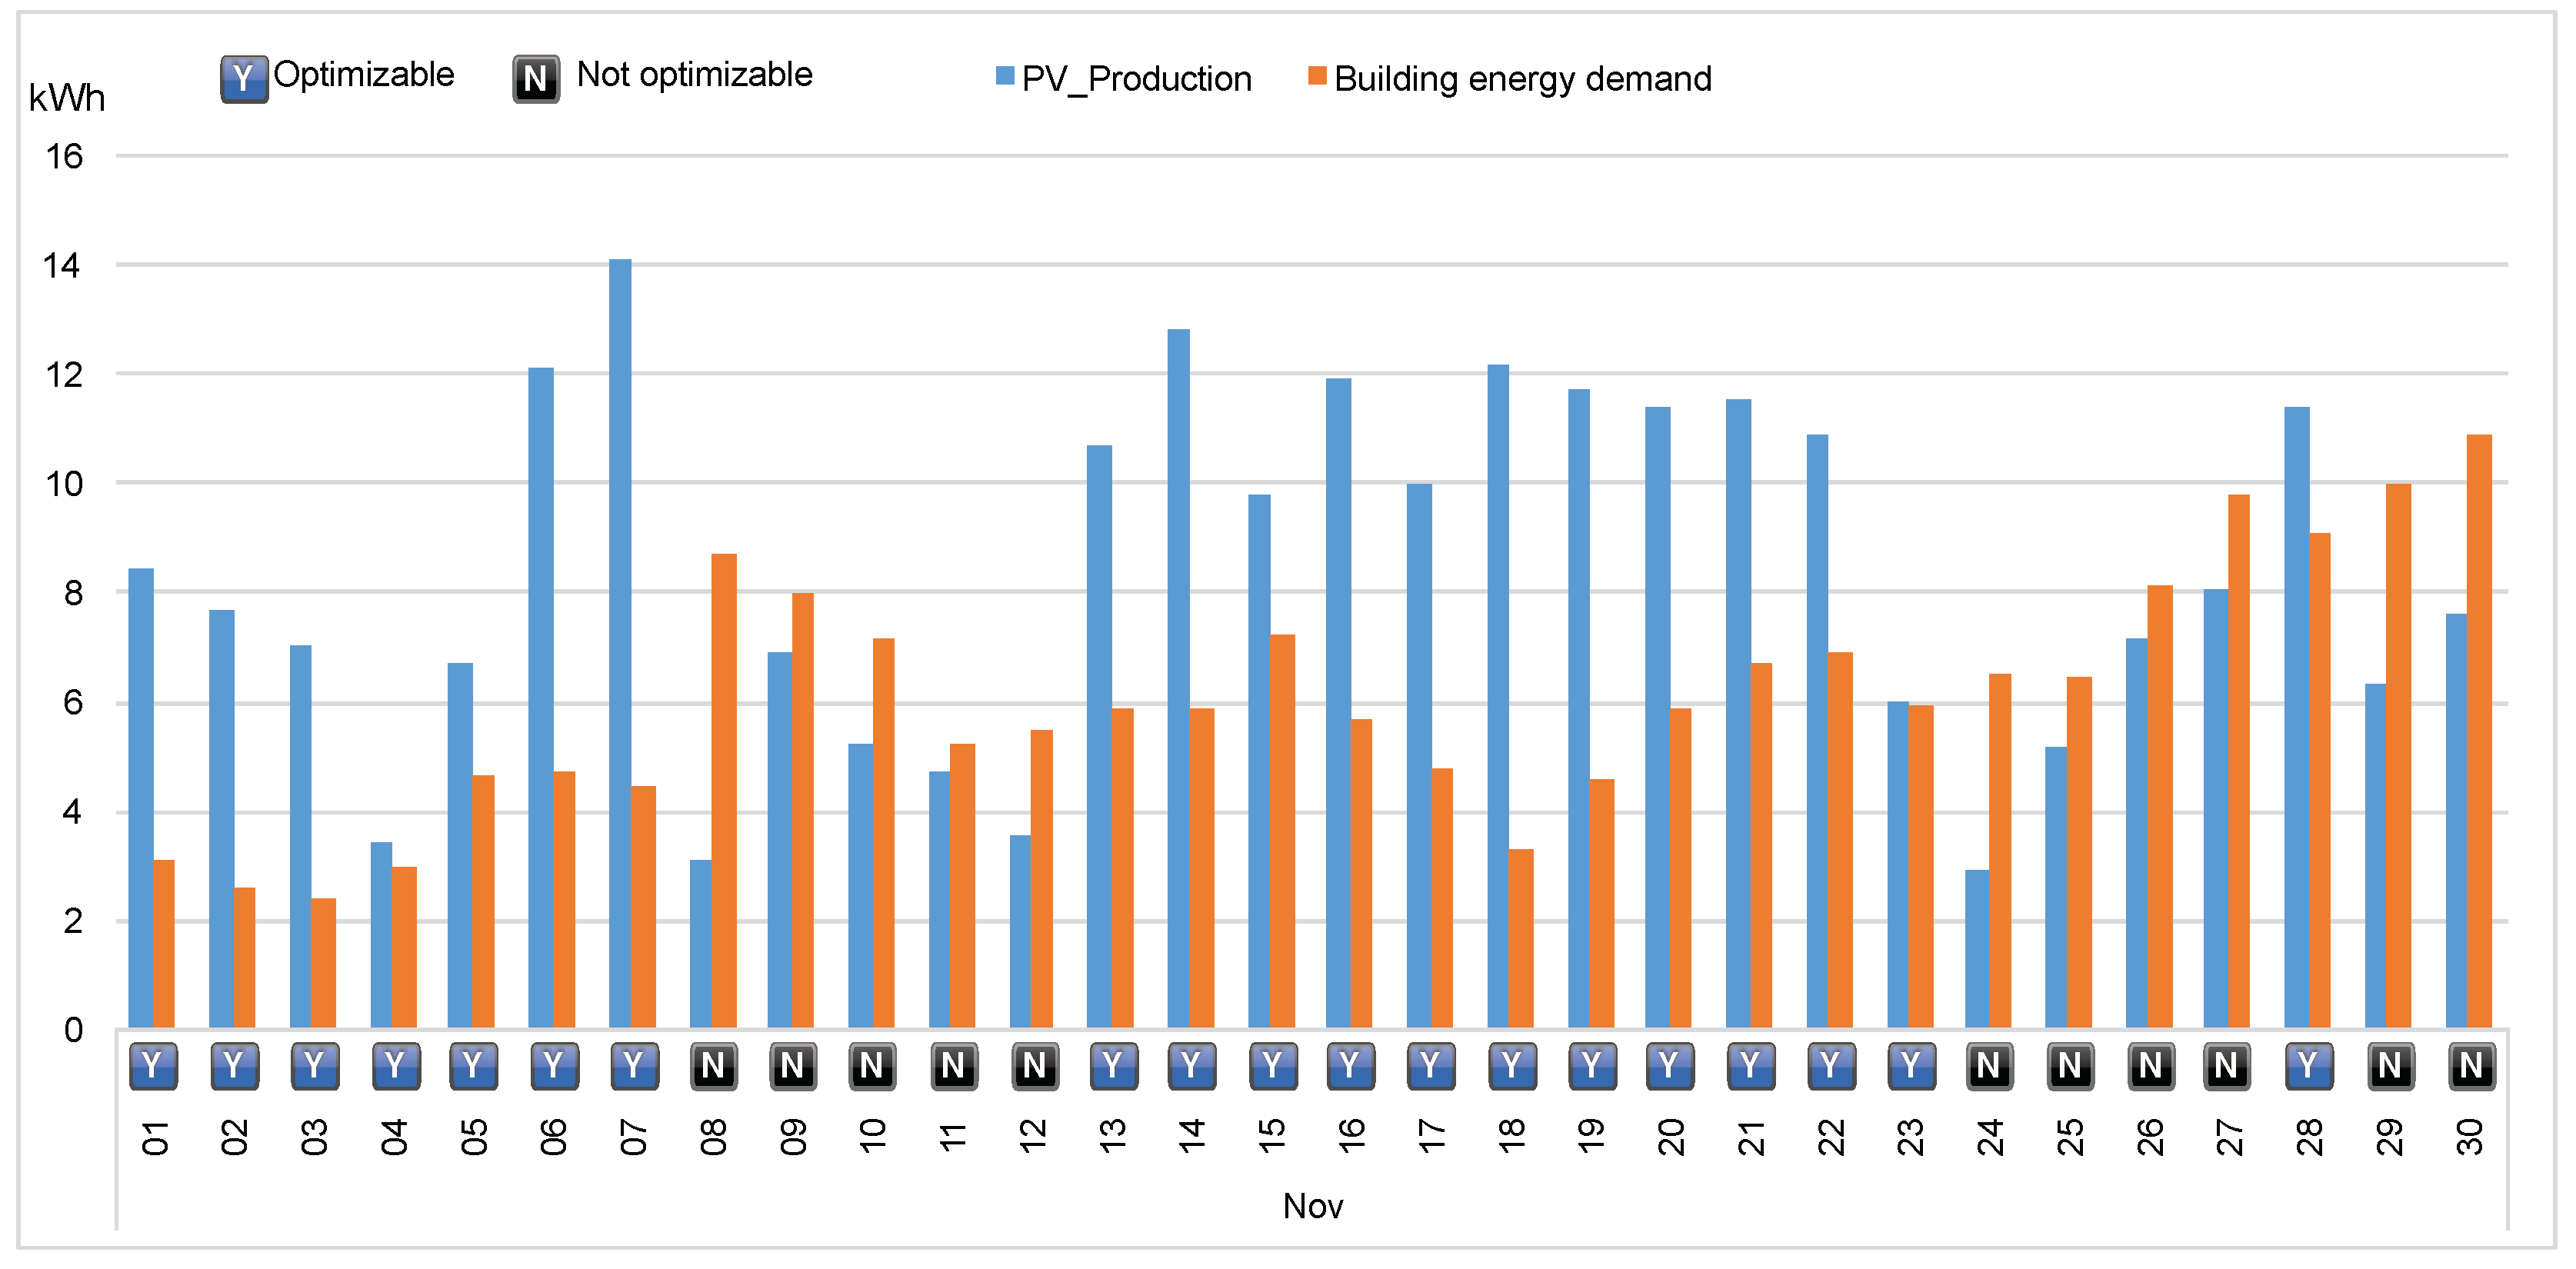
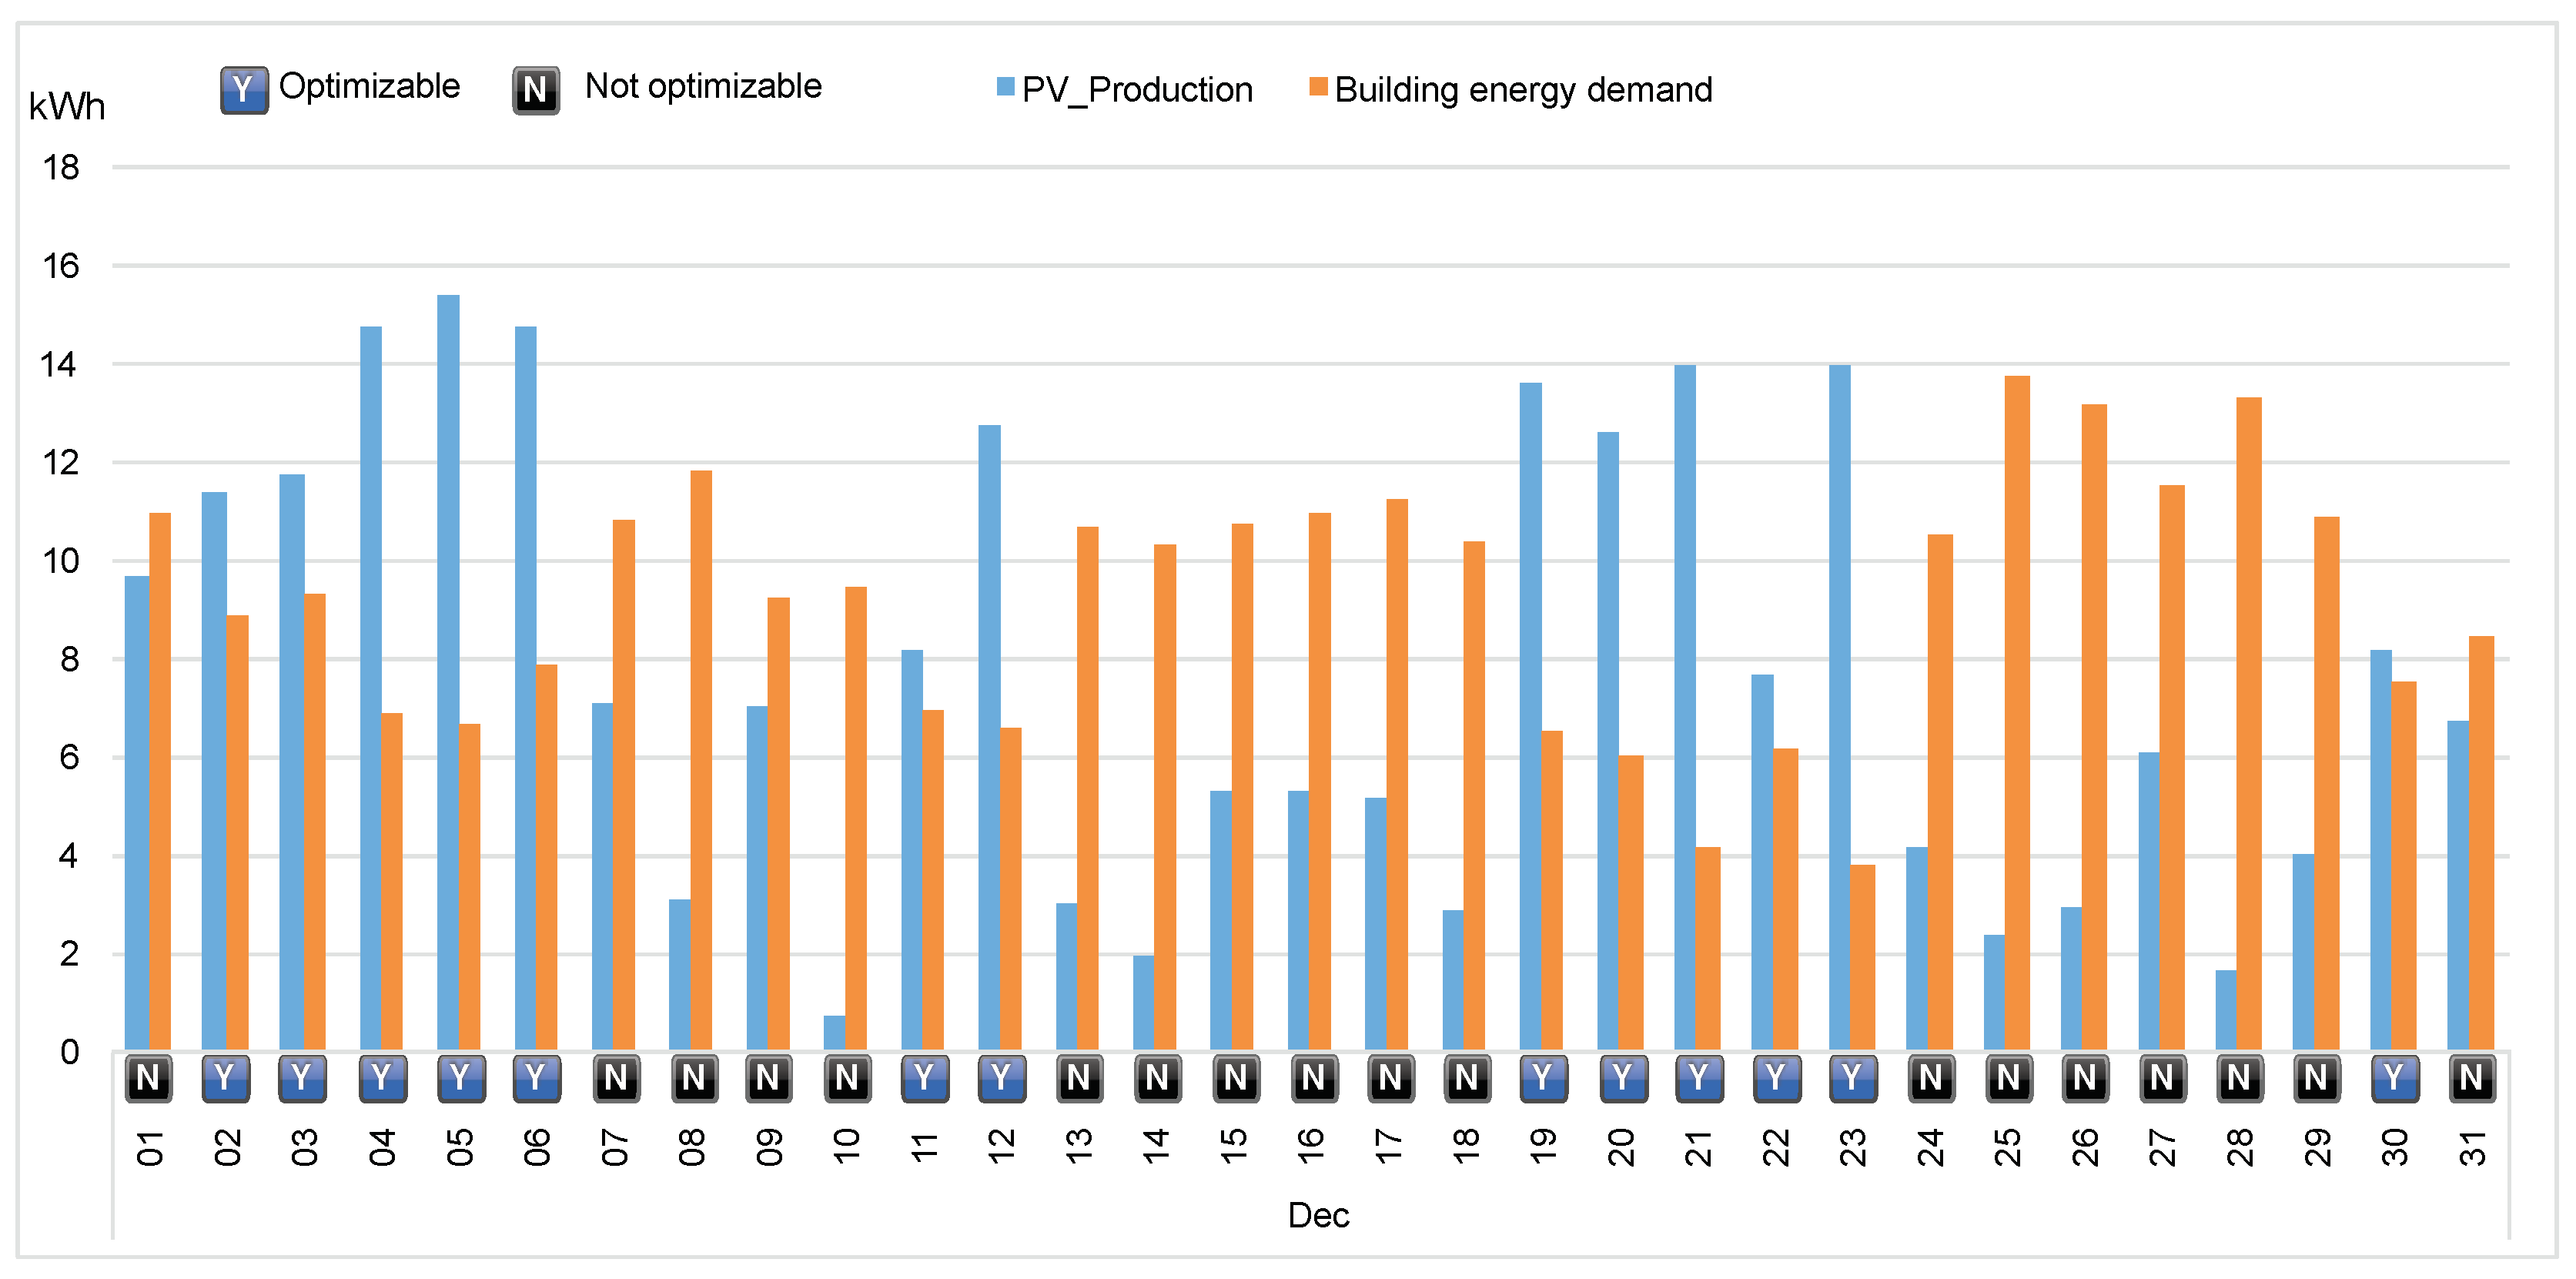
The optimization was carried out during the months of November and December. Four optimizable days (19 and 20 November and 4 and 5 December) were chosen using the criteria of a medium or high heating energy demand (between 4 and 7 kWh per day) and good PV production (between 10 and 15 kWh per day), and two not optimizable days (16 and 17 December) with high heating energy demand (more than 10 kWh) and low PV production (around 5 kWh) were selected. These choices were made to show the depth of the relationship between this optimization process and PV production. The optimization period in each day is 09:00–17:00. Figure 9 and Figure 10 show 18 days in November and 13 days in December that could have been used in this research since they had similar weather conditions.
The study consisted of performing six optimizations using six different days. For each day, three different scenarios were compared: ( a ) scenario 1 ( S C 1 ) is the model without any renewable energy; ( b ) scenario 2 ( S C 2 ) is the model with PV production and a fixed set-point of 20 C; and ( c ) scenario 3 ( S C 3 ) is the model optimized by using maximum PV production with a set of variable set-points between 20 and 25 C. The aim in S C 3 is to overheat the building without risking comfort when renewable energy is available in order to save energy afterward when the grid is needed.

3. Analysis of Results

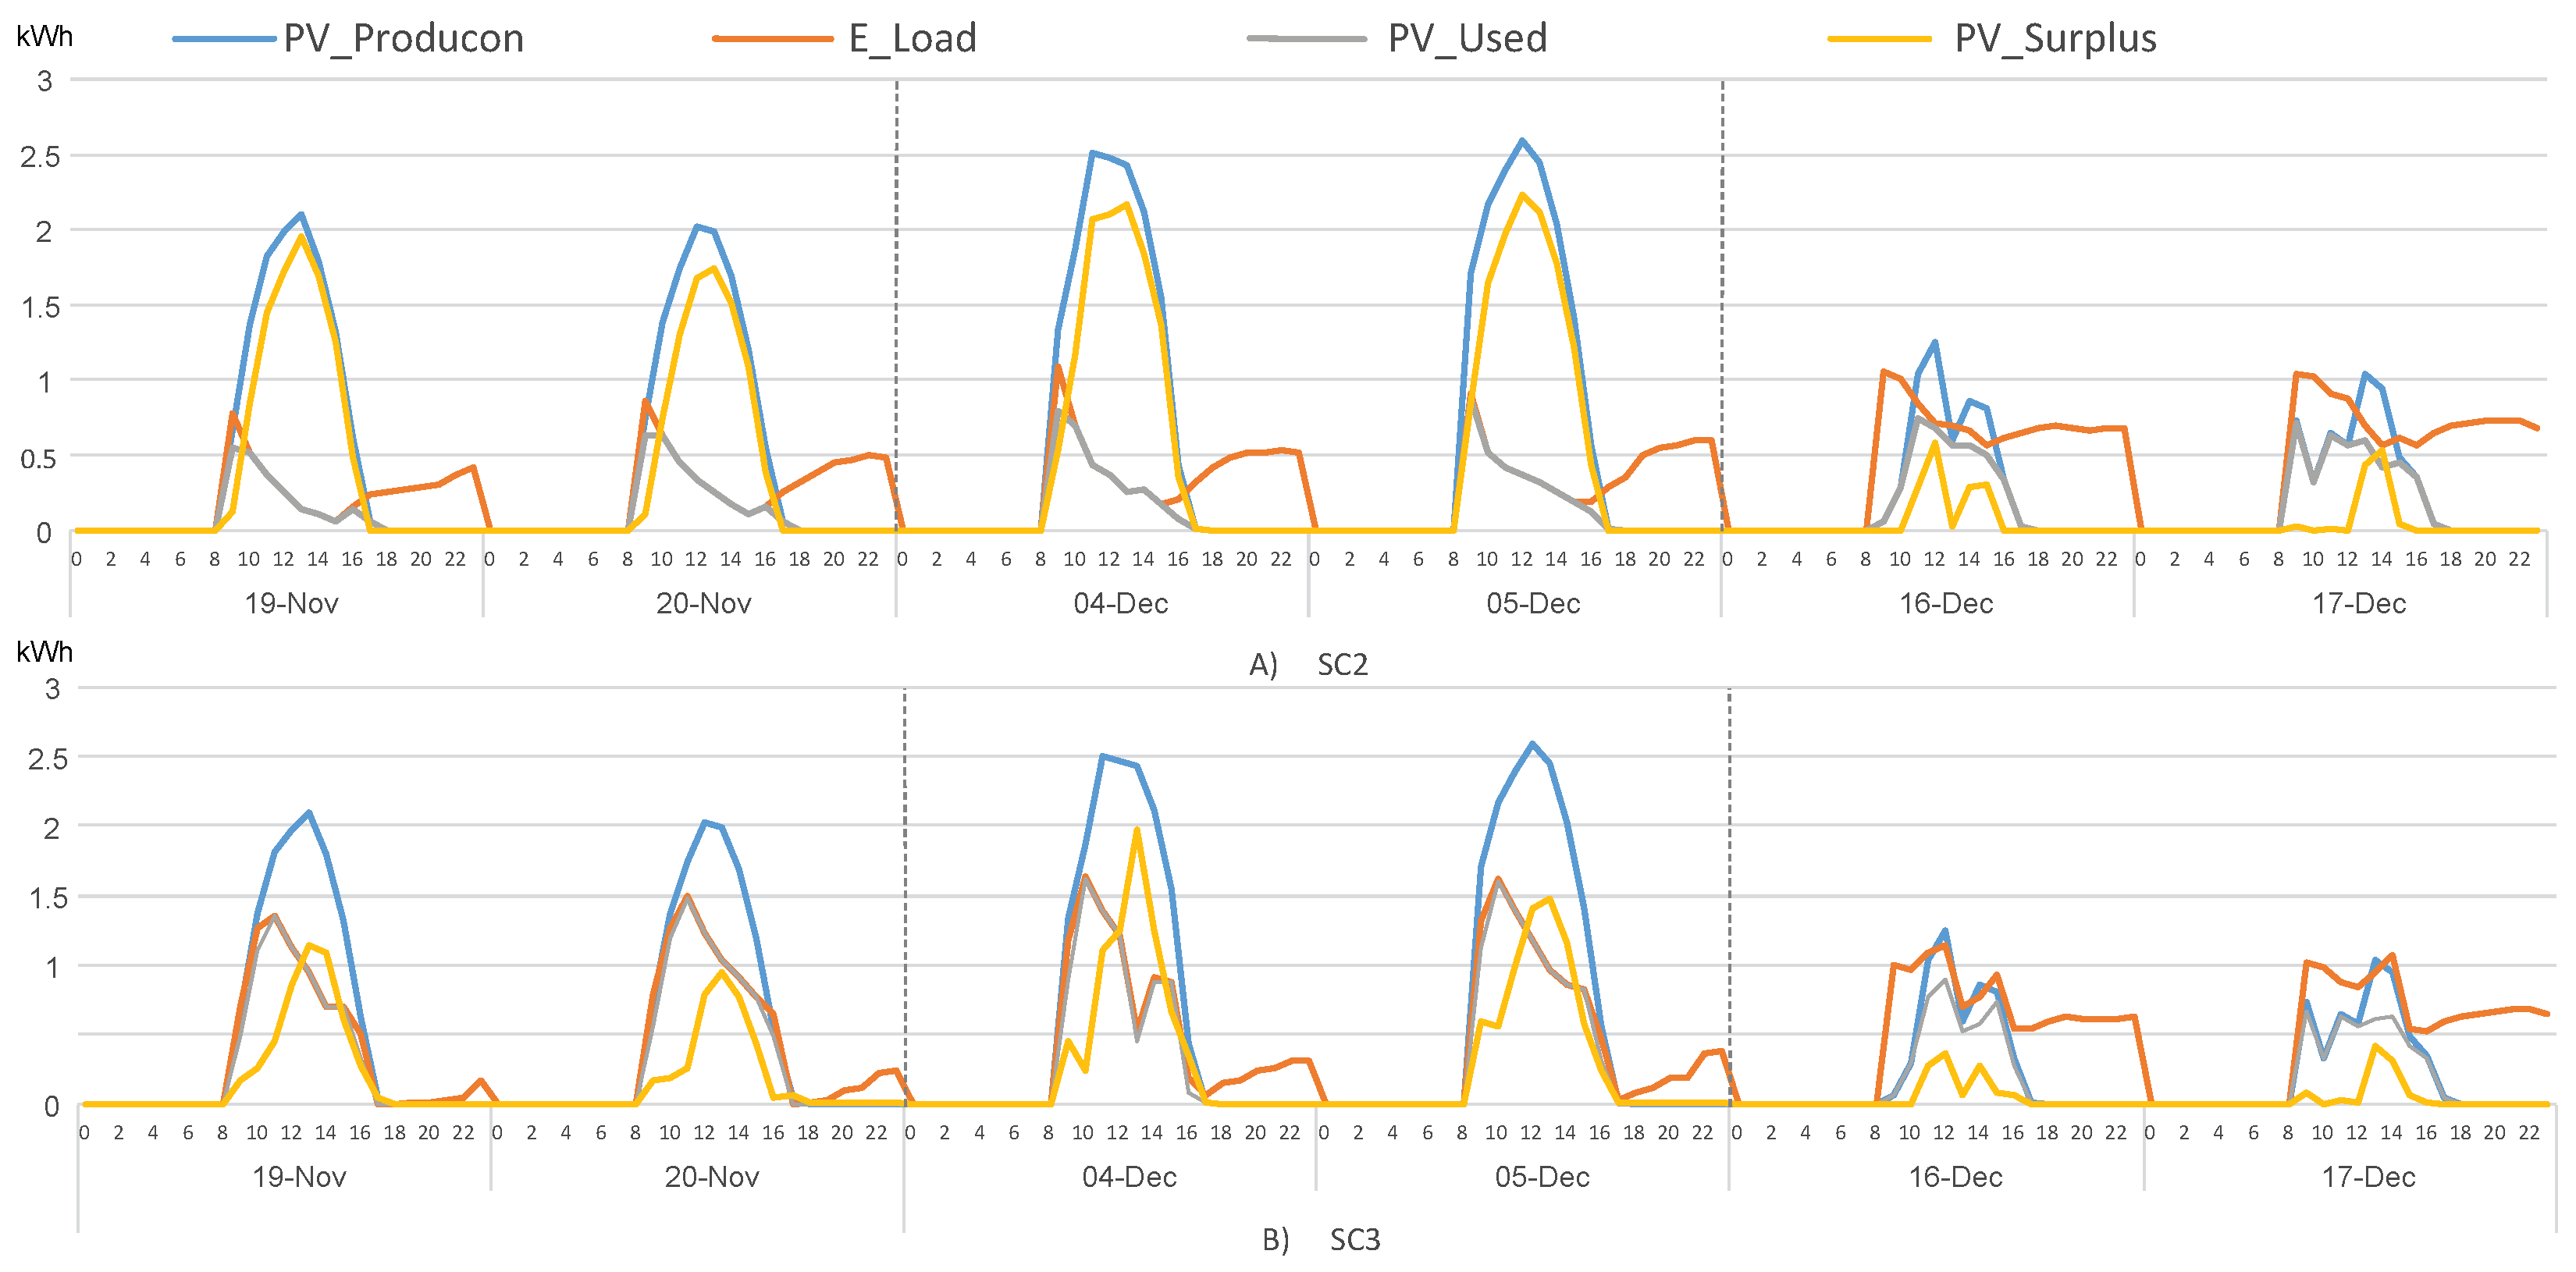
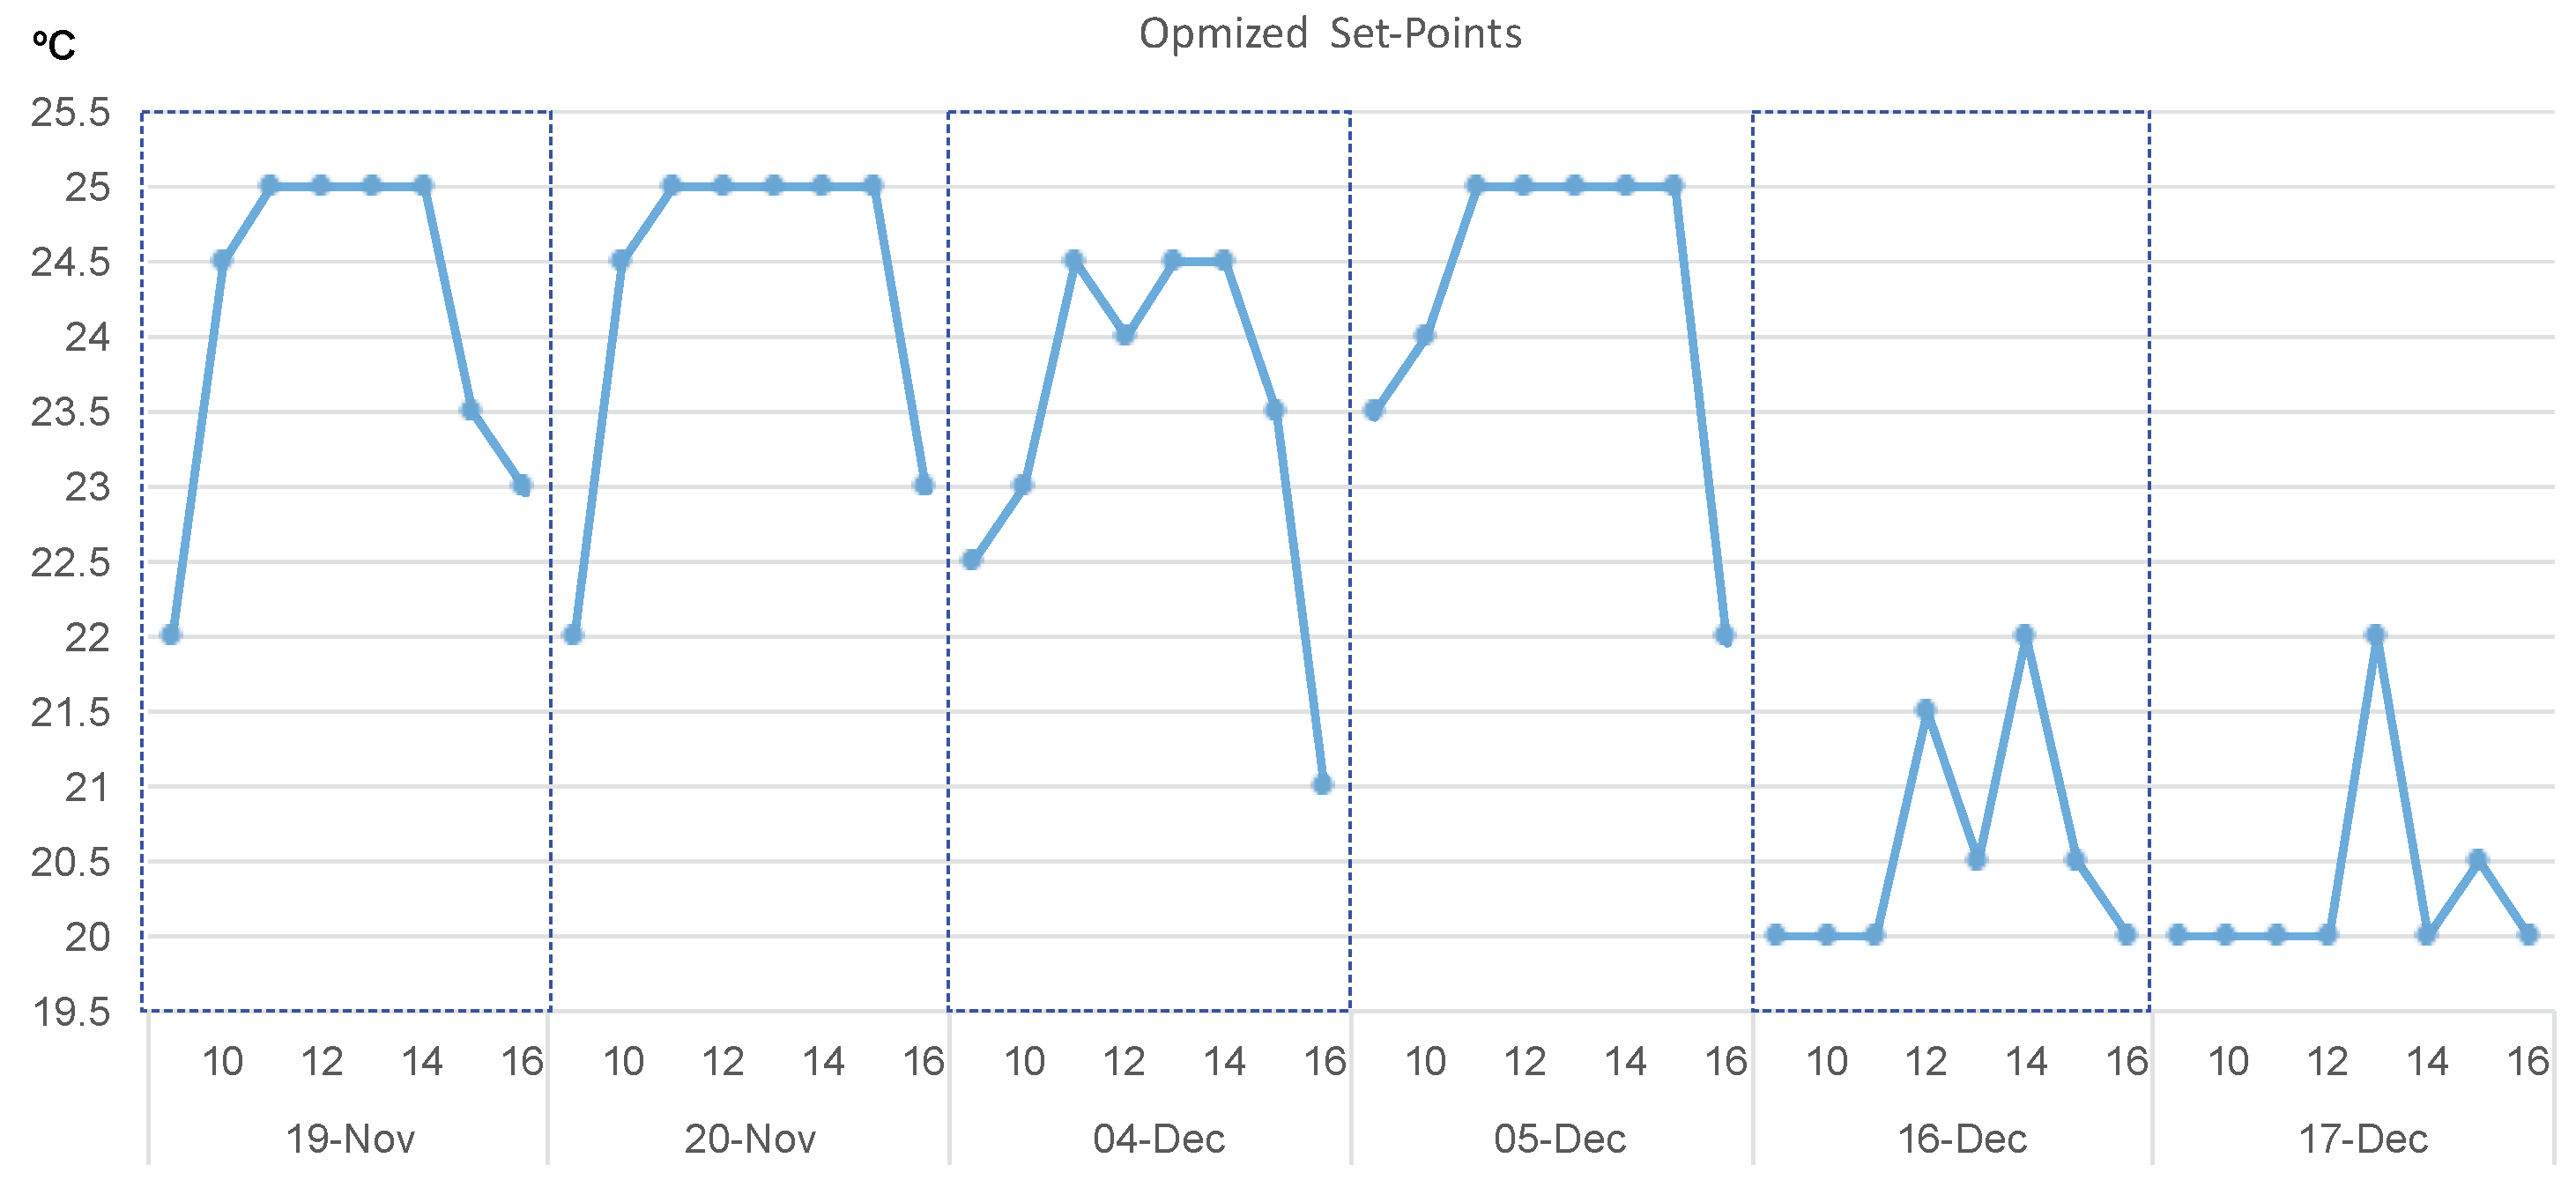
A general overview of the results produced by SC2 and SC3 is shown in Figure 11. When surplus energy from PV is available, the optimization process transform it into extra building energy demand and after sunset this extra energy consumption return to the building to reduce building energy needs. In Figure 12 the set of variable set-points between 20 and 25 C to generate the modulation of the energy available, are shown.
In the following figures a day to day analysis is going to be performed in order to quantify the results of the optimization conducted in this study.
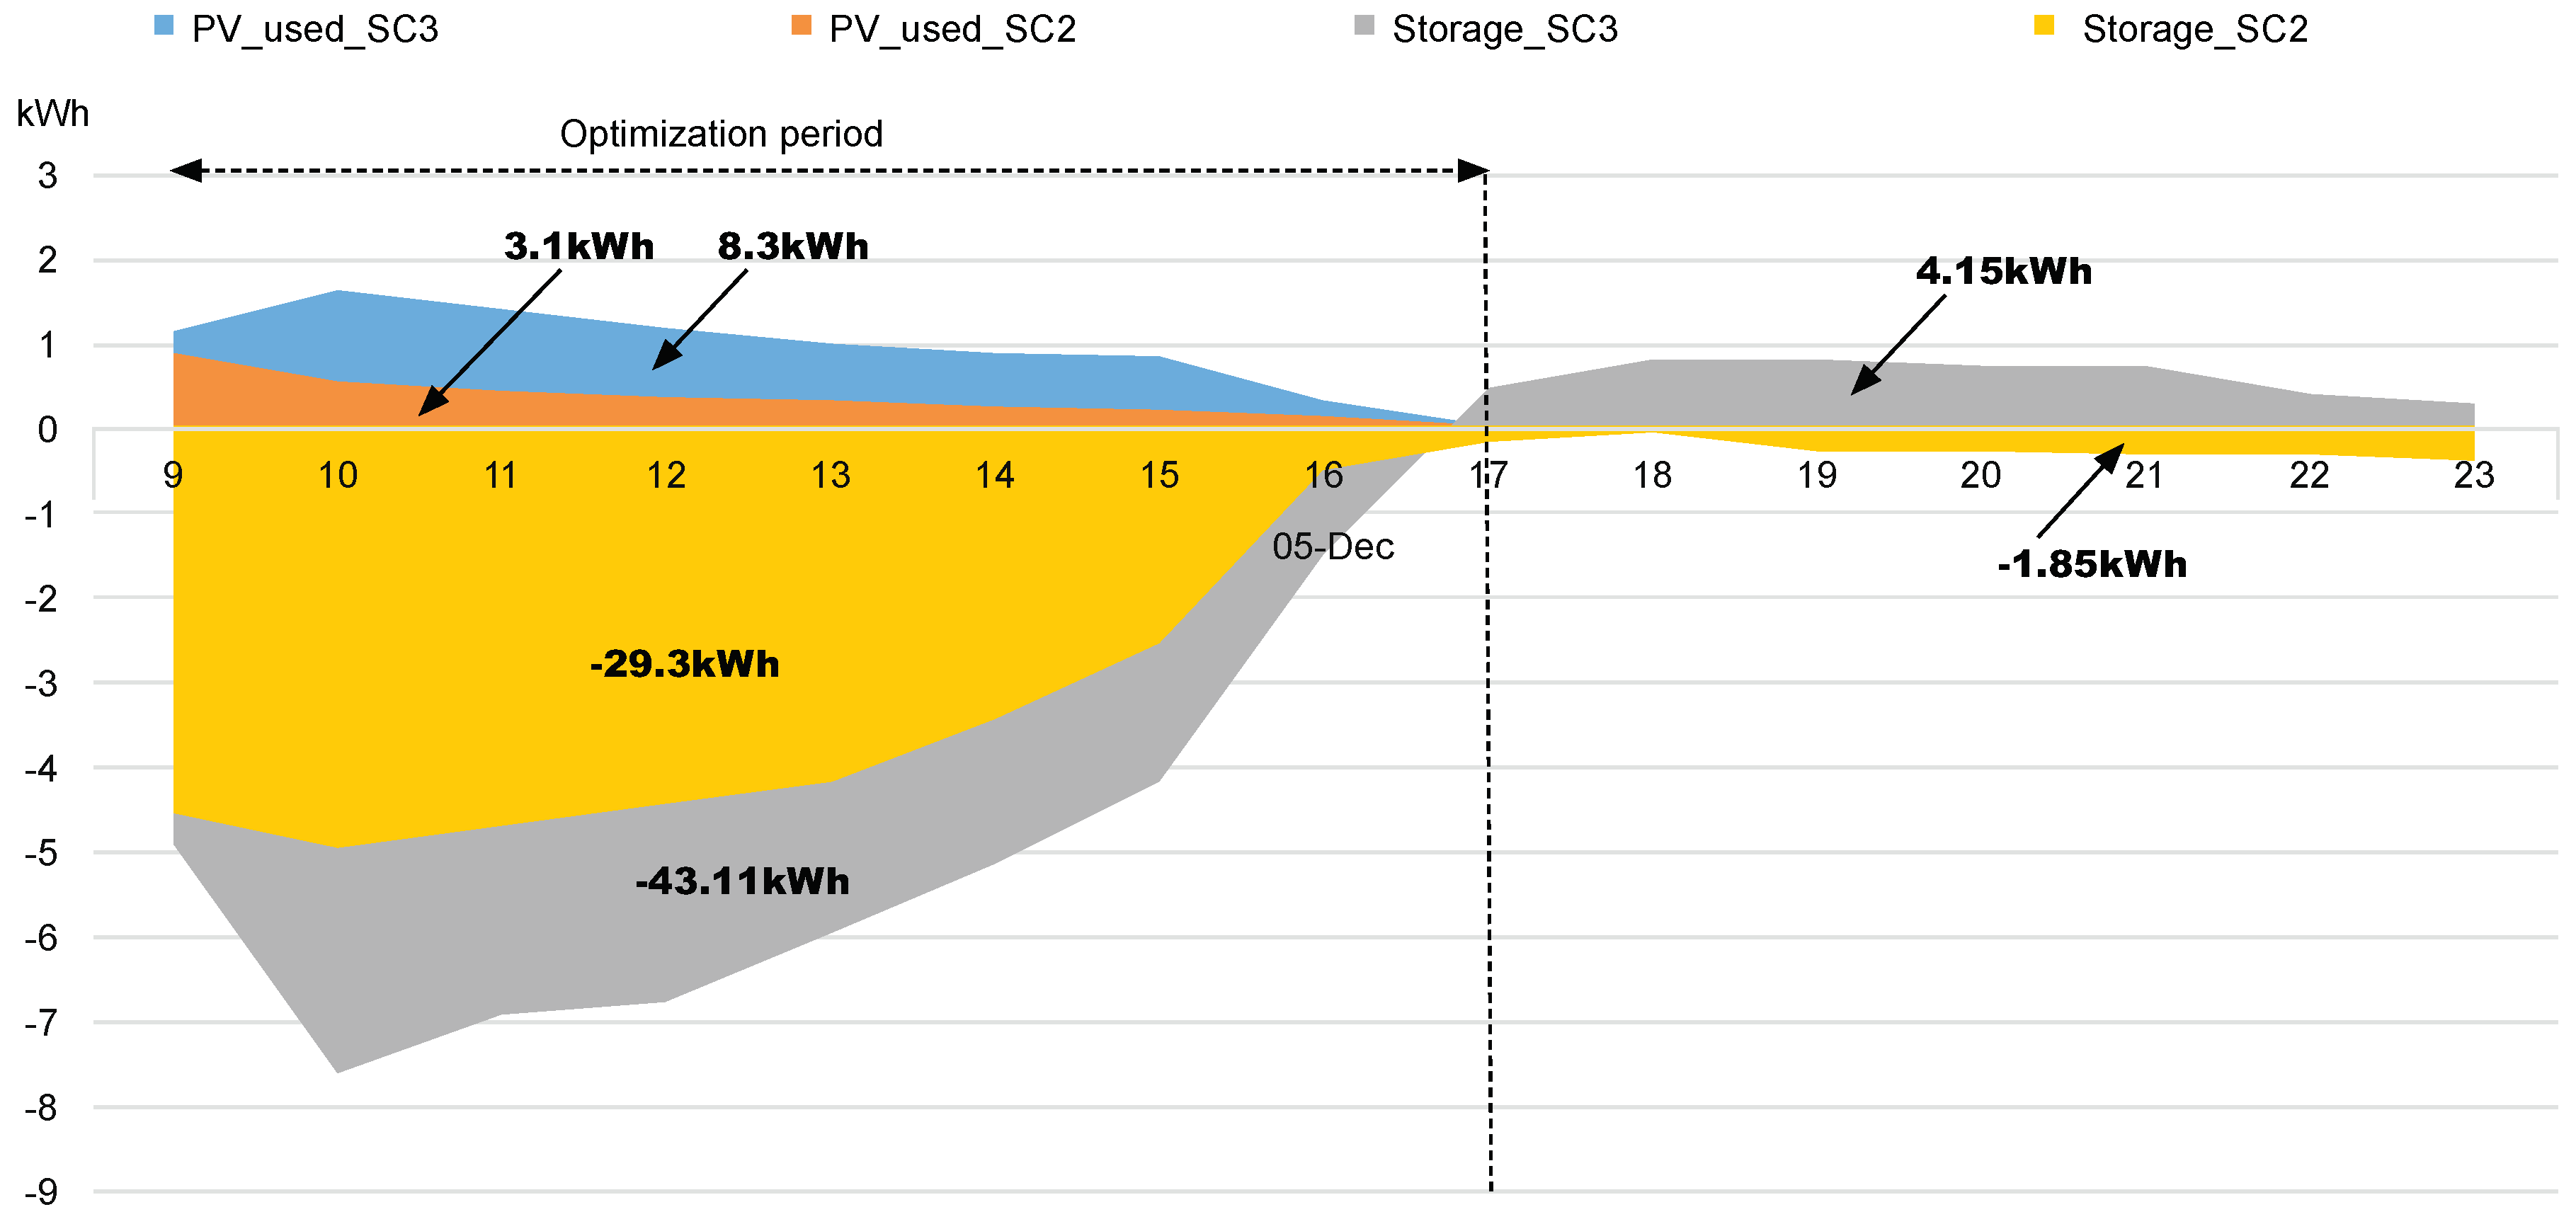
In Figure 13, the optimization process carried out for 5 December is shown in detail to understand its function. The gray and yellow graph shows the thermal mass storage after and before (base case) optimization. The negative sign means that the structure is being charged with energy from the HVAC system, and the positive sign indicates that energy is delivered to the indoor environment. To have a surplus charge, S C 3 (blue graph) consumes more energy than S C 2 (orange graph) from the available PV production. As a result of this extra energy consumption ( 5.17 kWh), after 16:00, the thermal structure of the optimized case (gray graph) returns energy to the indoor environment ( 4.15 kWh, positive sign), causing a reduction in grid energy consumption of 1.85 kWh. On the other hand, the base case ( S C 2 ) continues to consume energy from the environment, and no savings are realized.
Figure 14, which shows the performance for 17 December, demonstrates the result of having no extra PV production ( 0.2 kWh) to be optimized. S C 2 almost achieves the maximum storage capacity, and the optimization process can only slightly increase the PV energy used, but it is not enough to realize an energy profit, and there is no release of energy after sunset. In this example, the optimization process does not work. The same happens on 16 December. Appendix A summarizes the results of all the data from the simulations and the graphs for the other days analyzed.
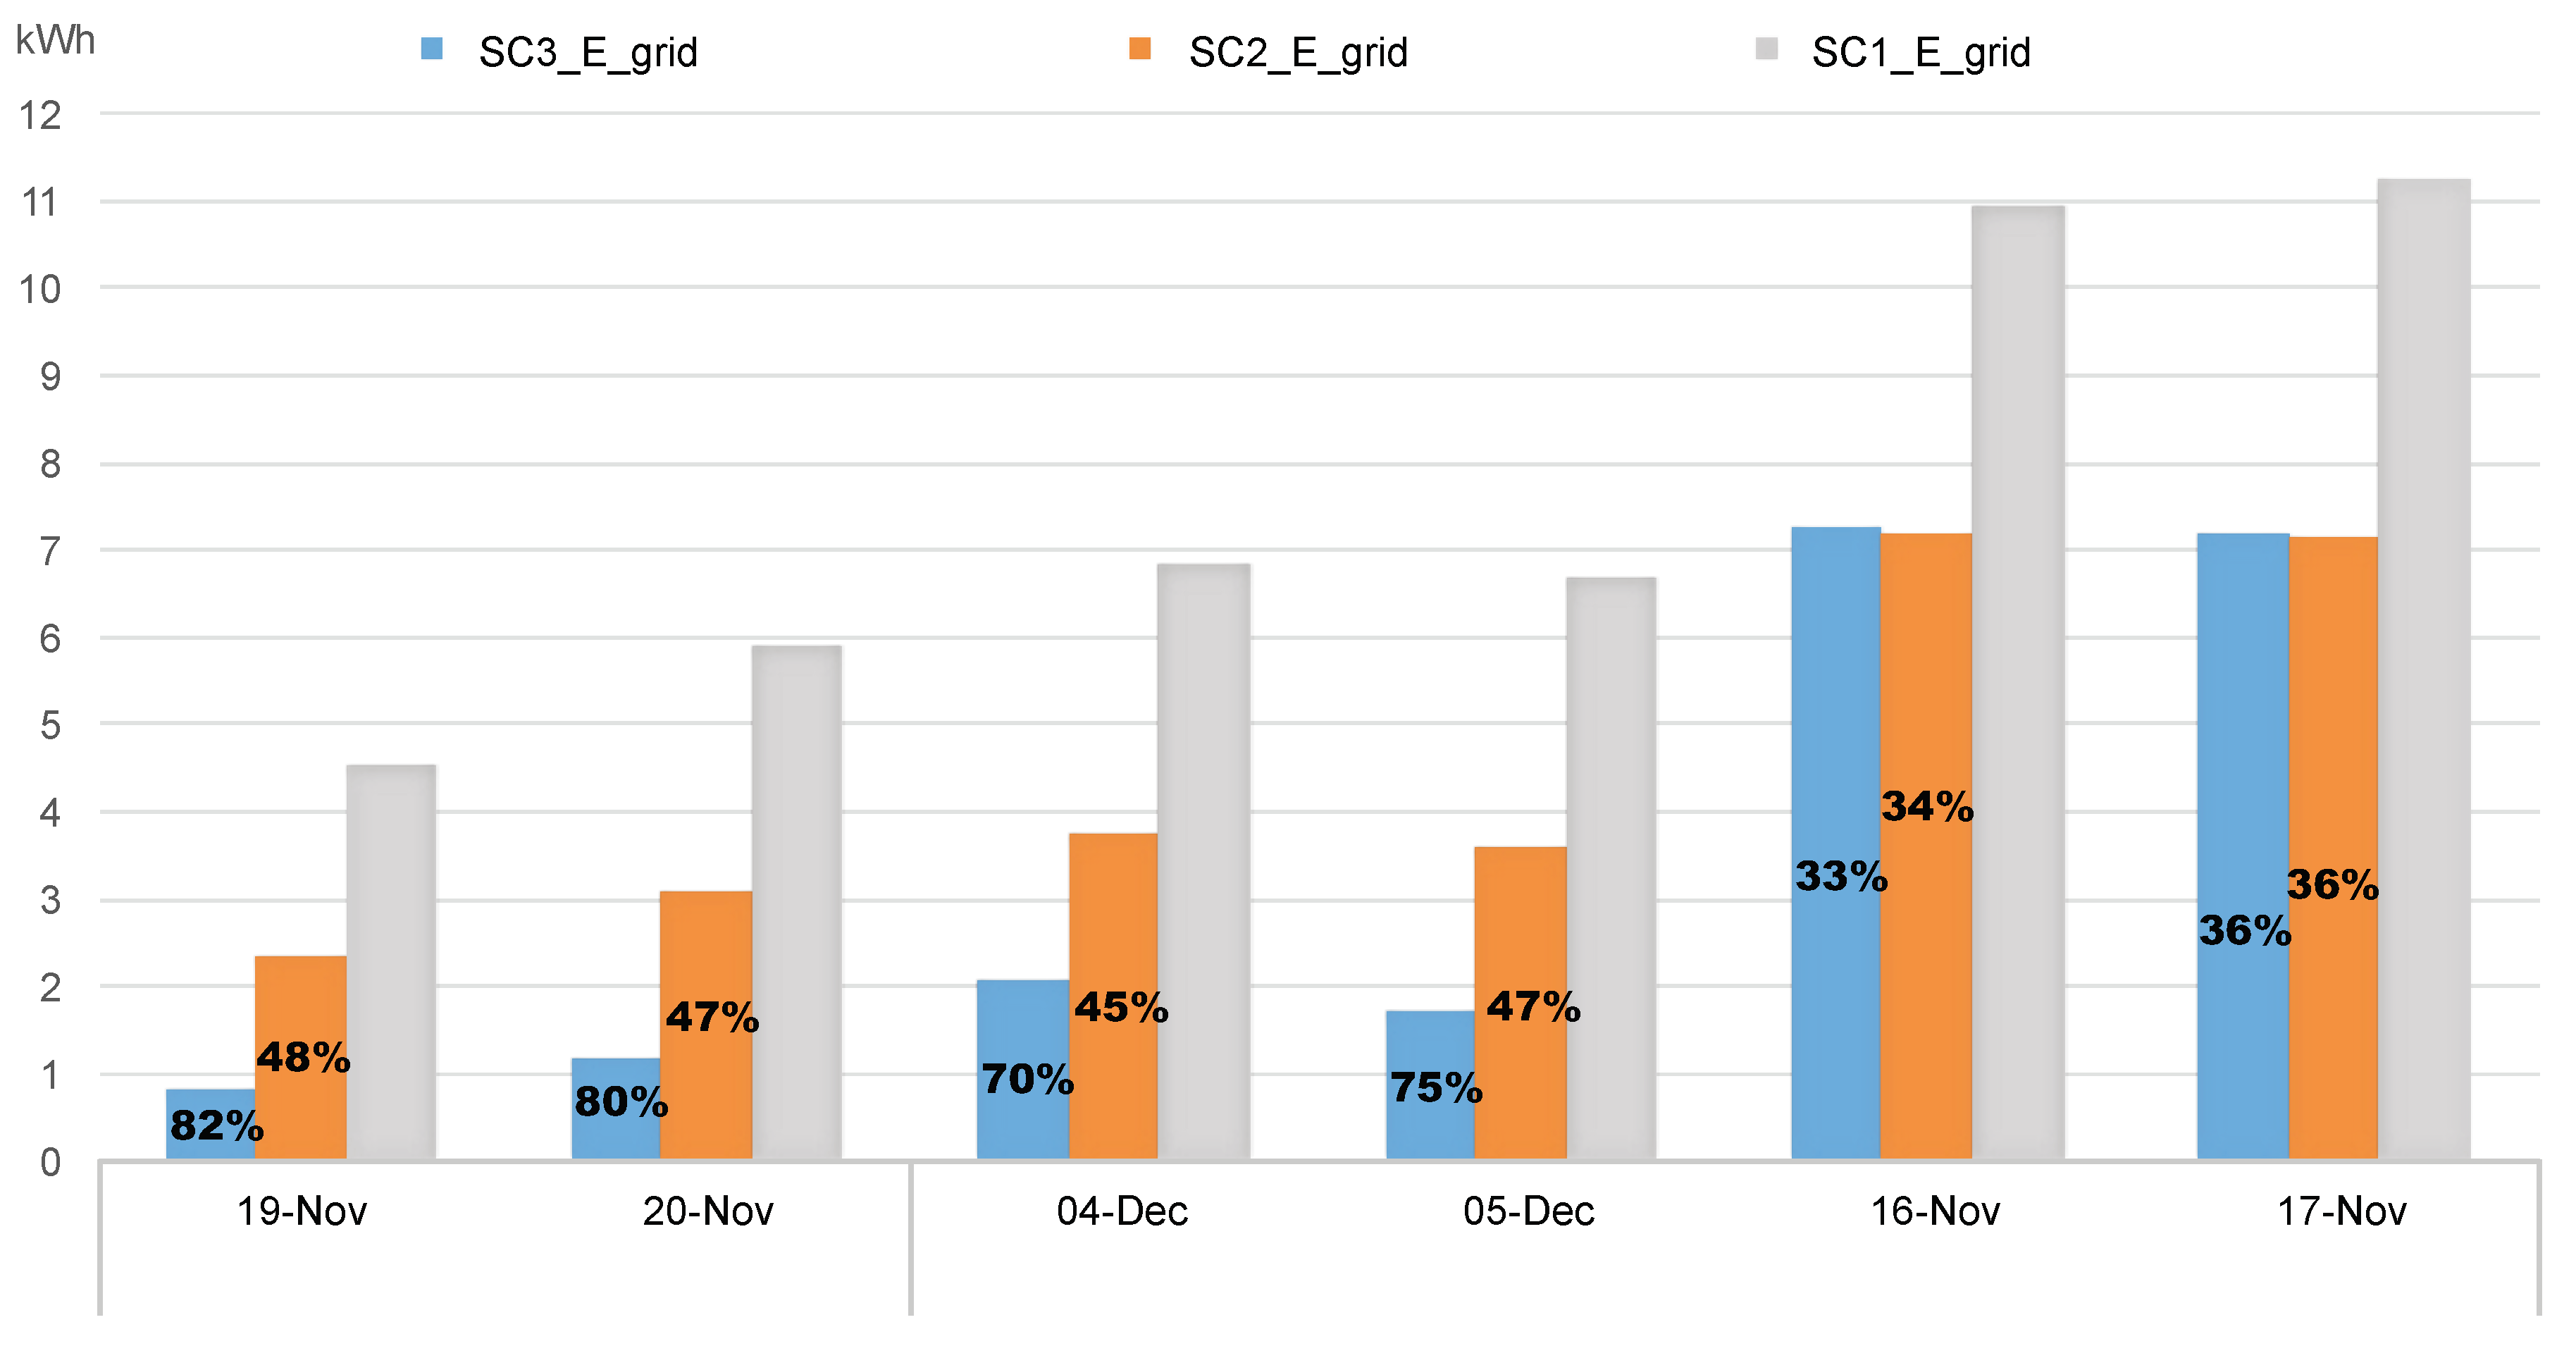
After the detailed analysis of a complete day in a good and bad case to represent similar occurrences on the other days, a more generalized result can be shown. In Figure 15, the effects of the different scenarios are compared for each selected day. Gray indicates the events in S C 1 , orange represents S C 2 , and blue represents S C 3 . As explained previously, two days (16 and 17 December) that lack adequate PV production were selected to demonstrate the consistency of the process. If PV production is low, then energy savings are not possible, so optimization does not need to be implemented on those days. When the weather conditions are appropriate, the energy savings from the main grid range from 82 % to 75 % for the selected days in S C 3 , which is an average increase of 30 % compared with S C 2 .
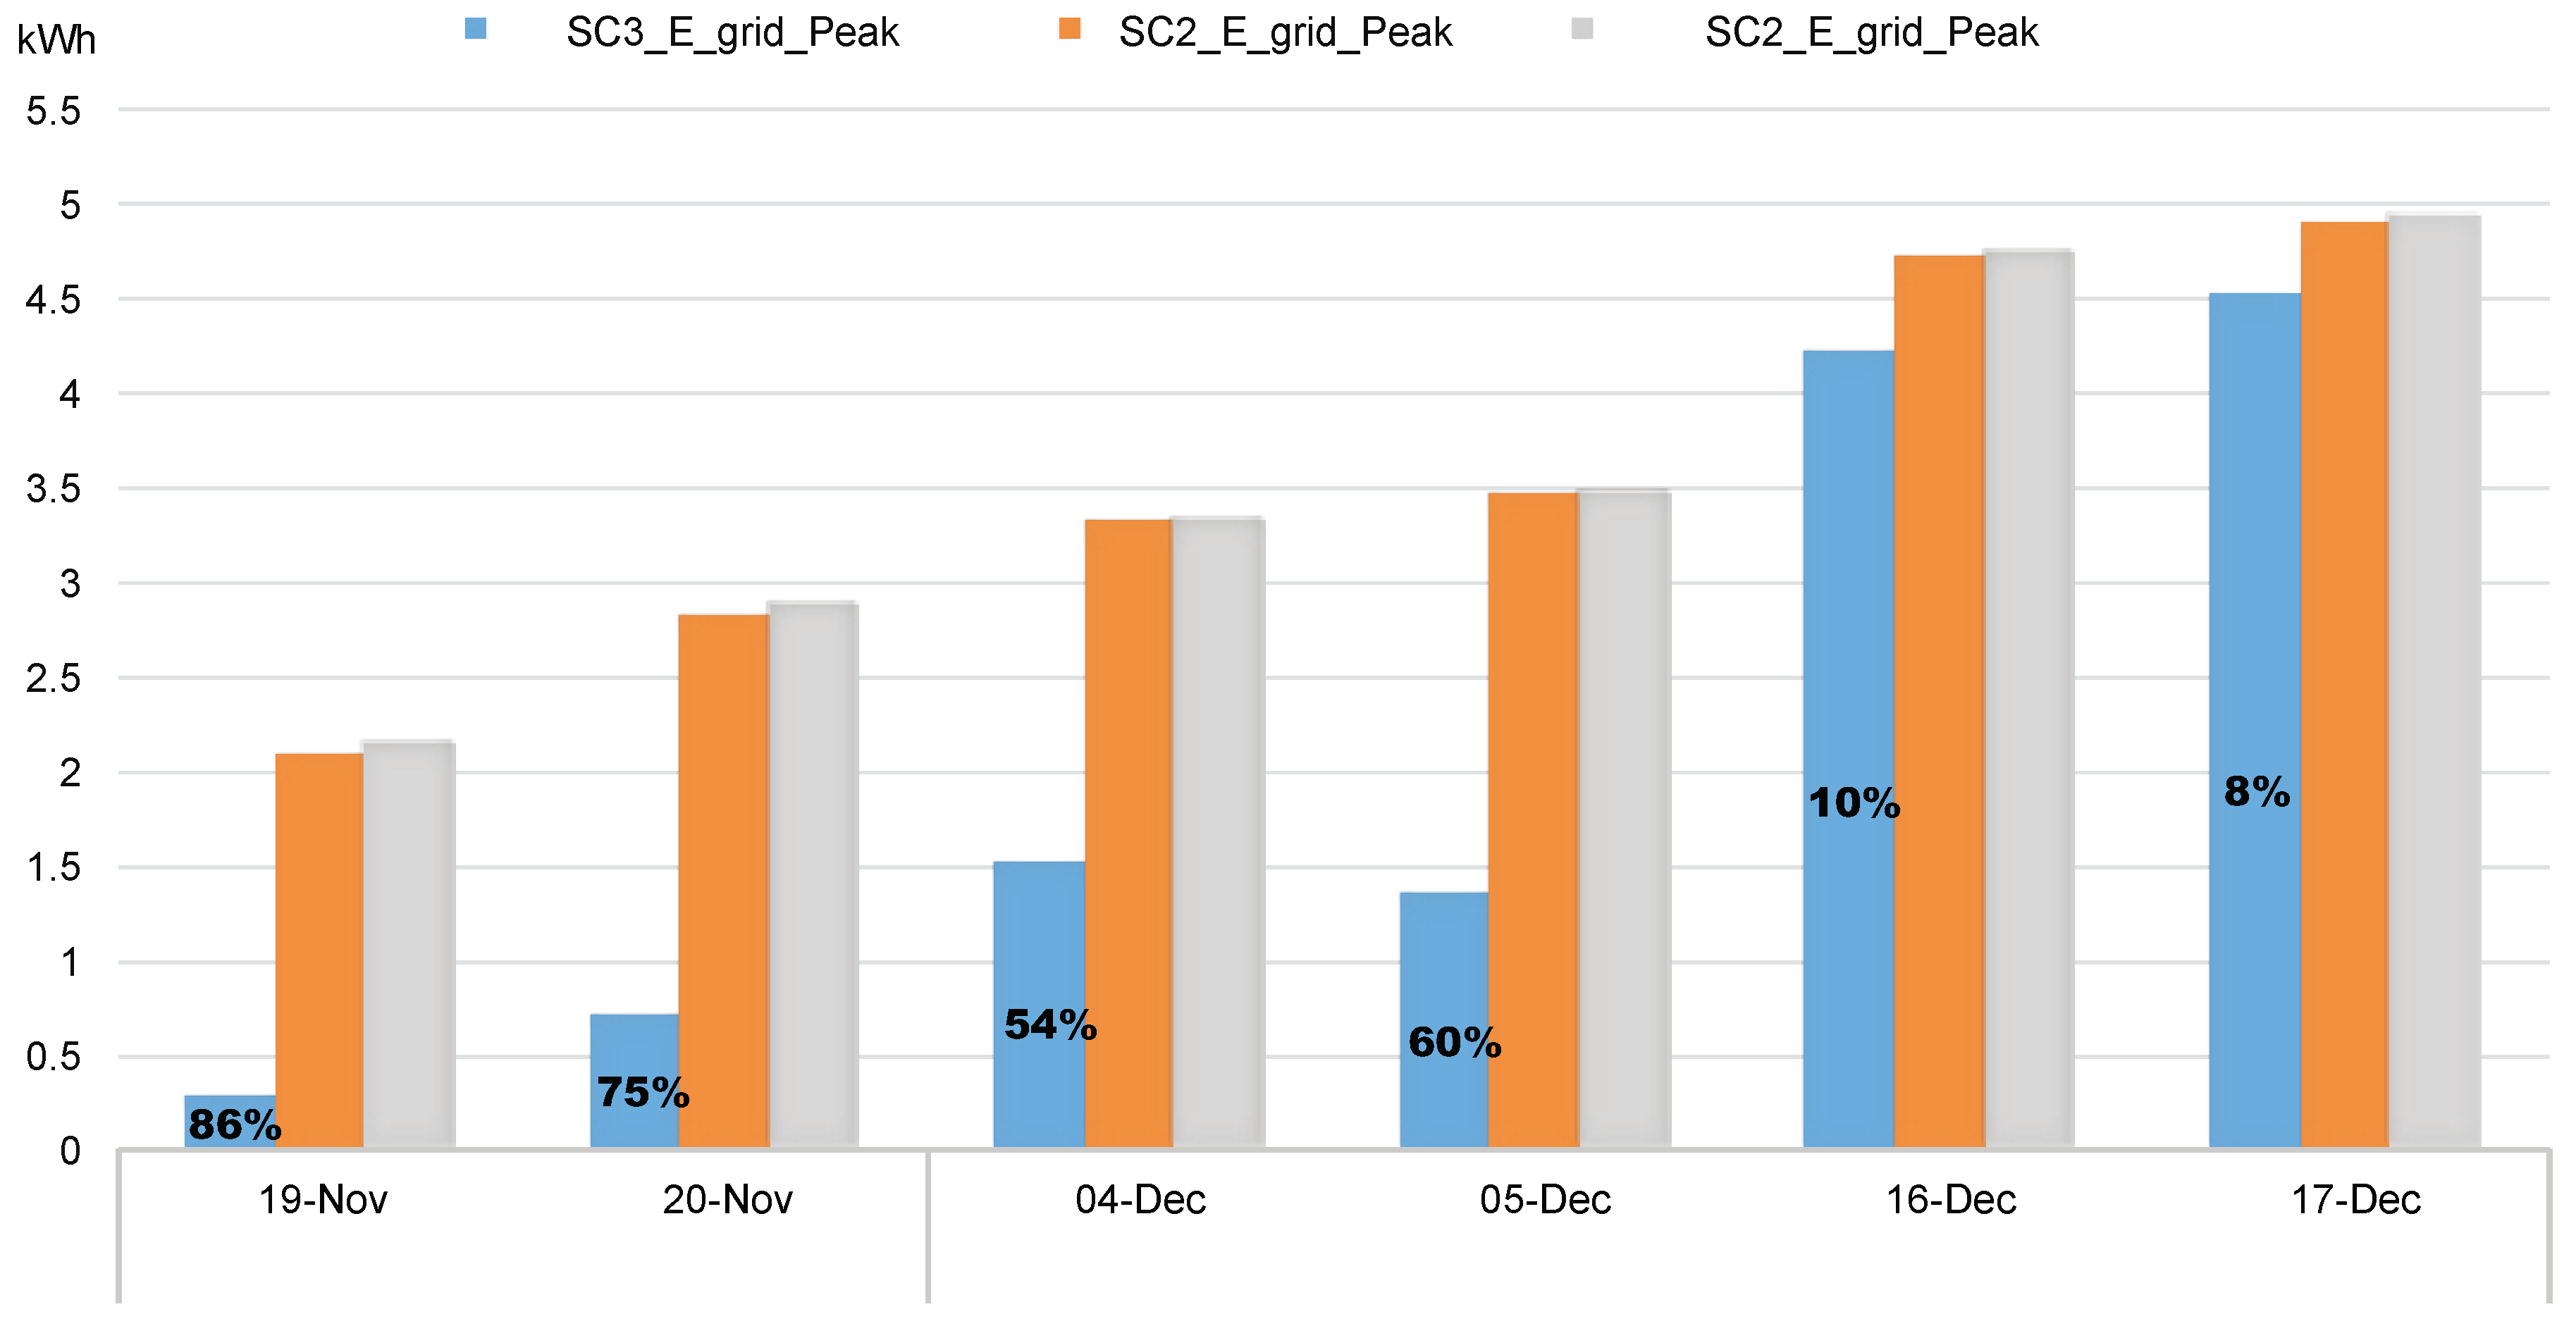
Figure 16 shows a similar analysis, but in this case, the evaluation period for savings is from 17:00 to 23:00. The goal of this analysis is to check the performance of the optimization after sunset. The power of the process is clearer in this example because S C 2 is not able to produce any extra profit. The reason is that the thermal mass activation is not sufficient, and the results are similar to those of S C 1 . These results are very important because they show the potential of the system to shift power from peak hours when energy from the grid is more expensive. The results range from 86 % to 54 % , which is quite remarkable.
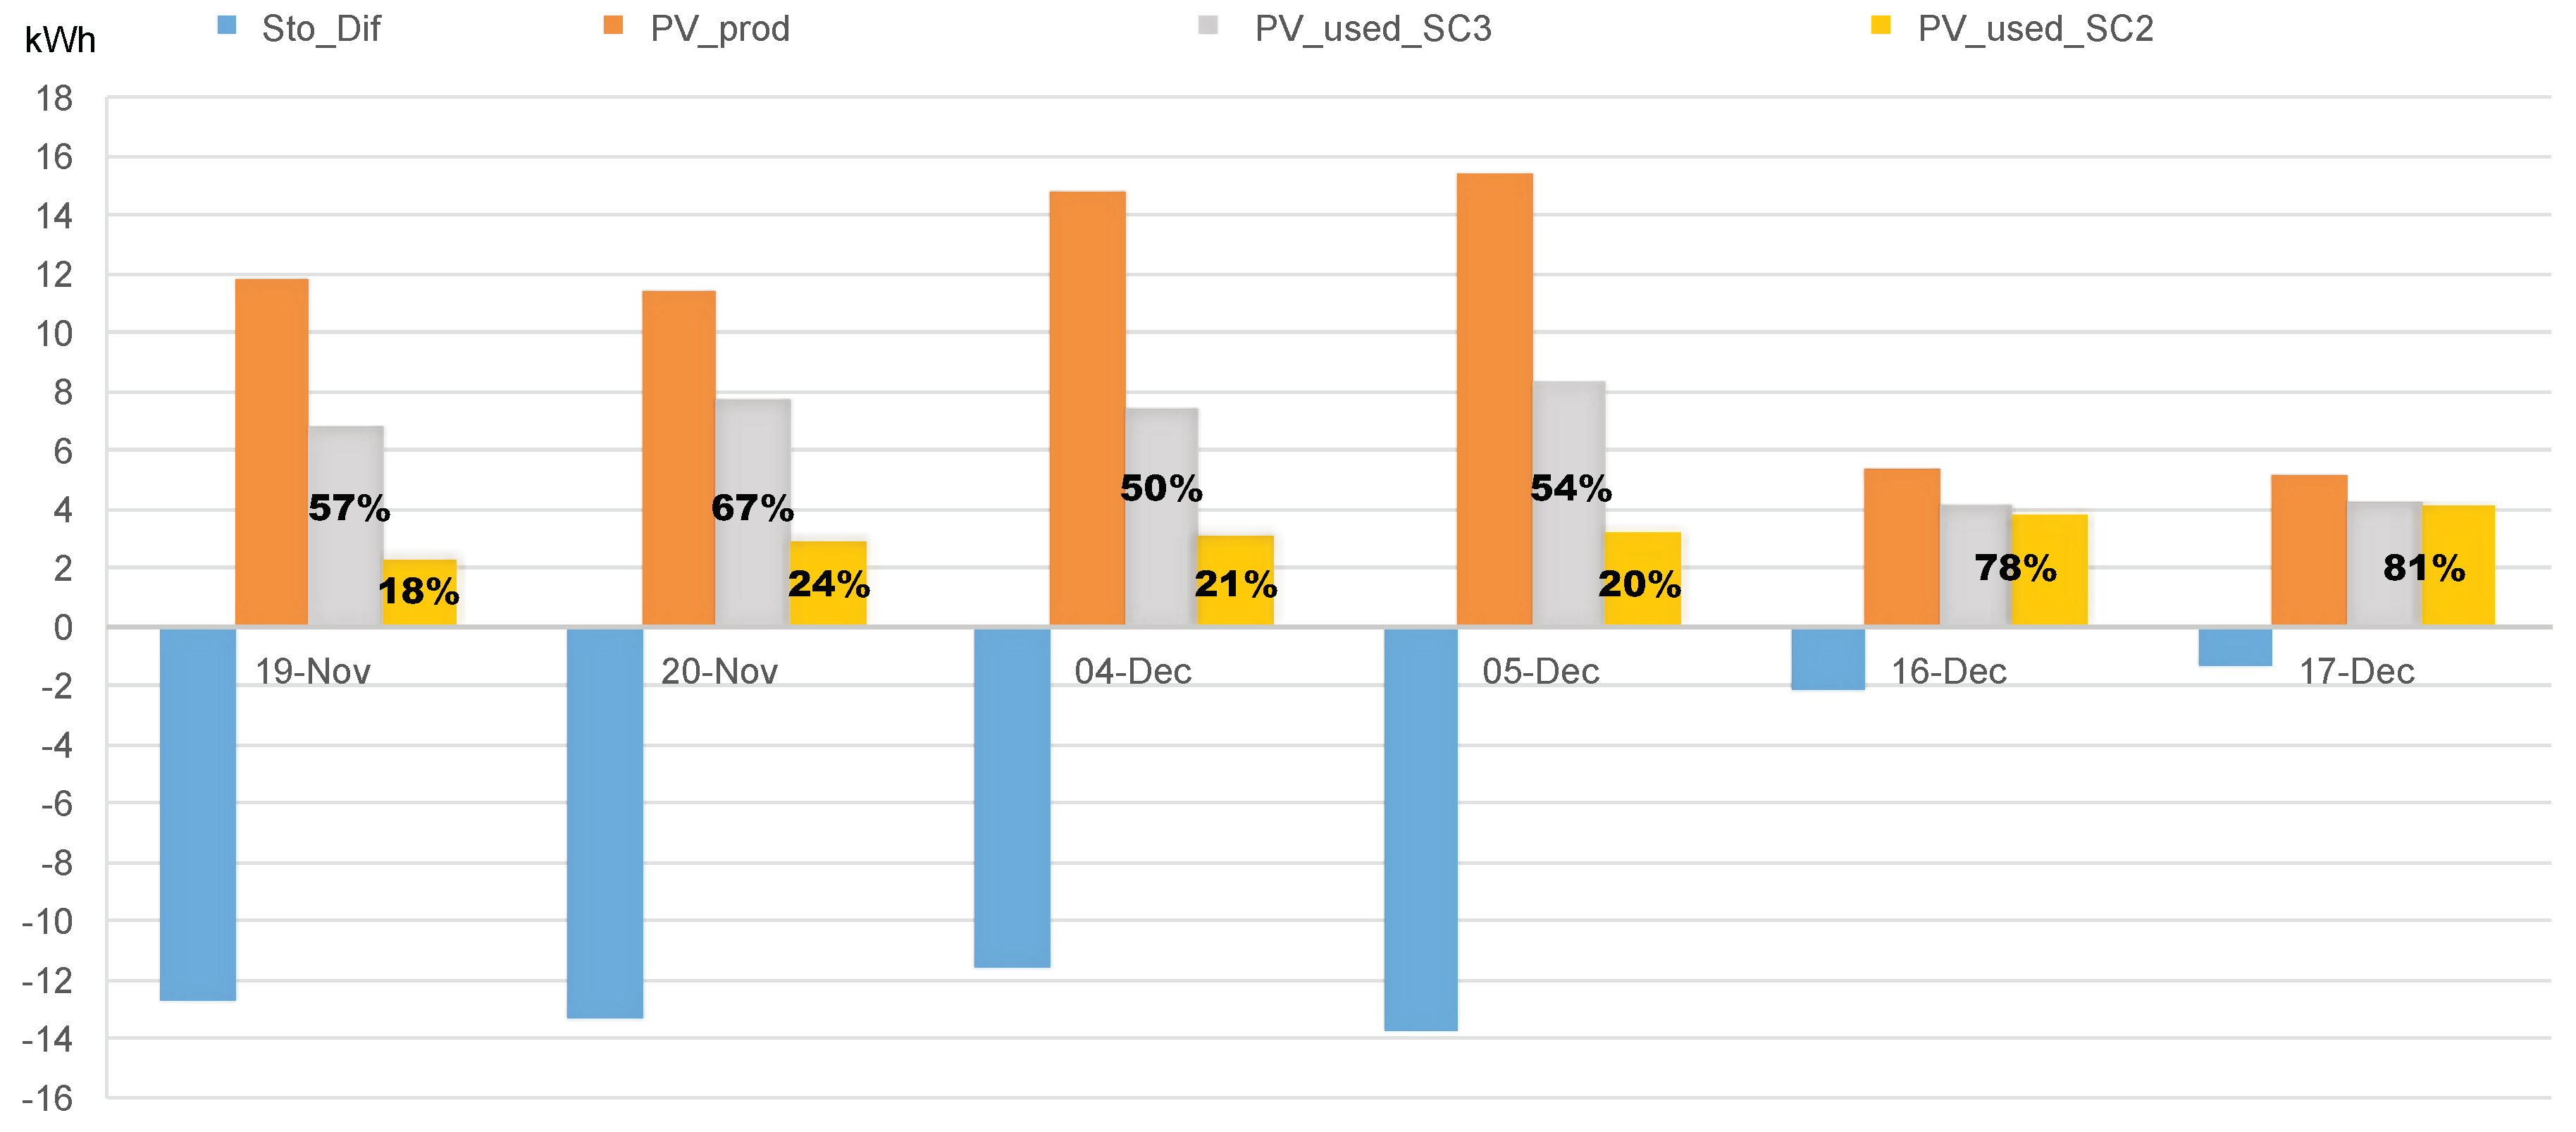
Figure 17 shows the evaluation of each day to compare the relation between energy storage in the thermal mass and the amount of extra energy needed to produce it. The difference in the energy used comes from using more energy from PV in the case of S C 3 . The thermal storage in the figure is the difference between the thermal storage of S C 2 and the thermal storage of S C 3 , and it represents the increase in thermal storage due to the optimization. The maximum amount of thermal energy storage is about 13 kWh, which is achieved by expending around 4.5 kWh of electric energy. Therefore, the average ratio between energy storage and the extra PV used is around 2.8 kWh. In the days with low solar radiation, there is no difference between the two scenarios ( S C 2 and S C 3 ) because no extra energy is available. It is noteworthy that similar values of extra PV consumption (around 4.5 kWh) produce a similar amount of thermal storage in the building (around 13 kWh) and savings, which range from 1.5 to 1.83 kWh. No more energy can be used despite having extra PV energy production, which is related to the maximum set-point allowed, 25 C.
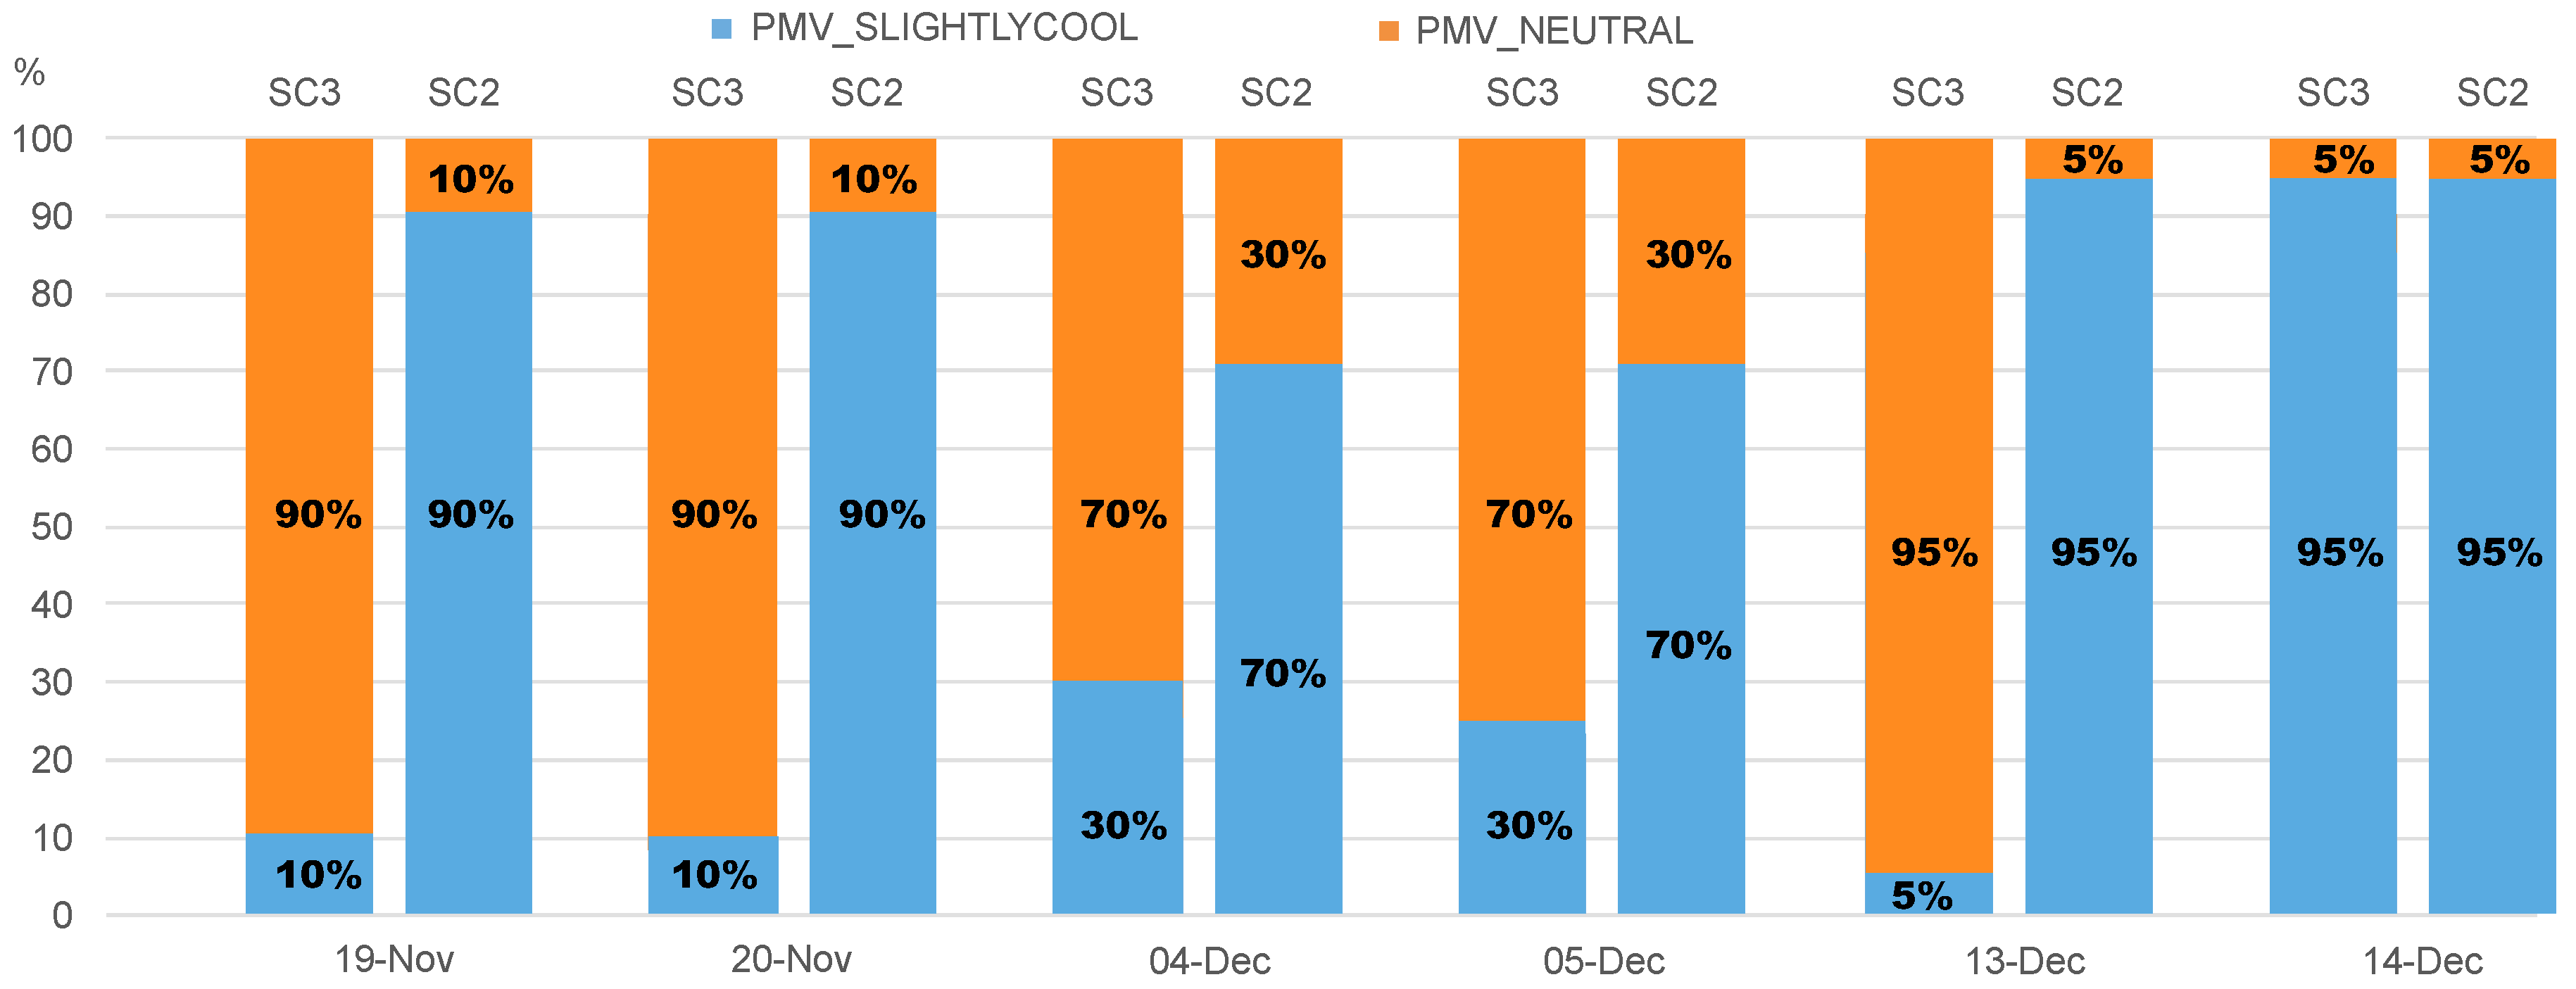
In addition to the better energy results, the optimized scenario ( S C 3 ) improves the comfort levels inside the dwelling [50]. Figure 18 shows the predicted mean vote (PMV) [51] for the period of optimization that corresponds to the period involving PV production considering 1 c l o of clothing insulation (a winter business suit [41]). “The PMV index predicts the mean response of a large group of people according to the ASHRAE thermal sensation scale” [41]. This is a numeric scale in which each value represents the thermal sensation, and it ranges from 3 (cold) to + 3 (hot). The comfort zone usually varies from 1 (slightly cool) to + 1 (slightly warm), and 0 (neutral) is the perfect condition. In general, the usual values for winter and summer for energy savings are 1 and + 1 , respectively. As can be seen in Figure 18, for 19 and 20 November and 4 and 5 December, the optimized model ( S C 3 ) reverses the number of hours in which the building temperature is slightly cool, increasing the number of hours of neutral temperature (perfect comfort zone). This is because of the increasing set-point temperature after the optimization. In contrast, for the 13 and 14 December, since there is little possibility of optimization, the values are basically the same.

4. Conclusions and Future Work

This paper presents a case study to demonstrate the optimization of a building’s energy storage capacity ( S C 3 ) for a group of selected days in winter. The results show that dependence on energy from the grid can be reduced in S C 3 by 45 % 65 % compared with S C 2 and 70 % 80 % compared with S C 1 . The methodology consists of applying an optimization process to obtain a set of HVAC temperature set-points (between 20 and 25 C) for the hours of HVAC operation when renewable energy produced by PV in situ is available. The objective is to increase the in situ renewable energy penetration, which increases in the range of 29 % 43 % when comparing S C 3 with S C 2 . Similarly, there is an energy reduction of 55 % 85 % in the peak hours from 16:00 to 23:00. This last result shows that this is an excellent methodology for demand response programs. Despite an increase in indoor air temperature depending on the availability of PV production, the building’s indoor comfort is not affected. This research quantified the amount of energy that is transferred from PV to the building thermal mass, and the result is 1– 2.8 kWh. A special script for the quantification of the thermal mass was developed in order to sum the building’s thermal heat storage of all the massive components. Good weather conditions are necessary (solar peak radiation of around 900 W/m 2 and mean outdoor temperature of 5 C) to achieve this goal. The methodology cannot be applied every day, as observed on 16 and 17 December when the optimization ( S C 3 ) is not producing significant results compared with the base case ( S C 1 ).
One of the main problems of this methodology is the computation time (2.5 h for each day), and alternative means of optimization should be considered in the future: different algorithms, different types of models, or different computation strategies. A comprehensive analysis of more days or even several years is desirable to gain a broader view of the potential of the methodology.
Real test case scenarios should be checked with calibrated energy models. The SABINA H2020 EU project with three real test sites (a school in Denmark and two office buildings in Greece) and a laboratory site in Spain are perfect environments for understanding the potential of the technology.
In the optimization processes, forecast data are necessary for the evaluation. This study used perfect weather data and renewable energy production. Future works may investigate the impact of errors in the weather forecast on the optimization results in order to maximize the profit of the methodology. Additionally, the same study should be considered for a summer case to determine which scenario realizes savings.

Author Contributions

MPC methodology was developed by G.R.R. and C.F.B. as part of Symmetri proyect. Thermal mass quantification was developed by all the authors as part of WP2 in SABINA project. Conceptualization, C.F.B. and G.R.R.; Methodology, C.F.B.; Software, G.R.R.; Validation and Formal Analysis, all authors; Investigation, Resources and Data Curation, C.F.B. and G.R.R.; Writing—Original Draft Preparation, C.F.B.; Writing—Review & Editing, Visualization, Supervision, all authors. All authors have read and agreed to the published version of the manuscript.

Funding

The work is funded by the research and innovation program Horizon 2020 of the European Union under the Grant No. 731211, project SABINA. The optimization methodology was developed thanks to the funds received from a research project granted by the Government of Navarre (SYMMETRI—“smart campus: electro-thermal microgrid”)

Conflicts of Interest

The authors declare no conflict of interest.

Abbreviations

The following abbreviations are used in this manuscript:
BMSBuilding Management Systems
BEMBuilding Energy Models
HEMSHome Energy Management Systems
HPHeat Pump
HVACHeating Ventilation and Air Conditioning
MPCModel Predictive Control
NSGA-IINon dominated sorting genetic algorithm—II
PMVPredicted Mean Vote
PVPhotolvoltaic
PV-TPhotovoltaic-Thermal Module (PV-T)
RESRenewable Energy Sources
ROIReturn Of Investment
VRFVariable Refrigerant Flow
SC1The model without any renewable energy
SC2The model with the renewable energy consumption but with a fixed set-point of 20
SC3The optimized model with variable set-points

Appendix A. Summary of Results

A summary of the main results of the optimization are in Table A1 and Table A2.
Table A1. Summary of the results. PV production, PV used and energy storage.
PV Production ( kWh )PV Used ( kWh )Storage ( kWh )
SC 3 SC 2 SC 3 Difference SC 2 SC 3 Difference
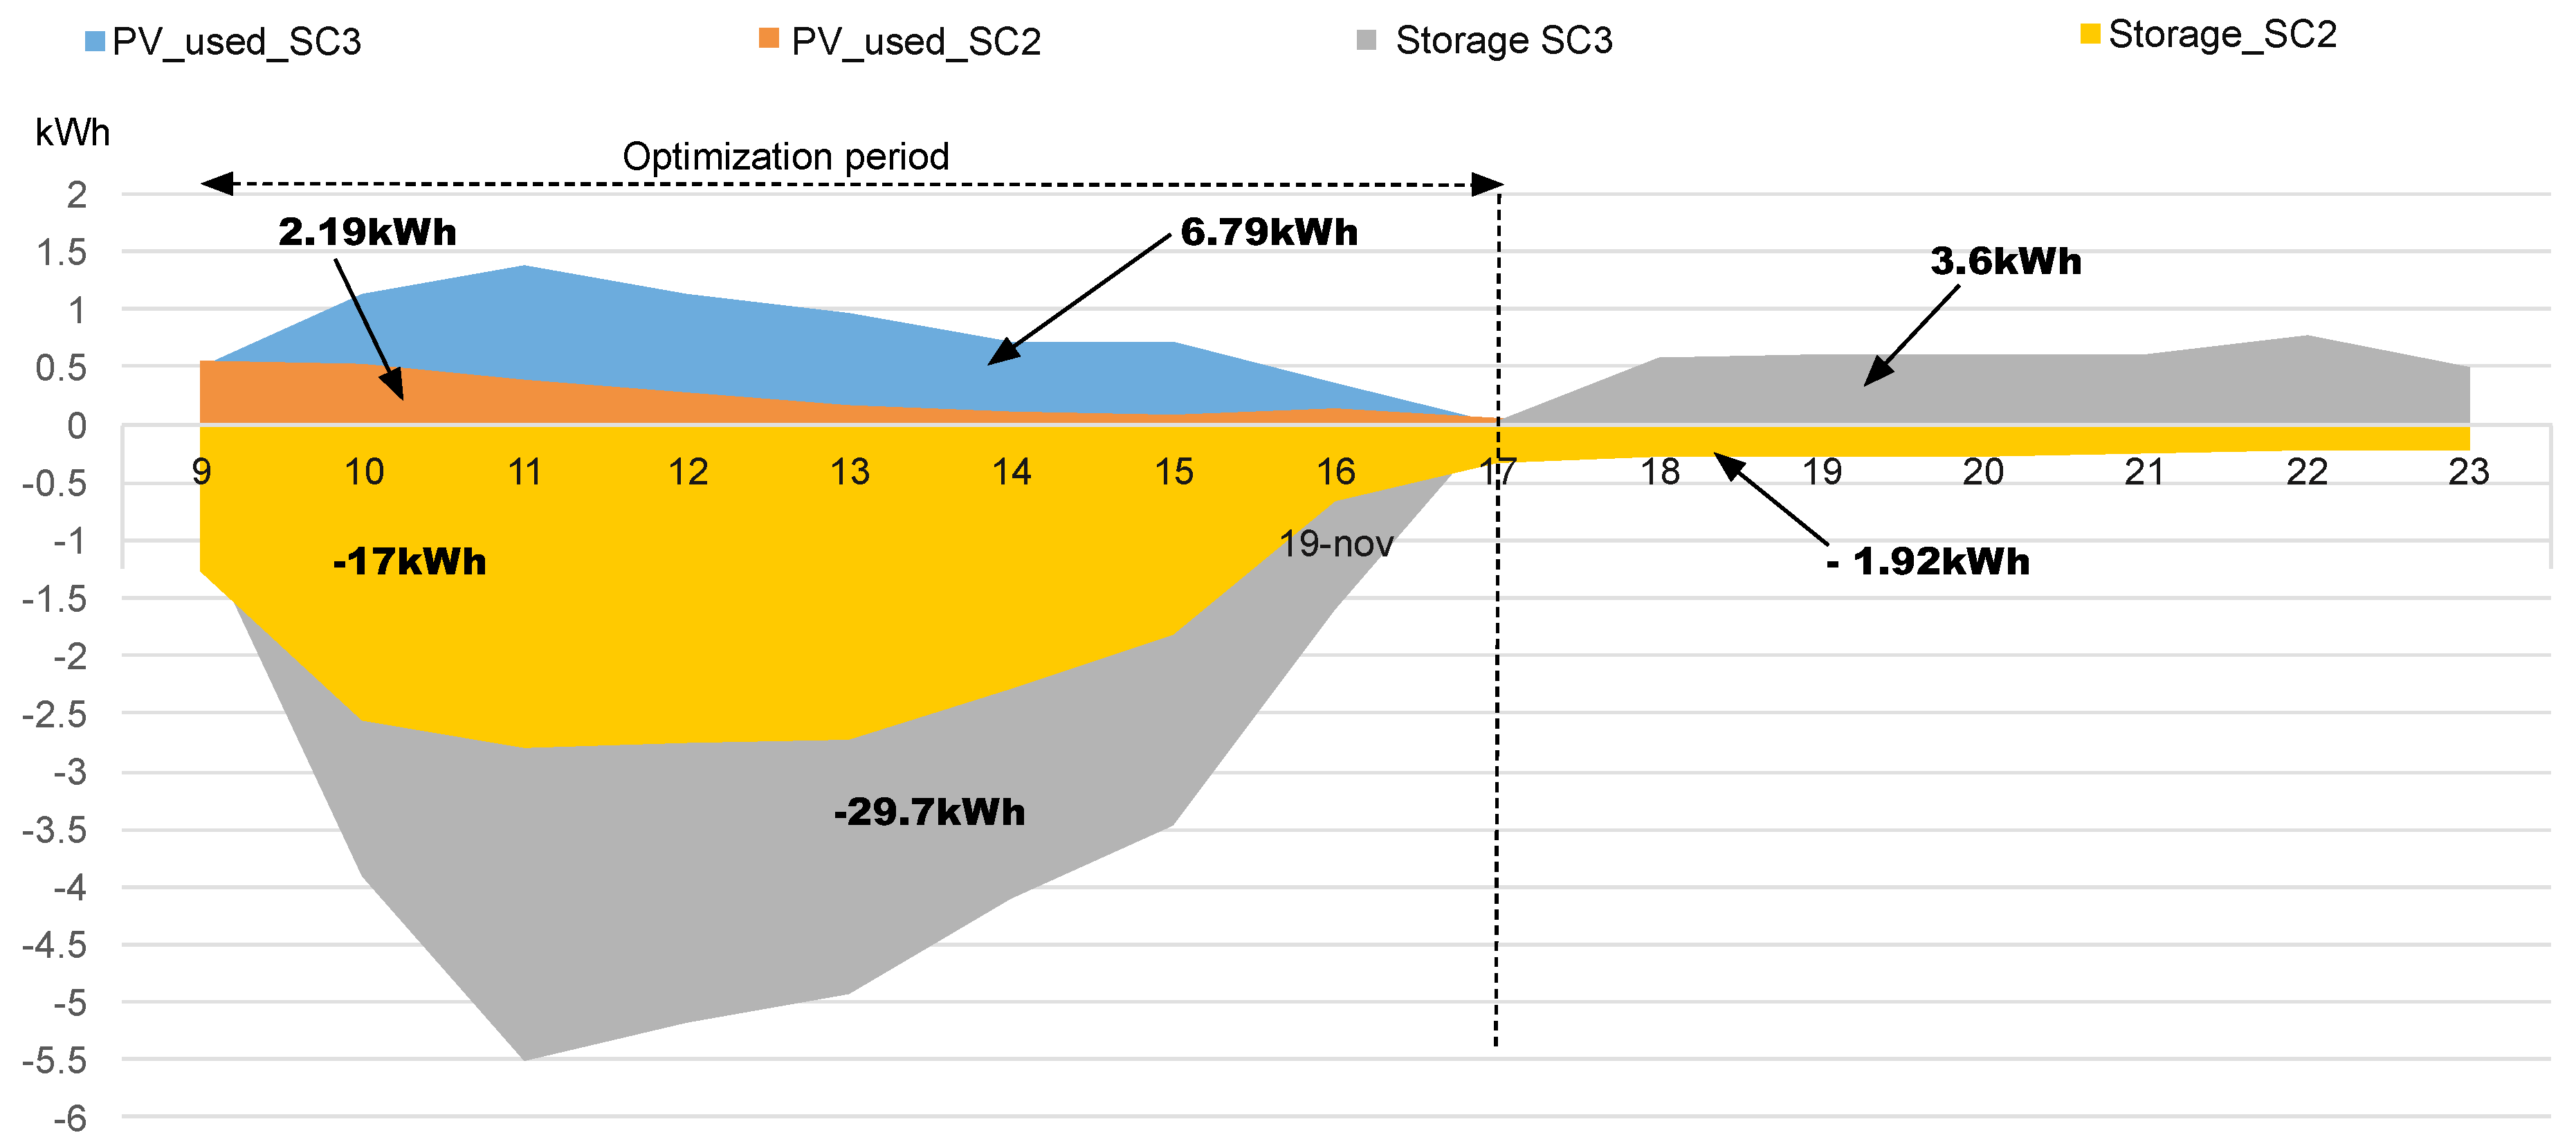
19-November11.722.19 (18.69%)6.79 (57.94%)4.6 (39.25%)−17−29.7−12.8
20-November11.732.8 (23.87%)7.71 (65.73%)4.9 (41.77%)−17.631−13.4
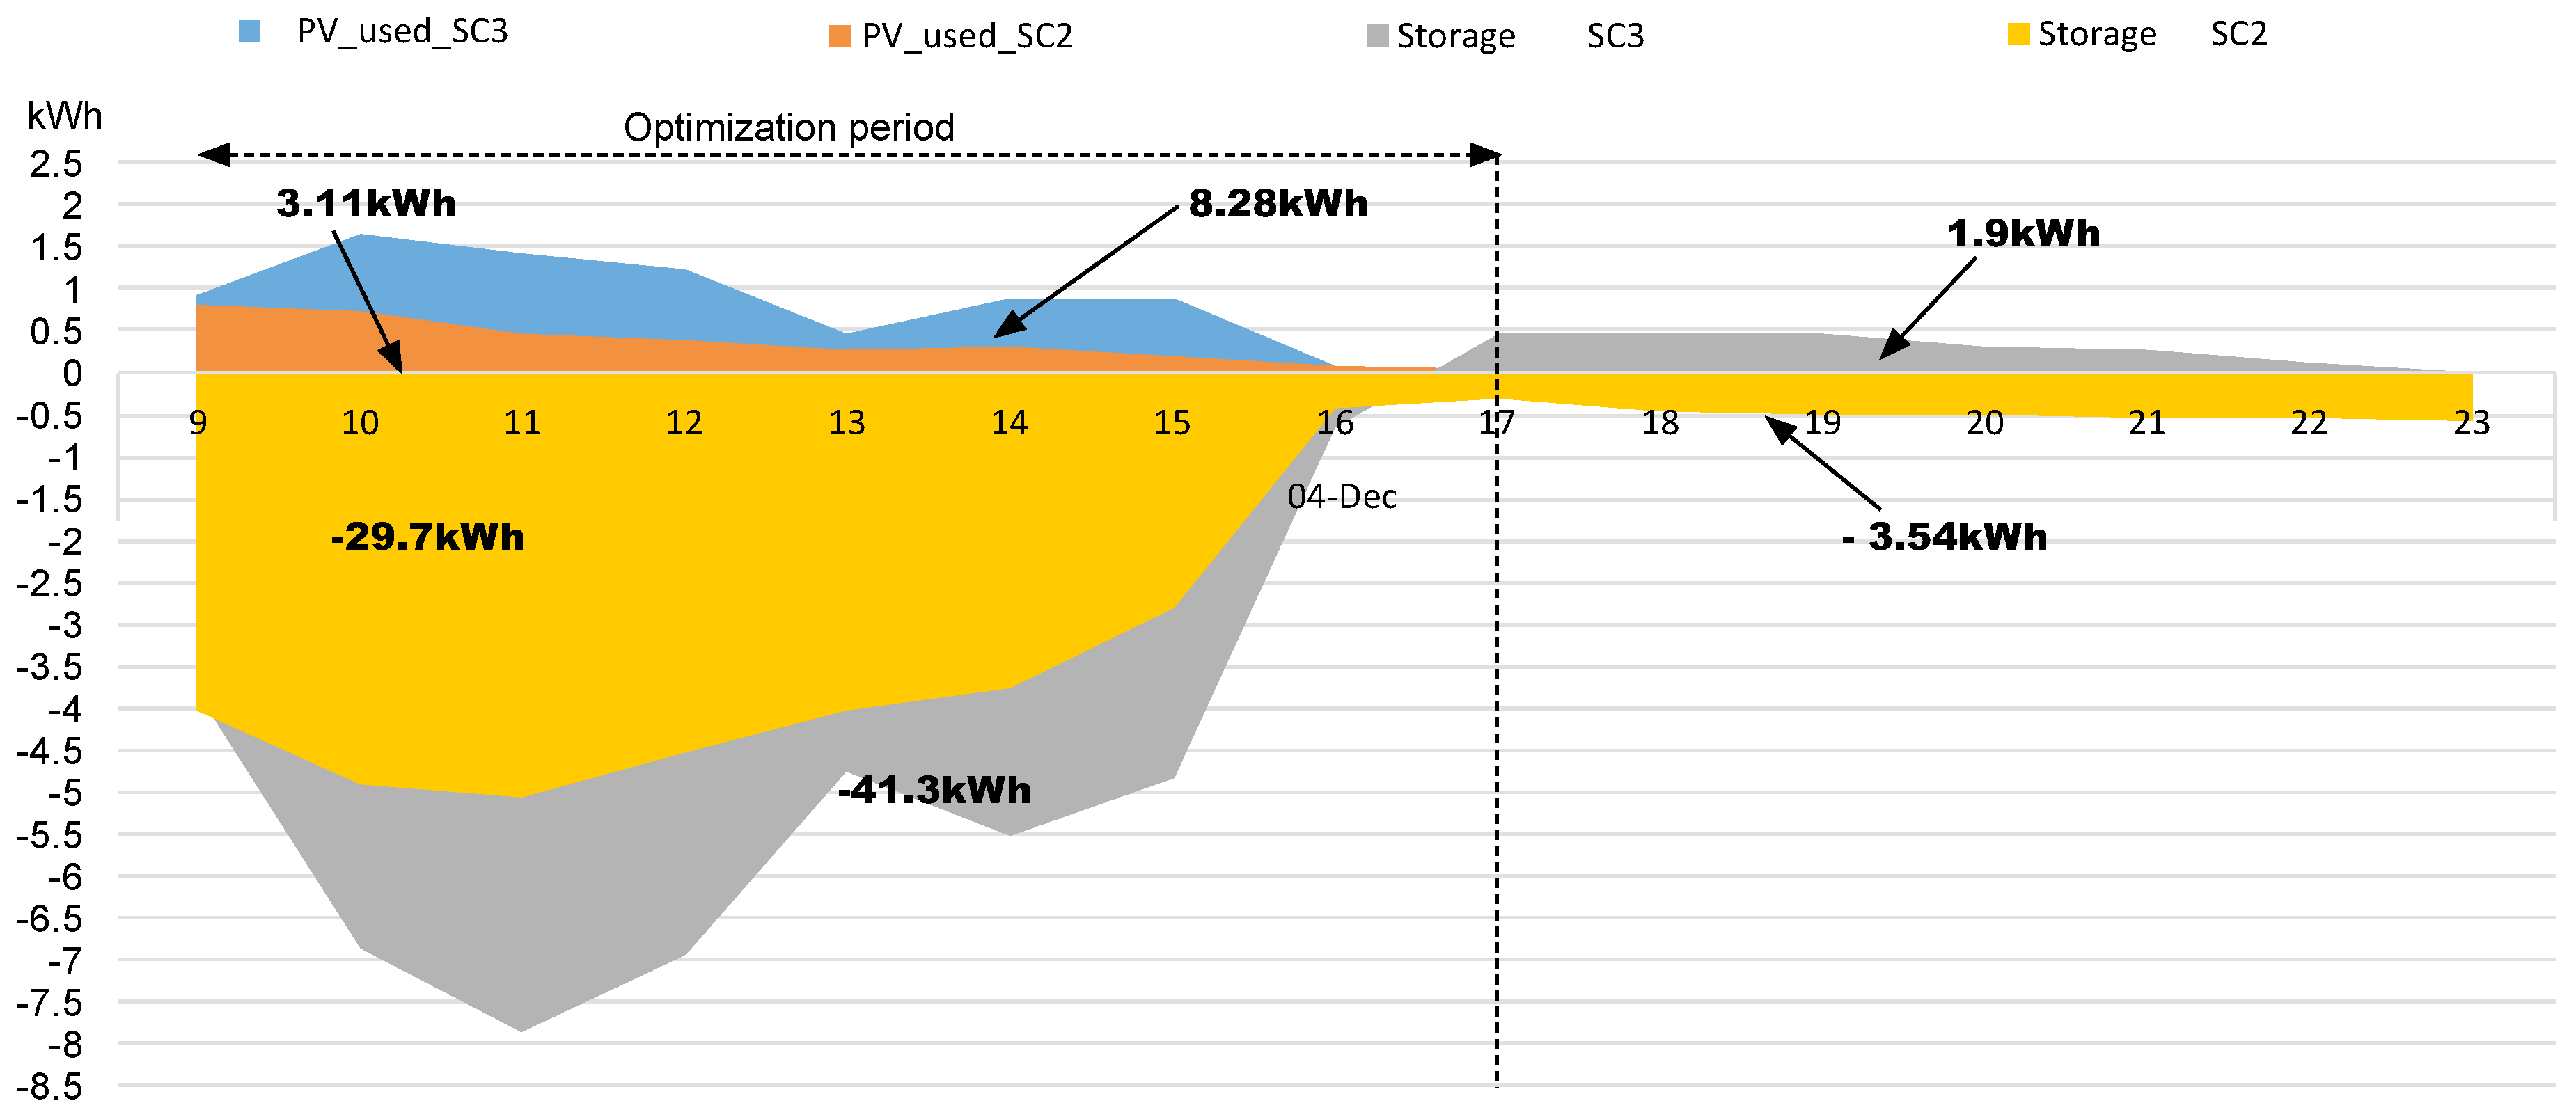
04-December14.713.09 (21.01%)7.4 (50.31%)4.3 (29.23%)−29.7−41.3−11.63
05-December15.333.11 (20.29%)8.28 (54.01%)5.17 (33.72%)−29.4−43.1−13.8
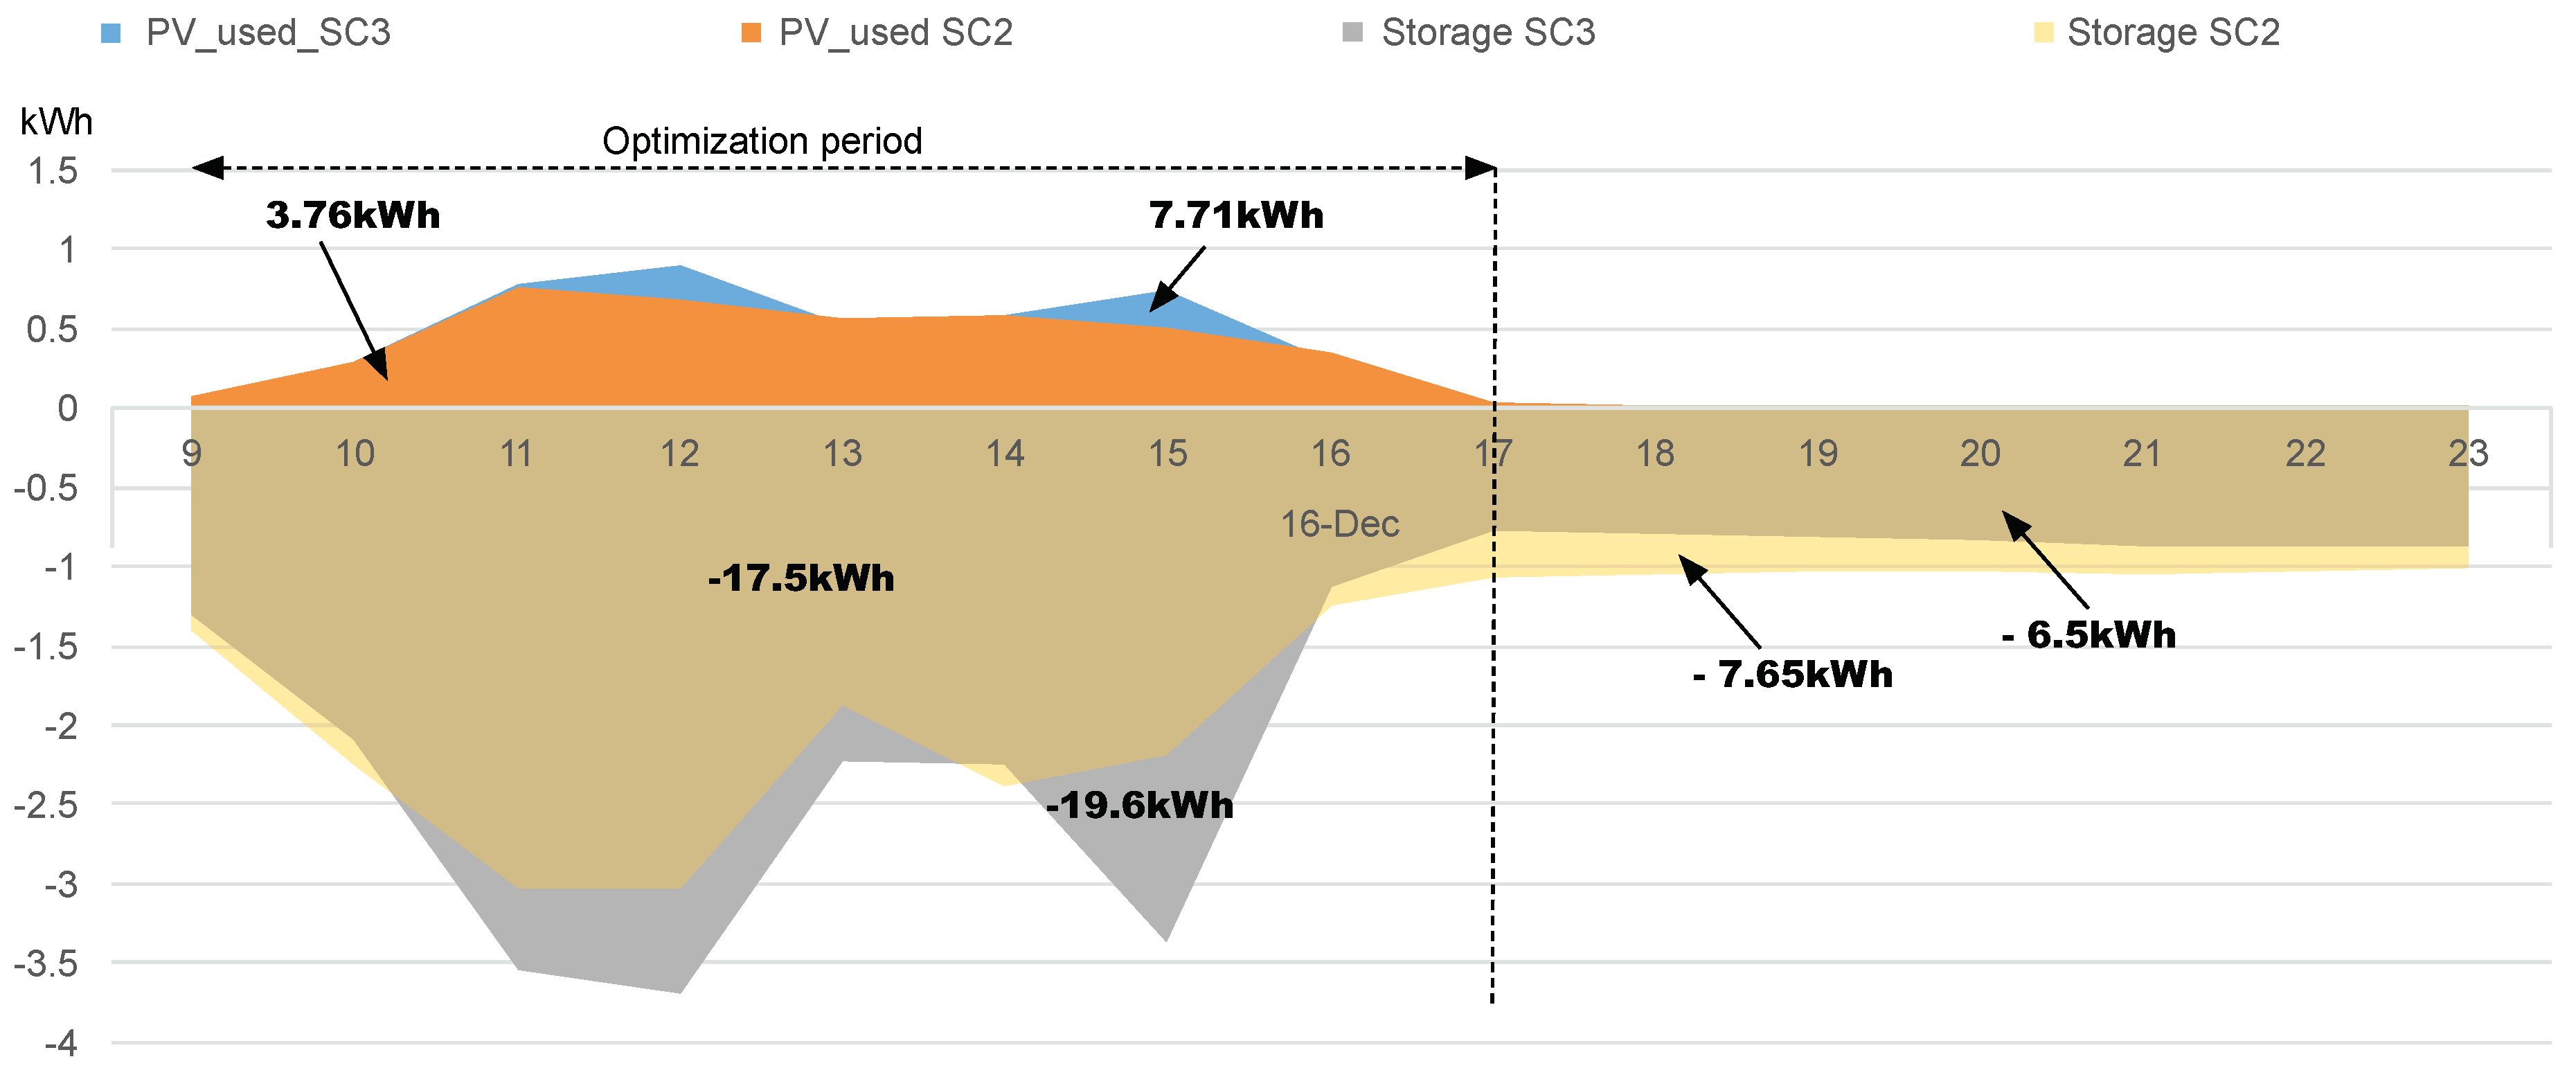
16-December5.263.76 (71.48%)4.13 (78.52%)0.37 (7.03%)−17.5−19.6−2.2
17-December5.154.09 (79.42%)4.22 (81.94%)0.13 (2.52%)−18.3−19.5−1.3
Table A2. Summary of the results. Energy grid [Total–Peak], total and peak savings.
Energy Grid (kWh)[Total–Peak]Total Saving (kWh–[%])Peak-Saving (kWh–[%])
SC 1 SC 2 SC 3 SC 2 SC 3 Difference SC 3
19-November4.532.132.342.080.810.292.19 (48.34%)3.72 (82.12%)1.53 (33.77%)1.85 (86.85%)
20-November5.862.883.062.831.150.72.8 (47.78%)4.71 (80.38%)1.91 (32.59%)2.18 (75.69%)
04-December6.823.323.733.312.041.523.09 (45.31%)4.78 (70.09%)1.69 (24.78%)1.8 (54.22%)
05-December6.663.463.553.461.711.363.11 (46.70%)4.96 (74.47%)1.85 (27.78%)2.11 (60.98%)
16-December10.924.747.164.727.254.223.76 (34.43%)3.66 (33.52%)0 (0.00%)0.52 (10.97%)
17-December11.234.937.144.897.154.524.09 (36.42%)4.08 (36.33%)0 (0.00%)0.4 (8.11%)
Figure A1. Daily performance of 19th November.
Sustainability 12 00553 g0a1
Figure A2. Daily performance of 20th November.
Sustainability 12 00553 g0a2
Figure A3. Daily performance of 4th December.
Sustainability 12 00553 g0a3
Figure A4. Daily performance of 16th December.
Sustainability 12 00553 g0a4

References

  1. Jäger-Waldau, A. Snapshot of Photovoltaics—February 2019. Energies 2019, 12, 769. [Google Scholar] [CrossRef] [Green Version]
  2. Rodríguez-Molina, J.; Martínez-Núñez, M.; Martínez, J.F.; Pérez-Aguiar, W. Business models in the smart grid: Challenges, opportunities and proposals for prosumer profitability. Energies 2014, 7, 6142–6171. [Google Scholar] [CrossRef] [Green Version]
  3. Aguilar, F.; Aledo, S.; Quiles, P. Experimental analysis of an air conditioner powered by photovoltaic energy and supported by the grid. Appl. Therm. Eng. 2017, 123, 486–497. [Google Scholar] [CrossRef]
  4. Nižetić, S.; Papadopoulos, A.; Tina, G.; Rosa-Clot, M. Hybrid energy scenarios for residential applications based on the heat pump split air-conditioning units for operation in the Mediterranean climate conditions. Energy Build. 2017, 140, 110–120. [Google Scholar] [CrossRef]
  5. Nizetic, S.; Coko, D.; Marasovic, I. Experimental study on a hybrid energy system with small-and medium-scale applications for mild climates. Energy 2014, 75, 379–389. [Google Scholar] [CrossRef]
  6. Hedegaard, K.; Mathiesen, B.V.; Lund, H.; Heiselberg, P. Wind power integration using individual heat pumps–Analysis of different heat storage options. Energy 2012, 47, 284–293. [Google Scholar] [CrossRef]
  7. Kaygusuz, K.; Kaygusuz, O. Theoretical performance of solar heat pump residential heating applications. J. Eng. Res. Appl. Sci. 2019, 8, 1099–1108. [Google Scholar]
  8. Noris, F.; Musall, E.; Salom, J.; Berggren, B.; Jensen, S.Ø.; Lindberg, K.; Sartori, I. Implications of weighting factors on technology preference in net zero energy buildings. Energy Build. 2014, 82, 250–262. [Google Scholar] [CrossRef]
  9. Salom, J.; Marszal, A.J.; Widén, J.; Candanedo, J.; Lindberg, K.B. Analysis of load match and grid interaction indicators in net zero energy buildings with simulated and monitored data. Appl. Energy 2014, 136, 119–131. [Google Scholar] [CrossRef]
  10. Jensen, S.Ø.; Marszal-Pomianowska, A.; Lollini, R.; Pasut, W.; Knotzer, A.; Engelmann, P.; Stafford, A.; Reynders, G. IEA EBC annex 67 energy flexible buildings. Energy Build. 2017, 155, 25–34. [Google Scholar] [CrossRef] [Green Version]
  11. Péan, T.; Ortiz, J.; Salom, J. Impact of demand-side management on thermal comfort and energy costs in a residential nZEB. Buildings 2017, 7, 37. [Google Scholar] [CrossRef] [Green Version]
  12. Henze, G.; Brandemuehl, M.; Felsmann, C.; Florita, A.; Cheng, H. Evaluation of Building Thermal Mass Savings; ASHRAE Research Project RP-1313; ASHRAE: North Atlanta, GA, USA, 2007. [Google Scholar]
  13. Zhai, X.; Qu, M.; Li, Y.; Wang, R. A review for research and new design options of solar absorption cooling systems. Renew. Sustain. Energy Rev. 2011, 15, 4416–4423. [Google Scholar] [CrossRef]
  14. Kim, D.; Ferreira, C.I. Solar refrigeration options–a state-of-the-art review. Int. J. Refrig. 2008, 31, 3–15. [Google Scholar] [CrossRef]
  15. Li, Z.; Sumathy, K. Technology development in the solar absorption air-conditioning systems. Renew. Sustain. Energy Rev. 2000, 4, 267–293. [Google Scholar] [CrossRef]
  16. Zondag, H. Flat-plate PV-Thermal collectors and systems: A review. Renew. Sustain. Energy Rev. 2008, 12, 891–959. [Google Scholar] [CrossRef] [Green Version]
  17. Fu, H.; Pei, G.; Ji, J.; Long, H.; Zhang, T.; Chow, T.T. Experimental study of a photovoltaic solar-assisted heat-pump/heat-pipe system. Appl. Therm. Eng. 2012, 40, 343–350. [Google Scholar] [CrossRef]
  18. Chen, H.; Riffat, S.B. Investigation of a hybrid solar heat pump system. Procedia Eng. 2011, 21, 311–318. [Google Scholar] [CrossRef] [Green Version]
  19. Lasseter, R.H.; Piagi, P. Microgrid: A conceptual solution. In Proceedings of the IEEE Power Electronics Specialists Conference, Aachen, Germany, 20–25 June 2004; Volume 6, pp. 4285–4291. [Google Scholar]
  20. Lasseter, R.H. Microgrids. In Proceedings of the 2002 IEEE Power Engineering Society Winter Meeting, Conference Proceedings (Cat. No. 02CH37309), New York, NY, USA, 27–31 January 2002; Volume 1, pp. 305–308. [Google Scholar]
  21. Mariam, L.; Basu, M.; Conlon, M.F. A review of existing microgrid architectures. J. Eng. 2013, 2013. [Google Scholar] [CrossRef] [Green Version]
  22. Infield, D.; Li, F. Integrating micro-generation into distribution systems—A review of recent research. In Proceedings of the 2008 IEEE Power and Energy Society General Meeting-Conversion and Delivery of Electrical Energy in the 21st Century, Pittsburgh, PA, USA, 20–24 July 2008; pp. 1–4. [Google Scholar]
  23. Saviuc, I.; Peremans, H.; Van Passel, S.; Milis, K. Economic Performance of Using Batteries in European Residential Microgrids under the Net-Metering Scheme. Energies 2019, 12, 165. [Google Scholar] [CrossRef] [Green Version]
  24. Koch, S.; Mathieu, J.L.; Callaway, D.S. Modeling and control of aggregated heterogeneous thermostatically controlled loads for ancillary services. In Proceedings of the PSCC, Stockholm, Sweden, 22–26 August 2011; pp. 1–7. [Google Scholar]
  25. McKenna, E.; Pless, J.; Darby, S.J. Solar photovoltaic self-consumption in the UK residential sector: New estimates from a smart grid demonstration project. Energy Policy 2018, 118, 482–491. [Google Scholar] [CrossRef]
  26. European Parliament. DIRECTIVE (EU) 2018/2001 of the European Parliament and of the Council of 11 December 2018 on the Promotion of the Use of Energy from Renewable Sources (Recast). 2018. Available online: https://eur-lex.europa.eu/legal-content/EN/TXT/?uri=celex:32018L2001 (accessed on 11 January 2020).
  27. Ministerio para la Transición Ecológica. Real Decreto 244/2019, de 5 de abril, por el que se regulan las condiciones administrativas, técnicas y económicas del autoconsumo de energía eléctrica; Boletín Oficial del Estado (BOE): Madrid, Spain, 2019; pp. 68–71.
  28. SABINA. SmArt BI-Directional Multi eNergy gAteway. 2016. Available online: http://sabina-project.eu (accessed on 1 November 2019).
  29. Péan, T.Q.; Salom, J.; Costa-Castello, R. Review of control strategies for improving the energy flexibility provided by heat pump systems in buildings. J. Process. Control. 2019, 74, 35–49. [Google Scholar] [CrossRef]
  30. Baeten, B.; Rogiers, F.; Helsen, L. Reduction of heat pump induced peak electricity use and required generation capacity through thermal energy storage and demand response. Appl. Energy 2017, 195, 184–195. [Google Scholar] [CrossRef]
  31. Pavlak, G.S.; Henze, G.P.; Cushing, V.J. Evaluating synergistic effect of optimally controlling commercial building thermal mass portfolios. Energy 2015, 84, 161–176. [Google Scholar] [CrossRef]
  32. Guglielmetti, R.; Macumber, D.; Long, N. OpenStudio: An Open Source Integrated Analysis Platform; Technical Report; National Renewable Energy Lab. (NREL): Golden, CO, USA, 2011.
  33. Crawley, D.B.; Lawrie, L.K.; Winkelmann, F.C.; Buhl, W.F.; Huang, Y.J.; Pedersen, C.O.; Strand, R.K.; Liesen, R.J.; Fisher, D.E.; Witte, M.J.; et al. EnergyPlus: creating a new-generation building energy simulation program. Energy Build. 2001, 33, 319–331. [Google Scholar] [CrossRef]
  34. Pombeiro, H.; Machado, M.J.; Silva, C. Dynamic programming and genetic algorithms to control an HVAC system: Maximizing thermal comfort and minimizing cost with PV production and storage. Sustain. Cities Soc. 2017, 34, 228–238. [Google Scholar] [CrossRef]
  35. Corbin, C.D.; Henze, G.P.; May-Ostendorp, P. A model predictive control optimization environment for real-time commercial building application. J. Build. Perform. Simul. 2013, 6, 159–174. [Google Scholar] [CrossRef]
  36. Ruiz, G.R.; Bandera, C.F.; Temes, T.G.A.; Gutierrez, A.S.O. Genetic algorithm for building envelope calibration. Appl. Energy 2016, 168, 691–705. [Google Scholar] [CrossRef]
  37. Ruiz, G.R.; Bandera, C.F. Analysis of uncertainty indices used for building envelope calibration. Appl. Energy 2017, 185, 82–94. [Google Scholar] [CrossRef]
  38. Ruiz, G.; Bandera, C. Validation of calibrated energy models: common errors. Energies 2017, 10, 1587. [Google Scholar] [CrossRef] [Green Version]
  39. Fernández Bandera, C.; Ramos Ruiz, G. Towards a new generation of building envelope calibration. Energies 2017, 10, 2102. [Google Scholar] [CrossRef] [Green Version]
  40. González, V.G.; Colmenares, L.Á.; Fidalgo, J.F.L.; Ruiz, G.R.; Bandera, C.F. Uncertainy’s Indices Assessment for Calibrated Energy Models. Energies 2019, 12, 2096. [Google Scholar] [CrossRef] [Green Version]
  41. Handbook, A.F. American Society of Heating, Refrigerating and Air-Conditioning Engineers; ASHARE Inc.: Atlanta, GA, USA, 2017. [Google Scholar]
  42. de la Edificación, C.T. Documento Básico he Ahorro de energía; CTE DB-HE; Ministerio de Fomento: Madrid, Spain, 2013.
  43. U.S. Department of Energy. Energyplus Engineering Reference: The Reference to EnergyPlus Calculations; U.S. Department of Energy: Washington, DC, USA, 2010.
  44. Ineichen, P.; Perez, R.; Seal, R.; Maxwell, E.; Zalenka, A. Dynamic global-to-direct irradiance conversion models. Ashrae Trans. 1992, 98, 354–369. [Google Scholar]
  45. Ramos Ruiz, G.; Lucas Segarra, E.; Fernández Bandera, C. Model Predictive Control Optimization via Genetic Algorithm Using a Detailed Building Energy Model. Energies 2019, 12, 34. [Google Scholar] [CrossRef] [Green Version]
  46. Zhang, Y.; Korolija, I. Performing complex parametric simulations with jEPlus. In Proceedings of the SET2010-9th International Conference on Sustainable Energy Technologies, Shanghai, China, 24–27 August 2010; pp. 24–27. [Google Scholar]
  47. Deb, K.; Pratap, A.; Agarwal, S.; Meyarivan, T. A fast and elitist multiobjective genetic algorithm: NSGA-II. IEEE Trans. Evol. Comput. 2002, 6, 182–197. [Google Scholar] [CrossRef] [Green Version]
  48. Nguyen, A.T.; Reiter, S.; Rigo, P. A review on simulation-based optimization methods applied to building performance analysis. Appl. Energy 2014, 113, 1043–1058. [Google Scholar] [CrossRef]
  49. Afram, A.; Janabi-Sharifi, F. Theory and applications of HVAC control systems–A review of model predictive control (MPC). Build. Environ. 2014, 72, 343–355. [Google Scholar] [CrossRef]
  50. American Society of Heating, Refrigerating and Air-Conditioning Engineers. ASHRAE Standard: Thermal Environmental Conditions for Human Occupancy; ASHRAE: Atlanta, GA, USA, 2010. [Google Scholar]
  51. Fanger, P.O. Thermal Comfort. Analysis and Applications in Environmental Engineering; Danish Technical Press: Copenhagen, Denmark, 1970. [Google Scholar]
Figure 1. Real dwelling on the left (surrounded by a red square) and representation of the building energy model on the right (Sketchup + OpenStudio pluging). The solar PV panel is the purple square on the roof of the building energy model.
Sustainability 12 00553 g001
Figure 2. Floor plan of the flat with the position of the different construction components taken from as built information and defined in Table 1.
Sustainability 12 00553 g002
Figure 3. General schema of the VRF connection for one single zone in EnergyPlus.
Sustainability 12 00553 g003
Figure 4. General schema of the Building Power Service as implemented in EnergyPlus and the algebraic relation between the different components.
Sustainability 12 00553 g004
Figure 5. PV plant hourly production of the different days of the experiment.
Sustainability 12 00553 g005
Figure 6. Main weather parameters for the selected days.
Sustainability 12 00553 g006
Figure 7. Optimization general scheme.
Sustainability 12 00553 g007
Figure 8. Search space for the optimization.
Sustainability 12 00553 g008
Figure 9. Possible days of analysis for November 2017.
Sustainability 12 00553 g009
Figure 10. Possible days of analysis for December 2017.
Sustainability 12 00553 g010
Figure 11. General overview of the results produced before optimization -(A) SC2- and after optimization -(B) SC3-.
Sustainability 12 00553 g011
Figure 12. Set-points obtained from the optimization.
Sustainability 12 00553 g012
Figure 13. Daily performance of 5 December.
Sustainability 12 00553 g013
Figure 14. Daily performance of 17 December.
Sustainability 12 00553 g014
Figure 15. Electric energy consumption from the grid from 9:00 to 23:00. In gray: consumption without solar contribution ( S C 1 ); in orange: consumption with solar contribution without optimization ( S C 2 ); in blue: consumption with solar contribution and optimization ( S C 3 ). The percentage is the reduction compared to the gray bar.
Sustainability 12 00553 g015
Figure 16. Electric energy consumption from the grid from 16:00 to 23:00 (peak hours). In gray consumption without solar contribution ( S C 1 ). In orange consumption with solar contribution ( S C 2 ). In blue consumption with solar contribution and optimization ( S C 3 ). The percentage is the reduction compared to the gray bar.
Sustainability 12 00553 g016
Figure 17. In gray: PV used by S C 3 and in yellow PV used by S C 2 . In orange: PV production for each day. In blue: storage difference between base and optimize case. The percentage is reffered to orange (PV production for each day).
Sustainability 12 00553 g017
Figure 18. Predicted Mean Vote for S C 2 only solar production and SC3 (optimized).
Sustainability 12 00553 g018
Table 1. Envelope characteristics of the building energy model.
Baseline Case Modele
m
λ
W / mK
ρ
kg / m 3
c
J / kgK
Facade wall (out-in)
Perforated brick0.120.539001000
Expanded polystyrene0.050.037301000
Hollow brick0.0750.0479301000
Plaster0.020.48501000
Roof (out-in)
Ceramic tiles0.0212000800
Cement mortar0.020.5511251000
Hollow brick0.050.286701000
Roof Slab (out-in)
Expanded polystyrene0.050.037301000
Waffle slab0.251.6712771000
Plaster0.020.48501000
Slab (out-in)
Plaster0.020.48501000
Waffle slab0.251.6712771000
Expanded polystyrene0.050.037301000
Stoneware tiles0.021.923501000
Partition
Plaster0.020.48501000
Hollow brick0.0750.479301000
Plaster0.020.48501000
e—Thickness; λ —Conductivity; ρ —Density; c—Specific heat; R Thermal resistance.
Table 2. Thechnical characteristics of the VRF system.
VRF Heat PumpUnitMin.Nom.Max.
Heating capacityW60048006000
Heating power supplyW20016002000
SCOP--2.9-
Table 3. PV plant production.
TypePeriodkWpkWh
Yearly201746077.3
MonthlyNovember 20172.7249.7
December 20173236.8
Daily19 November2.111.7
20 November2.0111.7
4 December2.514.7
5 December2.615.32
16 December1.25.2
17 December1.05.1