Article

Long-Term Forecast of Energy and Fuels Demand Towards a Sustainable Road Transport Sector in Ecuador (2016–2035): A LEAP Model Application

by
Luis Rivera-González
1,
David Bolonio
1,
Luis F. Mazadiego
1,*,
Sebastián Naranjo-Silva
2 and
Kenny Escobar-Segovia
3,4
1
Department of Energy and Fuels, Mining and Energy Engineering School, Universidad Politécnica de Madrid, 28003 Madrid, Spain
2
University Research Institute for Sustainability Science and Technology, Transversal Unit of Road Scope Management, Universidad Politécnica de Catalunya, 08034 Barcelona, Spain
3
Campus Gustavo Galindo, Escuela Superior Politécnica del Litoral, ESPOL, Guayaquil P.O. Box 09-01-5863, Ecuador
4
Faculty of Graduate Studies, Universidad Espíritu Santo, Guayas P.O. Box 09-01-5863, Ecuador
*
Author to whom correspondence should be addressed.
Sustainability 2020, 12(2), 472; https://doi.org/10.3390/su12020472
Submission received: 16 November 2019 / Revised: 3 January 2020 / Accepted: 5 January 2020 / Published: 8 January 2020

Abstract

:
The total energy demand in the transport sector represented 48.80% of the total consumption in Ecuador throughout 2016, where 89.87% corresponded to the road transport sector. Therefore, it is crucial to analyze the future behavior of this sector and assess the economic and environmental measures towards sustainable development. Consequently, this study analyzed: (1) the total energy demand for each vehicle class and fuel type; (2) the GHG (greenhouse gas) emissions and air pollutants NOx and PM10; and (3) the cost attributed to the fuel demand, between 2016 and 2035. For this, four alternative demand scenarios were designed: BAU: Business As Usual; EOM: Energy Optimization and Mitigation; AF: Alternative Fuels; and SM: Sustainable Mobility using Long-range Energy Alternatives Planning system. After analysis, the EOM, AF, and SM scenarios have advantages relative to BAU, where SM particularly stands out. The results show that SM compared to BAU, contributes with a 12.14% (141,226 kBOE) decrease of the total energy demand, and the economic savings for this fuel demand is of 14.22% (26,720 MUSD). Moreover, global NOx and PM10 emissions decreased by 14.91% and 13.78%, respectively. Additionally, accumulated GHG emissions decreased by 13.49% due to the improvement of the fuel quality for the vehicles that mainly consume liquefied petroleum gas, natural gas, and electricity.

1. Introduction

Over the last several years, the transport sector has gained particular relevance in the global energy context. During 2016, it represented around 27.8% of the total world energy demand [1], where oil remains its principal source with 96% [2]. It is estimated that the final consumption of liquid fuels worldwide in the transport sector has approximate participation of 55% by 2040. Thus, the final consumption share would remain constant from 2015 [3].
On the other hand, within the global energy consumption in this sector, liquid petroleum fuels would have a share that decreases from 95% in 2012 to 88% in 2040, due to the expansion of the consumption of alternative fuels [4]. Although natural gas and electricity still have deficient consumption levels related to liquid fuels, they have a faster growth forecast of approximately three times between 2015 and 2040. For example, the consumption of natural gas for passenger and cargo transport would increase by almost 500% in the same period [5].
Between 2000 and 2012, in several Latin American countries, the energy demand in the road transport sector has been continuously increasing with high intensity every year; in Paraguay, it grew by 11%, in Panama and Bolivia by 5%, in Argentina and Costa Rica by 4% [6]. This trend has remained relatively constant, generating a significant increase in the vehicle fleet, with a 3.5% average each year, which is mainly composed of cars [7].
In 2012, in the countries of this same region, the transport sector had a total energy consumption share of 27% in the case of Nicaragua to 55% in the case of Ecuador. Inside this sector, road transport demanded around 85% of the total energy consumption, excluding Panama, where air transport continues to be very significant with 30% of the total energy consumption in the transport sector due to its geographical condition [8].
The high levels of liquid petroleum fuels consumption in road transport cause great concern at the global level but mainly in emerging market countries such as India, China, the United States of America, and large regions such as the European Union, Latin America, Southeast Asian, Eastern Europe, the Middle East, and Africa, which are the world’s most energy demanded.
This concern is primarily related to the following reasons: (1) the localized polluting gases emissions within cities that reduce the quality of air which affects human and animal health [9,10]; (2) the increasing emissions of GHG that contribute to global warming, from 20 Gt CO2e (billion metric tons) in 1990 to 37 Gt CO2e in 2017, representing a 2.3% average increase per year. [11]; (3) the decrease of the non-renewable resources reserves due to their high demand; and (4) the limited energy generation alternative resources for worldwide consumption [12]. Consequently, most of the countries that signed the Paris Agreement study and promote initiatives to comply with Article 2 of the Agreement on Climate Change [13]. All this has influenced the development of numerous internationally relevant research studies related to (i) analysis of the reduction of polluting gases emissions, (ii) alternative fuels usage, and (iii) energy efficiency and optimization.
Among the most relevant and outstanding studies of some specific topics are the following: (a) energy for sustainable road transport and analysis of the energy demand consumption in road transport in China [9,14]; (b) fuels consumption in road transport in China and OECD countries [15]; (c) energy consumption and gases emission projection in Malaysia [16]; (d) atmospheric emissions from road transport and electric vehicles assessment in India [17,18]; (e) alternative fuels consumption in Japan and cleaner fuels in Europe [19,20]; (f) biofuels development for the automotive market in the UK and emission potential reduction for developing countries [21,22]; and (g) GHG reduction in the road transport sector in the U.S. and Korea [11,23].
These studies have different approaches and significant examples which show the need to know the energy implications and behavior of the road transport sector in the various countries and regions studied. Overall, they share similar aims to be analyzed on vehicular mobility: (i) estimate the energy demand and fuel type (fossil and alternative) for road transport; (ii) quantify positive and negative potential effects concerning polluting emissions; (iii) analyze the socio-economic benefits; and (iv) assess the impact of applying different policies in the road transport sector.
For all these reasons, it is crucial to develop and adopt, at a global level, firm and lasting policies that contribute to confronting these problems directly [24]. For example, the regional case of the sustainable urban mobility plan developed by the European Parliament [25], or local cases of urban mobility plans on all continents as in Madrid [26]; London [27]; New York City [28]; Abu Dhabi [29]; Bogotá [30]; Sydney [31]; Nairobi [32]; among others [33].
Therefore, following these trends, applied to Ecuador, the aims pursued by this research are the following: (1) estimate and analyze the total future energy demand for each vehicle type and fuel type consumed, within the road transport sector; (2) estimate the tank to wheel (TtW) total emissions of the leading polluting gases, of the entire vehicle fleet; and (3) estimate the future total cost of energy demand of each fuel type consumed.
All these results are quantified and analyzed for the four alternative scenarios, which have been designed through the use of LEAP (Long-range Energy Alternatives Planning) system between 2016 and 2035, which will allow proposing the best scenario towards the sustainability road transport sector in Ecuador.

2. Review of the Road Transport Sector in Ecuador

Ecuador, with over 17 million inhabitants [34], is smaller than the 15 most populated cities worldwide [35], and it has around 2.1 million motorized vehicles [36], representing 120 vehicles per 1000 inhabitants. According to the “Transport statistics yearbook 2016” [37] published by the National Institute of Statistics and Census of Ecuador (INEC by its acronym in Spanish), 2,061,309 vehicles are registered in the national road transport sector, from heavy-duty vehicles to motorcycles. Table 1 shows the registered units corresponding to the vehicle classes, the fuel type, and the total energy consumed in the road transport sector in 2016.
Within this classification of vehicles, the most representative percentages are cars with 31.11%, motorcycles with 23.18%, followed by pick-up and off-road with 19.58% and 15.67%, respectively. Next, with smaller percentages are cargo trucks with 4.80%, cargo vans with 2%, and passenger vans and buses with 1.17% and 1.14%, respectively. Finally, dump truck with 0.57%, trailer truck with 0.47%, tanker truck with 0.11%, and other classes with 0.20%.
In 2016, according to the Association of Automotive Companies of Ecuador (AEADE by its acronym in Spanish), 137,768 motorized vehicles were sold, corresponding to 121,301 passenger vehicles and 16,467 cargo vehicles, distributed among different types [38].
According to the National Energy Balance 2017 based on the year 2016 [39], the transport sector has the highest energy demand, which in 2007 consumed 29,314 kBOE (thousand barrels of oil equivalent) (42.60%) and grew in 2016 to 44,284 kBOE representing 48.80% of the total demand energy. In that same year, the road transport sector had the highest consumption, with 89.87% of the total demand, 39,798.6 KBOE. Liquid petroleum fuels for these vehicles were the most demanded, gasoline with 19,670.11 kBOE and diesel oil with 20,066.12 kBOE, which represent 49.42% and 50.42%, respectively, both reach the 99.84% of the total fuels demand in 2016.
On the other hand, with a less significant demand are the LPG (liquefied petroleum gas) with 50.48 kBOE, bioethanol with 5.51 kBOE, and electricity with 6.18 kBOE, which together represent about 0.16% of the total. Within the fuel consumption sector, the vehicles with the highest demand are those of heavy-duty with 39.57%, followed by light vehicles with 26.44%, then light duty with 24.96%, passengers with 8.97% and other types with 0.06%.
In this context, the most demanded fuels for the road transport sector are diesel and gasoline. In a much smaller amount, they are the LPG, bioethanol (E5), and electricity. Therefore, the primary fuels that would be sought to introduce a more significant measure in the automotive sector are bioethanol (E10), biodiesel (B10), LNG (liquefied natural gas), CNG (compressed natural gas), LPG, and electricity [40]. These fuels were successfully implemented several years ago in Ecuador’s neighboring countries; as in the cases of Brazil, Chile, and Colombia with biofuels, Argentina, Peru, Brazil, and Colombia with vehicular natural gas, and almost all Latin American countries with the recent increase of hybrid and electric vehicles sales [8].
In this way, the Ecuadorian Republic’s Government would work to comply with Articles 15 and 413 of their Constitution [41], about the use of environmentally clean technologies, alternative energies, and energy efficiency. Articles 15 and 413 promote two main axes: (i) energy efficiency, and (ii) fuels supply model change that stimulates the demand diversification. Additionally, the road transport sector would contribute to achieving the signed objective in the Nationally Determined Contributions (NDC) about the Paris Agreement [13], in which Ecuador is committed to reducing 9% of CO2e estimated emissions until 2025 [42]. However, the country still lacks a clear green fiscal reform, and it suffers from expensive energy subsidies, where gasoline and diesel are the most inefficient subsidies [43].
Therefore, there is a need to develop studies and promote initiatives by public institutions in the country related to sustainable mobility, which includes the following: (a) strategic lines of demand towards energy resources development [44]; (b) assessment and energy efficiency opportunities inland transport in Ecuador [45,46]; (c) strategic action lines in the transport sector for climate change mitigation in Ecuador [47,48]; (d) identification of energy efficiency needs in transport [49], and (e) impact evaluation methodology on energy consumption due to electric vehicle integration [50].
In particular, almost all cited studies above contain measures of sustainable mobility. However, the problem is that they are not inclusive for each other and show isolated independent results. In this way, this study has identified the most significant results of these national initiatives to integrate them with the most relevant international trends regarding energy policies applied to sustainable mobility, and which are potentially viable in Ecuador.
Finally, it is relevant to indicate that the current government is in the study phase for a proposal related with the construction of a high conversion refinery that would have 300 thousand barrels of oil per day processing capacity [51], which will be added to the 110 thousand barrels current capacity [52]. Hence, it is expected that the most demanded fuels, diesel and gasoline, will be of national production, reducing Ecuador’s dependence on foreign petroleum liquid fuels, since the current refiner capacity does not meet domestic demand according to the “Hydrocarbons Statistics Report 2016” of the Hydrocarbons Regulation and Control Agency (ARCH by its acronym in Spanish) [53].

3. Methodology

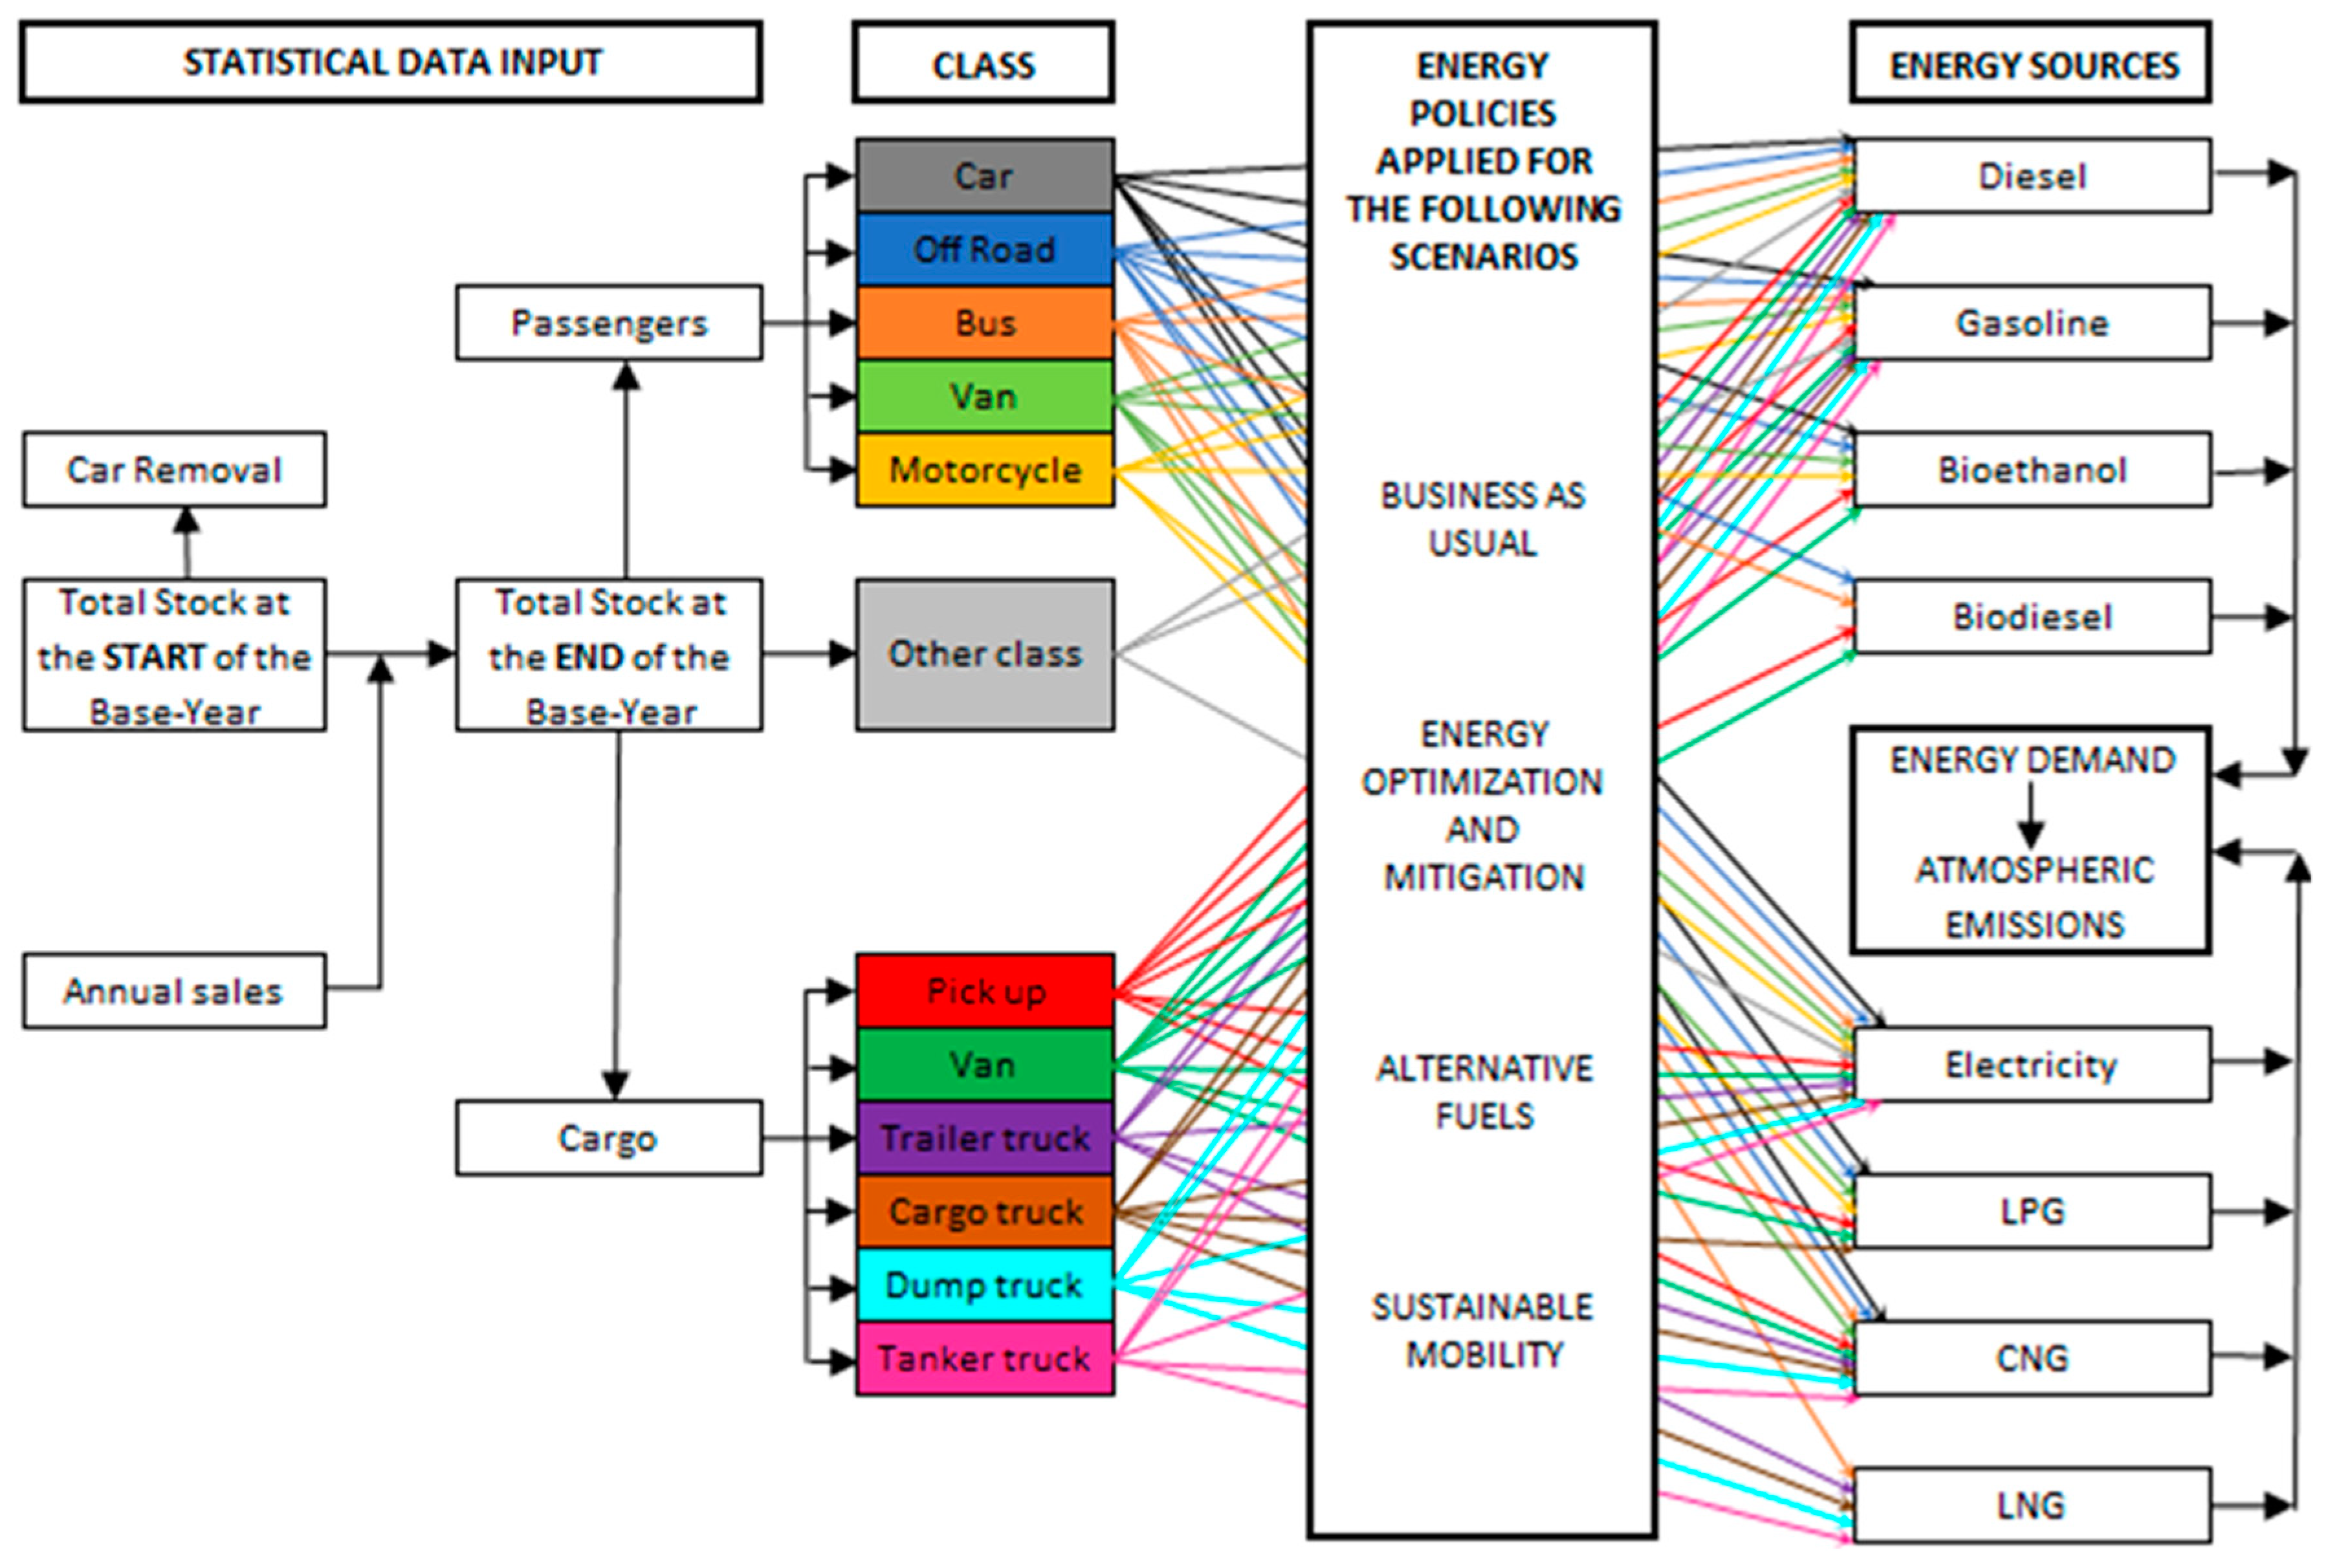
3.1. Road Transport in the LEAP Model

LEAP (Long-range Energy Alternatives Planning System) is an integrated software tool used to perform long term energy policy studies, environmental assessments, and cost analyses based on scenarios that represent different cases of energy production and consumption from different sources that need to cover the demand of all sectors of the economy [54].
Inside of the LEAP system design configuration, the parameters for the base year (Scenario: Current Accounts) were defined in a hierarchical tree structure method for the two following designed modules:
(1) Key Assumptions module, where the socioeconomic variables data are entered.
(2) Demand module, where the final energy demand data of each sub-sector are entered with their corresponding branches. In this case, vehicular classes with their particular technologies and fuels consumed.
In this way, the hierarchical tree has been designed into its different branches with the available data for the base year [55].
The LEAP model hierarchical structure applied to the vehicle fleet of Ecuador is grouped according to the following (see Figure 1):
(a)
socio-economic statistics,
(b)
passenger and cargo vehicles groups with their corresponding classes,
(c)
energy policies applied to different scenarios, and
(d)
energy source type that the vehicle consumes.
Regarding the data input, two national statistical reports of road transport in Ecuador have been compiled. The first report is the “Transport Statistics Yearbook 2016” [37], published by the National Institute of Statistics and Census of Ecuador. The second report is the “The automotive sector 2016” [56], published by the Association of Automotive Companies of Ecuador (AEADE by its acronym in Spanish). These documents include part of the necessary statistical data that has been used in LEAP to establish all scenarios with 2016 as the base year.
Moreover, as support by the data input for the base year, a study related to the estimation of fuel consumption of the road transport in Ecuador that only presents results for 2012 was considered [57]. For the demand methodological analysis, the stock-turnover model has been used, where the energy consumption in the road transport sector for each vehicle class is defined by Equation (1):
E C   =     T S V i ( t )   ×   V K T i ( t )   ×   F E i j ( t )
where TSV is the total stock of vehicles of class i, VKT is the average annual vehicle kilometer traveled (mileage) of the class i, and FE is the average fuel economy of class i of the fuel type j (vehicle kilometer/liter), in the time t in years. Then, the results of each class are added together, and the total energy consumption of the sector is obtained [58].
Due to the lack of information in the country regarding the fuel economy for each vehicle class, average values that correspond to the same vehicle technology that circulates and that are sold currently in Ecuador have been used. These values were taken from the document “Fuel Economy Guide 2018” [59] published by the U.S. Department of Energy and from the document “2018 Fuel Consumption Guide” [60] published by the Government of Canada.
In the case of atmospheric polluting emissions, the emission per consumed energy unit is the used method for each vehicle type and fuel source, where environmental effects, the category, and its measurement unit, are based on the Technology and Environmental Database (TED). TED includes emission factors proposed by the Intergovernmental Panel on Climate Change (IPCC) [23], and presents, by default, a large number of multiple effects in a hierarchical way, according to the energy demand for the road transport sector [54,61]. The emission forecast has been estimated using Equation (2):
E P   =     E C j ( t ) × E F j k ( t )
where EC is the energy consumption of the fuel type j and EF is the emission factor of pollutant type k under fuel type j, with time t in years.
Finally, the lifecycle profiles have been included. These describe the vehicle′s main characteristics that change over time, from the technological degradation behavior and the aging of the current stock. For any profile designed, their values can be entered in two ways: (1) data points curve (dp curve), where the known historical values have been introduced directly; and (2) exponential curve (exp curve), where the positive or negative constant value of the exponential curve has been specified, to each designed profile [54]. The profiles are designed using Equation (3):
V   =   V ( t 1 ) × E x p ( t × ± c )
where V is the value in % with time t in years, V(t − 1) is the initial value of the variable, and Exp(t × ±c) represents an exponential curve with a constant c in year t [62]. Among the included profiles are the following: (a) antiquity of the vehicular stock park (dp curve); (b) vehicles survival (exp curve); (c) average traveled distance degradation (exp curve); (d) fuel economy degradation (exp curve); and (e) emissions degradation (exp curve). In this way, Table 2 describes the main variables for all scenarios in the base year 2016.

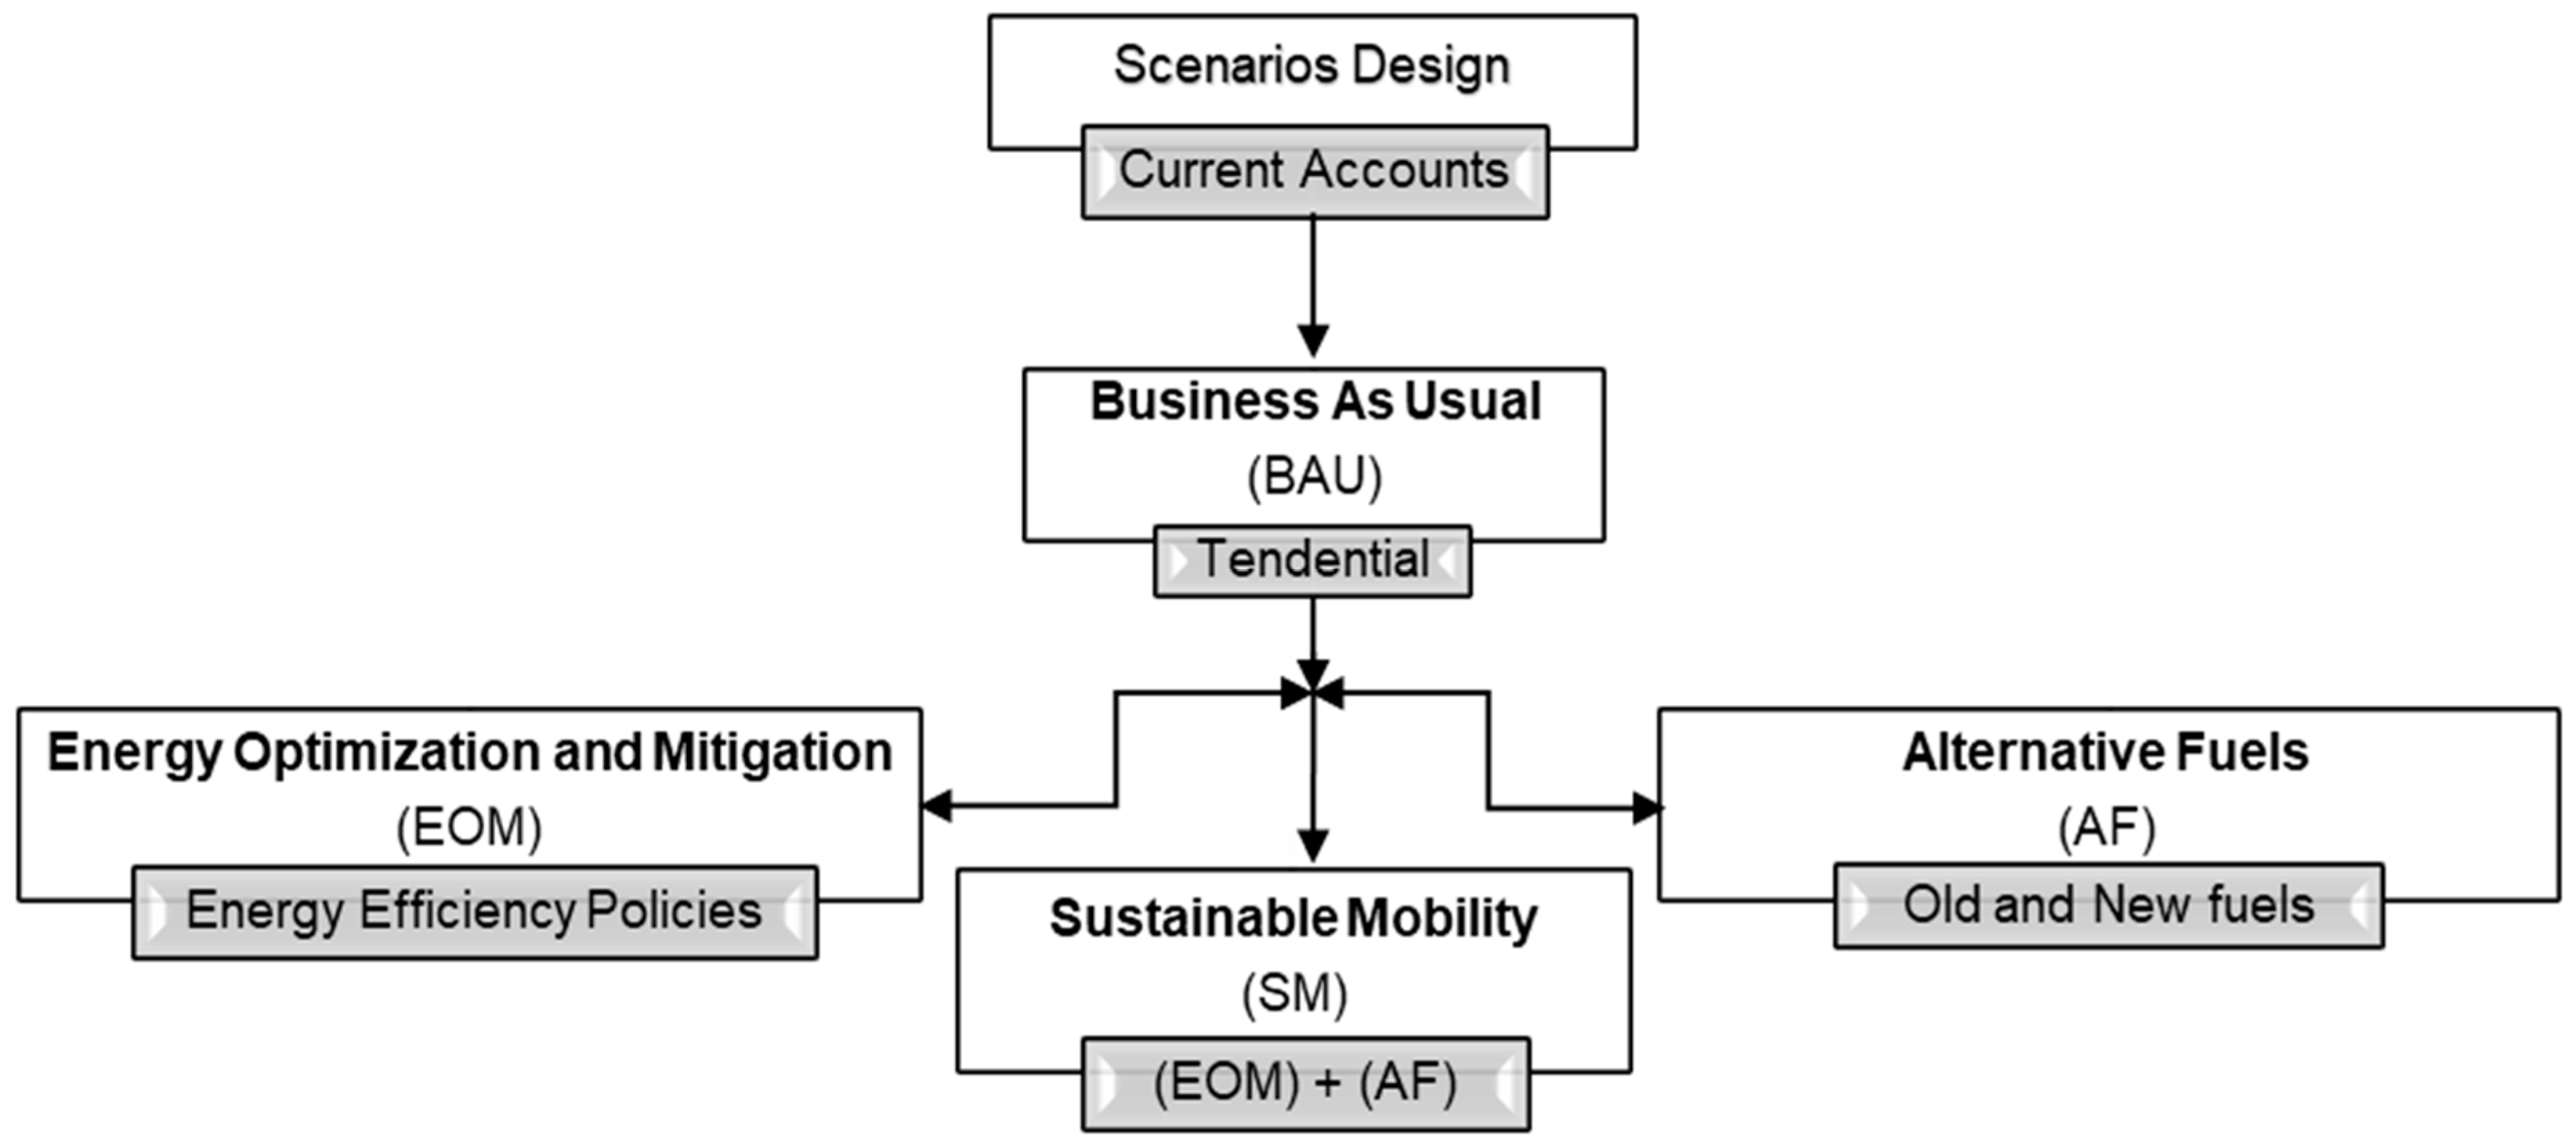
3.2. Design of Scenarios

Through the LEAP system, in the research of this energy prospective, the hierarchical relationships were established between the following four alternative scenarios: Business As Usual (BAU), which will present a similar trend behavior to its last 10 years; Energy Optimization and Mitigation (EOM) and Alternative Fuels (AF), which will implement particular characteristics for each scenario starting from the BAU scenario; Sustainable Mobility (SM), which inherits data from the BAU, EOM, and AF scenarios, in addition to its particular characteristics (see Figure 2). In this way, the scenario’s hierarchical structure has been designed in the LEAP system for road transport in Ecuador.
According to the particularity of each scenario design, plenty of different measures and initiatives of energy efficiency [6,65,66], alternative fuels [18,67,68,69,70], atmospheric emissions [71,72], and sustainable mobility [9,73,74,75], trends have been applied and integrated. National and international research institutions and researchers have developed these initiatives, who have studied the road transport sector [76].

3.2.1. Business as Usual (BAU) Scenario

The main characteristics of this scenario are focused on projecting historical annual growth trends of the vehicle fleet for each class and fuel type that it consumes, which grew 6.8% average between 2008 and 2016 each year [37]. At the same time, a slight growth of hybrid and electric vehicles sales forecast reported by AEADE have been included [77]. The Energy Efficiency Organic Law influences this new sales growth [78], which promotes the efficient, rational, and sustainable use of all energy sources.
With this statistical data for all vehicle types of the national fleet, the total passenger and cargo sale of units has been projected, which will be the same for the EOM and AF scenarios up to the year 2035. However, future sales percentage varies for each new vehicle class depending on the design of each scenario, where the new fuel types incorporation is not expected beyond those that currently exist (see Table 3).

3.2.2. Energy Optimization and Mitigation (EOM) Scenario

In this scenario, relevant energy efficiency studies and initiatives have been applied, which have been considered for their potential importance in public policies for road transport in Ecuador, supported by Energy Efficiency Organic Law [78].
Considering the energy efficiency and optimization initiatives, the average goal percentage of energy demand reduction for passenger vehicles would be 5% to 2025, 15% to 2030, and 20% to 2035 [45,79,80,81]. For the cargo vehicles, it would be 5% to 2025, 10% to 2030, and 15% to 2035 [82,83,84,85]. Among the most important initiatives that have been incorporated, the following can be cited:
-
Scrapping through “Plan RENOVA” with tax incentives for the renewal of older vehicles that completed their life cycle [48].
-
The improvement of fuel quality and the use of more efficient engines that achieve savings of up to 10% in 2035 [40].
-
The improvement of the urban, interurban, and interregional public transport quality [86,87].
-
Improvement of the efficiency in the passengers interurban transportation BRT (Bus Rapid Transfer Systems), mainly for the largest cities in the country [88].
-
The income of massive and sustainable urban public transport (The Quito Metro, Cuenca tram), and the implementation of cargo and passenger electric trains between Quito and Guayaquil [89].
-
Campaign for improving driving conditions and vehicular traffic flow (eco-driving initiatives) [90], together with smart traffic lights and urban planning [81].

3.2.3. Alternative Fuels (AF) Scenario

In this scenario, through a public policy strategy related to the energy matrix change of Ecuador [91], the Energy Efficiency Organic Law [78], and the Productive Development Law [92], the increased usage of several alternative fuels [18,20,93,94,95,96,97,98,99] is encouraged, for the vehicular market in the road transport sector in Ecuador. In this sector, through tax incentives, the state promotes the removal of VAT on hybrid and electric vehicle imports for private use, passengers transport, and cargo transport [92].
Thus, for this scenario design, it follows the same vehicle demand growth in future sales as the BAU and EOM scenarios. However, in this case, the alternative fuels and new vehicular technologies have been introduced to the fuels market, compatible with the current and new fuels. The new alternative fuels will be bioethanol (E10) [57,72,100], biodiesel (B10) [16,22,57,79], liquefied natural gas (LNG), compressed natural gas (CNG) [91], liquefied petroleum gas (LPG) [57], and of another type like electricity. The new vehicle technologies that enter in this scenario are Bi-Fuel, different models of Hybrid; Full Hybrid (HEV) and Plug-in Hybrid (PHEV) vehicles; Battery Electric Vehicles (BEVs); and those compatible engines with LPG, LNG, and CNG consumption [50] to reduce air pollution, GHG emissions, and noise pollution in cities [101].

3.2.4. Sustainable Mobility (SM) Scenario

For the design of this scenario, all characteristics of energy efficiency and mitigation, and alternative fuel scenarios have been inherited through a hierarchical structure in the LEAP model. In addition, a new trend group and sustainable mobility projects have been included [8,9,47,70,88,102,103]. Globally, some of these initiatives have already been incorporated, and it is expected that, in the next years, they will be adopted by developing countries [104]. Among the main additional initiatives to be integrated are the following:
-
Energy-saving and emission reduction as a result of the decrease of the vehicle fleet due to car-sharing and moto-sharing projects [105,106].
-
The massive use of electric bike-sharing for improving the sustainability of integrated transportation system [107] through public and private rental companies [75,87,108].
-
Use of electric scooter, electric segway, electric hoverboard in urban areas [71].
All these new projects still present uncertainty of the real impact in the future, but what is indisputable is that they are becoming increasingly important in road transport, and are present in cities these days. In this context, for the design of this scenario, it has been considered that future vehicle sales have a slight and gradual decrease, where fewer passenger private vehicles are sold each year for urban transport towards 2035. In this case, this scenario differs from the previous three, where BAU, EOM, and AF have the same global sales demand but have different percentage configurations for each vehicle’s class and fuel type that consume (see Table 3).

4. Results and Discussion

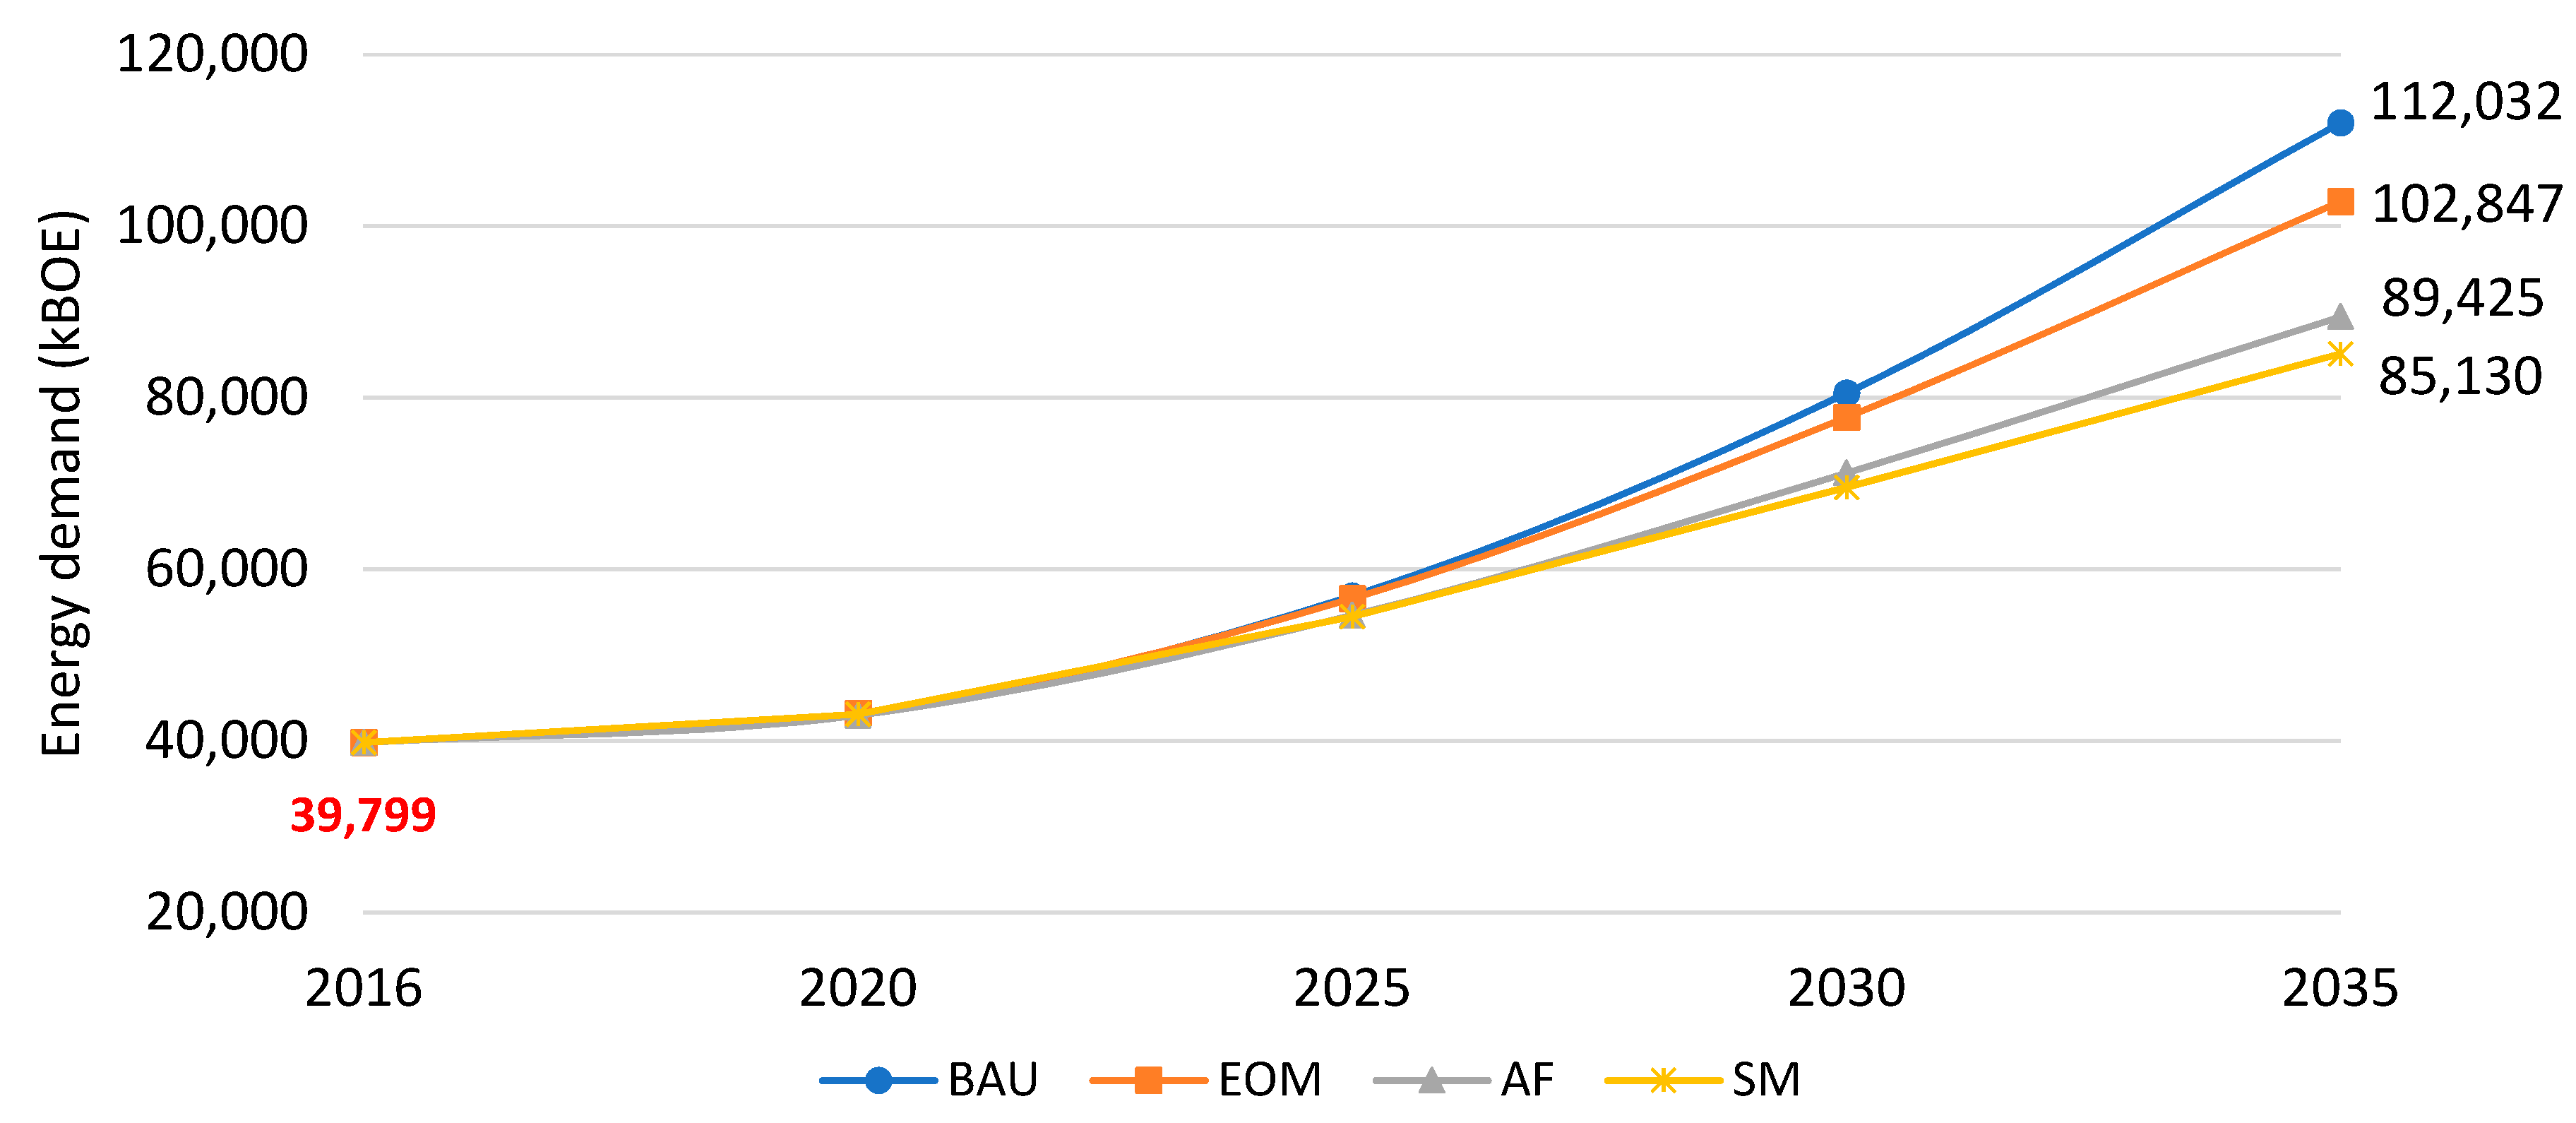
4.1. Energy Demand Forecasting

The analysis indicates that the energy demand for the scenarios has a difference in growth due to the fuel type that the vehicles of the Ecuadorian road transport sector consume. Figure 3 shows the energy demand growth trend in road transport for each scenario between 2016 and 2035. The differences in demand between scenarios began to be seen from 2025. For the BAU scenario, the energy demand trend is maintained, with a growth of 181.49% between 2016 and 2035. For the EOM scenario, the estimate shows a growth of 158.41%, for the AF scenario, a growth of 124.69%, and in the case of the SM scenario, a growth of 113.89%. The most significant difference in demand is among the BAU scenarios (higher) and SM (smaller) having a difference of 26,902 kBOE, which would indicate an energy demand reduction of 31.60% in 2035. Thus, the estimates show that in the whole analysis period, the average energy demand would be 97,358.50 kBOE.

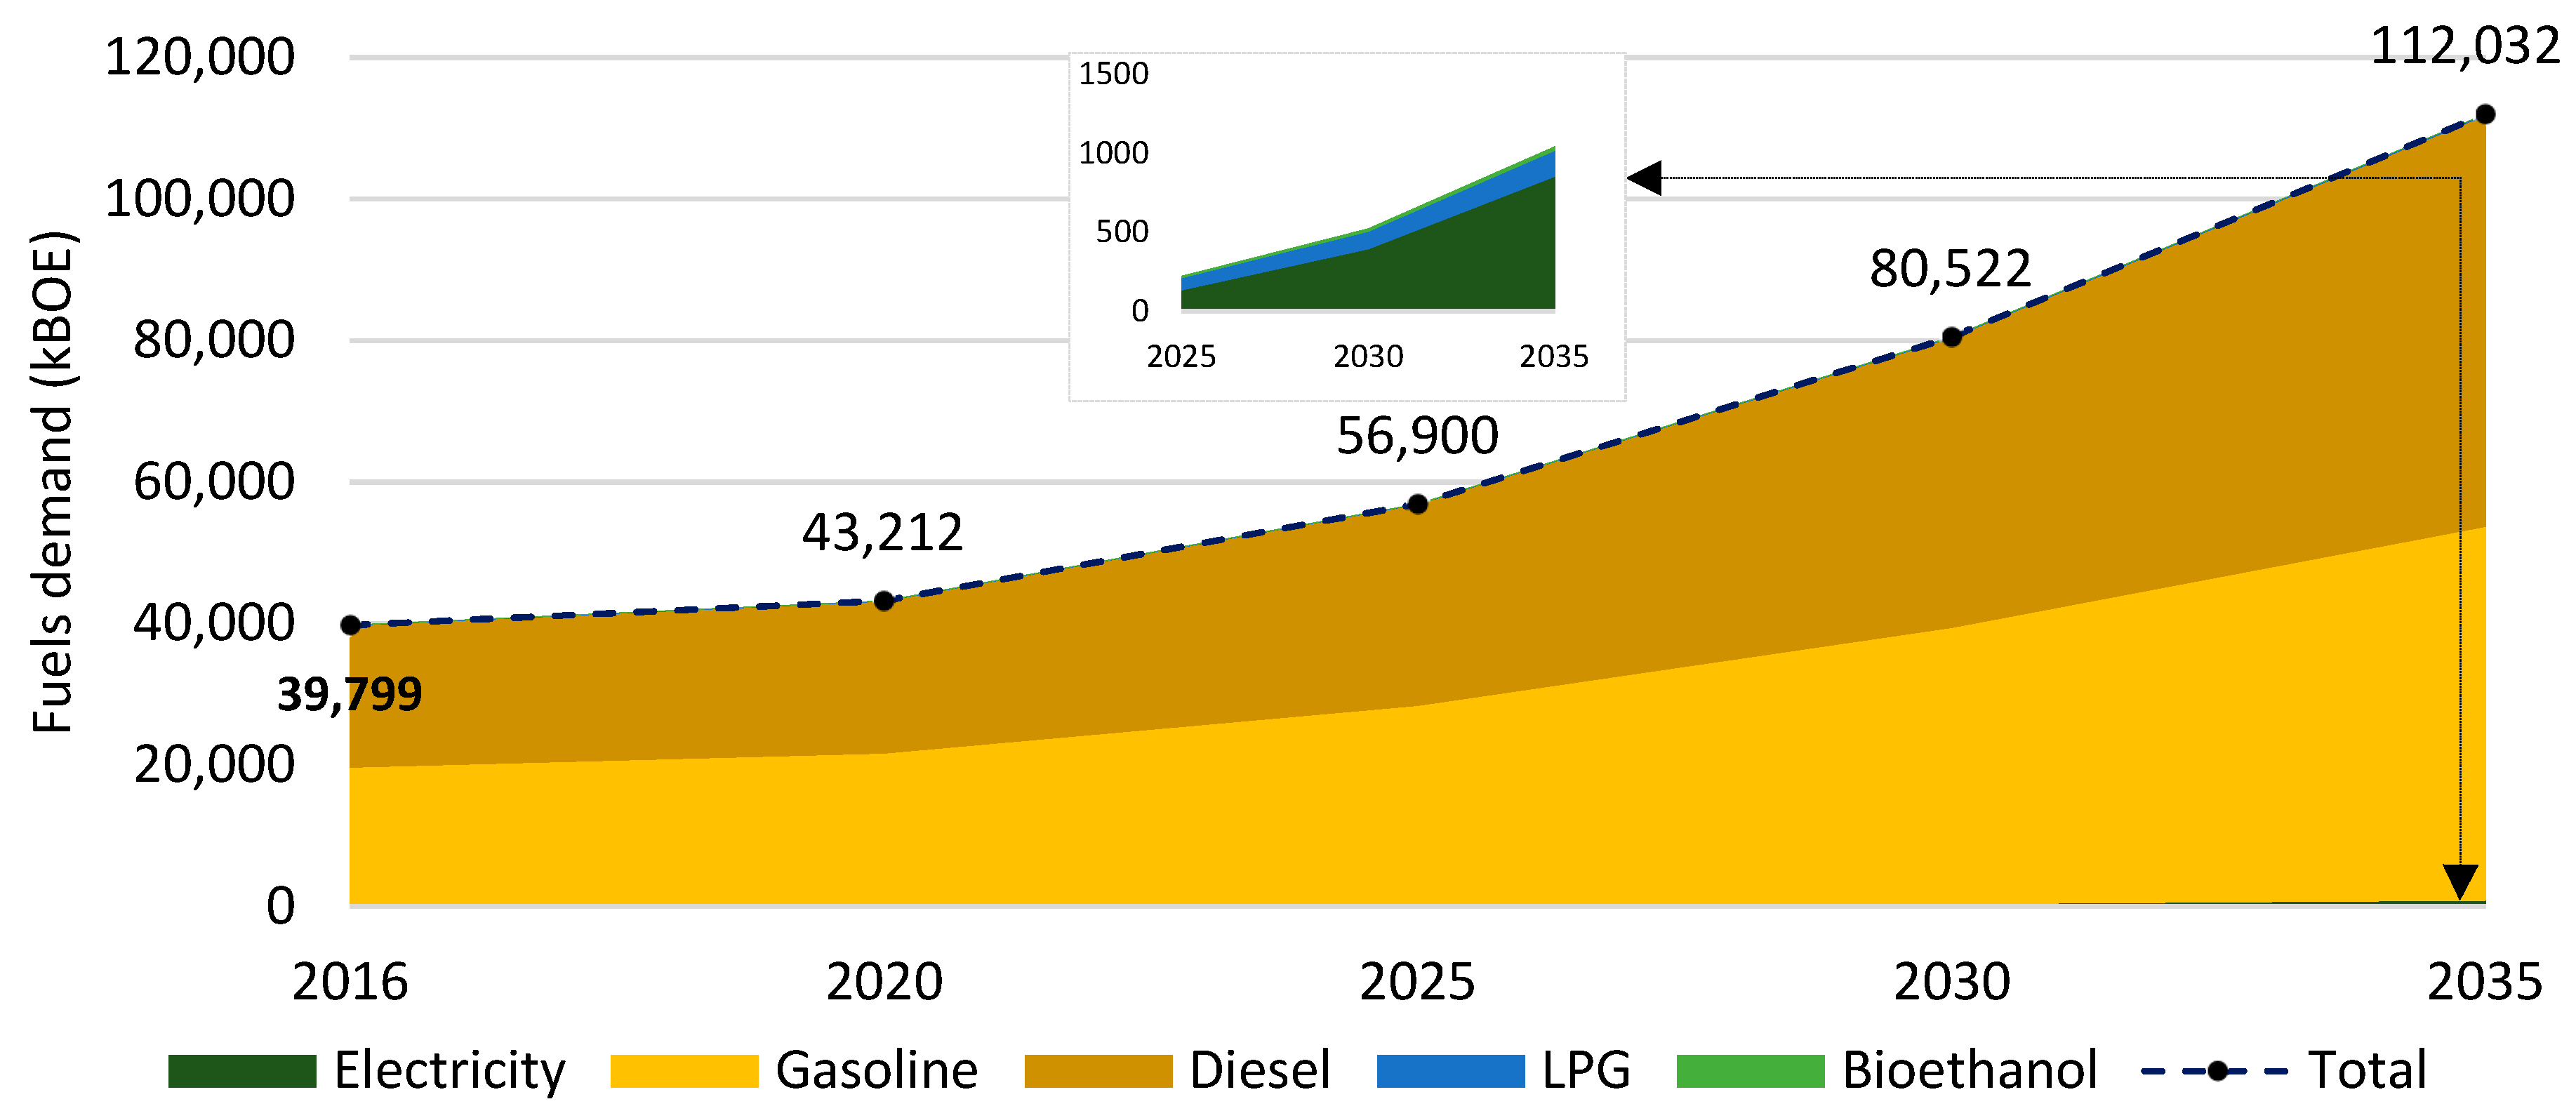
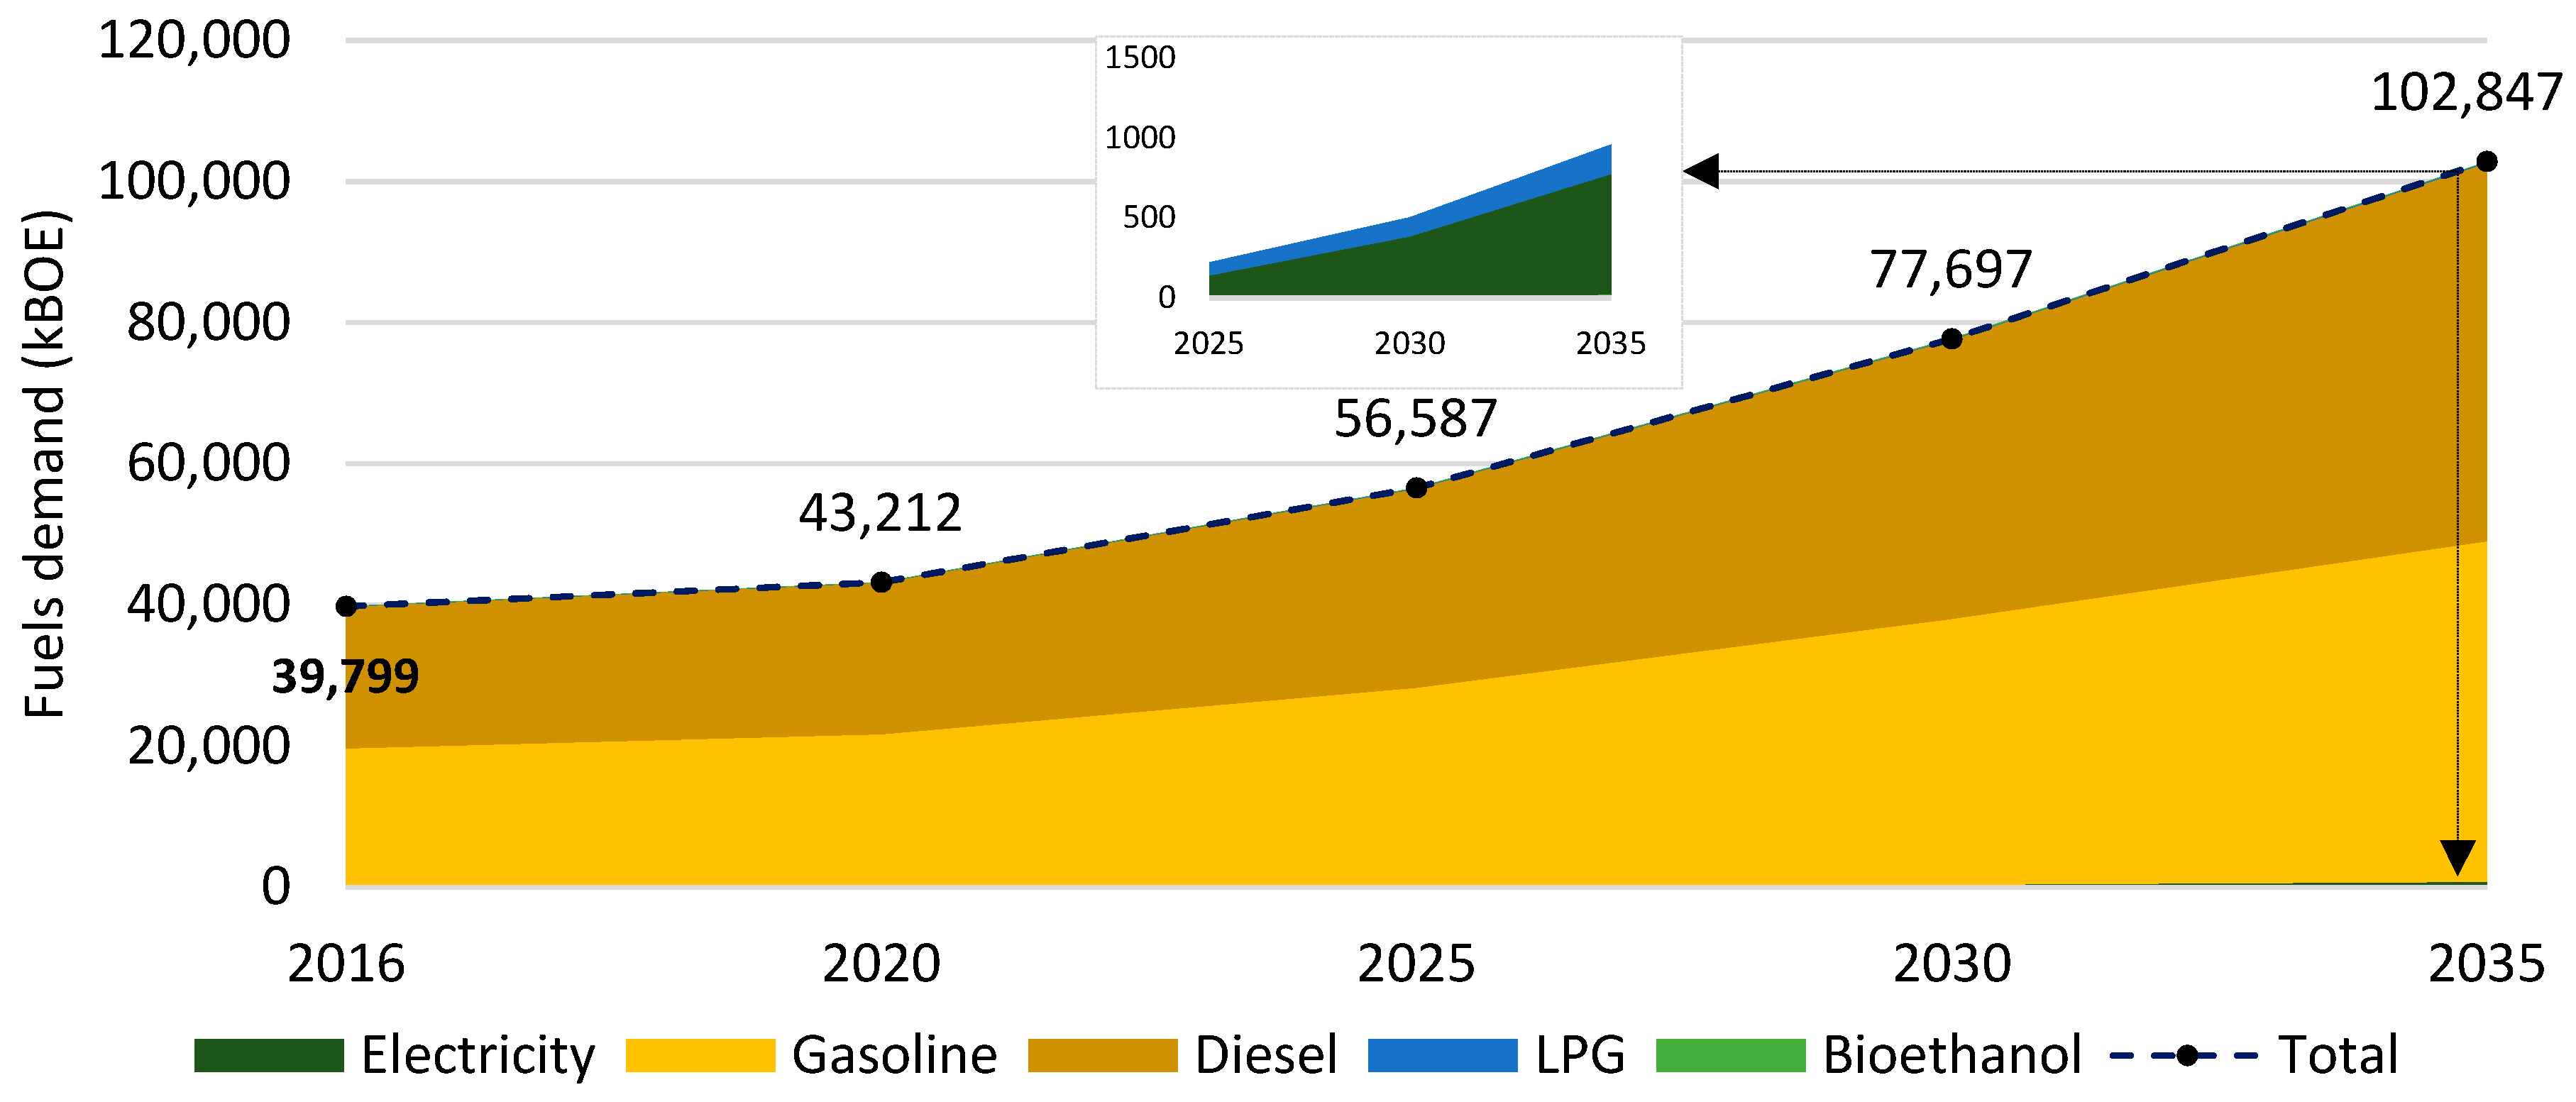
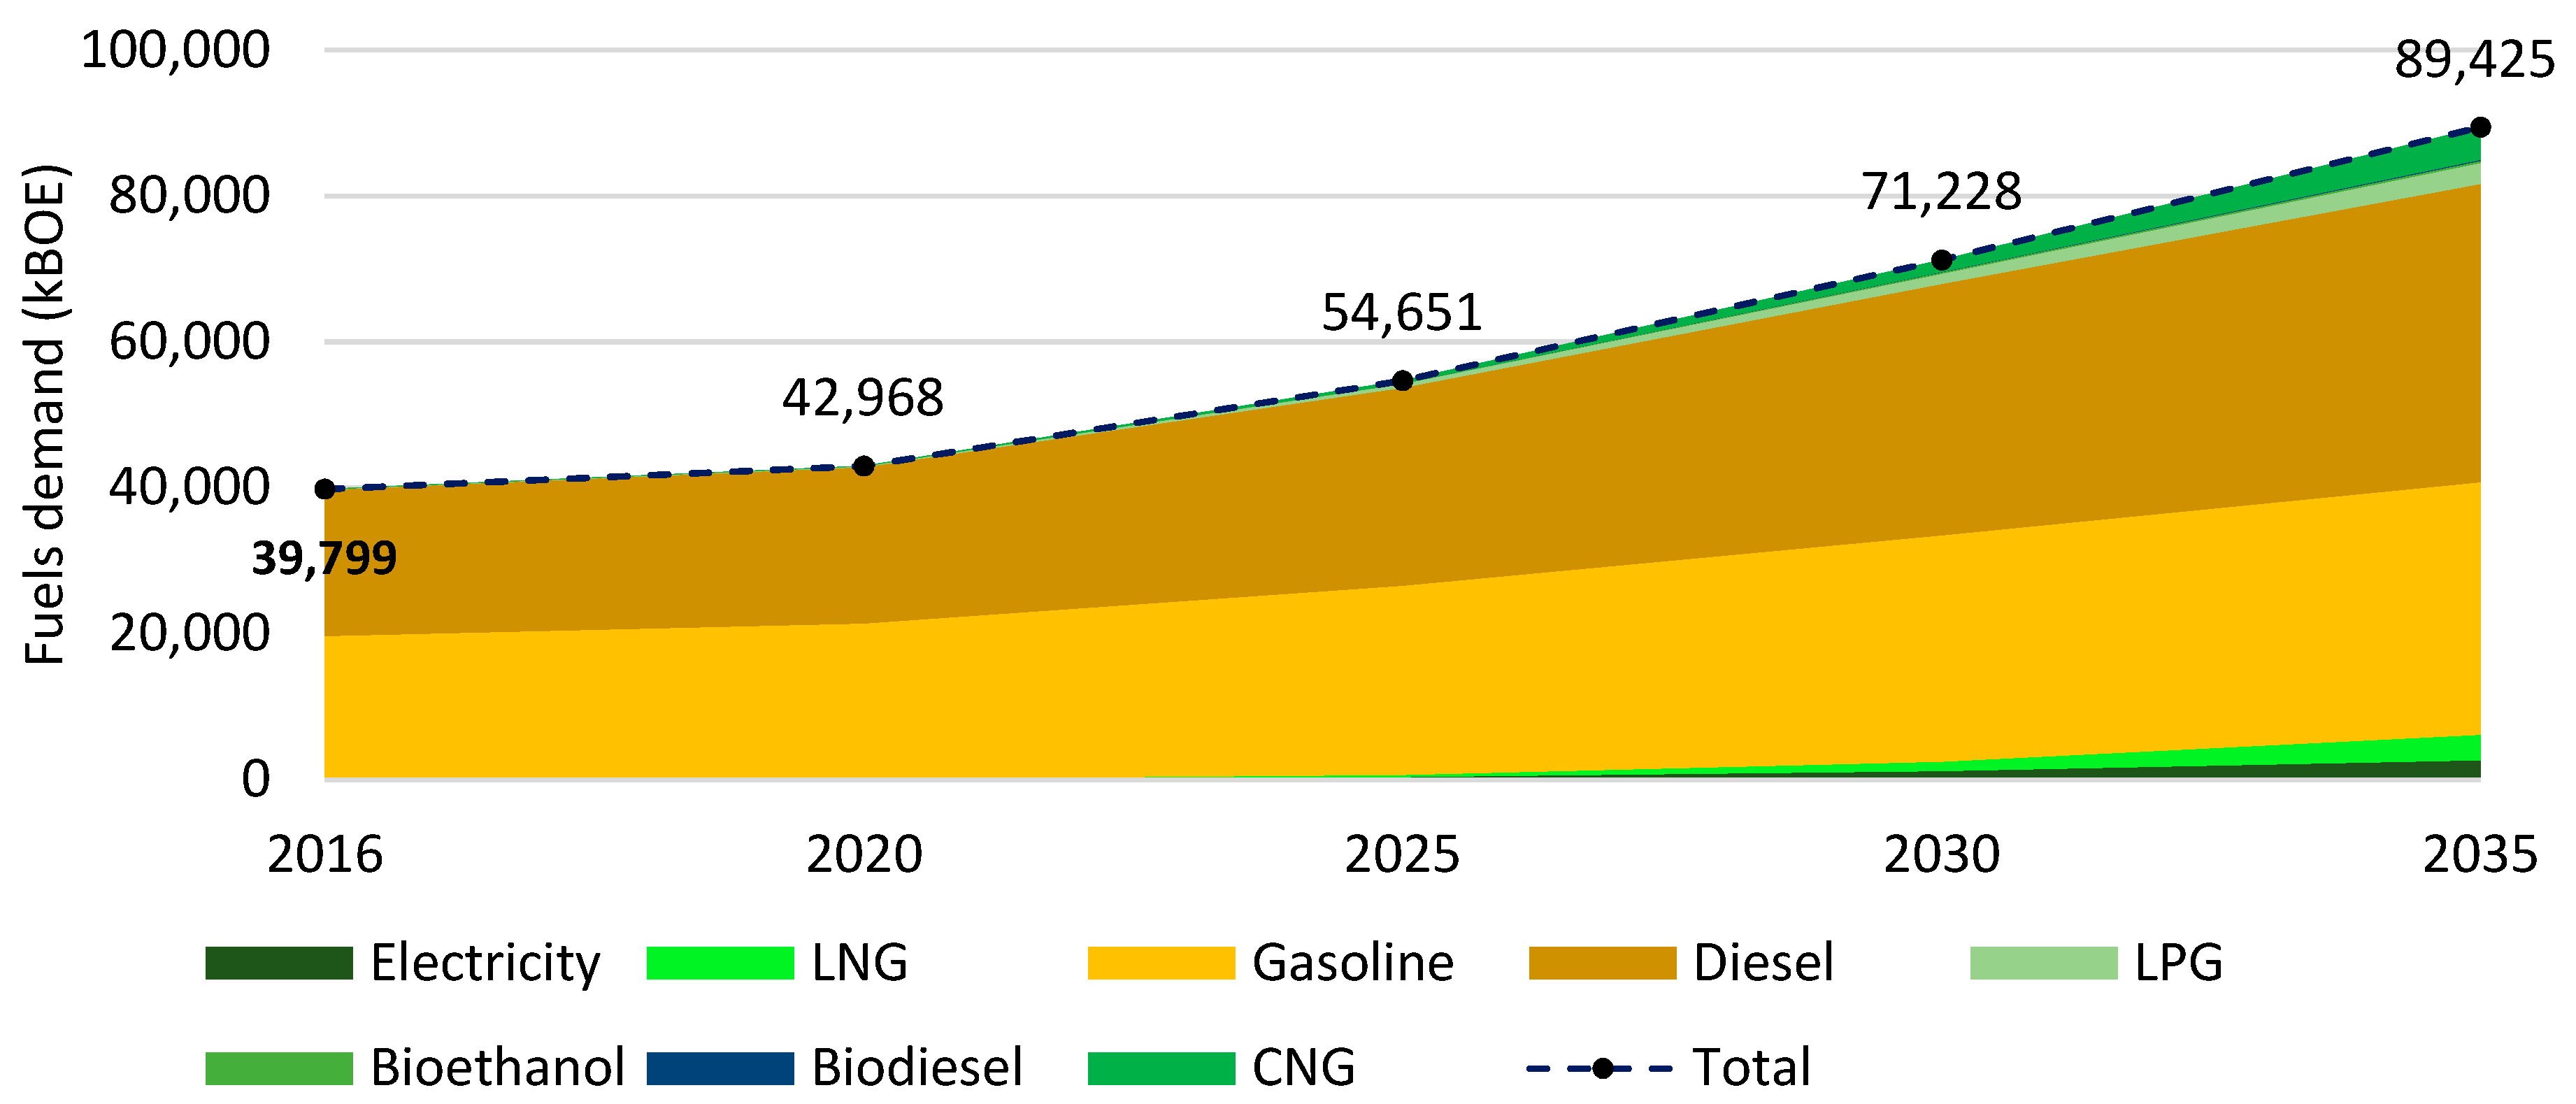
4.2. Fuels Demand Projections

The fuel demand forecast for each scenario shows that BAU maintains its trend, and there are no significant changes regarding historical behavior (see Figure 4). In this scenario, gasoline with 49.42% in 2016, decreases to 47.15% in 2035. In the case of diesel, its contribution was 50.42% in 2016, and it grows slightly to 51.92% by 2035. In contrast, although the electricity demand grows 137 times, and goes from 6.18 kBOE in 2016 to 853.52 kBOE in 2035, its global contribution is barely 0.76%. For the other fuels in this scenario, LPG and bioethanol, their demand is not significant, where they barely reach 0.2% in 2035. Therefore, it is unquestionable that diesel and gasoline continue to be the principal energy sources, concentrating 99.07% of the total in 2035.
In the EOM scenario (see Figure 5), the percentages of energy demand are very similar to BAU. The gasoline has a contribution of 46.97% and diesel 52.09% by 2035. However, between 2016 and 2035, the total fuel demand for EOM relative to BAU decreases by 39,688 kBOE, close to the total demand of 2016 (39,799 kBOE). This very significant result confirms that through the application of energy efficiency policies, a considerable saving in energy demand could be guaranteed.
For the BAU and EOM scenarios, the results show that the combined energy demand for electricity, bioethanol, and LPG do not reach 1%, which is practically insignificant; this is an effect of the design of these scenarios due to the there is not a significant inclusion of vehicles that consume alternative fuels.
In the AF scenario (see Figure 6), the global demand for energy grew by 124.69% towards 2035. However, due to the implementation and promotion of policies that promote vehicles that consume fuels from alternative energy sources for road transport. The accumulated energy demand decreased 120,944 kBOE, relative to BAU in the 2016–2035 period, that is, the approximate equivalent to the total energy consumption of 2016, 2017, and 2018 altogether.
According to the fuels demand for the AF scenario, slight changes appear in the alternative fuels demand after 2025, but this demand continues to be low with 2.87% for that year. However, this demand continues to grow up to 15.57% (CNG 5.01%, LNG 3.88%, LPG 3.22%, electricity 2.99%, bioethanol 0.32%, and biodiesel 0.15%), from which 8.89% would be powered by natural gas in 2035. This means 9.5 times more compared to BAU.
In conclusion, the total share of accumulated alternative fuels demand of AF would be 75,256 kBOE between 2016 and 2035 (CNG 22,042 kBOE, LNG 16,975 kBOE, LPG 18,121 kBOE, electricity 15,395 kBOE, bioethanol 2175 kBOE, and biodiesel 548 kBOE), which would represent almost the total energy demand of the road transport sector (74,717 kBOE) in 2031.
For the SM scenario, more significant and optimistic changes are shown for the energy demands in all scenarios. First, the accumulated total difference in energy demand is 141,227 kBOE less compared to the BAU scenario until the year 2035. Next, the inclusion of alternative fuels happens to have a relevant share of 17.77% (CNG 6.16%, LNG 5.03%, LPG 3.25%, electricity 2.89%, bioethanol 0.28%, and biodiesel 0.16%), reaching 15,131 kBOE in 2035 (see Figure 7).
At the same time, the accumulated total demand for gasoline shows a decrease of 133,922 kBOE, and in the case of diesel, a fall of 79,324 kBOE relative to BAU. These values are samples of significant energy savings for the country, because nowadays, these fuels continue to be imported in large amounts, and everything suggests that this will not change in the near future. As recent as in 2016, Ecuador imported 57.86% of diesel of the total national consumption [109].
Finally, the most relevant result is that the total energy demand in the SM scenario decreases by 30.43% relative to BAU in 2035. However, the total share of diesel and gasoline continues to be essential in the whole energy mix of the road transport sector with 47.39% and 34.84%, respectively.

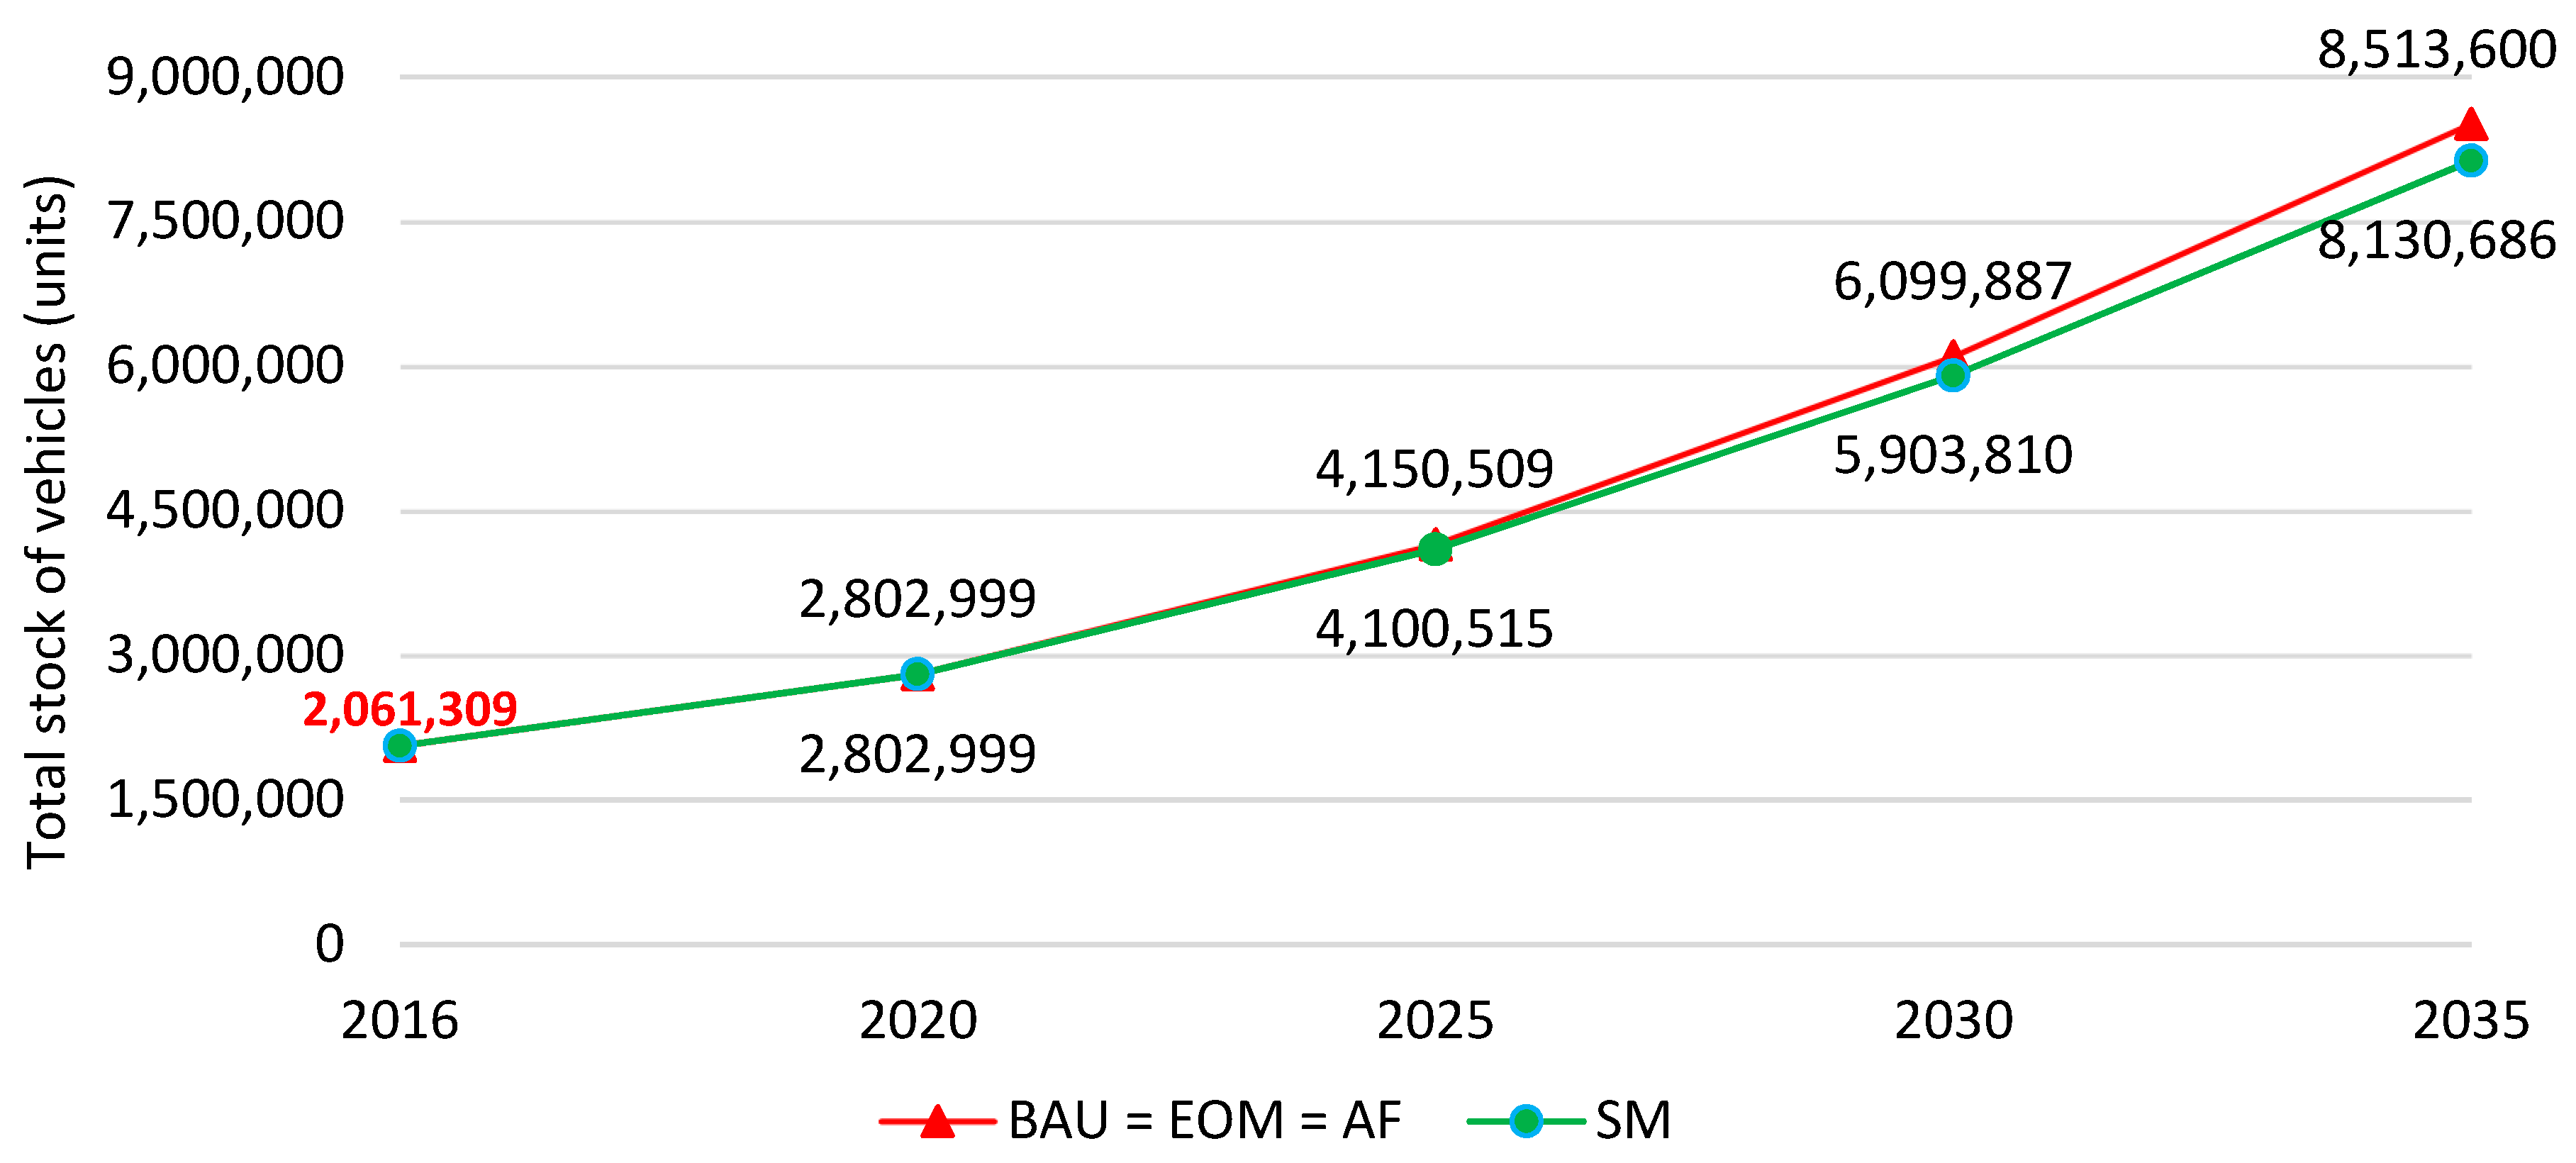
4.3. Forecast of the Total Stock of Vehicles

The forecast of the total stock of vehicles presents an identical growth for the BAU, EOM, and AF scenarios, and different from SM, which grows slightly less (see Figure 8). This result is a consequence of the SM design, where the reduction of the vehicle fleet through car-sharing and moto-sharing, the extensive use of electric bikes is promoted, and through the addition of electric scooter, electric Segway, and electric hoverboard for urban areas.
The total growth of the stock of vehicles for BAU, EOM, and AF is 313%, growing from 2,061,309 to 8,513,600 units, while for SM, it represents a growth of 294.44%, reaching 8,130,686 units, between 2016 and 2035. This means that SM would have an accumulated decrease in 2,287,935 vehicles compared to the other three scenarios in the same period (1,923,166 passenger vehicles and 364,769 cargo vehicles), which is comparable to the total stock of vehicles in 2017 (2,312,197 vehicles).
In the assessment of passenger vehicles of SM regarding the other three scenarios, the accumulated stock of cars decreases 1,507,069 units and of off-roads decreases 1,335,084 units. Together, as it is a scenario where sustainable mobility policies are promoted, the accumulated buses stock increases in 227,564 units, passenger vans in 106,858 units, and motorcycles in 584,585 units, this is outstanding since motorcycles represent 48.73% of the total sold units in SM until 2035.
In the case of SM cargo vehicles, there is an accumulated decrease in the pick-up stock in 445,185 units. Consequently, as a result of the applied policies for this scenario, the accumulated stock of cargo vans increases in 39,344 units, cargo trucks in 29,322 units, trailer trucks in 7347 units, tanker trucks in 3253 units, and dump trucks in 1149 units.

4.4. Forecast of Emissions

As a consequence of the combustion of the fuel, between 2016 and 2035, a different quantity of atmospheric pollution emissions take place according to each demand scenario in the road transport sector. Consequently, this section has been divided into two parts to be analyzed: (1) results of the GHG emissions that contribute to global warming, (2) the results of pollutant gas emissions that degrade the air quality. In this particular case, the nitrogen oxides emissions are represented by NOx and the emissions of particulate matter are represented by PM10.

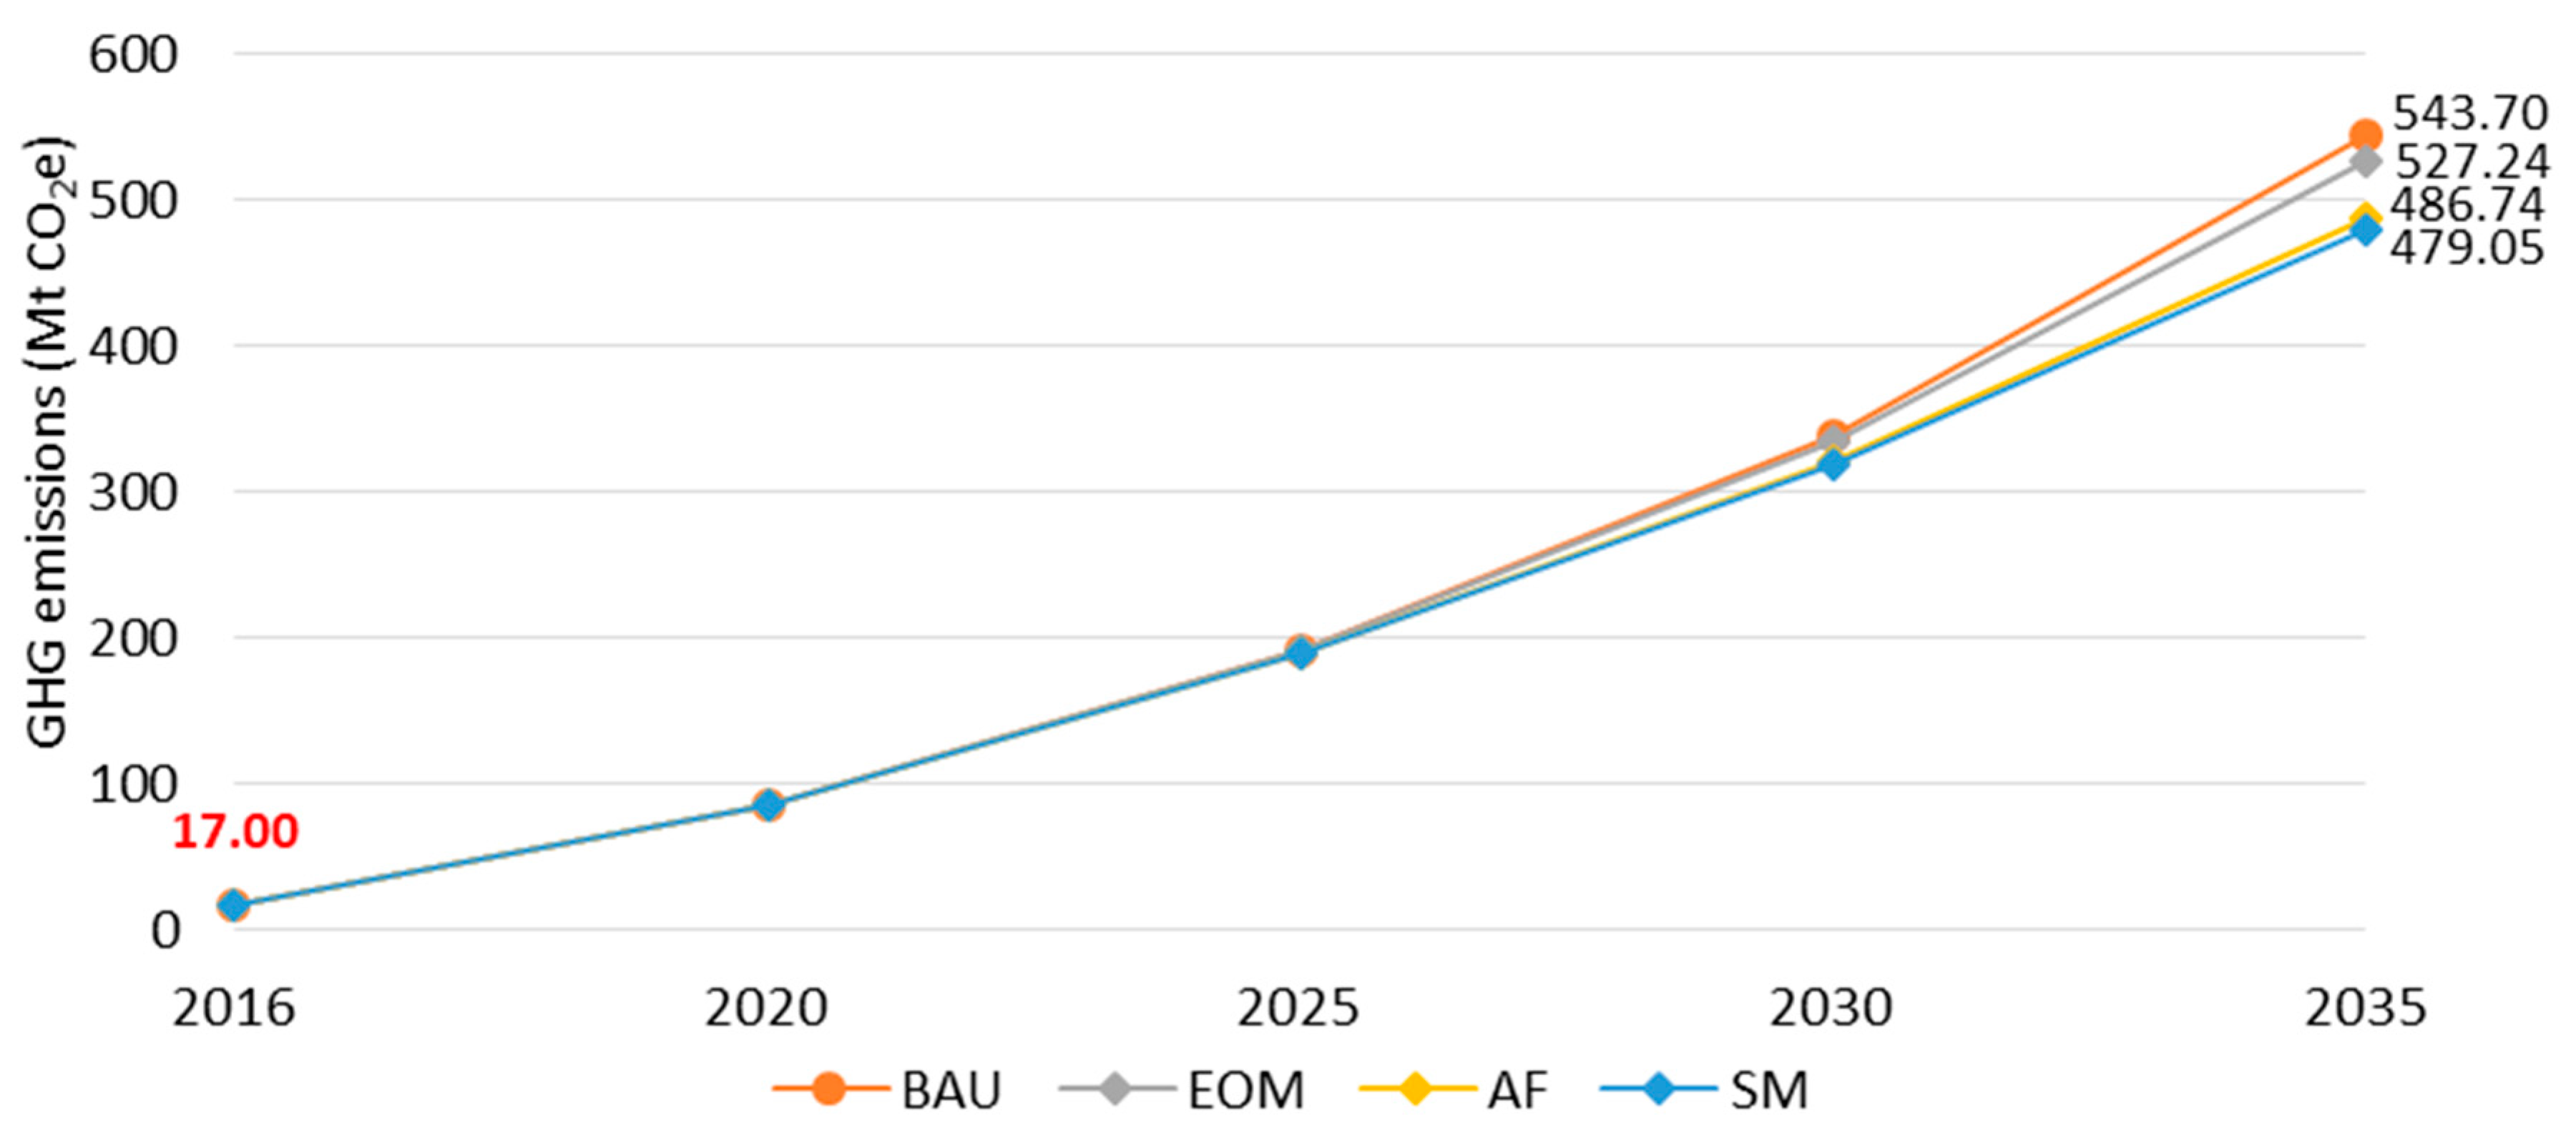
4.4.1. Greenhouse Gas (GHG) Emissions

The estimates of GHG emissions are measured in CO2 equivalent (CO2e) units, which are presented for all scenarios in Figure 9. For EOM relative to BAU, the total of accumulated GHG emissions fall by 3.12% between 2016 and 2035, which represents a reduction of 16.46 Mt CO2e (million metric tons) emissions into the atmosphere, due to lower demand for diesel and gasoline.
Likewise, it is interesting that for AF and SM scenarios, where sustainable mobility policies have been integrated and alternative fuels introduced, the expected happens. In AF related to BAU, the accumulated GHG emissions decreased by 11.70%, the equivalent to 56.96 Mt CO2e, due to the emissions reduction caused by the lower average fuel demand of diesel and gasoline per vehicle.
For SM relative to BAU, something similar to AF happens, where the accumulated GHG emissions decrease to 13.49%, which represents 64.65 Mt CO2e, in the same study period. This is a consequence caused by the decreased cumulative emissions by the combustion of LPG, CNG, and LNG until 2035. However, it is noteworthy to highlight that the accumulated GHG emissions caused by gasoline and diesel consumption decrease by 54.41 and 34.16 Mt CO2e, respectively.

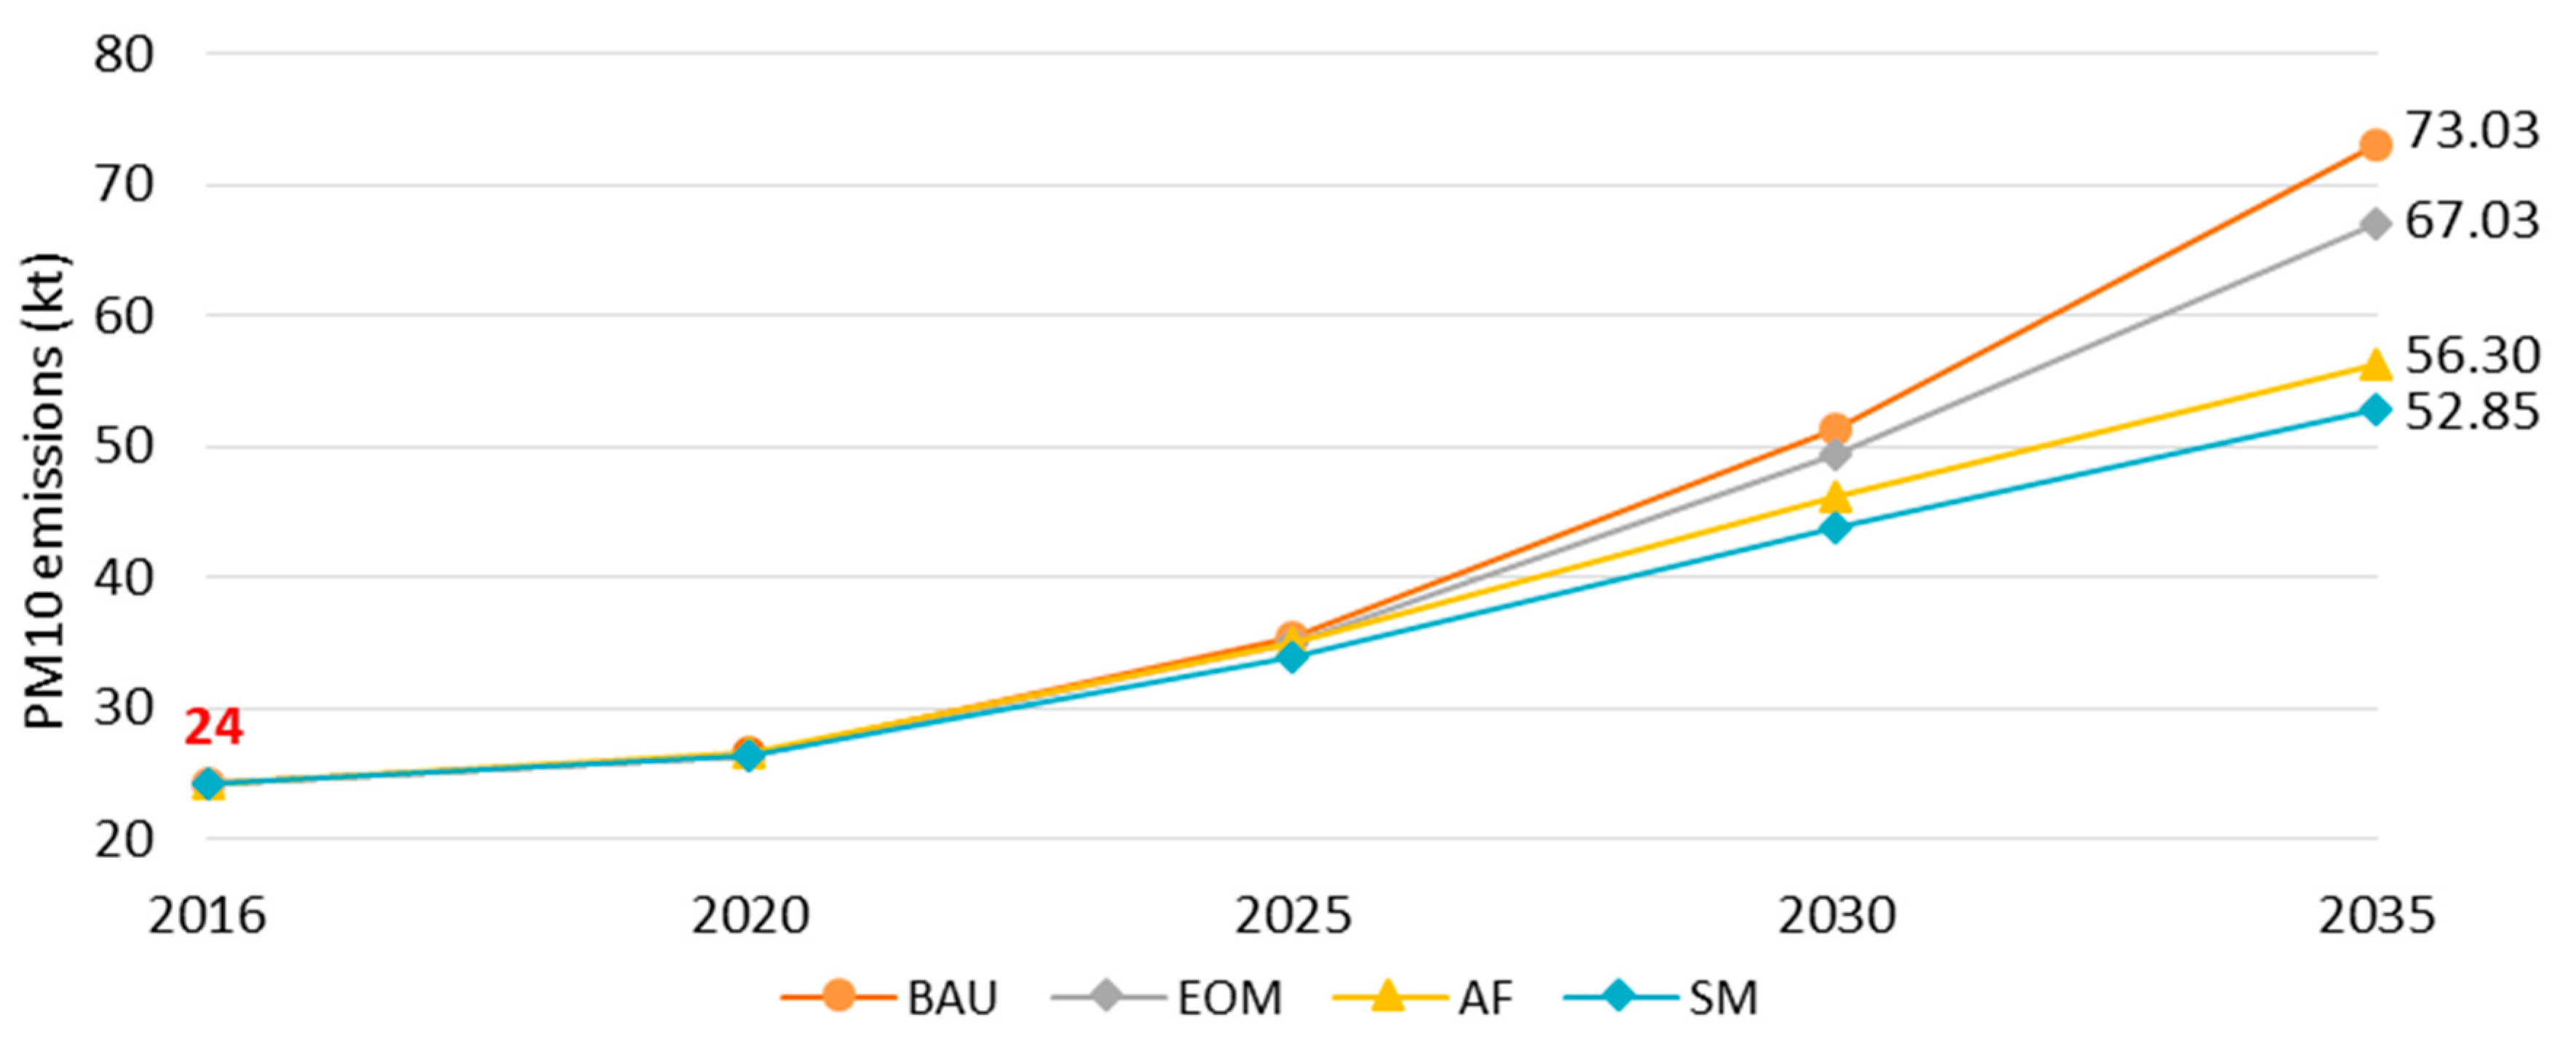
4.4.2. NOx and PM10 Emissions

As a result of the fossil fuel combustion, several pollutants are produced in different concentrations that affect air quality. In this investigation, two of the most common pollutant compounds that affect human health have been considered for their estimation; the nitrogen oxides, NOx, and particulate matter, PM10, which corresponds to the particulate fraction of the Total Suspended Particles (TSP), with a diameter less than 10 microns [110].
For NOx emissions, the accumulated emissions of SM, AF, and EOM decrease, relative to BAU, by 684.24 kt (thousand metric tons), 591.32 kt, and 166.21 kt until 2035, respectively (see Figure 10).
Moreover, NOx emissions have been significantly reduced per vehicle unit between 2016 and 2035. In 2016, for BAU, the NOx average emissions were 0.077 t/vehicle (metric ton per vehicle), while the average emission for BAU, EOM, AF, and SM are 0.054, 0.050, 0.041, and 0.040 t/vehicle in 2035, respectively. In this way, the integration of new energy efficiency and mitigation measures is justified because there is a direct relationship between fuel consumption and atmospheric pollution.
Regarding the annual emissions of the particulate matter PM10, these present a behavior similar to the NOx emissions. That is to say, while the consumption of fossil fuels increases, the PM10 emissions increase too. Specifically, in BAU, the PM10 emissions are tripled, while in SM they are doubled from the base year until 2035 (see Figure 11). Nevertheless, it should be considered that for the two scenarios, the stock of vehicles has almost quadrupled (see Figure 8).
Regarding the accumulated PM10 emissions, between 2016 and 2035, the SM, AF, and EOM scenarios show a reduction of 13.78%, 9.53%, and 4.4%, relative to BAU, respectively. At that time, diesel continues to be the primary emissions responsible for this pollutant each year, with an average of 86.36% in SM, 91.58% in AF, 92.93% in EOM, and 92.67% in BAU.

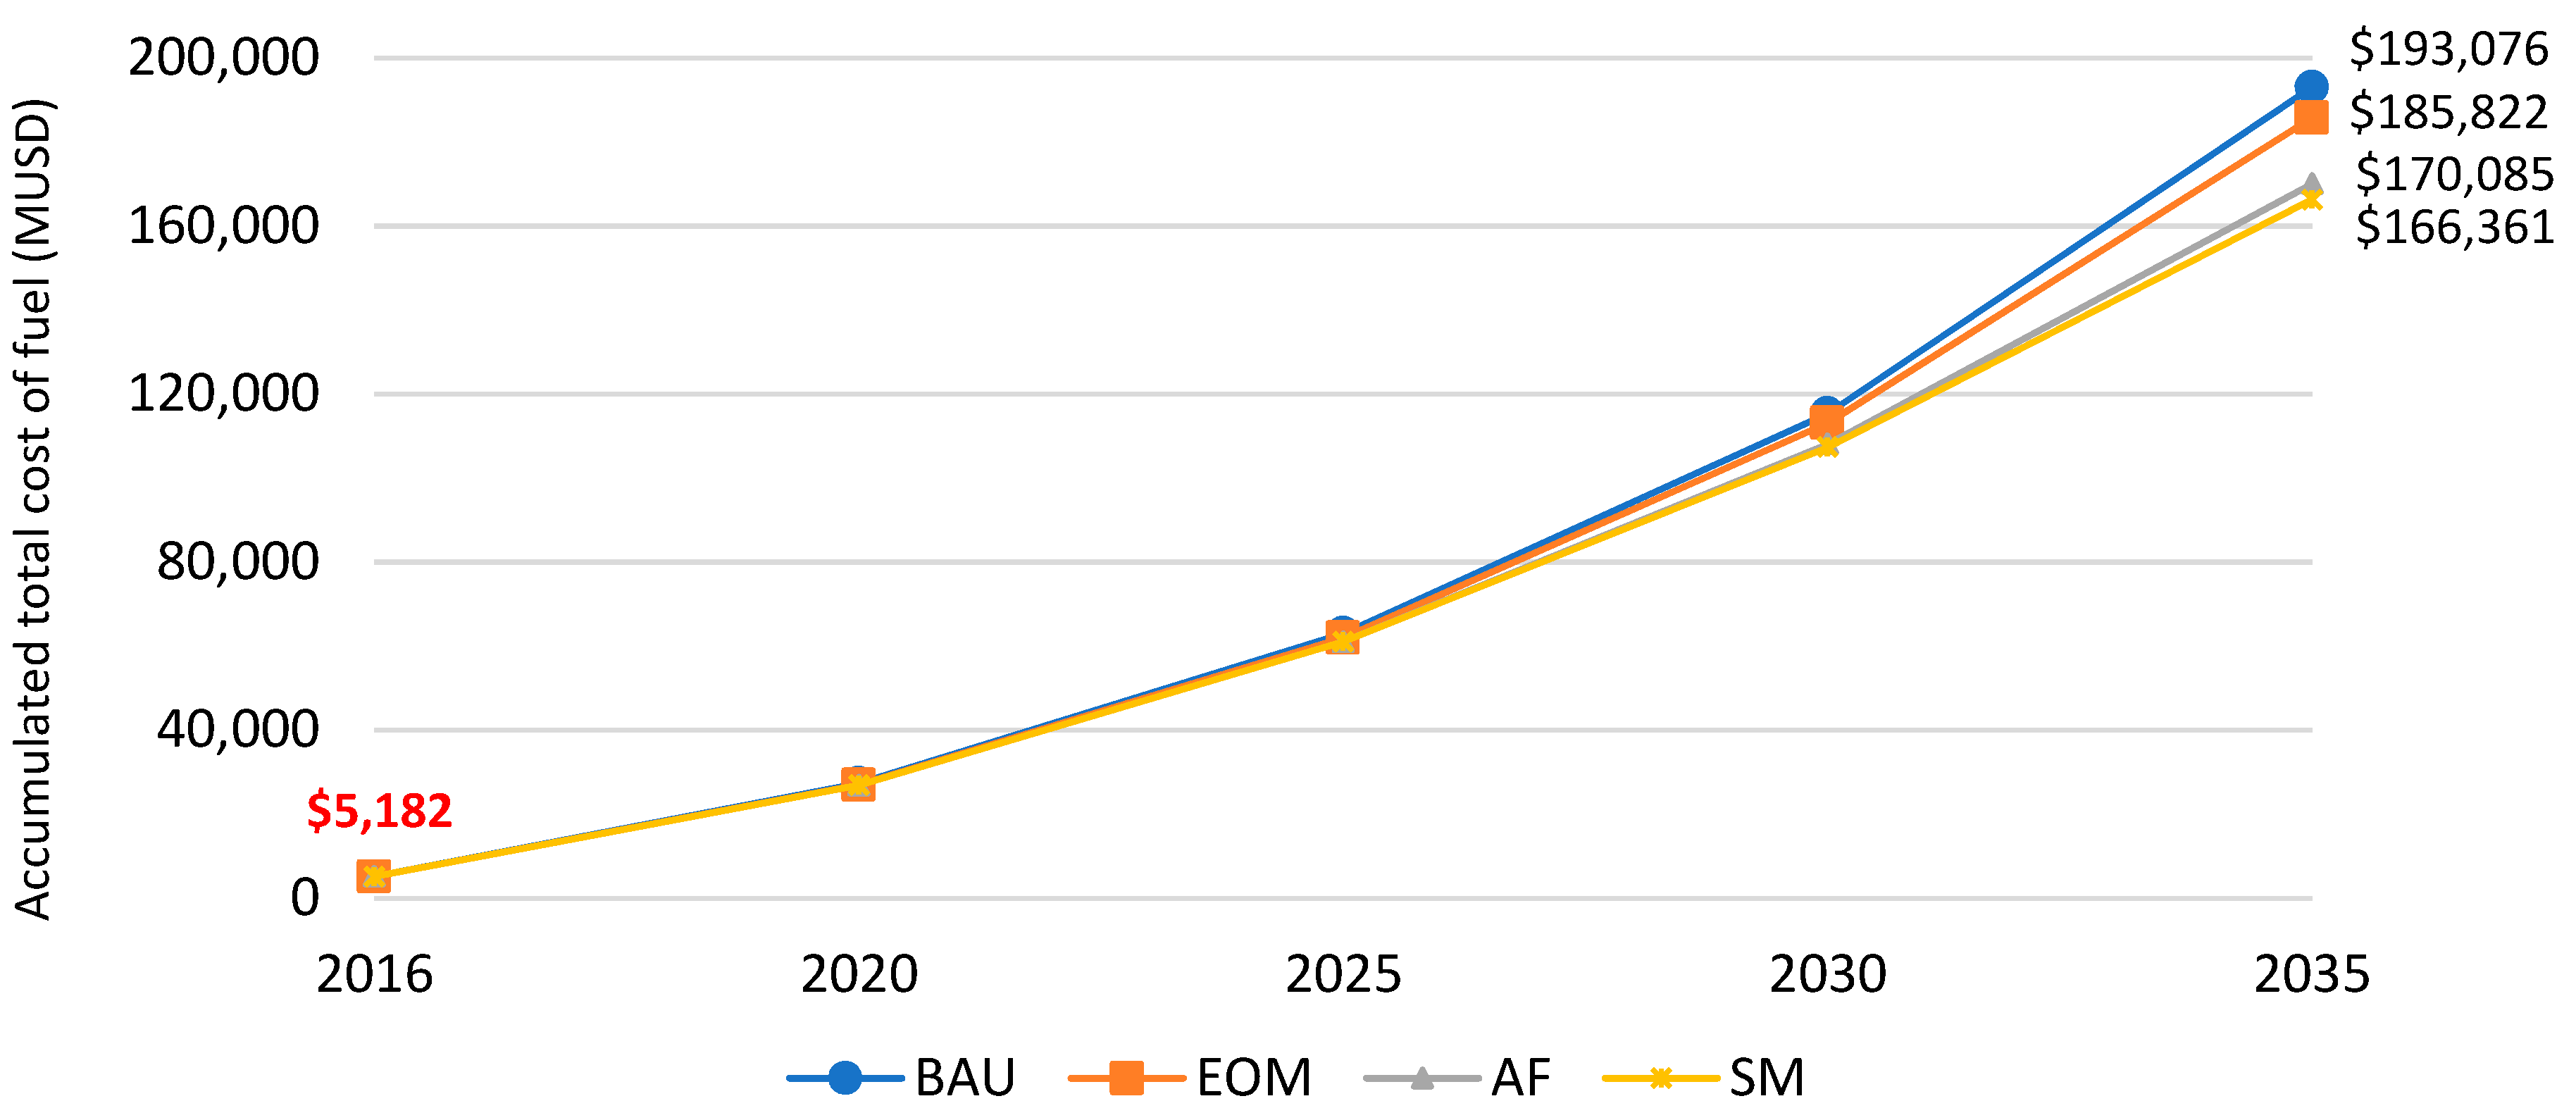
4.5. Forecast of the Total Fuel Cost Savings

Considering the estimation of international fuel prices for the transport sector up to 2050, carried out by the U.S. Energy Information Administration in its report “Annual Energy Outlook 2019” [111], Figure 12 shows the estimate of the accumulated economic cost due to the fuel consumption for each scenario until 2035. Between the SM, AF, and EOM scenarios, the accumulated savings, relative to BAU, are 14.22%, 12.24%, and 3.86% until 2035, respectively. This confirms that by applying energy efficiency and sustainable mobility policies, the benefits of energy savings and economic savings would be present. The estimated global savings for fuel consumption would be around 26,720 MUSD (million US dollars), between SM and BAU, an approximate of 25% country’s total gross domestic product in 2018 [112].

4.6. Summary and Analysis of the Main Results

In summary, Table 4 shows the main results for defined years between 2016 and 2035 every five years. Among the most relevant results are the following.
The estimation of the total stock of vehicles used in cities and on roads between the BAU, EOM, and AF scenarios regarding the SM, is higher by 382,914 units in 2035. Though the most significant fact is that, between 2016 and 2035, there will be a total of 2,287,935 fewer vehicles circulating in SM than in the other three scenarios; this is a consequence of the application of sustainable mobility policies such as the Ecuadorian Energy Efficiency Organic Law [78], where priority is given to the inclusion of passenger transport such as buses and vans, which generate a lower demand for private vehicles such as cars and off-road, and which generally carry very few passengers. At the same time, in cargo vehicles, the use of heavy cargo transport is promoted, and the use of pick-up vehicles decreases, which are often underutilized.
The total energy demand in each of the scenarios continues to grow progressively every year between 2016 and 2035. While for BAU, the demand increases by 181.49%, for SM, it increases by 113.89%. This represents 26,902 kBOE less energy only in 2035, which is equivalent to almost half of the total energy demand for SM in 2025. It is also comparable to the total diesel demand (27,155 kBOE) or gasoline (25,928 kBOE) in AF in 2025. Consequently, the SM is the most optimal scenario regarding global energy demand point of view.
Therefore, in the case of fuel demand for all scenarios, the gasoline and diesel, two of the most critical products due to their higher demand, are significantly reduced. In the diesel case, this fuel grows from 20,066 kBOE in the base year for all scenarios to 58,164 kBOE in BAU, to 53,576 kBOE in EOM, to 40,877 kBOE in AF, and 40,340 kBOE in SM, in 2035; this means a fall in diesel demand of 30.64% between SM and BAU.
Something similar happens in the case of gasoline. The demand for this fuel in the base year was 19,670 kBOE. By 2035, the demand forecast for this fuel decreases for all scenarios. For SM to 43.85%, to 34.47% in AF, and 8.54% in EOM, relative to the BAU scenario, respectively. For other energy sources, such as LPG, LNG, CNG, and electricity, it is essential to perceive that they begin to have discrete participation in 2025, which significantly reflects the goals of changing the current fuel demand model.
Then, the GHG emissions were a total of 17,004 kt CO2e in 2016. Hence the average ratio was 8.24 t CO2e per vehicle for each scenario in 2016. At the end of the study period, for BAU, EOM, AF, and SM, this ratio changes to 5.47, 5.02, 4.22, and 4.22 t CO2e per vehicle in 2035, respectively. Therefore, these results for this particular case show that with the increased use of alternative fuels, mainly LPG, LNG, and CNG, the GHG emissions decrease in SM and AF relative to BAU, also due to the emissions caused by the average decrease of diesel and gasoline consumption.
Finally, regarding fuel cost analysis, it is noteworthy that with the increased use of alternative fuels and the integration of energy efficiency and optimization policies, the annual average fuel consumption cost per vehicle is progressively reduced for all years. In 2016, the average cost was 2513.91 USD, and this cost changes to 2095.77 USD in BAU, 1923.58 USD in EOM, 1590.12 USD in AF, and 1562.72 USD in SM, in 2035.

5. Conclusions

This paper detailed the high energy demand of the road transport sector, and especially petroleum fuels consumption in Ecuador. This study has analyzed the total energy demand for each fuel type, the total motor vehicle stock, the GHG emissions, the emissions of two main air pollutants (NOx and PM10), and the total fuels cost, within the road transport sector, for each of the four energy policy alternative scenarios (BAU, EOM, AF, and SM), between 2016 and 2035.
According to the estimated results, diesel and gasoline very possibly continue to be the principal energy sources for the automotive sector in the country for all scenarios. This implies that not only should it be necessary to take measures to direct the system towards a sustainable mobility scenario, it also seems an urgent task that to plan and develop the essential infrastructure to reduce the dependence of petroleum fuels importation, which would have a positive effect for reducing costs. Initially, as a support of an energy transition stage, it is essential to start-up operations as soon as possible to promote projects for national petroleum fuels production to cover the future petroleum products demand for the automotive sector, such as the tender procedure of the study for the construction of a refinery that has already started, which would process 300 kBOE/day approximately. At the same time, the new infrastructure should be developed to increase the use of new fuels such as LPG, CNG, LNG, electricity, and biofuels in the automotive sector.
Moreover, a possible “sustainable transport policy” might be that of pursuing a modal share towards transport systems which have less impact on local pollution and global emissions; according to local needs, these might result in automated undergrounds, or in less expensive and with more moderate hourly-capacity automated people movers (APM), as those cable-driven adopted in cities for micro-mobility.
Overall, the main results for the AF and SM scenarios have been a significant decrease in the global energy demand of 120,944 kBOE and 141,226 kBOE relative to BAU in 2035, respectively. Together, the global cost has decreased by 26,720 MUSD due to the change in fuels demand, and PM10 has decreased by 20 kt between SM and BAU by 2035. Likewise, when alternative fuels are used significantly more (electricity, biofuels, LPG, CNG, and LNG), accumulated GHG emissions decrease by 11.70% for AF and 13.49% for SM, relative to BAU, up until 2035. Nevertheless, through an overall balance of all the results in the analyzed scenarios, it is concluded that SM would be the most optimal scenario for the automotive sector in the country.
Therefore, it is essential to develop a model that preserves the equilibrium of energy demand for each fuel type, while reducing the global emissions impact of air pollution and climate change and, subsequently, due to the applied mobility policies, a significant fuels cost-saving in the country is produced, moving towards a comprehensive sustainable mobility system.
Finally, this study has served to identify specific challenges and opportunities, in time and form, and it is concluded that there is an urgent need to establish state policies on energy efficiency, consumption of alternative fuels, and sustainable mobility, for both medium and long terms, and progressively implement them. Consequently, the energy sources peculiarities of the country, the implications of environmental impact related to air pollution and global warming, and socio-economic benefits must always be taken into account.
This research placed in Ecuador provides a useful LEAP model that can be used to study global processes. The same methodology and approach used in this work could be applied mainly for developing countries that share common demographics and macroeconomic characteristics with Ecuador.

Author Contributions

Conceptualization; L.R.-G., D.B. and L.F.M.; writing—review and editing, L.R.-G., D.B., S.N.-S., and K.E.-S.; methodology, L.R.-G., S.N.-S., and K.E.-S.; Formal analysis, L.R.-G., D.B., L.F.M., S.N.-S., and K.E.-S.; Supervision, D.B. and L.F.M. All authors reviewed together this paper. All authors have read and agreed to the published version of the manuscript.

Funding

This work was funded by the Secretaría Nacional de Ciencia y Tecnología (SENESCYT) and the Instituto de Fomento al Talento Humano (IFTH) of Ecuador [grant number 2013-AR2Q1374].

Acknowledgments

We thank the Energy and Fuels Department of the Technical School of Mining of the Universidad Politécnica de Madrid (UPM), Transversal Unit of Road Scope Management of the Universidad Politécnica de Catalunya (UPC), and Escuela Superior Politécnica del Litoral (ESPOL) for the total support.

Conflicts of Interest

The authors declared no conflict of interest.

References

  1. World Energy Outlook 2017; IEA—International Energy Agency: Barcelona, Spain, 2018.
  2. Álvarez, E.; Bravo, M.; Menéndez, J. Movilidad Sostenible-El Papel de la Electricidad y el Gas Natural en Varios Países Europeos; Instituto Vasco de Competitividad: Bilbao, España, 2017. [Google Scholar]
  3. BP Energy Outlook 2018; BP Energy Economics: Barcelona, Spain, 2019.
  4. International Energy Outlook 2017 Overview; U.S. Energy Information Administration (EIA): Washington, DC, USA, 2018.
  5. Annual Energy Outlook 2018; U.S. Energy Information Administration (EIA): Washington, DC, USA, 2019.
  6. Monitoring Energy Efficiency in Latin America; CEPAL—Comisión Económica Para América Latina y el Caribe: Santiago, Chile, 2016.
  7. Renewable Energy Market Analysis: Latin America; IRENA: Abu Dhabi, UAE, 2016; ISBN 9789295111493.
  8. Energy Efficiency in Latin America and the Caribbean: Advances and Opportunities; CEPAL-OLADE-BID: Santiago de Chile, Chile, 2017.
  9. Hu, X.; Chang, S.; Li, J.; Qin, Y. Energy for sustainable road transportation in China: Challenges, initiatives and policy implications. Energy 2010, 35, 4289–4301. [Google Scholar] [CrossRef]
  10. Wey, W.-M. Constructing urban dynamic transportation planning strategies for improving quality of life and urban sustainability under emerging growth management principles. Sustain. Cities Soc. 2019, 44, 275–290. [Google Scholar] [CrossRef]
  11. Kay, A.I.; Noland, R.B.; Rodier, C.J. Achieving reductions in greenhouse gases in the US road transportation sector. Energy Policy 2014, 69, 536–545. [Google Scholar] [CrossRef]
  12. British Petroleum Statistical Review of World Energy. 2019. Available online: https://www.bp.com/content/dam/bp/business-sites/en/global/corporate/pdfs/energy-economics/statistical-review/bp-stats-review-2019-full-report.pdf (accessed on 25 April 2019).
  13. UN - United Nations Convention on Climate Change: Climate Agreement of Paris. Available online: https://unfccc.int/sites/default/files/english_paris_agreement.pdf (accessed on 4 February 2019).
  14. Chai, J.; Lu, Q.Y.; Wang, S.Y.; Lai, K.K. Analysis of road transportation energy consumption demand in China. Transp. Res. Part D Transp. Environ. 2016, 48, 112–124. [Google Scholar] [CrossRef]
  15. Wang, T.; Lin, B. Fuel consumption in road transport: A comparative study of China and OECD countries. J. Clean. Prod. 2019, 206, 156–170. [Google Scholar] [CrossRef]
  16. Azam, M.; Othman, J.; Begum, R.A.; Abdullah, S.M.S.; Nor, N.G.M. Energy consumption and emission projection for the road transport sector in Malaysia: An application of the LEAP model. Environ. Dev. Sustain. 2016, 18, 1027–1047. [Google Scholar] [CrossRef]
  17. Baidya, S.; Borken-Kleefeld, J. Atmospheric emissions from road transportation in India. Energy Policy 2009, 37, 3812–3822. [Google Scholar] [CrossRef] [Green Version]
  18. Dhar, S.; Pathak, M.; Shukla, P.R. Electric vehicles and India’s low carbon passenger transport: A long-term co-benefits assessment. J. Clean. Prod. 2017, 146, 139–148. [Google Scholar] [CrossRef] [Green Version]
  19. Bomb, C.; McCormick, K.; Deurwaarder, E.; Kalberger, T.; Kåberger, T. Biofuels for transport in Europe: Lessons from Germany and the UK. Energy Policy 2007, 35, 2256–2267. [Google Scholar] [CrossRef] [Green Version]
  20. Johnson, E. LPG: A secure, cleaner transport fuel? A policy recommendation for Europe. Energy Policy 2003, 31, 1573–1577. [Google Scholar] [CrossRef]
  21. Hammond, G.P.; Kallu, S.; McManus, M.C. Development of biofuels for the UK automotive market. Appl. Energy 2008, 85, 506–515. [Google Scholar] [CrossRef]
  22. Liaquat, A.M.; Kalam, M.A.; Masjuki, H.H.; Jayed, M.H. Potential emissions reduction in road transport sector using biofuel in developing countries. Atmos. Environ. 2010, 44, 3869–3877. [Google Scholar] [CrossRef]
  23. Hong, S.; Chung, Y.; Kim, J.; Chun, D. Analysis on the level of contribution to the national greenhouse gas reduction target in Korean transportation sector using LEAP model. Renew. Sustain. Energy Rev. 2016, 60, 549–559. [Google Scholar] [CrossRef]
  24. Yang, C.; McCollum, D.; McCarthy, R.; Leighty, W. Meeting an 80% reduction in greenhouse gas emissions from transportation by 2050: A case study in California. Transp. Res. Part D Transp. Environ. 2009, 14, 147–156. [Google Scholar] [CrossRef] [Green Version]
  25. Mobility and Transport Commissions Sustainable Urban Mobility. Available online: https://ec.europa.eu/transport/home_en (accessed on 28 November 2018).
  26. Plan de Movilidad Urbana Sostenible de la ciudad de Madrid; Ayuntamiento de Madrid: Madrid, Spain, 2014.
  27. Mayor’s Transport Strategy - Executive 2018; City Hall of London: London, UK, 2018.
  28. Strategic Plan for the New York City; Department of Transport: New York, NY, USA, 2018.
  29. Capital Surface Transport Master Plan of Abu Dhabi 2030; Department of Transport: Abu Dhabi, UAE, 2017.
  30. Bogota Masterplan Mobility; Bogota City Hall: Bogota, Colombia, 2015.
  31. Delivering the New South Wales Long Term Transport Master Plan; NSW Government: NSW, Australia, 2014.
  32. Integrated Urban Development Master Plan for Nairobi; MT—Ministry of Transport: Nairobi, Kenya, 2013.
  33. Günter, J. Urban Mobility Plans—Links to documents and strategies; GIZ: Eschborn, Germany, 2015. [Google Scholar]
  34. INEC—National Institute of Statistics and Census of Ecuador Population projection Ecuador 2050. Available online: http://www.ecuadorencifras.gob.ec/documentos/web-inec/Poblacion_y_Demografia/Proyecciones_Poblacionales/presentacion.pdf (accessed on 10 October 2018).
  35. Cox, W. Demographia World Urban Areas 15 th Annual Addition; Demographia: Belleville, ON, USA, 2019. [Google Scholar]
  36. Transport Statistics Yearbook 2017; INEC—National Institute of Statistics and Census of Ecuador: Quito, Ecuador, 2018.
  37. Transport Statistics Yearbook 2016; INEC—National Institute of Statistics and Census of Ecuador: Quito, Ecuador, 2017.
  38. AEADE—Asociación de Empresas Automotrices del Ecuador Anuario 2016. Available online: http://www.aeade.net/wp-content/uploads/2017/12/anuario2016.pdf (accessed on 28 November 2018).
  39. National Energy Balance 2017; MEER—Ministry of electricity and renewable energy: Quito, Ecuador, 2018.
  40. Prospectiva Energética del Ecuador 2012-2040; MEER—Ministry of Electricity and Renewable Energy: Quito, Ecuador, 2015.
  41. Constitución de la República del Ecuador; Ecuadorian State: Quito, Ecuador, 2008.
  42. Ecuadorian Government First Nationally Determined Contributions. Available online: https://www4.unfccc.int/sites/ndcstaging/PublishedDocuments/Ecuador First/Primera NDC Ecuador.pdf (accessed on 25 April 2019).
  43. Jakob, M.; Soria, R.; Trinidad, C.; Edenhofer, O.; Bak, C.; Bouille, D.; Buira, D.; Carlino, H.; Gutman, V.; Hübner, C.; et al. Green fiscal reform for a just energy transition in latin America. Economics 2019, 13, 1–11. [Google Scholar] [CrossRef] [Green Version]
  44. El transporte en la Matriz Energética del Ecuador; MICSE—Coordinating Ministry of Strategic Sectors: Quito, Ecuador, 2017.
  45. Corral, A.; Izurieta, F.; Guayanlema, V.; Díaz, J.P.; Acurio, H.; Quintana, P. Assessment opportunities for energy efficiency in Ecuadorian road transport. Dyna 2017, 84, 309–315. [Google Scholar] [CrossRef]
  46. MTOP—Ministry of Transport Sectors Eficiencia energética en Transporte. Available online: https://docplayer.es/8834926-Foto-francisco-izurieta-iner-eficiencia-energetica-en-transporte.html (accessed on 8 November 2018).
  47. Guayanlema, V.; Espinoza, S.; Ramirez, A.D.; Núñez, A. Trends and mitigation options of greenhouse gas emissions from the road transport sector in ecuador. WIT Trans. Ecol. Environ. 2014, 191, 933–941. [Google Scholar]
  48. Ministry of Foreign Affairs and Human Mobility Líneas estratégicas de acción en el sector transporte para la mitigación del cambio climático en Ecuador. Available online: http://www.cancilleria.gob.ec/wp-content/uploads/2014/10/Línea-Sur-7.pdf#page=92 (accessed on 8 November 2018).
  49. Identificación de Necesidades de Eficiencia Energética en Transporte; INER—National Institute of Energy Efficiency and Renewable Energies: Quito, Ecuador, 2017.
  50. Ríos, P. Metodología de Evaluación del Impacto en el Consumo Energético de la Integración de Vehículos Eléctricos. Lychnos 2014, 6, 1–34. [Google Scholar]
  51. Hydrocarbons Sector 2019; Ministry of Hydrocarbons: Brazzaville, Congo, 2019.
  52. BCE—Central Bank of Ecuador Statistics of the Ecuadorian Oil Sector. Available online: https://www.bce.fin.ec/index.php/hidrocarburos (accessed on 5 June 2018).
  53. Statistical Report 2016; ARCH—Hydrocarbons Regulation and Control Agency: Quito, Ecuador, 2017.
  54. Heaps, C.G. Long-Range Energy Alternatives Planning (LEAP) System. [Software Version: 2018.1.25] Stockholm Environment Institute. Available online: https://www.energycommunity.org (accessed on 25 April 2019).
  55. Rivera-González, L.; Bolonio, D.; Mazadiego, L.F.; Valencia-Chapi, R. Long-Term Electricity Supply and Demand Forecast (2018–2040): A LEAP Model Application towards a Sustainable Power Generation System in Ecuador. Sustainability 2019, 11, 5316. [Google Scholar] [CrossRef] [Green Version]
  56. Sector Automotor en Cifras 2016; AEADE—Asociación de Empresas Automotrices del Ecuador: Quito, Ecuador, 2017.
  57. Cevallos, J. Estimating road transport fuel consumption in Ecuador. Energy Policy 2016, 92, 359–368. [Google Scholar]
  58. N. Di Sbroiavacca LEAP Model. Available online: www.fundacionbariloche.org.ar (accessed on 25 July 2018).
  59. U.S. Department of Energy Fuel Economy Guide 2018. Available online: https://www.fueleconomy.gov/feg/pdfs/guides/FEG2018.pdf (accessed on 28 November 2018).
  60. Government of Canada 2018 Fuel Consumption Guide. Available online: https://www.nrcan.gc.ca/energy/efficiency/transportation/cars-light-trucks/buying/7487#intro (accessed on 22 December 2018).
  61. Fitz-Henry, E. Greening the Petrochemical State: Between Energy Sovereignty and Sumak Kawsay in Coastal Ecuador. J. Lat. Am. Caribb. Anthropol. 2015, 20, 264–284. [Google Scholar] [CrossRef]
  62. User Guide for LEAP; SEI—Stockholm Environment Institute: Estocolmo, Suécia, 2005.
  63. Quezada, P.; Romero, W.; Coello, M. Incidencia de las motocicletas en la ciudad de Cuenca desde una perspectiva energética y ambiental; Universidad del Azuay: Cuenca, Equador, 2017. [Google Scholar]
  64. Pérez, J.P.G. Indicador Kilómetros- Vehículo Recorridos (KVR) Métodos de Cálculo en Diferentes Países; Instituto de Políticas para el Transporte y Desarrollo México: Cuauhtémoc, México, 2012. [Google Scholar]
  65. Indicadores de Eficiencia Energética: Bases Esenciales para el Establecimiento de Políticas; Agencia Internacional de Energía (IEA): Paris, France, 2015.
  66. Wills, W.; La Rovere, E.L. Light vehicle energy efficiency programs and their impact on Brazilian CO2 emissions. Energy Policy 2010, 38, 6453–6462. [Google Scholar] [CrossRef]
  67. Wang, Z.; Jin, Y.; Wang, M.; Wua, W. New fuel consumption standards for Chinese passenger vehicles and their effects on reductions of oil use and CO2 emissions of the Chinese passenger vehicle fleet. Energy Policy 2010, 38, 5242–5250. [Google Scholar] [CrossRef]
  68. He, K.; Huo, H.; Zhang, Q.; He, D.; An, F.; Wang, M.; Walsh, M.P. Oil consumption and CO2 emissions in China’s road transport: Current status, future trends, and policy implications. Energy Policy 2005, 33, 1499–1507. [Google Scholar] [CrossRef]
  69. Carriquiry, M.A.; Du, X.; Timilsina, G.R. Second generation biofuels: Economics and policies. Energy Policy 2011, 39, 4222–4234. [Google Scholar] [CrossRef] [Green Version]
  70. Wang, N.; Tang, L.; Pan, H. A global comparison and assessment of incentive policy on electric vehicle promotion. Sustain. Cities Soc. 2019, 44, 597–603. [Google Scholar] [CrossRef]
  71. Aggarwal, P.; Jain, S. Energy demand and CO2 emissions from urban on-road transport in Delhi: Current and future projections under various policy measures. J. Clean. Prod. 2016, 128, 48–61. [Google Scholar] [CrossRef]
  72. Yan, X.; Crookes, R.J. Reduction potentials of energy demand and GHG emissions in China’s road transport sector. Energy Policy 2009, 37, 658–668. [Google Scholar] [CrossRef]
  73. Chavez-Baeza, C.; Sheinbaum-Pardo, C. Sustainable passenger road transport scenarios to reduce fuel consumption, air pollutants and GHG (greenhouse gas) emissions in the Mexico City Metropolitan Area. Energy 2014, 66, 624–634. [Google Scholar] [CrossRef]
  74. Ross Morrow, W.; Gallagher, K.S.; Collantes, G.; Lee, H. Analysis of policies to reduce oil consumption and greenhouse-gas emissions from the US transportation sector. Energy Policy 2010, 38, 1305–1320. [Google Scholar] [CrossRef]
  75. Bullock, C.; Brereton, F.; Bailey, S. The economic contribution of public bike-share to the sustainability and efficient functioning of cities. Sustain. Cities Soc. 2017, 28, 76–87. [Google Scholar] [CrossRef]
  76. INER—National Institute of Energy Efficiency and Renewable Energies Scenarios of Energy Prospects for Ecuador in 2050; INER: Quito, Ecuador, 2016.
  77. Sector Automotor Ecuador en Cifras 2017; AEADE—Asociación de Empresas Automotrices del Ecuador: Quito, Ecuador, 2018.
  78. Ley Orgánica de Eficiencia Energética; Asamblea Nacional de la República del Ecuador: Quito, Ecuador, 2019.
  79. Guayanlema, V. Análisis Multicriterio de Implementación de Medidas de Eficiencia Energética en el Transporte e Industria Caso: Ecuador; Universitat de Barcelona: Barcelona, Spain, 2016. [Google Scholar]
  80. Usón, A.A.; Capilla, A.V.; Bribián, I.Z.; Scarpellini, S.; Sastresa, E.L. Energy efficiency in transport and mobility from an eco-efficiency viewpoint. Energy 2011, 36, 1916–1923. [Google Scholar] [CrossRef]
  81. Cheah, L.; Heywood, J.; Meeting, U.S. passenger vehicle fuel economy standards in 2016 and beyond. Energy Policy 2011, 39, 454–466. [Google Scholar] [CrossRef]
  82. Optimización Energética de Cadenas Logísticas en Transporte de Carga Pesada en el Ecuador; INER—National Institute of Energy Efficiency and Renewable Energies: Quito, Ecuador, 2015; ISBN 9789942862051.
  83. INER—National Institute of Energy Efficiency and Renewable Energies “Identificacion de las Necesidades de Eficiencia Energetica en el Transporte”. Available online: https://studylib.es/doc/7332106/identificacion-de-las-necesidades-de-eficiencia-energetic... (accessed on 15 September 2018).
  84. Eficiencia Energética en el Sector Transporte; INER—National Institute of Energy Efficiency and Renewable Energies: Quito, Ecuador, 2017.
  85. Gallardo, P.; Díaz, J.P.; Quintana, P.; Cevallos, I.; León, P.; Guillén, J. Energy intensity of road freight transport of liquid fuels for automotive use in Ecuador: Assessment of changes in logistics. Case Stud. Transp. Policy 2018, 6, 289–296. [Google Scholar] [CrossRef]
  86. Höysniemi, S.; Salonen, A.O. Towards Carbon-Neutral Mobility in Finland: Mobility and Life Satisfaction in Day-to-Day Life. Sustainability 2019, 11, 5374. [Google Scholar] [CrossRef] [Green Version]
  87. González, L.G.; Siavichay, E.; Espinoza, J.L. Impact of EV fast charging stations on the power distribution network of a Latin American intermediate city. Renew. Sustain. Energy Rev. 2019, 107, 309–318. [Google Scholar] [CrossRef] [Green Version]
  88. Kreuzer, F.M.; Wilmsmeier, G. Energy Efficiency and Mobility: A Roadmap towards a Greener Economy in Latin America and the Caribbean; CEPAL: Santiago de Chile, Chile, 2014. [Google Scholar]
  89. Chavez-Rodriguez, M.F.; Carvajal, P.E.; Martinez Jaramillo, J.E.; Egüez, A.; Mahecha, R.E.G.; Schaeffer, R.; Szklo, A.; Lucena, A.F.P.; Arango Aramburo, S. Fuel saving strategies in the Andes: Long-term impacts for Peru, Colombia and Ecuador. Energy Strateg. Rev. 2018, 20, 35–48. [Google Scholar] [CrossRef]
  90. Doll, C.; Wietschel, M. Externalities of the transport sector and the role of hydrogen in a sustainable transport vision. Energy Policy 2008, 36, 4069–4078. [Google Scholar] [CrossRef]
  91. Noboa, E. El Transporte en la Matriz Energética del Ecuador; INER: Quito, Ecuador, 2012. [Google Scholar]
  92. Ley Para Fomento Productivo, Atracción de Inversiones y Generacion de Empleo; Asamblea Nacional de la República del Ecuador: Quito, Ecuador, 2018.
  93. Diamond, D. The impact of government incentives for hybrid-electric vehicles: Evidence from US states. Energy Policy 2009, 37, 972–983. [Google Scholar] [CrossRef]
  94. Kuprys, A.; Kugelevičius, J. Possibilities of Using Liquefied Oil Gas in Transport. Transport 2009, 24, 48–53. [Google Scholar] [CrossRef] [Green Version]
  95. Hoekman, S.K. Biofuels in the U.S.—Challenges and Opportunities. Renew. Energy 2009, 34, 14–22. [Google Scholar] [CrossRef]
  96. Kamimura, A.; Sauer, I.L. The effect of flex fuel vehicles in the Brazilian light road transportation. Energy Policy 2008, 36, 1574–1576. [Google Scholar] [CrossRef]
  97. Baran, R.; Legey, L.F.L. The introduction of electric vehicles in Brazil: Impacts on oil and electricity consumption. Technol. Forecast. Soc. Chang. 2013, 80, 907–917. [Google Scholar] [CrossRef]
  98. Melikoglu, M. Demand forecast for road transportation fuels including gasoline, diesel, LPG, bioethanol and biodiesel for Turkey between 2013 and 2023. Renew. Energy 2014, 64, 164–171. [Google Scholar] [CrossRef]
  99. Goldemberg, J.; Guardabassi, P. Are biofuels a feasible option? Energy Policy 2009, 37, 10–14. [Google Scholar] [CrossRef]
  100. Joseph, H. Flex Fuel Vehicles in Brazil. Available online: http://www.globalbioenergy.org/fileadmin/user_upload/gbep/docs/2013_events/GBEP_Bioenergy_Week_Brasilia_18-23_March_2013/4.5_JOSEPH.pdf (accessed on 3 January 2019).
  101. Bakker, S.; Jacob Trip, J. Policy options to support the adoption of electric vehicles in the urban environment. Transp. Res. Part. D Transp. Environ. 2013, 25, 18–23. [Google Scholar] [CrossRef]
  102. Rahman Mohamed, A.; Lee, K.T. Energy for sustainable development in Malaysia: Energy policy and alternative energy. Energy Policy 2006, 34, 2388–2397. [Google Scholar] [CrossRef]
  103. Banister, D. The sustainable mobility paradigm. Transp. Policy 2008, 15, 73–80. [Google Scholar] [CrossRef]
  104. Tran, V.; Zhao, S.; Diop, E.B.; Song, W. Travelers’ Acceptance of Electric Carsharing Systems in Developing Countries: The Case of China. Sustainability 2019, 11, 5348. [Google Scholar] [CrossRef] [Green Version]
  105. Fan, J.L.; Wang, J.X.; Li, F.; Yu, H.; Zhang, X. Energy demand and greenhouse gas emissions of urban passenger transport in the Internet era: A case study of Beijing. J. Clean. Prod. 2017, 165, 177–189. [Google Scholar] [CrossRef]
  106. Galatoulas, N.F.; Genikomsakis, K.N.; Ioakimidis, C.S. Analysis of potential demand and costs for the business development of an electric vehicle sharing service. Sustain. Cities Soc. 2018, 42, 148–161. [Google Scholar] [CrossRef]
  107. Lu, M.; Hsu, S.-C.; Chen, P.-C.; Lee, W.-Y. Improving the sustainability of integrated transportation system with bike-sharing: A spatial agent-based approach. Sustain. Cities Soc. 2018, 41, 44–51. [Google Scholar] [CrossRef]
  108. Maioli, H.C.; de Carvalho, R.C.; de Medeiros, D.D. SERVBIKE: Riding customer satisfaction of bicycle sharing service. Sustain. Cities Soc. 2019, 50, 101680. [Google Scholar] [CrossRef]
  109. Statistical Report 2015; ARCH—Hydrocarbons Regulation and Control Agency: Quito, Ecuador, 2016.
  110. Estudio de Movilidad y Espacio Público. Emisiones de Tráfico; Agència d`Ecologia Urbana de Barcelona: Vitoria-Gasteiz, Spain, 2018. [Google Scholar]
  111. Energy Prices: Transportation; U.S. Energy Information Administration: Washington, DC, USA, 2019.
  112. World Bank Data Ecuador. Available online: https://datos.bancomundial.org/pais/ecuador (accessed on 15 June 2019).
Figure 1. Road transport structure for Ecuador LEAP model.
Sustainability 12 00472 g001
Figure 2. Scenarios design in the LEAP model for the road transport sector in Ecuador.
Sustainability 12 00472 g002
Figure 3. Total energy demand forecasting of road transport for each scenario from 2016 to 2035.
Sustainability 12 00472 g003
Figure 4. Fuels demand by sources in the BAU scenario from 2016 to 2035.
Sustainability 12 00472 g004
Figure 5. Fuels demand by sources in EOM scenario from 2016 to 2035.
Sustainability 12 00472 g005
Figure 6. Fuels demand by sources in AF scenario from 2016 to 2035.
Sustainability 12 00472 g006
Figure 7. Fuels demand by sources in the SM scenario from 2016 to 2035.
Sustainability 12 00472 g007
Figure 8. Annual total stock of the vehicles for each scenario from 2016 to 2035.
Sustainability 12 00472 g008
Figure 9. Accumulated GHG emissions for each scenario from 2016 to 2035.
Sustainability 12 00472 g009
Figure 10. Annual NOx emissions for each scenario from 2016 to 2035.
Sustainability 12 00472 g010
Figure 11. Annual PM10 emissions for each scenario from 2016 to 2035.
Sustainability 12 00472 g011
Figure 12. Accumulated total cost of fuel for each scenario from 2016 to 2035.
Sustainability 12 00472 g012
Table 1. Vehicle classes and fuel consumption in the road transport sector in Ecuador in 2016 [37].
Registered Vehicles (Units)Fuel Consumption (kBOE)
ClassDieselGasolineHybridElectricLPGTotalDieselGasolineBioethanolElectricityLPGTotal
Passenger
Car1774631,3492993465134641,29617.296060.392.260.0749.186129.19
Off-road7325313,11224515456322,99882.613566.923.440.100.293653.36
Bus23,056380-96-23,5322701.0142.04-5.78-2748.83
Van64523,38811624,04118.49804.50-0.010.09823.09
Motorcycle115477,73342145477,9180.16736.54-0.010.05736.76
Cargo
Pick-up83,016320,3311151365403,5401651.897293.40-0.060.638945.98
Van20,28420,97613441,268442.10545.45-0.020.04987.61
Trailer truck969454-1-9749892.215.01-0.03-897.25
Cargo truck94,8224078-2498,90613,042.10588.61-0.100.2013,631.01
Dump truck11,500220---11,720937.3218.68---956.00
Tanker truck217850---2228259.045.75---264.79
Other class
Other class3649464---411321.902.82---24.72
258,0581,792,135556523753142,061,30920,066.1219,670.115.706.1850.4839,798.59
Table 2. Vehicle classes and fuel consumption in the road transport sector in Ecuador in 2016 [37].
PassengerCargo
VariablesCarOff-RoadBusVanMotorcyclePick-UpVanTrailer TruckCargo TruckDump TruckTanker TruckOther Class
Total vehicles a (2,061,309)641,296322,99823,53224,041477,918403,54041,268974998,90611,72022284113
Fuel share b (%)
typeDiesel0.282.2797.972.680.0220.5749.1599.4495.8798.1297.7688.72
Gasoline80.5179.571.6197.2999.9779.4150.830.554.121.882.2411.28
Ethanol18.4118.13----------
Electricity0.010.010.420.01--0.010.010.01---
LPG0.800.02-0.020.010.020.01-----
Average Mileage c (km)16,00014,00070,00040,000830025,00028,00045,00085,00050,00053,0004000
Average Fuel
Economy d (MJ/100 km)
typeDiesel376.97493.831017.82447.5594.24501.37486.291281.701014.051021.591406.10942.43
Gasoline377.27513.86961.41537.06102.77573.53580.161292.931064.181064.181359.23762.50
Hybrid
(Gasoline)
238.69364.67-364.6766.30414.40414.40----663.04
Electricity64.0082.80423.00108.0018.00126.00126.00432.00360.00360432144
LPG182.48222.15-232.2572.99243.31232.25- ---
E5373.23506.17---559.74------
CNG103.95157..41367.29220.38-183.65220.371101.88668.67668.671101.88-
Bi-Fuel279.88368.01---405.11207.69-----
E10269.20498.48-524.45100.54560.87566.63-----
B10-496.471022.91--504.01488.551296.781025.741033.651423.82-
LNG--382.86----1093.13713.65713.651069.78-
Source: a: [37]; b: [37,56]; c: [57,63,64]; d: [57,59,60].
Table 3. Sales share values for LEAP for all scenarios in 2035.
DemandPassengerCargo
VariablesCarOff-RoadBusVanMotorcyclePick-UpVanTrailer TruckCargo TruckDump TruckTanker TruckOther Class
Total Sales (Vehicles)
Current Accounts (2016) a121,30116,467124
BAU—EOM—AF660,000132,000700
SM620,000120,000700
Total sales share (%)
Current Accounts (2016) b22.8914.051.170.7061.1867.238.791.9119.342.290.44-
BAU—EOM—AF25.0016.002.001.5055.5067.208.801.9019.402.300.40-
SM21.0012.003.002.0062.0063.0010.302.2021.502.500.50-
Sales Share for BAU and EOM scenarios (%) c
typeDiesel0.502.0094.003.000.0319.0040.0095.0095.0094.0094.0074.75
Gasoline38.4547.952.0076.9579.9779.0039.951.004.002.002.0011.50
Hybrid20.0010.00-10.0010.001.5010.00----10.00
Electricity10.0010.00-10.0010.000.5010.004.001.004.004.004.00
LPG1.050.054.000.05--0.05-----
E530.0030.00----------
Sales Share for AF and SM scenarios (%) d
typeDiesel00000002730302758.50
Gasoline00003500000011.50
Hybrid2530-30251530----20
Electricity1815-1515121581010810
LPG1710012-1015-----
E500---5------
CNG10152512-107.515151515-
Bi-Fuel310---107.5-----
E102717-31251810-----
B10-336--201530303030-
LNG--25----20151520-
Source: a: [77]; b: [56]; c: [40]; d: [45,47,79].
Table 4. Summary of the main results for the alternative scenarios in specific years.
Description20162020202520302035
Total Stock of Vehicles (Units)
ScenariosBAU—EOM—AF2,061,3092,802,9994,150,5096,099,8878,513,600
SM2,061,3092,802,9994,100,5155,903,8108,130,686
Total Energy Demand (kBOE)
ScenariosBAU39,79943,21256,90080,522112,032
EOM39,79943,21256,58777,697102,847
AF39,79942,96854,65171,22889,425
SM39,79943,09954,47969,53785,130
Total Fuels Demand (kBOE)
Business As Usual
typeDiesel20,06621,47328,40940,96258,164
Gasoline19,67021,65028,26939,03752,825
Electricity627135393854
LPG505777113164
Bioethanol67101625
Energy Optimization and Mitigation
typeDiesel20,06621,47328,24939,53453,576
Gasoline19,67021,65028,11837,65948,312
Electricity627133371754
LPG505778118183
Bioethanol67101623
Alternative Fuels
typeDiesel20,06621,43827,15534,48940,877
Gasoline19,67021,33225,92831,00134,618
Electricity65137711962672
LPG5012351213882877
Bioethanol62270171290
LNG--26512783472
CNG--34416694481
Biodiesel---35138
Sustainable Mobility
typeDiesel20,06621,64027,73835,08840,340
Gasoline19,67021,26225,18028,50829,659
Electricity65237811572463
LPG5012347912942770
Bioethanol62265151239
LNG--28314694283
CNG--35618355243
Biodiesel---35133
Total GHG Emissions (kt CO2e)
ScenariosBAU17,00418,05223,74233,53946,566
EOM17,00418,05223,61232,36542,762
AF17,00417,93322,66029,15835,967
SM17,00417,99122,60928,51334,305
Total Fuel Cost (Million US dollars)
ScenariosBAU5181.946042.198077.9912,304.9017,842.52
EOM5181.945859.708033.5811,872.4616,376.58
AF5181.945824.617716.1610,649.3013,537.67
SM5181.945841.967687.3310,359.4012,706.02

