Article

Estimated Profitability of Thoroughbred Yearlings Sold in Auctions in the United States, 2001–2018

Department of Agricultural Economics, University of Kentucky, Lexington, KY 40506, USA
*
Author to whom correspondence should be addressed.
Sustainability 2020, 12(2), 463; https://doi.org/10.3390/su12020463
Submission received: 12 December 2019 / Revised: 26 December 2019 / Accepted: 6 January 2020 / Published: 8 January 2020
(This article belongs to the Special Issue Sustainability in the Equine Industry)

Abstract

:
Yearling auctions constitute the most common means of trading prospective Thoroughbred racehorses. The main objective of many equine operations is to breed yearlings to sell at these auctions, and therefore, the ability of breeders to consistently realize positive returns is paramount to their long-term participation in the market. In this article, we investigate the estimated profitability of Thoroughbred yearlings sold in auctions from 2001–2018. According to our estimates, less than 50% of transactions were profitable, with negative median profit in all years under analysis but two. In addition, the likelihood of realizing a positive return diminishes as the quality of sire decreases. Our results suggest that the long-run sustainability for many breeders, especially breeders that may lack the capital to invest in high quality stallions, is questionable.

1. Introduction

The “triple bottom line” is a framework suggesting that the long-run sustainability of firms, or even an industry, depends simultaneously on economic (profit), social (people), and environmental (planet) concerns. Without any one of the three, longevity of a firm or industry is uncertain. However, without economic sustainability, the other two concerns may never be germane. A recent economic impact study commissioned by the British Thoroughbred Breeders’ Association included several key statistics that indicated the precarious economic standing of the British Thoroughbred breeding industry, revealing several startling revelations about the industry’s profitability and overall future outlook. The study reported that from 2014 to 2018, 66% of breeders lost money, and the average horse sold at Tattersalls in Book 3 lost £23,500 [1]. The consequence of these and other findings is that the sustainability of the industry is threatened if this type of performance continues. The objective of this paper is to examine the profitability of breeding in the U.S. market for Thoroughbred yearlings to identify whether this same type of threat exists.

1.1. Background

There are a number of business sectors in the Thoroughbred industry, which are not necessarily mutually exclusive, but which have evolved as a way to diversify risk. For example, in the racing sector, market participants may own or train racehorses. In the breeding sector, operations exist that breed horses with the intention to later race them under their own name, with the intention of later selling them, or to “pinhook” horses (purchasing a prospective racehorse to re-sell at a later time, such as purchasing a weanling to sell as a yearling). Operations that breed to sell are frequently referred to as commercial breeders. The primary market for these breeders is the auction market for yearlings, or one-year-old horses.
From 2001–2018, over 25% of the North American Thoroughbred foal crop was sold at a public auction as a yearling [2,3,4,5]. The yearling market always has a handful of seven-figure standouts that capture headlines, but the bulk of the market is composed of horses who sell for far less. Motivated by the British Thoroughbred Breeders’ Association study, the objective of this study is to investigate expected profit and the likelihood of profitability for yearlings being sold at auction in the United States.
Numerous yearling auctions are held every year across the United States. However, we consider the primary commercial auctions in this study: the Keeneland September Yearling Sale (Lexington, KY, USA), the Fasig-Tipton Saratoga Selected Yearlings Sale (Saratoga, NY, USA), and the Fasig-Tipton Kentucky Yearlings Sale (Lexington, KY, USA). Although it was canceled after 2002, we also include the Keeneland July Yearling Sale (Lexington, KY, USA) in 2001 and 2002. Over the period covered by the study, more than 50% of the yearlings sold at public auction in the United States/North America were sold at one of these sales [3,4,5,6,7].
Kentucky is considered to be the Thoroughbred breeding capital of the world, producing more than 40% of the annual North American Thoroughbred foal crop annually. In 2011, the Kentucky state government’s Legislative Research Commission conducted a study investigating the state’s breeding industry [8]. Though dated now, the study provided valuable insight about the income of the breeding industry and how it is distributed. The report indicates that there is an inverse relationship between percent of total income and percent of total farms, with approximately 20.2% of farms representing 83.8% of total income. These farms earned more than $1,000,000, while 43.2% of farms earned less than $250,000 but represented only 2.5% of the total income. On average, about one-quarter of income is from equine sales, second only to stud fees at 30.4%. Boarding fees constitute 22.7% of income, commissions/sales preparation/training at 5.7%, and “other” is listed at 17.1% of gross income. However, most farms rely on income from equine sales since only one of every six farms stands stallions. This study indicated that the average revenue per horse was $21,613, while the average expenditure per horse was $21,531, culminating in a profit of only $82 per horse.
The Thoroughbred industry has been in a constant state of change, including the time period under analysis. From 2001 to 2018, the annual North American foal crop has declined by over 42.6%, from 34,721 in 2001 to an estimated 19,925 in 2018. The number of races has declined by about 34.6%, from 62,835 in 2001 to 41,083 in 2018. Meanwhile, average purse per race, adjusted for inflation, increased just over 11% from 2001 to 2018. The number of active breeding stallions decreased by over 65%, from 3845 in 2001 to 1310 in 2018 [2]. All of these factors and more contribute to the expected profitability of commercial Thoroughbred breeding.

1.2. Related Literature

While a number of papers have focused on identifying determinants of sales prices, to our knowledge, none have examined the profitability associated with selling prospective Thoroughbred race horses. In fact, few papers have investigated the profitability of any of the various segments of the Thoroughbred industry. Neibergs and Vinzant study the profitability of owning racehorses. On average, over 80% of racehorses were unable to recover the variable costs of training, although the authors demonstrate that there are positive economic returns associated with the ownership of claiming racehorses [9]. Claiming races are ones in which all of the horses entered in a race are offered for sale at the claiming price; claiming races are considered to be among the lowest quality of races in this industry. In addition, they also suggest that at this level, the barriers to entry, such as the initial purchase price, are not as high as most prospective new owners might anticipate. However, it should be noted that the Neibergs and Vinzant study is about 20 years old and replicating their study today may yield different results.
Bosh et al. examine the profitability of investing in Thoroughbred broodmares [10]. The authors determine that over a seven-year investment period, a mare must produce a live foal six out of seven years to yield a positive financial return from her initial purchase. Moreover, they specify that mares valued under $100,000 were not profitable over a seven-year investment period, showing widespread unprofitability throughout the thoroughbred sales industry.
Finally, Gamrat and Sauer compare three models capable of explaining investment decisions in Thoroughbred yearling fillies. Their results suggest that investing in Thoroughbred fillies does not appear to be driven by traditional financial profitability concerns [11]. Rather, they find that a “utility of participation” model in which owners receive utility from simply participating in the game of racing best rationalizes purchase prices of yearling fillies. The authors describe this nonpecuniary utility of participating in the sport of racing as a racehorse owner like the utility a parent might receive watching their children play sports.
In this paper, we first examine trends in prices and profitability from major Thoroughbred yearling sales from 2001–2018. According to our estimates, less than 50% of transactions were profitable, with negative median profit in all years under analysis but two. In addition, the likelihood of realizing a positive return is diminishing in sire quality when sire quality is measured by stud fee. Then, we investigate implied “discounts” on one of the major costs of producing a yearling, the stud fee, that must exist to guarantee a threshold level of profitability. For some categories of sire quality, no transactions would have been profitable even with a complimentary stud fee. Our results suggest that the long-run sustainability for some breeders is in question, especially those lacking capital to invest in high quality stallions.

2. Data and Empirical Methods

2.1. Data

Data to estimate profitability of individual yearling transactions were collected from a number of sources. Sales results from yearling Thoroughbred sales were collected from the July (2001 and 2002) and September yearling sales (2001–2018) at Keeneland [6] and from the Fasig-Tipton Saratoga Selected Yearlings and Kentucky Yearlings sales (2003 to 2018) [7]. For each transaction, the sale price, sex, sire (father of yearling), dam (mother of yearling), consigner/owner, and purchaser were identified. Only horses that were sold at the auction are included, as yearlings that were taken out of the sale or did not meet their reserve price are excluded. Advertised breeding year stud fees, which generally constitute the major share of production cost are collected from the annual stud fee issues of the Blood-Horse MarketWatch. Stud fees are not always available for all stallions; observations with missing stud fee values were excluded. With these exclusions, the sample size consists of 74,789 transactions. Table 1 identifies the number of transactions captured from each auction house from 2001–2018 for which we have complete information.
In addition to stud fees, other major costs involved with breeding and selling yearlings are commission costs and production costs. Commission to the auction house is contingent upon the sale price and the auction house. Prior to 2017, sales commission at Keeneland was a flat $1000 fee for sales under $20,000 and 5% of sales price for prices above $20,000. The 2017 policy change is reflected, using a flat $500 for sales under $10,000 and 5% of sales price for prices above $10,000. At Fasig-Tipton, sales commission is a standard 5% of all sales.
Actual production costs are not readily available and must be estimated. Production costs account for boarding (or maintenance, if breeders own their own farm) and caring for the mare for one year and her foal until the sale as a yearling. These costs can be assumed to include farm labor, feed, veterinary and farrier costs, nominations fees, sale entry fees, radiographs to assess the bones and joints of the young horse, endoscopic evaluation of the airway to check for abnormalities, and sales prep. These costs can vary significantly depending on the facility where the mare and foal are boarded, the types of veterinary expenses incurred, and so on. In consultation with a number of area farm managers, we estimate the production cost of producing a foal until the time it is sold as a yearling as $20,000, representing low costs, and $35,000 to represent high production costs. We recognize that some breeders may be able to produce foals at a lower cost than $20,000, but also that some may exceed the $35,000 production cost.

2.2. Empirical Methods

Two values of estimated profit were computed for each transaction. Profit is measured as sales price less the sire’s advertised breeding year stud fee, sales commission, and low or high production costs. Since the estimated low and high production costs of $20,000 and $35,000 are considered to be in 2018 dollars, these figures were deflated using the Consumer Price Index (CPI) to represent equivalent costs in previous years [12]. Finally, both sales prices and profit were adjusted for inflation. Trends in sales prices and profit were analyzed at the 99th, 95th, 75th, 50th, 25th, and 5th percentiles, as well as at the mean. In addition, assuming low production costs, the percent of profitable sales were computed on an annual basis.
While there is no defined acceptable level of profitable transactions, the British report suggests that only 33% of profitable transactions is not sustainable. Therefore, we consider two possible thresholds which should be more appropriate for sustainability concerns: 50% and 67% profitable transactions. Then, we identify an implied “stud fee discount” using Goal Seek in Excel. The objective of this exercise is to identify the minimum stud fee discount required to ensure a 50% or 67% threshold of profitable transactions when that threshold is not met. Once Goal Seek identified a solution, we searched locally in order to ensure that the minimum was obtained.

3. Results

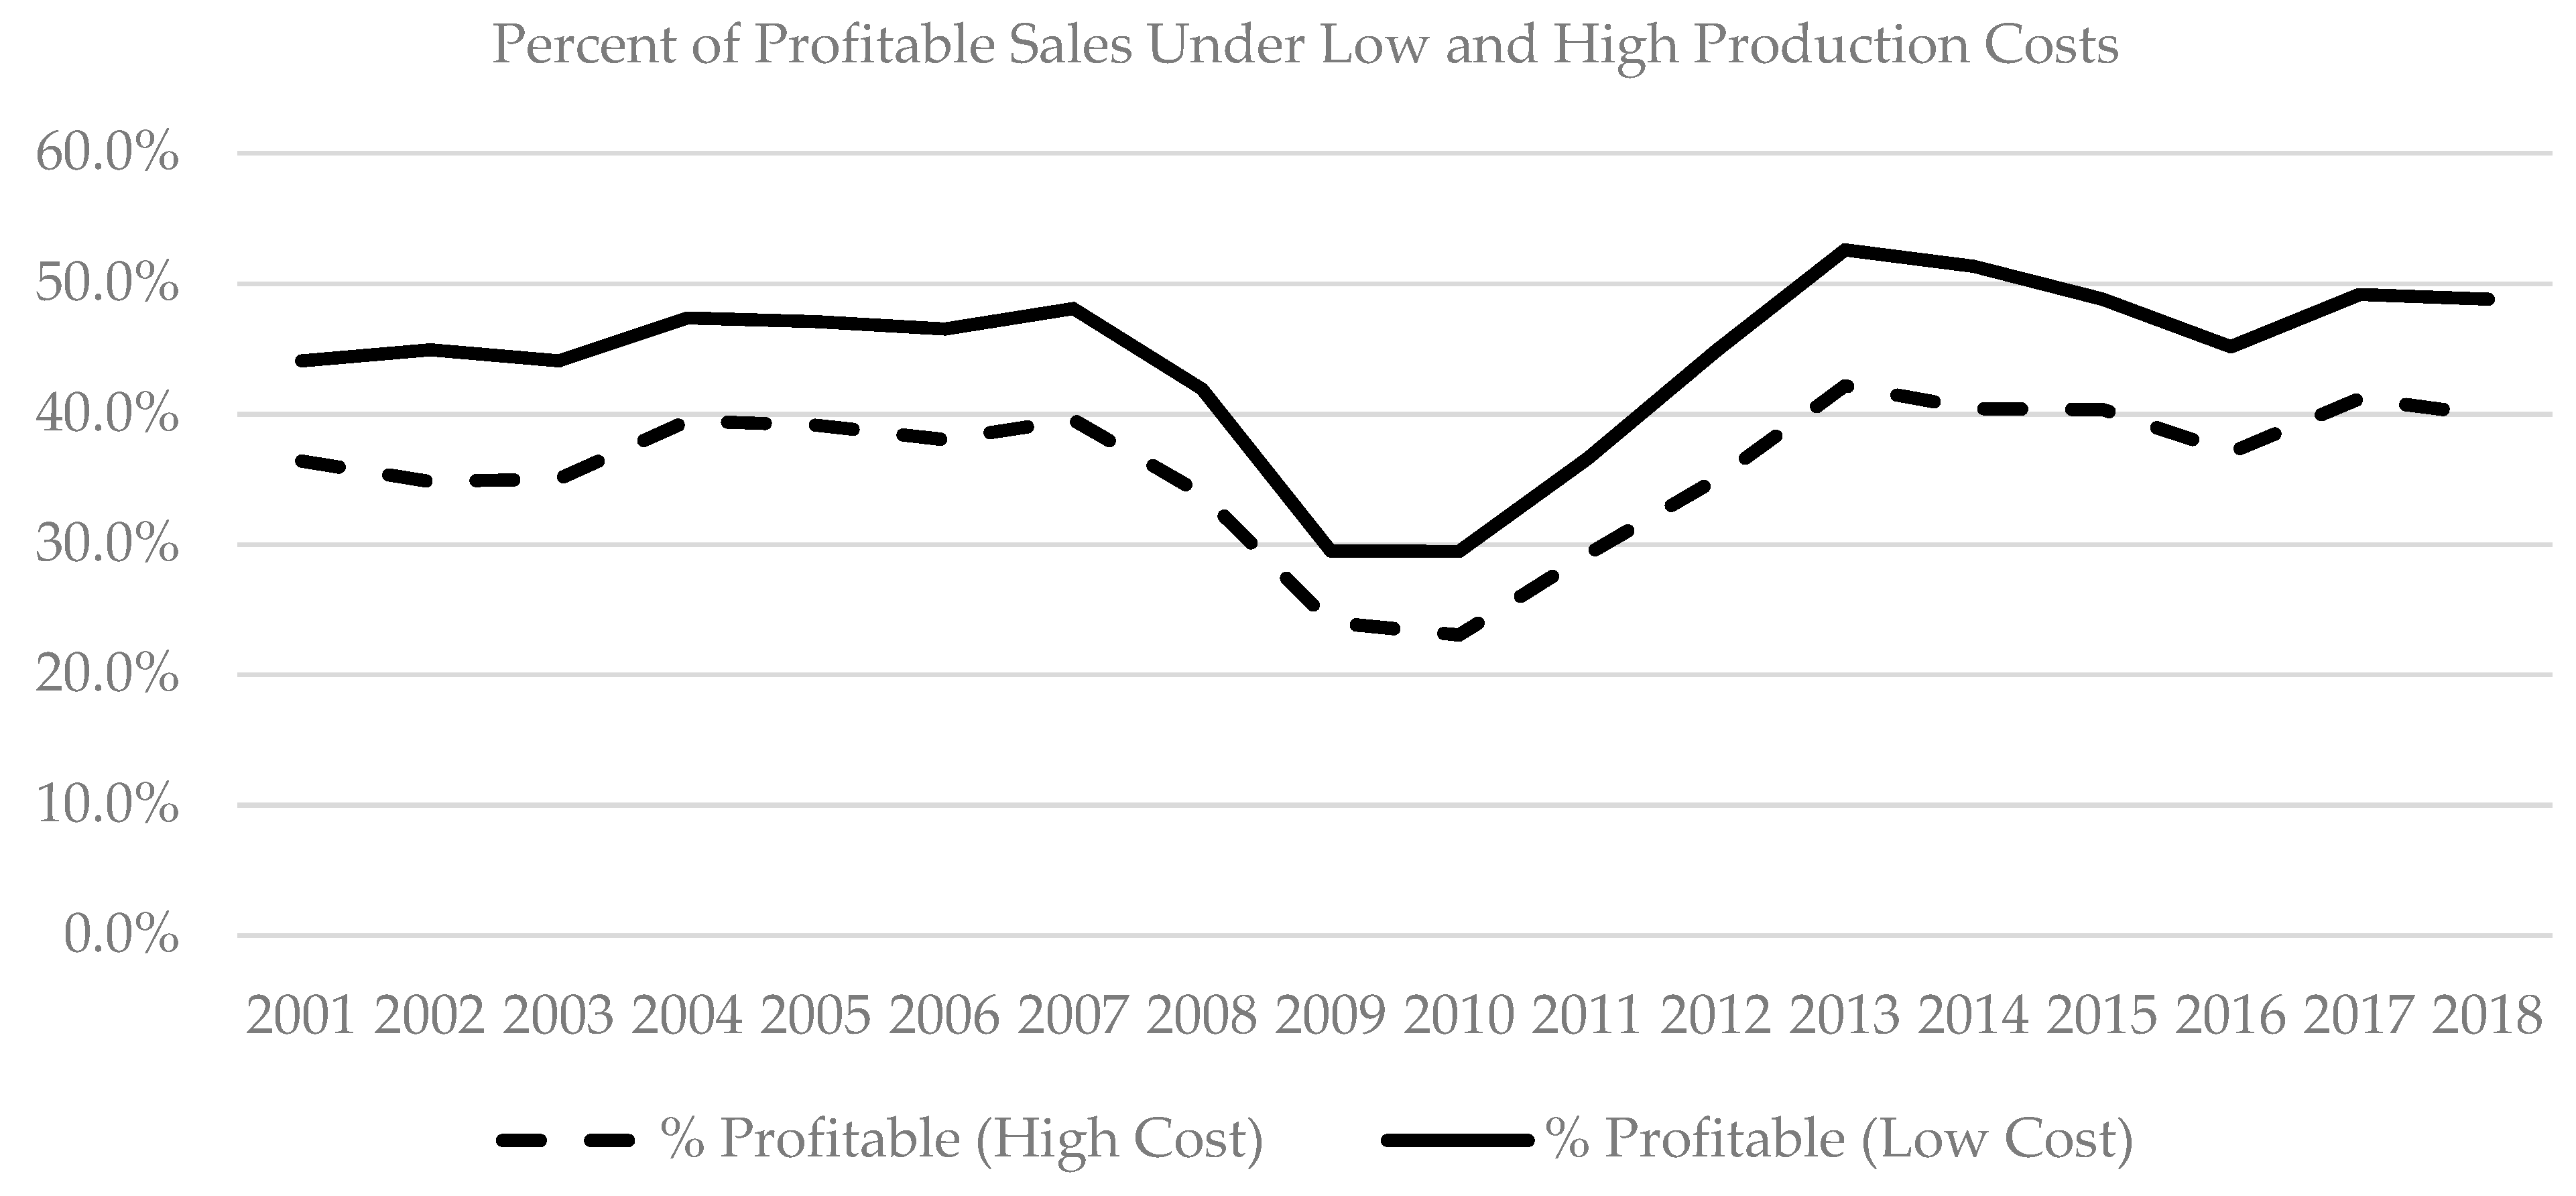
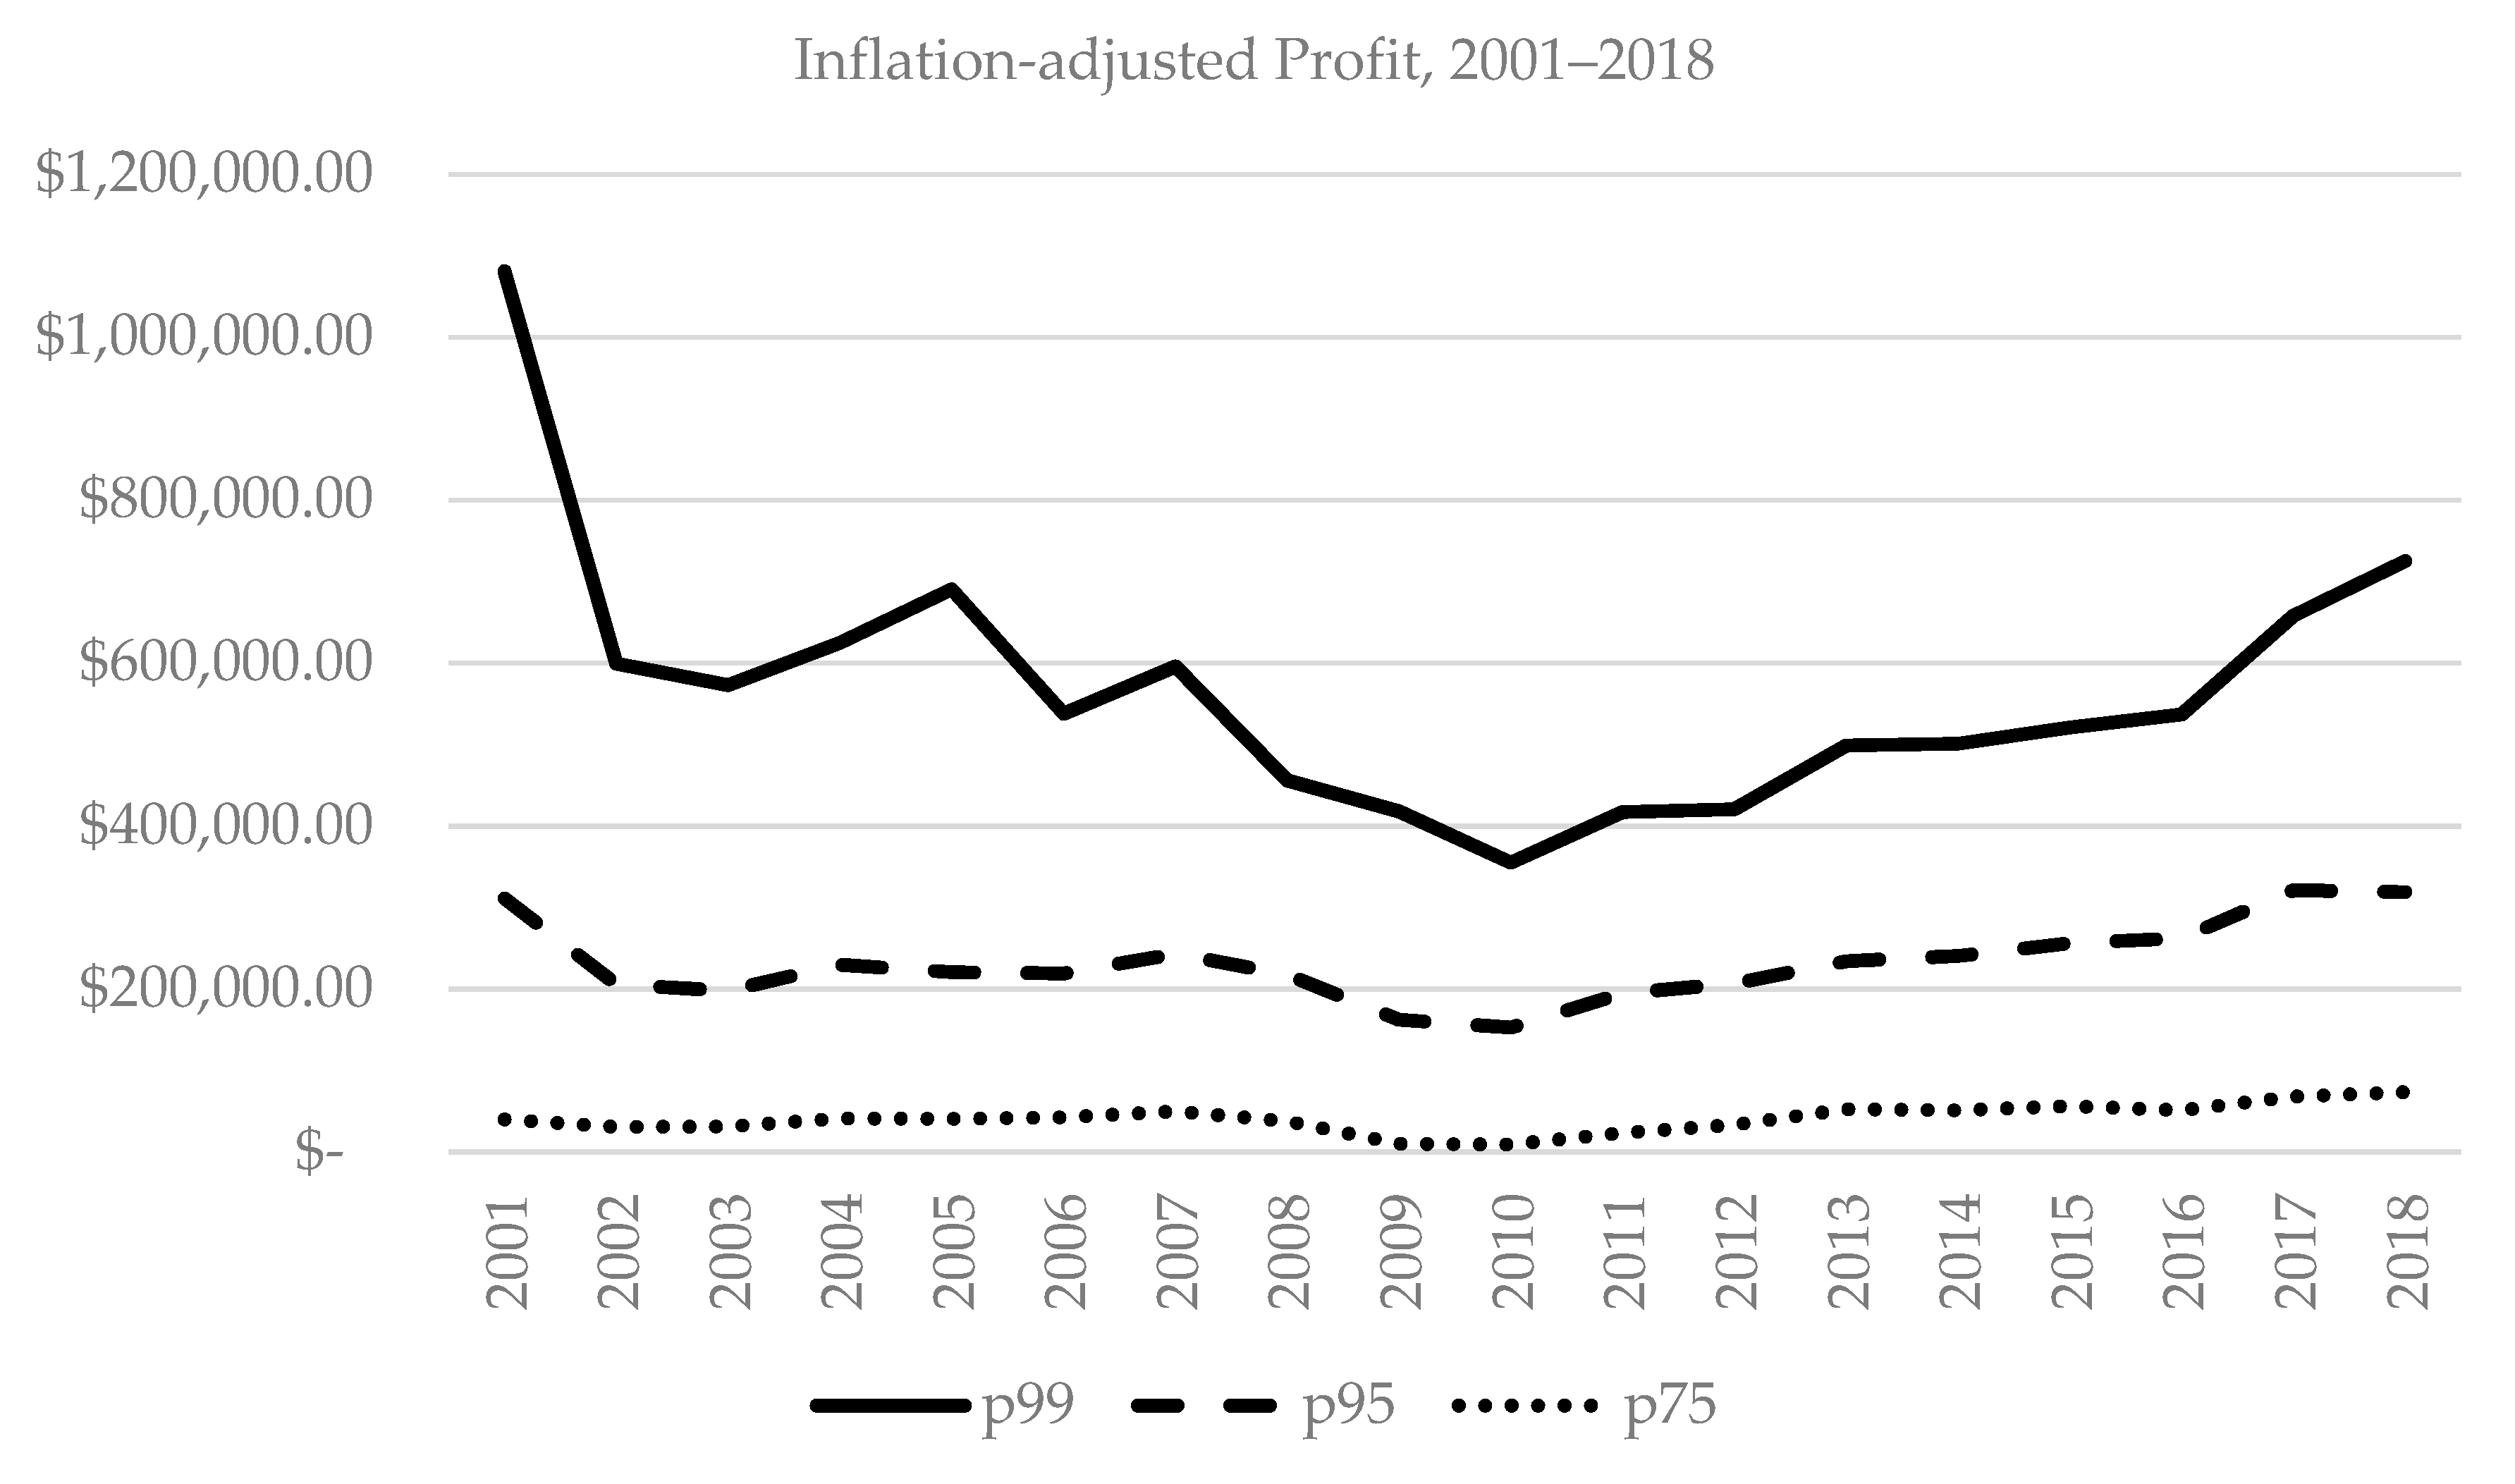
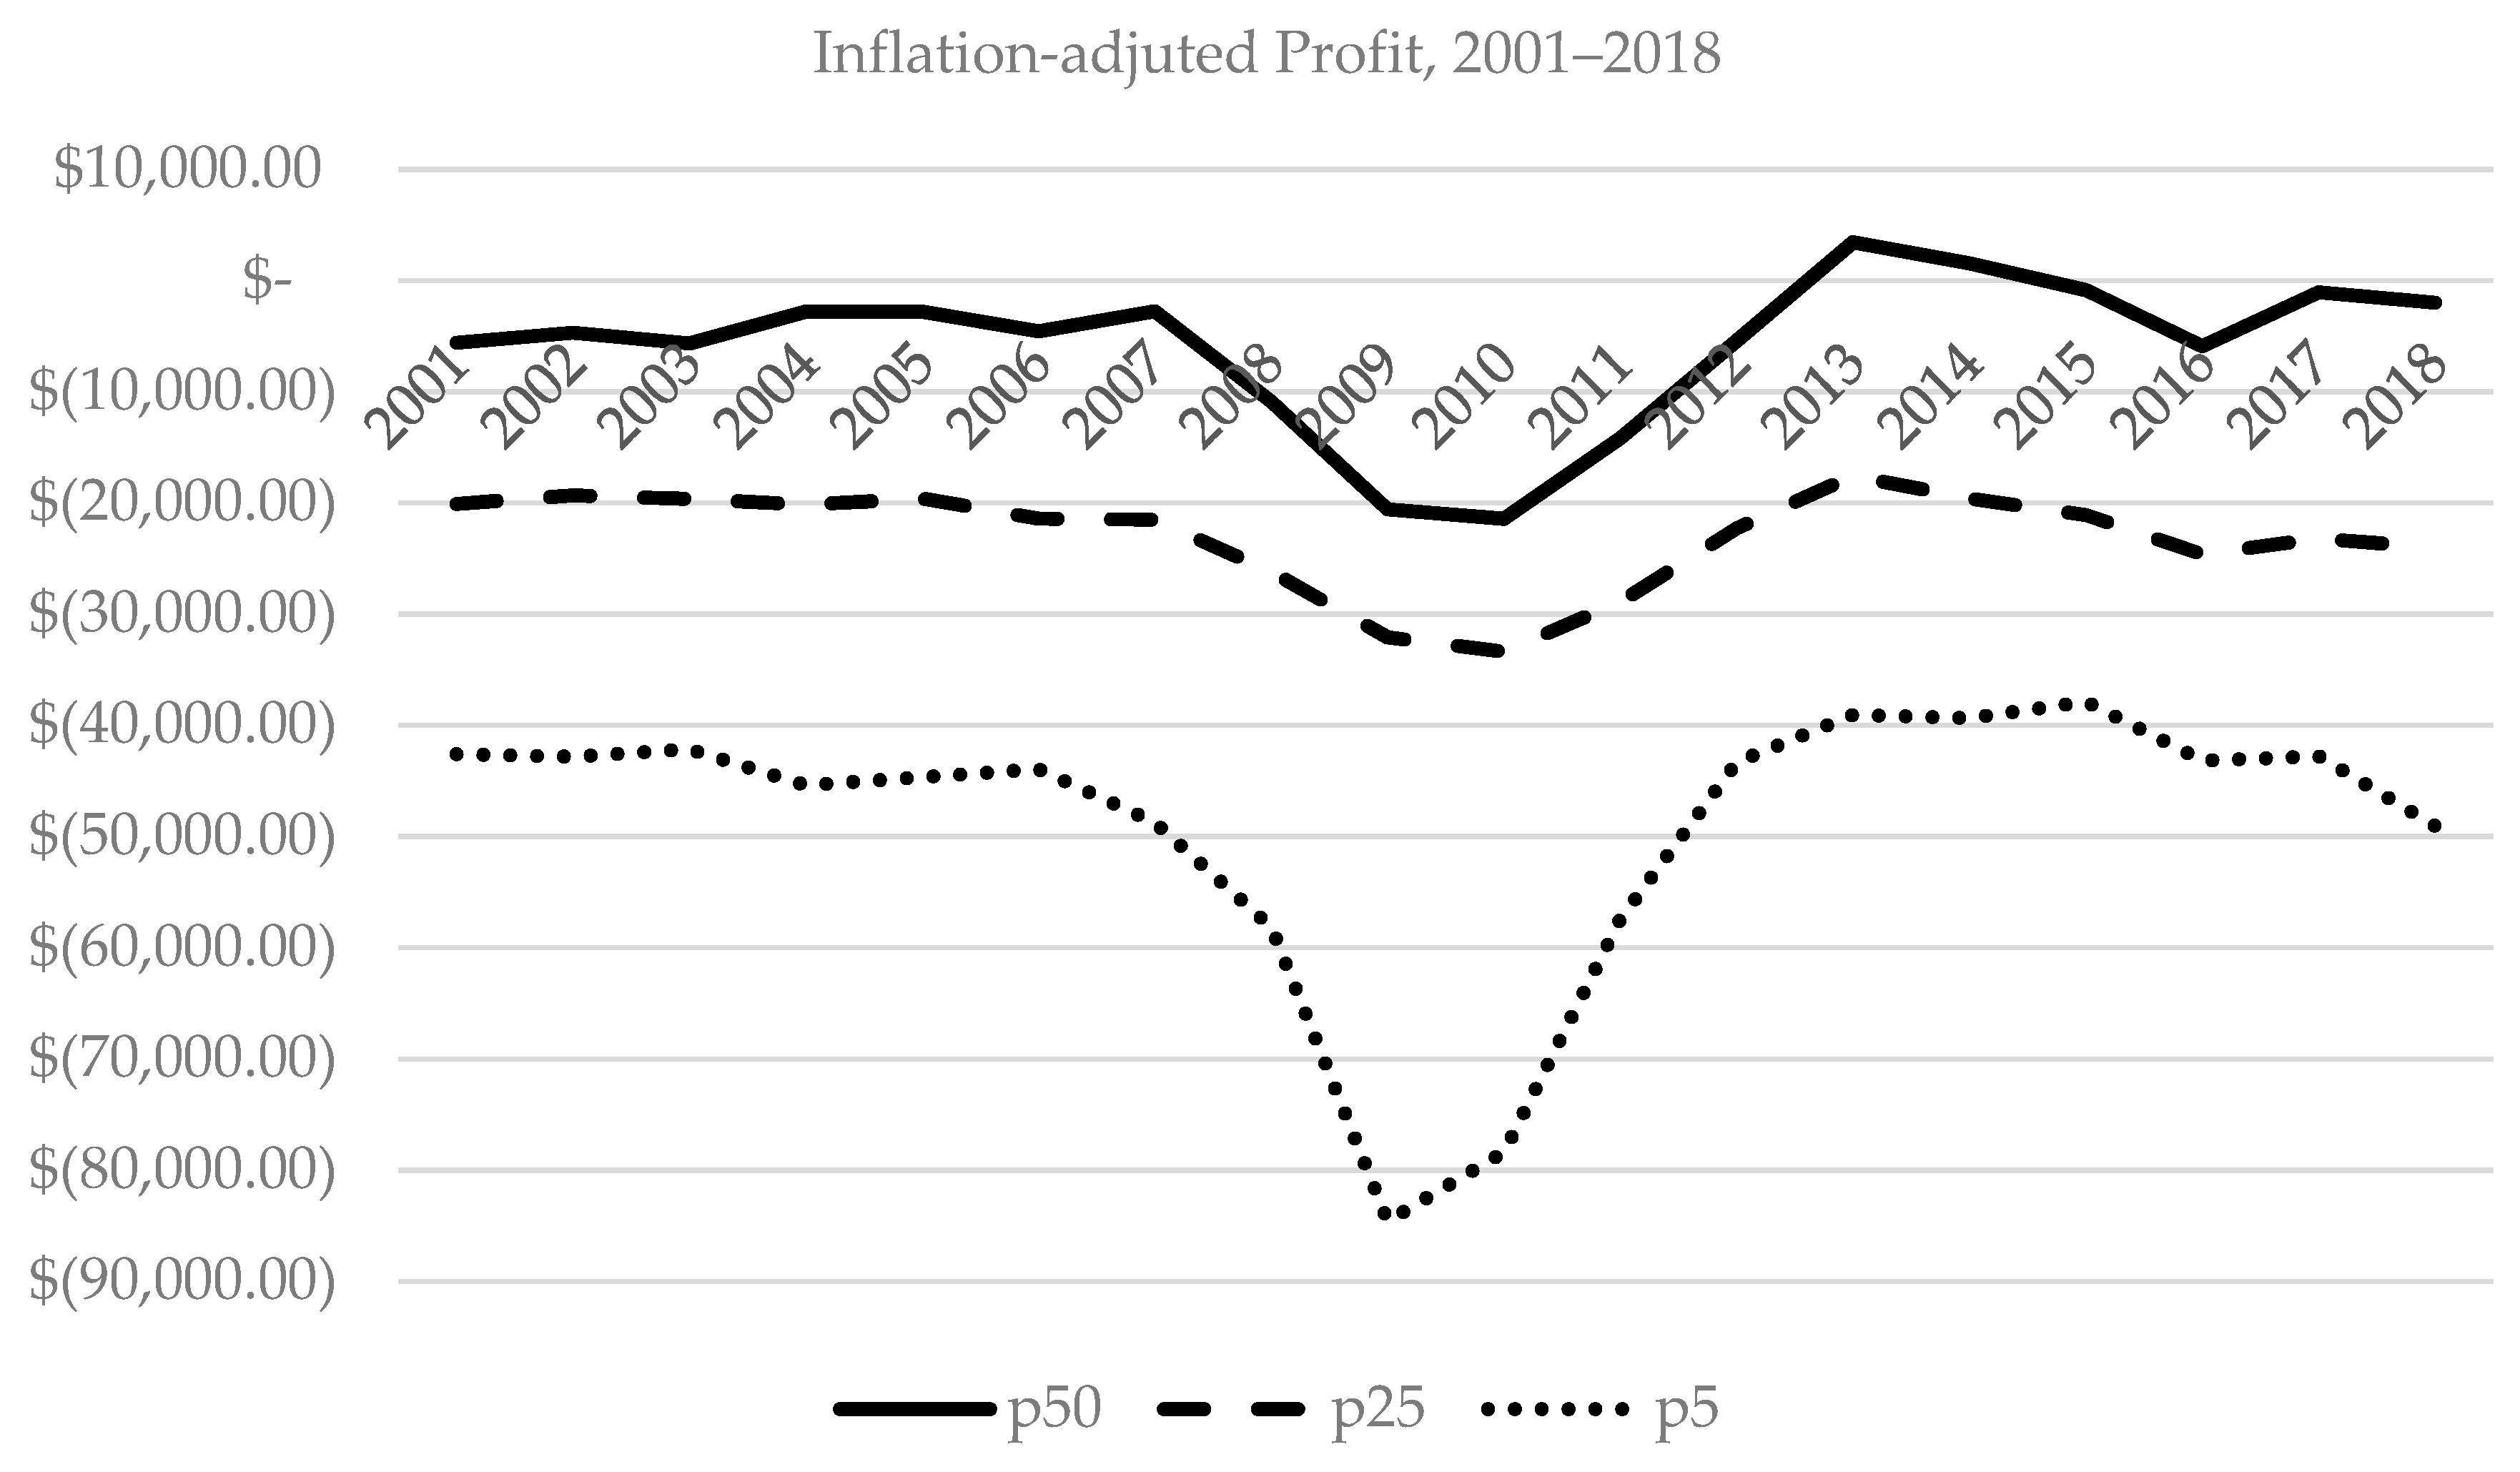
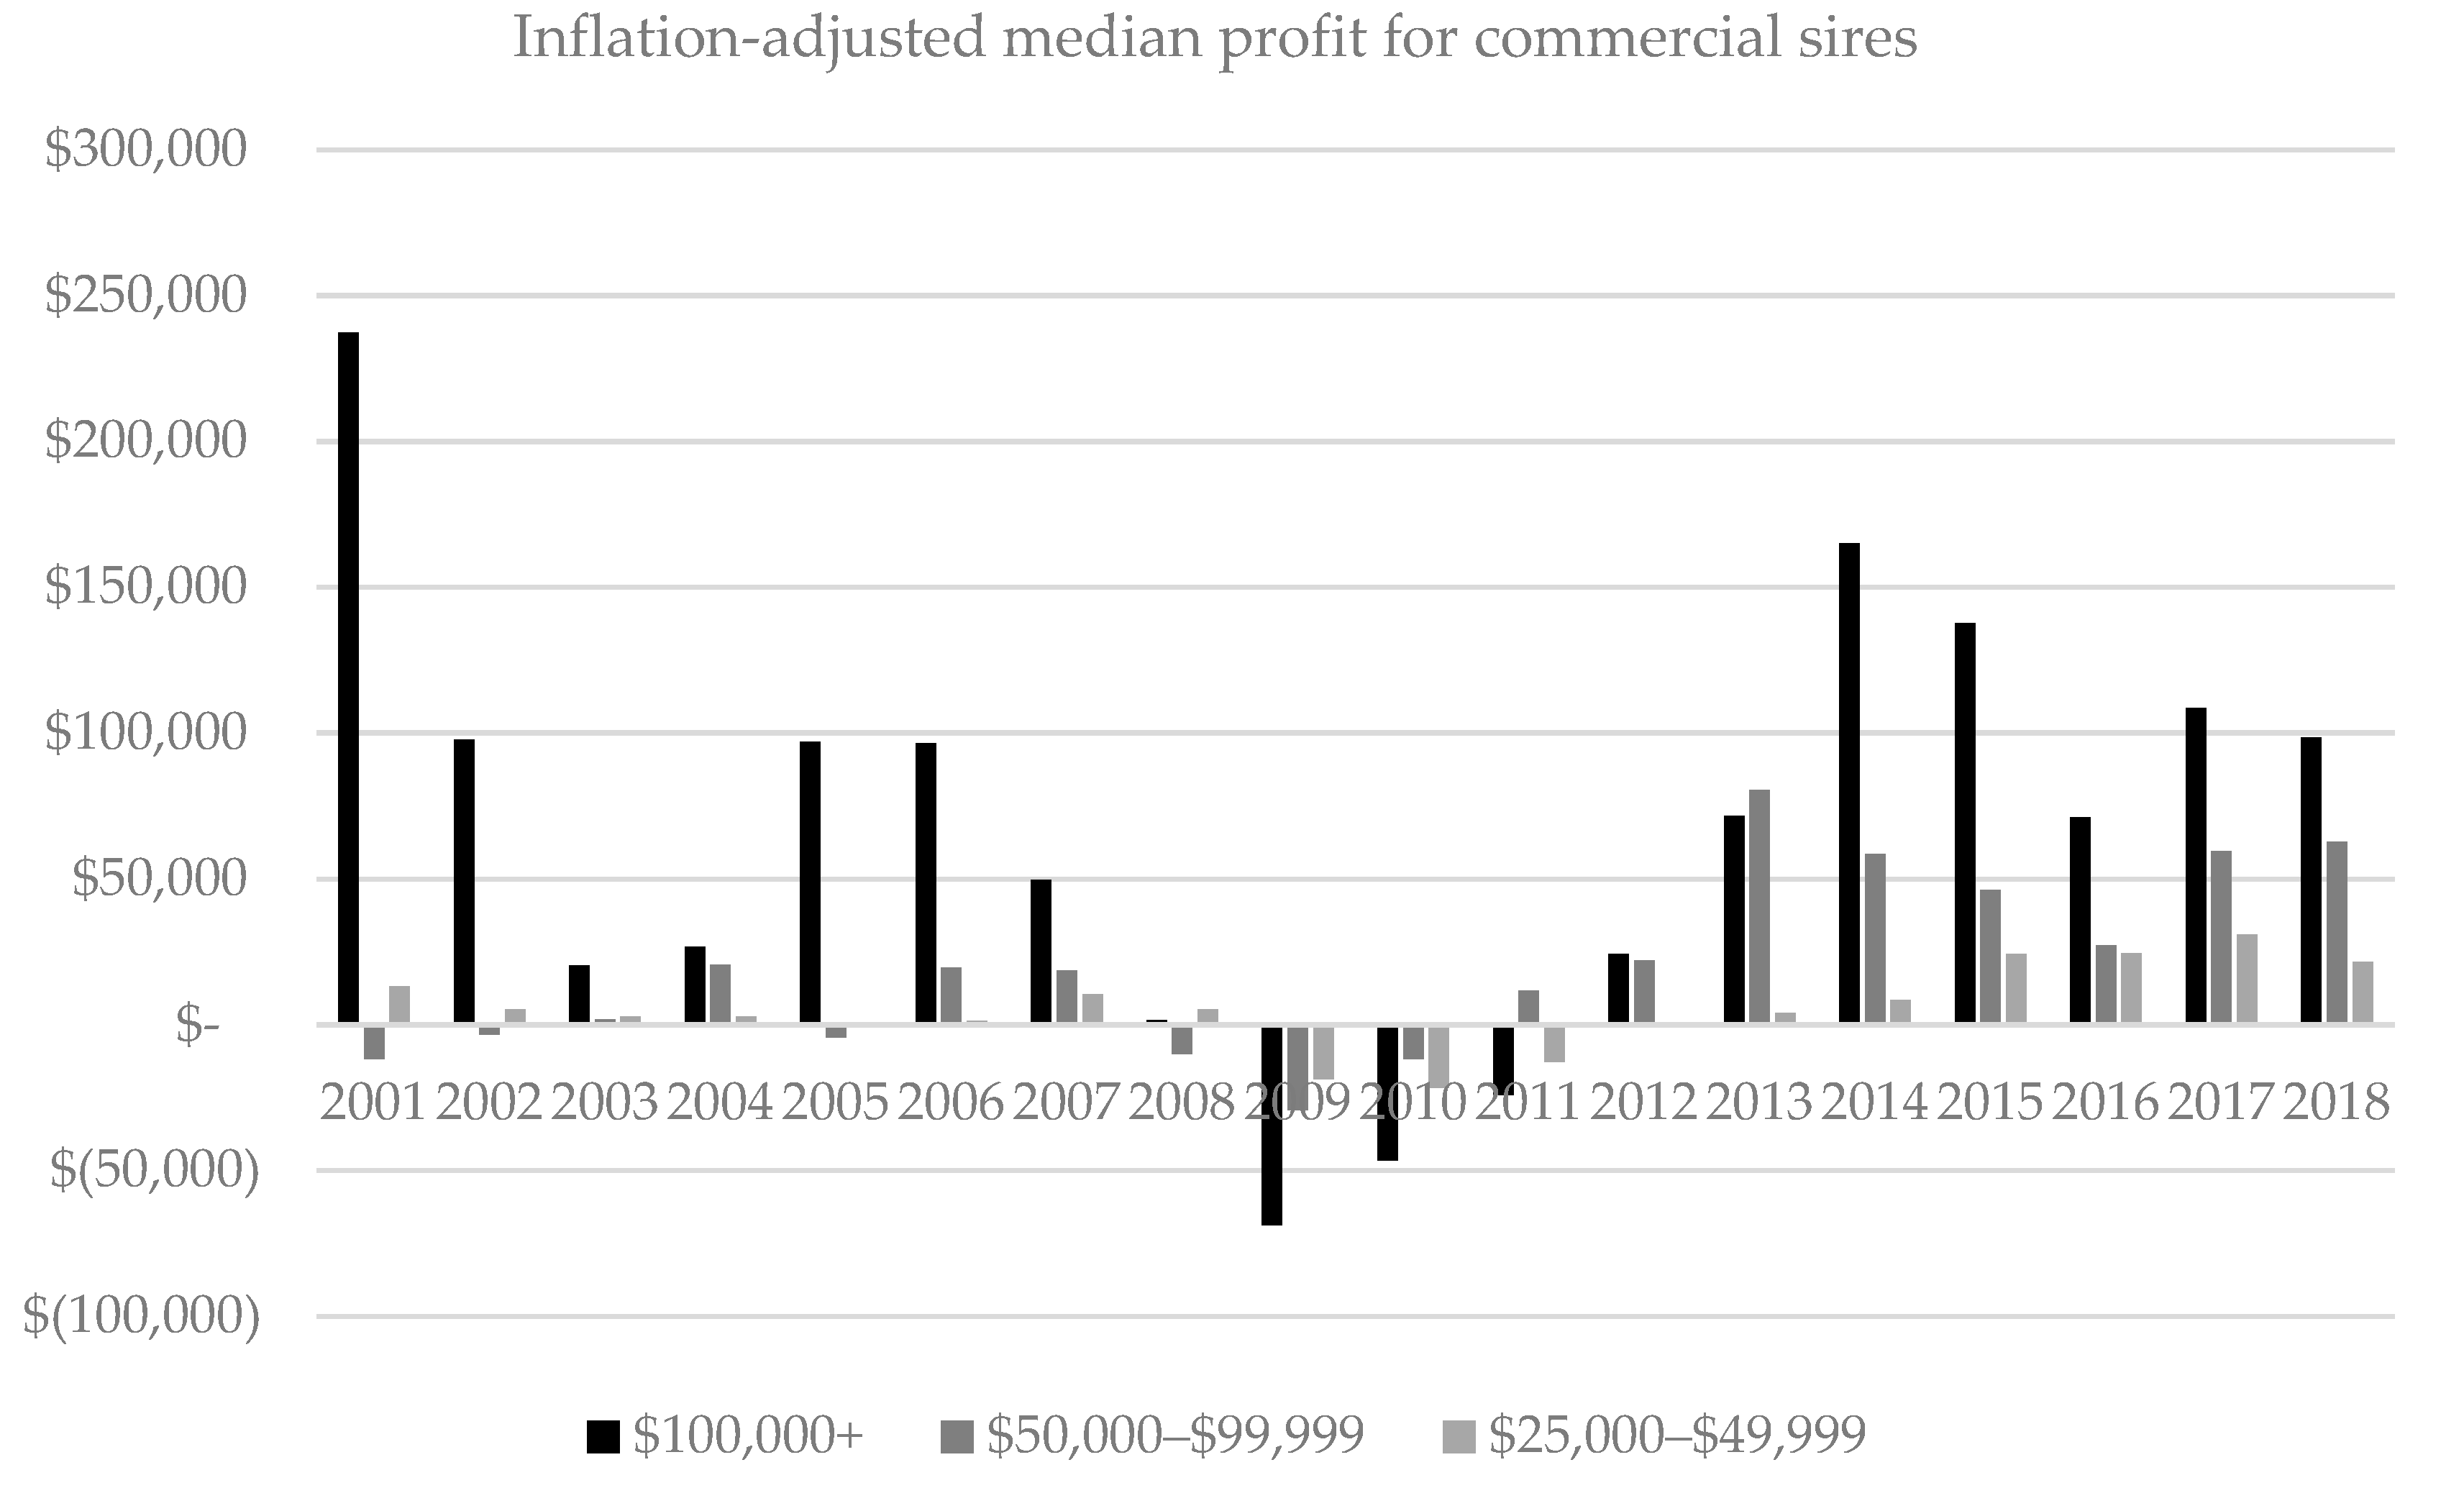
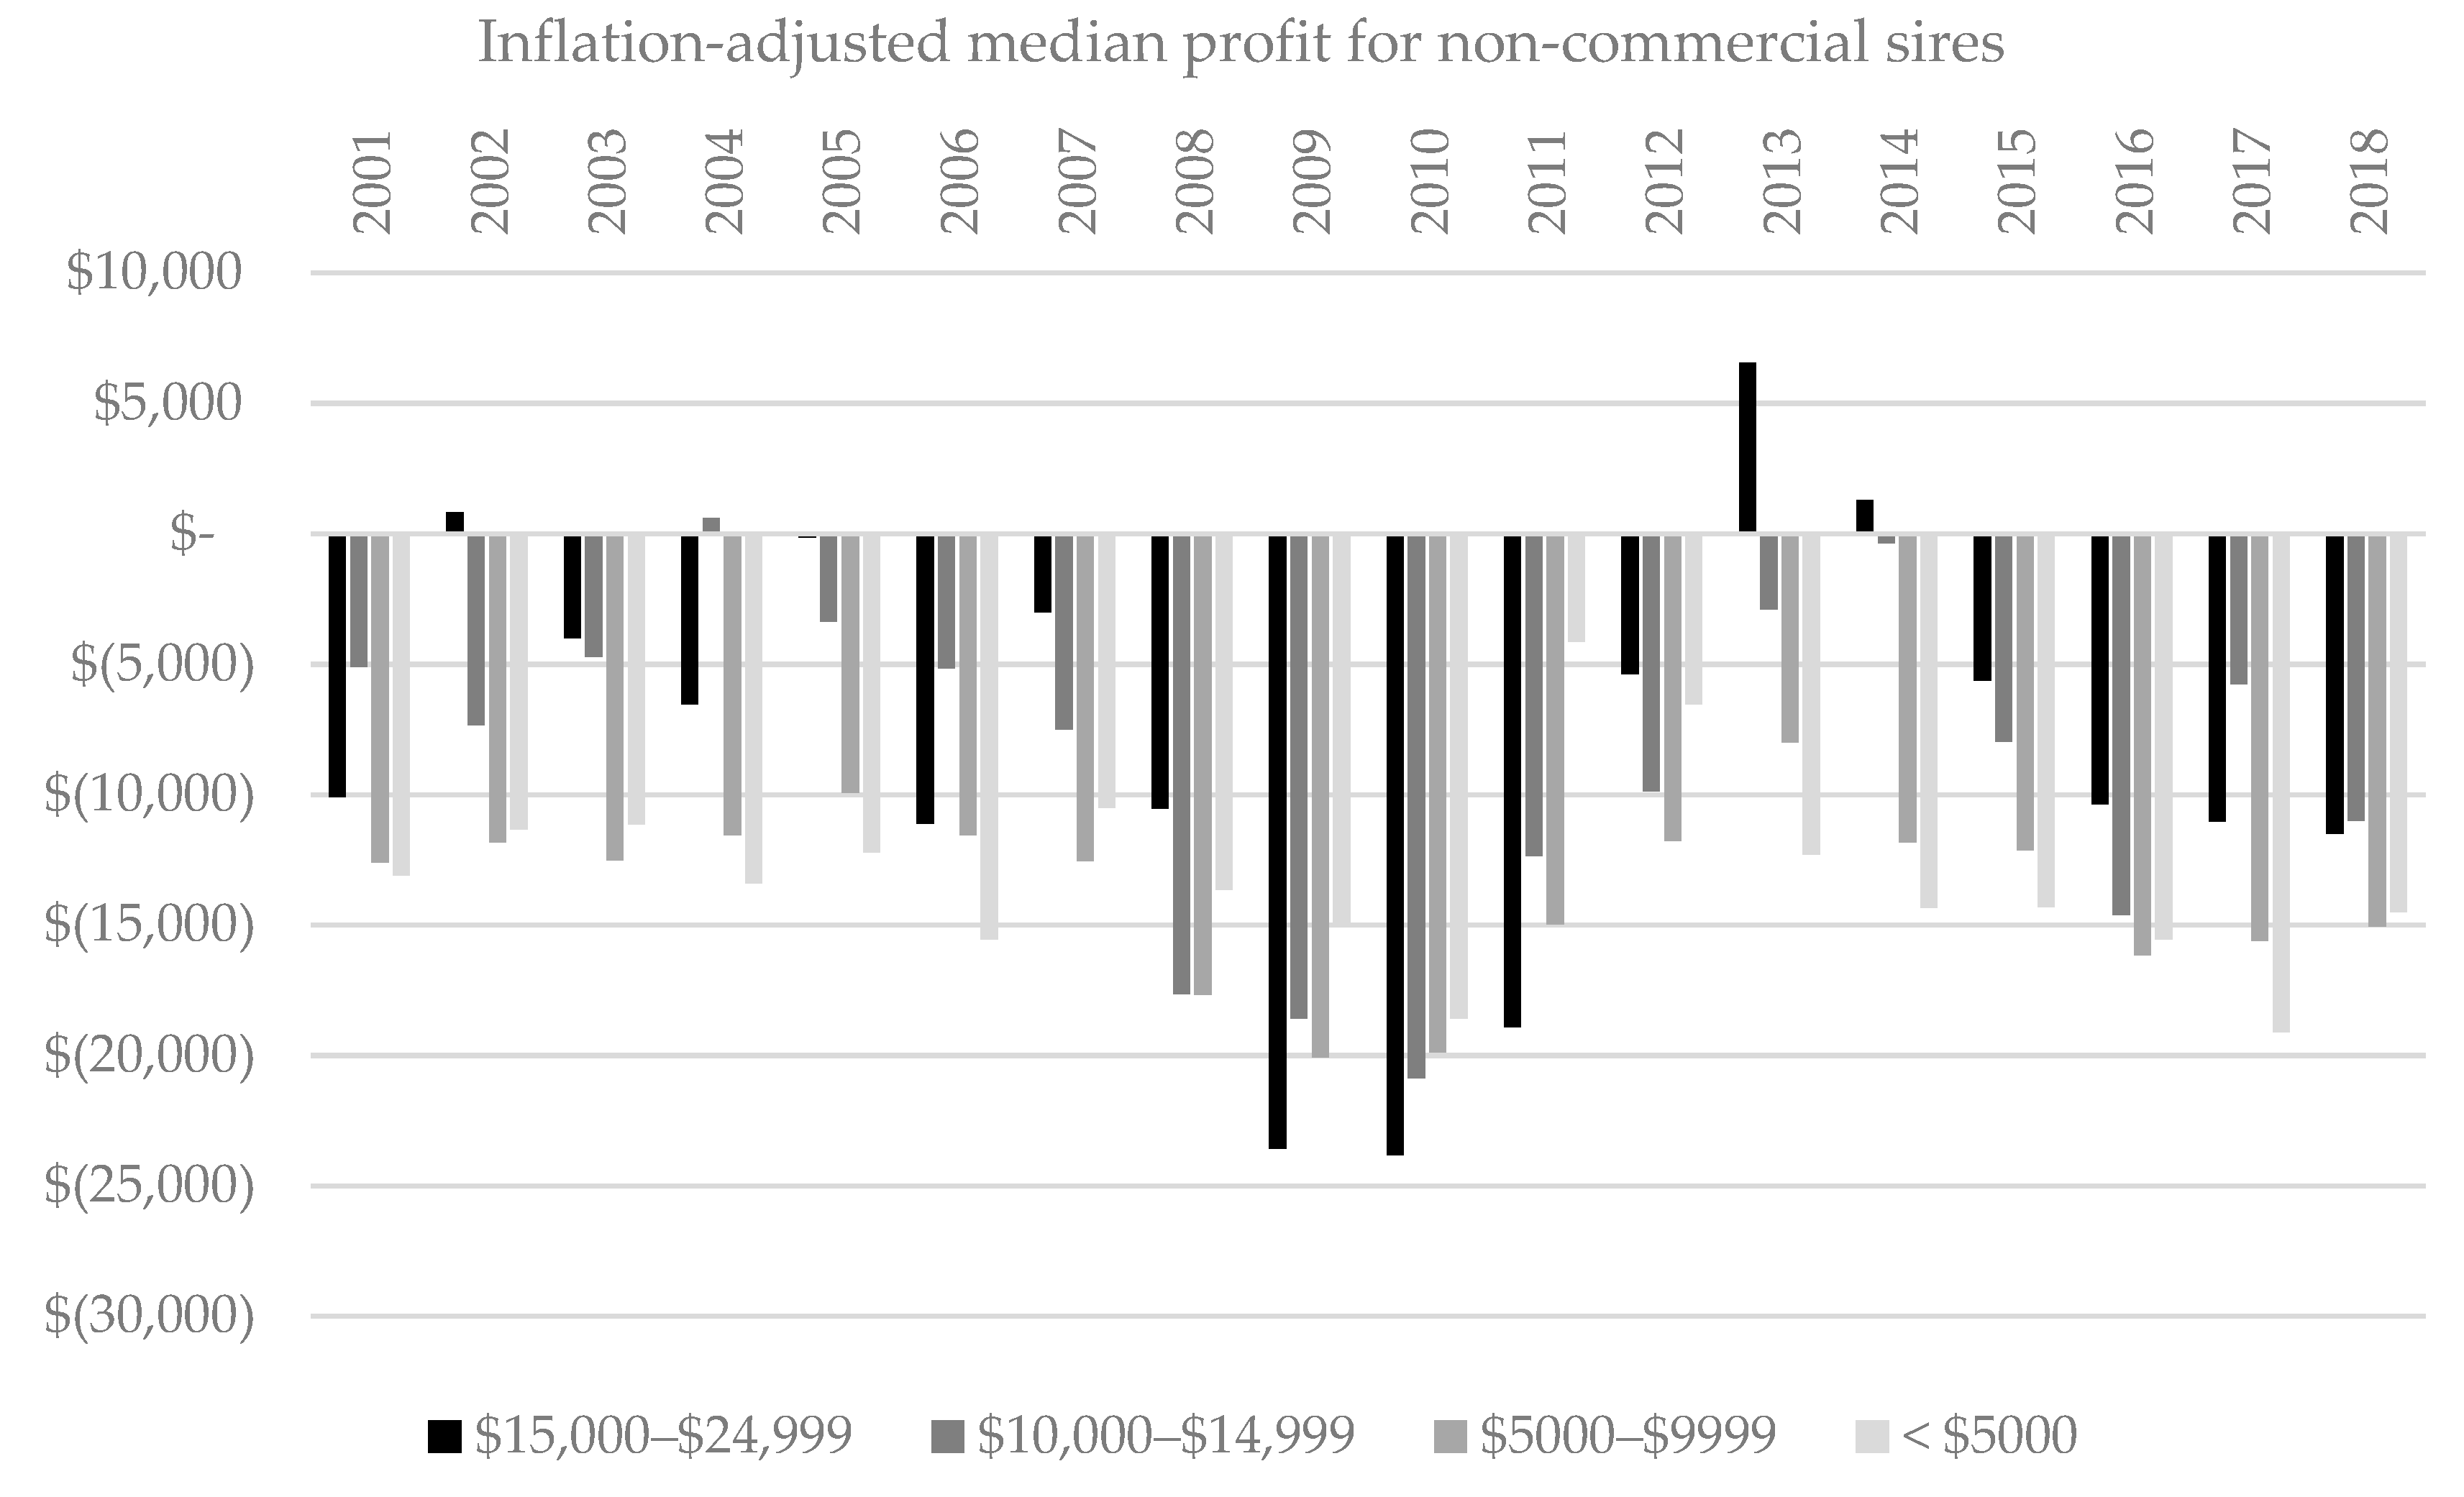
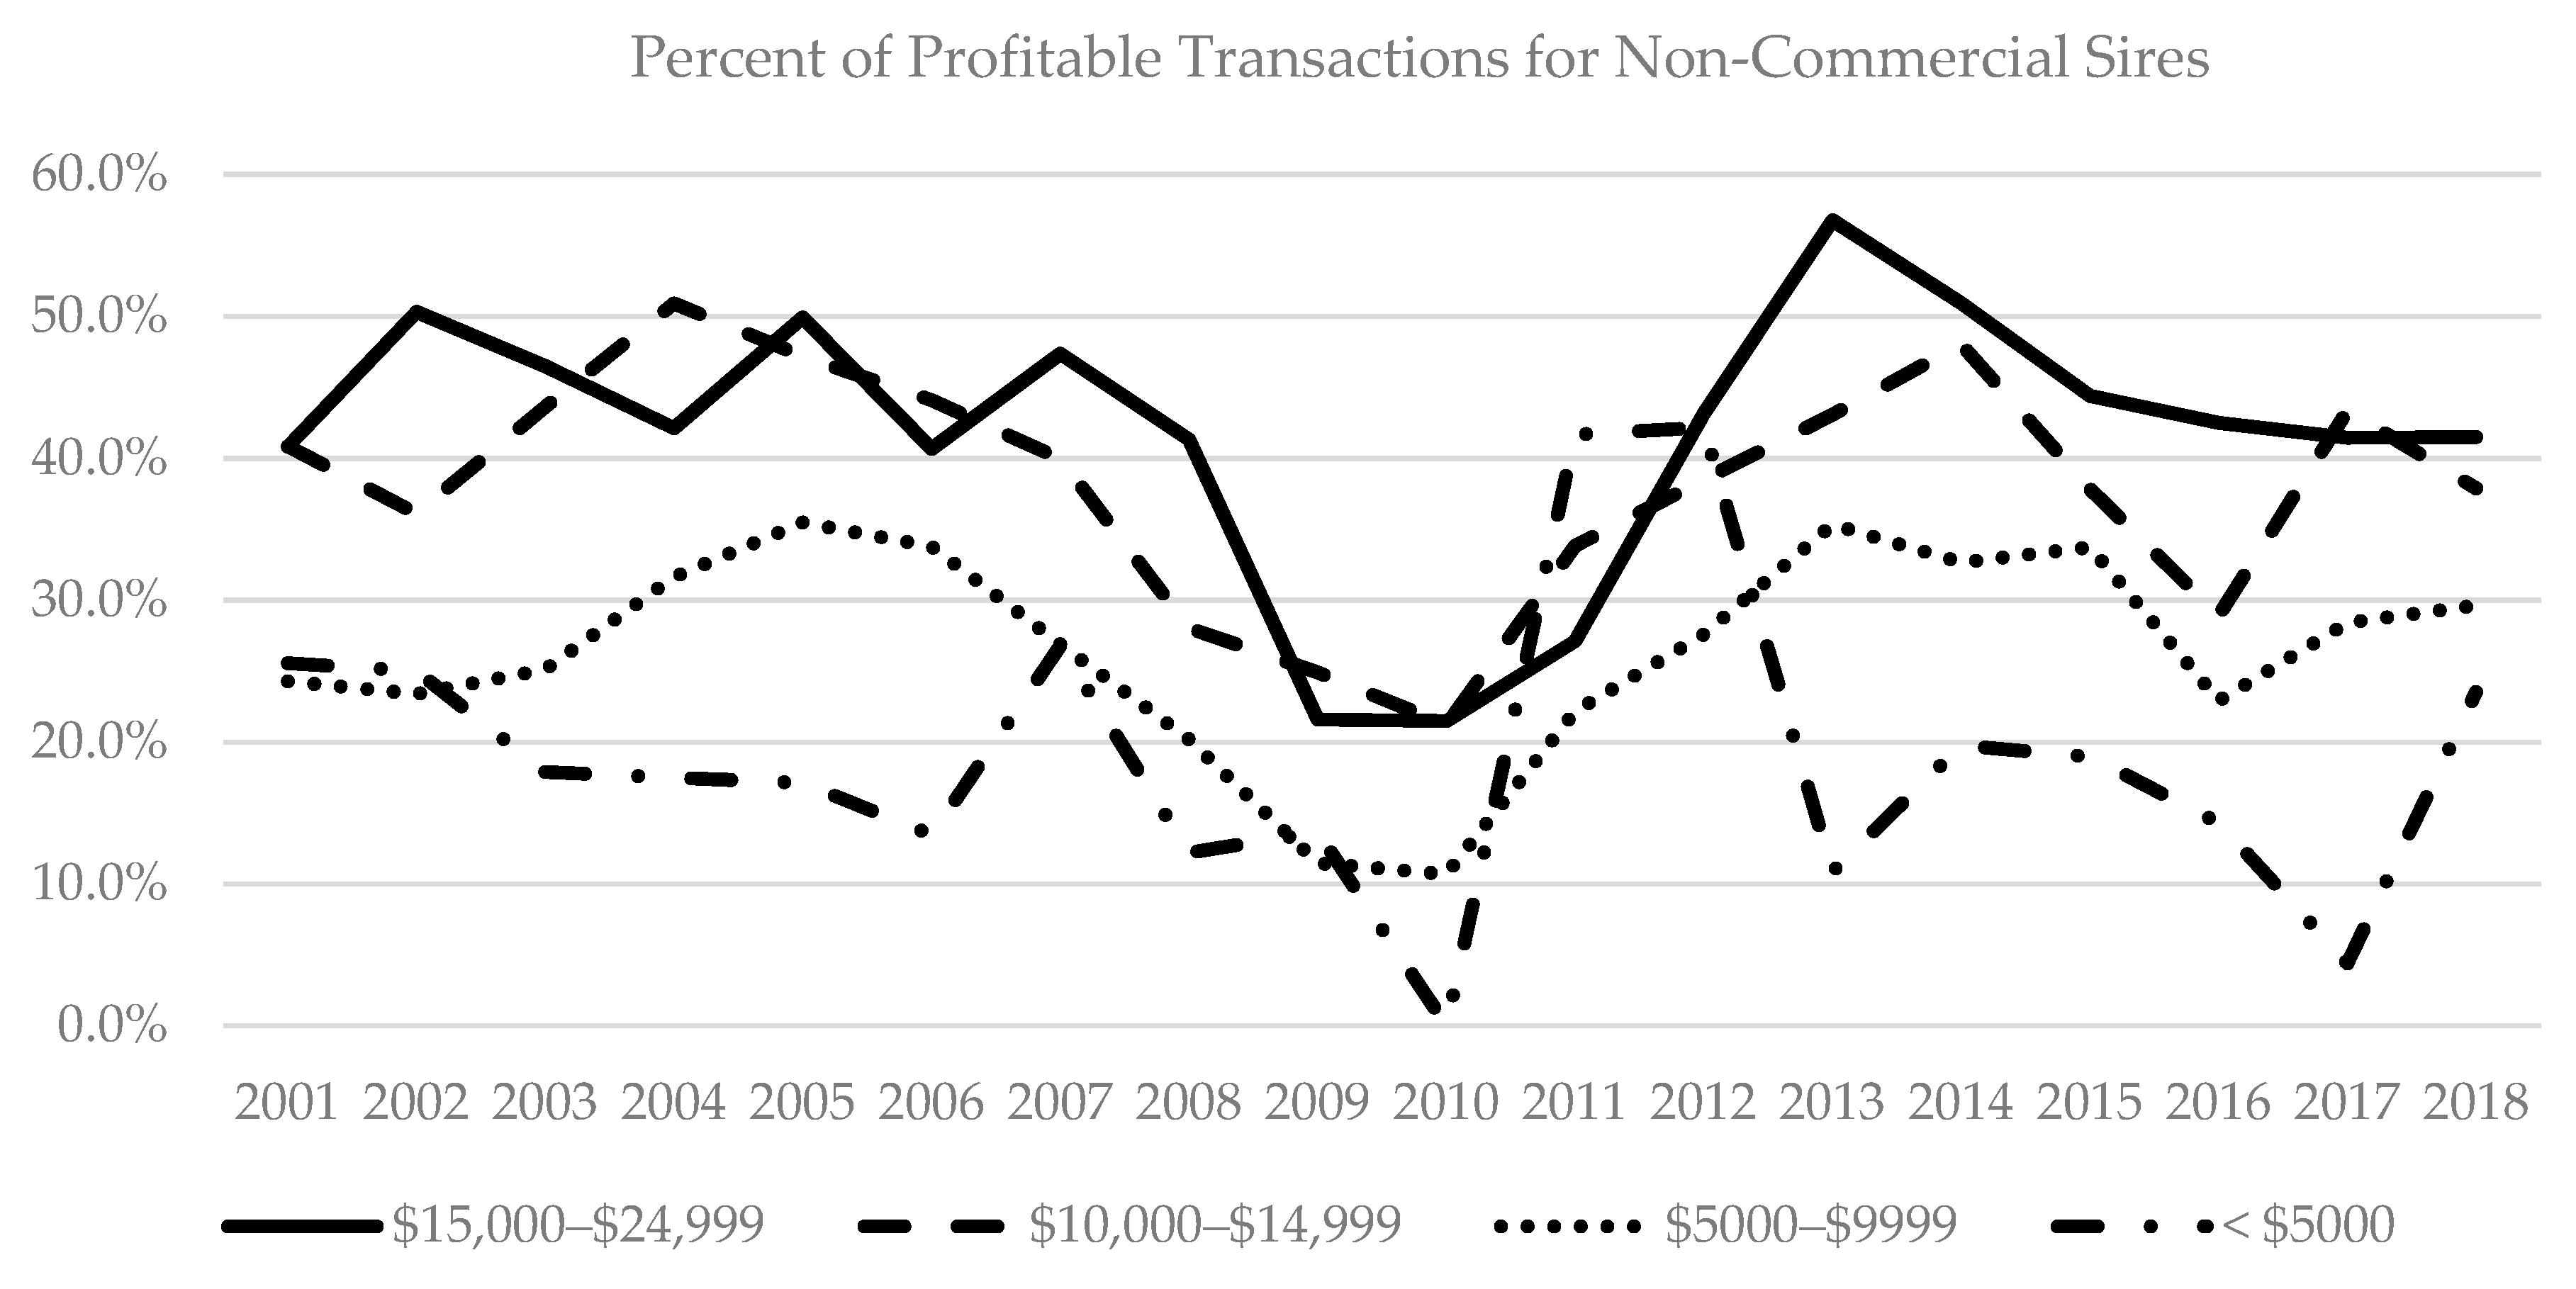
3.1. Trends in Sales Prices and Profitability, 2001–2018

Figure 1 depicts inflation-adjusted average and median sales prices from 2001–2018. Inspection of Figure 1 highlights the impact of the Great Recession in 2008 and 2009 on prices in the Thoroughbred yearling market. Mean prices fell by about 40% while median price fell by nearly 50%.
Table 2 presents average nominal profit, average inflation-adjusted profit in 2018 dollars, and the percentage of profitable sales annually from 2001 to 2018. Overall, under the assumption of low production costs, 44.4% of yearling sales were profitable, while under the assumption of high production costs, 36.1% of all yearling sales were profitable. In 2009 and 2010, average profit was negative under the assumption of high production costs.
Figure 2 illustrates the percentage of profitable sales under the assumption of both low and high production costs for the same time period. The two years following the start of the Great Recession demonstrate the lowest proportion of profitable transactions (2009 and 2010), while 2013, which was a few years into the recovery, exhibited the largest percentage of profitable transactions. 2013 and 2014 were the only years in which more than half of the transactions were profitable when assuming low production costs. With the exception of years spanning the Great Recession and its recovery, the percent of profitable transactions appear to remain relatively constant.
For the remainder of the paper, to err on the side of not underestimating profit, all further analyses are conducted under the assumption of low production costs ($20,000).
Figure 3 and Figure 4 illustrate estimated inflation-adjusted profit at the 99th, 95th, and 75th percentiles (Figure 3) as well as the 50th, 25th, and 5th percentiles (Figure 4). While there may be positive economic returns on average in a given year, this exercise demonstrates that with the exception of 2013 and 2014, median profit for breeders was estimated to be negative. In other words, a few especially lucrative transactions may yield an overall positive return enough though fewer than 50% of transactions are profitable. Moreover, Figure 4 illustrates sizable losses incurred by many breeders in the aftermath of the Great Recession.
What follows examines inflation-adjusted median profit and percentage of profitable transactions by stud fee category. The industry typically considers “commercial sires” to be those with advertised stud fees of at least $25,000 (some industry sources consider stallions with stud fees of $15,000 and above to be commercial, but our analysis shows that fewer than half of transactions in this category were profitable). Figure 5 and Figure 6 present inflation-adjusted median profit for commercial and non-commercial sires, respectively. The differences in the two figures is unmistakable. Figure 5 suggests that median profit is nearly always positive for yearlings by commercial sires and that the largest median profit is earned by yearlings with the highest quality sires (notably, though, when the economy experiences downturns such as the Great Recession, those breeders also stand to lose the most). In contrast, Figure 6 illustrates nearly guaranteed negative median profit across all categories of non-commercial sires. Together, Figure 5 and Figure 6 tell the story of a polarized market in which the best quality individuals are in high demand, but demand for individuals falling short of that ideal is weak.
Next, Table 3 presents the percentage of profitable transactions by stud fee. From 2001 to 2018, over 45% of the yearlings sold were by “commercial” sires. The percentage of profitable sales is monotonically decreasing from the highest stud fee category (57.6%) to the lowest (19.7%). Breeders with the initial means to invest in a higher quality stallion based on advertised stud fee stand a greater chance of realizing positive economic returns.
Figure 7 and Figure 8 illustrate percentage of profitable transactions among yearlings by commercial sires and non-commercial sires, respectively, from 2001 to 2018. For most years, investing in the top tier of stallions (stud fees of $100,000 and up) resulted in the greatest percentage of profitable sales, although there are a few exceptions. The largest deviations occurred in the years following the Great Recession, where breeders paid peak stud fees but experienced significant declines in prices. Yearlings by sires in the lowest stud fees of the commercial sires ($25,000–$49,999) appear to have the most predictable pattern of profitable sales, exhibiting less extreme deviations in times of boom or bust. Figure 6 depicts the same measure for yearlings by non-commercial sires. While the percentage of profitable sales is generally decreasing from higher stud fees to lower ones, there is significant variability in these measures from year to year. In addition, there were no profitable transactions in 2010 in the lowest stud fee category, even under the assumption of low production costs.
Based on this analysis, a few key points are evident. Perhaps the most remarkable is that even under the assumption of low production costs, fewer than half of the transactions are profitable in all but two of the years under analysis. Moreover, estimated median profit is negative for all years but one. Given the concerns on profitability from the British Thoroughbred Breeders’ Association study, this is troubling for the sustainability of smaller breeders who may not have the capital to invest in higher quality stallions. In the next section, we investigate changes to our assumptions that may lead us to underestimate profit.

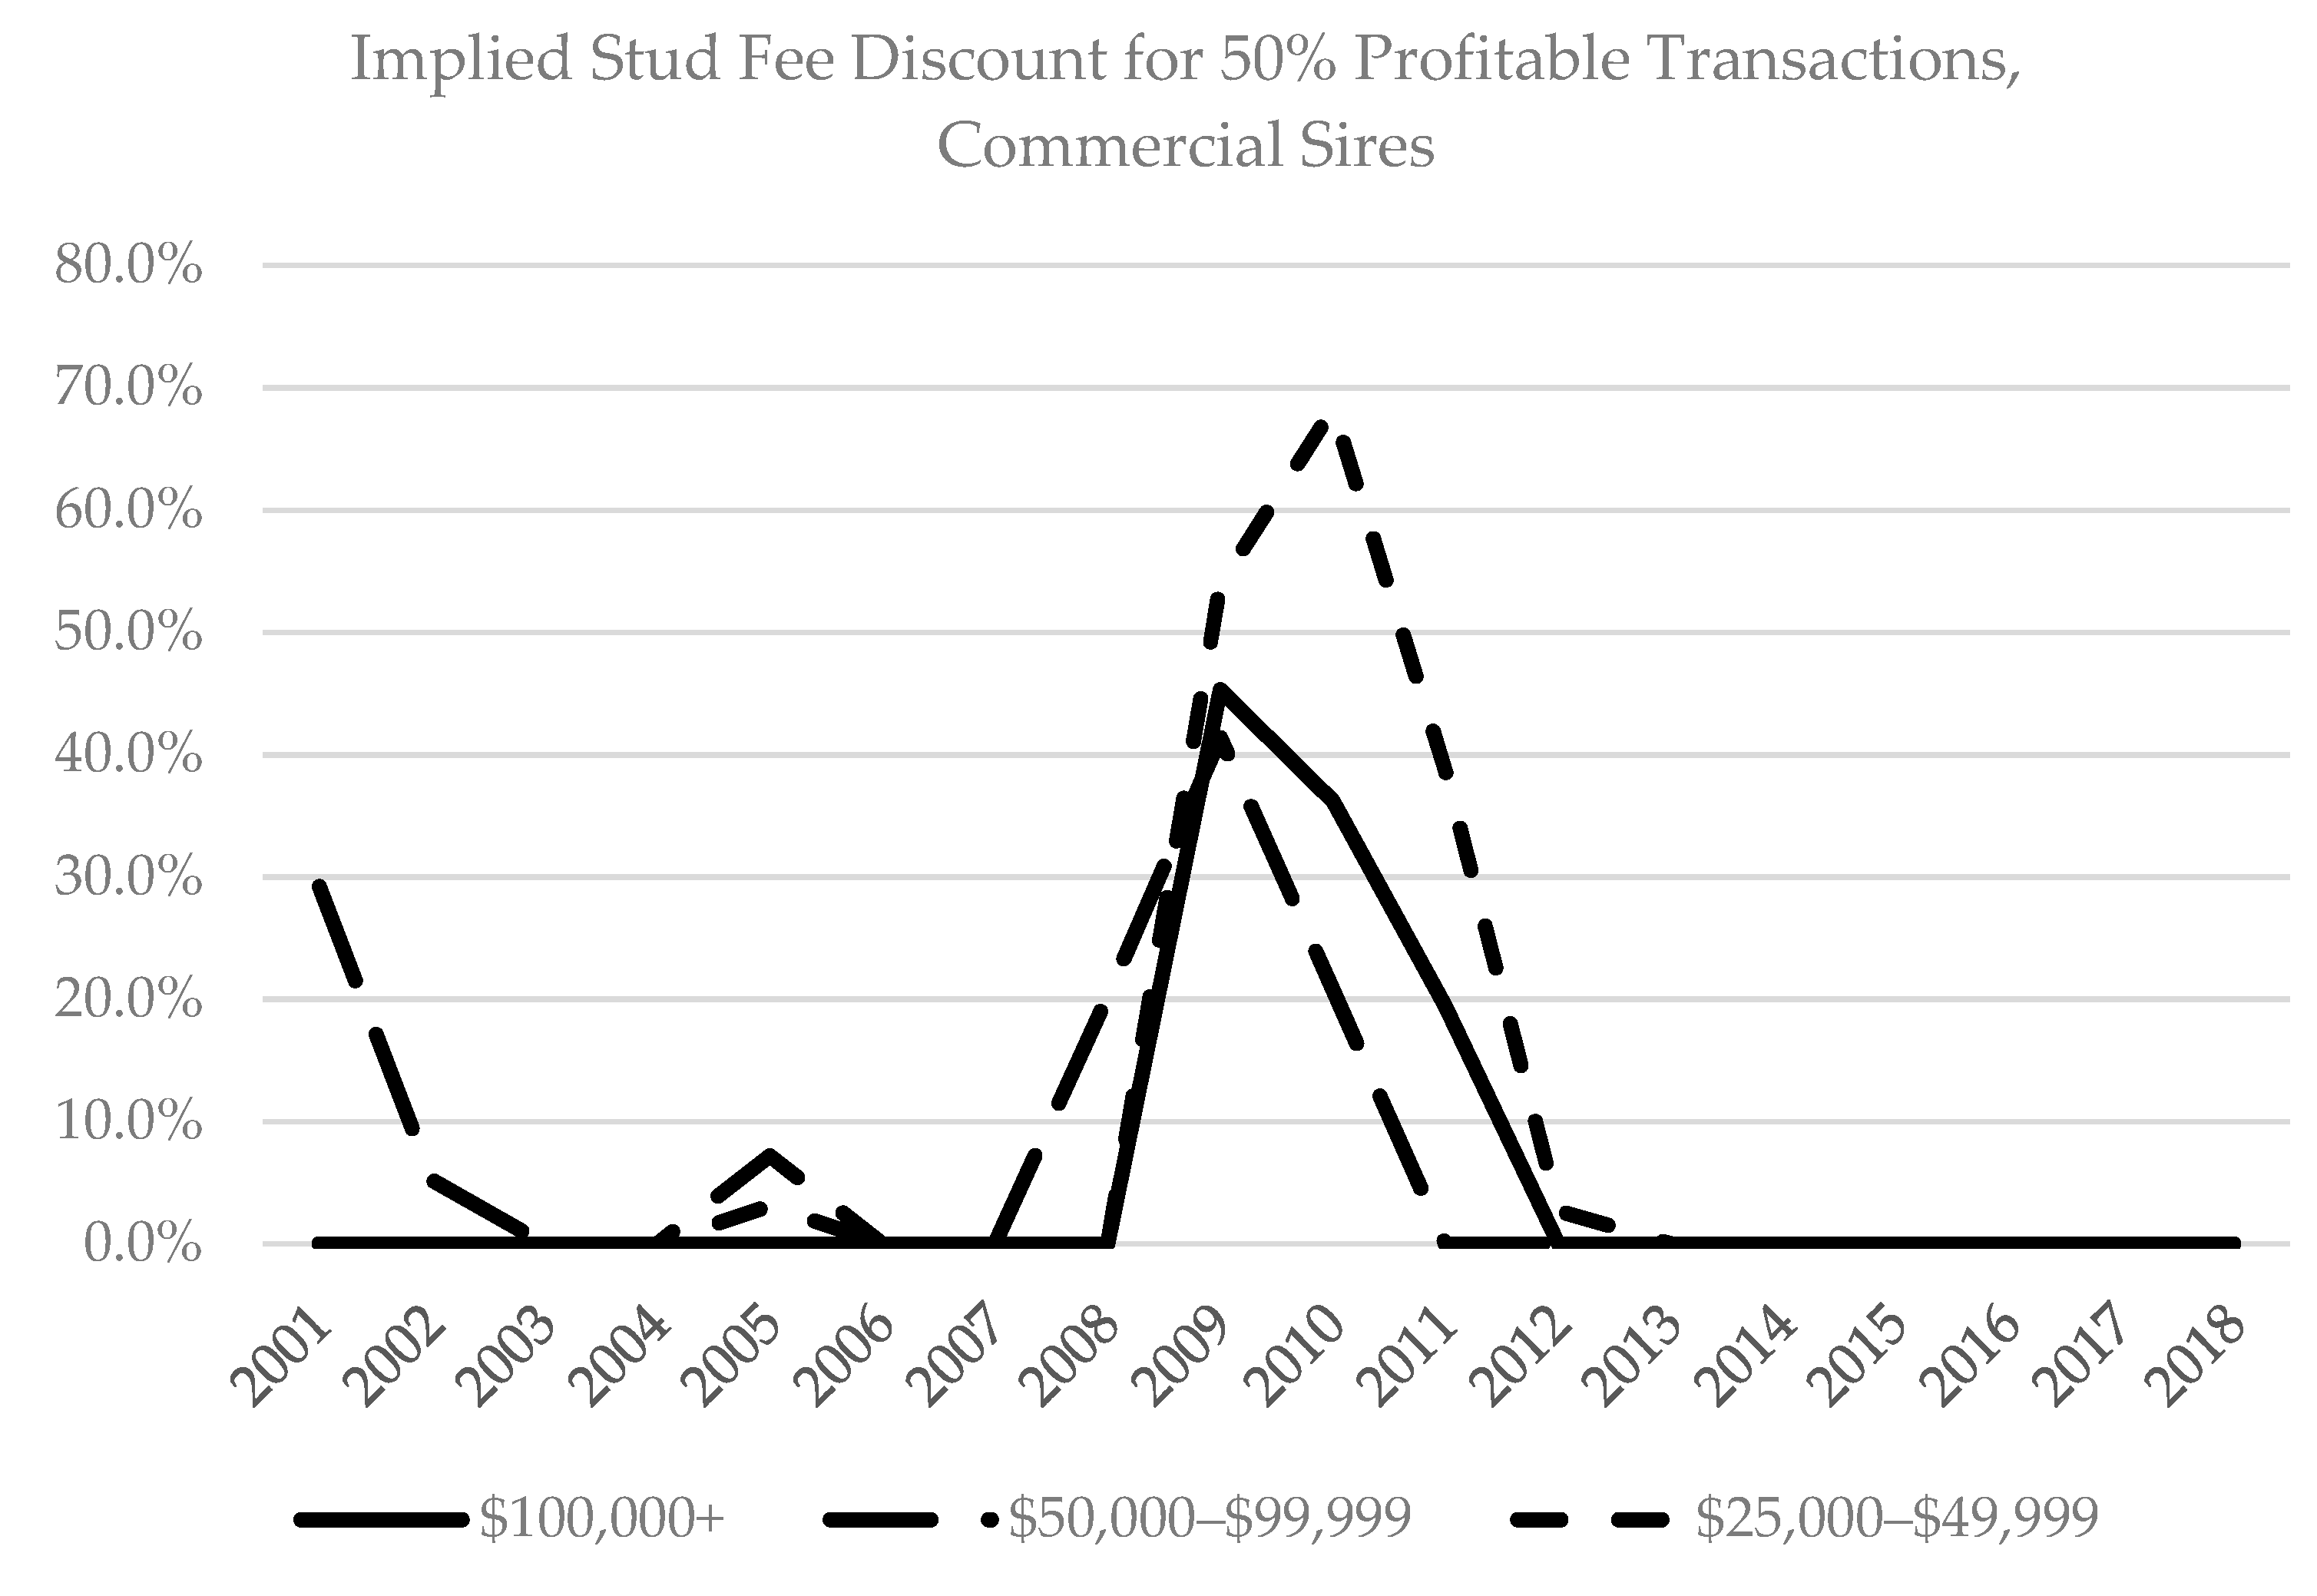
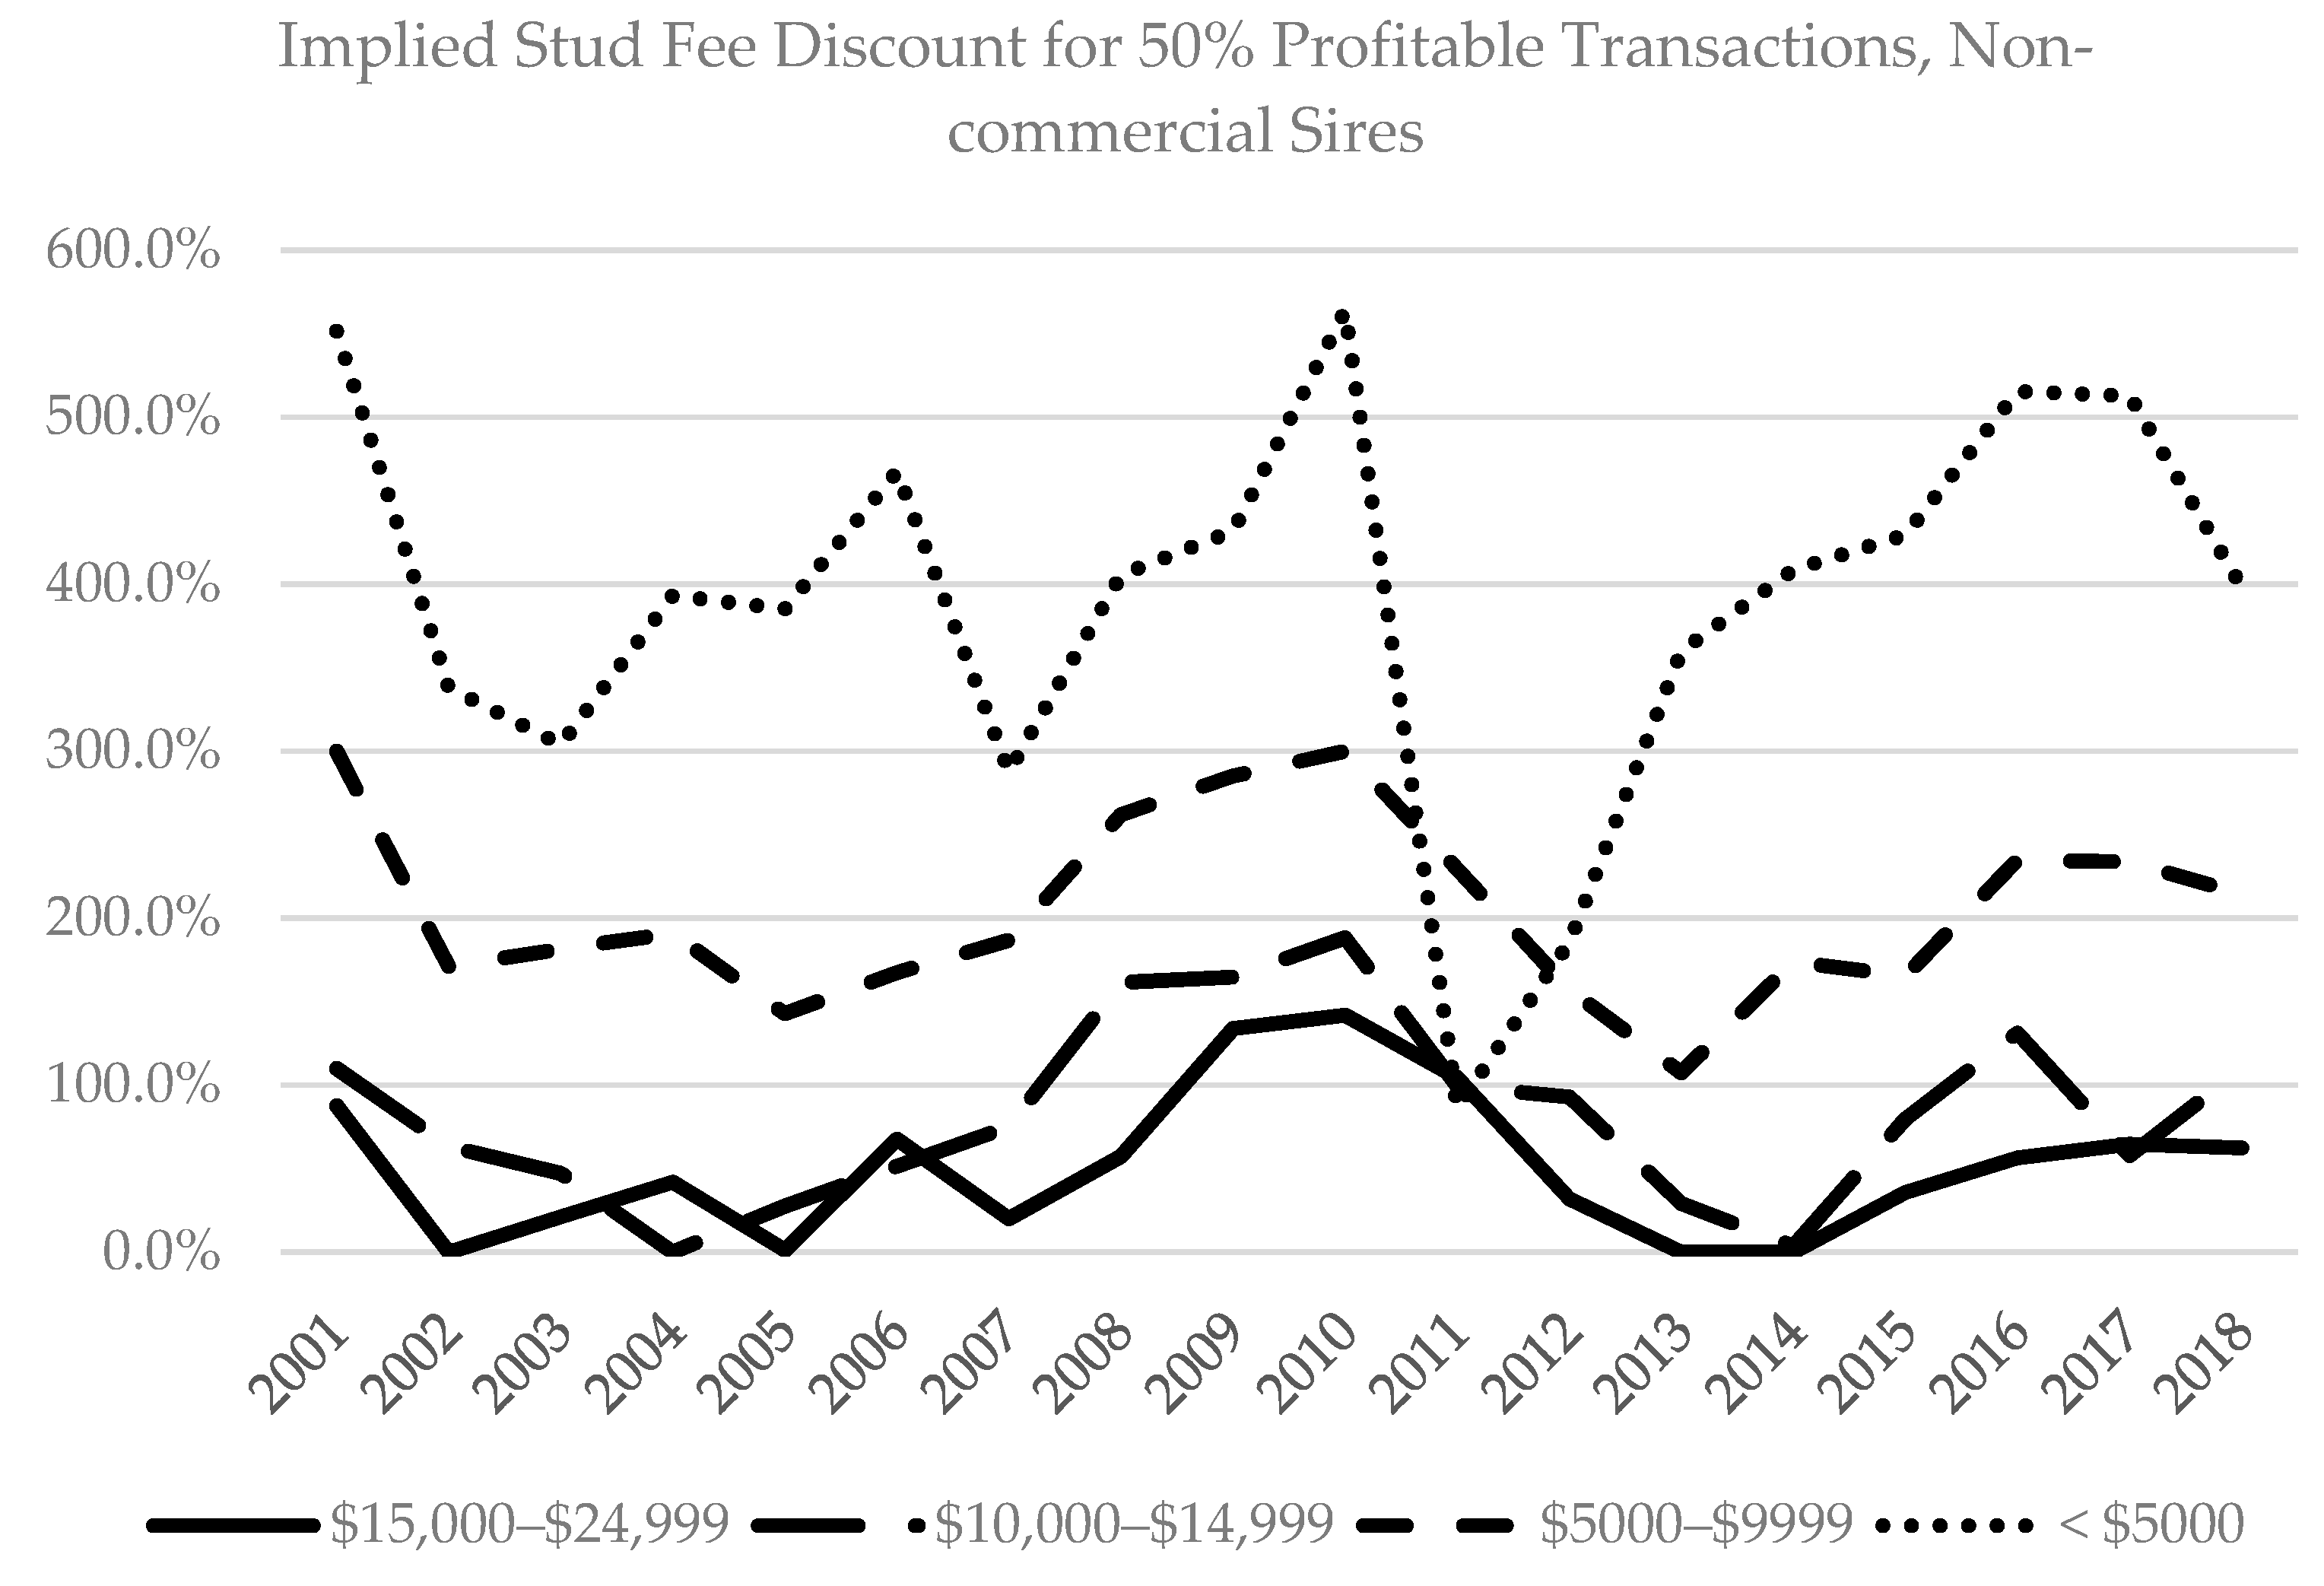
3.2. Implied Stud Fee Discount

In the estimation of profit, we had to make a few assumptions. First, we do not have access to actual production costs, so we identify two plausible levels in consultation with farm managers. Even assuming the low level of production costs, in general, fewer than 50% of profitable sales does not seem to be economically sustainable in the long run. So, while commission fees are generally fairly standard, our implicit assumption that breeders pay the advertised stud fee may be erroneous. A discount on the advertised stud fee may exist in many forms. Beyond a direct discount, breeders may receive discounted stud fees by breeding multiple mares to the same stallion or at the same farm, participating in foal-share partnerships with the stallion farm, purchasing a syndicate share, participating in incentive programs or risk-sharing programs, and so on. Because such a discount may exist in many forms, we estimate the implied direct stud fee discount that must exist in order to generate 50% or 67% profitable transactions using Goal Seek in Excel. The results are intended to capture the value of the discount that the breeder receives relative to the advertised stud fee, regardless of the form the discount actually takes. Moreover, in spite of this exercise, it is important to note that in some years, breeders certainly did not achieve the threshold of profitable sales even with any type of accommodation from the stallion owner.
Figure 9 presents the minimum annual implied stud fee discount required to achieve at least 50% or 67% profitable sales. The discount peaked in 2009 and 2010 where the discounts exceeded 80% (for 50% profitable transactions) and 100% (for 67% profitable transactions), and was minimized in 2013 and 2014, where no discount was necessary to achieve the threshold of 50% profitable transactions.
Figure 10 and Figure 11 investigate this issue further by allowing the implied discount to differ across stud fee categories. Generally, demand is stronger for sires with higher stud fees. Therefore, fewer incentives are needed to attract mares. However, sires with lower stud fees are less desirable and may require greater enticements to attract breeders. For this analysis, we only consider the 50% profitability threshold. Figure 10 presents the annual implied stud fee discount for commercial sires, while Figure 11 presents the implied discount for non-commercial sires.
Figure 10 suggests that among commercial sires, in most years, no implied discount was required to achieve 50% profitable transactions even though there were very few years in which no discount was required to achieve 67% profitable transactions.
Figure 11 demonstrates a much different result. For the bottom two stud fee categories, the implied stud fee discount is over 100%, indicating that even if the stud fee was waived, the transaction would still not have been profitable. So, even if there are breeders raising yearlings on a “shoestring” budget, realizing a positive economic return is unlikely. With a few exceptions, the implied discount was always greater than 0%, and often above 50%. Taken together, these results suggest that selling yearlings by non-commercial sires is not likely to be a profitable venture.

4. Discussion

This study investigates the profitability of commercial Thoroughbred breeders in North American from 2001–2018. We find that while average profit is positive over the 18-year period, the mean is driven by a few outliers. On average, fewer than 50% of transactions are profitable, and median profit is nearly always negative. In addition, we find that the likelihood of realizing a positive economic return on a transaction is greater for yearlings by higher quality stallions. Finally, in many instances, even if breeders had received a complimentary stud fee, profit would still have been negative. Taken together, these results suggest that the market for Thoroughbred yearlings is quite polarized. Consequently, the long-run sustainability for many of these breeders is uncertain, especially for breeders that may lack the capital to invest in high quality stallions.
Some participants in the racing and breeding industry, especially those in the upper echelons, have made their fortunes in other industries such as oil, telecommunications, and banking. Profitability may not be a primary objective for these participants; however, any business must show a profit motive or the activity will be classified as a hobby, and expenses associated with the activity will not be tax deductible. However, for those in the industry without other major sources of income, their operations are subject to the same rules of production as any other firm. Continually producing at a loss is not sustainable, and in the long run, these operations would be required to shut down.
There are a few limitations to the approach we adopted in this study. First, although we ultimately consider only the lowest production cost, it is possible that production costs are still overestimated. In addition, it is possible that breeders often pay less than the advertised stud fee. To account for this, we determined the implied stud fee discount that would yield a threshold level of profitable transactions. Third, it is possible that the percentage of profitable transactions is not the best measure of profitability to consider. Many commercial breeders likely own more than one broodmare and sell multiple yearlings in any given year. In this case, the return on the portfolio would be a more accurate measure of profitability. However, due to data limitations, we are unable to pursue this approach.
A significant contributor to breeder profit is the price that buyers are willing to pay for young Thoroughbreds. Future research plans include investigating factors influencing price at the market level. For example, in the year following a highly televised breakdown, did yearling profitability decrease? Or, in the event of a welcome anomaly, such as American Pharaoh becoming the first Triple Crown winner in 37 years, would enthusiasm be renewed? Also, to what extent do macroeconomic factors, such as interest rates, exchange rates, capital gains tax rates, and tax benefits (like accelerated depreciation) influence prices? Karungu, Reed, and Tvedt study some of these factors, but those results are now 25 years old [13]. Finally, it would be interesting and useful to develop a model capable of forecasting cycles in the market. Because there are no futures markets for Thoroughbreds, and because of the biological constraints involved in producing Thoroughbreds, it may be possible to identify leading indicators to forecast median or average prices. This type of tool may be able to benefit breeders in their ability to anticipate expected returns and make decisions accordingly.

Author Contributions

Conceptualization, C.J.S.; methodology, J.B. and C.J.S.; formal analysis, J.B. and C.J.S.; data curation, J.B.; writing—original draft preparation, J.B. and C.J.S.; writing—review and editing, J.B. and C.J.S. All authors have read and agreed to the published version of the manuscript.

Funding

This work is supported by the National Institute of Food and Agriculture, U.S. Department of Agriculture, Hatch Project, under accession number 1014277.

Conflicts of Interest

The authors declare no conflict of interest.

References and Notes

  1. The Contribution of Thoroughbred Breeding to the UK Economy and Factors Impacting the Industry’s Supply Chain. Thoroughbred Breeders’ Assocation: Great Britain, UK, 2018. Available online: https://www.thetba.co.uk/wp-content/uploads/2018/09/TBA-Economic-Impact-Study-2018.pdf (accessed on 26 December 2019).
  2. 2019 Fact Book; The Jockey Club: Lexington, KY, USA, 2019. Available online: http://www.jockeyclub.com/Default.asp?section=Resources&area=11 (accessed on 26 December 2019).
  3. 2018 Auctions Digest; Blood-Horse, LLC: Lexington, KY, USA, 2018; p. 56.
  4. 2012 Auctions Digest; Blood-Horse LLC: Lexington, KY, USA, 2012; p. 1.
  5. 2010 Auctions Digest; Blood-Horse LLC: Lexington, KY, USA, 2010; p. 3877.
  6. Keeneland Sales Summaries. 2019. Available online: http://flex.keeneland.com/summaries/summaries.html (accessed on 26 December 2019).
  7. Fasig-Tipton Results Archive. 2019. Available online: http://www.fasigtipton.com/results/2019 (accessed on 26 December 2019).
  8. Nutt, P.; Clark, M.; Graycarek, R.; Hall, C.T.; Roenker, J. The Kentucky Thoroughbred Breeding Industry and State Programs that Assist the Equine Industry; Legislative Research Commission: Frankfort, KY, USA, 2011. [Google Scholar]
  9. Neibergs, J.S.; Vinzant, P.L. Maximum-Likelihood Estimates of Racehorse Earnings and Profitability. J. Agribus. 1999, 17, 37–48. [Google Scholar]
  10. Bosh, K.A.; Powell, D.; Neibergs, J.S.; Shelton, B.; Zent, W. Impact of reproductive efficiency over time and mare financial value on economic returns among Thoroughbred mares in central Kentucky. Equine Vet. J. 2009, 41, 889–894. [Google Scholar] [CrossRef] [PubMed]
  11. Gamrat, F.A.; Sauer, R.D. The utility of sport and returns to ownership: Evidence from the thoroughbred market. J. Sports Econ. 2000, 1, 219–235. [Google Scholar] [CrossRef]
  12. Consumer Price Index—All Urban Consumers, 2001–2018. 2019. Available online: http://data.bls.gov (accessed on 28 October 2019).
  13. Karungu, P.; Reed, M.; Tvedt, D. Macroeconomic Factors and the Thoroughbred Industry. J. Agric. Appl. Econ. 1993, 25, 165–173. [Google Scholar] [CrossRef] [Green Version]
Figure 1. Trends in inflation-adjusted average and median sales prices, 2001–2018.
Sustainability 12 00463 g001
Figure 2. Percent of profitable yearling transactions by year under low and high production cost assumptions.
Sustainability 12 00463 g002
Figure 3. 99th, 95th, and 75th percentiles for inflation-adjusted profit, 2001–2018.
Sustainability 12 00463 g003
Figure 4. 50th, 25th, and 5th percentiles for inflation-adjusted profit, 2001–2018.
Sustainability 12 00463 g004
Figure 5. Inflation-adjusted median profit for offspring of commercial sires.
Sustainability 12 00463 g005
Figure 6. Inflation-adjusted median profit for offspring of non-commercial sires.
Sustainability 12 00463 g006
Figure 7. Percent of Profitable Transactions for Commercial Sires, 2001 to 2018.
Sustainability 12 00463 g007
Figure 8. Percent of Profitable Transactions for Non-commercial Sires, 2001 to 2018.
Sustainability 12 00463 g008
Figure 9. Annual implied stud fee discount for 50% and 67% profitable transactions.
Sustainability 12 00463 g009
Figure 10. Annual implied stud fee discount for 50% profitable transactions for commercial sires.
Sustainability 12 00463 g010
Figure 11. Annual implied stud fee discount for 50% profitable transactions for commercial sires.
Sustainability 12 00463 g011
Table 1. Sample size.
Sale YearKeenelandFasig-TiptonTotal
20012666--2666
20022788--2788
200328999223821
200433027434045
2005344312634706
2006349411934687
2007377613095085
2008359114185009
2009310212934395
2010304013584398
2011290111854086
2012249913903889
2013272912083937
2014279813094107
2015272415424266
2016277514354210
2017253816044142
2018290016524552
Total 53,96520,82474,789
Table 2. Average profit, average inflation-adjusted profit (2018 dollars), and the percent of profitable sales, 2001 to 2018.
High Production CostsLow Production Costs
Sale YearNominal ProfitInflation-Adjusted Profit (2018 Dollars)% ProfitableNominal ProfitInflation-Adjusted Profit (2018 Dollars)% Profitable
2001$45,621.80$64,684.5536.4%$56,201.25$79,684.5544.1%
2002$21,189.90$29,576.3434.8%$31,936.61$44,576.3444.9%
2003$17,786.06$24,272.1735.0%$28,777.69$39,272.1644.1%
2004$25,650.47$34,096.5239.5%$36,934.82$49,096.5247.4%
2005$29,300.73$37,672.3739.1%$40,967.40$52,672.3747.1%
2006$28,301.17$35,250.1238.0%$40,344.19$50,250.1346.5%
2007$26,324.90$31,887.0439.6%$38,708.41$46,887.0348.1%
2008$9623.41$11,223.5933.9%$22,484.82$26,223.5941.9%
2009$(8965.57)$(10,495.35)24.0%$3848.06$4504.6529.5%
2010$(11,904.63)$(13,705.88)23.1%$1124.04$1294.1129.5%
2011$3323.97$3711.2029.3%$16,758.85$18,711.1936.6%
2012$12,627.91$13,810.4035.0%$26,343.56$28,810.4044.9%
2013$27,598.60$29,742.5342.2%$41,517.35$44,742.5252.6%
2014$25,144.80$26,674.5240.4%$39,284.58$41,674.5251.3%
2015$26,897.26$28,497.4840.4%$41,054.96$43,497.4748.8%
2016$23,330.58$24,409.6237.1%$37,667.50$39,409.6245.2%
2017$35,596.53$36,467.9341.2%$50,238.11$51,467.9349.2%
2018$36,732.77$36,732.7739.9%$51,732.77$51,732.7748.8%
Total$20,263.61 36.1%$33,219.45 44.4%
Table 3. Percentage of profitable sales by stud fee category.
Stud Fee Category% Profitablen% of Total
$100,000+57.6%51256.9%
$50,000–$99,99957.0%802110.7%
$25,000–$49,99951.7%20,90628.0%
$15,000–$24,99941.7%16,62322.2%
$10,000–$14,99938.2%12,65816.9%
$5000–$999928.1%10,31413.8%
Less than $500019.7%11421.5%
Total44.4%74,789100%

