Abstract
Seasonality is a major issue for sustainable tourism as it governs the optimal use of investment, infrastructure and human capital. Given the increasing numerical and financial significance of Chinese outbound tourism, the ex-Yugoslavia (ex-Yu) countries, partaking in the Belt and Road Initiative, are presented with a potential boost to their Tourism and Travel Industry (T&T) by attracting Chinese travelers during the low season. In an attempt to provide an answer to the RQ and justify grounds for future research and efforts towards developing content and services for Chinese travelers, to be undertaken mostly by Tourism Boards and DMOs in ex-Yugoslavia, this paper explores several aspects: The importance of the T&T in the 6 ex-Yu countries, with focus on the Economic indicators; within the Triple Bottom Line’s (TBL) theme of Seasonality, the existence of meaningful overlaps or mismatches between trends in inbound tourism across ex-Yugoslavia countries and trends in China’s outbound tourism; if meaningful mismatches exist, especially in ex-Yu low seasons, could Chinese tourists be an asset? Although the focus is on the Economic dimension of the TBL through its theme of Seasonality, the other two dimensions, Social and Environmental, are also considered; potential effects and interactions of the Viable, Equitable and Bearable sub-dimensions are also discussed. The final findings present a very significant mismatch, with extreme gaps in trends between the ex-Yu countries’ inbound tourism in low seasons and the corresponding Chinese outbound tourism, the latter presenting very strong shoulders, almost matching the values of high, or even peak, season. In a scenario projecting a range of 0.04–0.38% of Chinese outbound tourists visiting ex-Yu countries, benchmarked vs. January 2018 values, indicates the statistical significance of the potential boost to the low season, with important growth rates for all countries except Croatia and Slovenia for the 0.04% case.
Keywords:
low season; seasonality; tourism; China; Bosnia; Croatia; North Macedonia; Montenegro; Serbia; Slovenia; ex-Yugoslavia 1. Introduction of P.R. of China and ex-Yugoslavia Countries’ Relationships and Motivations for Exploring Potential Future Scenarios in Mutual Travel & Tourism Industry
1.1. P.R of China and ex-Yugoslavia Countries’ Collaboration through the BRI and CCEEC
In the last five years, P.R. of China and ex-Yugoslavia countries have developed stronger relationships, especially through the Belt and Road Initiative (BRI), inaugurated by the Chinese General Secretary, Xi Jinping. A key part of the Chinese transcontinental economic and geopolitical vision BRI aims at integrating P.R. of China (China) more deeply in the world economic system, and eventually positioning it as a global leader. All six ex-Yu countries are part of the China Central East Europe Collaboration platform (CCEEC) [1], established in Warsaw in 2012. This advanced sub-regional diplomatic initiative in Europe involves 12 Central and Eastern European EU member states and five Balkan states (each in the process of negotiating their accession to the EU) and currently operates by following guidelines set in Budapest in 2016 [2]. In late 2017, China and CEEC vowed to enhance cooperation in the Travel and Tourism Industry at the Third High-Level Conference on Tourism Cooperation, held in Sarajevo, the Capital of Bosnia and Herzegovina [3].
Therefore, the mentioned initiatives can be considered not only as a sign of goodwill but also as a potentially strong stimulus to future T&T Industry development between China and ex-Yu countries. Slovenia and Croatia, while being in the EU, still take part in the CCEEC activities. BiH and Serbia, having more political freedom outside the EU, have recently signed visa waiver programs with China, thus removing a significant barrier. Macedonia and Montenegro, although aspiring to join the EU, are also actively taking part in the CCEEC program.
For greater ease of understanding the geographic position of ex-Yugoslavia countries inside the CCEEC, the following map (Figure 1), designed by CRP-Infotec, illustrates and lists the countries that are participating in the CCEEC collaboration:
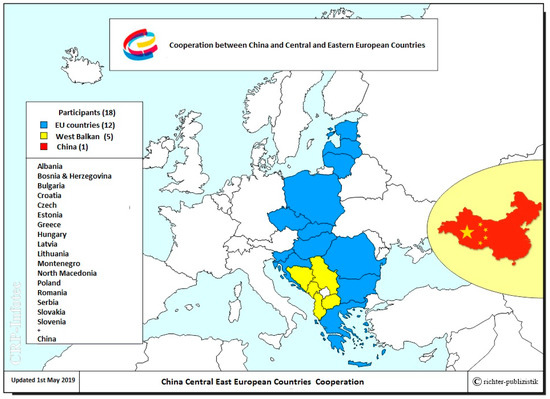
Figure 1.
Cooperation between China and Central and Eastern European Countries.
1.2. Significance of Chinese Outbound Travelers
To understand if there could be a meaningful and sustainable direction for future T&T Industry development in the ex-Yu countries, framed in the China-CEEC cooperation scenario and aimed at the Chinese tourists, an overview of current significance of Chinese outbound travelers is presented. Beside the sheer number of travelers, the economic aspects are also notable.
One of the most authoritative sources of data on tourism in China comes from the China Tourism Academy’s (CTA) research, spearheaded by Professor Dai Bin. In their “Annual Report of China Outbound Tourism Development”, they reported a steady growth of Chinese outbound tourists since 2009, passing 100 million person-times in 2014 [4,5], while 2017 registered 131 million person-times, an increase of 6.9% from 2016 [6]. In 2018, the number reached 149 million, an increase of 14.7% from 2017, based on the report by Yan Jinsong, the director of China Tourism Research Institute, released on January 8, 2019 [7]. This growth is visually represented below (Figure 2).
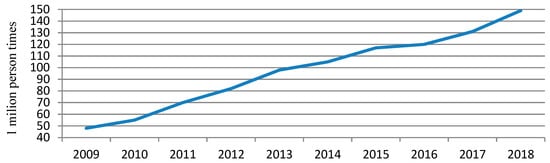
Figure 2.
Number of Chinese outbound tourists (2009–2018).
Regarding the choice of destinations, economic and motivational aspects of Chinese outbound tourism, the CTA’s “2016 Chinese Tourists’ Vacation Willingness Report” [5] stated that both the demand for travel and the travel budget of Chinese residents would continue to grow, especially in the areas of outbound travel, leisure travel, high-end travel, and tours for the elderly, while “shopping“ ranked as the highest motivational driver: Up to 85.9% of total respondents chose it as the main reason for travelling abroad, while 46.6% indicated “attraction of scenic area of tourism destination” as the main driving factor in the choice of a destination.
As the choice of destinations across 2014–2018, short-haul ones dominated, especially within Asia, growing from 65.4% to 89.03%; Europe experienced strong negative growth, falling from 11.7% to 3.83%, together with America, which plummeted to 2.44% from 9.0% [4,7]. In terms of expenditure, outbound tourists with monthly personal income of RMB 3001–8000 accounted for the highest proportion in 2015, 58.4% of the total with a strong concentration [5], while in 2018, the most numerous segment shifted to RMB 5001–8000, around 32% with RMB 3001–5000 at 20% [6]. The overseas consumption of outbound Chinese tourists amounted to USD 104.5 billion in 2015 [5] and reached the USD 130 billion, with a growth rate of over 13%, in 2018 [7]. Considering the GDP per capita and disposable income, the last decade registered a steady growth of both; the findings in the Survey of Chinese Outbound Tourist Travel Willingness (CTA 2015) indicate how the growing GDP and the per capita disposable income are directly related to the growth of travel demand. These indicators were also reported in the successive CTA reports, up till 2018 [7]. A visual representation of these growing trends combined, extrapolated from several CTA reports, can be observed in the following graph (Figure 3):
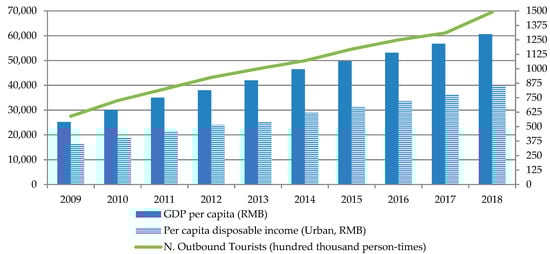
Figure 3.
China: GDP, per capita disposable income and number of outbound tourist growth trends.
Therefore, in this introductory note, it is clear how Chinese outbound travelers indeed present potentials for any destination, not only ex-Yugoslavia and partially justify the direction of the research herein. At this point the main research questions can be proposed.
1.3. Research Question and Initial Assumptions and Considerations
RQ:Considering the travel period trends of the Chinese outbound tourists and the inbound tourism trends in ex-Yugoslavia, is there any significant overlap/mismatch and could the Chinese tourists be a meaningful asset for the low seasons in ex-Yu countries, and can this asset be implemented in a sustainable way?
As the initial hypothesis, taking Triple Bottom Line as general framework, this research assumes that attracting the Chinese tourists during the low season could have a strong element of sustainability as no significant additional resources or burden on the environment would be required, since tourists would benefit of the already existing services and vacant hospitality structures. The Social dimension would potentially benefit from stabilizing employment or, at least, would not be negatively affected; consequently, the Bearable sub-dimension would not be impacted in worst case scenario, while it would have some light improvement in the best case one, as a consequence of positive results in both the Social and Environmental dimensions. The Economic dimension would be the main driver, also leading interactions in the Viable and Equitable sub-dimensions. These assumptions will be reviewed time after time as findings emerge.
2. Literature Review and Framework
In order to present the framework of the research, three underlying concepts must be brought to focus: Sustainable Tourism, Triple Bottom Line, and Seasonality. While all three are well documented in the existing literature, with obvious links between them, some of the most relevant papers will be given space here in order to form a well-defined ground for data collection and to frame the direction of the subsequent analysis.
2.1. Sustainable Tourism Definition and Intended Use
In 1985, the Report of the “World Commission on Environment and Development: Our Common Future” [8] had put forward several concluding remarks on sustainable development, of which the opening one states that, “In its broadest sense, the strategy for sustainable development aims to promote harmony among human beings and between humanity and nature”. From there, a definition of Sustainable Tourism [9] is proposed on UNWTO webpage as follows: “Tourism that takes full account of its current and future economic, social and environmental impacts, addressing the needs of visitors, the industry, the environment and host communities.” In their article, Torres-Delgado and Lopez Palomeque [10] narrate the developmental timeline of the notion of Sustainable Tourism and state how “… the understanding of sustainable tourism has progressed from the early conservationist or environmental conceptions to more holistic approaches which see it as a tool for economic development, population welfare and environmental conservation”.
A detailed analysis of the concept of sustainable tourism development is presented in Stoddard, Pollard and Evans [11]. The authors initially position themselves with the definition of Isaksson and Garvare [12] who “… identified sustainable tourism and development as that which finds a balance between economic prosperity, environmental protection and social equity.” Then they advance their own definition of sustainable tourism as “… a level of tourism activity that can be maintained over the long term because it results in a net benefit for the social, economic, natural and cultural environments of the area in which it takes place”. This definition will be understood and intended under the term “Sustainable Tourism” for the purposes of the research herein.
2.2. Triple Bottom Line Definition and Intended Use
The definition of Sustainable Tourism adopted here is closely related to the concept of Triple Bottom Line (TBL), introduced by Elkington in 1994 [13]. TBL is linked to sustainable development, thoroughly discussed and proposed as a framework for sustainable tourism in Stoddard et al. [11]. The authors also present an overview of the three dimensions of TBL, summarized here:
- -
- Economic dimension, easiest to capture, measure, evaluate and manage. Sales revenue, profit, ROI, overnight stays, visitors per attraction and similar quantitative elements;
- -
- Social dimension, or social capital (trust, norms and networks needed to facilitate cooperation [14], has two components: Human capital (employees, contractors, advisers and suppliers) and investment by the social systems that support the business [15,16];
- -
- Environmental dimension, or natural capital: Clean water and air, forests, minerals, fish, wildlife and soil, all forming the basis for human existence, often taken for granted [17].
Stoddard et al. [11] continue discussing the application of TBL to Sustainable Tourism and put forward Economic, Social and Environmental indicators that would provide some degree of measure of each dimension, although admitting that attempts to quantify social and environmental impacts are presented with great challenges. These three indicators are briefly overviewed here:
- -
- Economic indicators which are mostly comprised of hotel occupancy rates, number of nonresident visitors, per capita tourist expenditures and lodging revenues, number of tourism employees and labor income from tourism, employment issues, destination economic benefits, seasonality and poverty alleviation;
- -
- Social indicators are linked with concept of social capital (improving trust, encouraging cooperation, recognizing and enhancing individual and organizational networks, fostering life-long learning) and social impacts of tourism on communities (state of the local economy, maturity of the tourism destination) as well as level of community attachment, pride and sense of belonging to the local area, support for cultural and artistic endeavors, regional showcase and community health and safety issues;
- -
- Environmental indicators are varied, from measures focused on energy use, water use, greenhouse gas emissions and ecological footprint to management of natural resources (waste, water, energy, etc.), climate change, visual impact of tourism and measuring the impact of tourism on the natural environment.
Furthermore, Stoddard et al. argue that the Economic indicators are the most straightforward and easiest to measure and, consequently, to manage; the Social indicators appear to be more vague and difficult to assess, with no method of measuring Social capital currently being widely accepted; the Environmental ones are observed to vary greatly according to different researchers, presenting a management challenge due to the lack of consensus as what is supposed to be measured. In their concluding remarks, the authors invite to exercise caution in adopting TBL thinking, as “… critics suggest that TBL is essentially a vague concept with many buzzwords that is really hard to measure and be very precise“; they also refer to Porter and Kramer [18] who agree that, if done consistently and accurately, measuring and publicizing TBL is a potentially powerful way to influence policy and behaviors but that neither of these conditions are true in practice.
As their final remark, Stoddard et al. indicate measurements as the key issue of TBL, with global measures from a tourism organization’s perspective being somewhat limited: Various types of tourism organizations may require ad hoc measurements and the measures that will be used to assess impacts will certainly vary, given the highly heterogeneous nature of the tourism sector.
Additionally, each dimension of TBL interacts with the other two, resulting in 3 sub-dimensions: Equitable, Bearable and Viable [19]. Equitable is comprised of positive interactions between Society and Economy (e.g., eradicating poverty, social inequality and raising life standards by having equitable distribution, and by allowing for an equal and fair sharing of a location’s resources to local people). Bearable is comprised of positive interactions between Society and Environment (e.g., society being aware of impact on environment, thus actively improving lifestyle and contributing towards a healthy environment and general well-being). Viable is comprised of positive interactions between Environment and Economy (economic growth, development and operations are pursued bearing environmental issues in mind. Investments must be feasible and self-sustainable, create jobs and contribute to the GDP while protecting the environment).
The union of the three TBL dimensions: Society, Environment and Economy (i.e., of their sub-dimensions: Equitable, Bearable and Viable), results in Sustainable Development. For a more immediate understanding of TBL and how, conceptually, the Economy, Society and Environment dimensions compose it and interact with each other through their sub-dimensions, a visual representation is given in the following figure (Figure 4).
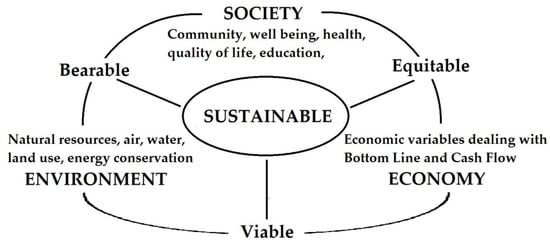
Figure 4.
Triple Bottom Line: Sustainable as the union of Bearable, Equitable and Viable.
2.3. Seasonality Definition and Intended Use
The UNWTO publication on Indicators of Sustainable Development for Tourism [20], also mentioned in Stoddard et al., contains a more detailed analysis of the three indicators (Social, Environmental and Economic), summarized as lists in the Appendix A. In their “Review of Economic Indicators of Tourism Impact” table, the authors include Seasonality as one of the Themes (along with Employment, Destination Economic Benefits and Poverty Alleviation), with the UNWTO acknowledging all four of the proposed indicators of Seasonality: Degree of seasonality; strengthening shoulder seasons and low seasons; provision of sufficient infrastructure year-round; short-term and seasonal employment.
To further elaborate on Seasonality’s impact on the Travel & Tourism Industry in general and its relevance to the proposed research, salient points of several highly referenced and pertinent papers on Seasonability are briefly presented here.
Seasonality in Tourism [21] by Bar-On, in 1976, is considered to be a seminal work on this topic. Bar-On stated that Seasonality is shaped by two basic groups of factors: Natural and Institutional. This dichotomy is reiterated and touched upon by numerous other authors e.g., Allcock, Butler, Hartmann, Baum and Hagen, Higham and Hitnch, Hadwen et al. [22,23,24,25,26,27], More recent authors Duro and Turrion-Prats [28] also give credit to Butler’s explanation [29], following on Bar-On and Hartmann, how Natural seasonality regards regular variations in natural phenomena, particularly those brought by cyclical climatic changes throughout the year e.g., temperature, precipitation, wind, daylight and animal migrations, while Institutional seasonality regards largely societal practices and factors, such as the timing of major official public holiday periods as well as religious and/or cultural holidays.
As salient elements of Seasonality, Allcock [22] points at the concentration of tourist flows in relatively short periods of the year, while Butler [23] warns of an imbalance in numbers of visitors, their expenditure and impact on transportation (traffic), on local employment and admissions to attractions. Economic and social aspects are considered by Jefferson and McEnif [30,31] as particularly stressed during off-peak times in terms of lost revenue, enforced termination of employment and underutilization of capacity.
Although defined as an Economic Indicator, Seasonality in tourism goes beyond the financial sustainability of businesses, spilling over to both environmental and social sustainability of destinations. According to Cooper and Hall, and Getz and Nilsson [32,33], brief but strong high seasons might be an indicator of over-capacity and also of under-utilization during low season, while Krakover, Ashworth and Thomas [34,35] point out it affects hiring and retention, undermining employment stability. The overall economic benefits of tourism to destinations, especially in peak season, are considered, by some, to be suffering from issues related to seasonal employment taken up by seasonal workers [36], issues of waste and sewage [37], over-crowding [33,38], congestion and slower traffic, limited parking spaces, longer wait times, and higher prices for services [39]. In low season, numerous facilities and services may close [22], which can impact negatively the reputation and image of the destination [40].
As this research focuses on the “low season” segment of Seasonality, the issues typically emblematic for the high season/peak season will not be discussed at greater length than what has already been presented. The assumption made herein is that these issues would be “non-issues” during the low season in the ex-Yugoslavia countries, especially given the huge gap in number of tourists between high and low season. This part will be expanded later on, after the relevant data regarding tourist seasonality in ex Yu countries has been presented.
In conclusion, for the purpose of this paper, Seasonality is intended mainly as an Economic Indicator, under the Economy dimension of the Triple Bottom Line framework for sustainable development in tourism (i.e., Sustainable Tourism), yet potentially having overflowing effects on the Environment and Society dimensions as well.
3. Research Method and Data Selection
The research method is based on systematic review of archival primary sources and secondary sources in order to find, collect, reorganize and analyze the data pertinent to the research question. In general, the quantitative data were obtained from archival censuses and analysis conducted by government Statistical Agencies, Ministries of Tourism, World Tourism Organization (UNWTO), World Travel and Tourism Council or Tourism research institutes. For each country, the primary sources containing quantitative data research and statistical analysis conducted by local governments have been preferred as most reliable sources. For Bosnia and Herzegovina, the BiH Agency for Statistics [41] was consulted as the primary source; for Croatia, the primary sources were the Ministry of Tourism of Republic of Croatia and Croatian Bureau of Statistics [42,43]; for Montenegro, the Statistical Office of Montenegro and the Government of Montenegro [44,45] were primary sources; for North Macedonia, the primary sources was the State Statistical Office [46]; for the Republic of Slovenia, the Statistical Office [47] was the primary source; for Serbia, the primary source was the Statistical Office of the Republic of Serbia [48]; for P.R of China, the primary source were publications and reports from China Tourism Academy (National Tourism Data Center) [49], a specialized institute directly under China National Tourism Administration (CNTA) and dedicated to tourism research, data analysis, and tourism promotion; in case of lacking or incomplete data from previously listed primary sources, UN Statistics Division, WTTC data gateway, the World Bank databank and China Tourism Research Institute publications were consulted [50,51,52,53].
The aim of this method was to obtain sufficient data to provide statistically valid and conclusive answers to the proposed research question. The periods considered are January 2014–December 2018 and January 2016–December 2018, included, based on the relevance and availability of yearly and monthly data. The majority of hard data, analysis and observations presented here are based on above mentioned primary sources, with the exception of min-max normalized values for seasonal trends in China and ex-Yu countries.
Pertaining to the Economic dimension, several Economic Indicators (Appendix A) are expected to be affected and the quantitative data on Travel and Tourism (T&T) Industry, GDP and employment would provide the basis for the analysis herein. The “Seasonality” theme is at the focus of this research and most data presented and analyzed relate to its indicators, except “provision of sufficient infrastructure year-round”, for which no related data was presented. The “Employment” theme, while not in focus of this research, is strongly connected to “Seasonality” since employment indicators are present in both. Nevertheless, while providing data on “numbers in employment”, the data on several of its indicators, namely regarding the “quality of employment”, “professional and personal development”, “contentment from work” and “lack of skilled labor” is not presented. As far as the “Destination economic benefits” theme is concerned, most relevant data to its indicators is related to the T&T impact on the GDP and the potential spending power of the Chinese visitors, as both could be used to infer impacts in “tourism revenue”, “net economic benefits”, “business investment in tourism”, while the boost in number of visitors would most certainly be connected to “hotel occupancy rates”; remaining indicators are deemed too distant from the ones under “Seasonality”. It is worth reiterating that the Economic dimension would certainly be the main driver of any significant impact on the ex-Yu destinations in low season. It is also the dimension that presents most numerous and concrete quantitative data related to its indicators and will be in the main focus of this research. As stated earlier, a solid move towards Sustainable Development would be to make sure the Economic dimension is shaped towards the Viable and Equitable sub-dimensions, while paying attention to curb negative issues that might arise, as discussed in the reviewed literature in Section 2.3 herein.
Pertaining to the Social dimension, it is very difficult to predict what would actually be the impact, according to the Social Indicators (Appendix A), in a hypothetical scenario that this research proposes. The “Background” theme contains “tourism development” and “visitors to the area” indicators that seem might be affected by an increased number of visitors in the low season, along with increased influx of capital they would bring; “resident population” is not considered here. As for the “Social Environment” theme, only few indicators seem to be related to indicators that are present in the “Seasonality” theme and to the data presented here: “increased awareness of destination” could be related to the increase of visitors in general, not only in low season, especially for from distant places and different cultures; “business success” and “tourism development” certainly seem related to economic factors; “crowding” is generally an issue in high seasons, and is not expected to be an issue in low seasons; “cultural development: events” depend on the could be correlated in terms of developing specific cultural attractions that target the Chinese traveler, along with “maintenance of cultural heritage through enhancement of attractions”; however, there is no concrete data on these indicators; other indicators are deemed too distant from “Seasonality”. If any impact to indicators, for which no data is available, were to be assumed, only potential scenarios based on already existing cases that present valid parallels, will be constructed.
Pertaining to the Environmental dimension, it is also very challenging to assume the impact on Environmental indicators (Appendix A) in a hypothetical situation of this research, as they are far from the “Seasonality” theme; it is possible that the “financing for biodiversity conservation and maintenance of protected areas” indicator, under the “Tourism as a Contributor to Nature Conservation” theme could benefit from increased influx of capital, if proper channeling of funds is in place; “provision of opportunities for participation by tourists in conservation” could be related to the increase of visitors in low season if adequate tourism products were to be offered. The “Limiting Environmental Impacts of Tourism Activity” theme presents indicators that are quite relevant in high season situations, as per literature review in Section 2.3 (i.e., regarding sewage, solid waste, water and air pollutions and noise levels); however, while they are related to increase of visitors, they are not presented in this research, as the focus is on low season.
In summary, the impact would be direct and obvious in the Economic dimension, throughout the majority of its indicators, while the Social and Environment dimensions would be affected through some of the indicators that are directly related to the increase in number of visitors, influx of capital and, potentially, designing specific cultural or environmentally friendly tourist offers. It is understood that the affected indicators in all 3 dimensions must be framed within the Equitable, Bearable and Viable solutions, in order to attain a degree of sustainability of the boost in the low season’s number of inbound tourists.
Regarding Seasonality, the research on inbound foreign tourists in ex-Yugoslavia countries starts with hard data from censuses, firstly analyzed on a yearly level, in order to understand differences in absolute values; subsequently, the data is normalized in order to provide a clearer picture on pattern changes in time, relative to parameters of identical range for all 6 countries. The same approach is adopted for the data regarding Chinese outbound tourist.
Finally, considering the number of inbound foreign tourists in ex-Yugoslavia countries each month and the number of outbound Chinese tourists each month, over a period of several years, in the case significant mismatches in overlap were to be found, it might be considered as a meaningful finding, and a basis for providing a significant answer to the research question. Additionally, a hypothetical scenario will be constructed, based on a potential increase of the number Chinese visitors during the low season, projected within an inferred value range. The results will be analyzed and used to indicate the statistical importance of the impact of such a boost to the ex- Yu countries low season.
4. Statistical Data on Inbound Tourism in Ex-Yugoslavia and Outbound Tourism in China
Presently, the six countries that once comprised Yugoslavia are, in alphabetical order: Bosnia and Herzegovina (BiH), Croatia, Montenegro, North Macedonia (N. Macedonia), Serbia and Slovenia. The statistical data available on ex-Yu countries is often scarce, imprecise or is presented as projections based on trends older than a decade or two. As far as data in Travel and Tourism Industry is concerned, most ex-Yu countries do provide detailed and methodical reports, while few offer more generic estimates. Nevertheless, the data collected from primary sources appears sufficiently reliable and consistent, therefore it has been deemed as acceptable.
Travel and Tourism in P.R. of China is rapidly growing and is carefully monitored and regulated by the government; statistical data on all relevant aspects is regularly published. Therefore, primary data on Chinese outbound travelers, ranging from total or monthly volumes of travelers, their spending to preferences in destinations or activities, points of origin, age and gender, is readily available in yearly reports. As mentioned, China Tourism Academy [49] is accepted as the primary source of the data presented herein.
In terms of Tourism data, mostly relative to the Economic dimension of TBL, several aspects concerning ex-Yu countries are presented here: annual inbound tourist headcount; monthly and yearly variations, tourist impact on GDP and employment. This data is considered relevant as it will be observed in line with the Chinese outbound tourist data, in order to present a clearer perspective on the potential impact of Chinese tourists in the ex-Yu region.
4.1. Inbound Foreign Tourists in ex-Yu Countries, Annual Data for 2014–2018
The data concerning “Inbound Tourism by Country of Destination” has been obtained from World Tourism Organization (UNWTO) 2018 edition of European Union Short-term Tourism Trends [1], the UNTWO 2018 Tourism Highlights [54], and relevant government Statistical Agencies and Ministries of Tourism [55,56,57,58,59,60,61] from each of the six ex-Yugoslavia countries, presented in alphabetical order (Table 1), as follows.

Table 1.
Inbound tourism by countries of destination—International Tourist Arrivals. Inbound Tourism of ex-Yu countries 2014–2018, in thousands (1000), with yearly growth in %.
We can observe that Croatia’s number of inbound tourists greatly overshadows that of the other countries’; its 2017 total is actually equal to almost twice the sum of other five countries’ totals (Croatia total: 15,593,000; other 5 countries sum of totals: 8,513,000). All six ex-Yu countries have registered a constant increase of inbound tourists, i.e., a positive growth, across the 2014–2018 period, which can be interpreted as a signal of a growing interest in inbound tourists’ willingness to travel to these countries.
It is immediately observable that Croatia has a dominant role when it comes to the mere number of inbound tourists, together with the highest relative increase. Further comparisons in terms of yearly growth in inbound tourists also can be made. All countries register positive growth across all four years, with few occasional slowdowns, but still registering above 10% in 2018, except Croatia, which registered 6.8% However, in order to understand more clearly the meaning of Croatia’s 6.8% growth, when benchmarked against other ex-Yu countries’ growth, we cannot simply consider these absolute values. In other words, if we take Croatia’s 2017–2018 increase in foreign tourist arrivals of roughly 1,052,000 (6.8% compared to the previous year) as the relative benchmark, this number of tourists would be equivalent to Slovenia’s 23.8%, BIH’s 100%, North Macedonia’s 148.8%, Montenegro’s 50.4%, and Serbia’s 61.5% of their total foreign tourists for the same 2017–2018 period. Thus, Croatia’s 6.8% growth still overtakes, by far, growths of other ex-Yu countries. A more intuitive comparison is given by the visual representation of annual totals of inbound tourists to ex-Yu countries, during the 2014–2018 period, in the following graph (Figure 5), with countries arranged in descending order of annual total value.
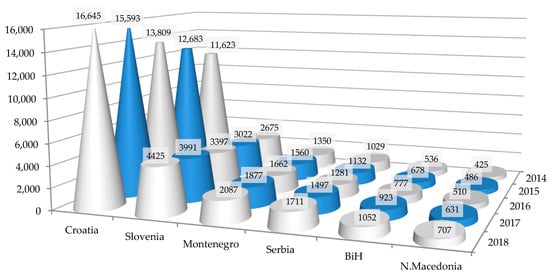
Figure 5.
Inbound International Tourist Arrivals, full year, in thousands (1000).
These initial findings are put to use when trying to determine the importance and impact of the Tourism and Travel Industry in ex-Yugoslavia countries, especially in the domain of the Economic dimension, where contribution to GDP and employment are relevant Economic indicators.
4.2. Economic Dimension: Tourism and Travel Industry in ex-Yugoslavia in Terms of GDP and Employment
As far as the Economic indicators are considered, the data on Tourism and Travel Industry impact on GDP and employment has been collected and analyzed. As presented and defined in country reports by World Travel & Tourism Council, methodologically based on the “UN Tourism Satellite Account: Recommended Methodological Framework 2008” [62], the economic impact of T&T is comprised of commodities, indirect impact, induced impact and employment. A brief overview of these four components follows:
Commodities count as accommodation, transportation, entertainment and attractions; actors in accommodation services, food and beverage services, retail trade, transportation services, cultural, sport and recreational services; sources of spending such as residents’ domestic T&T spending, businesses’ domestic travel spending, visitors exports, individual government T&T spending.
Indirect impact: T&T investment spending, government collective T&T spending; impact of purchases from suppliers.
Induced impact or spending of direct and indirect employees considers food and beverages, recreation, clothing, housing and household goods.
Employment includes employment by hotels, travel agents, airlines and other passenger transportation services (excluding commuter services). It also includes the activities of the restaurants and leisure industries directly supported by tourists.
The following data (Table 2), expressed in millions of EUR, regards six ex-Yu countries’ nominal GDP and the total contribution of T&T to GDP, across the 2016–2018 period, with T&T growth expressed in %. The nominal GDP data has been extracted from the reports of each country’s government statistical agency, considered as primary sources for BiH [63], Croatia [64,65], Montenegro [66], N. Macedonia [67], Serbia [68,69], and Slovenia [70,71]. The data regarding the total contribution of Travel and Tourism Industry to GDP has been obtained from World Travel and Tourism Council (WTTC) data gateway database for BiH [72], Ministry of Tourism of Croatia [73,74], WTTC data gateway database for Montenegro [75], N. Macedonia [76], Serbia [77] and Slovenia [78].
Table 2.
Ex-Yu countries’ nominal GDP, total contribution of Travel and Tourism to GDP and yearly growth in EUR million (1,000,000).
It can be observed that Croatia ranks first both in terms of GDP and T&T contribution to GDP. In comparison to second ranked Slovenia, although their GDP’s present a relatively small gap of 13.47% average, the T&T total contribution to Croatia’s GDP is roughly two times that of Slovenia’s. In the case of Croatia and the lowest ranking Montenegro, Croatia’s T&T contribution to GDP alone is higher than twice the nominal GDP of Montenegro. While all six countries do present a constant positive growth, the ratio between total T&T contribution to GDP and nominal GDP should be examined in order to understand more precisely how relevant the Travel and Tourism Industry through its impact on GDP is, this contribution is presented in the following graph (Figure 6).
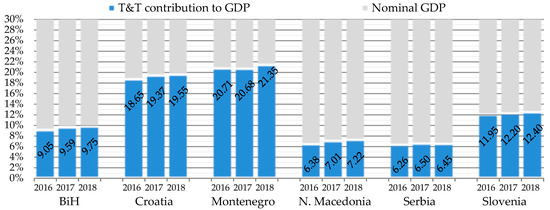
Figure 6.
Travel and Tourism Industry impact on Nominal GDP, in %, range 0–30%.
In case of Montenegro and Croatia, the contribution appears to be very high, around 20%, translating into a strong dependence on the Tourism Industry. In case of Serbia and N. Macedonia, the role is more contained, averaging around 6.5%. Bosnia’s and Slovenia’s T&T contribution is somewhat a middle ground between the other countries, spanning between 9.5% and 12%. The global average contribution of Tourism (direct, indirect and induced) to world GDP is 10.4%, according to the WTTC 2018 report [79]. If taken as a benchmark for the ex-Yu countries, the answer to the first part of the research question is that, yes, in terms of contribution to GDP, the Travel and Tourism Industry is somewhat relevant for N. Macedonia and Serbia, with room for growth; BIH and Slovenia follow the global average; Croatia and Montenegro result is heavily reliant on their T&T Industry, with values that double the global average.
In terms of Travel and Tourism growth rate, given that the world average is orbiting around 3.9% [51], it would appear that T&T is experiencing significant growth in all ex-Yu countries across 2016–2018 period, with Montenegro and N. Macedonia registering highest annual growth rates.
Regarding the T&T impact on employment, the following table (Table 3) shows areas and populations of ex-Yu countries, according to the most recent censuses (with December 31st as the relevant reference point in time), along with the total and percentual contribution of Travel and Tourism Industry to total workforce. Data on geographical areas and total population have been retrieved from the Statistical Agencies of each country [80,81,82,83,84,85]; the population data has been integrated with data from the World Bank databases on population prospects [86,87,88,89,90,91] in cases where data was not available through the Statistical Agencies; data on employment contribution of T&T has been retrieved from World Travel and Tourism Council country reports [92,93,94,95,96,97].
Table 3.
Ex-Yu countries area, population, total and percentual employment in Travel and Tourism.
Several observations can be made on data presented in the above Table 3. Looking at rows, one by one, the most immediate observation is that all the countries experienced positive growth both in terms of total number of employees in the Travel and Tourism Industry, and in the percentage these employees represent of total workforce; the other immediate observation is that all the countries, except Slovenia, have suffered a slight decline in total population.
Furthermore, starting from the country with the largest area and population, Serbia, the number of employees in T&T is at second place, while the percentage of employees in the T&T relative to the total workforce is the lowest one, at 5.22% average. Slovenia’s area is 4 times smaller and population is 3 times smaller than those of Serbia, yet their total n. of employees in T&T are equivalent, given that Slovenia has 1 out of 10 employees working in T&T, while Serbia has 1 out of 20, on average. Croatia, although suffering a slight decline in total population, still holds the first place in the terms of n. of employees in T&T, both relative to its own population and to the n. of employees in T&T of other 5 countries; in terms of T&T percentage of total workforce, Croatia still leads with 23.25% on average. Croatia’s total n. of employees in T&T actually is equivalent to 3 times the total of Serbia and Slovenia, respectfully, and to half of total population of Montenegro. Montenegro, although being the smallest in terms of area and population, relies heavily on T&T, with a n. of employees that closely follows the 3 times more populous N. Macedonia’s; also, in terms of percentage of workforce in T&T Industry, Montenegro comes second, after Croatia, at 16.95%, indicating a significant reliance. Bosnia and Herzegovina positions itself in the middle, both with the total n. of employees and the percentage at average value of 11.44%; it is worth noting that, although BIH has the area size of 90% and a population roughly 85% of Croatia’s, BIH’s total number of employees is almost 4 times smaller and the percentage of workforce in T&T is half of Croatia’s. Also, the total n. of employees in Croatia’s T&T in 2018 is equivalent to the 82% of the sum of the totals of the other 5 ex-Yu countries.
These numbers acquire even more importance if unemployment rates are considered. According to the estimates from the UN Statistic Division [51] and the World Bank [53], under Economic Indicators, the unemployment rates of labor force, in 2018, were: 26% i.e., 20.84% in BiH, 9.2% i.e., 8.85% in Croatia, 16.4% i.e., 15.46% in Montenegro, 22.8% i.e., 21.55% in N. Macedonia, 13.1% i.e., 13.51% in Serbia and 6.7% i.e., 5.51% in Slovenia. Considering the average unemployment rate orbits around 4.95%, globally [53], and between 3 and 5 percent in leading developed EU countries, e.g., Germany and Austria [51,53], it is obvious that, except Slovenia, the ex- Yu countries are far from an optimal situation in terms of employment opportunities.
Thus, considering the Economic dimension through Economic indicators of GDP and employment, as presented above, the contribution of Travel and Tourism Industry appears to be overall significant. As far as Croatia and Montenegro are concerned, the contribution is very significant, with Croatia being the most reliant on T&T; BiH and Slovenia appear to be following the global averages, with T&T playing an important role in GDP, yet both countries do not appear to be heavily reliant on this industry; Serbia and N. Macedonia do not appear to have significant reliance on T&T industry in terms of impact on GDP and employment, with lower values that potentially present the most space for growth or improvement. The unemployment rates, except for Slovenia, indicate there is major room for improvement, thus boosting the T&T in the low season might be presented as one of the options for reducing unemployment.
4.3. Ex-Yugoslavia Inbound Tourism Economic Indicator: Seasonality
To understand the current state of Seasonality in ex-Yu countries, the quantitative data regarding foreign tourist overnight overstays has been collected and analyzed herein. Specifically, monthly data regarding foreign tourists overnight stays across the 2016–2018 period has been gathered from Ministry of Tourism database of Croatia [73,74,98] and Statistical Agencies’ databases of Bosnia and Herzegovina [99,100,101], Montenegro [102,103,104], North Macedonia [105], Serbia [106] and Slovenia [107]. Given the high volumes of gathered data, the following table (Table 4) reports only the extracts regarding the total monthly overnight stays of foreign tourists in 2018, while the complete data gathered for the 2016–2018 period is presented in the Appendix B.
Table 4.
2018 Foreign tourists overnight stays, total, in hundreds of thousands (100,000).
For simplicity and immediate understanding of the values and their cyclic trend, the data is presented visually in the following graph (Figure 7), displaying every country’s total number of foreign tourist overnight stay for every month, across 2016–2018, 36 months in total.
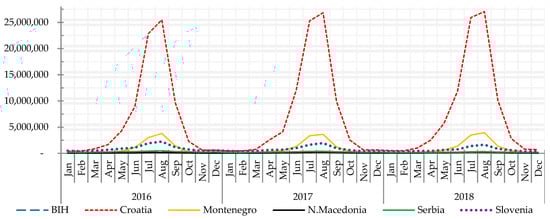
Figure 7.
Ex-Yu countries: Total foreign tourist overnight stay, monthly, 2016–2018 period.
It is immediately observable that Croatia largely overshadows the other five countries in terms of total foreign tourist overnight stays in what could be defined as high season, roughly starting mid-May and ending mid-September, peaking at 25–27 thousands in July–August. Montenegro and Slovenia do appear to have more significant growth in terms of high season, orbiting around 2.5 thousands, although it seems to start later than Croatia’s, around end of June, and seems to end with August. Croatia’s low season does have a plummeting fall, towards numbers shared across other ex-Yu countries, which barely seems to register any change during their respective low seasons.
While Figure 7 gives an immediate general idea of the volume and seasonality of foreign visitors to the ex-Yu countries, the scale (i.e., the plot area) is heavily conditioned by Croatia’s extremely high values. Therefore, in order to get a more representative image of the temporal variation of the number of foreign tourist overnight stays, the data has been min-max normalized to restrict the range of values in the dataset between −0.5 and 0.5. Defining the value of 0 as the average value, positive values (0 < X < 0.5) are considered as high season, with 0.5 being the peak, and negative values (−0.5 < X < 0) are considered as low season. Thus, modified normalizing function is presented as follows:
While the high and low seasons are obvious in the Figure 7, the normalized values allow for a much clearer appreciation of the cyclical seasonal trends and enable pinpointing the start and the end of both high and low seasons. Normalized values for 2018, rounded to 2nd decimal, are shown below (Table 5); the values for the entire 2016–2018 period is reported in Appendix C. As mentioned, negative values are designed as low season and are marked in red.
Table 5.
Ex-Yu foreign tourist overnight stays, totals, 2018, min-max normalized.
At a first glance, it would appear that all of six countries experience a similar trend, with high values concentrated in the summer, or the July–August period, generating a sharp peak, and then diffuse towards low values across spring and autumn, touching lowest points in winter. The normalized data regarding monthly foreign tourist overnight stays in the 2016–2018 period, reported in appendix C (Table A5), is visually presented in the graph bellow (Figure 8).
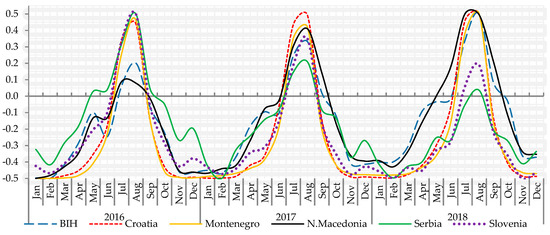
Figure 8.
Ex-Yu countries foreign tourist overnight stays, total, 2016–2018, min-max normalized.
Since the data in Figure 8 covers a three-year period, max(x) and min(x) are present just once for the entire period of each country, instead of once for each country for each year, thus facilitating visual comparison of positive/negative growth in total number of foreign visitor overnight stays across the entire period. For example, it is observable how N. Macedonia has a very distinct growth across the three-year period, reaching its max(x) value in 2018, while Serbia has suffered the opposite, with its max(x) value in 2016 and then experiencing a negative growth.
As the data for each ex-Yu country in the three-year period has been normalized with same parameters and visually presented, the first impressions are sufficiently significant to call for a more careful analysis of each country’s trend. This would allow for more detailed observations on seasonality, i.e., on seasonal trends in terms both of monthly distribution of the number of foreign visitor overnight stays and on their positive/negative growth, pertinent to the research question.
4.3.1. Bosnia and Herzegovina Seasonal Variations of Foreign Visitor Overnight Stays
Observing the values in BiH (———) across 2016–2018, there seems to be a substantial shoulder in spring (April–May), with slight fall in June and then the values rocket between June and July, peaking in August and then falling abruptly to November. A tiny shoulder around New Year, in December, is registered. Considering the values, the high season in 2016 clearly appeared to be June-August, with expanding to June–September in 2018, with the overall increase in the total number of foreign visitor overnight stays. The values are presented more in detail in the following table (Table 6), showing the percentage growth in same months across 3 years, obtained by elaborating extracts from the Bosnia and Herzegovina Statistical Agency database [47,48,49].
Table 6.
BIH, foreign visitor overnight stay growth by same month comparison, 2016-2018
From the graph (Figure 8) and the above data (Table 6) it is clear that Bosnia and Herzegovina has experienced a positive growth trend across all months in the 2016–2018 period, with the most significant increase between 2017–2018s’ February and August, while the smallest increases were registered in 2016–2017s’ May and 2017–2018s’ September. Thus, although the summer period represents the high season in BIH, it is still experiencing an overall positive growth across all months.
4.3.2. Croatia Seasonal Variations of Foreign Visitor Overnight Stays
In the case of Croatia (- - - - -), across 2016–2018, the trends are fairly clean and repetitive, with low season holding until April-May, then rocketing up to maximum peak in August and falling down through September, reaching its lowest values in October and, again, not showing signs of rising until March-April. Values indicate the high season clearly starting at June and ending in September, with overall increase in the total number of foreign visitor overnight stays in those periods. Calculations showing the percentage growth in same months across 3 years are in the following table (Table 7), obtained by elaborating extracts from the Ministry of Tourism database of Croatia [21,22,46].
Table 7.
Croatia, foreign visitor overnight stay growth by same month comparison, 2016–2018.
Combining the graph (Figure 8) and the above data (Table 7), Croatia’s trend presents an overall positive growth, with a few instances of negative growth between 2016 and 2017 (−11.8% in March and −3.6% in May), and very slight negative growths of −1.5% registered between 2017 and 2018. The highest positive growths were, along with May’s 39.9%, peculiarly, in 2017–2018 winter period: January’s 20.5% and March’s 35.2%. Given the total number of foreign visitor overnight stays in Croatia, these positive growths in the low season might appear encouraging but are still statistically neglectable. Thus, although there are variations in growth, Croatia’s low season values represent a tiny fraction of its high season ones.
4.3.3. Montenegro Seasonal Variations of Foreign Visitor Overnight Stays
Montenegro (  ), across 2016–2018, presents trends that shadow Croatia’s, easily explained by the fact that they share the same coastline and attract a similar configuration of foreign tourists. The trends of Montenegro show a more limited growth in 2017s’ high season though the maximum values of peaks are reached in August 2018. The following table shows Montenegro’s foreign visitor overnight stay percentage growth in same months across 3 years (Table 8), obtained by elaborating extracts from the Montenegro Statistical Agency database [50,51,52].
Table 8.
Montenegro, foreign visitor overnight stay growth by same month comparison, 2016–2018.
From the previous graph (Figure 8) and the above data (Table 8), Montenegro presents some very high positive growth values between the low seasons of 2016 and 2017, although between 2017 and 2018, the values are still positive but more moderate, and in line with other ex-Yu countries. While there are few negative growth moments, the overall growth is positive. It is important to bear in mind, given Montenegro’s relatively low total number of foreign overnight stay visitors, even small absolute increases can reflect as high percentages in relative growth, a likely scenario, given the vicinity of Croatia to Montenegro and the fact they share the same coast on the Adriatic. Thus, while Montenegro’s high season is very dominant, the low season presents much room for growth.
4.3.4. N. Macedonia Seasonal Variations of Foreign Visitor Overnight Stays
The trends in N. Macedonia (  ) while following the cyclical pattern of the other 5 countries do present some interesting deviations. First, there is an observable shoulder in the late spring, both in 2016 and 2017, also observed in BiH. The shoulder then transitions to a linear positive growth towards the peak in August, anticipating the pinpoint of high season’s beginning to May, instead of previous June-July. On the descending side of the high season peak, 2018 also presents a milder fall, entering low season in September and hitting minimum values in November, in line with BiH, and later than other 4 countries. From the values, we can observe a gradual increase in the total number of foreign overnight stays across all months in 2018, which softens the 3rd bell curve (Figure 8). As for the percentages of growth in same months across 3 years, they are presented below (Table 9), obtained by elaborating extracts from the Statistical Agency of North Macedonia database [53].
Table 9.
N. Macedonia, foreign visitor overnight stay growth by same month comparison, 2016–2018.
N. Macedonia presents positive growth across all months, with quite optimistic values between 2016/2017, ranging from 20% to 40%, except a slow March at 3.2% and a moderate May at 9.8%. The 2017/2018 comparison shows a sort of inversion of 2016/2017, with slowdowns in high season and winter too, where previous values were high and an increase in spring, where previous growth was a bit lower. Overall, N. Macedonia signals there is improvement both in terms of total foreign visitor overnight stays and their “spread” across the high season, expanding it to 2 additional months in 2018.
4.3.5. Serbia Seasonal Variations of Foreign Visitor Overnight Stays
Serbia (  ) presents somewhat different trends, compared to the other 5 countries, across the 3 years. It is clear that, while the high and low season cycles mirror those of its regional neighbors, Serbia has been experiencing a decrease in total number of foreign visitor overnight stays. It can be observed in the graph (Figure 8) how the peak value in 2018 barely reaches over the 0.0 threshold line, touching 0.035 in August (Appendix C). While the focus of this research is whether it is possible to boost the low season of this region, Serbia appears to be in need of recovering its high season as well. In the table below, growth values of foreign visitor overnight stays (Table 10), obtained from the Statistical Agency of Serbia database [54], are presented.
Table 10.
Serbia, foreign visitor overnight stay growth by same month comparison, 2016–2018.
Overall, Serbia presents a glaring negative growth across both high and low seasons of the 3 year period. While exact causes of this trend are not explored here, it still remains an important finding, as it potentially shifts focus to Chinese travelers being a sustainable boost to Serbia’s high season as well, not only the low one. Also, considering the data from the above table (Table 10) and the normalized graph (Figure 8), while Serbia’s cycles do follow trends of the other 5 countries, its high season has suffered the most, especially in 2017/2018, with negative growth values ranging roughly between −14% and −21% reaching the lowest −21.9% in April and −21.1% in June.
4.3.6. Slovenia Seasonal Variations of Foreign Visitor Overnight Stays
Across 2016–2018, Slovenia (▪▪▪▪▪) presents somewhat similar, although less drastic, trends to Serbia in terms of negative growth. The max(x) value is in August 2016 and all values are dropping across the following 2 cycles, both in high and low season. From the graph (Figure 8), the overall high/low season trend seems to be in line with the other 5 countries, with the numbers of total foreign visitor overnight stays rising sharply at beginning of the summer and falling at the end of it, while the rest of the year stays low with limited shoulders in winter’s December, possibly caused by Slovenia’s ski resorts. Slovenia’s Statistical Agency database [55] holds the data on foreign visitor overnight stays and the growth comparison across the last 3 years is presented here (Table 11):
Table 11.
Slovenia, foreign visitor overnight stay growth by same month comparison, 2016–2018.
Judging by the numbers, Slovenia has experienced a steady negative growth across all the months in the comparison between 2016 and 2017. Especially worth of notice are the drops in summer, −14.6% July and −12.8% August and −16.7% in September, repeated in 2017/2018, with drops of −14.6% in July and −15.6% in August, while June reached −23.8%. As mentioned for Serbia, the reasons for the overall negative growth in Slovenia’s foreign tourist overnight stays are not explored here, but it does present the potential for considering boosting the high season as well.
4.3.7. Summary and Observations on Findings Related to the Economic Dimension, Indicators and Seasonality Trends in Ex-Yugoslavia Inbound Tourism
So far, the data presented and elaborated in this segment of the research was aimed at exploring the Seasonality and its relevance, in terms of inbound tourism in the ex-Yugoslavia region. The first findings, although mixed for the 6 ex-Yu countries, still indicate that Seasonality does play an important role when considering the Economic dimension in terms of TBL framework. Regarding Economic indicators, T&T’s interaction with the GDP and employment appear to be statistically significant while the unemployment rate also presents high values with exception of Slovenia. Although this research lacks hard data that would prove causality, or even correlation, between unemployment rates and seasonal employment, it is safe to infer that a boost to T&T in ex-Yu low season could increase the demand for additional workforce thus increasing (1) chances of seasonal workers being re-employed and (2) chances of tourism related jobs becoming more stable.
Regarding Seasonality, it was observed that all of the ex-Yu countries have very similar cycles of high and low seasons, including peaks, although two of them, Serbia and Slovenia, are experiencing negative growth. Reasons of these negative growths are not explored here but might be interesting to consider in future research It is worth noting that the high/low season cycle of T&T Industry in ex-Yu region, while mostly conditioned by favorable Natural factors during the summer period (climate, weather, temperatures), is also conditioned by Institutional ones i.e., general summer vacation periods in Europe. This note will be valuable when comparing these factors to the ones conditioning the Chinese outbound tourism.
In terms of total foreign visitor overnight stays, Croatia absolutely dominates the high season, where its highest registered value in August 27 million, is more than 4 times higher than the sum of the totals of the other five countries. Except the obvious case of Croatia, the other countries also do present their high seasons across summer months although, with varying ranges. With that being said, the low season, being the focus of this research, presents relatively smaller differences in values across all 6 ex-Yu countries, and these values are overall at least 2 to 3 times smaller, on average, than the high season ones, Croatia is the exception here, with January’s total of foreign visitor overnight stays being 50 times smaller than the August one.
To understand more clearly the statistical significance presented by seasonality, i.e., seasonal gaps, across 2016–2018 period, the following table (Table 12) contains: the number of foreign overnight visitor stays in peak season (max); in low season (min); their averages (avg); differences between peak and low values (max- min gap); differences between average and low season values (avg-min gap); proportion of low season values to peak season (min/max %); proportion of low season values to average values (min/avg %). This will pinpoint the statistical significance of any potential boost to low season, i.e., increase in the n. of foreign visitors, for each of the 6 ex Yu countries.
Table 12.
Number of foreign visitors: max; avg; min; differences; min as % of max and avg; 2016–2018 period.
The largest relative gap is found in Croatia’s difference between peak and lowest values, at more than 26 million, while the smallest gap is in N. Macedonia, at barely under 200 thousand visitors. BiH, N. Macedonia and Serbia present max-min gaps of several hundred thousands, while Slovenia is at almost 1.9 million and Montenegro more than 3.8 million.
When looking at relations between minimum, maximum and average values, expressed in percentages, Croatia’s 1.47% and 2.89% clearly indicate the tremendous significance of its 26 million gap, presenting the low season as strongly underperforming; also, it can be understood that it would require much stronger boost in terms of n. of foreign visitors in order to register a meaningful improvement. Montenegro presents a similar case, although it’s relative gap is smaller, the percentages are in line with Croatia’s, at 1.66% and 3.28%.
N. Macedonia, on the other hand, while presenting the smallest relative gap, has its low season n. of visitors positioned as 17.23% of its peak value and 29.40% of its average value; this shows that an increase of even one hundred thousand foreign visitors would be very meaningful as it would reach N. Macedonia’s average value. BiH and Slovenia present similar scenarios, with their min/max values at 19.79% and 15.15%, while min/avg are at 33.04% and 26.32%.
Serbia presents a slightly different case, with its relative gap in line with the other 3 countries while its low season value equates to one third of the peak value and to almost 50% of its average value; an increase of several hundred thousand visitors would translate to a significant boost, easily going over its average value. It is clear that these low season/high season gaps present all the six countries, with the opportunity to boost the low season, reaping major benefits where the gaps are larger, e.g., in Croatia, although also requiring a stronger boost, i.e., a higher number of visitors, while other countries would have relatively sound benefits even from more modest boosts. Potentially, the low season boost would also extend to the declining high season in the case of Serbia and Slovenia.
4.4. P.R. of China Outbound Tourism Economic Indicator: Seasonality
As far as the Seasonality, i.e., seasonal trends, of the Chinese outbound travelers is concerned, it is important noting that they are heavily conditioned by the Institutional public holidays in China and are not very limited by Natural ones. More and more Chinese tourists prefer to piece together holidays, weekends and annual leaves to extend an otherwise short holiday. The data in the World Tourism Cities Federation report [108] illustrate the percentages of time choice for the travel of China’s outbound tourists, divided between public holidays, summer and winter vacations, and other days, listed here in descending order: Minor vacation 26.78%; National Day 23.02%; Chinese New Year/winter vacation 21.32%; other than legal holidays 16.62%; summer vacation 12.26%.
More specifically, the main travel periods are the Chinese New Year (7 days, January or February), the National Day (7 days, October), the summer vacation (July to August), while minor vacation periods are mostly combined between Chinese traditional holidays and weekends, lasting for 3 days, including holidays for Ching Ming Festival in April, Dragon Boat Festival in June, Mid-Autumn Festival in September and the May Day on May the 1st. Average days spent overseas during 2018 Spring Festival are 8.5, with 57% of Chinese tourists choosing 6–9 days. In order to understand the seasonal trends of Chinese outbound tourism more in detail, the data from China Tourism Academy [4,5,6] and China Tourism Research Institute [7] on monthly person-times of Chinese outbound tourists, across 2014–2018, is elaborated and presented in the following graph (Figure 9), with a scale of 100,000 people times.
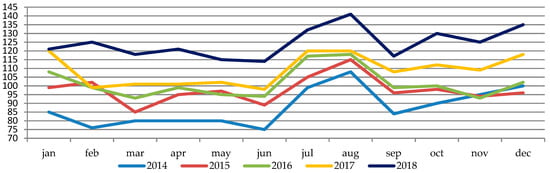
Figure 9.
Chinese outbound tourists 2014–2018 period, 100,000 people-times.
The graph below (Figure 9) clearly shows that the number of Chinese outbound tourists is growing on a yearly basis and is also subject to some degree of seasonality. For the purpose of illustrating the comparison of inbound tourism seasonal trends of the six ex-Yu countries to the Chinese outbound tourism seasonal trends, the data taken in consideration will be limited to the 2016–2018 period and min-max normalized according to the same formula (Formula 1) that was previously used in Figure 3. The data used prior to the normalization are fully presented in the Appendix D, while the normalized one is reported in the table below (Table 13); as already stated, the values in red are considered as low season, while the black ones are considered as high season.
Table 13.
2016–2018 Chinese outbound tourists, total, min-max normalized.
When observing both the previous graph (Figure 9) and the above table (Table 13) several initial considerations can be put forward:
First, it would appear that the “high season” for the Chinese outbound tourism, generally, also occurs in the summer period, peaking in months of July and August, to be precise. This would be expected and in line with the Institutional factor of summer vacation, both for government institutions (e.g., government employees, schools and universities) and private companies.
Second, there is also a very significant shoulder in winter, especially between December and January, both in 2016 and 2017, while February 2018 also presented a significant shoulder. These shoulders are also accounted for on basis of Institutional factors, i.e., the Chinese New Year, as mentioned previously [108]. On closer inspection, a suggestion of a double peak scenario might be put forward, one during the summer vacation, subject to general summer vacations, and one during the winter period, subject to the Lunar calendar that determines the Chinese New Year holidays.
Third, as noted earlier, ex-Yu countries inbound tourism seasonal trends seem to be conditioned by the Natural factors during the low season (generally spanning from autumn to spring), while Chinese outbound tourist trends do not appear to be similarly limited at this point.
These initial observations are encouraging and allow the research to move forward with a direct comparison between ex-Yugoslavia countries inbound tourism seasonal trends in order to provide crucial information for defining a potential answer to the research question.
4.5. Comparison of Seasonal Trends: Chinese Outbound Tourism Ex-Yugoslavia Inbound Tourism
In order to formulate a more concrete and founded answer on the potential of Chinese inbound tourist as meaningful asset for the low seasons in ex-Yu countries, a direct comparison between the two trends is presented, as they are superimposed in the graph below (Figure 10).
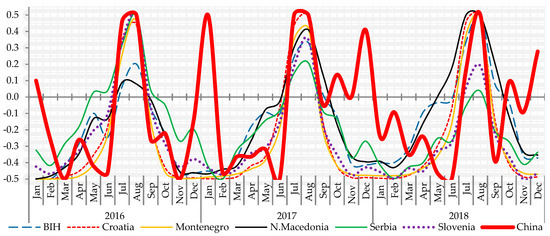
Figure 10.
Seasonal trends: Ex-Yu inbound and China outbound, totals, 2016–2018, min-max normalized.
For the purpose of the visual comparison, previously presented min-max normalized values for the 2016–2018 period have been used (Table A5 and Table A6). The visual representation in Figure 10 gives a clearer understanding of how the two trends might interact. In terms of Chinese outbound tourists and their seasonal trends, they clearly present a potential boost to ex-Yu countries inbound tourism, especially during the low season.
It is immediately observable how the high seasons in ex-Yu countries inbound tourism and Chinese outbound tourism present a significant overlap. The low seasons, however, present a different scenario. Chinese outbound values present several very significant high shoulders (even double peaks) and, at the same time, present extreme gaps from the bottom values of low seasons in ex-Yu countries inbound trends. The gaps are particularly evident with Chinese peaks in December and January periods, with overflows to October, November; even February and April, with March in 2017 and 2018, while being in Chinese outbound “low season”, still present significant gaps with several ex-Yu countries inbound ones, confirming again that Chinese outbound tourism seasonal trends mismatch the ex-Yu inbound ones and present them with a potential boost in low season.
Observing the numerical values of Chinese outbound tourists and ex-Yu countries inbound tourists might yield additional information on the above gaps. For illustration purpose, the graph showing ex- Yu countries total foreign tourist overstay (Figure 7) is combined with data on Chinese outbound tourists (Table A6), superimposed and presented in the graph below (Figure 11).
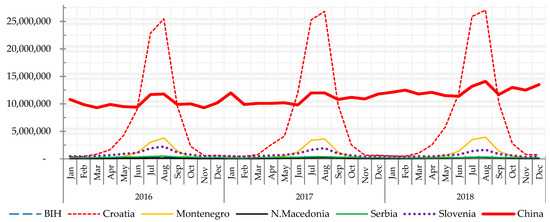
Figure 11.
Ex-Yu countries’ foreign tourist overnight stays and China outbound tourists, totals, in hundreds of thousands (100,000).
It is interesting to see how the total number of Chinese outbound tourists in 2018 reached the median value of Croatia’s high season number of inbound tourists, while easily surpassing the sum of the totals across the rest of the ex-Yu countries This already, at least visually, provides grounds for envisioning the potential contribution, i.e., boost to the low season in a scenario where even a very small fraction of the Chinese tourists were to visit these ex-Yu countries.
Furthermore, considering the issues in seasonality (seasonal gaps), presented previously in Table 12, and the statistics about Chinese outbound travelers in [4,5,6,7], an attempt to define the value range of the potential boost can be attempted. For the 2018, China Tourism Research Institute [7] placed the total of Chinese outbound tourists at 149 million person times, with Europe being a destination for 3.83%, i.e., roughly 5.71 million. In a hypothetical scenario, the 5.71 million person times is adopted as a projection for the future years; if ex-Yu countries were to attract certain percentages, where lower, more pessimistic projection is set at 1%, while higher, more optimistic projection is set at 10%, the result would project a potential range of 57,000 to 571,000 person times. To simplify, ex-Yu countries could attract 1–10% of Europe’s 3.83% of total Chinese outbound travelers, which would roughly equate to 0.04–0.38%, annually.
Focusing on the low season, January 2018 is taken as a point of reference and the above reasoning on the hypothetical boost range of 0.04–0.38% is applied to the Chinese outbound tourists (Table A6), resulting in roughly 4840–45,980 people times. When compared to the ex-Yu countries foreign tourist overnight stays (Table 4), the most notable increases would be in cases of N. Macedonia, by 7.93–75.38%, and BiH, by 5.09–48.4%, followed by Montenegro, with 3.38–32.15%, and Serbia, with 2.59–24.59%; Slovenia and Croatia, comparatively, would register the smallest growth, by 1.15–10.95% and 0.91–8.64%, respectively. In this hypothetical scenario, in terms of foreign visitor overnight stay growth rates for each country’s month of January (Table 6, Table 7, Table 8, Table 9, Table 10 and Table 11), taking January 2018 as a basis and adding the calculated boosts, both the pessimistic 00.4% (minimal boost) and optimistic 0.38% (maximal boost), the results would be the growth rates presented in table below (Table 14).
Table 14.
Foreign visitor overnight stay, projection growth based on Chinese traveler hypothetical boost.
In case of BiH, the minimal boost would rate would still result in a meaningful growth rate, albeit at roughly one third of the benchmark; maximal boost growth rate would be almost 2.5 times the 2017/2018 one. Croatia would barely register any minimal boost growth, at 0.91% being slightly less than 5% of the 2017/2018 growth rate benchmark, while the maximal boost, at 7.66%, would both reach one third of the benchmark and present a solid growth. Montenegro’s growth rate would be almost 7 times smaller than 2017/2018, in case of minimal boost, mostly because of its relatively high number of visitors and strong growth in the last 2 years (Table 8 and Table 12), although 3.38 would almost equate the world average [51]; maximal boost would be meaningful, slightly surpassing the benchmark. North Macedonia had a very strong growth rate in 2017/2018, thus the minimal boost results less impressive at 4-time lower value; the maximal boost, however, would reach an impressive growth rate of 62.60%, the highest among the ex-Yu countries, explained by the very low number of total visitors in January 2018. Serbia would register a slightly different behavior, given its low benchmark growth value: there would be slight growth in case of minimal boost, but still under the global average; maximal boost would bring the growth at rates similar to those of Croatia and Montenegro, going over 20%, a very solid result, mostly cause of relatively low total number of visitors in January 2018. Slovenia, although being the only country to have registered a negative growth in the benchmark period, does report a higher number of total visitors, therefore the minimal boost results in low growth rate; maximal boost growth rate, however, reaches a solid 9.68%.
5. Summary of Findings and Discussion in Terms of TBL with Focus on the Economic Dimension and Economic Indicator of Seasonality
As put forward initially, Seasonality, intended as a “theme” in the Economic dimension of the TBL, is in the main focus of this research (Table A1, Table A2 and Table A3). The Social and Environmental dimensions, although not researched here, are still touched upon and at least considered in terms of interactions with the Economic dimension i.e., through the Equitable and Viable sub-dimensions. This decision has been justified by (1) the availability of data pertaining to the Economic Indicators and (2) the assumption that a limited boost to the number of tourists in the low season would not put the amount of stress equivalent to that of the median number of tourists (taking lowest value in low season and the peak value in the high season for each country separately). Therefore, as a part of the initial hypothesis, interactions within the Equitable and Viable sub-dimensions would be active the most, driven by the Economic dimension, while the Bearable sub-dimension would be affected through the interaction of a more limited number of Environmental and Social Indicators, i.e., mostly the ones related to “financing biodiversity”, “conservation and maintenance of protected areas” and “opportunities for participation of tourists in conservation” combined with “tourism development”, “business success”, “cultural development”, “increased awareness about destinations and cultures” and “maintenance of cultural heritage through enhancement of attractions” (Appendix A).
In the first part of this research, the relevance and growth of the T&T Industry in the ex-Yu countries was expanded on, especially in terms of impact on GDP and employment. In 2014–2018 period, all countries experienced positive growth of inbound tourists to different degrees, e.g., in 2017–2018 ranges were from 6.8% to 14.3% (Table 1). Croatia stands out as an anomaly, having the totals that surpass other countries from 3 to 20 times, in cases of Slovenia and N. Macedonia. The contribution of T&T to GDP in ex-Yu countries was in line with its growth, e.g., ranging from 5.53% to 10.57% in 2017–2018 period. Croatia ranked first both in terms of GDP and T&T growth and was a close second in terms of T&T impact to GDP. Montenegro and N. Macedonia ranked last in GDP but were leading in terms of T&T growth, with Montenegro also in the lead with T&T contribution to GDP, while N. Macedonia ranked second last (Table 2, Figure 6). Employment is also affected significantly by T&T, with one out of four people working in this industry in Croatia, and one out of 10, on average, in other countries (Table 3).
As noted earlier, in the Economic dimension, through Economic indicators of GDP and employment, the contribution of T&T appears significant, overall. For Croatia and Montenegro, the contribution is very significant, with Croatia being the most reliant on T&T; BiH and Slovenia follow the global averages, with T&T playing an important role in GDP, yet not relying heavily on this industry; Serbia and N. Macedonia do not rely as much on T&T Industry in terms of impact on GDP and employment, potentially having most space for growth or improvement.
Seasonality, across the observed 2016–2018 period, was quite marked in all ex-Yugoslavia countries. The high season, with its peak, is during the mid-summer period, while the low season covers most of the rest of the year, with some sporadic and limited shoulders (Table 4, Figure 7). For the Chinese outbound tourism, Natural factors in seasonality play a more limited role, partially due to the Institutional factors that spread Chinese holidays across the whole year, with Chinese New Year being one of the major travel periods [108]. Since Chinese outbound tourism trends presented significant shoulders during the winter/ex-Yu countries low season (Figure 9), this finding prompted a direct comparison between the ex-Yu and Chinese trends. From this direct comparison, it was observed how Chinese outbound tourism seasonal trends mismatch the ex-Yu inbound ones and present them with a scenario for a potential boost in low season (Figure 10).
Additionally, the analysis of seasonal issues presented by seasonality in ex-Yu countries (Table 12) allowed for a more precise framing of the statistical significance of a potential boost to low season. A hypothetical scenario, where ex-Yu countries would attract a certain share of Chinese outbound tourists that chose Europe as a destination, was presented. The share was defined as a percentual range within two projected values: 1% as a pessimistic and 10% as an optimistic projection. Europe, as a destination in 2018, was chosen by 3.83% Chinese travelers [7], thus the projected values ranged between 0.04% and 0.38% for ex-Yugoslavia. The values for foreign visitors in January 2018 and 2017/2018 January growth rates were taken as benchmark (Table 14) for statistical analysis of the projections. It was observed that attracting the minimal value of 0.004% of the Chinese outbound tourists during the low season would represent a negligible boost for Croatia (0.91%), slight to globally average growth rate for Slovenia, Serbia and Montenegro, and significant boost to BiH and N. Macedonia (5.09% and 7.95%). In case of attracting the maximal value of 0.38%, although the boost for Croatia and Slovenia would be relatively lower, their growth rate would still rank high compared to the world average (7.66% and 9.68% vs. 3.38%), while Serbia and Montenegro would climb over 20%, and BiH and N. Macedonia would rocket to 41.19% and 62.60%. In summary, this hypothetical scenario illustrated the statistical significance of a potential boost to the ex-Yu countries low season.
It is worth reminding that, although both minimal and maximal boosts would certainly be felt across all ex-Yu countries, with exception for minimal growth case in Croatia, the total number of foreign overnight visitors in the low season would still be far from their average annual values, therefore it is safe to exclude most of the issues strongly related to the high season.
Considering the TBL dimensions more in detail, there are several other Economic indicators, other than the ones in the “Seasonality” theme, that would be positively affected, e.g., in the “Employment” theme, the “number and quality of employment” indicator would surely show positive results if increased demand in low season called for more stable and/or trained personnel. The “Destination Economic Benefits” theme also has several indicators that would benefit, such as “business investment”, “revenue”, “hotel occupancy rates”, while the others are not expected to be significantly impacted. Also, if “quality of employment” and “professional development” are considered related to the Social indicator of “cultural development”, there might be need for cross-cultural experts in presenting Equitable solutions. As for Viable interactions, the most obvious links are, once more, through economic benefits derived from influx of capital brought by visitors e.g., “revenue” and “financing for biodiversity conservation and maintenance of protected areas” seem closely related.
As far as the Social dimension is affected, if considering the Social indicators of Tourism Impact (Table A2), no data were presented for the “Background” theme’s “tourism development” indicator; “visitors to the area” indicator is affected by increased number of visitors in the low season, registering growth; there are no data for other indicators or indications for inferring conclusions. As for the “Social Environment” theme, “increased awareness of destination” would register growth since more Chinese travelers would acquire awareness about ex-Yu destinations; as for “business success” and “tourism development”, it can be inferred these indicators would register growth from an increased influx of capital; there are no data concerning “resident population”; “crowding”, as already mentioned, is generally an issue in high seasons, and although the Chinese travelers boost to low season would present a significant potential for T&T growth, the total contribution would still keep the total numbers of visitors under average levels i.e., in the low season; there are no concrete data for “maintenance of cultural heritage through enhancement of attractions” and “cultural development: events”, but it can be suggested that DMOs develop specific cultural attractions that target the Chinese traveler, and channel the extra income from the visitor boost towards the maintenance of cultural heritage. Other indicators cannot be commented as there is no data available or they are too far from the indicators in the “Seasonality” theme and relative data presented herein. In summary, all of the Social indicators that have been observed as directly linked to the Economic ones, through effects of a boost in number of visitors to the low season, present possibilities for Equitable interactions and solutions.
As for the Environment dimension, it might be argued that several Environment indicators of Tourism Impact (Table A3) under the “Tourism as a Contributor to Nature Conservation” theme, such as “financing for biodiversity conservation and maintenance of protected areas”’ and “provision of opportunities for participation by tourists in conservation” might be directly affected: The extra revenue could surely contribute to the financing of protected areas, such as natural parks, present across all 6 ex-Yu countries; eco-friendly tourist offers, designed to raise awareness about the environment and its protection and preservation, aimed at Chinese travelers in particular, would surely find their place in the low season tourist products. Although there is no data to support concrete conclusions on the indicators under the “Limiting Environmental impacts of Tourism Activity” theme, since the level of foreign overnight visitors would still be under average, it can be inferred that, as long as there are good practices concerning Environmental impacts already in place, there should be no additional issues to the ones already occurring in the low season across ex-Yugoslavia. Therefore, indicators of “sewage treatment”, “solid waste management”, “water and air pollution”, “noise levels” and “visual impacts of tourism” would be expected to remain within norms. Several indicators do have points in common with the Social dimension: “managing visual impacts of tourism” can be linked with “education and training” and “tourism development”; “…participation by tourists in conservation” can be related to “maintenance of cultural heritage”, “cultural development” and “increased awareness of destination” allowing for the Bearable sub-dimension interactions regardless of the Economic dimension indicators.
However, since these Social and Environmental indicators, that would allow for Bearable interactions, are also separately linked to, and driven by, Economic indicators (focal to the research herein), it can be concluded that, if managed properly within the BTL framework, these single Economic indicators could drive Sustainable development, leading interactions within the Viable and Equitable sub-dimensions, while indirectly providing support for the Bearable sub-dimension.
6. Conclusions and Final Remarks
The research question was posed in Section 1.3, as follows: “considering the travel period trends of the Chinese outbound tourists and the inbound tourism trends in ex-Yugoslavia, is there any significant overlap/mismatch and could the Chinese tourists be a meaningful asset for the low seasons in ex-Yu countries, and can this asset be implemented in a sustainable way?”
Having adopted a definition of Sustainable Tourism (p. 4), the Triple Bottom Line framework (p. 5) and a definition of Seasonality (p. 7), and considering data presented and analyzed so far, it is possible to formulate the answer in 3 parts, as follows:
- (1)
- There is a significant degree of complementarity between the seasonal trends of Chinese outbound tourism and ex-Yugoslavia countries’ inbound tourism, with particular emphasis on the ex-Yugoslavia countries’ low season, which presents huge negative growth gaps with the high season, while Chinese outbound tourism still present positive growth;
- (2)
- Yes, Chinese tourists could be a meaningful asset and provide a statistically significant quantitative boost to foreign overnight visitors in low seasons for all 6 ex-Yugoslavia countries. Taking January 2018 as a benchmark, there was less impact in case of Croatia and Slovenia in case of lower values (minimal value considered of 0.04% of total Chinese outbound travelers), and very high growth rates across all 6 countries in case of higher values (maximal value of 0.38% of total Chinese outbound travelers;
- (3)
- The boost could be sustainable in terms of the TBL dimensions and indicators. More precisely, the initial assumption was that the majority of resources already in use during the high season would be relied upon, while the potential boost by the Chinese tourists would not pass the median values of tourists, therefore the stress on the TBL dimensions would still be within the “low season values”. While the emphasis is on the Economic dimension, which is presented with the greatest benefit and as the main driver, the Social and Environmental dimensions would also benefit, mostly as consequence of their themes being directly affected by the economic factors and increase in visitors brought through the Economic dimension, i.e., there are indicators that share common points and can affect more than one dimension. In this way, the Social and Environment dimensions are affected via actions driven by the Economic dimension through the Equitable and Viable sub-dimensions, while the Bearable sub-dimension, although independent from the Economic dimension, can still be impacted indirectly through the interaction with the Equitable and Viable sub-dimensions.
As final remarks, additional effort should be put into reframing the content into formats that would increase the Chinese traveler willingness to travel to ex-Yu destinations during the low season. Adequate offers and services that would emphasize engagement with local culture as to create more awareness should be developed and put in place, while paying attention to local resources. Given that ex-Yu countries partake in China’s “Belt and Road” initiative and the “17+1” platform, they should be able to benefit from the support of the Chinese government in terms of exposure to the Chinese consumers, and might be able to access preferential channels to promote themselves as destinations for the Chinese traveler. Under this light, it is suggested that further studies be made in terms of how Destination Management Organizations in ex-Yu countries could develop appealing content and services for the Chinese travellers, bearing in mind the local resources and employing sustainable means.
Exemplary Cases of Research and Successful Programs on Attracting Chinese Tourists with an Overview of ex-Yu Countries’ Tourist Offers
Although developing and/or proposing content for DMOs is not within the scope of this research, for the sake of completeness of the above remarks, several successful cases of tourist programs targeting specifically the Chinese traveler are briefly mentioned here, followed by a synthetic overview of the types of tourist offers promoted via ex–Yu countries’ official DMOs, mostly national tourism boards or organizations that fulfill a similar role.
On a global level, the most prominent programs are implemented by large hotel chains. A research for InterContinental Hotels Group (IHG) [109] in Dubai introduced a “China Ready” status, a certification of services including Mandarin-speaking staff, acceptance of Chinese bank cards and Chinese tea for guests, resulting in a 70% increase in overnight stays in the same periods between 2015 and 2016. IHG opened its first Hualuxe hotel in China in 2015, a luxury brand with Chinese characteristics, including VIP check-in lines and teahouses in place of hotel bars. “Hilton Huanying” [110] program was developed for the older Chinese travelers, who prefer tour groups, although it also aims to reach the independent traveler. Its “Arrival Experience” includes welcome notes in simplified Chinese upon arrival and a 24-hour Mandarin interpretation service, while many properties retain Mandarin-speaking staff, offer Chinese TV channels in the rooms and a Chinese breakfast menu, with AliPay terminals available in hotels so guests can pay using their smartphones [111]. Since 2014, Four Seasons Hotels and Resorts employs Mandarin-speaking staff, available 24 hours a day, with attention to cultural sensitivities when providing service e.g., avoiding assigning rooms ending with the number four or rooms at the end of a corridor, using red flowers but avoiding white and blue ones. These changes brought a 76% increase year over year in business from Chinese travelers staying at Four Seasons [112].
Some countries and regions have paid particular attention to attracting Chinese travelers in the recent years. Australia is a leading example with its government sponsored research aimed at understanding Chinese Free and Independent Traveler (FIT) [113]; estimating Chinese tourists as worth AUD 11.5 billion a year, Australian government is investing AUD 5 million in advertising to young Chinese urbanites, in order to persuade them that regional Australia isn’t dangerous and is worth visiting, despite the lack of free WiFi [114]. The Nordics has published an extensive research on Chinese High Spending FITs [115], initiated and financed by the Nordic DMOs and Nordic Council of Ministers, partnered with COTRI, that explored how to increase awareness of the Nordic region as a whole; identify multiple interesting places to combine in the same trip; increase sustainable tourism from China to different Nordic destinations. It is worth noting how the report affirms that there are potential ways to manage the seasonality of the Chinese market by “focusing destination branding and marketing strategies in educating the Chinese market of Nordic’s off- and shoulder-season attractions and activities” through trade marketing to the industry (product training and workshops to Chinese tour operators, roadshows and key trade fairs, marketing campaigns with Chinese tour operators, airlines, hotels and other service providers) and consumer marketing (manage contents and market through Qyer and Mafengwo, WeChat and Weibo accounts, live-stream through KOLs, movie/TV productions). A valid suggestion, in the report, is also to develop products and services that contain specific themes and activities that can be impacted less by seasons/climate, for example: photography (in any season); Northern European architecture and Scandinavian design; foodies’ trip to taste and learn healthy Scandinavian way of cooking; self-driving.
In cases of winter/low season tourism, successful programs like the Shaun White Air and Style snowboarding event have taken place in Beijing’s Bird Nest every year since 2010, two years after China hosted the Summer Olympic Games, attracting crowds willing to explore snow destinations outside of China. Davos employed eight Mandarin-speaking ski teachers paid by the local tourism board to spend the winter in the Swiss Alps, aiming to facilitate entry to China’s skiing market, according to Clampet [116]. A similar strategy was adopted by the leading ski resort in Canada, the Whistler Blackcomb, as reported by Hudson [117], and the British ski school Warren Smith Academy [118], while Aspen Snowmass’s strategies focus on building brand awareness in China introducing information on what to see and do in the area to tour operators, including site seeing, local foods and other special experiences, such as shopping [118].
These remarks do not imply that DMOs and other relevant Tourism bodies in ex-Yu countries should only develop snow related offers or just focus on culturally relevant services; rather they are meant to serve as an invitation to explore, according to local resources and constraints, what are the best practices in activities and services, during low season, that aim to provide experiences that match the Chinese traveler’s expectations, along with paying attention to the dimensions of TBL.
The above examples indicated tourism products, services and offers that match Chinese traveler’s motivation/drivers i.e., willingness to travel, also mentioned in the Section 1.2: Attraction of scenic area of tourism destination/site seeing, local foods, shopping or some special experiences. Ex- Yu countries already have, to certain extent, potential locations, travel products and offers that might act upon those drivers, and some examples can be found as travel suggestions on web pages of Tourism Bureaus or similar organizations.
In case of Bosnia and Herzegovina, under a “heart-shaped land” tagline, the Tourism Association of Federation of BiH [119] highlights numerous locations: some are historical, related to medieval heritage via a special “Bosnian Kingdom Trail” or related to both World Wars, in which BiH was strongly involved; others are natural or sport locations, such as mountains where Winter Olympics 1984 were held or natural parks with charming waterfalls, rivers and lakes.
Croatia also does not lack in tourist offers, with “Croatia Full of Life” crowning the content on the Croatian National Tourist Board web page [120]. Offers are heavily nature and outdoors activities oriented, as the catchy adjectival phrase “full of” starts a list of nature, islands, paradises, trails, bike routes and adventures. There are some cultural options related to food and wine, featuring both traditional and Michelin rated spots, along with World Heritage locations; the special “Game of Thrones” tour, a huge success in previous years, is still being featured.
Montenegro National Tourism Organization [121] operates a more modest web page, with the tag “Montenegro Wild Beauty” capturing the essence of their offers. The selections mostly rely on untouched nature, coastal area, panoramic roads and natural parks, sports and outdoor activities, with few alternative sections, e.g., cultural heritage and shopping. Overall, while having potential, the offers are not as elaborate or presented well, if compared to the neighboring countries’ offers.
The N. Macedonia’s Agency for Promotion and Support of Tourism [122] presents a style that could be defined governmental, bureaucratic or “statistic agency” feel. While it presents a tiny logo with a whimsical raising Sun and a “Timeless Macedonia” tag, it is completely opposite of colorful and “customer-oriented” web portals of BiH, Croatia, Serbia and Slovenia. The focus is heavy on official news bulletins, announcements and statistical reports, while “Information Trips” is only available in local language and presents mostly instructions for foreign tour operators, journalists and celebrities.
In case of the neighboring Serbia, the National Tourism Organization has a more modern look, with a playful and colorful logo based on the country’s name [123]. The main attractions revolve mostly around natural landscapes, such as Stara Mountain, Djerdap and Tara National parks or Resavska Cave, or appear combined with some cultural and historical elements, dating from the Roman Empire. There is one section about wine, but, overall, there is nothing that really stands out when compared to the other countries’ generic offers.
Slovenian Tourist Board [124] put an extra effort in branding, as their website bears the tagline “I FEEL SLOVENIA”, a play in double meaning by partially bolded words. Slovenian Tourist Board boasts mostly world class natural attractions, such as Postojna cave, Lake Bled or Lipica, the cradle of Lipizzaner horses. Julian Alps are a dominant feature of the Slovenian geography and play a relevant role in the local tourism, across all seasons, thus are strongly featured as well. “Going Green” and the claim “In Slovenia, sustainable is the way to go” designate distinctive offers, as Sustainable Tourism is not yet a mainstream concept in the ex- Yu countries.
Regardless of any specific locations, offers, services or “travel products” that might match the drives of Chinese travelers and increase their willingness to travel to ex-Yu countries, there is a complete absence of successful practices reported earlier in this section [109,110,111,114,115,116,117]. It is advised, should DMOs in ex-Yu wish to pursue attracting the Chinese traveler, to develop more content in line with their cultural idiosyncrasies, delivered in Chinese language and promoted through local tourist channels that rely heavily on visual material and online interaction. On a positive note, if Chinese travelers were to be targeted, Slovenia’s example of “Go Green” sustainable tourism could be an opportunity to present an appealing tourism product that raises awareness about sustainability issues way beyond its country borders.
Author Contributions
Conceptualization, M.X. and A.A.; Methodology, Investigation, Data Curation, Formal Analysis, Writing-Original, Writing-Review & Editing, Visualization, A.A.; Supervision, M.X. All authors have read and agreed to the published version of the manuscript.
Funding
This research received no external funding.
Conflicts of Interest
The authors declare no conflict of interest.
Appendix A
Economic, Social and Environment indicators of Tourism Impact, as found in “The Triple Bottom Line: A Framework for Sustainable Tourism Development” by Stoddard, Pollard and Evans [11], presented as lists.
Table A1.
Economic Indicators of Tourism Impact.
Table A1.
Economic Indicators of Tourism Impact.
| Theme | Indicators |
|---|---|
| Seasonality | degree of seasonality; strengthening shoulder seasons and low seasons; provision of sufficient infrastructure year-round; short-term and seasonal employment |
| Employment | numbers and quality of employment in tourism sector; professional and personal development; contentment from work; lack of skilled labor; labor income |
| Destination economic benefits | business investment in tourism; tourism revenue; community expenditures; net economic benefits; changes in cost of living; financial rate of return to operators; gross operating surplus of different tourism industry sectors; hotel occupancy rates; number of nonresident visitors; amount of money leaving tourism locality |
Table A2.
Social Indicators of Tourism Impact.
Table A2.
Social Indicators of Tourism Impact.
| Theme | Indicators |
|---|---|
| Background | resident population; visitors to the area; land use; tourism development; |
| Social Environment | access, especially parking; highway traffic count; housing affordability; business success; safety in the community; crowding; tourism development; resident attitudes towards tourism; pressure on health and social services; pressure on police; number of complaints by local residents; positive participation in community activities; change in character of local community such as development of local community groups; maintenance of cultural heritage through enhancement of attractions; resident perceptions of quality of life; cultural development: events (number and type); increased awareness of destination (increased visitation); increased awareness of destination (new investment/business opportunity in the region); change in crime patterns; change in social problems (e.g., alcohol, drugs); malnutrition; family support; education and training |
Table A3.
Environment Indicators of Tourism Impact.
Table A3.
Environment Indicators of Tourism Impact.
| Theme | Indicators |
|---|---|
| Tourism as a Contributor to Nature Conservation | measuring impact of tourism on natural environment; financing for biodiversity conservation and maintenance of protected areas; site-specific regulations; provision of opportunities for participation by tourists in conservation; intensity of use; managing scarce resources; greenhouse gas emissions; water availability and conservation |
| Limiting Environmental Impacts of Tourism Activity | sewage treatment; solid waste management; water pollution; air pollution; controlling noise levels; managing visual impacts of tourism; |
Appendix B
Monthly data of foreign tourists overstays across the 2016–2018 period, gathered from Ministry of Tourism database of Croatia [21,22,46] and Statistical Agencies’ databases of Bosnia and Herzegovina [47,48,49], Montenegro [50,51,52], North Macedonia [53], Serbia [54] and Slovenia [55] presented in Table A4, as follows:
Table A4.
2016–2018 ex-Yu countries foreign tourists overnight stays, totals, in 100,000.
Table A4.
2016–2018 ex-Yu countries foreign tourists overnight stays, totals, in 100,000.
| Year | Month | BIH | Croatia | Montenegro | N. Macedonia | Serbia | Slovenia |
|---|---|---|---|---|---|---|---|
| 2016 | Jan. | 68,642 | 396,707 | 65,722 | 40,052 | 217,442 | 482,355 |
| Feb. | 67,824 | 428,225 | 67,162 | 43,639 | 185,811 | 399,169 | |
| Mar. | 90,800 | 850,626 | 77,027 | 53,707 | 230,534 | 510,240 | |
| Apr. | 127,426 | 1,676,664 | 137,074 | 69,930 | 266,181 | 666,317 | |
| May | 177,932 | 4,270,282 | 416,699 | 110,530 | 336,571 | 898,554 | |
| Jun. | 137,626 | 8,962,643 | 1,122,967 | 110,988 | 340,830 | 1,096,914 | |
| Jul. | 222,638 | 22,854,302 | 3,006,367 | 153,328 | 434,535 | 1,922,112 | |
| Aug. | 260,522 | 25,473,938 | 3,801,146 | 151,508 | 496,489 | 2,234,907 | |
| Sep. | 186,254 | 9,666,033 | 1,429,785 | 133,256 | 341,609 | 1,168,478 | |
| Oct. | 144,243 | 2,275,386 | 234,255 | 90,249 | 310,687 | 746,931 | |
| Nov. | 79,639 | 612,032 | 92,178 | 49,354 | 236,627 | 480,588 | |
| Dec. | 77,875 | 594,247 | 78,093 | 47,476 | 260,552 | 569,445 | |
| 2017 | Jan. | 81,268 | 441,472 | 113,238 | 46,137 | 184,038 | 467,469 |
| Feb. | 76,395 | 470,265 | 132,311 | 51,427 | 157,748 | 389,563 | |
| Mar. | 104,043 | 750,336 | 187,733 | 55,427 | 216,830 | 451,409 | |
| Apr. | 155,494 | 2,550,428 | 303,768 | 84,676 | 245,647 | 637,461 | |
| May | 179,186 | 4,115,822 | 513,594 | 121,345 | 278,849 | 699,756 | |
| Jun. | 176,828 | 12,030,104 | 1,277,027 | 131,193 | 299,725 | 998,399 | |
| Jul. | 272,011 | 25,291,870 | 3,366,494 | 194,406 | 376,275 | 1,641,450 | |
| Aug. | 296,299 | 26,826,651 | 3,631,847 | 214,977 | 397,614 | 1,949,539 | |
| Sep. | 210,914 | 9,899,830 | 1,231,970 | 163,621 | 299,161 | 973,215 | |
| Oct. | 172,091 | 2,515,570 | 379,800 | 104,118 | 281,629 | 618,521 | |
| Nov. | 93,296 | 662,801 | 177,526 | 67,056 | 201,736 | 384,684 | |
| Dec. | 91,505 | 645,112 | 154,824 | 60,309 | 235,875 | 473,864 | |
| 2018 | Jan. | 95,035 | 532,075 | 143,029 | 60,879 | 186,648 | 420,365 |
| Feb. | 95,602 | 485,251 | 146,169 | 53,632 | 158,821 | 344,640 | |
| Mar. | 120,145 | 1,014,777 | 176,189 | 71,217 | 182,561 | 462,435 | |
| Apr. | 179,632 | 2,513,405 | 329,531 | 105,405 | 191,830 | 428,619 | |
| May | 196,235 | 5,759,584 | 601,612 | 136,352 | 241,621 | 664,223 | |
| Jun. | 201,005 | 11,850,435 | 1,372,138 | 169,876 | 236,366 | 761,232 | |
| Jul. | 297,901 | 25,918,243 | 3,481,548 | 232,402 | 308,988 | 1,396,556 | |
| Aug. | 342,700 | 27,050,659 | 3,947,629 | 231,398 | 339,134 | 1,645,397 | |
| Sep. | 228,032 | 10,186,069 | 1,376,904 | 176,671 | 256,788 | 871,244 | |
| Oct. | 196,233 | 2,826,494 | 480,799 | 113,568 | 234,773 | 601,254 | |
| Nov. | 106,657 | 781,182 | 209,421 | 71,940 | 188,288 | 338,645 | |
| Dec. | 103,166 | 733,585 | 178,841 | 68,195 | 213,180 | 405,368 |
Appendix C
Normalized values for total number of total monthly foreign visitors to the ex-Yu countries in the 2016–2018 period is found in Table A5, following the modified min-max normalizing formula:
Table A5.
Ex-Yu countries inbound tourists, totals, 2016–2018, min-max normalized.
Table A5.
Ex-Yu countries inbound tourists, totals, 2016–2018, min-max normalized.
| Year | Month | BIH | Croatia | Montenegro | N. Macedonia | Serbia | Slovenia |
|---|---|---|---|---|---|---|---|
| 2016 | Jan. | −0.49702 | −0.50000 | −0.50000 | −0.50000 | −0.32378 | −0.42421 |
| Feb. | −0.50000 | −0.49882 | −0.49963 | −0.48135 | −0.41715 | −0.46808 | |
| Mar. | −0.41641 | −0.48297 | −0.49709 | −0.42901 | −0.28513 | −0.40951 | |
| Apr. | −0.28317 | −0.45198 | −0.48162 | −0.34467 | −0.17989 | −0.32720 | |
| May | −0.09943 | −0.35467 | −0.40959 | −0.13360 | 0.02790 | −0.20473 | |
| Jun. | −0.24606 | −0.17862 | −0.22765 | −0.13121 | 0.04048 | −0.10012 | |
| Jul. | 0.06321 | 0.34256 | 0.25753 | 0.08891 | 0.31711 | 0.33505 | |
| Aug. | 0.20104 | 0.44084 | 0.46227 | 0.07944 | 0.50000 | 0.50000 | |
| Sep. | −0.06915 | −0.15223 | −0.14861 | −0.01545 | 0.04278 | −0.06238 | |
| Oct. | −0.22199 | −0.42952 | −0.45658 | −0.23903 | −0.04851 | −0.28469 | |
| Nov. | −0.45702 | −0.49192 | −0.49318 | −0.45164 | −0.26714 | −0.42515 | |
| Dec. | −0.46343 | −0.49259 | −0.49681 | −0.46140 | −0.19651 | −0.37829 | |
| 2017 | Jan. | −0.45109 | −0.49832 | −0.48776 | −0.46836 | −0.42239 | −0.43206 |
| Feb. | −0.46882 | −0.49724 | −0.48285 | −0.44086 | −0.50000 | −0.47315 | |
| Mar. | −0.36824 | −0.48673 | −0.46857 | −0.42007 | −0.32558 | −0.44053 | |
| Apr. | −0.18106 | −0.41920 | −0.43868 | −0.26801 | −0.24051 | −0.34242 | |
| May | −0.09486 | −0.36047 | −0.38463 | −0.07737 | −0.14250 | −0.30957 | |
| Jun. | −0.10344 | −0.06354 | −0.18796 | −0.02617 | −0.08087 | −0.15208 | |
| Jul. | 0.24283 | 0.43401 | 0.35030 | 0.30246 | 0.14512 | 0.18704 | |
| Aug. | 0.33119 | 0.49160 | 0.41865 | 0.40941 | 0.20811 | 0.34951 | |
| Sep. | 0.02056 | −0.14346 | −0.19957 | 0.14242 | −0.08253 | −0.16536 | |
| Oct. | −0.12068 | −0.42050 | −0.41909 | −0.16693 | −0.13429 | −0.35241 | |
| Nov. | −0.40733 | −0.49002 | −0.47120 | −0.35961 | −0.37014 | −0.47572 | |
| Dec. | −0.41385 | −0.49068 | −0.47705 | −0.39469 | −0.26936 | −0.42869 | |
| 2018 | Jan. | −0.40101 | −0.49492 | −0.48009 | −0.39172 | −0.41468 | −0.45690 |
| Feb. | −0.39894 | −0.49668 | −0.47928 | −0.42940 | −0.49683 | −0.49684 | |
| Mar. | −0.30966 | −0.47681 | −0.47154 | −0.33798 | −0.42675 | −0.43472 | |
| Apr. | −0.09324 | −0.42059 | −0.43204 | −0.16024 | −0.39939 | −0.45255 | |
| May | −0.03284 | −0.29880 | −0.36195 | 0.00065 | −0.25240 | −0.32831 | |
| Jun. | −0.01549 | −0.07028 | −0.16346 | 0.17494 | −0.26791 | −0.27715 | |
| Jul. | 0.33702 | 0.45751 | 0.37994 | 0.50000 | −0.05352 | 0.05789 | |
| Aug. | 0.50000 | 0.50000 | 0.50000 | 0.49478 | 0.03547 | 0.18912 | |
| Sep. | 0.08284 | −0.13272 | −0.16223 | 0.21026 | −0.20762 | −0.21913 | |
| Oct. | −0.03285 | −0.40884 | −0.39307 | −0.11780 | −0.27261 | −0.36151 | |
| Nov. | −0.35873 | −0.48558 | −0.46298 | −0.33422 | −0.40984 | −0.50000 | |
| Dec. | −0.37143 | −0.48736 | −0.47086 | −0.35369 | −0.33636 | −0.46481 |
Appendix D
As found in CTA reports [4,5,6,7] values for Chinese outbound tourists for the 2014–2018 period, expressed in 100,000 people-times, are found in Table A6, and have been successively min-max normalized in Table 13, following the modified min-max normalizing formula:
Table A6.
Chinese outbound tourists, 100,000 people-times, yearly, 2014–2018.
Table A6.
Chinese outbound tourists, 100,000 people-times, yearly, 2014–2018.
| 2014 | 2015 | 2016 | 2017 | 2018 | |
|---|---|---|---|---|---|
| Jan. | 85 | 99 | 108 | 120 | 121 |
| Feb. | 76 | 102 | 99 | 99 | 125 |
| Mar. | 80 | 85 | 93 | 101 | 118 |
| Apr. | 80 | 95 | 99 | 101 | 121 |
| May | 80 | 97 | 95 | 102 | 115 |
| Jun. | 75 | 89 | 94 | 98 | 114 |
| Jul. | 99 | 105 | 117 | 120 | 132 |
| Aug. | 108 | 115 | 118 | 120 | 141 |
| Sep. | 84 | 96 | 99 | 108 | 117 |
| Oct. | 90 | 98 | 100 | 112 | 130 |
| Nov. | 95 | 94 | 93 | 109 | 125 |
| Dec. | 100 | 96 | 102 | 118 | 135 |
References
- Secretariat for Cooperation between China Central Europe Cooperation. Available online: http://www.china-ceec.org/eng/ (accessed on 13 May 2019).
- Ministry of Foreign Affairs of People’s Republic of China. The Budapest Guidelines for Cooperation between China and Central and Eastern European Countries. 28 November 2017. Available online: https://www.fmprc.gov.cn/mfa_eng/wjdt_665385/2649_665393/t1514534.shtml (accessed on 14 May 2019).
- Embassy of the People’s Republic of China in Bosnia and Herzegovina. Third High-Level Conference on Tourism Cooperation between China and CEEC Held in Sarajevo. 27 November 2017. Available online: http://ba.chineseembassy.org/eng/sgxx_5/sghd/t1543042.htm (accessed on 14 May 2019).
- China Tourism Academy. Annual Report of China Outbound Tourism Development 2015; Tourism Education Press: Bejing, China, 2015; ISBN 978-7-5637-3201-2. [Google Scholar]
- China Tourism Academy. Annual Report of China Outbound Tourism Development 2016; Tourism Education Press: Bejing, China, 2016; ISBN 978-7-5637-3460-3. [Google Scholar]
- China Tourism Academy. Annual Report of China Outbound Tourism Development 2018; Tourism Education Press: Bejing, China, 2018; ISBN 978-7-5637-3792-5. [Google Scholar]
- Jingsong, Y. Tourism Research Institute: China Outbound Tourism Development Annual Report 2019 [旅游研究院: 中国出境旅游发展年度报告2019]. China Tourism Research Institute. Available online: http://www.pinchain.com/article/198626?from=singlemessage (accessed on 20 September 2019).
- Report of the World Commission on Environment and Development: Our Common Future. Available online: https://sustainabledevelopment.un.org/content/documents/5987our-common-future.pdf (accessed on 18 September 2019).
- UNWTO (World Tourism Organization). Sustainable Development of Tourism Definition. Available online: https://sdt.unwto.org/content/about-us-5 (accessed on 17 May 2019).
- Torres-Delgado, A.; López Palomeque, F. The growth and spread of the concept of sustainable tourism: The contribution of institutional initiatives to tourism policy. Tour. Manag. Perspect. 2012, 4, 1–10. [Google Scholar] [CrossRef]
- Stoddard, J.E.; Pollard, C.E.; Evans, M.R. The Triple Bottom Line: A Framework for Sustainable Tourism Development. Int. J. Hosp. Tour. Adm. 2012, 13, 233–258. [Google Scholar] [CrossRef]
- Isaksson, R.; Garvare, R. Measuring sustainable development using process models. Manag. Audit. J. 2003, 18, 649–656. [Google Scholar] [CrossRef]
- Elkington, J. Cannibals with Forks: Triple Bottom Line of 21st Century Business; John Wiley & Son Ltd.: Hoboken, NJ, USA, 1999; ISBN1 -10: 1841120847. ISBN2 -13: 978-1841120843. [Google Scholar]
- Putnam, R.; Leonardi, R.; Nanetti, R.Y. Making Democracy Work: Civic Traditions in Modern Italy; Princeton University Press: Princeton, NJ, USA, 1994; ISBN 9781400820740. [Google Scholar]
- Dwyer, L. Relevance of triple bottom line reporting to achievement of sustainable tourism: A scoping study. Tour. Rev. Int. 2005, 9, 79–93. [Google Scholar] [CrossRef]
- Sauvante, M. The triple bottom line: A boardroom guide. Dir. Mon. 2001, 25, 1–6. [Google Scholar]
- Onyx, J.; Bullen, P. Measuring social capital in five communities. J. Appl. Behav. Sci. 2000, 36, 23–42. [Google Scholar] [CrossRef]
- Porter, M.; Kramer, M. Strategy & society: The link between competitive advantage and corporate social responsibility. Harv. Bus. Rev. 2006, 12, 78–92. [Google Scholar]
- Barile, S.; Quattrociocchi, B.; Calabrese, M.; Iandolo, F. Sustainability and the Viable Systems Approach: Opportunities and Issues for the Governance of the Territory. Sustainability 2018, 10, 790. [Google Scholar] [CrossRef] [Green Version]
- WTO. Indicators of Sustainable Development for Tourism Destinations: A Guidebook. 2004. Available online: https://www.e-unwto.org/doi/book/10.18111/9789284407262 (accessed on 27 December 2019).
- Bar-On, R.R.V. Seasonality in Tourism: A Guide to the Analysis of Seasonality and Trends for Policy Making. J. Travel Res. 1976, 14, 25. [Google Scholar]
- Allcock, J.B. Seasonality. In Tourism Marketing and Management Handbook; Witt, S.F., Moutinho, L., Eds.; Prentice-Hall: Englewood Cliffs, NJ, USA, 1989; pp. 387–392. [Google Scholar]
- Butler, R.W. Seasonality in tourism: Issues and problems. In Tourism: The State of the Art, 1st ed.; Seaton, A.V., Ed.; Wiley: Chichester, UK, 1994; pp. 332–339. ISBN1 -13: 978-0471950929. ISBN2 -10: 0471950920. [Google Scholar]
- Hartmann, R. Tourism, seasonality and social change. Leis. Stud. 1986, 5, 25–33. [Google Scholar] [CrossRef]
- Baum, T.; Hagen, L. Responses to seasonality: The experiences of peripheral destinations. Int. J. Tour. Res. 1999, 1, 299–312. [Google Scholar] [CrossRef]
- Higham, J.; Hinch, T. Tourism, sport and seasons: The challenges and potential of overcoming seasonality in the sport and tourism sectors. Tour. Manag. 2002, 23, 175–185. [Google Scholar] [CrossRef]
- Hadwen, W.L.; Arthington, A.H.; Boon, P.I.; Taylor, B.; Fellows, C.S. Do Climatic or Institutional Factors Drive Seasonal Patterns of Tourism Visitation to Protected Areas across Diverse Climate Zones in Eastern Australia? Tour. Geogr. 2011, 13, 187–208. [Google Scholar] [CrossRef] [Green Version]
- Duro, J.A.; Turrión-Prats, J. Tourism seasonality worldwide. Tour. Manag. Perspect. 2019, 31, 38–53. [Google Scholar] [CrossRef] [Green Version]
- Butler, R. Seasonality in tourism: Issues and implications. Tour. Rev. 1998, 53, 18–24. [Google Scholar] [CrossRef]
- Jefferson, A. Smoothing out the ups and downs in demand. Br. Hotel. Restaur. 1986, July/Aug., 24–25. [Google Scholar]
- McEnnif, J. Seasonality of tourism demand in the European community. Travel Tour. Anal. 1992, 3, 67–88. [Google Scholar]
- Cooper, C.; Hall, C.M. Contemporary Tourism, 4th ed.; Goodfellows Publishing: Oxford, UK, 2018. [Google Scholar]
- Getz, D.; Nilsson, P.A. Responses of family businesses to extreme seasonality in demand: The case of Bornholm, Denmark. Tour. Manag. 2004, 25, 17–30. [Google Scholar] [CrossRef]
- Krakover, S. Partitioning seasonal employment in the hospitality industry. Tour. Manag. 2000, 21, 461–471. [Google Scholar] [CrossRef]
- Ashworth, J.; Thomas, B. Patterns of seasonality in employment in tourism in the UK. Appl. Econ. Lett. 1999, 6, 735–739. [Google Scholar] [CrossRef]
- Lundmark, L. Mobility, migration and seasonal tourism employment: Evidence from Swedish mountain municipalities. Scand. J. Hosp. Tour. 2006, 6, 197–213. [Google Scholar] [CrossRef]
- Hall, C.M. Second home tourism: An international review. Tour. Rev. Int. 2014, 18, 115–135. [Google Scholar] [CrossRef]
- Simón, F.J.G.; Narangajavana, Y.; Marqués, D.P. Carrying capacity in the tourism industry: A case study of Hengistbury Head. Tour. Manag. 2004, 25, 275–283. [Google Scholar] [CrossRef]
- Deery, M.; Jago, L.; Fredline, L. Rethinking social impacts of tourism research: A new research agenda. Tour. Manag. 2012, 33, 64–73. [Google Scholar] [CrossRef]
- Flognfeldt, T. Long-term positive adjustments to seasonality: Consequences of summer tourism in the Jotunheimen area, Norway. In Seasonality in Tourism; Baum, T., Lundtorp, S., Eds.; Pergamon: Oxford, UK, 2001; pp. 109–117. [Google Scholar]
- Bosnia and Herzegovina Agency for Statistics. Available online: http://bhas.gov.ba/ (accessed on 12 October 2019).
- Ministry of Tourism of Republic of Croatia. Available online: https://mint.gov.hr/ (accessed on 13 October 2019).
- Croatian Bureau of Statistics. Available online: https://www.dzs.hr (accessed on 13 October 2019).
- Statistical Office of Montenegro. Available online: https://www.monstat.org (accessed on 14 October 2019).
- Government of Montenegro. Available online: www.gov.me (accessed on 15 October 2019).
- Republic of North Macedonia State Statistical Office. Available online: http://makstat.stat.gov.mk/ (accessed on 15 October 2019).
- Statistical Office of the Republic of Slovenia. Available online: https://pxweb.stat.si (accessed on 15 October 2019).
- Statistical Office of the Republic of Serbia. Available online: http://data.stat.gov.rs (accessed on 15 October 2019).
- China Tourism Academy. Available online: http://eng.ctaweb.org/ (accessed on 18 October 2019).
- United Nations. Statistics Division. Available online: https://unstats.un.org (accessed on 12 September 2019).
- WTTC (World Travel and Tourism Council). Available online: https://www.wttc.org/datagateway (accessed on 10 September 2019).
- The World Bank. DataBank. Available online: https://databank.worldbank.org/reports.aspx (accessed on 13 October 2019).
- China Tourism Research Institute. Available online: https://china-outbound.com/ (accessed on 18 August 2019).
- World Tourism Organization. UNWTO Tourism Highlights; UNWTO: Madrid, Spain, 2018; ISBN1 978-92-844-1987-6. ISBN2 978-92-844-1986-9. [Google Scholar]
- Bosnia and Herzegovina Agency for Statistics. Tourism Statistics Cumulative Data January–December 2018 [Statistika Turizma Kumulativni Podaci, Januar–Decembar 2018]; Year XI (n.11); Bosnia and Herzegovina Agency for Statistics: Sarajevo, Bosnia and Herzegovina, 7 February 2019. Available online: http://bhas.gov.ba/data/Publikacije/Saopstenja/2019/TUR_02_2018_12_0_BS.pdf (accessed on 21 September 2019).
- Ministry of Tourism of Republic of Croatia. Tourist Traffic for January–December 2018 (Official Data) [Turistički promet Siječanj-Prosinac 2018. Godine (službeni podaci)]. p. 9. Available online: https://mint.gov.hr/UserDocsImages/AA_2018_c-dokumenti/190212_stat2018.pdf (accessed on 21 September 2019).
- MONSTAT Statistical Office of Montenegro. Communication N.33 Arrivals and Overnight Stays of Tourists in Individual Accommodation 2018 [Saopštenje Broj: 33 Dolasci i Noćenja Turista u Individualnom Smještaju 2018]; MONSTAT Statistical Office of Montenegro: Podgorica, Montenegro, 28 February 2019. Available online: https://www.monstat.org/userfiles/file/turizam/ind2018/Dolasci%20i%20no%C4%87enja%20turista%20u%20individualnom%20smje%C5%A1taju%20-%202018.pdf (accessed on 25 September 2019).
- MONSTAT Statistical Office of Montenegro. Monthly Statistical Review n. March 2019 [Mjesečni Statistički Pregled n. 3/2019]; year 67; MONSTAT Statistical Office of Montenegro: Podgorica, Montenegro, March 2019; ISSN 0354-365X. Available online: https://www.monstat.org/userfiles/file/publikacije/2019/3/BILTEN%20BR.%203.pdf (accessed on 25 September 2019).
- MAKSTAT Republic of North Macedonia State Statistical Office. Tourism, News Release, Tourism December 2018; Year LVII, (n. 8.1.19.03); MAKSTAT Republic of North Macedonia State Statistical Office: Skopje, Macedonia, 12 February 2019. Available online: http://www.stat.gov.mk/pdf/2019/8.1.19.03.pdf (accessed on 29 September 2019).
- PBC Statistical Office of the Republic of Serbia. Tourists Arrivals and Overnight Stays by Regions and Areas—Annual Data. 3 July 2019. Available online: http://data.stat.gov.rs/Home/Result/220201?languageCode=en-US (accessed on 29 September 2019).
- Republic of Slovenia Statistical Office. Tourist Arrivals and Overnight Stays by Measures, Tourists and Year. Available online: https://pxweb.stat.si/pxweb/Dialog/viewplus.asp?ma=H069E&ti=&path=../Database/Hitre_Repozitorij/&lang=1 (accessed on 29 September 2019).
- United Nations Statistics Division. Tourism Satellite Account: Recommended Methodological Framework 2008; Studies in Methods Series F No. 80/Rev.1; United Nations Statistics Division (UNSD), Department of Economic and Social Affairs: New York, NY, USA, 2008; ISBN 978-92-1-161520-3. [Google Scholar]
- Bosnia and Herzegovina Agency for Statistics. Gross Domestic Product, by Expenditure Approach Quarterly Data; Year V, (n. I); Bosnia and Herzegovina Agency for Statistics: Sarajevo, Bosnia and Herzegovina, 1 April 2019. Available online: http://bhas.gov.ba/data/Publikacije/Saopstenja/2019/NAC_01_2018_Q4_0_HR.pdf (accessed on 23 September 2019).
- Croatian Bureau of Statistics. Statistical Yearbook of the Republic of Croatia 2018; Year 50; HRV: Zagreb, Croatia, 2018; ISSN 1333-3305. [Google Scholar]
- Croatian Bureau of Statistics. First Quarterly Gross Domestic Product Estimate Fourth Quarter of 2018. First Release, Year LV, (n. 12.1.1/4). 27 February 2019. Available online: https://www.dzs.hr/default_e.htm (accessed on 22 September 2019).
- Government of Montenegro. Program of Economic Reforms for MONTENEGRO, Year 2019–2021 [Program ekonomskih reformi za Crnu Goru, 2019–2021. godina]; Government of Montenegro: Podgorica, Montenegro, December 2018. Available online: www.gov.me/ResourceManager/FileDownload.aspx?rid=342335&rType=2 (accessed on 24 September 2019).
- MAKSTAT Republic of North Macedonia State Statistical Office. News Release, Gross Domestic Product, Fourth Quarter of 2018; Year LVII, (N. 3.1.19.05); MAKSTAT Republic of North Macedonia State Statistical Office: Skopje, Macedonia, 8 March 2019. Available online: http://www.stat.gov.mk/pdf/2019/3.1.19.05.pdf (accessed on 23 September 2019).
- PBC Statistical Office of the Republic of Serbia. Gross Domestic Product, Total and Per Capita. Available online: http://data.stat.gov.rs/Home/Result/09020101?languageCode=en-US (accessed on 23 September 2019).
- PBC Statistical Office of the Republic of Serbia. Quarterly GDP of Republic of Serbia—Fourth Quarter of 2018 [Квартални брутo дoмаћи прoизвoд у Републици Србији—Четврти квартал 2018. гoдине]; year LXIX, (N. 053); CPБ053 HP40 010319; PBC Statistical Office of the Republic of Serbia: Belgrade, Serbia, 2019; ISSN 0353-9555.
- Republic of Slovenia Statistical Office. Gross Domestic Product, Other Aggregates of National Accounts and Employment, Slovenia, 2017. 31 August 2018. Available online: https://www.stat.si/StatWeb/en/News/Index/7625 (accessed on 23 September 2019).
- Republic of Slovenia Statistical Office. Gross Domestic Product, Slovenia, 4th Quarter 2018. 28 February 2019. Available online: https://www.stat.si/StatWeb/en/News/Index/7966 (accessed on 23 September 2019).
- WTTC Data Gateway. Bosnia and Herzegovina Total Contribution to GDP. Available online: https://www.wttc.org/datagateway (accessed on 10 July 2019).
- Ministry of Tourism of Republic of Croatia. Tourism in Numbers 2017 [Turizam u Brojkama 2017]; HRV: Zagreb, Croatia, 2018.
- Ministry of Tourism of Republic of Croatia. Tourism in Numbers 2018 [Turizam u Brojkama 2018]; HRV: Zagreb, Croatia, 2019.
- WTTC Data Gateway. Montenegro Total Contribution to GDP. Available online: https://www.wttc.org/datagateway (accessed on 12 July 2019).
- WTTC Data Gateway. North Macedonia Total Impact on GDP. Available online: https://www.wttc.org/datagateway (accessed on 12 July 2019).
- WTTC Data Gateway. Serbia Total Impact on GDP. Available online: https://www.wttc.org/datagateway (accessed on 12 July 2019).
- WTTC Data Gateway. Slovenia Total Impact on GDP. Available online: https://www.wttc.org/datagateway (accessed on 12 July 2019).
- WTTC. Travel & Tourism City Travel & Tourism Impact 2018; WTTC: London, UK, 2018. [Google Scholar]
- Bosnia and Herzegovina Agency for Statistics. Bosnia and Herzegovina in Numbers 2018 [Bosna i Hercegovina u Brojevima 2018]; Bosnia and Herzegovina Agency for Statistics: Sarajevo, Bosnia and Herzegovina, 2019; ISSN 1986-8510.
- Croatian Bureau of Statistics. Croatia in Figures 2018; HRV: Zagreb, Croatia, 2018; ISSN 1848-6673. [Google Scholar]
- MONSTAT Statistical Office of Montenegro. Montenegro in Figures 2017 [Crna Gora u Brojkama 2017]; MONSTAT Statistical Office of Montenegro: Podgorica, Montenegro, 2017; ISBN 978-86-85581-58-8. COBISS.CG-ID 34524944.
- MAKSTAT Republic of North Macedonia State Statistical Office. North Macedonia in Figures 2019; MAKSTAT Republic of North Macedonia State Statistical Office: Skopje, Macedonia, 2019; ISSN 1409-665X.
- PBC Statistical Office of the Republic of Serbia. Statistical Yearbook 2018; PBC Statistical Office of the Republic of Serbia: Belgrade, Serbia, 2018; ISSN 0354-4206.
- Republic of Slovenia Statistical Office. Stat’o’book Statistical Overview of Slovenia 2016; Republic of Slovenia Statistical Office: Ljubljana, Slovenia, 2016; ISSN 2385-9334. [Google Scholar]
- The World Bank. Population Estimates and Projections, Total Population for Bosnia and Herzegovina, 2017–2018. Available online: https://databank.worldbank.org/reports.aspx?source=Health%20Nutrition%20and%20Population%20Statistics:%20Population%20estimates%20and%20projections (accessed on 24 September 2019).
- The World Bank. Population Estimates and Projections, Total Population for Croatia, 2017–2018. Available online: https://databank.worldbank.org/reports.aspx?source=Health%20Nutrition%20and%20Population%20Statistics:%20Population%20estimates%20and%20projections (accessed on 24 September 2019).
- The World Bank. Population Estimates and Projections, Total Population for Montenegro, 2017–2018. Available online: https://databank.worldbank.org/reports.aspx?source=Health%20Nutrition%20and%20Population%20Statistics:%20Population%20estimates%20and%20projections# (accessed on 24 September 2019).
- The World Bank. Population Estimates and Projections, Total Population for North Macedonia, 2017–2018. Available online: https://databank.worldbank.org/reports.aspx?source=Health%20Nutrition%20and%20Population%20Statistics:%20Population%20estimates%20and%20projections# (accessed on 23 September 2019).
- The World Bank. Population Estimates and Projections, Total Population for Serbia, 2017–2018. Available online: https://databank.worldbank.org/reports.aspx?source=Health%20Nutrition%20and%20Population%20Statistics:%20Population%20estimates%20and%20projections# (accessed on 23 September 2019).
- Republic of Slovenia Statistical Office. Population by Groups and Sex, Slovenia 2017–2018. Available online: https://www.stat.si/StatWeb/en/News/Index/8062 (accessed on 23 September 2019).
- World Travel & Tourism Council Data Gateway. Bosnia and Herzegovina, Total Contribution to Employment. Available online: https://www.wttc.org/datagateway (accessed on 10 July 2019).
- World Travel & Tourism Council Data Gateway. Croatia, Total Contribution to Employment. Available online: https://www.wttc.org/datagateway (accessed on 10 July 2019).
- World Travel & Tourism Council Data Gateway. Montenegro, Total Contribution to Employment. Available online: https://www.wttc.org/datagateway (accessed on 10 June 2019).
- World Travel & Tourism Council Data Gateway. North Macedonia, Total Contribution to Employment. Available online: https://www.wttc.org/datagateway (accessed on 10 June 2019).
- World Travel & Tourism Council Data Gateway. Serbia, Total Contribution to Employment. Available online: https://www.wttc.org/datagateway (accessed on 10 June 2019).
- World Travel & Tourism Council Data Gateway. Slovenia, Total Contribution to Employment. Available online: https://www.wttc.org/datagateway (accessed on 14 June 2019).
- Ministry of Tourism of Republic of Croatia. Tourism in Numbers 2016 [Turizam u Brojkama 2016]; HRV: Zagreb, Croatia, 2017.
- Bosnia and Herzegovina Agency for Statistics. Tourism Statistics in BiH December 2016 [Statistika Turizma u BiH Decembar 2016]; Year X, (n. 12); Bosnia and Herzegovina Agency for Statistics: Sarajevo, Bosnia and Herzegovina, 20 February 2017.
- Bosnia and Herzegovina Agency for Statistics. Tourism Statistics in BiH December 2017 [Statistika Turizma u BiH Decembar 2017]; Year X, (n. 12); Bosnia and Herzegovina Agency for Statistics: Sarajevo, Bosnia and Herzegovina, 5 February 2018.
- Bosnia and Herzegovina Agency for Statistics. Tourism Statistics in BiH December 2018 [Statistika Turizma u BiH, Decembar 2018]; Year XII, (n. 12); Bosnia and Herzegovina Agency for Statistics: Sarajevo, Bosnia and Herzegovina, 5 May 2019.
- MONSTAT Statistical Office of Montenegro. Arrivals and Overnight Stay of Tourists December Year 2016 [Dolasci i Noćenja Turista Decembar 2016 godina]; (n. 11); MONSTAT Statistical Office of Montenegro: Podgorica, Montenegro, 31 January 2017.
- MONSTAT Statistical Office of Montenegro. Research on Arrivals and Overnight Stay of Tourists, Total Year 2017 [Istraživanje o Dolascima i Noćenjima Turista, Ukupno, 2017. godina]; (n. 34/2); MONSTAT Statistical Office of Montenegro: Podgorica, Montenegro, 1 June 2018.
- MONSTAT Statistical Office of Montenegro. Research on Arrivals and Overnight Stay of Tourists, Total Year 2018 [Istraživanje o Dolascima i Noćenjima Turista, Ukupno, 2018. godina]; (n. 34/2); MONSTAT Statistical Office of Montenegro: Podgorica, Montenegro, 3 June 2019.
- MAKSTAT Republic of North Macedonia State Statistical Office. Tourist Arrivals and Tourist Nights Spent, by Years and Months 2016–2018. Available online: http://makstat.stat.gov.mk/PXWeb/sq/8f71e57c-4e84-418a-84c5-c239a2368857 (accessed on 20 July 2019).
- PBC Statistical Office of the Republic of Serbia. Tourists, Arrivals and Overnight Stays by Regions—Monthly Data. Available online: http://data.stat.gov.rs/Home/Result/220203?languageCode=sr-Latn&displayMode=table&guid=79a2f1cc-663a-4ef0-9a1a-b5954b43e746 (accessed on 20 July 2019).
- Republic of Slovenia Statistical Office. Tourist, Arrivals and Overnight Stays by Month, Groups of Tourist Accommodation Establishments and Measures. Available online: https://pxweb.stat.si (accessed on 20 July 2019).
- World Tourism Cities Federation. Market Research Report on Chinese Outbound Tourist (City) Consumption (2017–2018); IPSOS: Paris, France, 2018. [Google Scholar]
- Oxford Economics for Intercontinental Hotels Group. The Future of Chinese Travel: The Global Chinese Travel Market. A Report by Oxford Economics for InterContinental Hotels Group. 2014. Available online: www.ihgplc.com/chinesetravel/src/pdf/IHG_Future_Chinese_Travel.pdf (accessed on 14 December 2018).
- Mejia, C.; Wei, W.; Fu, X.; Hua, N.; Wang, Y. Hospitality and tourism experts’ perspectives on Chinese independent tourists’ U.S. service expectations through a mobilities lens. Int. J. Tour. Res. 2018, 20, 726–737. [Google Scholar] [CrossRef]
- Van der Linden, L. Trends in Hospitality and the Leisure Industry: How Social Welfare and Spending Power Influence Holiday Trends. In Educational Strategies for the Next Generation Leaders in Hotel Management; Feng, J., Stocklin, S., Wang, W., Eds.; IGI Global: Harrisburg, PA, USA, 2015; pp. 1–15. [Google Scholar]
- Resonance. 2016 Future of Luxury Travel Report. Available online: http://media.resonanceco.com/uploads/2018/08/2016-Future-of-Luxury-Travel-Report.pdf (accessed on 15 September 2019).
- Australian Government. Chinese Free and Independent Travellers—Their Potential for Regional Australia, Tourism Research Australia. March 2019. Available online: https://www.tra.gov.au/ArticleDocuments/317/CHINESE%20FITS%20-%20THEIR%20POTENTIAL%20FOR%20REGIONAL%20AUSTRALIA,%20FULL%20REPORT%20MARCH%202019.pdf.aspx (accessed on 15 October 2019).
- Needham, K. Australian Government to Spend Millions Attracting Chinese Tourists. The Sydney Morning Herald. 6 March 2019. Available online: https://www.smh.com.au/world/asia/australian-government-to-spend-millions-attracting-chinese-tourists-20190306-p5120g.html (accessed on 15 October 2019).
- The Nordics. Chinese Market Segment: High Spending FITs, Opportunities and Challenges for Nordic Destinations. May 2018. Available online: http://www.tourismstat.gl/resources/reports/en/r23/Chinese_Market_Opportunities_and_Challenges_07082018.pdf (accessed on 17 October 2019).
- Jason, C. The Ski Instructors One Swiss Town Uses to Lure Chinese Visitors. 17 January 2014. Available online: https://skift.com/2014/01/17/the-ski-instructors-one-swiss-town-uses-to-lure-chinese-visitors/ (accessed on 17 October 2019).
- Louise, H. Winter Sports: Pivotal part of the ‘China Dream’. One two ski. 12 January 2017. Available online: http://onetwoski.blogspot.com/2017/01/winter-sports-pivotal-part-of-china.html (accessed on 17 October 2019).
- Lucy, A. First British ski School to Open in China. The Telegraph. 2 December 2016. Available online: https://www.telegraph.co.uk/travel/ski/news/first-british-ski-school-to-open-in-china/ (accessed on 17 October 2019).
- Tourism Association Federation of BiH. Bosnia and Herzegovina, the Heart Shaped Land. Available online: http://www.bhtourism.ba/eng/tourismattractions.wbsp (accessed on 25 December 2019).
- Croatian National Tourist Board. Croatia Full of Life. Available online: http://croatia.hr/en-GB (accessed on 25 December 2019).
- National Tourism Organisation of Montenegro. Montenegro Wild Beauty. Available online: https://montenegro.travel/en (accessed on 25 December 2019).
- Republic of North Macedonia Agency for Promotion and Support of Tourism. Macedonia Timeless. Available online: http://exploringmacedonia.com/home.nspx (accessed on 25 December 2019).
- National Tourism Organization of Serbia, Serbia. Available online: http://www.serbia.travel/home.779.html (accessed on 25 December 2019).
- Slovenian Tourist Board. I Feel Slovenia. Available online: https://www.slovenia.info/en (accessed on 25 December 2019).
© 2020 by the authors. Licensee MDPI, Basel, Switzerland. This article is an open access article distributed under the terms and conditions of the Creative Commons Attribution (CC BY) license (http://creativecommons.org/licenses/by/4.0/).