1. Introduction
Waste management can be characterized as the strongest common threat that all countries are facing worldwide. Regardless of its content/composition, directly or not, waste is one of the greatest challenges of the urban world [
1]. Although until recently urban solid waste was not considered to be a problem, nowadays more and more countries around the world develop waste management strategies, studies, and projects [
2].
The world population is constantly growing, while lifestyles and trends are changing rapidly. As such, the increasing quantities of municipal waste is a key issue in modern cities worldwide, and one of the major challenges for municipalities is the collection, recycling, treatment, and disposal of solid waste [
3]. It should be highlighted that in the European Union (EU), the “Waste Framework” Directive [
4] and the “Landfill Directive” [
5] are setting the regulatory framework within which member states should adopt more environmentally friendly options, based on the “Waste Hierarchy” concept [
4,
6], which prioritizes the waste management concepts of reduce, reuse, recycling/compost, and energy recovery from waste, thereby aiming at waste prevention and landfill minimization [
4,
6]. As a result, over the last two decades, the political emphasis on municipal waste is very high in all European countries, despite the fact that municipal waste represents only 10% of the total waste generated in the EU [
7]. The different waste policies set various targets at the EU level concerning the management of certain types of waste. For instance, in 2015, the European Commission recommended new objectives for municipal waste of 60% recycling and preparing for reuse by 2025 and 65% by 2030 [
8].
Waste generation as well as waste management options are different for each European country, and are dependent on various factors, such as: (i) economic growth, (ii) population density, (iii) consumer behavior, or (iv) existing waste management facilities [
4]. Data on municipal waste have been collected by Eurostat since 1995 and are widely used for comparing and getting information about municipal waste generation and treatment across EU countries. According to these data, the total municipal waste generation in EU countries declined approximately 5.4% from 2005 to 2017. However,
Figure 1 illustrates that in 21 of the 31 countries (Member States and EFTA), the volume of municipal waste generated per capita increased from 1995 to 2017. Based on 1995 and 2017 data, the highest average annual growth rates were recorded for Greece and Latvia (both 2.3%), as well as Malta (2.0%) and Denmark (1.9%). On the other hand, Bulgaria has the largest reduction, with an annual average decrease of −2.3%, followed by Slovenia (−1.1%) and Romania (−1.0%) [
9].
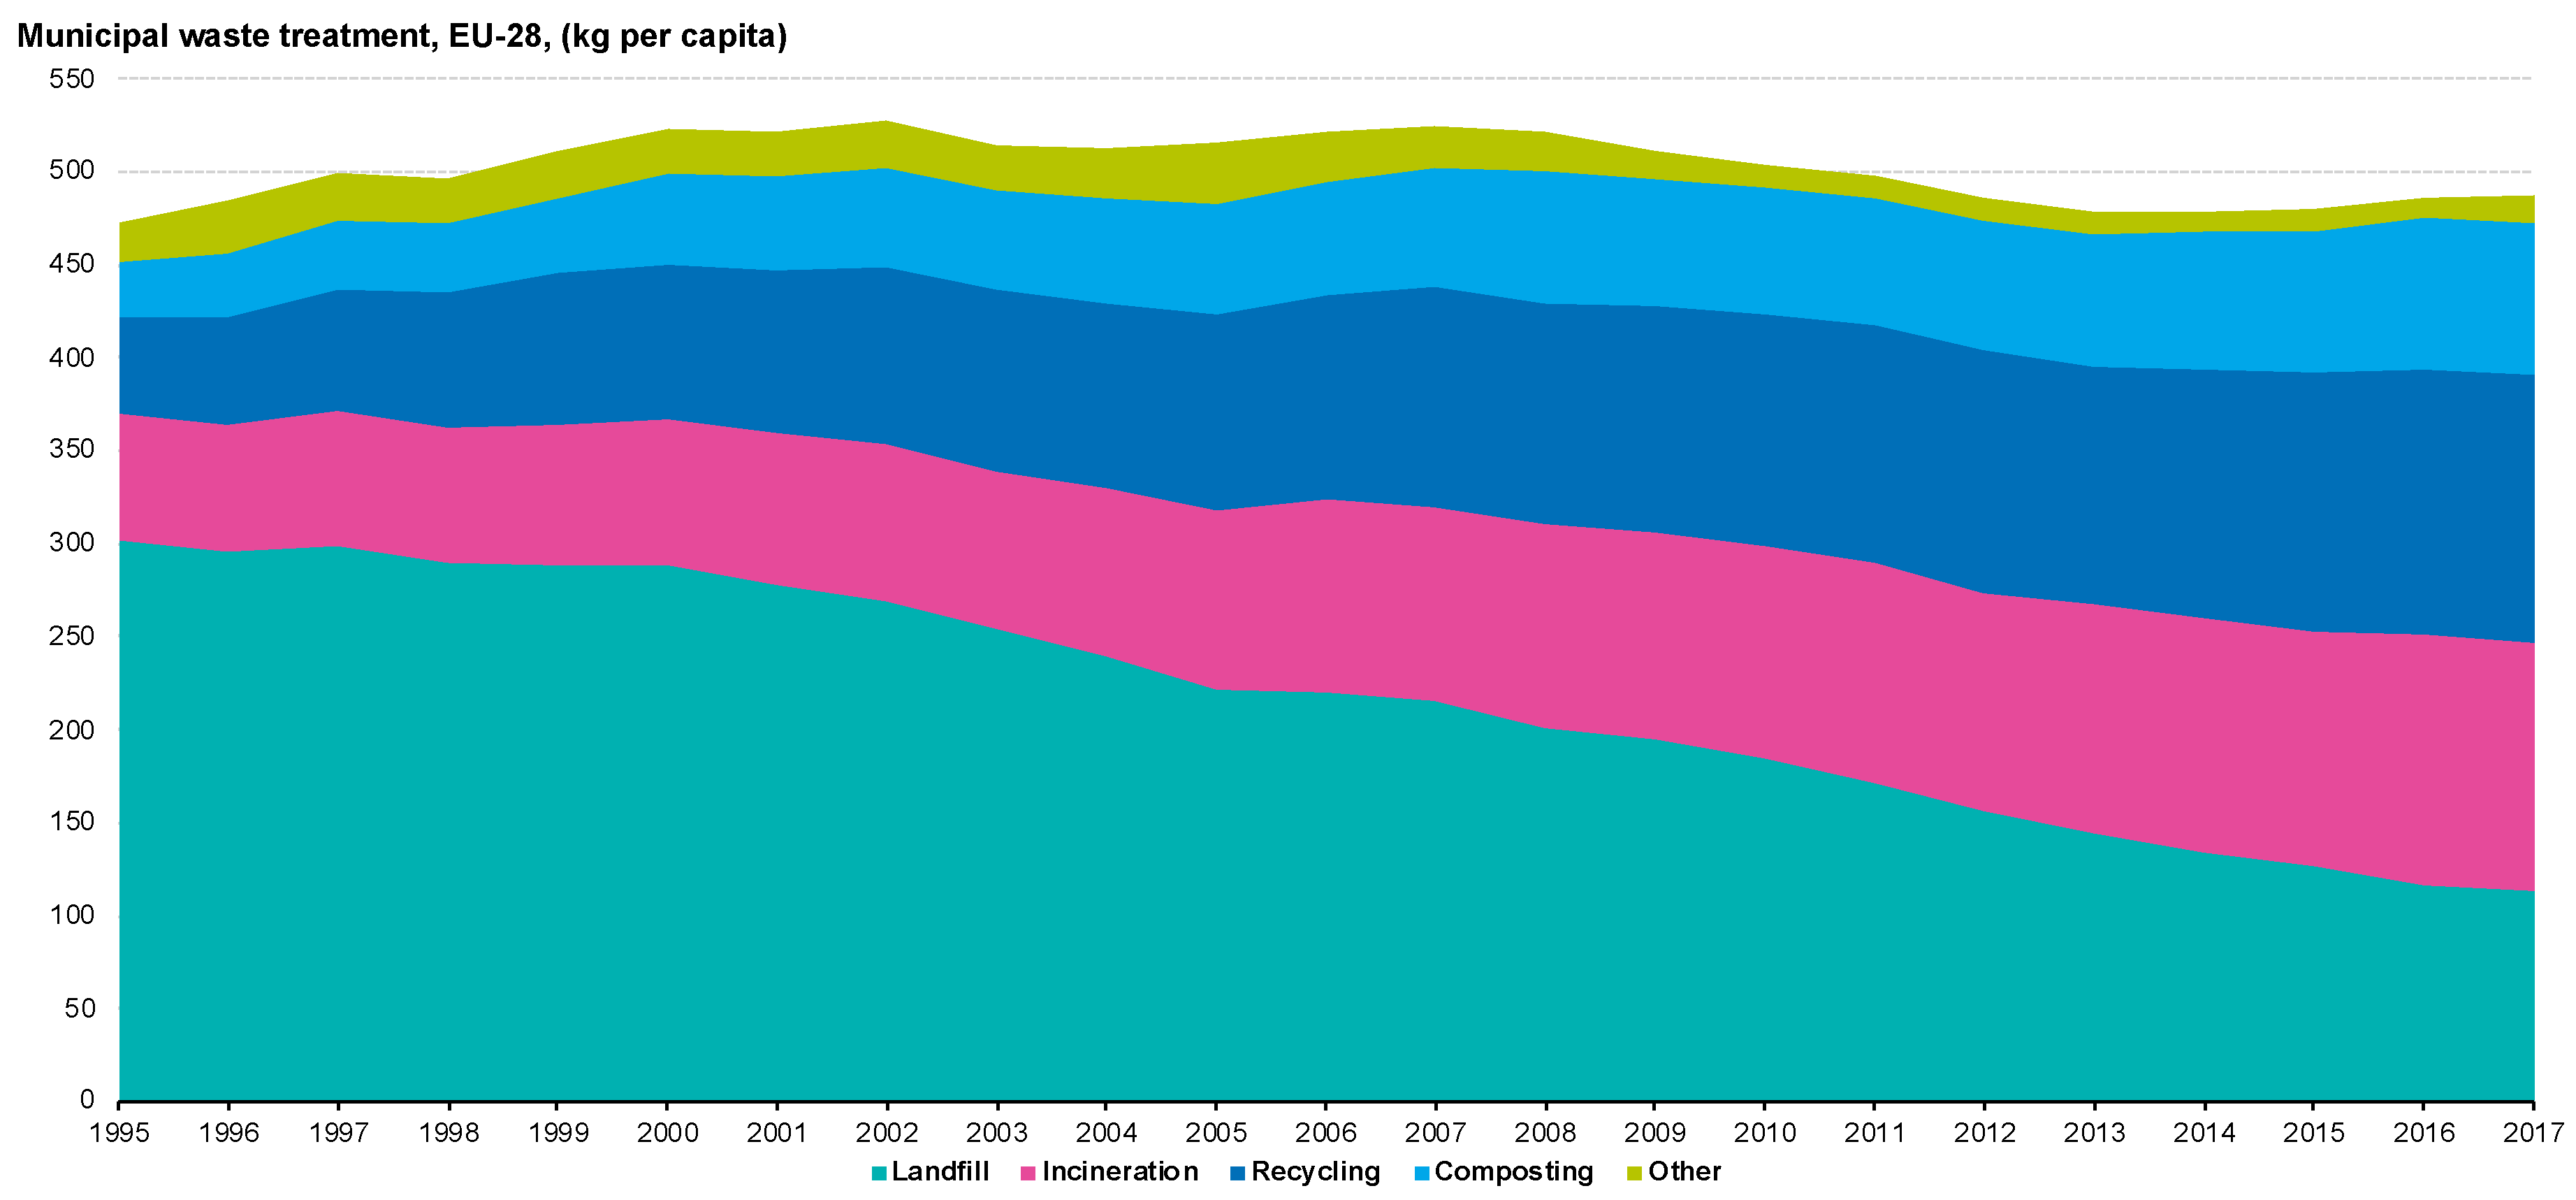
With respect to the management of municipal waste and specific treatment strategies,
Figure 2 presents the total amount of waste generated in the European Union (EU-27) for the period from 1995 to 2017 and the amount of waste by treatment category. More specifically, during the last 20 years, the total municipal waste landfilled in the EU-28 decreased by 60 %, from 145 million tons in 1995 to 58 million tons in 2017. In the period between 2005 and 2017, landfilling has diminished by as much as 5.3 % per year on average, and thus the landfilling rate compared with municipal waste generation dropped from 64% in 1995 to 23% in 2017. Besides that, the amount of waste recycled increased from 25 million tons in 1995 to 74 million tons in 2017 at an average annual rate of 5.1%, and the recovery of organic material by composting has also risen, with an average annual rate of 5.2% for the same period. Waste incineration has also increased. Since 1995, the amount of municipal waste incinerated in the EU-28 has risen by 34 million tons and accounted for 68 million tons in 2017. Nevertheless, mechanical biological treatment (MBT) and the sorting of waste are not covered directly as categories in the relative reporting of municipal waste treatment [
9].
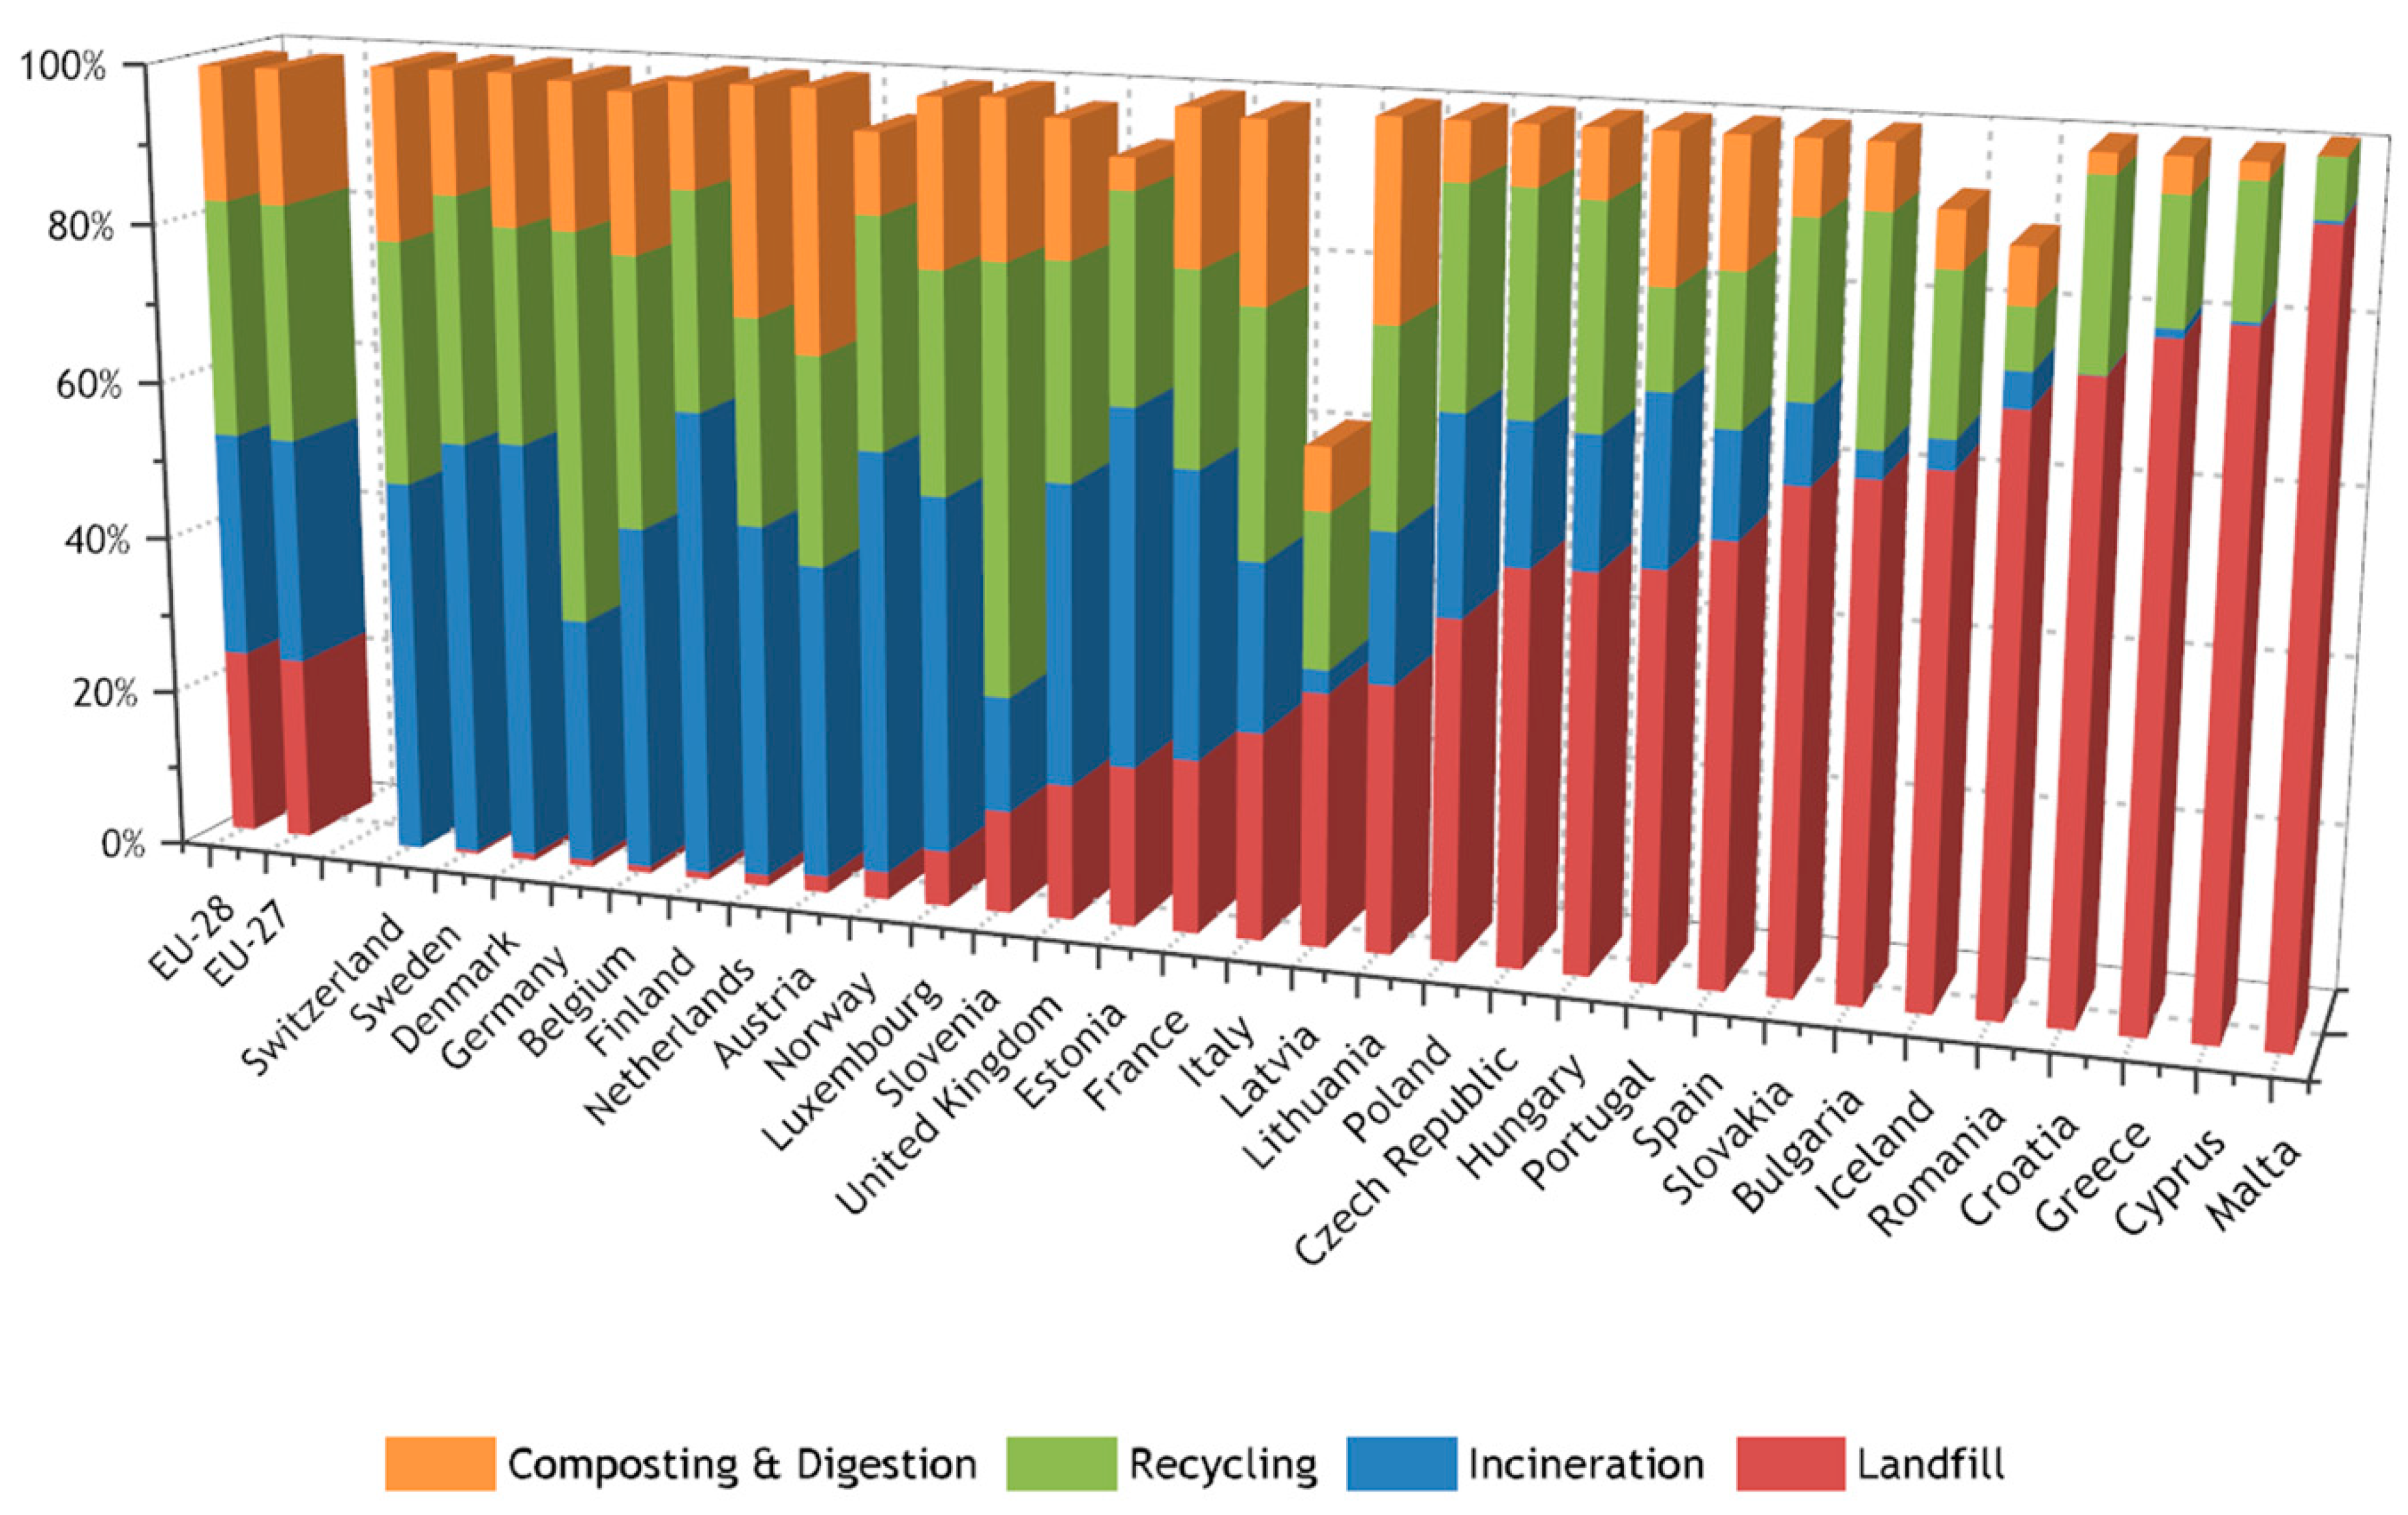
It should be noticed that the overall waste management systems differ significantly among EU countries. More specifically,
Figure 3 depicts the volume of municipal waste landfilled, incinerated, recycled, and composted in 2016 as a percentage of the total waste treated. Some countries have significantly reduced their landfill rates (sometimes below 5%) by adopting sophisticated and modern waste management schemes, taking into consideration the most preferable principles that the “Waste Hierarchy” concept promotes. Indicatively, it should be noted that Switzerland, Germany, and Sweden demonstrate a near to zero (0%) percentage of landfill rate, whereas the same rate for Belgium, Denmark, Netherland, Austria, Finland, and Norway is below 5%. In contrast, for the majority of the EU countries, landfilling is the basic treatment method for more than 50% of the total municipal waste treated. Last but not least, it should be underlined that Malta and Greece have the highest landfill rates in the EU, with 92% and 82% of the total waste production, to be disposed of in landfills, respectively, while Latvia, Croatia, and Cyprus also predominantly employ the same bad waste management performance regarding the landfill of waste (i.e., landfill rate above 70%) [
9].
Consequently, there has been a growing interest in the sustainable management of Municipal Solid Waste (MSW), which covers: (i) generation, (ii) collection, (iii) transfer, (iv) sorting, (v) treatment, (vi) recovery, and (vii) disposal of waste. On the above basis, significant research has been performed on integrated MSW management systems, which include various options like materials recycling, biological treatment of biodegradable fractions, composting, or thermal treatments with energy recovery. The literature review on MSW management revealed a variety of examples on the approaches used by EU countries. Several publications have appeared evaluating various MSW management strategies at the local, regional, and national level. Different practices on waste management have been reviewed for countries such as Germany, Denmark, Greece and other European countries [
10,
11]; for regions: Lombardia, Italy [
12]; and for cities: (i) Niš, Serbia [
13], (ii) Porto, Portugal [
14], (iii) Naples, Italy [
15].
Within this context, Life Cycle Assessment (LCA) methodologies and tools are increasingly used in MSW management, as they offer a very efficient and useful tool which effectively supports the decision-making of a waste management policy by evaluating and comparing the environmental impacts of the various waste management systems, schemes, and practices. It should be underlined that LCA is an assessment method, which can be applied to determine the entire environmental impact of a product or system over its entire life. Since 1995, LCA has been used for the evaluation of waste management practices, and the implementation of the ISO 14044 standards for LCA methodology globally, as well as the introduction of the EU Waste Framework Directive [
4], led to an increase of LCA applications in MSW management sector after 2008 [
16]. Moreover, previous research on the evaluation methods used on waste management sector had demonstrated that around 40% of reviewed articles are LCA-based [
13]. Thus, in recent years, the utilization of LCA methodologies and tools has become very popular, as several publications have been introduced, documenting LCA use for the evaluation of various scenarios of MSW management practices in a wide range of countries across Europe. Indicatively, there are various publications that include Serbia [
13], Spain [
17,
18,
19], Portugal [
14], Italy [
3,
15,
20], UK [
21,
22], Norway [
23], Sweden [
24], Denmark [
10,
25].
However, a limited number of publications that discuss the issue of MSW management in Greece has been reported in the literature, despite the fact that the Waste Framework Directive is poorly implemented, with the country being penalized by the European Court of Justice since 2005. It should be noticed that trends and patterns of solid waste generation and waste composition [
26], the challenges of waste management [
27], and the dynamics, comparison, and evaluation of waste policies and treatment [
28,
29,
30,
31] have been reviewed for the city of Thessaloniki. Nevertheless, most of the past studies do not take into account the revised Regional Waste Management Plan (RWMP) for the Region of Central Macedonia (RCM).
The current RWMP of the Region of Central Macedonia [
32] was revised and an optimal waste management plan has been introduced in the RCM. The latter RWMP focuses both on the significant minimization of the generated waste and on maximizing the reuse and recycling rate at more than 50% of the total MSW. Furthermore, the implementation of waste treatment practices that include energy recovery is recommended, while landfill should be limited to less than 30% of the total MSW produced, and considered only as the final and less preferable (environmentally sound) waste treatment option. On this basis, the development of an optimal waste management strategy is more than urgent and of critical importance in the RCM. The current study focuses both on the environmental impacts caused by the existing waste management scheme in the RCM and the comparison of specific alternative scenarios regarding MSW management in the RCM. An LCA approach is adopted to benchmark the alternative waste management practices on the basis of specific environmental key performance indicators that were considered important for the environment and human health.
2. Materials and Methods
2.1. Conceptualization
The goal of this study is to analyze and compare different MSW management strategies that can be effectively implemented in the RCM from an environmental point of view. Therefore, different waste management treatment practices (WMTP) were investigated and specific alternative MSW management systems were compared [
33]. More specifically, four (4) alternative scenarios have been introduced and compared regarding the management of the MSW generated in the RCM. Each scenario consists of (i) the storage and collection of the MSW in bins, (ii) the usage of both mixed bins and those for separately sorting recyclable fractions at the source, (iii) the gathering of municipal waste and its transport by collection vehicles to the Waste Transfer Stations (WTS). Moreover, the proposed alternative WMTP include the main available treatment in each scenario, such as the mechanical separation of the waste, recycling or composting, and the final disposal of the residues of those processes in a landfill site. The LCA methodology was utilized in order to holistically evaluate the optimal MSW management system. The application of LCA was carried out with the use of SimaPro software [
34], which enables the evaluation of environmental impacts for all alternatives scenarios for the WMTP with the use of specific environmental impact indicators that will be further analyzed in the following sections.
Within the framework of this study, the functional unit is defined as the reference flow. More specifically, this is the whole amount of MSW generated in the RCM over a period of one year. The option to use the entire amount of waste produced as a functional unit may limit the ability to draw general conclusions for regions and municipalities. However, it was considered more relevant than to select a standard unit, like 1 ton of waste, since the current study attempts to define the current status of waste management in the RCM.
The system under examination is defined as an integrated waste management scheme for 842,490 tons of MW. The system boundaries involve the final stage of the life cycle of the waste generated in the RCM. More specifically, the system boundaries include all processes from the stage of waste collection until it leaves the system as an impact—either as an emission or as a secondary raw material, biogas, or energy (
Figure 4). MW enters the system after being discarded either as mixed waste or as source-segregated streams which are separately collected. The system covers waste collection from bins, transport, mechanical separation (when available), recycling, or other waste treatment (composting, MBT, incineration), depending on each scenario, and finally disposal in a landfill. It should be highlighted that, within the system boundaries, besides the main treatment of MSW, both the required fuels for the transport and the energy for the operation and construction of all required facilities are included.
In the inventory analysis, most of the data used in order to model the various processes, such as recycling, waste composting and energy recovery, are primary, since they were obtained from the RWMP [
32]. In many case, however, in order to export valid results, waste treatment techniques included in the SimaPro software [
34] were performed, given the lack of information regarding the management practices.
2.2. Municipal Solid Waste Management in the Region of Central Macedonia
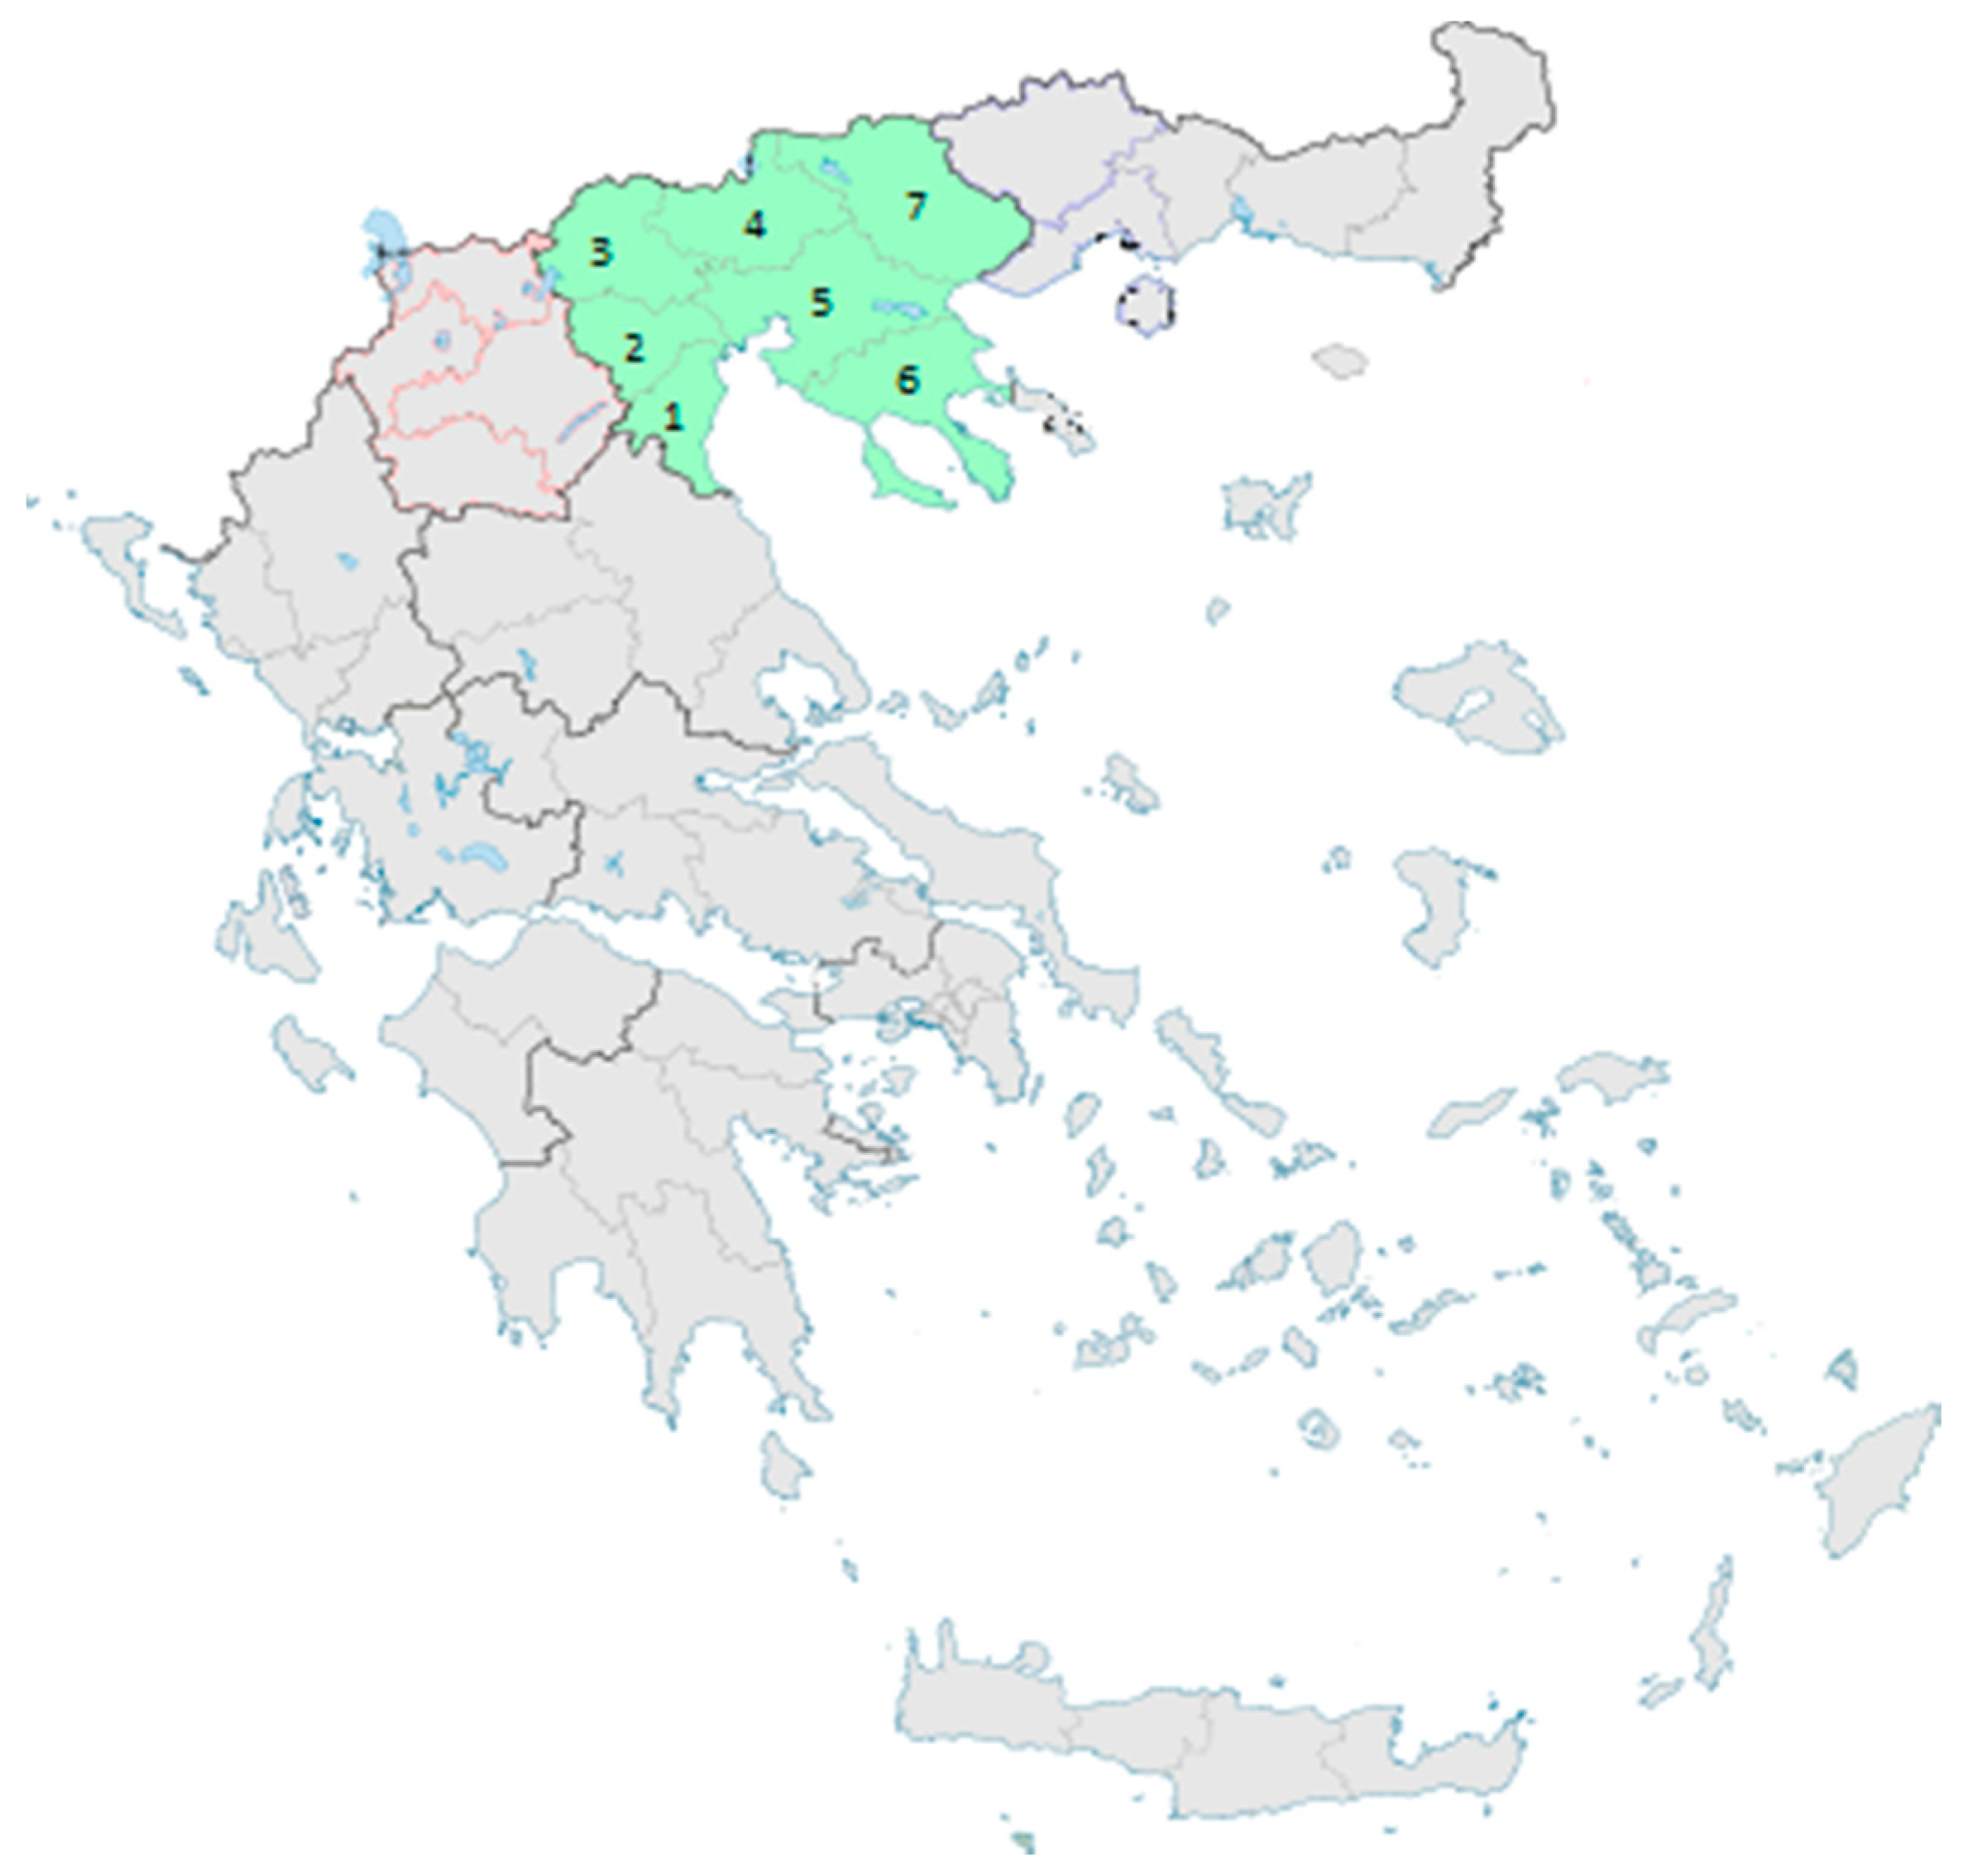
Greece consists of 13 administrative regions, which are further subdivided into 54 prefectures. This paper is focused on the management of MSW in the RCM (seven (7) distinct prefectures), which is located in North Greece and consists of the central part of the geographical region of Macedonia (
Figure 5). The region has the largest surface area (18,811km
2) among all regions, and it is divided into seven prefectures: Thessaloniki, Imathia, Pella, Kilkis, Pieria, Serres, and Chalkidiki. Additionally, it is the second most populous region after Attica (1,882,108 habitats), with intense urbanization and a high density of inhabitation, especially in Thessaloniki and its metropolitan area, which is the capital of the RCM [
32].
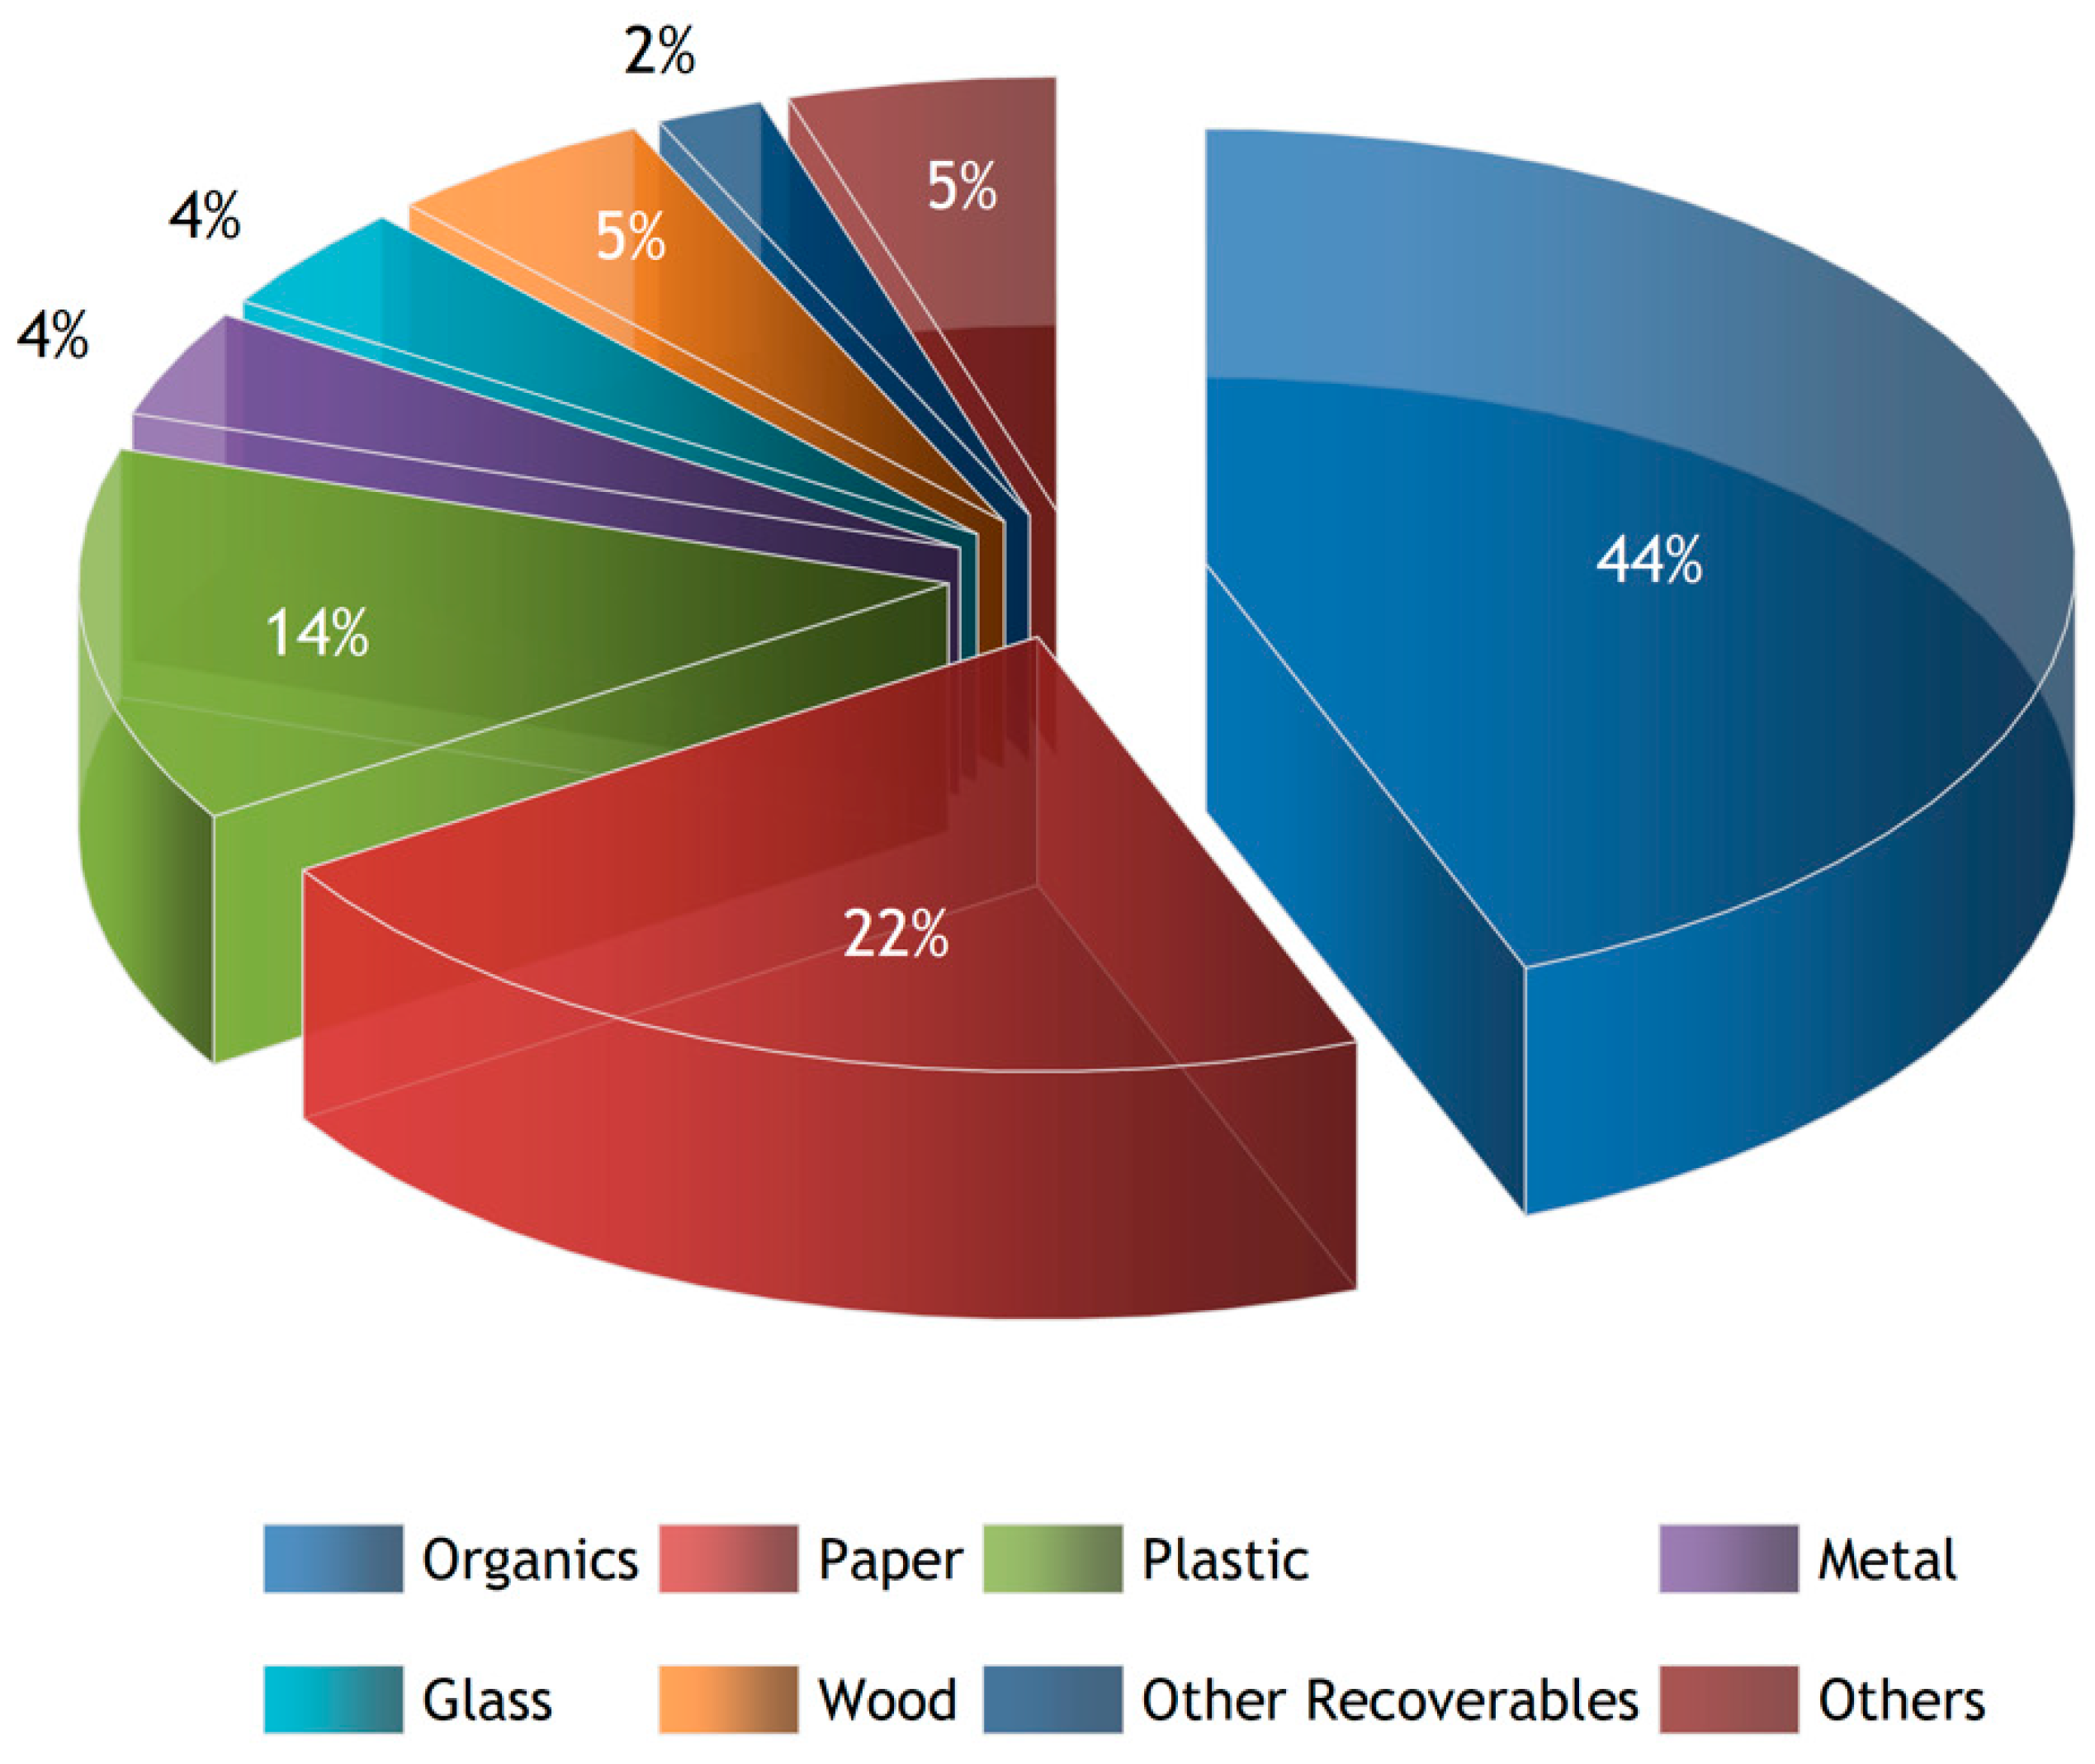
In the RCM in 2014, 842,490 tons/year of waste were generated, according to the up-to-date Regional Waste Management Plan (RWMP) [
32], of which 82% ended up in sanitary landfills. In general, the composition of MSW depends on the socioeconomic conditions and the various consumption patterns in the RCM. However, within the context of this study, a typical average composition of the waste was used, in accordance with the data available in the RWMP. The fractions of MSW included in the study are: (i) total amount of household organics, (ii) paper, (iii) plastic, (iv) metals, (v) glass, (vi) wood, (vii) other recoverable such as batteries and household appliances, as well as other unclassified materials, including hazardous waste like textiles, inks, medicine. The composition of the total MSW in the RCM is illustrated in
Figure 6.
According to the RWMP, except for the sorting of packaging waste at the source and some other streams, such as batteries and Waste Electrical and Electronic Equipment (WEEE), all the MSW of the RCM is disposed of in landfills [
35,
36]. More specifically, 82% of MSW is disposed of directly in landfills, whereas only 12% is sorted at the source. RCM still has not implemented a specific MSW system including advanced waste treatment methods. The RCM’s waste management policy involves mainly the collection and disposal of waste in the landfill. The current situation in the prefectures of the region is the following: initially, municipal waste temporarily stored into bins or containers is collected by a public company using waste collection vehicles and then transported to Waste Transfer Stations (WTSs). Furthermore, waste streams such as (i) paper, (ii) glass, and (iii) packaging waste are separately collected in recyclable bins, and vehicles dedicated to waste management transport them to Material Recycling Facilities (MRFs) (RWMP, 2016) [
32].
With respect to bio-waste, no specific collection waste management practices are implemented in the RCM, with the exception of its diversion in rural areas for the purpose of animal feeding and on-site composting, as well as pilot composting programs and programs for the collection of cooking oil and grease waste in some schools of the region, that send it to a recycling company which turns them into biodiesel. Moreover, in almost all municipalities of RCM, WEEE is collected by private companies and transferred to processing plants. Bulky waste is collected by the municipalities’ departments dedicated to waste management. In the majority of the municipalities of the RCM, after the collection, the bio-waste stream is directed mainly (directly or after shredding) for disposal in landfills or dispatched to private companies. Similarly, the waste management stream of garden waste includes the segregation and disposal in landfills, since in most of the municipalities of the RCM there is no organized system for the collection and management of green waste [
32].
2.3. Waste Management Scenarios
To efficiently and effectively examine and outline the benefits and drawbacks of the proposed practices used on MSW management, diverse MSW strategies have been analyzed. The differentiation of the proposed strategies is based on the variations of the waste flows in comparison to the different waste control methods, such as landfill, recycling, composting, and others. With the core of conventional waste treatment methods and the final disposal in landfills, the different proposed waste management practices focusing on reusing and recycling most of the MSW, as well as on energy recovery, are the following:
Scenario 0: the main treatment of this scenario is landfilling without energy recovery;
Scenario I: the main treatment of this scenario is landfill with energy recovery, as well as a small percentages of recycling of specific MSW fractions;
Scenario II: the main waste treatment of this scenario is recycling and material recovery, thus incorporating the future targets that must be completed according to the European Directive;
Scenario III: the main treatment of this scenario is also recycling, but it also allows for the incineration of residual waste with energy recovery.
Scenario 0, landfilling, was until recently the most common waste management treatment practice in Greece [
6,
7,
37]. It assumes that all the MSW generated is collected and transferred to the WTS. Then, the MSW is disposed of in regional landfill sites, where it is placed with no energy recovery taking place and without any process of separation of the produced waste (
Figure 7).
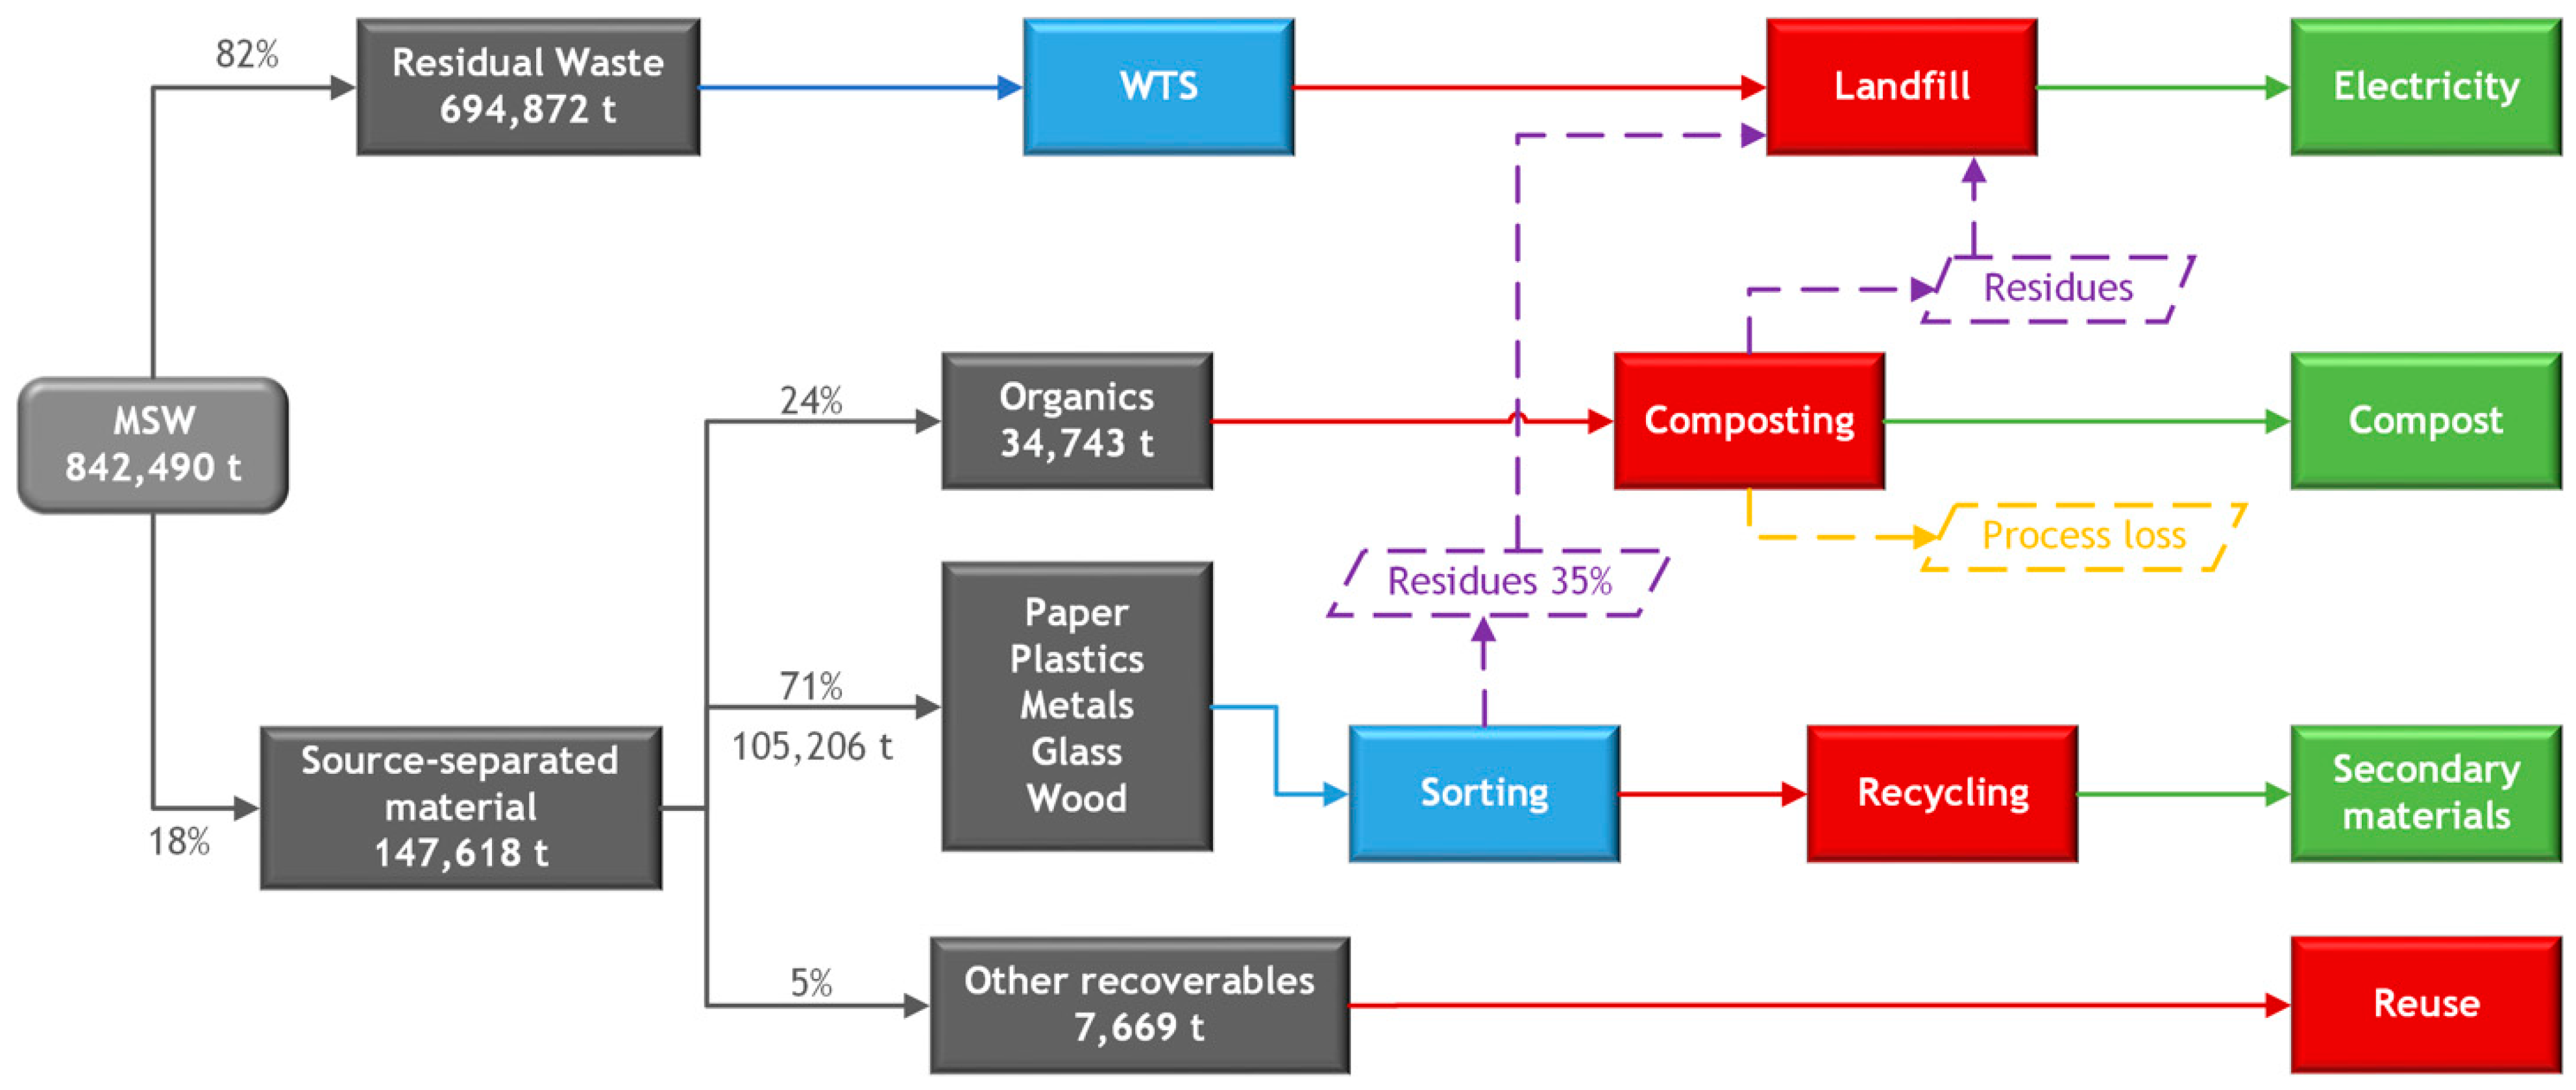
Scenario I models the basic scenario that corresponds to the current adopted waste management practice in the RCM.
Figure 8 illustrates the flowchart of Scenario I. 694,872 tons (82%) of MSW are disposed of in landfills, whereas only 147,618 tons (18%) of waste is separated and collected, as depicted in
Table 1. According to the RWMP and the existing recycling facilities, recyclable waste fractions, equal to 103,213 tons (12% of the total waste amount) are recycled, around 5% of the waste sorted at the source is composted in home facilities, and 1% is sent for reuse.
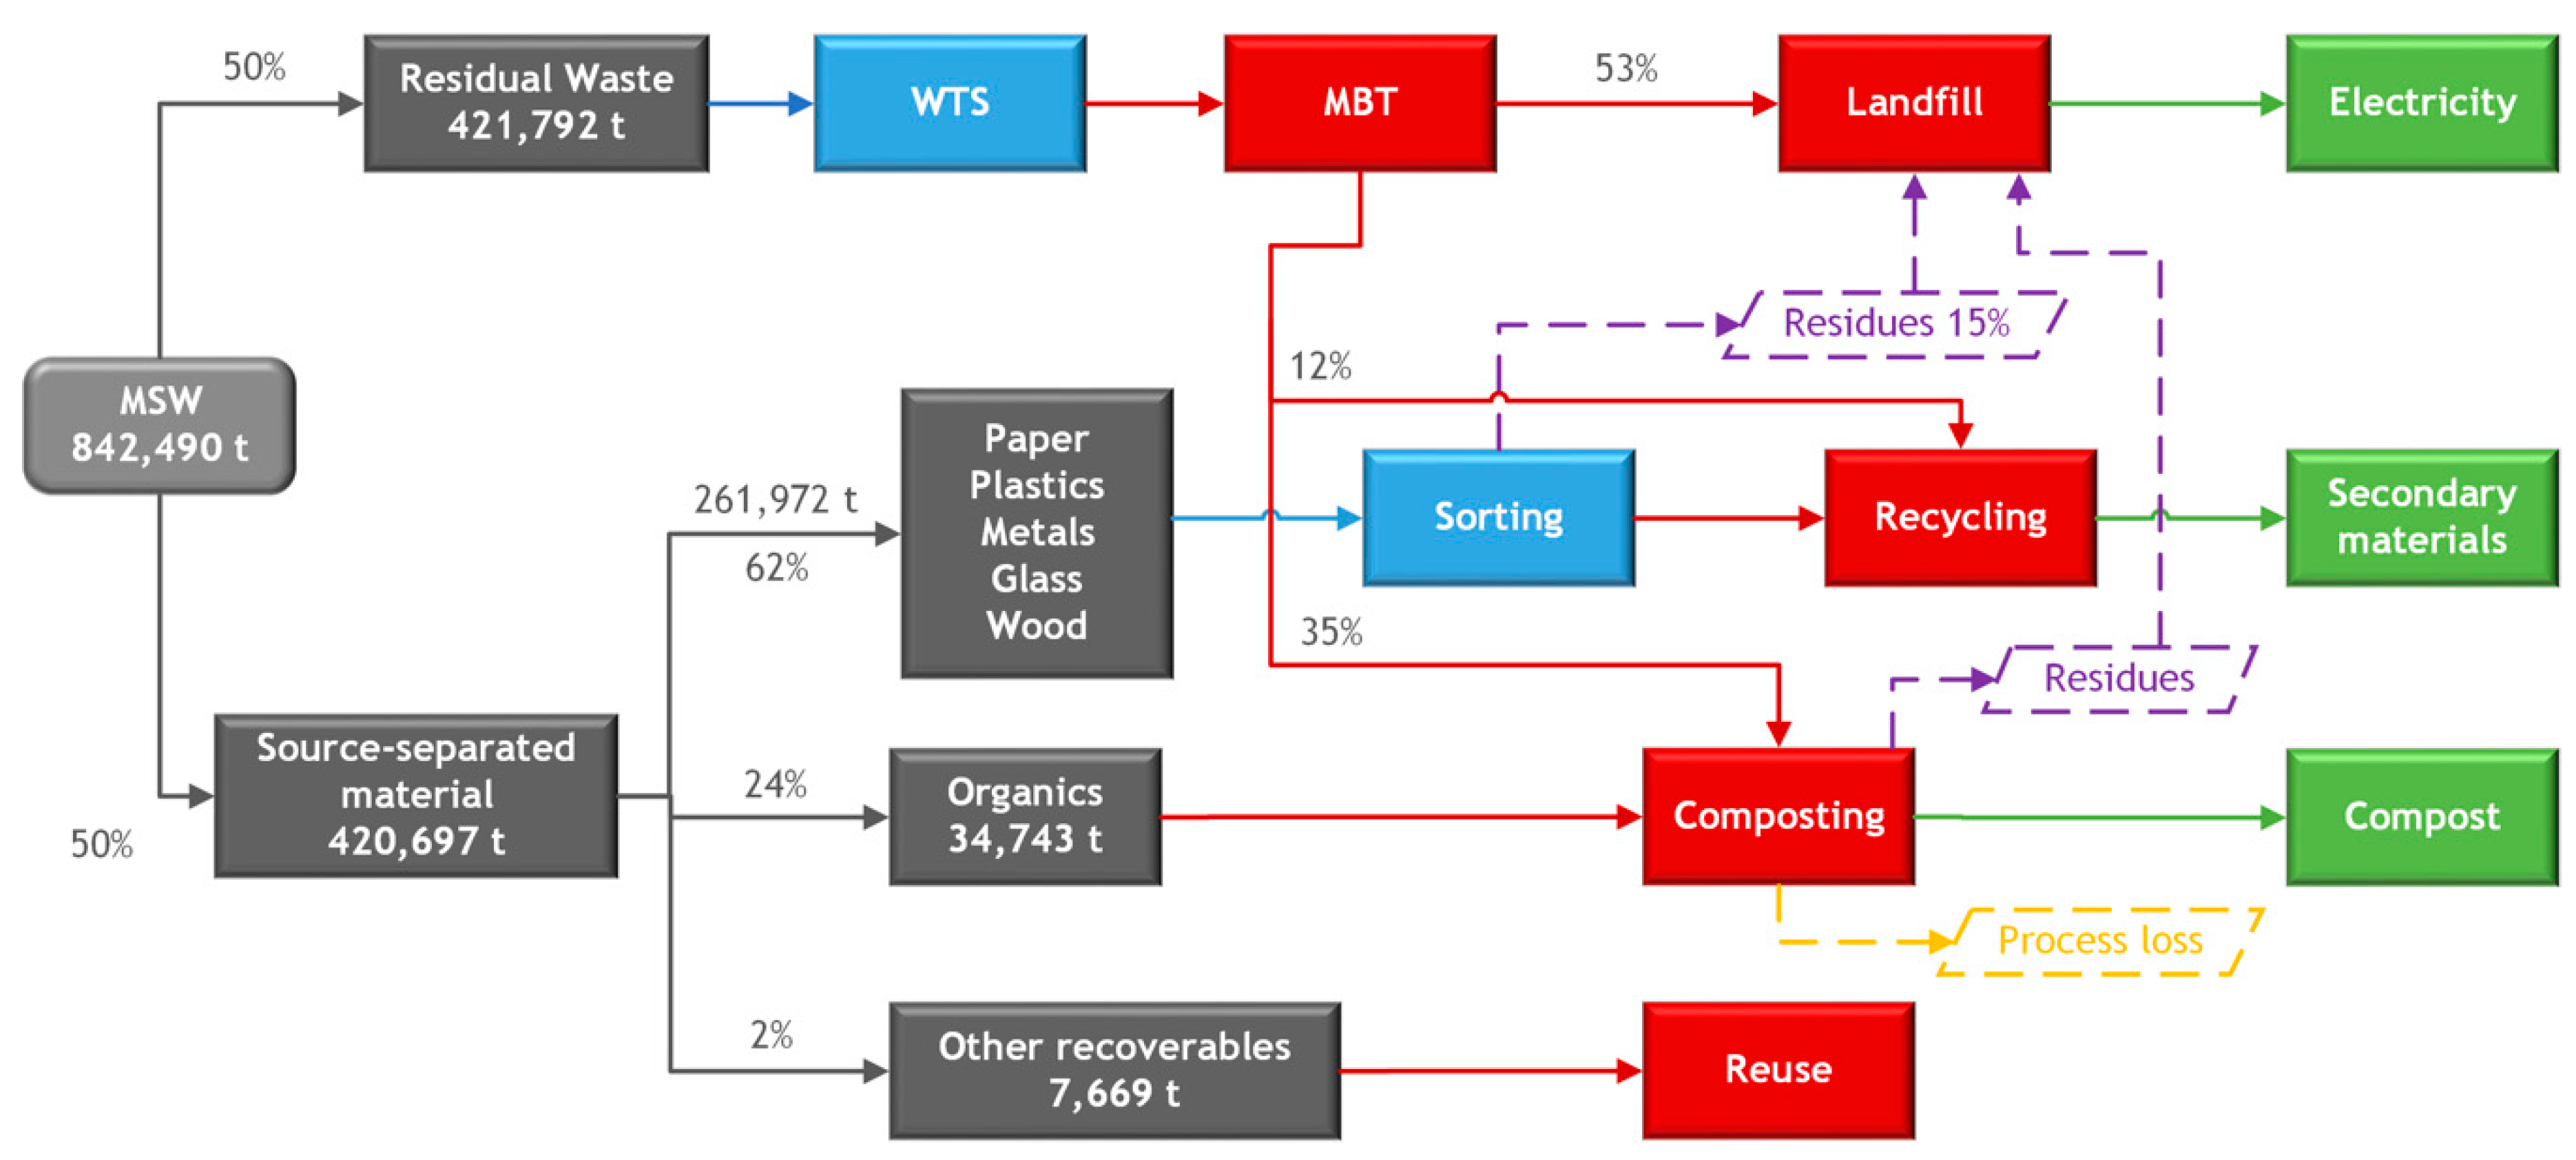
Scenario II introduces the proposed future waste management plan for 2020, as defined by the revised RWMP. This scenario emphasizes the reuse and recycling of all fractions of waste generated in the RCM, while minimizing the amounts of waste that are sent directly to landfill sites. More particularly, according to the RWMP, 74% of the total MSW must be recovered, whereas only 26% of the aggregate MSW quantities should be disposed of in the regional landfill sites (
Table 2).
Figure 9 illustrates the flowchart of Scenario II.
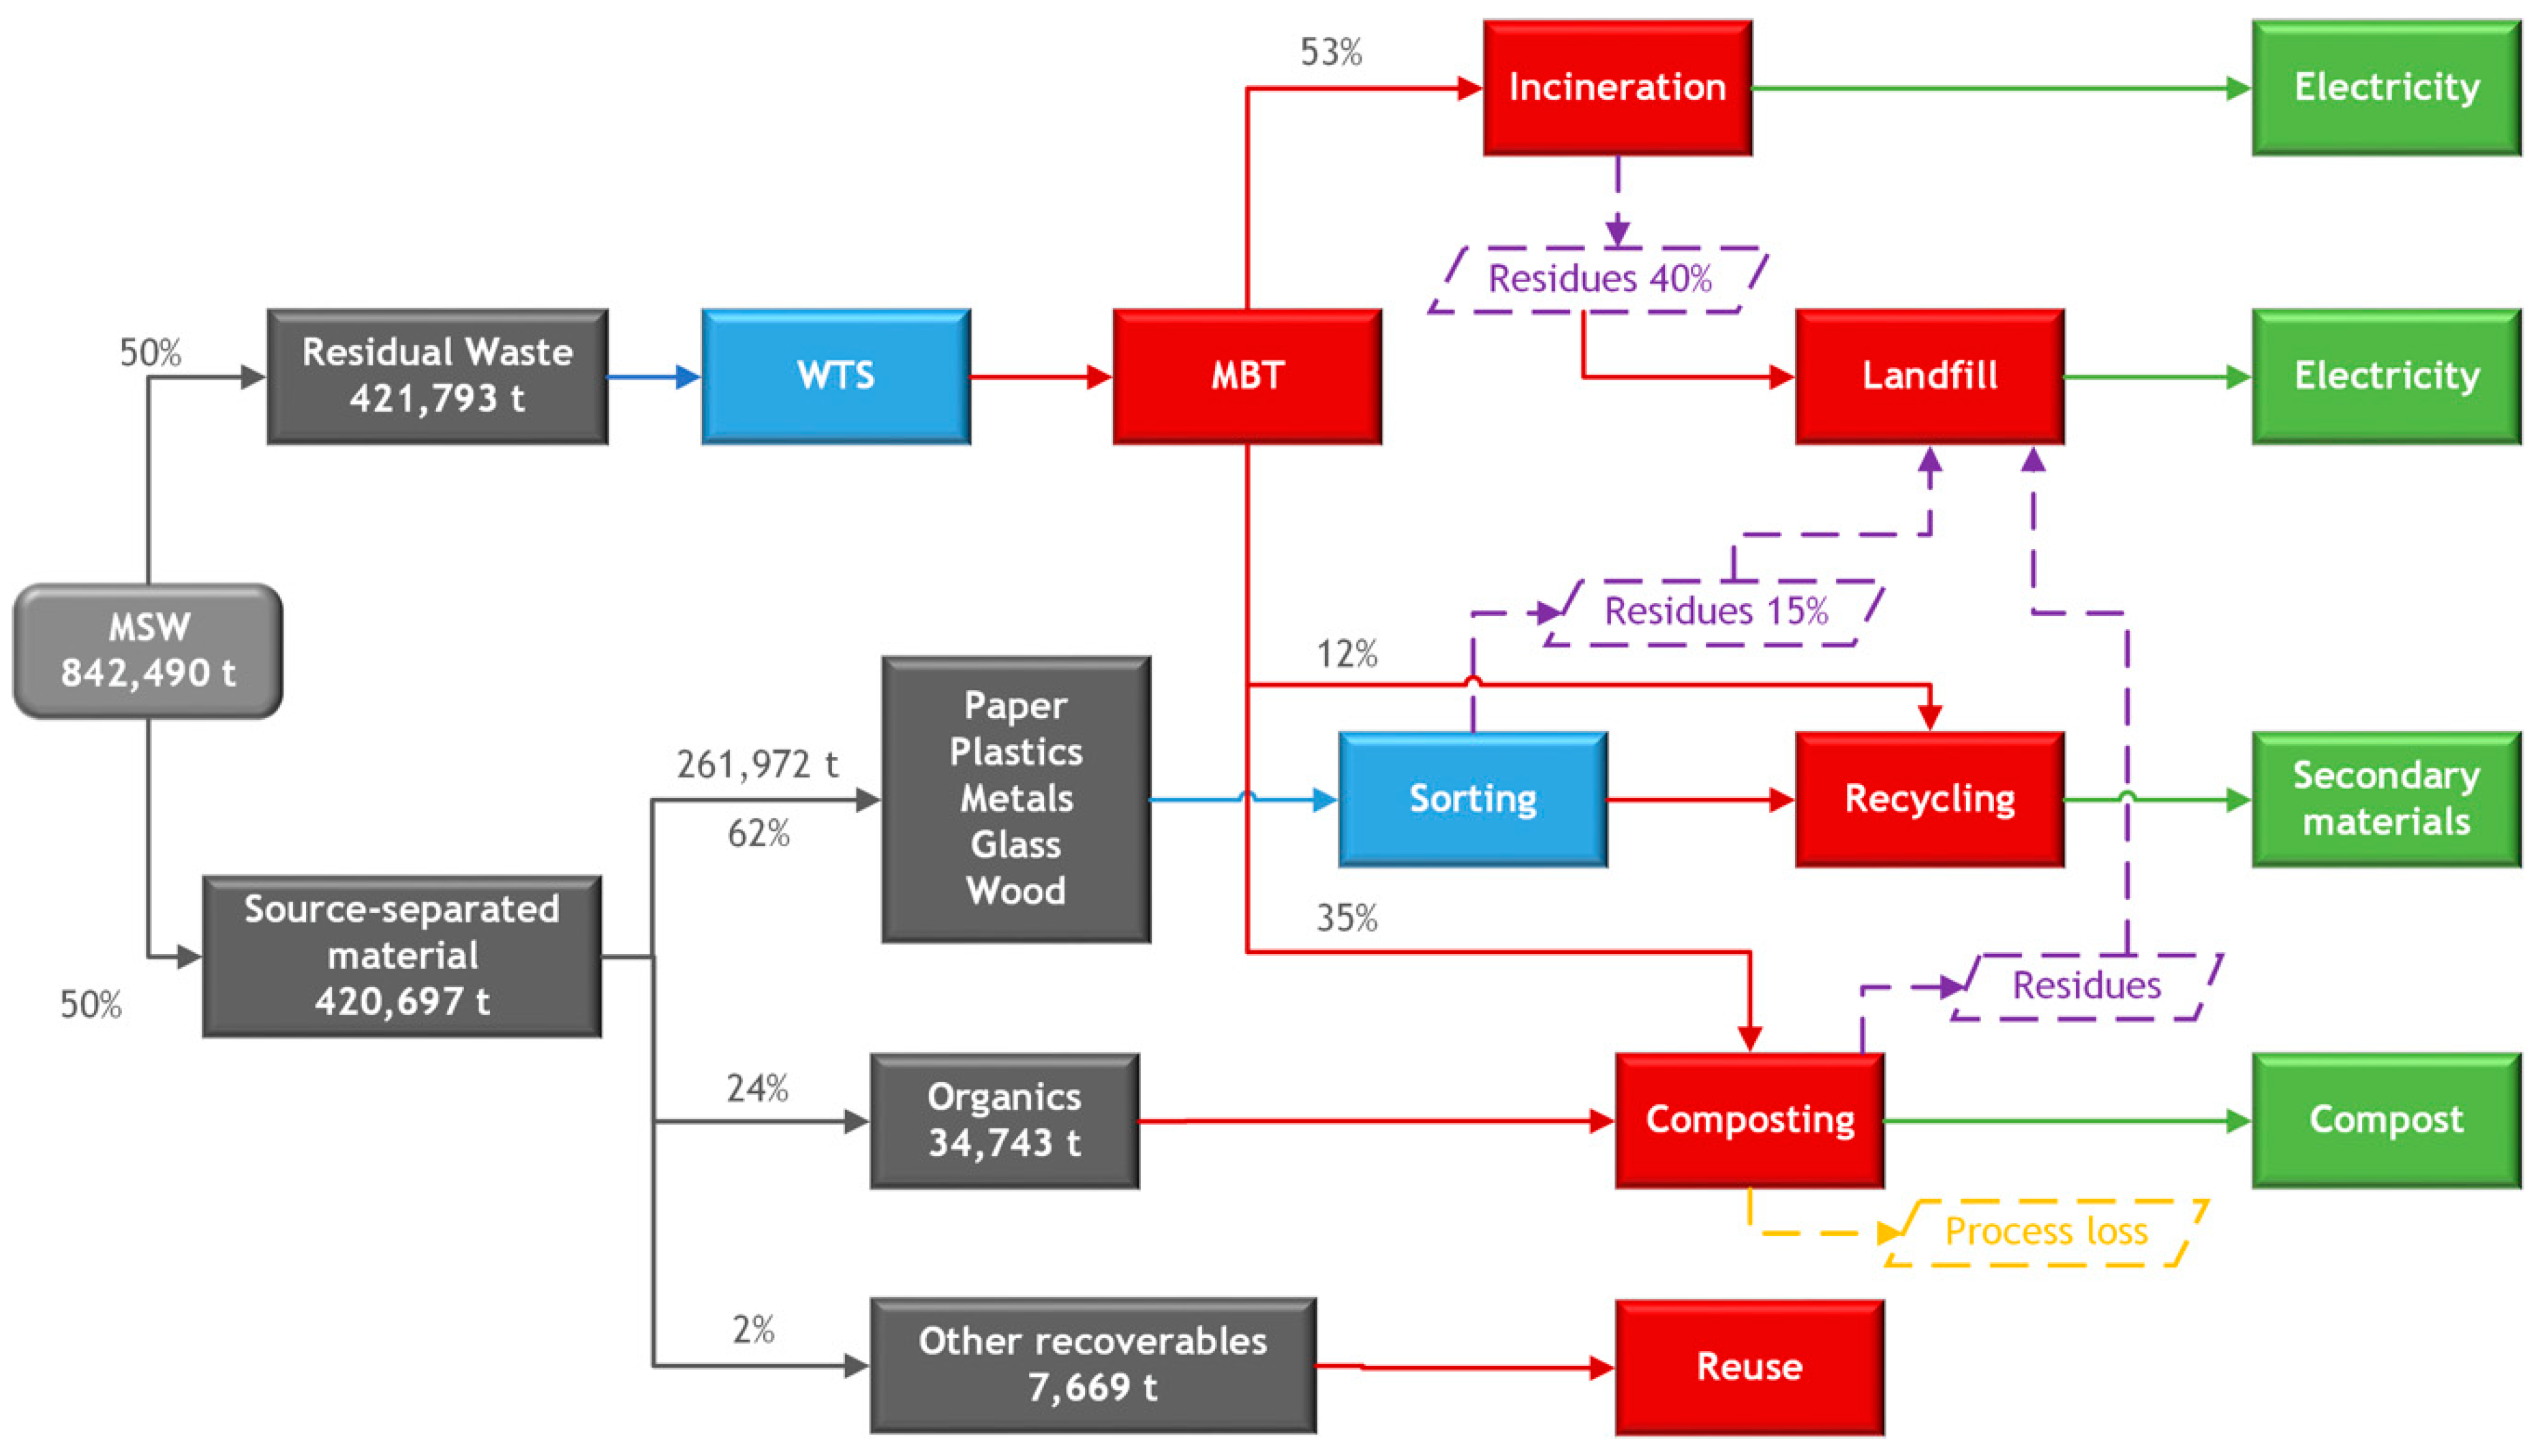
Scenario III describes an almost zero waste management plan. This scenario also emphasizes minimizing the volumes of waste that are sent directly to landfill sites. More specifically, apart from high rates of reuse and recovery of materials, in this scenario the incineration of residual waste with energy recovery is provided in order to minimize the aggregated amounts of MSW which are disposed of in the landfill sites (
Table 3) [
38].
Figure 10 illustrates the flowchart of Scenario III.
2.4. Life Cycle Inventory of the Proposed Scenarios: Modeling of the Different Sub-Units
In the LCA, an inventory was created for the proposed alternative scenarios. The selected inventory was based on those available in the Ecoinvent database v2.2 [
39]. Due to the complexity of an integrated MSW management system, several reasonable assumptions are required in order to simplify complex calculations and overcome the problem of lack of data, so as to comply with the requirements of the SimaPro software [
34] and to obtain a proper comparison between the different scenarios. An integrated MSW management system consists of distinctive sub-units, every one of which should be incorporated into a life cycle assessment. These sub-units are: (i) waste collection and transportation, (ii) recycling, which is composed by two phases: a sorting phase and a reprocessing one, (iii) treatment of bio-waste, either by composting or by anaerobic digestion, and treatment of the residual waste either by incineration in a Waste to Energy (WTE) plant or by disposal in landfill sites. The summary of the main assumptions, as well as the major data used in the modeling of the alternative scenarios are described in the following sub-sections.
2.4.1. Waste Collection and Transport
To evaluate the impact of a waste management system, the vehicles used both for the collection of the various waste fractions and those utilized for their transport to the various waste treatment facilities are taken into consideration. With respect to the collection stage, curb collection is assumed, which consists of the gathering of MSW in bins from various locations in the various municipalities of the RCM, and more specifically: “Transport, municipal waste collection, lorry 21t”, as mentioned in Ecoinvent database [
39]. Nevertheless, only the environmental impacts from waste transportation with collection vehicles and not those of raw materials and the manufacture of bins are taken into consideration.
The waste management transportation distance to the various waste management facilities was entered into the SimaPro according to the following assumptions. Initially, the required total distance for waste collection comprised the average distance between the capital city of each prefecture and the final management point. Moreover, the distance calculations were made on the basis of the assumption that empty collection vehicle returns were also included. Besides that, regarding the new waste facilities that are established in Scenario II, the required distance for transportation was calculated based on data provided by the RWMP [
32].
Furthermore, it was assumed that all the generated MSW is collected and transferred to WTS before it is sent to the various waste management facilities. To model WTS, the inventory data for the (i) electricity, (ii) fuel and (iii) water consumptions for this type of facility were based on Bovea et al. [
17] and were equal to 1.36 kWh/ton, 1.76 l/ton, and 0.043 m
3/ton, respectively.
2.4.2. Materials Recovery and Recycling
Recycling consists of two distinct stages, that may take place within the same site: sorting and re-processing. Initially, it should be noted that every fraction of recyclable materials is separated from the inappropriate ones. For this reason, a typical dry Material Recovery Facility (MRF) process is considered. The waste streams that are assumed to represent the recycling streams at the MRF are: (i) glass, (ii) metals, (iii) mixed papers, and (iv) mixed plastics. After the separation stage, a fraction of these materials sent to the MRF will be rejected.
Table 2 and
Table 3 illustrate the sorting efficiency used in the modeling of the waste management system of the proposed alternative scenarios. At the MRF, according to Bovea et al. [
17], 8.11 kWh of electricity, 0.56l of diesel, and 0.004 m
3 of water per ton of waste treated are consumed during the facility’s operation.
The recycling activity, as a waste treatment stage, results in the generation of the so-called “secondary materials”, which may replace the “primary materials” during the production process. For every fraction, the recycling inventory has been modeled based on Ecoinvent database [
39], with the assumption of 1:1 substitution ratio among the avoided primary material and their replacement of secondary material during the production process.
2.4.3. Bio-Waste Composting and Anaerobic Digestion
Organic waste is sent to composting or anaerobic digestion. These processes aim to produce compost as a recovery material or energy generation. As far as the composting process is concerned, a substitution ratio equal to 0.4:1 is considered, which means that 1 ton of organic waste yields 0.4 ton of compost. According to the literature [
20,
40], 1 ton of compost is equivalent to 23 kg of N-fertilizer, 9.5 kg of P-fertilizer, and 9 kg of K-fertilizer. The energy used for the operation of the composting plant is considered, and the model assumes the use of 19.67 kWh of electricity, 0.36l of diesel, and 0.054 m
3 of water per ton of waste treated [
17].
2.4.4. Mechanical Biological Treatment (MBT) Facilities
MBT includes both mechanical separation and biological treatment. The MBT inventory has been modeled based on primary data of the MBT plant in Ano Liossia, in Athens, Greece. According to Abeliotis et al. [
41], process electricity, diesel, and water consumption were estimated to be 10,816 MW/y, 133,333 l/y, and 135,000 m
3/y, respectively.
2.4.5. Incineration Facilities
Regarding the modeling of the waste treatment in incineration facilities, the available processes in the Ecoinvent database [
39] were used. More specifically, for the inventories of the input and output flows treated in WTE plants, the waste incineration treatment that was assumed to be used is: “Treatment of municipal solid waste incineration”.
2.4.6. Landfill
Two alternative methods of waste disposal in landfills are taken into account: landfills with and without energy recovery. In both cases, the inventory of disposing the residual waste on landfills is based on the Ecoinvent database (disposal, municipal solid waste, 22.9% water, to sanitary landfill/CH) [
39]. In case of energy recovery, the landfill site is supposed to be equipped with an energy recovery system for landfill gas (LFG). According to the literature, 4.5 m
3 of biogas is produced from 1 ton of MSW and 150 m3 of leachate daily. Besides that, a fraction of 30% of landfill gas is assumed to be collected through pipes for electricity production, and the average energy content of the gas is approximately 5-6 kWh/Nm
3, while the amount of electricity recovered from the LFG is 22,000 ΜWh every year.
2.5. Impact Assessment
Life Cycle Assessment data were mainly compiled from the SimaPro (Ecoinvent) databases, from the bibliography, as well as from the inventory of current waste management systems in RCM, as described in the latest RWMP. For the Life Cycle Impact Assessment, which was based on the outcomes of the inventory, both the Eco-indicator 99 and the CML 2001 methods were utilized.
According to the CML 2001 Method, the emissions from the alternative scenarios studied are classified according to the following impact categories: Abiotic Depletion Potential (ADP, kg Sb eq), Global Warming Potential (GWP, kg CO2 eq), Human Toxicity Potential (HTP, kg 1,4-DCB eq), Acidification Potential (AP, kg SO2 eq), Eutrophication Potential (EP, kg PO4 eq), Ozone Layer Depletion Potential (ODP, kg CFC-11 eq), Photochemical Ozone Creation Potential (POCP, kg C2H4). On the other hand, Eco-indicator 99 is a damage-oriented method which classifies the various impact categories and the damages caused into three damage categories: (i) Damage to Human Health, (ii) Damage Ecosystem Quality, and (iii) Damage to Resources.
3. Results and Discussion
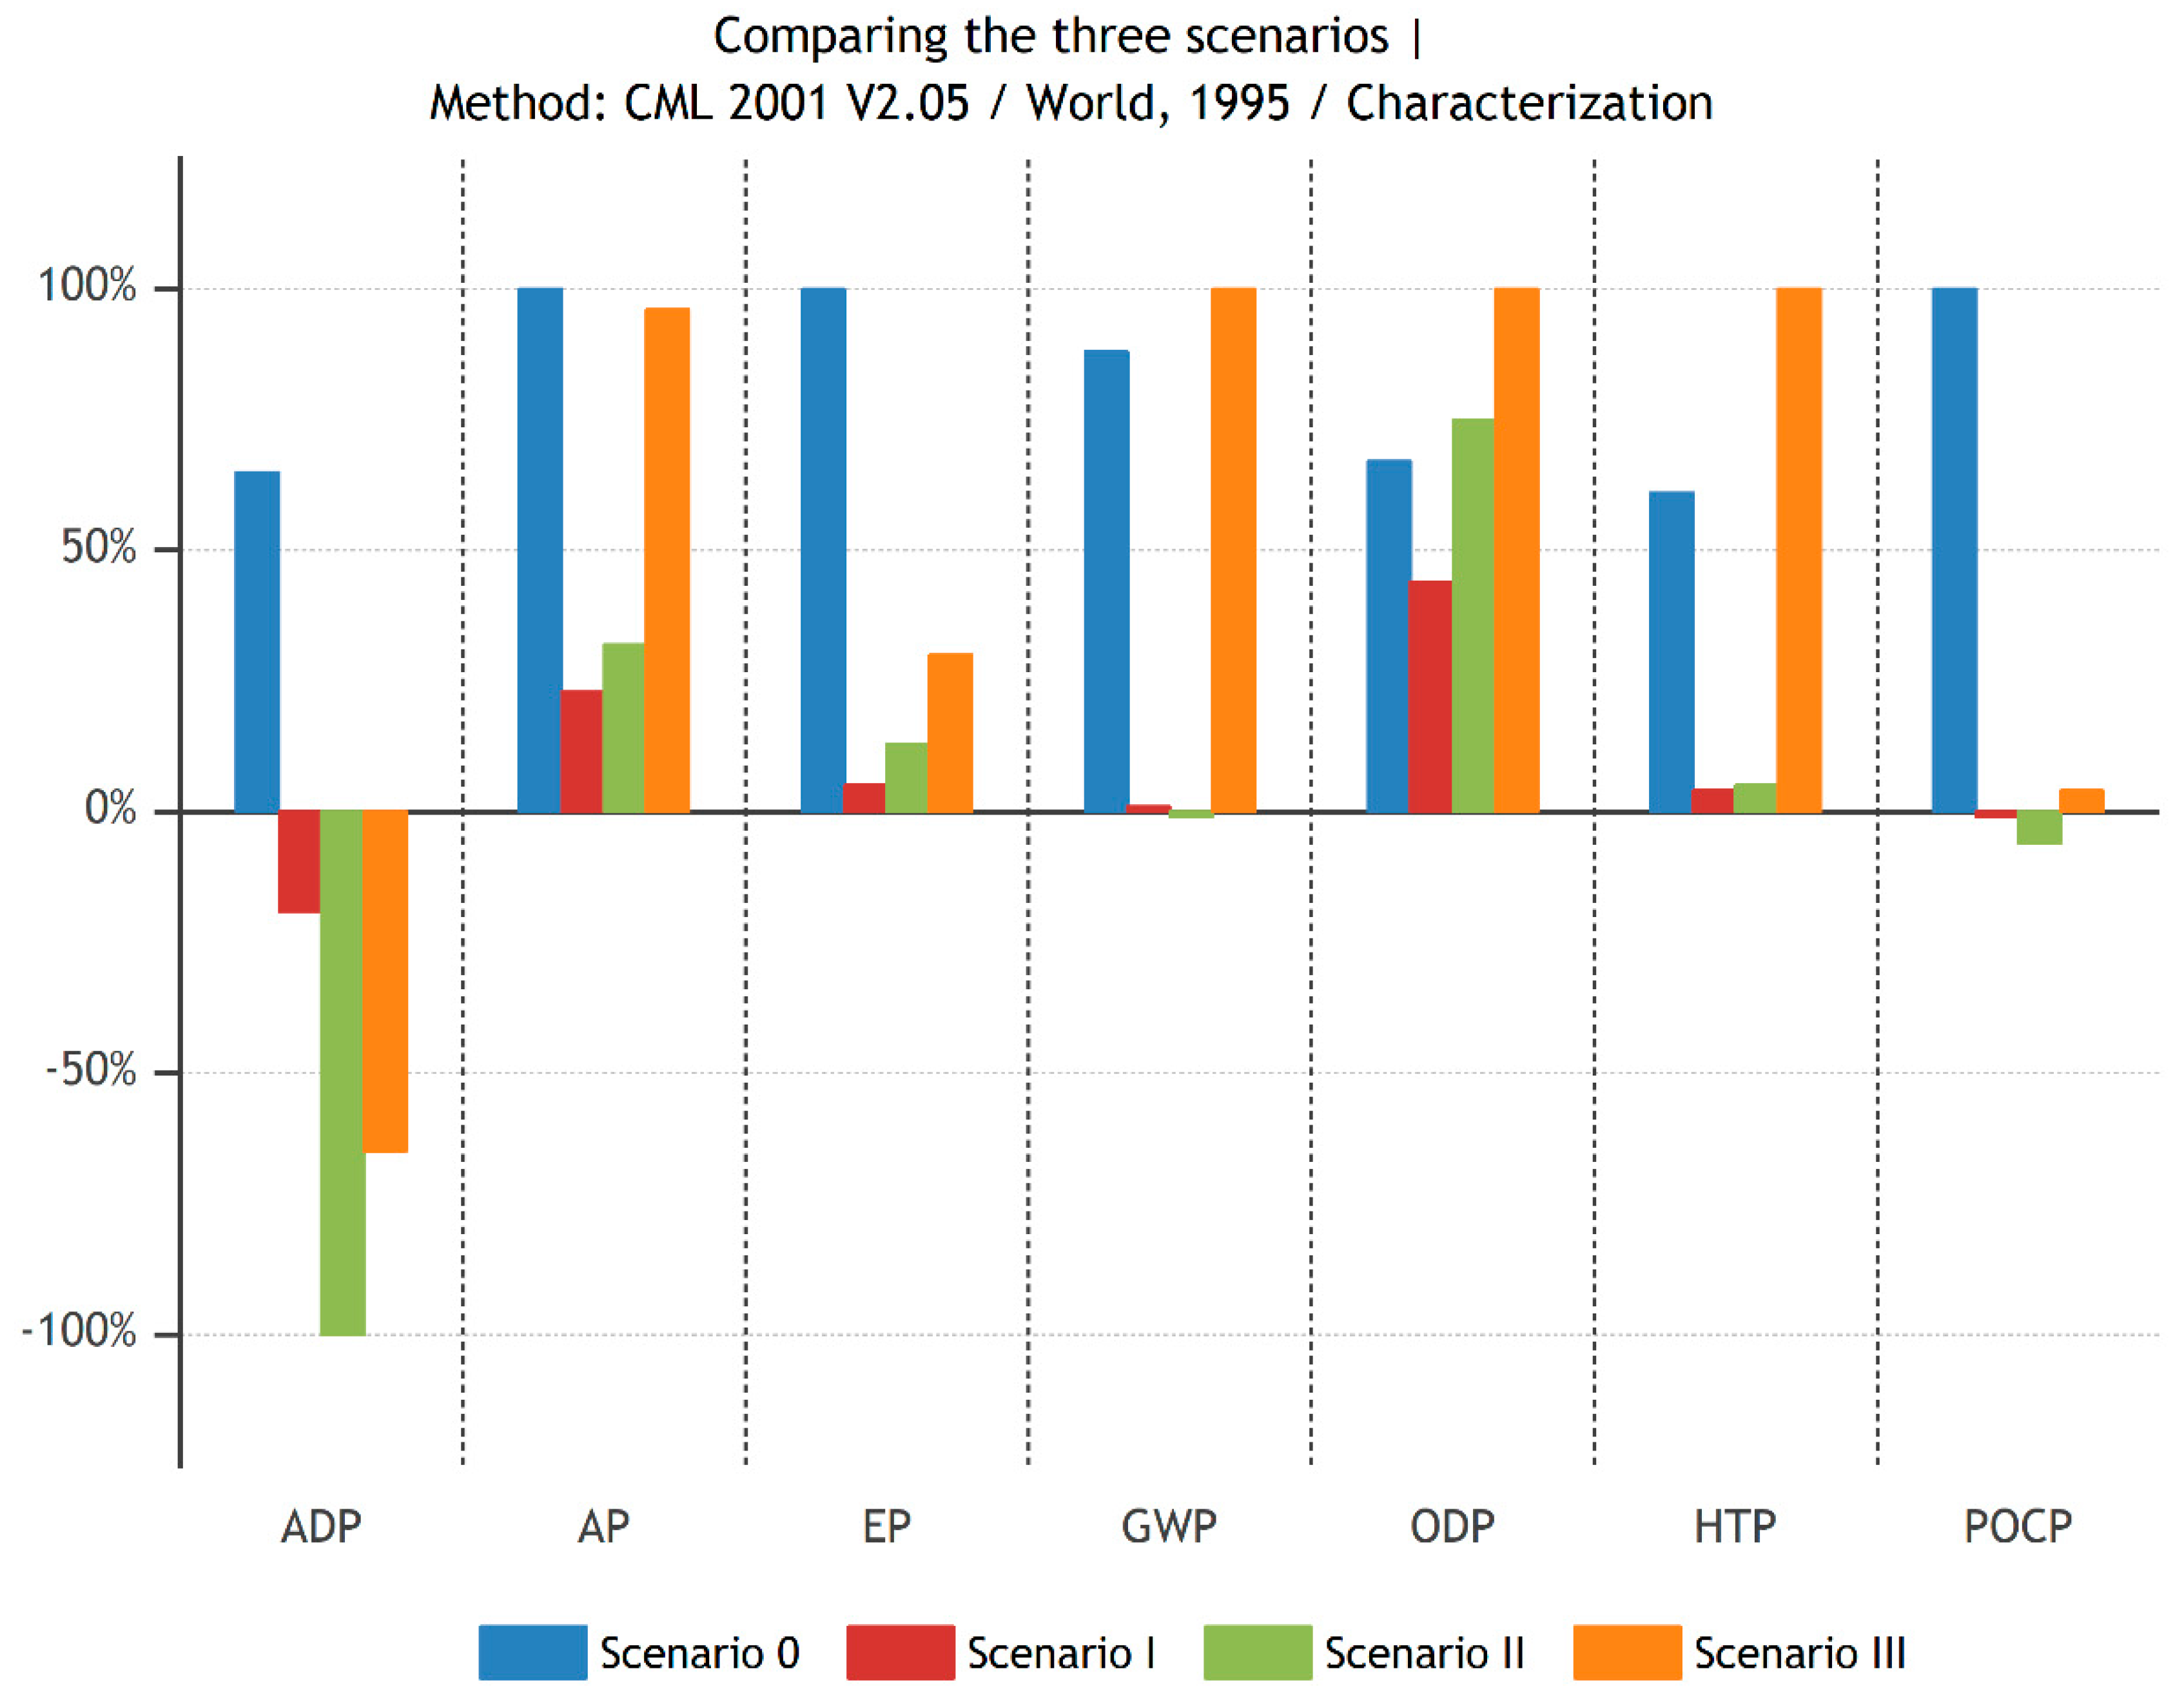
The environmental burdens of each practice were calculated with both selected Methods (CML 2001, Eco-indicator 99), and they are graphically presented in
Figure 11 and
Figure 12, respectively. Taking into consideration the CML 2001 methodology’s results from
Figure 11, it is obvious that an integrated waste management system can significantly minimize the environmental impacts caused by the MSW generated. The application of sustainable practices and treatment methods such as sorting at the source, recycling, and composting lead to the reduction of waste disposal.
Based on the results of the life cycle impact assessment, Scenario 0, and its main waste treatment method, landfilling, resulted in the worst performance for almost all the indicators analyzed. This high level of environmental burdens in all of the impact categories, compared to the other management systems, is due to the lack of reuse and the disposal of all the waste generated in sanitary landfills. Besides that, waste incineration (Scenario III) also has also high environmental impacts compared to the other waste treatment processes in many categories, and especially regarding the global warming potential. Both waste incineration and landfilling (Scenarios 0 and III) have the highest global warming potential, mainly with regard to large amounts of CO2 and methane emissions to the atmosphere. On the other hand, findings show that Scenario II contributes to either a very low impact or savings in many impact indicators. The replacement of primary products with products which come from waste treatment recompenses the impacts caused by the actual process of the treatment. Thus, the fact that Scenario II has high corporate rates of recycling and composting is advantageous to most of the impact categories.
However, the status in cases of acidification and ozone layer depletion indicators is different. Acidification Potential has positive values for all scenarios. Scenarios 0 and III have the highest contribution for acidification impact category because of the SO2, NOx, HCL, and HF emissions to the air. Along the same lines, Scenarios I and II also result in positive values for acidification potential, which are associated with the biological processes as well as the electricity production. Furthermore, all four treatment scenarios are large contributors to ozone layer depletion due to the composting of great amounts of municipal waste. Moreover, all alternatives have a positive sign of eutrophication indicator, due to the leachates from the landfill, which release NO3− and NH3 despite their treatment in wastewater facilities. Thus, in all four alternative management systems, these emissions represent the biggest contribution to eutrophication. This indicator has a positive value even in Scenario II, which generally has the most environmentally friendly performance.
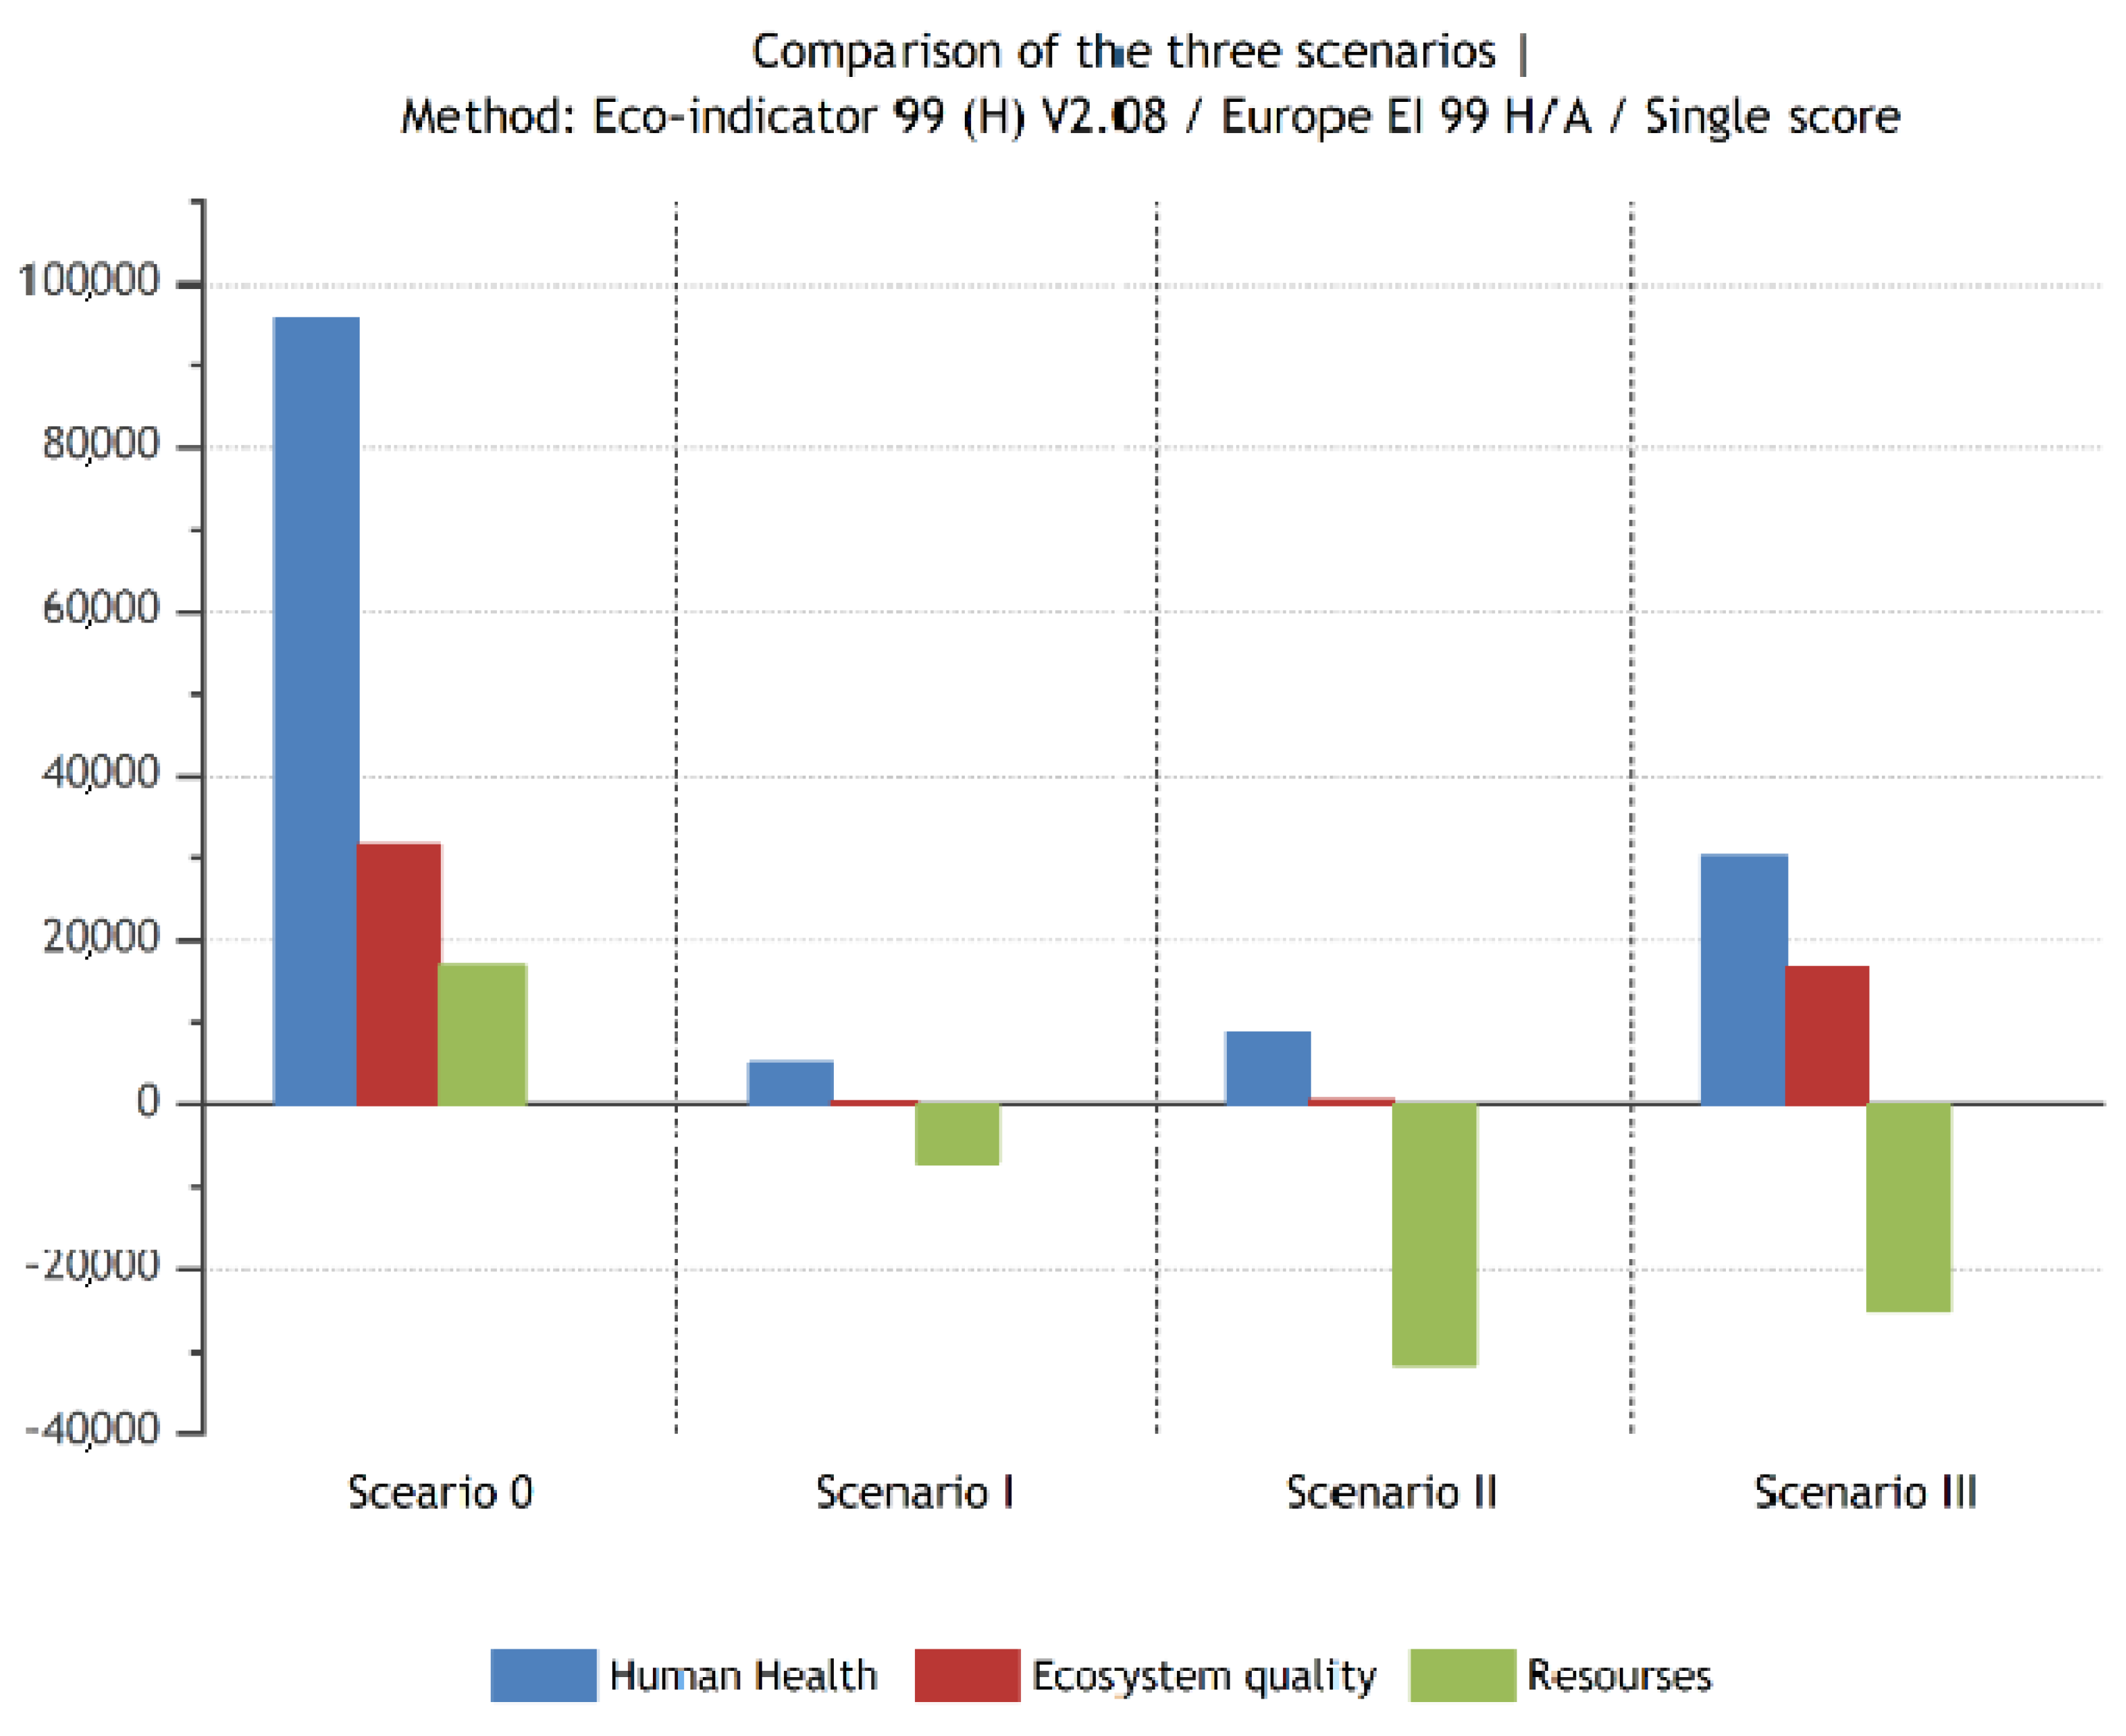
With respect to the results from the Eco-indicator 99 methodology, the single scores are illustrated in
Figure 11. It is clear that Scenario 0 is the worst waste management system that can be implemented in the RCM. Its environmental burden is significant, according to both methodologies used. Similarly, with CML 2001, results for the Eco-indicator 99 methodology indicate that the main impacts are caused by the landfilling treatment process and the huge amount of waste that is disposed of (Scenario 0), while waste incineration also has a relatively high environmental impact and low overall environmental performance due to CO
2 and methane emission (Scenario III). Furthermore, the environmental benefits that derive from the replacement of primary products with recycled ones are significant (Scenario II). As
Figure 11 illustrates, savings of the resources are more advantageous when high rates of sorting collection, recycling, and composting are implemented.
Overall, taking into consideration the final results of the two methods (
Table 4), it becomes crystal clear that Scenario II is the most environmentally sustainable waste management practice, due to the high environmental benefits derived from the recycling of waste streams, as well as the small environmental burden from waste disposal, because of the comparatively less amounts of waste sent to landfill sites. On the other hand, landfilling of municipal waste, as it has already been reported in the literature, is considered to be the worst method from the proposed waste management practices from an environmental point of view. That is because of the significant impacts that this process has both on the environment and on human health. Furthermore, waste incineration appears to have both advantages and disadvantages. The main problems with incineration are the large volume of gaseous emissions and the remaining hazardous solid wastes that require strict air pollution control and safe disposal. As a final consideration on the results, the uncertainty of such studies is a significant factor that should be taken under consideration. However, the analysis of uncertainty is not included in the scope of this study, and thus it is not presented.
4. Conclusions
The aim of this study is twofold. Firstly, it focuses on the development and application of a life cycle methodological framework in order to compare the different management practices. Secondly, it introduces a holistic evaluation for the optimal selection of the most sustainable integrated waste management system from an environmental point of view. According to all indicators examined, waste management practices that involve either the entire or partial disposal in landfill sites have the worst performance. It should be highlighted that he parameters that mainly contribute to these negative results are the large quantities of untreated MSW that are disposed of in landfills and the low rates of landfill gas collection. It should be noticed that the alternative management practice of municipal waste, which combines the recycling of metals, glass, plastics, and paper with the composting of organic fractions of MSW after the separate collection at the source is the optimal solution. The latter emerges due to the significantly low rate of untreated waste, reported in this scenario, which is sent to landfill sites and at the same time due to the material recovery, which offers many environmental benefits. However, it should not be disregarded that alternative waste treatment methods such as recycling do have negative environmental impacts, although these loads do not overshadow the environmental benefits of material recovery.
Taking into consideration the results of the LCA analysis, it has been found that the implementation of an integrated waste management system is important to the sustainable management of municipal waste. Nevertheless, the proposed waste management system may not be effective if there is no efficient sorting ratio of waste streams at the source. Overall, a significant percentage of MSW can be treated in various ways, recycled, or reused before being disposed of in a landfill site, thus minimizing the environmental impacts of the continuously expanding amounts of waste produced.

 ,
, 


